Embed Size (px)
Citation preview
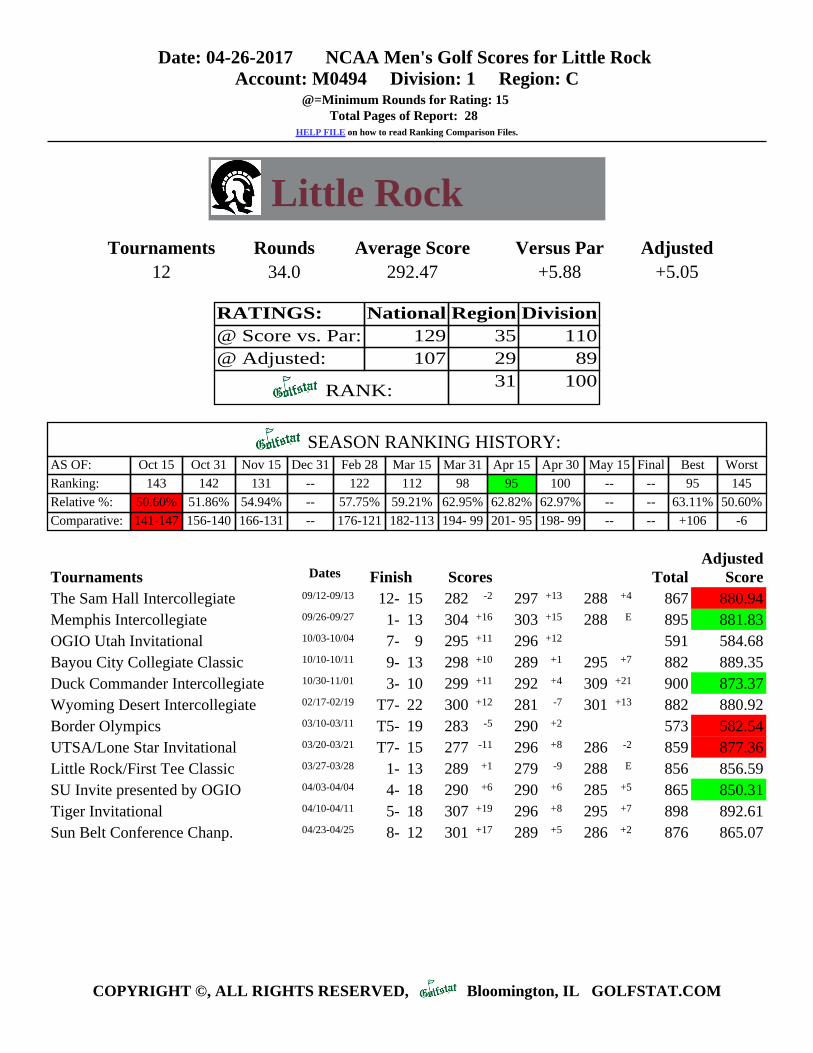
Date: 04-26-2017 NCAA Men's Golf Scores for Little Rock Account: M0494 Division: 1 Region: C
@=Minimum Rounds for Rating: 15 Total Pages of Report: 28
HELP FILE on how to read Ranking Comparison Files.
COPYRIGHT ©, ALL RIGHTS RESERVED, Bloomington, IL GOLFSTAT.COM
Little Rock Tournaments Rounds Average Score Versus Par Adjusted
12 34.0 292.47 +5.88 +5.05
RATINGS: National Region Division@ Score vs. Par: 129 35 110@ Adjusted: 107 29 89
RANK: 31 100
SEASON RANKING HISTORY:AS OF: Oct 15 Oct 31 Nov 15 Dec 31 Feb 28 Mar 15 Mar 31 Apr 15 Apr 30 May 15 Final Best Worst
Ranking: 143 142 131 -- 122 112 98 95 100 -- -- 95 145
Relative %: 50.60% 51.86% 54.94% -- 57.75% 59.21% 62.95% 62.82% 62.97% -- -- 63.11% 50.60%
Comparative: 141-147 156-140 166-131 -- 176-121 182-113 194- 99 201- 95 198- 99 -- -- +106 -6
Tournaments Dates Finish Scores TotalAdjusted
ScoreThe Sam Hall Intercollegiate 09/12-09/13 12- 15 282 -2 297 +13 288 +4 867 880.94Memphis Intercollegiate 09/26-09/27 1- 13 304 +16 303 +15 288 E 895 881.83OGIO Utah Invitational 10/03-10/04 7- 9 295 +11 296 +12 591 584.68Bayou City Collegiate Classic 10/10-10/11 9- 13 298 +10 289 +1 295 +7 882 889.35Duck Commander Intercollegiate 10/30-11/01 3- 10 299 +11 292 +4 309 +21 900 873.37Wyoming Desert Intercollegiate 02/17-02/19 T7- 22 300 +12 281 -7 301 +13 882 880.92Border Olympics 03/10-03/11 T5- 19 283 -5 290 +2 573 582.54UTSA/Lone Star Invitational 03/20-03/21 T7- 15 277 -11 296 +8 286 -2 859 877.36Little Rock/First Tee Classic 03/27-03/28 1- 13 289 +1 279 -9 288 E 856 856.59SU Invite presented by OGIO 04/03-04/04 4- 18 290 +6 290 +6 285 +5 865 850.31Tiger Invitational 04/10-04/11 5- 18 307 +19 296 +8 295 +7 898 892.61Sun Belt Conference Chanp. 04/23-04/25 8- 12 301 +17 289 +5 286 +2 876 865.07
Date: 04-26-2017 NCAA Men's Golf Scores for Little Rock Account: M0494 Division: 1 Region: C
@=Minimum Rounds for Rating: 15
COPYRIGHT ©, ALL RIGHTS RESERVED, Bloomington, IL GOLFSTAT.COM
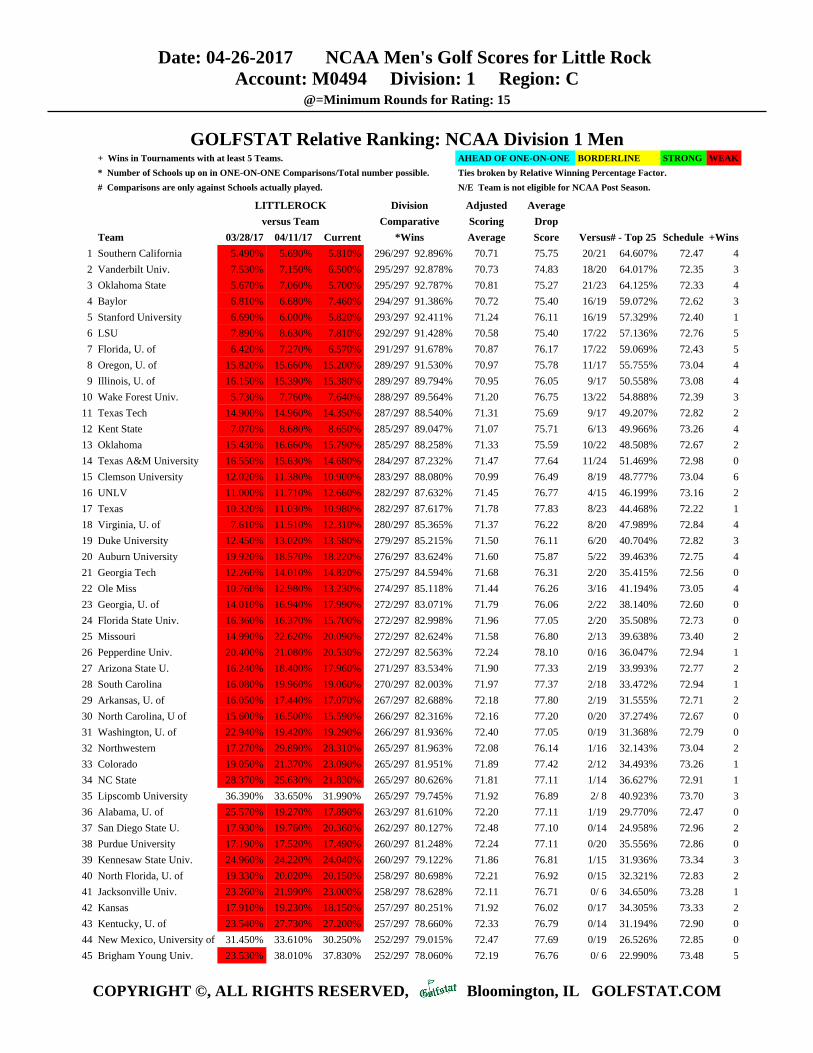
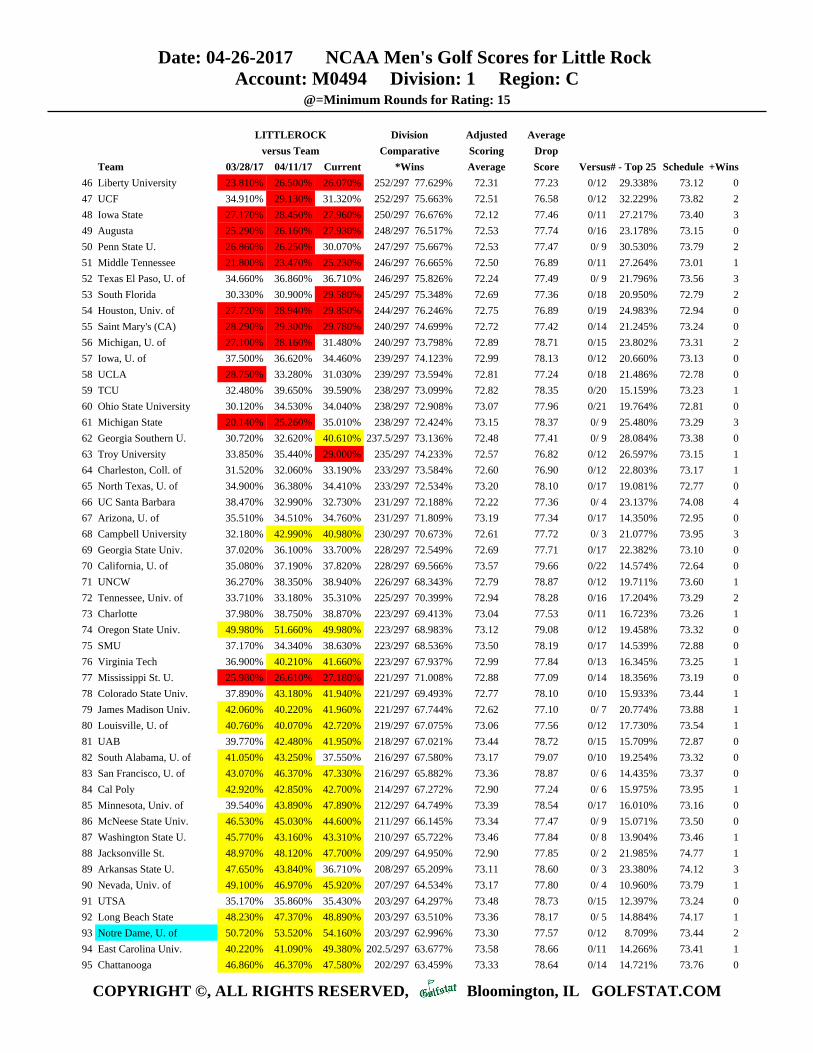
GOLFSTAT Relative Ranking: NCAA Division 1 Men+ Wins in Tournaments with at least 5 Teams. AHEAD OF ONE-ON-ONE BORDERLINE STRONG WEAK
* Number of Schools up on in ONE-ON-ONE Comparisons/Total number possible. Ties broken by Relative Winning Percentage Factor.
# Comparisons are only against Schools actually played. N/E Team is not eligible for NCAA Post Season.
LITTLEROCK Division Adjusted Average
versus Team Comparative Scoring Drop
Team 03/28/17 04/11/17 Current *Wins Average Score Versus# - Top 25 Schedule +Wins
1 Southern California 5.490% 5.690% 5.810% 296/297 92.896% 70.71 75.75 20/21 64.607% 72.47 4
2 Vanderbilt Univ. 7.530% 7.150% 6.500% 295/297 92.878% 70.73 74.83 18/20 64.017% 72.35 3
3 Oklahoma State 5.670% 7.060% 5.700% 295/297 92.787% 70.81 75.27 21/23 64.125% 72.33 4
4 Baylor 6.810% 6.680% 7.460% 294/297 91.386% 70.72 75.40 16/19 59.072% 72.62 3
5 Stanford University 6.690% 6.000% 5.820% 293/297 92.411% 71.24 76.11 16/19 57.329% 72.40 1
6 LSU 7.890% 8.630% 7.810% 292/297 91.428% 70.58 75.40 17/22 57.136% 72.76 5
7 Florida, U. of 6.420% 7.270% 6.570% 291/297 91.678% 70.87 76.17 17/22 59.069% 72.43 5
8 Oregon, U. of 15.820% 15.660% 15.200% 289/297 91.530% 70.97 75.78 11/17 55.755% 73.04 4
9 Illinois, U. of 16.150% 15.390% 15.380% 289/297 89.794% 70.95 76.05 9/17 50.558% 73.08 4
10 Wake Forest Univ. 5.730% 7.760% 7.640% 288/297 89.564% 71.20 76.75 13/22 54.888% 72.39 3
11 Texas Tech 14.900% 14.960% 14.350% 287/297 88.540% 71.31 75.69 9/17 49.207% 72.82 2
12 Kent State 7.070% 8.680% 8.650% 285/297 89.047% 71.07 75.71 6/13 49.966% 73.26 4
13 Oklahoma 15.430% 16.660% 15.790% 285/297 88.258% 71.33 75.59 10/22 48.508% 72.67 2
14 Texas A&M University 16.550% 15.630% 14.680% 284/297 87.232% 71.47 77.64 11/24 51.469% 72.98 0
15 Clemson University 12.020% 11.380% 10.900% 283/297 88.080% 70.99 76.49 8/19 48.777% 73.04 6
16 UNLV 11.000% 11.710% 12.660% 282/297 87.632% 71.45 76.77 4/15 46.199% 73.16 2
17 Texas 10.320% 11.030% 10.980% 282/297 87.617% 71.78 77.83 8/23 44.468% 72.22 1
18 Virginia, U. of 7.610% 11.510% 12.310% 280/297 85.365% 71.37 76.22 8/20 47.989% 72.84 4
19 Duke University 12.450% 13.020% 13.580% 279/297 85.215% 71.50 76.11 6/20 40.704% 72.82 3
20 Auburn University 19.920% 18.570% 18.220% 276/297 83.624% 71.60 75.87 5/22 39.463% 72.75 4
21 Georgia Tech 12.260% 14.010% 14.820% 275/297 84.594% 71.68 76.31 2/20 35.415% 72.56 0
22 Ole Miss 10.760% 12.980% 13.230% 274/297 85.118% 71.44 76.26 3/16 41.194% 73.05 4
23 Georgia, U. of 14.010% 16.940% 17.990% 272/297 83.071% 71.79 76.06 2/22 38.140% 72.60 0
24 Florida State Univ. 16.360% 16.370% 15.700% 272/297 82.998% 71.96 77.05 2/20 35.508% 72.73 0
25 Missouri 14.990% 22.620% 20.090% 272/297 82.624% 71.58 76.80 2/13 39.638% 73.40 2
26 Pepperdine Univ. 20.400% 21.080% 20.530% 272/297 82.563% 72.24 78.10 0/16 36.047% 72.94 1
27 Arizona State U. 16.240% 18.400% 17.960% 271/297 83.534% 71.90 77.33 2/19 33.993% 72.77 2
28 South Carolina 16.080% 19.960% 19.060% 270/297 82.003% 71.97 77.37 2/18 33.472% 72.94 1
29 Arkansas, U. of 16.050% 17.440% 17.070% 267/297 82.688% 72.18 77.80 2/19 31.555% 72.71 2
30 North Carolina, U of 15.600% 16.500% 15.590% 266/297 82.316% 72.16 77.20 0/20 37.274% 72.67 0
31 Washington, U. of 22.940% 19.420% 19.290% 266/297 81.936% 72.40 77.05 0/19 31.368% 72.79 0
32 Northwestern 17.270% 29.890% 28.310% 265/297 81.963% 72.08 76.14 1/16 32.143% 73.04 2
33 Colorado 19.050% 21.370% 23.090% 265/297 81.951% 71.89 77.42 2/12 34.493% 73.26 1
34 NC State 28.370% 25.630% 21.830% 265/297 80.626% 71.81 77.11 1/14 36.627% 72.91 1
35 Lipscomb University 36.390% 33.650% 31.990% 265/297 79.745% 71.92 76.89 2/ 8 40.923% 73.70 3
36 Alabama, U. of 25.570% 19.270% 17.890% 263/297 81.610% 72.20 77.11 1/19 29.770% 72.47 0
37 San Diego State U. 17.930% 19.760% 20.360% 262/297 80.127% 72.48 77.10 0/14 24.958% 72.96 2
38 Purdue University 17.190% 17.520% 17.490% 260/297 81.248% 72.24 77.11 0/20 35.556% 72.86 0
39 Kennesaw State Univ. 24.960% 24.220% 24.040% 260/297 79.122% 71.86 76.81 1/15 31.936% 73.34 3
40 North Florida, U. of 19.330% 20.020% 20.150% 258/297 80.698% 72.21 76.92 0/15 32.321% 72.83 2
41 Jacksonville Univ. 23.260% 21.990% 23.000% 258/297 78.628% 72.11 76.71 0/ 6 34.650% 73.28 1
42 Kansas 17.910% 19.230% 18.150% 257/297 80.251% 71.92 76.02 0/17 34.305% 73.33 2
43 Kentucky, U. of 23.540% 27.730% 27.200% 257/297 78.660% 72.33 76.79 0/14 31.194% 72.90 0
44 New Mexico, University of 31.450% 33.610% 30.250% 252/297 79.015% 72.47 77.69 0/19 26.526% 72.85 0
45 Brigham Young Univ. 23.530% 38.010% 37.830% 252/297 78.060% 72.19 76.76 0/ 6 22.990% 73.48 5
Date: 04-26-2017 NCAA Men's Golf Scores for Little Rock Account: M0494 Division: 1 Region: C
@=Minimum Rounds for Rating: 15
COPYRIGHT ©, ALL RIGHTS RESERVED, Bloomington, IL GOLFSTAT.COM
LITTLEROCK Division Adjusted Average
versus Team Comparative Scoring Drop
Team 03/28/17 04/11/17 Current *Wins Average Score Versus# - Top 25 Schedule +Wins
46 Liberty University 23.810% 26.500% 26.070% 252/297 77.629% 72.31 77.23 0/12 29.338% 73.12 0
47 UCF 34.910% 29.130% 31.320% 252/297 75.663% 72.51 76.58 0/12 32.229% 73.82 2
48 Iowa State 27.170% 28.450% 27.960% 250/297 76.676% 72.12 77.46 0/11 27.217% 73.40 3
49 Augusta 25.290% 26.160% 27.930% 248/297 76.517% 72.53 77.74 0/16 23.178% 73.15 0
50 Penn State U. 26.860% 26.250% 30.070% 247/297 75.667% 72.53 77.47 0/ 9 30.530% 73.79 2
51 Middle Tennessee 21.800% 23.470% 25.230% 246/297 76.665% 72.50 76.89 0/11 27.264% 73.01 1
52 Texas El Paso, U. of 34.660% 36.860% 36.710% 246/297 75.826% 72.24 77.49 0/ 9 21.796% 73.56 3
53 South Florida 30.330% 30.900% 29.580% 245/297 75.348% 72.69 77.36 0/18 20.950% 72.79 2
54 Houston, Univ. of 27.720% 28.940% 29.850% 244/297 76.246% 72.75 76.89 0/19 24.983% 72.94 0
55 Saint Mary's (CA) 28.290% 29.300% 29.780% 240/297 74.699% 72.72 77.42 0/14 21.245% 73.24 0
56 Michigan, U. of 27.100% 28.160% 31.480% 240/297 73.798% 72.89 78.71 0/15 23.802% 73.31 2
57 Iowa, U. of 37.500% 36.620% 34.460% 239/297 74.123% 72.99 78.13 0/12 20.660% 73.13 0
58 UCLA 28.750% 33.280% 31.030% 239/297 73.594% 72.81 77.24 0/18 21.486% 72.78 0
59 TCU 32.480% 39.650% 39.590% 238/297 73.099% 72.82 78.35 0/20 15.159% 73.23 1
60 Ohio State University 30.120% 34.530% 34.040% 238/297 72.908% 73.07 77.96 0/21 19.764% 72.81 0
61 Michigan State 20.140% 25.260% 35.010% 238/297 72.424% 73.15 78.37 0/ 9 25.480% 73.29 3
62 Georgia Southern U. 30.720% 32.620% 40.610% 237.5/297 73.136% 72.48 77.41 0/ 9 28.084% 73.38 0
63 Troy University 33.850% 35.440% 29.000% 235/297 74.233% 72.57 76.82 0/12 26.597% 73.15 1
64 Charleston, Coll. of 31.520% 32.060% 33.190% 233/297 73.584% 72.60 76.90 0/12 22.803% 73.17 1
65 North Texas, U. of 34.900% 36.380% 34.410% 233/297 72.534% 73.20 78.10 0/17 19.081% 72.77 0
66 UC Santa Barbara 38.470% 32.990% 32.730% 231/297 72.188% 72.22 77.36 0/ 4 23.137% 74.08 4
67 Arizona, U. of 35.510% 34.510% 34.760% 231/297 71.809% 73.19 77.34 0/17 14.350% 72.95 0
68 Campbell University 32.180% 42.990% 40.980% 230/297 70.673% 72.61 77.72 0/ 3 21.077% 73.95 3
69 Georgia State Univ. 37.020% 36.100% 33.700% 228/297 72.549% 72.69 77.71 0/17 22.382% 73.10 0
70 California, U. of 35.080% 37.190% 37.820% 228/297 69.566% 73.57 79.66 0/22 14.574% 72.64 0
71 UNCW 36.270% 38.350% 38.940% 226/297 68.343% 72.79 78.87 0/12 19.711% 73.60 1
72 Tennessee, Univ. of 33.710% 33.180% 35.310% 225/297 70.399% 72.94 78.28 0/16 17.204% 73.29 2
73 Charlotte 37.980% 38.750% 38.870% 223/297 69.413% 73.04 77.53 0/11 16.723% 73.26 1
74 Oregon State Univ. 49.980% 51.660% 49.980% 223/297 68.983% 73.12 79.08 0/12 19.458% 73.32 0
75 SMU 37.170% 34.340% 38.630% 223/297 68.536% 73.50 78.19 0/17 14.539% 72.88 0
76 Virginia Tech 36.900% 40.210% 41.660% 223/297 67.937% 72.99 77.84 0/13 16.345% 73.25 1
77 Mississippi St. U. 25.980% 26.610% 27.180% 221/297 71.008% 72.88 77.09 0/14 18.356% 73.19 0
78 Colorado State Univ. 37.890% 43.180% 41.940% 221/297 69.493% 72.77 78.10 0/10 15.933% 73.44 1
79 James Madison Univ. 42.060% 40.220% 41.960% 221/297 67.744% 72.62 77.10 0/ 7 20.774% 73.88 1
80 Louisville, U. of 40.760% 40.070% 42.720% 219/297 67.075% 73.06 77.56 0/12 17.730% 73.54 1
81 UAB 39.770% 42.480% 41.950% 218/297 67.021% 73.44 78.72 0/15 15.709% 72.87 0
82 South Alabama, U. of 41.050% 43.250% 37.550% 216/297 67.580% 73.17 79.07 0/10 19.254% 73.32 0
83 San Francisco, U. of 43.070% 46.370% 47.330% 216/297 65.882% 73.36 78.87 0/ 6 14.435% 73.37 0
84 Cal Poly 42.920% 42.850% 42.700% 214/297 67.272% 72.90 77.24 0/ 6 15.975% 73.95 1
85 Minnesota, Univ. of 39.540% 43.890% 47.890% 212/297 64.749% 73.39 78.54 0/17 16.010% 73.16 0
86 McNeese State Univ. 46.530% 45.030% 44.600% 211/297 66.145% 73.34 77.47 0/ 9 15.071% 73.50 0
87 Washington State U. 45.770% 43.160% 43.310% 210/297 65.722% 73.46 77.84 0/ 8 13.904% 73.46 1
88 Jacksonville St. 48.970% 48.120% 47.700% 209/297 64.950% 72.90 77.85 0/ 2 21.985% 74.77 1
89 Arkansas State U. 47.650% 43.840% 36.710% 208/297 65.209% 73.11 78.60 0/ 3 23.380% 74.12 3
90 Nevada, Univ. of 49.100% 46.970% 45.920% 207/297 64.534% 73.17 77.80 0/ 4 10.960% 73.79 1
91 UTSA 35.170% 35.860% 35.430% 203/297 64.297% 73.48 78.73 0/15 12.397% 73.24 0
92 Long Beach State 48.230% 47.370% 48.890% 203/297 63.510% 73.36 78.17 0/ 5 14.884% 74.17 1
93 Notre Dame, U. of 50.720% 53.520% 54.160% 203/297 62.996% 73.30 77.57 0/12 8.709% 73.44 2
94 East Carolina Univ. 40.220% 41.090% 49.380% 202.5/297 63.677% 73.58 78.66 0/11 14.266% 73.41 1
95 Chattanooga 46.860% 46.370% 47.580% 202/297 63.459% 73.33 78.64 0/14 14.721% 73.76 0
Date: 04-26-2017 NCAA Men's Golf Scores for Little Rock Account: M0494 Division: 1 Region: C
@=Minimum Rounds for Rating: 15
COPYRIGHT ©, ALL RIGHTS RESERVED, Bloomington, IL GOLFSTAT.COM
LITTLEROCK Division Adjusted Average
versus Team Comparative Scoring Drop
Team 03/28/17 04/11/17 Current *Wins Average Score Versus# - Top 25 Schedule +Wins
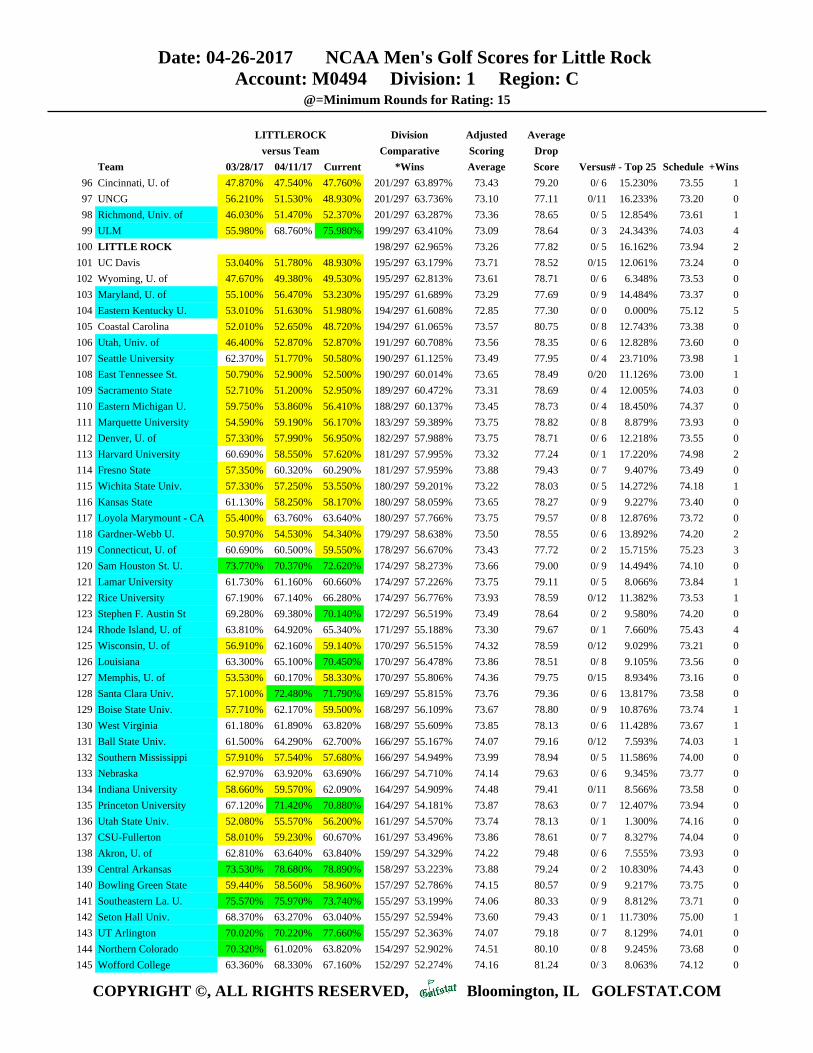
96 Cincinnati, U. of 47.870% 47.540% 47.760% 201/297 63.897% 73.43 79.20 0/ 6 15.230% 73.55 1
97 UNCG 56.210% 51.530% 48.930% 201/297 63.736% 73.10 77.11 0/11 16.233% 73.20 0
98 Richmond, Univ. of 46.030% 51.470% 52.370% 201/297 63.287% 73.36 78.65 0/ 5 12.854% 73.61 1
99 ULM 55.980% 68.760% 75.980% 199/297 63.410% 73.09 78.64 0/ 3 24.343% 74.03 4
100 LITTLE ROCK 198/297 62.965% 73.26 77.82 0/ 5 16.162% 73.94 2
101 UC Davis 53.040% 51.780% 48.930% 195/297 63.179% 73.71 78.52 0/15 12.061% 73.24 0
102 Wyoming, U. of 47.670% 49.380% 49.530% 195/297 62.813% 73.61 78.71 0/ 6 6.348% 73.53 0
103 Maryland, U. of 55.100% 56.470% 53.230% 195/297 61.689% 73.29 77.69 0/ 9 14.484% 73.37 0
104 Eastern Kentucky U. 53.010% 51.630% 51.980% 194/297 61.608% 72.85 77.30 0/ 0 0.000% 75.12 5
105 Coastal Carolina 52.010% 52.650% 48.720% 194/297 61.065% 73.57 80.75 0/ 8 12.743% 73.38 0
106 Utah, Univ. of 46.400% 52.870% 52.870% 191/297 60.708% 73.56 78.35 0/ 6 12.828% 73.60 0
107 Seattle University 62.370% 51.770% 50.580% 190/297 61.125% 73.49 77.95 0/ 4 23.710% 73.98 1
108 East Tennessee St. 50.790% 52.900% 52.500% 190/297 60.014% 73.65 78.49 0/20 11.126% 73.00 1
109 Sacramento State 52.710% 51.200% 52.950% 189/297 60.472% 73.31 78.69 0/ 4 12.005% 74.03 0
110 Eastern Michigan U. 59.750% 53.860% 56.410% 188/297 60.137% 73.45 78.73 0/ 4 18.450% 74.37 0
111 Marquette University 54.590% 59.190% 56.170% 183/297 59.389% 73.75 78.82 0/ 8 8.879% 73.93 0
112 Denver, U. of 57.330% 57.990% 56.950% 182/297 57.988% 73.75 78.71 0/ 6 12.218% 73.55 0
113 Harvard University 60.690% 58.550% 57.620% 181/297 57.995% 73.32 77.24 0/ 1 17.220% 74.98 2
114 Fresno State 57.350% 60.320% 60.290% 181/297 57.959% 73.88 79.43 0/ 7 9.407% 73.49 0
115 Wichita State Univ. 57.330% 57.250% 53.550% 180/297 59.201% 73.22 78.03 0/ 5 14.272% 74.18 1
116 Kansas State 61.130% 58.250% 58.170% 180/297 58.059% 73.65 78.27 0/ 9 9.227% 73.40 0
117 Loyola Marymount - CA 55.400% 63.760% 63.640% 180/297 57.766% 73.75 79.57 0/ 8 12.876% 73.72 0
118 Gardner-Webb U. 50.970% 54.530% 54.340% 179/297 58.638% 73.50 78.55 0/ 6 13.892% 74.20 2
119 Connecticut, U. of 60.690% 60.500% 59.550% 178/297 56.670% 73.43 77.72 0/ 2 15.715% 75.23 3
120 Sam Houston St. U. 73.770% 70.370% 72.620% 174/297 58.273% 73.66 79.00 0/ 9 14.494% 74.10 0
121 Lamar University 61.730% 61.160% 60.660% 174/297 57.226% 73.75 79.11 0/ 5 8.066% 73.84 1
122 Rice University 67.190% 67.140% 66.280% 174/297 56.776% 73.93 78.59 0/12 11.382% 73.53 1
123 Stephen F. Austin St 69.280% 69.380% 70.140% 172/297 56.519% 73.49 78.64 0/ 2 9.580% 74.20 0
124 Rhode Island, U. of 63.810% 64.920% 65.340% 171/297 55.188% 73.30 79.67 0/ 1 7.660% 75.43 4
125 Wisconsin, U. of 56.910% 62.160% 59.140% 170/297 56.515% 74.32 78.59 0/12 9.029% 73.21 0
126 Louisiana 63.300% 65.100% 70.450% 170/297 56.478% 73.86 78.51 0/ 8 9.105% 73.56 0
127 Memphis, U. of 53.530% 60.170% 58.330% 170/297 55.806% 74.36 79.75 0/15 8.934% 73.16 0
128 Santa Clara Univ. 57.100% 72.480% 71.790% 169/297 55.815% 73.76 79.36 0/ 6 13.817% 73.58 0
129 Boise State Univ. 57.710% 62.170% 59.500% 168/297 56.109% 73.67 78.80 0/ 9 10.876% 73.74 1
130 West Virginia 61.180% 61.890% 63.820% 168/297 55.609% 73.85 78.13 0/ 6 11.428% 73.67 1
131 Ball State Univ. 61.500% 64.290% 62.700% 166/297 55.167% 74.07 79.16 0/12 7.593% 74.03 1
132 Southern Mississippi 57.910% 57.540% 57.680% 166/297 54.949% 73.99 78.94 0/ 5 11.586% 74.00 0
133 Nebraska 62.970% 63.920% 63.690% 166/297 54.710% 74.14 79.63 0/ 6 9.345% 73.77 0
134 Indiana University 58.660% 59.570% 62.090% 164/297 54.909% 74.48 79.41 0/11 8.566% 73.58 0
135 Princeton University 67.120% 71.420% 70.880% 164/297 54.181% 73.87 78.63 0/ 7 12.407% 73.94 0
136 Utah State Univ. 52.080% 55.570% 56.200% 161/297 54.570% 73.74 78.13 0/ 1 1.300% 74.16 0
137 CSU-Fullerton 58.010% 59.230% 60.670% 161/297 53.496% 73.86 78.61 0/ 7 8.327% 74.04 0
138 Akron, U. of 62.810% 63.640% 63.840% 159/297 54.329% 74.22 79.48 0/ 6 7.555% 73.93 0
139 Central Arkansas 73.530% 78.680% 78.890% 158/297 53.223% 73.88 79.24 0/ 2 10.830% 74.43 0
140 Bowling Green State 59.440% 58.560% 58.960% 157/297 52.786% 74.15 80.57 0/ 9 9.217% 73.75 0
141 Southeastern La. U. 75.570% 75.970% 73.740% 155/297 53.199% 74.06 80.33 0/ 9 8.812% 73.71 0
142 Seton Hall Univ. 68.370% 63.270% 63.040% 155/297 52.594% 73.60 79.43 0/ 1 11.730% 75.00 1
143 UT Arlington 70.020% 70.220% 77.660% 155/297 52.363% 74.07 79.18 0/ 7 8.129% 74.01 0
144 Northern Colorado 70.320% 61.020% 63.820% 154/297 52.902% 74.51 80.10 0/ 8 9.245% 73.68 0
145 Wofford College 63.360% 68.330% 67.160% 152/297 52.274% 74.16 81.24 0/ 3 8.063% 74.12 0
Date: 04-26-2017 NCAA Men's Golf Scores for Little Rock Account: M0494 Division: 1 Region: C
@=Minimum Rounds for Rating: 15
COPYRIGHT ©, ALL RIGHTS RESERVED, Bloomington, IL GOLFSTAT.COM
LITTLEROCK Division Adjusted Average
versus Team Comparative Scoring Drop
Team 03/28/17 04/11/17 Current *Wins Average Score Versus# - Top 25 Schedule +Wins
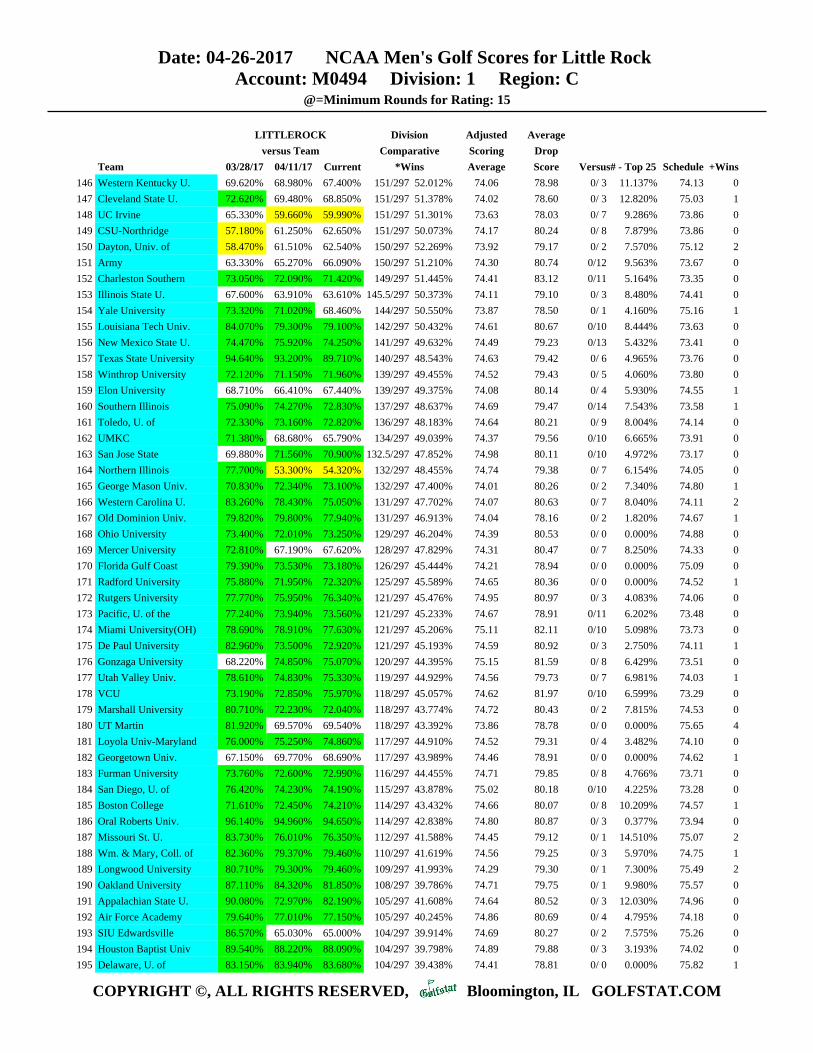
146 Western Kentucky U. 69.620% 68.980% 67.400% 151/297 52.012% 74.06 78.98 0/ 3 11.137% 74.13 0
147 Cleveland State U. 72.620% 69.480% 68.850% 151/297 51.378% 74.02 78.60 0/ 3 12.820% 75.03 1
148 UC Irvine 65.330% 59.660% 59.990% 151/297 51.301% 73.63 78.03 0/ 7 9.286% 73.86 0
149 CSU-Northridge 57.180% 61.250% 62.650% 151/297 50.073% 74.17 80.24 0/ 8 7.879% 73.86 0
150 Dayton, Univ. of 58.470% 61.510% 62.540% 150/297 52.269% 73.92 79.17 0/ 2 7.570% 75.12 2
151 Army 63.330% 65.270% 66.090% 150/297 51.210% 74.30 80.74 0/12 9.563% 73.67 0
152 Charleston Southern 73.050% 72.090% 71.420% 149/297 51.445% 74.41 83.12 0/11 5.164% 73.35 0
153 Illinois State U. 67.600% 63.910% 63.610% 145.5/297 50.373% 74.11 79.10 0/ 3 8.480% 74.41 0
154 Yale University 73.320% 71.020% 68.460% 144/297 50.550% 73.87 78.50 0/ 1 4.160% 75.16 1
155 Louisiana Tech Univ. 84.070% 79.300% 79.100% 142/297 50.432% 74.61 80.67 0/10 8.444% 73.63 0
156 New Mexico State U. 74.470% 75.920% 74.250% 141/297 49.632% 74.49 79.23 0/13 5.432% 73.41 0
157 Texas State University 94.640% 93.200% 89.710% 140/297 48.543% 74.63 79.42 0/ 6 4.965% 73.76 0
158 Winthrop University 72.120% 71.150% 71.960% 139/297 49.455% 74.52 79.43 0/ 5 4.060% 73.80 0
159 Elon University 68.710% 66.410% 67.440% 139/297 49.375% 74.08 80.14 0/ 4 5.930% 74.55 1
160 Southern Illinois 75.090% 74.270% 72.830% 137/297 48.637% 74.69 79.47 0/14 7.543% 73.58 1
161 Toledo, U. of 72.330% 73.160% 72.820% 136/297 48.183% 74.64 80.21 0/ 9 8.004% 74.14 0
162 UMKC 71.380% 68.680% 65.790% 134/297 49.039% 74.37 79.56 0/10 6.665% 73.91 0
163 San Jose State 69.880% 71.560% 70.900% 132.5/297 47.852% 74.98 80.11 0/10 4.972% 73.17 0
164 Northern Illinois 77.700% 53.300% 54.320% 132/297 48.455% 74.74 79.38 0/ 7 6.154% 74.05 0
165 George Mason Univ. 70.830% 72.340% 73.100% 132/297 47.400% 74.01 80.26 0/ 2 7.340% 74.80 1
166 Western Carolina U. 83.260% 78.430% 75.050% 131/297 47.702% 74.07 80.63 0/ 7 8.040% 74.11 2
167 Old Dominion Univ. 79.820% 79.800% 77.940% 131/297 46.913% 74.04 78.16 0/ 2 1.820% 74.67 1
168 Ohio University 73.400% 72.010% 73.250% 129/297 46.204% 74.39 80.53 0/ 0 0.000% 74.88 0
169 Mercer University 72.810% 67.190% 67.620% 128/297 47.829% 74.31 80.47 0/ 7 8.250% 74.33 0
170 Florida Gulf Coast 79.390% 73.530% 73.180% 126/297 45.444% 74.21 78.94 0/ 0 0.000% 75.09 0
171 Radford University 75.880% 71.950% 72.320% 125/297 45.589% 74.65 80.36 0/ 0 0.000% 74.52 1
172 Rutgers University 77.770% 75.950% 76.340% 121/297 45.476% 74.95 80.97 0/ 3 4.083% 74.06 0
173 Pacific, U. of the 77.240% 73.940% 73.560% 121/297 45.233% 74.67 78.91 0/11 6.202% 73.48 0
174 Miami University(OH) 78.690% 78.910% 77.630% 121/297 45.206% 75.11 82.11 0/10 5.098% 73.73 0
175 De Paul University 82.960% 73.500% 72.920% 121/297 45.193% 74.59 80.92 0/ 3 2.750% 74.11 1
176 Gonzaga University 68.220% 74.850% 75.070% 120/297 44.395% 75.15 81.59 0/ 8 6.429% 73.51 0
177 Utah Valley Univ. 78.610% 74.830% 75.330% 119/297 44.929% 74.56 79.73 0/ 7 6.981% 74.03 1
178 VCU 73.190% 72.850% 75.970% 118/297 45.057% 74.62 81.97 0/10 6.599% 73.29 0
179 Marshall University 80.710% 72.230% 72.040% 118/297 43.774% 74.72 80.43 0/ 2 7.815% 74.53 0
180 UT Martin 81.920% 69.570% 69.540% 118/297 43.392% 73.86 78.78 0/ 0 0.000% 75.65 4
181 Loyola Univ-Maryland 76.000% 75.250% 74.860% 117/297 44.910% 74.52 79.31 0/ 4 3.482% 74.10 0
182 Georgetown Univ. 67.150% 69.770% 68.690% 117/297 43.989% 74.46 78.91 0/ 0 0.000% 74.62 1
183 Furman University 73.760% 72.600% 72.990% 116/297 44.455% 74.71 79.85 0/ 8 4.766% 73.71 0
184 San Diego, U. of 76.420% 74.230% 74.190% 115/297 43.878% 75.02 80.18 0/10 4.225% 73.28 0
185 Boston College 71.610% 72.450% 74.210% 114/297 43.432% 74.66 80.07 0/ 8 10.209% 74.57 1
186 Oral Roberts Univ. 96.140% 94.960% 94.650% 114/297 42.838% 74.80 80.87 0/ 3 0.377% 73.94 0
187 Missouri St. U. 83.730% 76.010% 76.350% 112/297 41.588% 74.45 79.12 0/ 1 14.510% 75.07 2
188 Wm. & Mary, Coll. of 82.360% 79.370% 79.460% 110/297 41.619% 74.56 79.25 0/ 3 5.970% 74.75 1
189 Longwood University 80.710% 79.300% 79.460% 109/297 41.993% 74.29 79.30 0/ 1 7.300% 75.49 2
190 Oakland University 87.110% 84.320% 81.850% 108/297 39.786% 74.71 79.75 0/ 1 9.980% 75.57 0
191 Appalachian State U. 90.080% 72.970% 82.190% 105/297 41.608% 74.64 80.52 0/ 3 12.030% 74.96 0
192 Air Force Academy 79.640% 77.010% 77.150% 105/297 40.245% 74.86 80.69 0/ 4 4.795% 74.18 0
193 SIU Edwardsville 86.570% 65.030% 65.000% 104/297 39.914% 74.69 80.27 0/ 2 7.575% 75.26 0
194 Houston Baptist Univ 89.540% 88.220% 88.090% 104/297 39.798% 74.89 79.88 0/ 3 3.193% 74.02 0
195 Delaware, U. of 83.150% 83.940% 83.680% 104/297 39.438% 74.41 78.81 0/ 0 0.000% 75.82 1
Date: 04-26-2017 NCAA Men's Golf Scores for Little Rock Account: M0494 Division: 1 Region: C
@=Minimum Rounds for Rating: 15
COPYRIGHT ©, ALL RIGHTS RESERVED, Bloomington, IL GOLFSTAT.COM
LITTLEROCK Division Adjusted Average
versus Team Comparative Scoring Drop
Team 03/28/17 04/11/17 Current *Wins Average Score Versus# - Top 25 Schedule +Wins
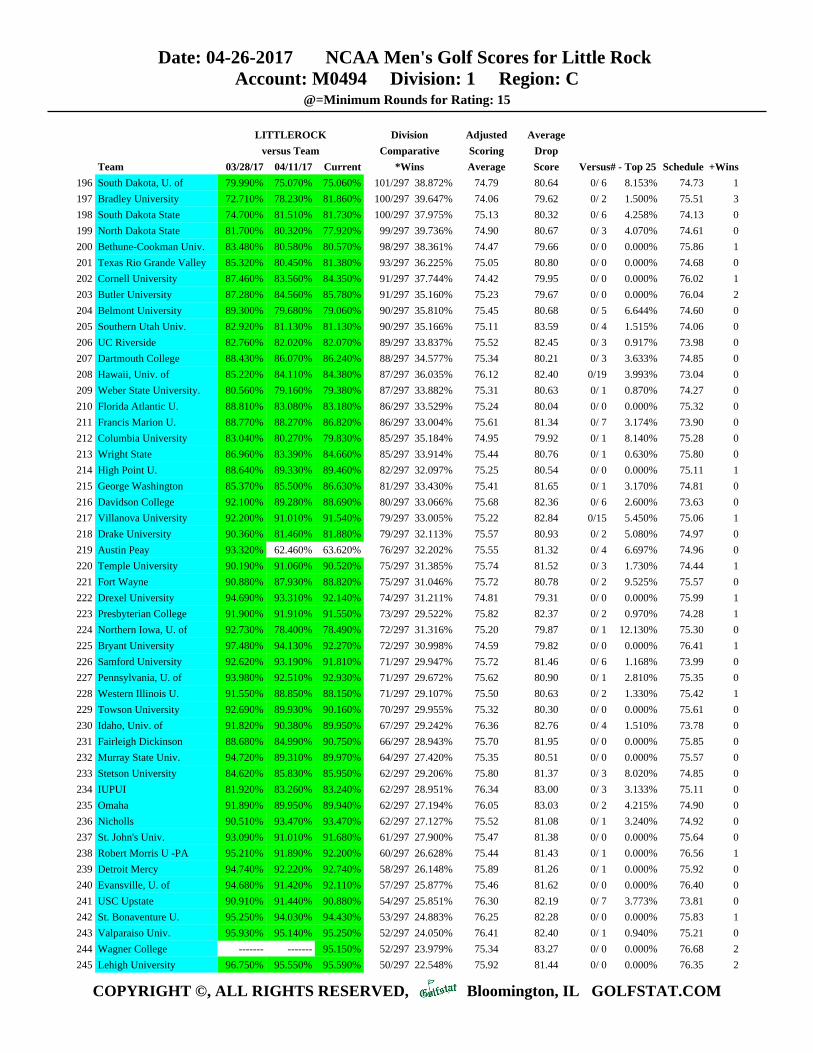
196 South Dakota, U. of 79.990% 75.070% 75.060% 101/297 38.872% 74.79 80.64 0/ 6 8.153% 74.73 1
197 Bradley University 72.710% 78.230% 81.860% 100/297 39.647% 74.06 79.62 0/ 2 1.500% 75.51 3
198 South Dakota State 74.700% 81.510% 81.730% 100/297 37.975% 75.13 80.32 0/ 6 4.258% 74.13 0
199 North Dakota State 81.700% 80.320% 77.920% 99/297 39.736% 74.90 80.67 0/ 3 4.070% 74.61 0
200 Bethune-Cookman Univ. 83.480% 80.580% 80.570% 98/297 38.361% 74.47 79.66 0/ 0 0.000% 75.86 1
201 Texas Rio Grande Valley 85.320% 80.450% 81.380% 93/297 36.225% 75.05 80.80 0/ 0 0.000% 74.68 0
202 Cornell University 87.460% 83.560% 84.350% 91/297 37.744% 74.42 79.95 0/ 0 0.000% 76.02 1
203 Butler University 87.280% 84.560% 85.780% 91/297 35.160% 75.23 79.67 0/ 0 0.000% 76.04 2
204 Belmont University 89.300% 79.680% 79.060% 90/297 35.810% 75.45 80.68 0/ 5 6.644% 74.60 0
205 Southern Utah Univ. 82.920% 81.130% 81.130% 90/297 35.166% 75.11 83.59 0/ 4 1.515% 74.06 0
206 UC Riverside 82.760% 82.020% 82.070% 89/297 33.837% 75.52 82.45 0/ 3 0.917% 73.98 0
207 Dartmouth College 88.430% 86.070% 86.240% 88/297 34.577% 75.34 80.21 0/ 3 3.633% 74.85 0
208 Hawaii, Univ. of 85.220% 84.110% 84.380% 87/297 36.035% 76.12 82.40 0/19 3.993% 73.04 0
209 Weber State University. 80.560% 79.160% 79.380% 87/297 33.882% 75.31 80.63 0/ 1 0.870% 74.27 0
210 Florida Atlantic U. 88.810% 83.080% 83.180% 86/297 33.529% 75.24 80.04 0/ 0 0.000% 75.32 0
211 Francis Marion U. 88.770% 88.270% 86.820% 86/297 33.004% 75.61 81.34 0/ 7 3.174% 73.90 0
212 Columbia University 83.040% 80.270% 79.830% 85/297 35.184% 74.95 79.92 0/ 1 8.140% 75.28 0
213 Wright State 86.960% 83.390% 84.660% 85/297 33.914% 75.44 80.76 0/ 1 0.630% 75.80 0
214 High Point U. 88.640% 89.330% 89.460% 82/297 32.097% 75.25 80.54 0/ 0 0.000% 75.11 1
215 George Washington 85.370% 85.500% 86.630% 81/297 33.430% 75.41 81.65 0/ 1 3.170% 74.81 0
216 Davidson College 92.100% 89.280% 88.690% 80/297 33.066% 75.68 82.36 0/ 6 2.600% 73.63 0
217 Villanova University 92.200% 91.010% 91.540% 79/297 33.005% 75.22 82.84 0/15 5.450% 75.06 1
218 Drake University 90.360% 81.460% 81.880% 79/297 32.113% 75.57 80.93 0/ 2 5.080% 74.97 0
219 Austin Peay 93.320% 62.460% 63.620% 76/297 32.202% 75.55 81.32 0/ 4 6.697% 74.96 0
220 Temple University 90.190% 91.060% 90.520% 75/297 31.385% 75.74 81.52 0/ 3 1.730% 74.44 1
221 Fort Wayne 90.880% 87.930% 88.820% 75/297 31.046% 75.72 80.78 0/ 2 9.525% 75.57 0
222 Drexel University 94.690% 93.310% 92.140% 74/297 31.211% 74.81 79.31 0/ 0 0.000% 75.99 1
223 Presbyterian College 91.900% 91.910% 91.550% 73/297 29.522% 75.82 82.37 0/ 2 0.970% 74.28 1
224 Northern Iowa, U. of 92.730% 78.400% 78.490% 72/297 31.316% 75.20 79.87 0/ 1 12.130% 75.30 0
225 Bryant University 97.480% 94.130% 92.270% 72/297 30.998% 74.59 79.82 0/ 0 0.000% 76.41 1
226 Samford University 92.620% 93.190% 91.810% 71/297 29.947% 75.72 81.46 0/ 6 1.168% 73.99 0
227 Pennsylvania, U. of 93.980% 92.510% 92.930% 71/297 29.672% 75.62 80.90 0/ 1 2.810% 75.35 0
228 Western Illinois U. 91.550% 88.850% 88.150% 71/297 29.107% 75.50 80.63 0/ 2 1.330% 75.42 1
229 Towson University 92.690% 89.930% 90.160% 70/297 29.955% 75.32 80.30 0/ 0 0.000% 75.61 0
230 Idaho, Univ. of 91.820% 90.380% 89.950% 67/297 29.242% 76.36 82.76 0/ 4 1.510% 73.78 0
231 Fairleigh Dickinson 88.680% 84.990% 90.750% 66/297 28.943% 75.70 81.95 0/ 0 0.000% 75.85 0
232 Murray State Univ. 94.720% 89.310% 89.970% 64/297 27.420% 75.35 80.51 0/ 0 0.000% 75.57 0
233 Stetson University 84.620% 85.830% 85.950% 62/297 29.206% 75.80 81.37 0/ 3 8.020% 74.85 0
234 IUPUI 81.920% 83.260% 83.240% 62/297 28.951% 76.34 83.00 0/ 3 3.133% 75.11 0
235 Omaha 91.890% 89.950% 89.940% 62/297 27.194% 76.05 83.03 0/ 2 4.215% 74.90 0
236 Nicholls 90.510% 93.470% 93.470% 62/297 27.127% 75.52 81.08 0/ 1 3.240% 74.92 0
237 St. John's Univ. 93.090% 91.010% 91.680% 61/297 27.900% 75.47 81.38 0/ 0 0.000% 75.64 0
238 Robert Morris U -PA 95.210% 91.890% 92.200% 60/297 26.628% 75.44 81.43 0/ 1 0.000% 76.56 1
239 Detroit Mercy 94.740% 92.220% 92.740% 58/297 26.148% 75.89 81.26 0/ 1 0.000% 75.92 0
240 Evansville, U. of 94.680% 91.420% 92.110% 57/297 25.877% 75.46 81.62 0/ 0 0.000% 76.40 0
241 USC Upstate 90.910% 91.440% 90.880% 54/297 25.851% 76.30 82.19 0/ 7 3.773% 73.81 0
242 St. Bonaventure U. 95.250% 94.030% 94.430% 53/297 24.883% 76.25 82.28 0/ 0 0.000% 75.83 1
243 Valparaiso Univ. 95.930% 95.140% 95.250% 52/297 24.050% 76.41 82.40 0/ 1 0.940% 75.21 0
244 Wagner College ------- ------- 95.150% 52/297 23.979% 75.34 83.27 0/ 0 0.000% 76.68 2
245 Lehigh University 96.750% 95.550% 95.590% 50/297 22.548% 75.92 81.44 0/ 0 0.000% 76.35 2
Date: 04-26-2017 NCAA Men's Golf Scores for Little Rock Account: M0494 Division: 1 Region: C
@=Minimum Rounds for Rating: 15
COPYRIGHT ©, ALL RIGHTS RESERVED, Bloomington, IL GOLFSTAT.COM
LITTLEROCK Division Adjusted Average
versus Team Comparative Scoring Drop
Team 03/28/17 04/11/17 Current *Wins Average Score Versus# - Top 25 Schedule +Wins
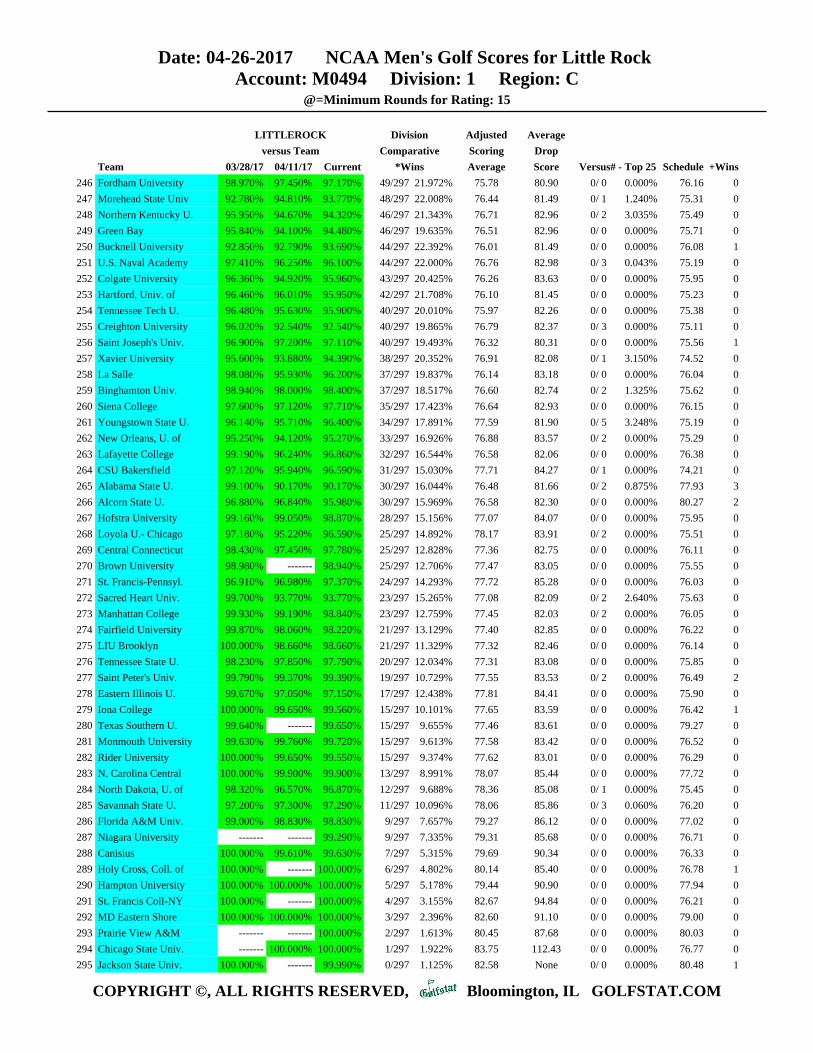
246 Fordham University 98.970% 97.450% 97.170% 49/297 21.972% 75.78 80.90 0/ 0 0.000% 76.16 0
247 Morehead State Univ 92.780% 94.810% 93.770% 48/297 22.008% 76.44 81.49 0/ 1 1.240% 75.31 0
248 Northern Kentucky U. 95.950% 94.670% 94.320% 46/297 21.343% 76.71 82.96 0/ 2 3.035% 75.49 0
249 Green Bay 95.840% 94.100% 94.480% 46/297 19.635% 76.51 82.96 0/ 0 0.000% 75.71 0
250 Bucknell University 92.850% 92.790% 93.690% 44/297 22.392% 76.01 81.49 0/ 0 0.000% 76.08 1
251 U.S. Naval Academy 97.410% 96.250% 96.100% 44/297 22.000% 76.76 82.98 0/ 3 0.043% 75.19 0
252 Colgate University 96.360% 94.920% 95.960% 43/297 20.425% 76.26 83.63 0/ 0 0.000% 75.95 0
253 Hartford, Univ. of 96.460% 96.010% 95.950% 42/297 21.708% 76.10 81.45 0/ 0 0.000% 75.23 0
254 Tennessee Tech U. 96.480% 95.630% 95.900% 40/297 20.010% 75.97 82.26 0/ 0 0.000% 75.38 0
255 Creighton University 96.020% 92.540% 92.540% 40/297 19.865% 76.79 82.37 0/ 3 0.000% 75.11 0
256 Saint Joseph's Univ. 96.900% 97.200% 97.110% 40/297 19.493% 76.32 80.31 0/ 0 0.000% 75.56 1
257 Xavier University 95.600% 93.880% 94.390% 38/297 20.352% 76.91 82.08 0/ 1 3.150% 74.52 0
258 La Salle 98.080% 95.930% 96.200% 37/297 19.837% 76.14 83.18 0/ 0 0.000% 76.04 0
259 Binghamton Univ. 98.940% 98.000% 98.400% 37/297 18.517% 76.60 82.74 0/ 2 1.325% 75.62 0
260 Siena College 97.600% 97.120% 97.710% 35/297 17.423% 76.64 82.93 0/ 0 0.000% 76.15 0
261 Youngstown State U. 96.140% 95.710% 96.400% 34/297 17.891% 77.59 81.90 0/ 5 3.248% 75.19 0
262 New Orleans, U. of 95.250% 94.120% 95.270% 33/297 16.926% 76.88 83.57 0/ 2 0.000% 75.29 0
263 Lafayette College 99.190% 96.240% 96.860% 32/297 16.544% 76.58 82.06 0/ 0 0.000% 76.38 0
264 CSU Bakersfield 97.120% 95.940% 96.590% 31/297 15.030% 77.71 84.27 0/ 1 0.000% 74.21 0
265 Alabama State U. 99.100% 90.170% 90.170% 30/297 16.044% 76.48 81.66 0/ 2 0.875% 77.93 3
266 Alcorn State U. 96.880% 96.840% 95.980% 30/297 15.969% 76.58 82.30 0/ 0 0.000% 80.27 2
267 Hofstra University 99.160% 99.050% 98.870% 28/297 15.156% 77.07 84.07 0/ 0 0.000% 75.95 0
268 Loyola U.- Chicago 97.180% 95.220% 96.590% 25/297 14.892% 78.17 83.91 0/ 2 0.000% 75.51 0
269 Central Connecticut 98.430% 97.450% 97.780% 25/297 12.828% 77.36 82.75 0/ 0 0.000% 76.11 0
270 Brown University 98.980% ------- 98.940% 25/297 12.706% 77.47 83.05 0/ 0 0.000% 75.55 0
271 St. Francis-Pennsyl. 96.910% 96.980% 97.370% 24/297 14.293% 77.72 85.28 0/ 0 0.000% 76.03 0
272 Sacred Heart Univ. 99.700% 93.770% 93.770% 23/297 15.265% 77.08 82.09 0/ 2 2.640% 75.63 0
273 Manhattan College 99.930% 99.190% 98.840% 23/297 12.759% 77.45 82.03 0/ 2 0.000% 76.05 0
274 Fairfield University 99.870% 98.060% 98.220% 21/297 13.129% 77.40 82.85 0/ 0 0.000% 76.22 0
275 LIU Brooklyn 100.000% 98.660% 98.660% 21/297 11.329% 77.32 82.46 0/ 0 0.000% 76.14 0
276 Tennessee State U. 98.230% 97.850% 97.790% 20/297 12.034% 77.31 83.08 0/ 0 0.000% 75.85 0
277 Saint Peter's Univ. 99.790% 99.370% 99.390% 19/297 10.729% 77.55 83.53 0/ 2 0.000% 76.49 2
278 Eastern Illinois U. 99.670% 97.050% 97.150% 17/297 12.438% 77.81 84.41 0/ 0 0.000% 75.90 0
279 Iona College 100.000% 99.650% 99.560% 15/297 10.101% 77.65 83.59 0/ 0 0.000% 76.42 1
280 Texas Southern U. 99.640% ------- 99.650% 15/297 9.655% 77.46 83.61 0/ 0 0.000% 79.27 0
281 Monmouth University 99.630% 99.760% 99.720% 15/297 9.613% 77.58 83.42 0/ 0 0.000% 76.52 0
282 Rider University 100.000% 99.650% 99.550% 15/297 9.374% 77.62 83.01 0/ 0 0.000% 76.29 0
283 N. Carolina Central 100.000% 99.900% 99.900% 13/297 8.991% 78.07 85.44 0/ 0 0.000% 77.72 0
284 North Dakota, U. of 98.320% 96.570% 96.870% 12/297 9.688% 78.36 85.08 0/ 1 0.000% 75.45 0
285 Savannah State U. 97.200% 97.300% 97.290% 11/297 10.096% 78.06 85.86 0/ 3 0.060% 76.20 0
286 Florida A&M Univ. 99.000% 98.830% 98.830% 9/297 7.657% 79.27 86.12 0/ 0 0.000% 77.02 0
287 Niagara University ------- ------- 99.290% 9/297 7.335% 79.31 85.68 0/ 0 0.000% 76.71 0
288 Canisius 100.000% 99.610% 99.630% 7/297 5.315% 79.69 90.34 0/ 0 0.000% 76.33 0
289 Holy Cross, Coll. of 100.000% ------- 100.000% 6/297 4.802% 80.14 85.40 0/ 0 0.000% 76.78 1
290 Hampton University 100.000% 100.000% 100.000% 5/297 5.178% 79.44 90.90 0/ 0 0.000% 77.94 0
291 St. Francis Coll-NY 100.000% ------- 100.000% 4/297 3.155% 82.67 94.84 0/ 0 0.000% 76.21 0
292 MD Eastern Shore 100.000% 100.000% 100.000% 3/297 2.396% 82.60 91.10 0/ 0 0.000% 79.00 0
293 Prairie View A&M ------- ------- 100.000% 2/297 1.613% 80.45 87.68 0/ 0 0.000% 80.03 0
294 Chicago State Univ. ------- 100.000% 100.000% 1/297 1.922% 83.75 112.43 0/ 0 0.000% 76.77 0
295 Jackson State Univ. 100.000% ------- 99.990% 0/297 1.125% 82.58 None 0/ 0 0.000% 80.48 1
Date: 04-26-2017 NCAA Men's Golf Scores for Little Rock Account: M0494 Division: 1 Region: C
@=Minimum Rounds for Rating: 15
COPYRIGHT ©, ALL RIGHTS RESERVED, Bloomington, IL GOLFSTAT.COM
LITTLEROCK Division Adjusted Average
versus Team Comparative Scoring Drop
Team 03/28/17 04/11/17 Current *Wins Average Score Versus# - Top 25 Schedule +Wins
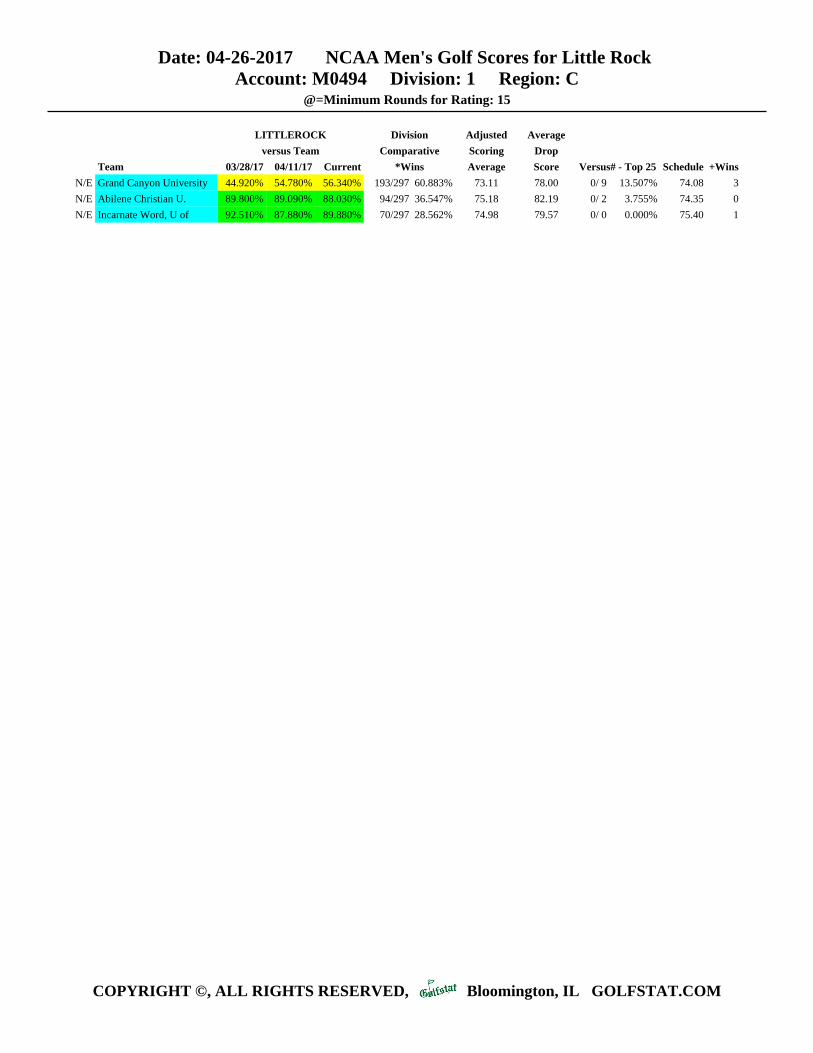
N/E Grand Canyon University 44.920% 54.780% 56.340% 193/297 60.883% 73.11 78.00 0/ 9 13.507% 74.08 3
N/E Abilene Christian U. 89.800% 89.090% 88.030% 94/297 36.547% 75.18 82.19 0/ 2 3.755% 74.35 0
N/E Incarnate Word, U of 92.510% 87.880% 89.880% 70/297 28.562% 74.98 79.57 0/ 0 0.000% 75.40 1
Date: 04-26-2017 NCAA Men's Golf Scores for Little Rock Account: M0494 Division: 1 Region: C
@=Minimum Rounds for Rating: 15
COPYRIGHT ©, ALL RIGHTS RESERVED, Bloomington, IL GOLFSTAT.COM
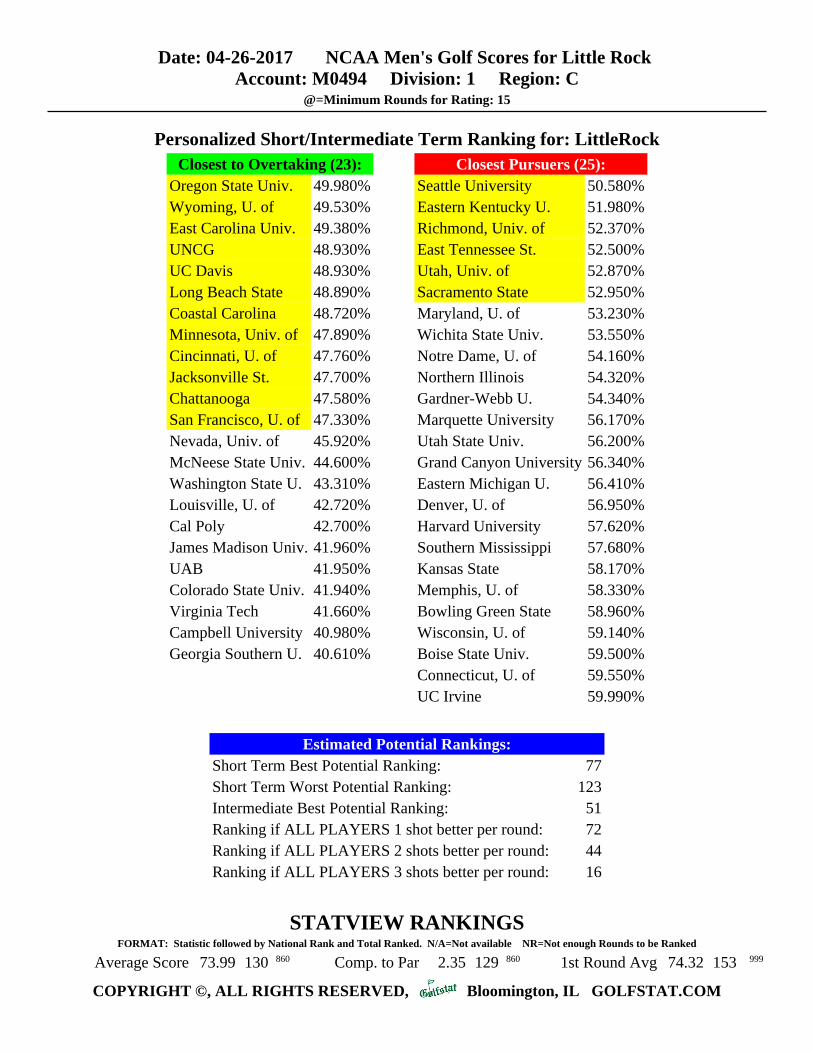
Personalized Short/Intermediate Term Ranking for: LittleRockClosest to Overtaking (23): Closest Pursuers (25):
Oregon State Univ. 49.980% Seattle University 50.580%Wyoming, U. of 49.530% Eastern Kentucky U. 51.980%East Carolina Univ. 49.380% Richmond, Univ. of 52.370%UNCG 48.930% East Tennessee St. 52.500%UC Davis 48.930% Utah, Univ. of 52.870%Long Beach State 48.890% Sacramento State 52.950%Coastal Carolina 48.720% Maryland, U. of 53.230%Minnesota, Univ. of 47.890% Wichita State Univ. 53.550%Cincinnati, U. of 47.760% Notre Dame, U. of 54.160%Jacksonville St. 47.700% Northern Illinois 54.320%Chattanooga 47.580% Gardner-Webb U. 54.340%San Francisco, U. of 47.330% Marquette University 56.170%Nevada, Univ. of 45.920% Utah State Univ. 56.200%McNeese State Univ. 44.600% Grand Canyon University 56.340%Washington State U. 43.310% Eastern Michigan U. 56.410%Louisville, U. of 42.720% Denver, U. of 56.950%Cal Poly 42.700% Harvard University 57.620%James Madison Univ. 41.960% Southern Mississippi 57.680%UAB 41.950% Kansas State 58.170%Colorado State Univ. 41.940% Memphis, U. of 58.330%Virginia Tech 41.660% Bowling Green State 58.960%Campbell University 40.980% Wisconsin, U. of 59.140%Georgia Southern U. 40.610% Boise State Univ. 59.500%
Connecticut, U. of 59.550%UC Irvine 59.990%
Estimated Potential Rankings:Short Term Best Potential Ranking: 77Short Term Worst Potential Ranking: 123Intermediate Best Potential Ranking: 51Ranking if ALL PLAYERS 1 shot better per round: 72Ranking if ALL PLAYERS 2 shots better per round: 44Ranking if ALL PLAYERS 3 shots better per round: 16
STATVIEW RANKINGSFORMAT: Statistic followed by National Rank and Total Ranked. N/A=Not available NR=Not enough Rounds to be Ranked
Average Score 73.99 130 860 Comp. to Par 2.35 129 860 1st Round Avg 74.32 153 999
Date: 04-26-2017 NCAA Men's Golf Scores for Little Rock Account: M0494 Division: 1 Region: C
@=Minimum Rounds for Rating: 15
COPYRIGHT ©, ALL RIGHTS RESERVED, Bloomington, IL GOLFSTAT.COM
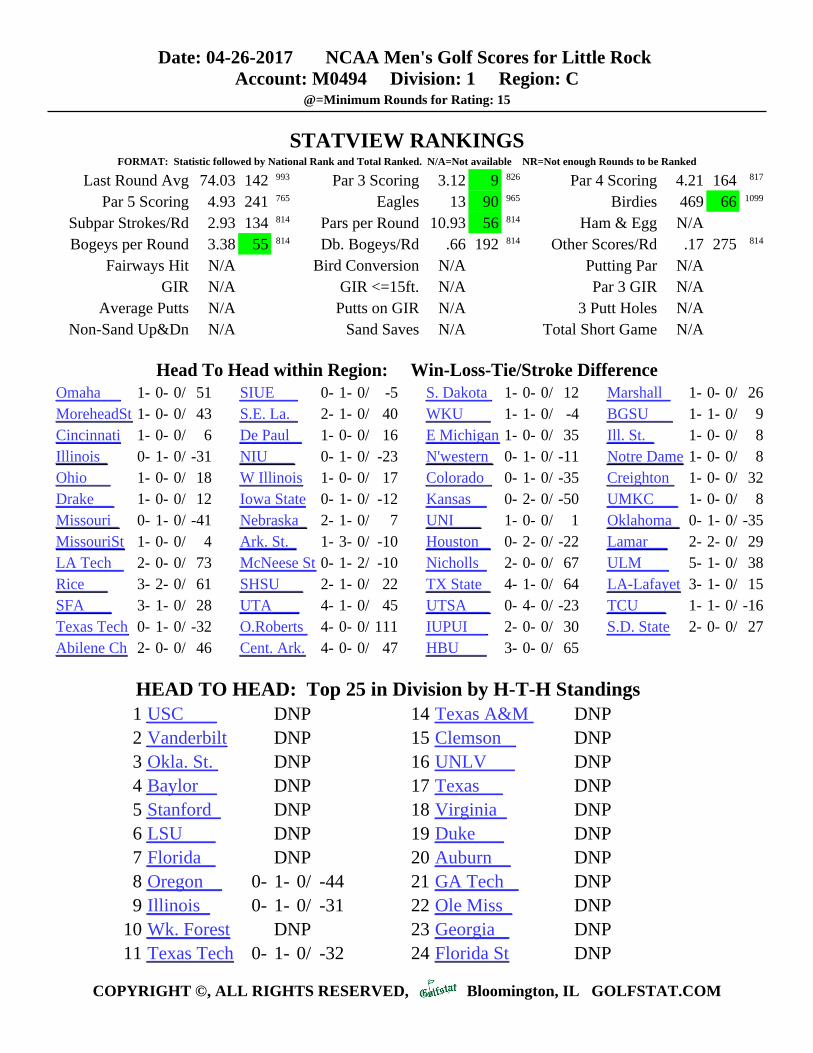
STATVIEW RANKINGSFORMAT: Statistic followed by National Rank and Total Ranked. N/A=Not available NR=Not enough Rounds to be Ranked
Last Round Avg 74.03 142 993 Par 3 Scoring 3.12 9 826 Par 4 Scoring 4.21 164 817
Par 5 Scoring 4.93 241 765 Eagles 13 90 965 Birdies 469 66 1099
Subpar Strokes/Rd 2.93 134 814 Pars per Round 10.93 56 814 Ham & Egg N/ABogeys per Round 3.38 55 814 Db. Bogeys/Rd .66 192 814 Other Scores/Rd .17 275 814
Fairways Hit N/A Bird Conversion N/A Putting Par N/AGIR N/A GIR <=15ft. N/A Par 3 GIR N/A
Average Putts N/A Putts on GIR N/A 3 Putt Holes N/ANon-Sand Up&Dn N/A Sand Saves N/A Total Short Game N/A
Head To Head within Region: Win-Loss-Tie/Stroke DifferenceOmaha 1- 0- 0/ 51 SIUE 0- 1- 0/ -5 S. Dakota 1- 0- 0/ 12 Marshall 1- 0- 0/ 26MoreheadSt 1- 0- 0/ 43 S.E. La. 2- 1- 0/ 40 WKU 1- 1- 0/ -4 BGSU 1- 1- 0/ 9Cincinnati 1- 0- 0/ 6 De Paul 1- 0- 0/ 16 E Michigan 1- 0- 0/ 35 Ill. St. 1- 0- 0/ 8Illinois 0- 1- 0/ -31 NIU 0- 1- 0/ -23 N'western 0- 1- 0/ -11 Notre Dame 1- 0- 0/ 8Ohio 1- 0- 0/ 18 W Illinois 1- 0- 0/ 17 Colorado 0- 1- 0/ -35 Creighton 1- 0- 0/ 32Drake 1- 0- 0/ 12 Iowa State 0- 1- 0/ -12 Kansas 0- 2- 0/ -50 UMKC 1- 0- 0/ 8Missouri 0- 1- 0/ -41 Nebraska 2- 1- 0/ 7 UNI 1- 0- 0/ 1 Oklahoma 0- 1- 0/ -35MissouriSt 1- 0- 0/ 4 Ark. St. 1- 3- 0/ -10 Houston 0- 2- 0/ -22 Lamar 2- 2- 0/ 29LA Tech 2- 0- 0/ 73 McNeese St 0- 1- 2/ -10 Nicholls 2- 0- 0/ 67 ULM 5- 1- 0/ 38Rice 3- 2- 0/ 61 SHSU 2- 1- 0/ 22 TX State 4- 1- 0/ 64 LA-Lafayet 3- 1- 0/ 15SFA 3- 1- 0/ 28 UTA 4- 1- 0/ 45 UTSA 0- 4- 0/ -23 TCU 1- 1- 0/ -16Texas Tech 0- 1- 0/ -32 O.Roberts 4- 0- 0/ 111 IUPUI 2- 0- 0/ 30 S.D. State 2- 0- 0/ 27Abilene Ch 2- 0- 0/ 46 Cent. Ark. 4- 0- 0/ 47 HBU 3- 0- 0/ 65
HEAD TO HEAD: Top 25 in Division by H-T-H Standings1 USC DNP 14 Texas A&M DNP2 Vanderbilt DNP 15 Clemson DNP3 Okla. St. DNP 16 UNLV DNP4 Baylor DNP 17 Texas DNP5 Stanford DNP 18 Virginia DNP6 LSU DNP 19 Duke DNP7 Florida DNP 20 Auburn DNP8 Oregon 0- 1- 0/ -44 21 GA Tech DNP9 Illinois 0- 1- 0/ -31 22 Ole Miss DNP
10 Wk. Forest DNP 23 Georgia DNP11 Texas Tech 0- 1- 0/ -32 24 Florida St DNP
Date: 04-26-2017 NCAA Men's Golf Scores for Little Rock Account: M0494 Division: 1 Region: C
@=Minimum Rounds for Rating: 15
COPYRIGHT ©, ALL RIGHTS RESERVED, Bloomington, IL GOLFSTAT.COM
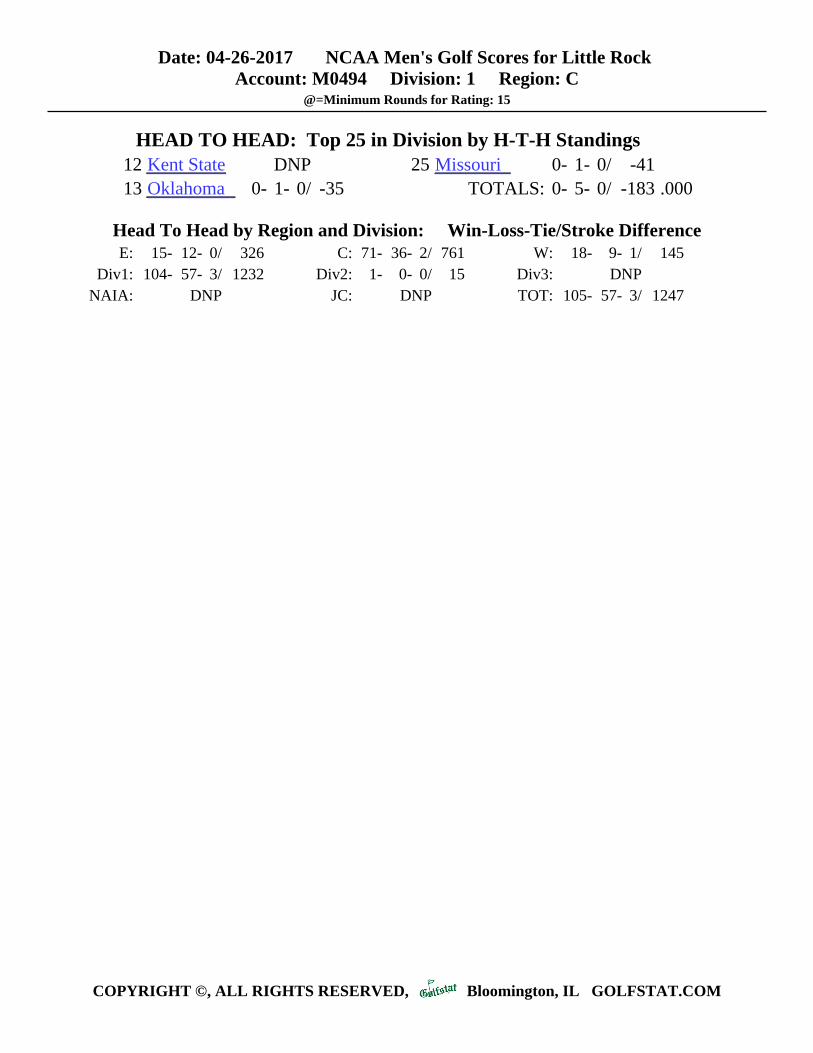
HEAD TO HEAD: Top 25 in Division by H-T-H Standings12 Kent State DNP 25 Missouri 0- 1- 0/ -4113 Oklahoma 0- 1- 0/ -35 TOTALS: 0- 5- 0/ -183 .000
Head To Head by Region and Division: Win-Loss-Tie/Stroke DifferenceE: 15- 12- 0/ 326 C: 71- 36- 2/ 761 W: 18- 9- 1/ 145
Div1: 104- 57- 3/ 1232 Div2: 1- 0- 0/ 15 Div3: DNPNAIA: DNP JC: DNP TOT: 105- 57- 3/ 1247
Date: 04-26-2017 NCAA Men's Golf Scores for Little Rock Account: M0494 Division: 1 Region: C
@=Minimum Rounds for Rating: 15
COPYRIGHT ©, ALL RIGHTS RESERVED, Bloomington, IL GOLFSTAT.COM
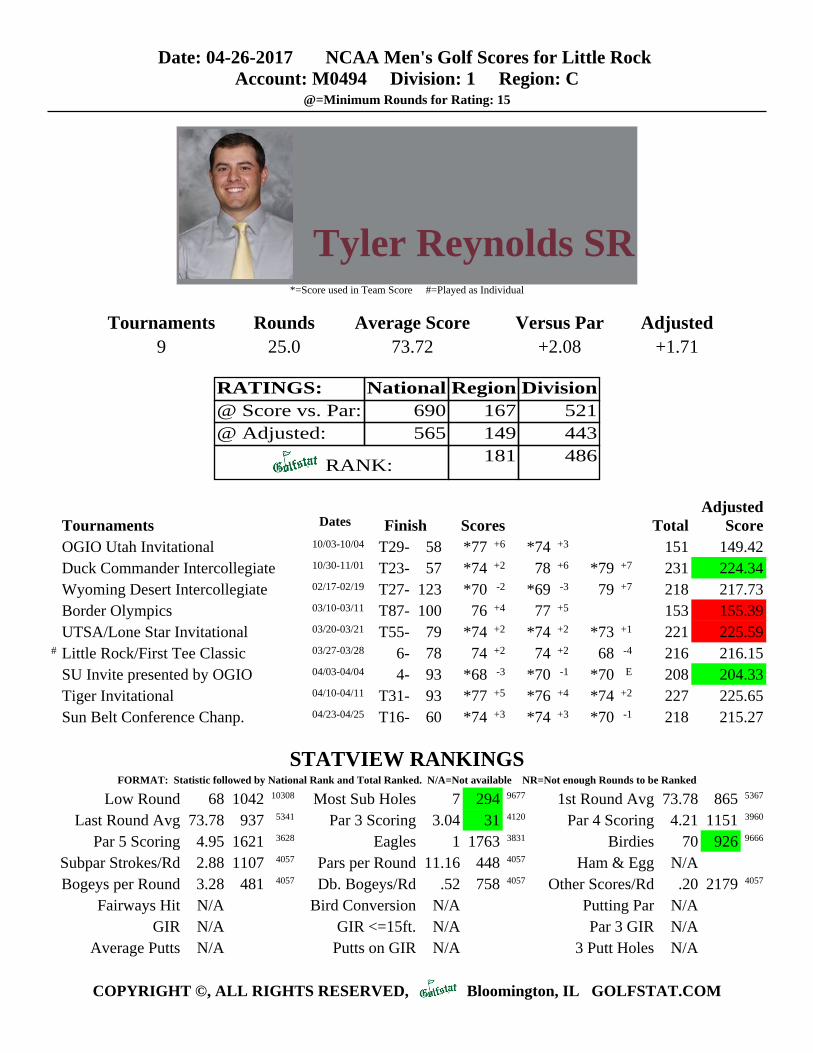
Tyler Reynolds SR*=Score used in Team Score #=Played as Individual
Tournaments Rounds Average Score Versus Par Adjusted9 25.0 73.72 +2.08 +1.71
RATINGS: National Region Division@ Score vs. Par: 690 167 521@ Adjusted: 565 149 443
RANK: 181 486
Tournaments Dates Finish Scores TotalAdjusted
ScoreOGIO Utah Invitational 10/03-10/04 T29- 58 *77 +6 *74 +3 151 149.42Duck Commander Intercollegiate 10/30-11/01 T23- 57 *74 +2 78 +6 *79 +7 231 224.34Wyoming Desert Intercollegiate 02/17-02/19 T27- 123 *70 -2 *69 -3 79 +7 218 217.73Border Olympics 03/10-03/11 T87- 100 76 +4 77 +5 153 155.39UTSA/Lone Star Invitational 03/20-03/21 T55- 79 *74 +2 *74 +2 *73 +1 221 225.59
# Little Rock/First Tee Classic 03/27-03/28 6- 78 74 +2 74 +2 68 -4 216 216.15SU Invite presented by OGIO 04/03-04/04 4- 93 *68 -3 *70 -1 *70 E 208 204.33Tiger Invitational 04/10-04/11 T31- 93 *77 +5 *76 +4 *74 +2 227 225.65Sun Belt Conference Chanp. 04/23-04/25 T16- 60 *74 +3 *74 +3 *70 -1 218 215.27
STATVIEW RANKINGSFORMAT: Statistic followed by National Rank and Total Ranked. N/A=Not available NR=Not enough Rounds to be Ranked
Low Round 68 1042 10308 Most Sub Holes 7 294 9677 1st Round Avg 73.78 865 5367
Last Round Avg 73.78 937 5341 Par 3 Scoring 3.04 31 4120 Par 4 Scoring 4.21 1151 3960
Par 5 Scoring 4.95 1621 3628 Eagles 1 1763 3831 Birdies 70 926 9666
Subpar Strokes/Rd 2.88 1107 4057 Pars per Round 11.16 448 4057 Ham & Egg N/ABogeys per Round 3.28 481 4057 Db. Bogeys/Rd .52 758 4057 Other Scores/Rd .20 2179 4057
Fairways Hit N/A Bird Conversion N/A Putting Par N/AGIR N/A GIR <=15ft. N/A Par 3 GIR N/A
Average Putts N/A Putts on GIR N/A 3 Putt Holes N/A
Date: 04-26-2017 NCAA Men's Golf Scores for Little Rock Account: M0494 Division: 1 Region: C
@=Minimum Rounds for Rating: 15
COPYRIGHT ©, ALL RIGHTS RESERVED, Bloomington, IL GOLFSTAT.COM
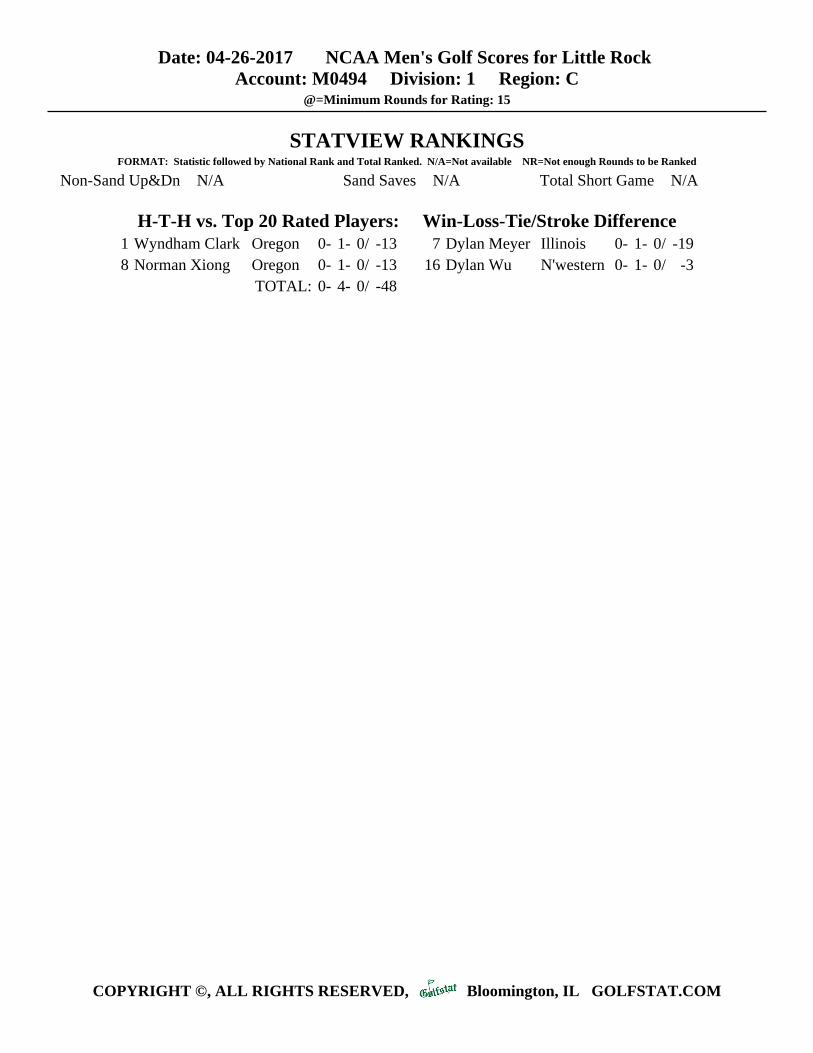
STATVIEW RANKINGSFORMAT: Statistic followed by National Rank and Total Ranked. N/A=Not available NR=Not enough Rounds to be Ranked
Non-Sand Up&Dn N/A Sand Saves N/A Total Short Game N/A
H-T-H vs. Top 20 Rated Players: Win-Loss-Tie/Stroke Difference1 Wyndham Clark Oregon 0- 1- 0/ -13 7 Dylan Meyer Illinois 0- 1- 0/ -198 Norman Xiong Oregon 0- 1- 0/ -13 16 Dylan Wu N'western 0- 1- 0/ -3
TOTAL: 0- 4- 0/ -48
Date: 04-26-2017 NCAA Men's Golf Scores for Little Rock Account: M0494 Division: 1 Region: C
@=Minimum Rounds for Rating: 15
COPYRIGHT ©, ALL RIGHTS RESERVED, Bloomington, IL GOLFSTAT.COM
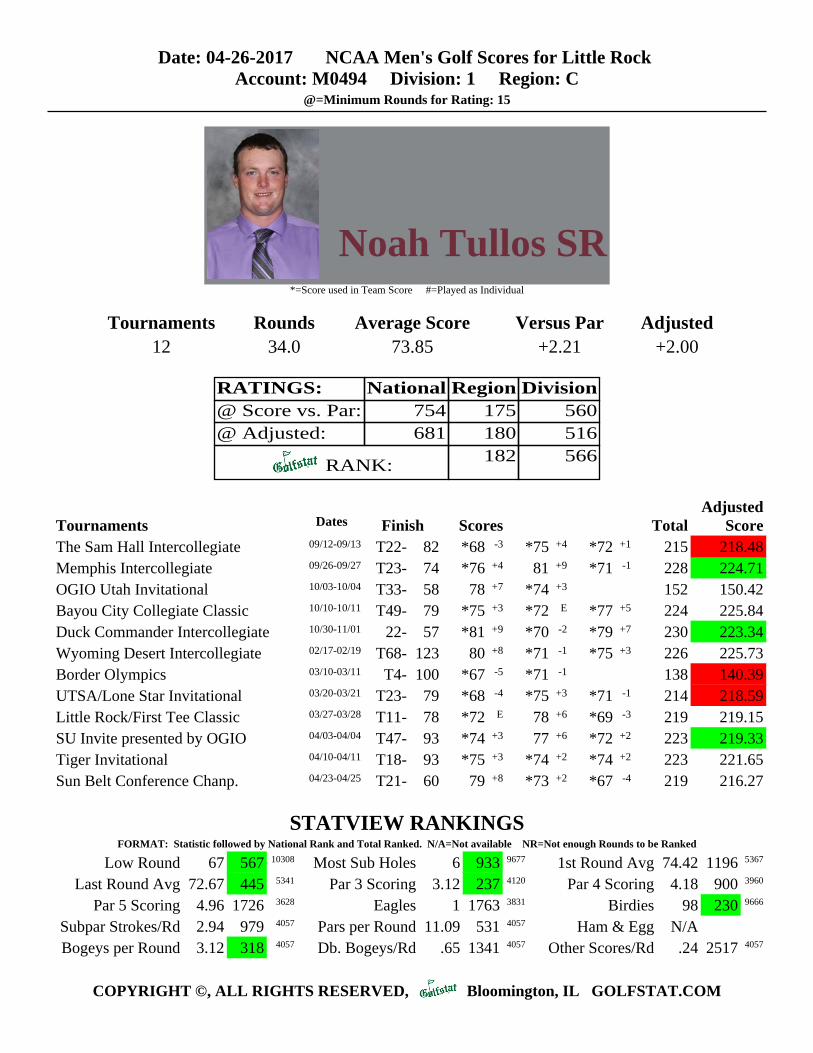
Noah Tullos SR*=Score used in Team Score #=Played as Individual
Tournaments Rounds Average Score Versus Par Adjusted12 34.0 73.85 +2.21 +2.00
RATINGS: National Region Division@ Score vs. Par: 754 175 560@ Adjusted: 681 180 516
RANK: 182 566
Tournaments Dates Finish Scores TotalAdjusted
ScoreThe Sam Hall Intercollegiate 09/12-09/13 T22- 82 *68 -3 *75 +4 *72 +1 215 218.48Memphis Intercollegiate 09/26-09/27 T23- 74 *76 +4 81 +9 *71 -1 228 224.71OGIO Utah Invitational 10/03-10/04 T33- 58 78 +7 *74 +3 152 150.42Bayou City Collegiate Classic 10/10-10/11 T49- 79 *75 +3 *72 E *77 +5 224 225.84Duck Commander Intercollegiate 10/30-11/01 22- 57 *81 +9 *70 -2 *79 +7 230 223.34Wyoming Desert Intercollegiate 02/17-02/19 T68- 123 80 +8 *71 -1 *75 +3 226 225.73Border Olympics 03/10-03/11 T4- 100 *67 -5 *71 -1 138 140.39UTSA/Lone Star Invitational 03/20-03/21 T23- 79 *68 -4 *75 +3 *71 -1 214 218.59Little Rock/First Tee Classic 03/27-03/28 T11- 78 *72 E 78 +6 *69 -3 219 219.15SU Invite presented by OGIO 04/03-04/04 T47- 93 *74 +3 77 +6 *72 +2 223 219.33Tiger Invitational 04/10-04/11 T18- 93 *75 +3 *74 +2 *74 +2 223 221.65Sun Belt Conference Chanp. 04/23-04/25 T21- 60 79 +8 *73 +2 *67 -4 219 216.27
STATVIEW RANKINGSFORMAT: Statistic followed by National Rank and Total Ranked. N/A=Not available NR=Not enough Rounds to be Ranked
Low Round 67 567 10308 Most Sub Holes 6 933 9677 1st Round Avg 74.42 1196 5367
Last Round Avg 72.67 445 5341 Par 3 Scoring 3.12 237 4120 Par 4 Scoring 4.18 900 3960
Par 5 Scoring 4.96 1726 3628 Eagles 1 1763 3831 Birdies 98 230 9666
Subpar Strokes/Rd 2.94 979 4057 Pars per Round 11.09 531 4057 Ham & Egg N/ABogeys per Round 3.12 318 4057 Db. Bogeys/Rd .65 1341 4057 Other Scores/Rd .24 2517 4057
Date: 04-26-2017 NCAA Men's Golf Scores for Little Rock Account: M0494 Division: 1 Region: C
@=Minimum Rounds for Rating: 15
COPYRIGHT ©, ALL RIGHTS RESERVED, Bloomington, IL GOLFSTAT.COM
STATVIEW RANKINGSFORMAT: Statistic followed by National Rank and Total Ranked. N/A=Not available NR=Not enough Rounds to be Ranked
Fairways Hit N/A Bird Conversion N/A Putting Par N/AGIR N/A GIR <=15ft. N/A Par 3 GIR N/A
Average Putts N/A Putts on GIR N/A 3 Putt Holes N/ANon-Sand Up&Dn N/A Sand Saves N/A Total Short Game N/A
H-T-H vs. Top 20 Rated Players: Win-Loss-Tie/Stroke Difference1 Wyndham Clark Oregon 0- 1- 0/ -21 7 Dylan Meyer Illinois 0- 1- 0/ -128 Norman Xiong Oregon 0- 1- 0/ -21 16 Dylan Wu N'western 0- 1- 0/ -18
TOTAL: 0- 4- 0/ -72
Date: 04-26-2017 NCAA Men's Golf Scores for Little Rock Account: M0494 Division: 1 Region: C
@=Minimum Rounds for Rating: 15
COPYRIGHT ©, ALL RIGHTS RESERVED, Bloomington, IL GOLFSTAT.COM
Grady Bourguignon SO*=Score used in Team Score #=Played as Individual
Tournaments Rounds Average Score Versus Par Adjusted1 3.0 79.67 +7.67 +7.72
RATINGS: National Region Division@ Score vs. Par: 0 0 0@ Adjusted: 0 0 0
RANK: NR NR
Tournaments Dates Finish Scores TotalAdjusted
Score# Little Rock/First Tee Classic 03/27-03/28 73- 78 76 +4 79 +7 84 +12 239 239.15
STATVIEW RANKINGSFORMAT: Statistic followed by National Rank and Total Ranked. N/A=Not available NR=Not enough Rounds to be Ranked
Low Round 76 6846 10308 Most Sub Holes 2 7419 9677 1st Round Avg 76.00 NRLast Round Avg 84.00 NR Par 3 Scoring 3.17 NR Par 4 Scoring 4.57 NR
Par 5 Scoring 5.33 NR Eagles N/A Birdies 5 7762 9666
Subpar Strokes/Rd 1.67 NR Pars per Round 9.33 NR Ham & Egg N/ABogeys per Round 5.00 NR Db. Bogeys/Rd 1.67 NR Other Scores/Rd .33 NR
Fairways Hit N/A Bird Conversion N/A Putting Par N/AGIR N/A GIR <=15ft. N/A Par 3 GIR N/A
Average Putts N/A Putts on GIR N/A 3 Putt Holes N/ANon-Sand Up&Dn N/A Sand Saves N/A Total Short Game N/A
Date: 04-26-2017 NCAA Men's Golf Scores for Little Rock Account: M0494 Division: 1 Region: C
@=Minimum Rounds for Rating: 15
COPYRIGHT ©, ALL RIGHTS RESERVED, Bloomington, IL GOLFSTAT.COM
Brady Edwards SR*=Score used in Team Score #=Played as Individual
Tournaments Rounds Average Score Versus Par Adjusted7 20.0 74.85 +3.10 +2.73
RATINGS: National Region Division@ Score vs. Par: 1248 289 868@ Adjusted: 1043 252 740
RANK: 258 723
Tournaments Dates Finish Scores TotalAdjusted
ScoreThe Sam Hall Intercollegiate 09/12-09/13 T28- 82 *67 -4 77 +6 *72 +1 216 219.48Memphis Intercollegiate 09/26-09/27 T10- 74 *75 +3 *72 E 77 +5 224 220.71OGIO Utah Invitational 10/03-10/04 T7- 58 *70 -1 *74 +3 144 142.42Bayou City Collegiate Classic 10/10-10/11 T71- 79 79 +7 *75 +3 78 +6 232 233.84
# Duck Commander Intercollegiate 10/30-11/01 T32- 57 78 +6 79 +7 79 +7 236 229.34# Little Rock/First Tee Classic 03/27-03/28 T9- 78 74 +2 70 -2 74 +2 218 218.15
Tiger Invitational 04/10-04/11 T31- 93 *78 +6 *76 +4 *73 +1 227 225.65
STATVIEW RANKINGSFORMAT: Statistic followed by National Rank and Total Ranked. N/A=Not available NR=Not enough Rounds to be Ranked
Low Round 67 567 10308 Most Sub Holes 6 933 9677 1st Round Avg 74.43 1198 5367
Last Round Avg 75.29 1882 5341 Par 3 Scoring 3.21 891 4120 Par 4 Scoring 4.23 1468 3960
Par 5 Scoring 4.96 1714 3628 Eagles 2 838 3831 Birdies 51 1779 9666
Subpar Strokes/Rd 2.75 1343 4057 Pars per Round 10.60 1321 4057 Ham & Egg N/ABogeys per Round 3.80 1196 4057 Db. Bogeys/Rd .80 2050 4057 Other Scores/Rd .15 1649 4057
Fairways Hit N/A Bird Conversion N/A Putting Par N/AGIR N/A GIR <=15ft. N/A Par 3 GIR N/A
Average Putts N/A Putts on GIR N/A 3 Putt Holes N/ANon-Sand Up&Dn N/A Sand Saves N/A Total Short Game N/A
Date: 04-26-2017 NCAA Men's Golf Scores for Little Rock Account: M0494 Division: 1 Region: C
@=Minimum Rounds for Rating: 15
COPYRIGHT ©, ALL RIGHTS RESERVED, Bloomington, IL GOLFSTAT.COM
George Trujillo SR*=Score used in Team Score #=Played as Individual
Tournaments Rounds Average Score Versus Par Adjusted10 28.0 74.14 +2.57 +2.48
RATINGS: National Region Division@ Score vs. Par: 936 223 684@ Adjusted: 913 227 660
RANK: 241 802
Tournaments Dates Finish Scores TotalAdjusted
ScoreThe Sam Hall Intercollegiate 09/12-09/13 T59- 82 78 +7 *72 +1 *71 E 221 224.48
# OGIO Utah Invitational 10/03-10/04 28- 58 80 +9 70 -1 150 148.42Bayou City Collegiate Classic 10/10-10/11 T16- 79 *78 +6 *68 -4 *72 E 218 219.84Duck Commander Intercollegiate 10/30-11/01 T4- 57 *71 -1 *73 +1 *77 +5 221 214.34Wyoming Desert Intercollegiate 02/17-02/19 T72- 123 *78 +6 *71 -1 *78 +6 227 226.73Border Olympics 03/10-03/11 T37- 100 *72 E *73 +1 145 147.39UTSA/Lone Star Invitational 03/20-03/21 T57- 79 *74 +2 *75 +3 *73 +1 222 226.59Little Rock/First Tee Classic 03/27-03/28 T2- 78 *72 E *67 -5 *74 +2 213 213.15SU Invite presented by OGIO 04/03-04/04 T68- 93 *76 +5 *74 +3 79 +9 229 225.33Sun Belt Conference Chanp. 04/23-04/25 T47- 60 *76 +5 *71 E 83 +12 230 227.27
STATVIEW RANKINGSFORMAT: Statistic followed by National Rank and Total Ranked. N/A=Not available NR=Not enough Rounds to be Ranked
Low Round 67 567 10308 Most Sub Holes 6 933 9677 1st Round Avg 75.50 1855 5367
Last Round Avg 75.00 1670 5341 Par 3 Scoring 3.12 235 4120 Par 4 Scoring 4.24 1513 3960
Par 5 Scoring 4.89 1268 3628 Eagles 2 838 3831 Birdies 84 485 9666
Subpar Strokes/Rd 3.14 698 4057 Pars per Round 10.46 1586 4057 Ham & Egg N/ABogeys per Round 3.54 790 4057 Db. Bogeys/Rd .71 1659 4057 Other Scores/Rd .21 2377 4057
Fairways Hit N/A Bird Conversion N/A Putting Par N/AGIR N/A GIR <=15ft. N/A Par 3 GIR N/A
Date: 04-26-2017 NCAA Men's Golf Scores for Little Rock Account: M0494 Division: 1 Region: C
@=Minimum Rounds for Rating: 15
COPYRIGHT ©, ALL RIGHTS RESERVED, Bloomington, IL GOLFSTAT.COM
STATVIEW RANKINGSFORMAT: Statistic followed by National Rank and Total Ranked. N/A=Not available NR=Not enough Rounds to be Ranked
Average Putts N/A Putts on GIR N/A 3 Putt Holes N/ANon-Sand Up&Dn N/A Sand Saves N/A Total Short Game N/A
H-T-H vs. Top 20 Rated Players: Win-Loss-Tie/Stroke Difference1 Wyndham Clark Oregon 0- 1- 0/ -22 7 Dylan Meyer Illinois 0- 1- 0/ -208 Norman Xiong Oregon 0- 1- 0/ -22 16 Dylan Wu N'western 0- 1- 0/ -24
TOTAL: 0- 4- 0/ -88
Date: 04-26-2017 NCAA Men's Golf Scores for Little Rock Account: M0494 Division: 1 Region: C
@=Minimum Rounds for Rating: 15
COPYRIGHT ©, ALL RIGHTS RESERVED, Bloomington, IL GOLFSTAT.COM
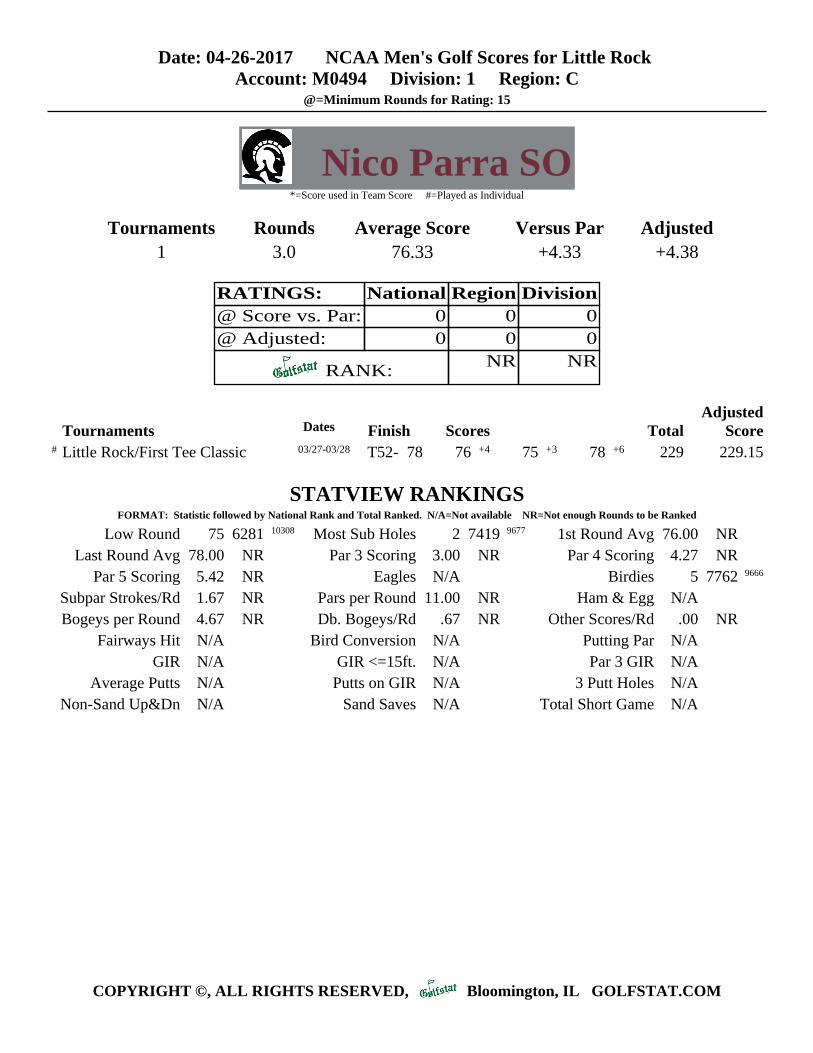
Nico Parra SO*=Score used in Team Score #=Played as Individual
Tournaments Rounds Average Score Versus Par Adjusted1 3.0 76.33 +4.33 +4.38
RATINGS: National Region Division@ Score vs. Par: 0 0 0@ Adjusted: 0 0 0
RANK: NR NR
Tournaments Dates Finish Scores TotalAdjusted
Score# Little Rock/First Tee Classic 03/27-03/28 T52- 78 76 +4 75 +3 78 +6 229 229.15
STATVIEW RANKINGSFORMAT: Statistic followed by National Rank and Total Ranked. N/A=Not available NR=Not enough Rounds to be Ranked
Low Round 75 6281 10308 Most Sub Holes 2 7419 9677 1st Round Avg 76.00 NRLast Round Avg 78.00 NR Par 3 Scoring 3.00 NR Par 4 Scoring 4.27 NR
Par 5 Scoring 5.42 NR Eagles N/A Birdies 5 7762 9666
Subpar Strokes/Rd 1.67 NR Pars per Round 11.00 NR Ham & Egg N/ABogeys per Round 4.67 NR Db. Bogeys/Rd .67 NR Other Scores/Rd .00 NR
Fairways Hit N/A Bird Conversion N/A Putting Par N/AGIR N/A GIR <=15ft. N/A Par 3 GIR N/A
Average Putts N/A Putts on GIR N/A 3 Putt Holes N/ANon-Sand Up&Dn N/A Sand Saves N/A Total Short Game N/A
Date: 04-26-2017 NCAA Men's Golf Scores for Little Rock Account: M0494 Division: 1 Region: C
@=Minimum Rounds for Rating: 15
COPYRIGHT ©, ALL RIGHTS RESERVED, Bloomington, IL GOLFSTAT.COM
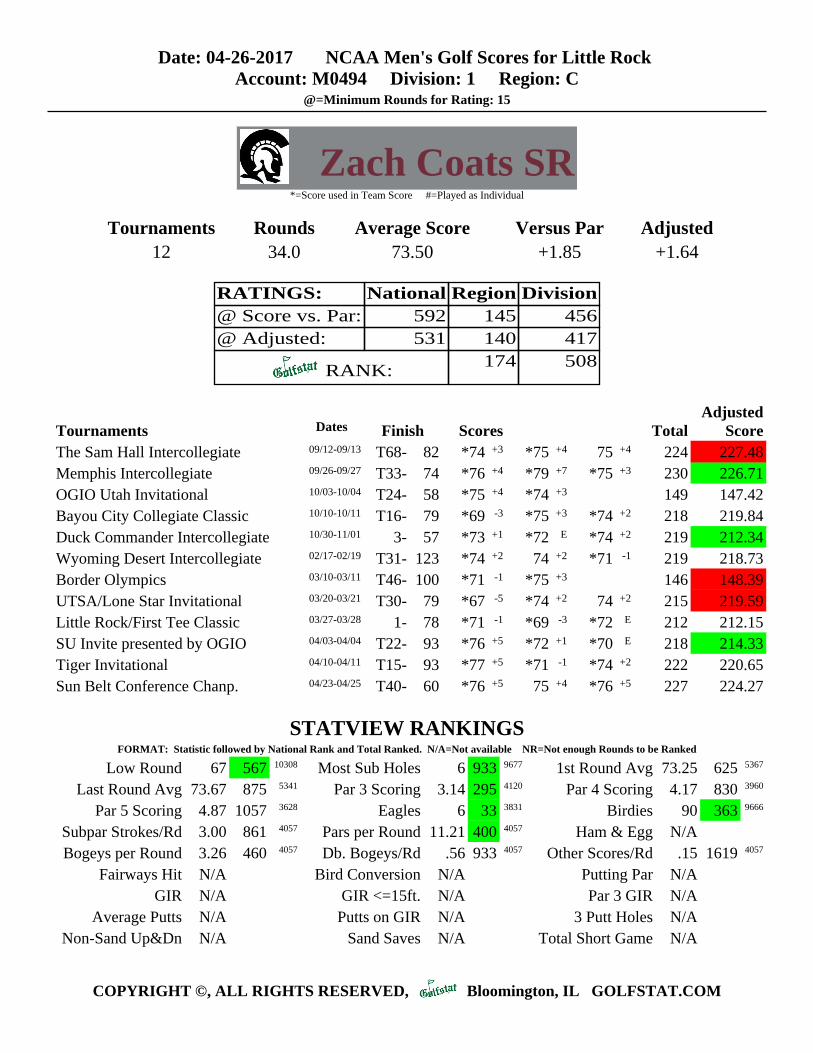
Zach Coats SR*=Score used in Team Score #=Played as Individual
Tournaments Rounds Average Score Versus Par Adjusted12 34.0 73.50 +1.85 +1.64
RATINGS: National Region Division@ Score vs. Par: 592 145 456@ Adjusted: 531 140 417
RANK: 174 508
Tournaments Dates Finish Scores TotalAdjusted
ScoreThe Sam Hall Intercollegiate 09/12-09/13 T68- 82 *74 +3 *75 +4 75 +4 224 227.48Memphis Intercollegiate 09/26-09/27 T33- 74 *76 +4 *79 +7 *75 +3 230 226.71OGIO Utah Invitational 10/03-10/04 T24- 58 *75 +4 *74 +3 149 147.42Bayou City Collegiate Classic 10/10-10/11 T16- 79 *69 -3 *75 +3 *74 +2 218 219.84Duck Commander Intercollegiate 10/30-11/01 3- 57 *73 +1 *72 E *74 +2 219 212.34Wyoming Desert Intercollegiate 02/17-02/19 T31- 123 *74 +2 74 +2 *71 -1 219 218.73Border Olympics 03/10-03/11 T46- 100 *71 -1 *75 +3 146 148.39UTSA/Lone Star Invitational 03/20-03/21 T30- 79 *67 -5 *74 +2 74 +2 215 219.59Little Rock/First Tee Classic 03/27-03/28 1- 78 *71 -1 *69 -3 *72 E 212 212.15SU Invite presented by OGIO 04/03-04/04 T22- 93 *76 +5 *72 +1 *70 E 218 214.33Tiger Invitational 04/10-04/11 T15- 93 *77 +5 *71 -1 *74 +2 222 220.65Sun Belt Conference Chanp. 04/23-04/25 T40- 60 *76 +5 75 +4 *76 +5 227 224.27
STATVIEW RANKINGSFORMAT: Statistic followed by National Rank and Total Ranked. N/A=Not available NR=Not enough Rounds to be Ranked
Low Round 67 567 10308 Most Sub Holes 6 933 9677 1st Round Avg 73.25 625 5367
Last Round Avg 73.67 875 5341 Par 3 Scoring 3.14 295 4120 Par 4 Scoring 4.17 830 3960
Par 5 Scoring 4.87 1057 3628 Eagles 6 33 3831 Birdies 90 363 9666
Subpar Strokes/Rd 3.00 861 4057 Pars per Round 11.21 400 4057 Ham & Egg N/ABogeys per Round 3.26 460 4057 Db. Bogeys/Rd .56 933 4057 Other Scores/Rd .15 1619 4057
Fairways Hit N/A Bird Conversion N/A Putting Par N/AGIR N/A GIR <=15ft. N/A Par 3 GIR N/A
Average Putts N/A Putts on GIR N/A 3 Putt Holes N/ANon-Sand Up&Dn N/A Sand Saves N/A Total Short Game N/A
Date: 04-26-2017 NCAA Men's Golf Scores for Little Rock Account: M0494 Division: 1 Region: C
@=Minimum Rounds for Rating: 15
COPYRIGHT ©, ALL RIGHTS RESERVED, Bloomington, IL GOLFSTAT.COM
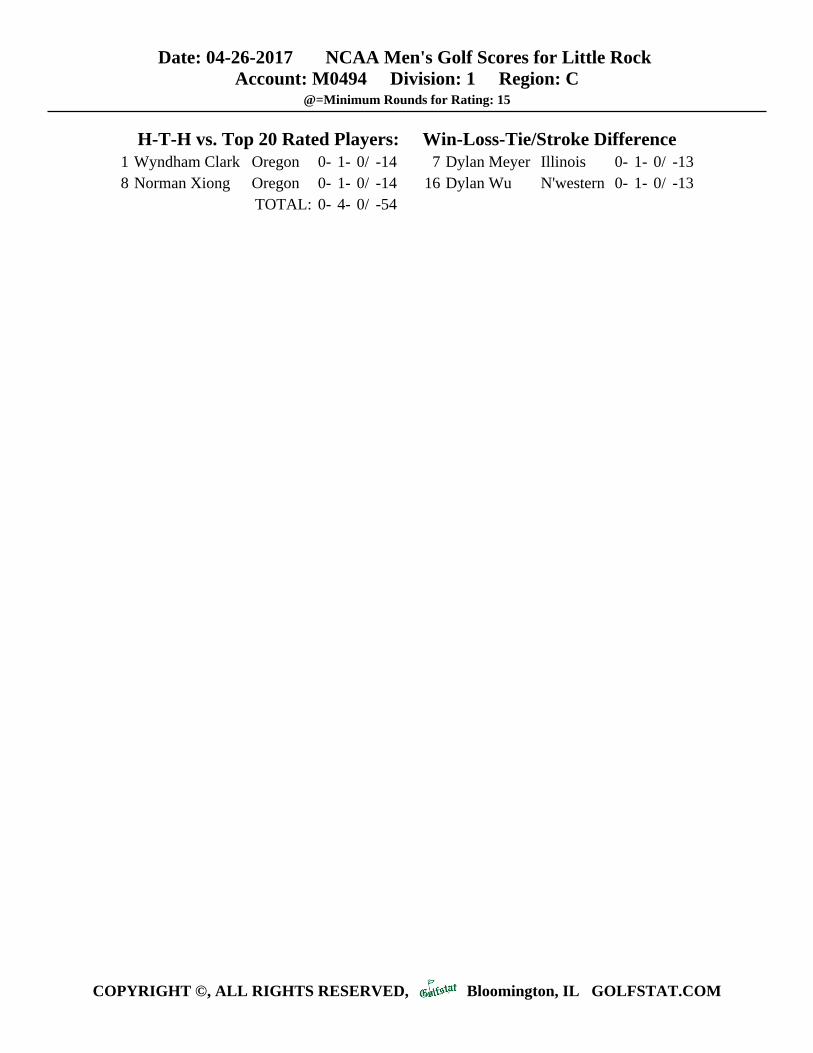
H-T-H vs. Top 20 Rated Players: Win-Loss-Tie/Stroke Difference1 Wyndham Clark Oregon 0- 1- 0/ -14 7 Dylan Meyer Illinois 0- 1- 0/ -138 Norman Xiong Oregon 0- 1- 0/ -14 16 Dylan Wu N'western 0- 1- 0/ -13
TOTAL: 0- 4- 0/ -54
Date: 04-26-2017 NCAA Men's Golf Scores for Little Rock Account: M0494 Division: 1 Region: C
@=Minimum Rounds for Rating: 15
COPYRIGHT ©, ALL RIGHTS RESERVED, Bloomington, IL GOLFSTAT.COM
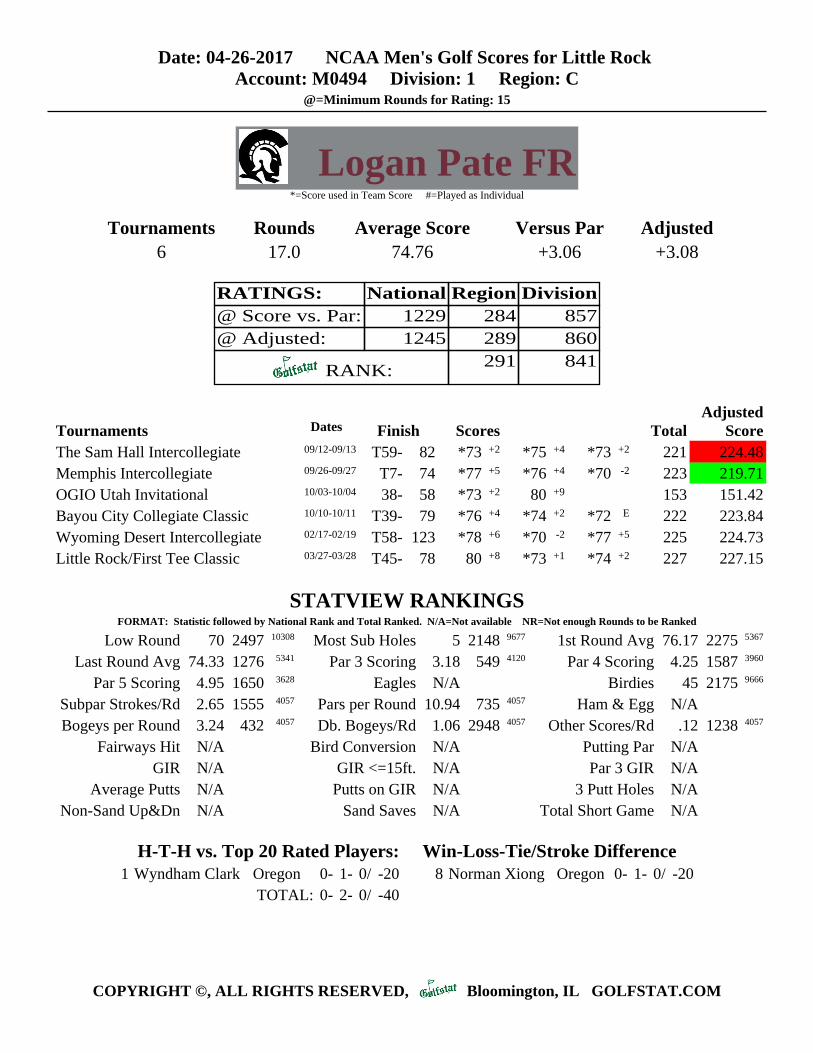
Logan Pate FR*=Score used in Team Score #=Played as Individual
Tournaments Rounds Average Score Versus Par Adjusted6 17.0 74.76 +3.06 +3.08
RATINGS: National Region Division@ Score vs. Par: 1229 284 857@ Adjusted: 1245 289 860
RANK: 291 841
Tournaments Dates Finish Scores TotalAdjusted
ScoreThe Sam Hall Intercollegiate 09/12-09/13 T59- 82 *73 +2 *75 +4 *73 +2 221 224.48Memphis Intercollegiate 09/26-09/27 T7- 74 *77 +5 *76 +4 *70 -2 223 219.71OGIO Utah Invitational 10/03-10/04 38- 58 *73 +2 80 +9 153 151.42Bayou City Collegiate Classic 10/10-10/11 T39- 79 *76 +4 *74 +2 *72 E 222 223.84Wyoming Desert Intercollegiate 02/17-02/19 T58- 123 *78 +6 *70 -2 *77 +5 225 224.73Little Rock/First Tee Classic 03/27-03/28 T45- 78 80 +8 *73 +1 *74 +2 227 227.15
STATVIEW RANKINGSFORMAT: Statistic followed by National Rank and Total Ranked. N/A=Not available NR=Not enough Rounds to be Ranked
Low Round 70 2497 10308 Most Sub Holes 5 2148 9677 1st Round Avg 76.17 2275 5367
Last Round Avg 74.33 1276 5341 Par 3 Scoring 3.18 549 4120 Par 4 Scoring 4.25 1587 3960
Par 5 Scoring 4.95 1650 3628 Eagles N/A Birdies 45 2175 9666
Subpar Strokes/Rd 2.65 1555 4057 Pars per Round 10.94 735 4057 Ham & Egg N/ABogeys per Round 3.24 432 4057 Db. Bogeys/Rd 1.06 2948 4057 Other Scores/Rd .12 1238 4057
Fairways Hit N/A Bird Conversion N/A Putting Par N/AGIR N/A GIR <=15ft. N/A Par 3 GIR N/A
Average Putts N/A Putts on GIR N/A 3 Putt Holes N/ANon-Sand Up&Dn N/A Sand Saves N/A Total Short Game N/A
H-T-H vs. Top 20 Rated Players: Win-Loss-Tie/Stroke Difference1 Wyndham Clark Oregon 0- 1- 0/ -20 8 Norman Xiong Oregon 0- 1- 0/ -20
TOTAL: 0- 2- 0/ -40
Date: 04-26-2017 NCAA Men's Golf Scores for Little Rock Account: M0494 Division: 1 Region: C
@=Minimum Rounds for Rating: 15
COPYRIGHT ©, ALL RIGHTS RESERVED, Bloomington, IL GOLFSTAT.COM
Danial Durisic FR*=Score used in Team Score #=Played as Individual
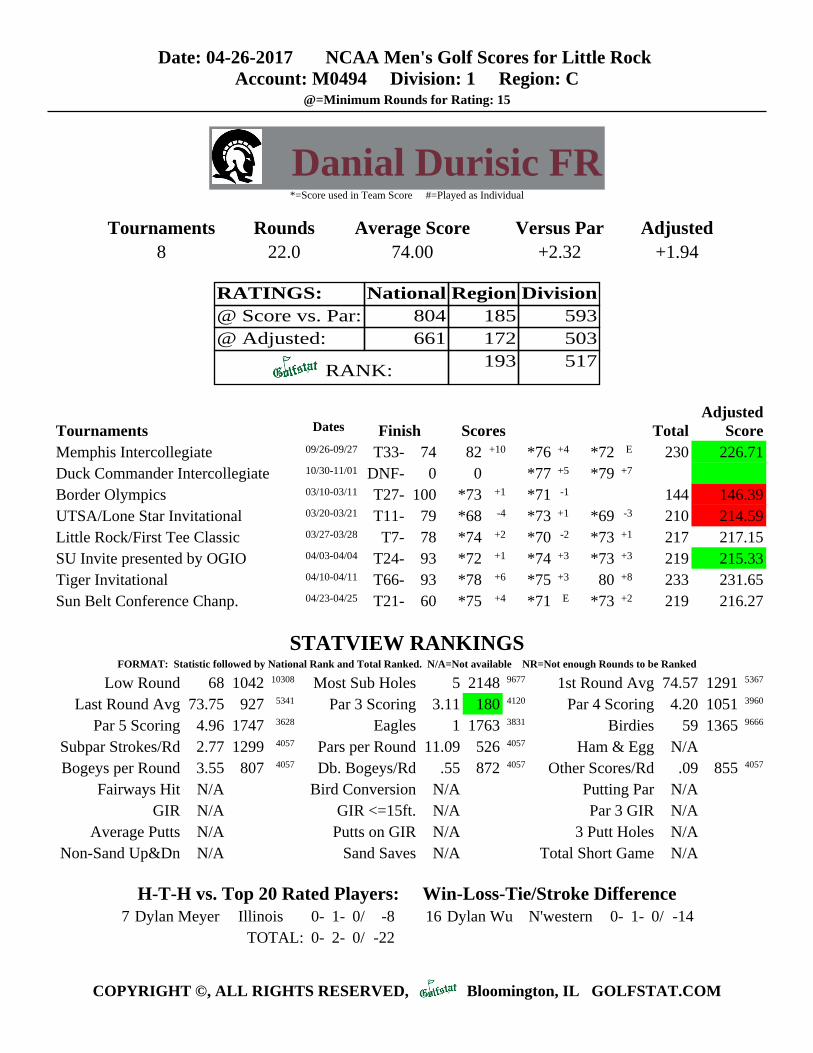
Tournaments Rounds Average Score Versus Par Adjusted8 22.0 74.00 +2.32 +1.94
RATINGS: National Region Division@ Score vs. Par: 804 185 593@ Adjusted: 661 172 503
RANK: 193 517
Tournaments Dates Finish Scores TotalAdjusted
ScoreMemphis Intercollegiate 09/26-09/27 T33- 74 82 +10 *76 +4 *72 E 230 226.71Duck Commander Intercollegiate 10/30-11/01 DNF- 0 0 *77 +5 *79 +7
Border Olympics 03/10-03/11 T27- 100 *73 +1 *71 -1 144 146.39UTSA/Lone Star Invitational 03/20-03/21 T11- 79 *68 -4 *73 +1 *69 -3 210 214.59Little Rock/First Tee Classic 03/27-03/28 T7- 78 *74 +2 *70 -2 *73 +1 217 217.15SU Invite presented by OGIO 04/03-04/04 T24- 93 *72 +1 *74 +3 *73 +3 219 215.33Tiger Invitational 04/10-04/11 T66- 93 *78 +6 *75 +3 80 +8 233 231.65Sun Belt Conference Chanp. 04/23-04/25 T21- 60 *75 +4 *71 E *73 +2 219 216.27
STATVIEW RANKINGSFORMAT: Statistic followed by National Rank and Total Ranked. N/A=Not available NR=Not enough Rounds to be Ranked
Low Round 68 1042 10308 Most Sub Holes 5 2148 9677 1st Round Avg 74.57 1291 5367
Last Round Avg 73.75 927 5341 Par 3 Scoring 3.11 180 4120 Par 4 Scoring 4.20 1051 3960
Par 5 Scoring 4.96 1747 3628 Eagles 1 1763 3831 Birdies 59 1365 9666
Subpar Strokes/Rd 2.77 1299 4057 Pars per Round 11.09 526 4057 Ham & Egg N/ABogeys per Round 3.55 807 4057 Db. Bogeys/Rd .55 872 4057 Other Scores/Rd .09 855 4057
Fairways Hit N/A Bird Conversion N/A Putting Par N/AGIR N/A GIR <=15ft. N/A Par 3 GIR N/A
Average Putts N/A Putts on GIR N/A 3 Putt Holes N/ANon-Sand Up&Dn N/A Sand Saves N/A Total Short Game N/A
H-T-H vs. Top 20 Rated Players: Win-Loss-Tie/Stroke Difference7 Dylan Meyer Illinois 0- 1- 0/ -8 16 Dylan Wu N'western 0- 1- 0/ -14
TOTAL: 0- 2- 0/ -22
Date: 04-26-2017 NCAA Men's Golf Scores for Little Rock Account: M0494 Division: 1 Region: C
@=Minimum Rounds for Rating: 15
COPYRIGHT ©, ALL RIGHTS RESERVED, Bloomington, IL GOLFSTAT.COM
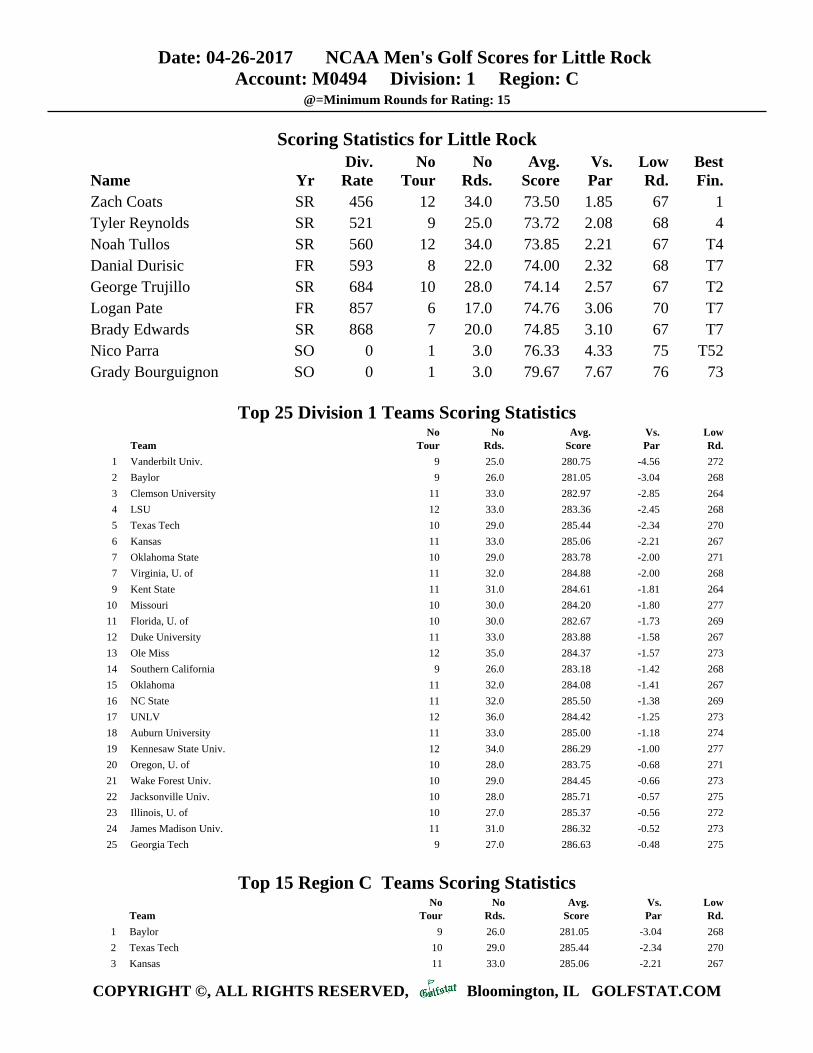
Scoring Statistics for Little Rock
Name YrDiv.Rate
NoTour
NoRds.
Avg.Score
Vs.Par
LowRd.
BestFin.
Zach Coats SR 456 12 34.0 73.50 1.85 67 1Tyler Reynolds SR 521 9 25.0 73.72 2.08 68 4Noah Tullos SR 560 12 34.0 73.85 2.21 67 T4Danial Durisic FR 593 8 22.0 74.00 2.32 68 T7George Trujillo SR 684 10 28.0 74.14 2.57 67 T2Logan Pate FR 857 6 17.0 74.76 3.06 70 T7Brady Edwards SR 868 7 20.0 74.85 3.10 67 T7Nico Parra SO 0 1 3.0 76.33 4.33 75 T52Grady Bourguignon SO 0 1 3.0 79.67 7.67 76 73
Top 25 Division 1 Teams Scoring Statistics
TeamNo
TourNo
Rds.Avg.
ScoreVs.Par
LowRd.
1 Vanderbilt Univ. 9 25.0 280.75 -4.56 272
2 Baylor 9 26.0 281.05 -3.04 268
3 Clemson University 11 33.0 282.97 -2.85 264
4 LSU 12 33.0 283.36 -2.45 268
5 Texas Tech 10 29.0 285.44 -2.34 270
6 Kansas 11 33.0 285.06 -2.21 267
7 Oklahoma State 10 29.0 283.78 -2.00 271
7 Virginia, U. of 11 32.0 284.88 -2.00 268
9 Kent State 11 31.0 284.61 -1.81 264
10 Missouri 10 30.0 284.20 -1.80 277
11 Florida, U. of 10 30.0 282.67 -1.73 269
12 Duke University 11 33.0 283.88 -1.58 267
13 Ole Miss 12 35.0 284.37 -1.57 273
14 Southern California 9 26.0 283.18 -1.42 268
15 Oklahoma 11 32.0 284.08 -1.41 267
16 NC State 11 32.0 285.50 -1.38 269
17 UNLV 12 36.0 284.42 -1.25 273
18 Auburn University 11 33.0 285.00 -1.18 274
19 Kennesaw State Univ. 12 34.0 286.29 -1.00 277
20 Oregon, U. of 10 28.0 283.75 -0.68 271
21 Wake Forest Univ. 10 29.0 284.45 -0.66 273
22 Jacksonville Univ. 10 28.0 285.71 -0.57 275
23 Illinois, U. of 10 27.0 285.37 -0.56 272
24 James Madison Univ. 11 31.0 286.32 -0.52 273
25 Georgia Tech 9 27.0 286.63 -0.48 275
Top 15 Region C Teams Scoring Statistics
TeamNo
TourNo
Rds.Avg.
ScoreVs.Par
LowRd.
1 Baylor 9 26.0 281.05 -3.04 268
2 Texas Tech 10 29.0 285.44 -2.34 270
3 Kansas 11 33.0 285.06 -2.21 267
Date: 04-26-2017 NCAA Men's Golf Scores for Little Rock Account: M0494 Division: 1 Region: C
@=Minimum Rounds for Rating: 15
COPYRIGHT ©, ALL RIGHTS RESERVED, Bloomington, IL GOLFSTAT.COM
Top 15 Region C Teams Scoring Statistics
TeamNo
TourNo
Rds.Avg.
ScoreVs.Par
LowRd.
4 Oklahoma State 10 29.0 283.78 -2.00 271
5 Kent State 11 31.0 284.61 -1.81 264
6 Missouri 10 30.0 284.20 -1.80 277
7 Oklahoma 11 32.0 284.08 -1.41 267
8 Illinois, U. of 10 27.0 285.37 -0.56 272
9 Colorado 11 31.0 286.63 +0.35 266
10 Iowa State 11 31.0 286.90 +0.58 272
11 Northwestern 9 26.0 286.88 +1.31 274
12 Texas A&M University 12 34.0 287.41 +1.53 273
13 Kentucky, U. of 10 28.0 288.71 +2.29 276
14 Purdue University 9 26.0 289.12 +2.35 277
15 Houston, Univ. of 12 34.0 287.85 +2.38 278
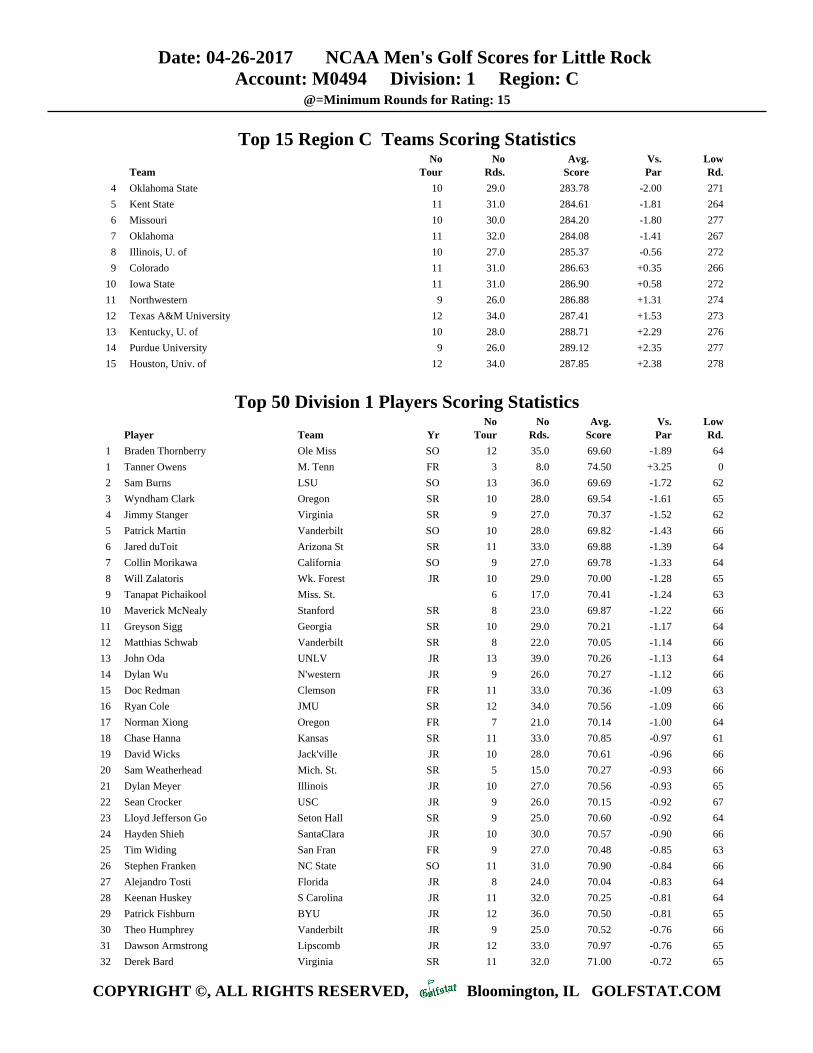
Top 50 Division 1 Players Scoring Statistics
Player Team YrNo
TourNo
Rds.Avg.
ScoreVs.Par
LowRd.
1 Braden Thornberry Ole Miss SO 12 35.0 69.60 -1.89 64
1 Tanner Owens M. Tenn FR 3 8.0 74.50 +3.25 0
2 Sam Burns LSU SO 13 36.0 69.69 -1.72 62
3 Wyndham Clark Oregon SR 10 28.0 69.54 -1.61 65
4 Jimmy Stanger Virginia SR 9 27.0 70.37 -1.52 62
5 Patrick Martin Vanderbilt SO 10 28.0 69.82 -1.43 66
6 Jared duToit Arizona St SR 11 33.0 69.88 -1.39 64
7 Collin Morikawa California SO 9 27.0 69.78 -1.33 64
8 Will Zalatoris Wk. Forest JR 10 29.0 70.00 -1.28 65
9 Tanapat Pichaikool Miss. St. 6 17.0 70.41 -1.24 63
10 Maverick McNealy Stanford SR 8 23.0 69.87 -1.22 66
11 Greyson Sigg Georgia SR 10 29.0 70.21 -1.17 64
12 Matthias Schwab Vanderbilt SR 8 22.0 70.05 -1.14 66
13 John Oda UNLV JR 13 39.0 70.26 -1.13 64
14 Dylan Wu N'western JR 9 26.0 70.27 -1.12 66
15 Doc Redman Clemson FR 11 33.0 70.36 -1.09 63
16 Ryan Cole JMU SR 12 34.0 70.56 -1.09 66
17 Norman Xiong Oregon FR 7 21.0 70.14 -1.00 64
18 Chase Hanna Kansas SR 11 33.0 70.85 -0.97 61
19 David Wicks Jack'ville JR 10 28.0 70.61 -0.96 66
20 Sam Weatherhead Mich. St. SR 5 15.0 70.27 -0.93 66
21 Dylan Meyer Illinois JR 10 27.0 70.56 -0.93 65
22 Sean Crocker USC JR 9 26.0 70.15 -0.92 67
23 Lloyd Jefferson Go Seton Hall SR 9 25.0 70.60 -0.92 64
24 Hayden Shieh SantaClara JR 10 30.0 70.57 -0.90 66
25 Tim Widing San Fran FR 9 27.0 70.48 -0.85 63
26 Stephen Franken NC State SO 11 31.0 70.90 -0.84 66
27 Alejandro Tosti Florida JR 8 24.0 70.04 -0.83 64
28 Keenan Huskey S Carolina JR 11 32.0 70.25 -0.81 64
29 Patrick Fishburn BYU JR 12 36.0 70.50 -0.81 65
30 Theo Humphrey Vanderbilt JR 9 25.0 70.52 -0.76 66
31 Dawson Armstrong Lipscomb JR 12 33.0 70.97 -0.76 65
32 Derek Bard Virginia SR 11 32.0 71.00 -0.72 65
Date: 04-26-2017 NCAA Men's Golf Scores for Little Rock Account: M0494 Division: 1 Region: C
@=Minimum Rounds for Rating: 15
COPYRIGHT ©, ALL RIGHTS RESERVED, Bloomington, IL GOLFSTAT.COM
Top 50 Division 1 Players Scoring Statistics
Player Team YrNo
TourNo
Rds.Avg.
ScoreVs.Par
LowRd.
33 Chandler Phillips Texas A&M SO 12 34.0 70.76 -0.71 66
34 Trace Crowe Auburn SO 9 27.0 70.96 -0.70 66
35 Fidel Concepcion So. Utah JR 10 28.0 71.00 -0.61 67
36 Carson Young Clemson SR 11 33.0 70.85 -0.61 67
37 Frederik Dreier UTEP SR 11 32.0 70.84 -0.59 64
38 Bryson Nimmer Clemson SO 11 33.0 70.94 -0.52 65
39 Broc Everett Augusta SO 10 30.0 70.93 -0.47 65
40 Hunter Richardson UT Martin SO 11 33.0 71.18 -0.45 68
41 Hannes Ronneblad Texas Tech SR 10 29.0 71.45 -0.45 65
42 Kyle Mueller Michigan JR 10 27.0 71.04 -0.44 66
43 Aaron Beverly Sac State SR 8 23.0 70.91 -0.43 66
44 Luis Gagne LSU SO 13 36.0 71.03 -0.39 65
45 Braden Bailey Baylor SO 9 26.0 70.58 -0.38 66
45 Nick Voke Iowa State SR 9 26.0 71.12 -0.38 65
47 Shintaro Ban UNLV JR 12 36.0 71.06 -0.36 62
48 Mark Lawrence Va. Tech SO 11 29.0 71.34 -0.34 66
48 Patrick Cover UNCW JR 10 29.0 71.34 -0.34 65
50 Ben Wolcott Ole Miss SR 12 35.0 71.14 -0.34 67
Top 30 Region C Players Scoring Statistics
Player Team YrNo
TourNo
Rds.Avg.
ScoreVs.Par
LowRd.
1 Dylan Wu N'western JR 9 26.0 70.27 -1.12 66
2 Chase Hanna Kansas SR 11 33.0 70.85 -0.97 61
3 Sam Weatherhead Mich. St. SR 5 15.0 70.27 -0.93 66
4 Dylan Meyer Illinois JR 10 27.0 70.56 -0.93 65
5 Chandler Phillips Texas A&M SO 12 34.0 70.76 -0.71 66
6 Hannes Ronneblad Texas Tech SR 10 29.0 71.45 -0.45 65
7 Kyle Mueller Michigan JR 10 27.0 71.04 -0.44 66
8 Braden Bailey Baylor SO 9 26.0 70.58 -0.38 66
8 Nick Voke Iowa State SR 9 26.0 71.12 -0.38 65
10 Grant Hirschman Oklahoma JR 11 32.0 71.06 -0.28 66
11 Kristoffer Ventura Okla. St. JR 10 29.0 71.21 -0.28 67
12 Ian Holt Kent State JR 11 31.0 71.39 -0.23 65
13 Doug Ghim Texas JR 11 29.0 70.90 -0.21 65
14 Fredrik Nilehn Texas Tech JR 9 26.0 71.69 -0.19 66
15 Hayden Buckley Missouri JR 8 24.0 71.21 -0.17 66
16 Josh Whalen Kent State SR 11 31.0 71.45 -0.16 64
17 Max McGreevy Oklahoma SR 12 35.0 71.17 -0.14 63
18 Linus Lilliedahl Missouri SR 10 30.0 71.37 -0.13 67
19 Austin Squires Cincinnati SO 12 35.0 71.71 -0.11 68
20 Cooper Dossey Baylor FR 9 26.0 70.88 -0.08 66
21 Ivan Ramirez Texas Tech SO 10 29.0 71.83 -0.07 67
22 Euan Walker Missouri SR 10 30.0 71.43 -0.07 67
23 Nick Hardy Illinois JR 10 27.0 71.44 -0.04 66
24 Cameron Champ Texas A&M SO 11 31.0 71.39 -0.03 65
25 Rory Franssen Missouri FR 9 27.0 71.44 +0.00 68
26 Ruben Sondjaja Iowa State SR 11 31.0 71.61 +0.03 66
27 Daniel Sutton Kansas JR 10 30.0 71.87 +0.07 66
Date: 04-26-2017 NCAA Men's Golf Scores for Little Rock Account: M0494 Division: 1 Region: C
@=Minimum Rounds for Rating: 15
COPYRIGHT ©, ALL RIGHTS RESERVED, Bloomington, IL GOLFSTAT.COM
Top 30 Region C Players Scoring Statistics
Player Team YrNo
TourNo
Rds.Avg.
ScoreVs.Par
LowRd.
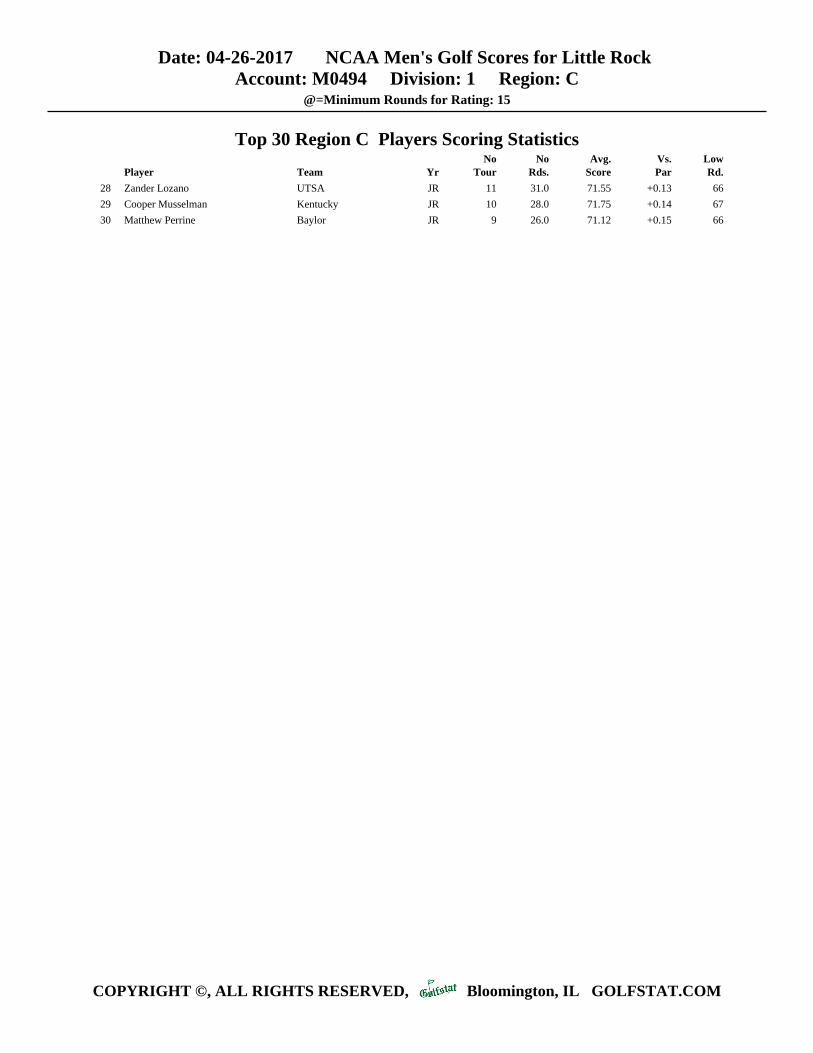
28 Zander Lozano UTSA JR 11 31.0 71.55 +0.13 66
29 Cooper Musselman Kentucky JR 10 28.0 71.75 +0.14 67
30 Matthew Perrine Baylor JR 9 26.0 71.12 +0.15 66


![SMD MPI29-JAN-2019...2019/01/29 · 5.88 5.88 TOP 10 GAINERS BLUE DIAMONDS [X] EDEN HOTEL LANKA KELSEY ARPICO GUARDIAN CAPITAL KANDY HOTELS RESUS ENERGY MULTI FINANCE ACME SEYLAN](https://img.pdfslide.us/doc/110x75/602384d561b1c147741e742e/smd-mpi29-jan-2019-20190129-588-588-top-10-gainers-blue-diamonds-x.jpg)