Embed Size (px)
Citation preview
Height and Industrialisation in a City in Catalonia during the Nineteenth Century Ramon Ramon-Muñoz Josep-Maria Ramon-Muñoz
Col.lecció d’Economia E15/334
UB Economics Working Papers 2015/334
Height and Industrialisation in a City in Catalonia during the Nineteenth Century
Abstract: Drawing on anthropometric information, this article investigates the evolution of the biological standard of living in nineteenth-century Catalonia. We focus on the city of Igualada, one of Catalonia’s main textile centres in the early part of the century. The results show a decline in the height of males born between the 1830s and the 1860s, the period in which factory-based industrialisation emerged and became consolidated. The article also suggests that height inequality rose during the third quarter of the nineteenth century. The empirical evidence gathered provides further support for the pessimistic view of the evolution of the standard of living during the early stages of industrialisation.
JEL Codes: I12, I14, I31, N33, N63. Keywords: Biological Standard of Living, Inequality, Industry, Urbanization, Southern Europe.
Ramon Ramon-Muñoz Universitat de Barcelona Josep-Maria Ramon-Muñoz Universidad de Murcia
Acknowledgements: Previous versions of this paper were presented at Iberometrics VI – Sixth Iberian Cliometrics Workshop (Zaragoza, 2013), the X Congreso de la Asociación de Demografía Histórica (Albacete, 2013), the Launching Conference of the European Society of Historical Demography (Alghero, 2014), the Seminars of the Department of Economic History and Institutions at the University of Barcelona (Barcelona, 2014) and the 17th World Economic History Congress (Kyoto, 2015). We are very grateful to the participants at these meetings for their comments. We also thank to Joerg Baten, Josep Maria Benaul, Máximo Camacho, Antonio-David Cámara, Jordi Catalan, Sergio Espuelas, Rui Esteves, Joan Gil, Miquel Gutiérrez, Alfonso Herranz, Nikola Koepke, José-Miguel Martínez-Carrión, Stefan Öberg, Nuno Palma, Pere Pascual, Vicente Pinilla, Diego Ramiro and Francesc Valls for their help and careful reading of earlier versions of this paper. Finally, we acknowledge funding support from the Ministry of Economy and Competitiveness (MINECO) through the projects HAR2012-33298, and HAR2013-47182-C2-2-P, and from the Fundación Séneca. Agencia de Ciencia y Tecnología de la Región de Murcia through the project 19512/PI/14. The usual disclaimer applies.
ISSN 1136-8365
3
1. Introduction
For a region on the European periphery, Catalonia underwent industrialisation unusually early1. In the late eighteenth century it was already home to a flourishing cotton industry, and by the 1830s factory-based industrialisation had begun2. By the end of the 1890s, Catalonia had become “Spain’s factory”3, and in 1910, it had the highest Gross Domestic Product per capita of all the Spanish communities4. The origins and the development of Catalan industrialisation are well known5, but much less attention has been paid to the evolution of living standards during this period. In fact, it is difficult to form a clear picture because the quantitative evidence available is still fragmentary and scarce. Industrial real wages seem to have stagnated between the 1790s and the 1810s, but started to rise after the late 1860s6. This might be taken as a reflection of an improvement in living standards during the last third of the century, an interpretation also supported by anthropometric information7. However, demographic evidence for certain Catalan localities indicates that this improvement may have started earlier8.
Whether, when and to what extent the expected productivity gains associated with industrialisation translated into better living standards are not minor issues. In fact, the evolution of the standard of living during early industrialisation has become an important topic in economic history, particularly in the British context. It has also raised considerable controversy: pessimistic views of working-class conditions during the Industrial Revolution have been challenged by more optimistic approaches, and vice versa. After decades of debate, there is now widespread agreement among scholars that working-class conditions improved between the mid-nineteenth century and the outbreak of World War I. This consensus is, however, less clear when the analysis centres on the decades prior to 1850, when the more recent research findings have tended to support the pessimistic view9.
Not surprisingly, the empirical base of this debate has relied on the use of a large number of variables. The concept of living standards is very broad and difficult to define: no single indicator is able to cover it comprehensively. Scholars have made extensive use of real wages, but they have also analysed demographic and anthropometric information10. Regarding to the anthropometric information,
1 Pollard (1981). 2 Nadal (1975); Sánchez (1989). 3 Nadal (1985). 4 Rosés, Martínez-Galarraga & Tirado (2010). 5 See, among others, Vilar (1964); Nadal (1975); Torras (1988); Thomson (1992); Sánchez (2000); Valls-Junyent (2004). 6 Mora (2007); Camps (1995). 7 Ramon-Muñoz, J.M. (2011). 8 Nadal (1992); Muñoz Pradas (1992). 9 Escudero (2002); Voth (2004). 10 See, among others, Huck (1994, 1995); Szreter & Mooney (1998); Floud, Wachter & Gregory (1990); Komlos (1993a); Cinnirella (2008a).
4
height is a reliable indicator of the net cumulative nutritional status of individuals and societies, and is generally associated with the concept of biological standard of living11. In particular, individuals’ physical stature reflects the relation between the nutritional intake and the demands made on the body during childhood and adolescence. These demands come from three main sources: the basal metabolism, that is, the energy necessary to keep the body alive and functioning; the impact of disease and epidemics, which negatively affect height; finally, workload and the energy expended on working. Of course, there is an important genetic component in the final stature of an individual, but environmental and economic factors appear to be more important when the average height is compared across regions and social groups and over time12.
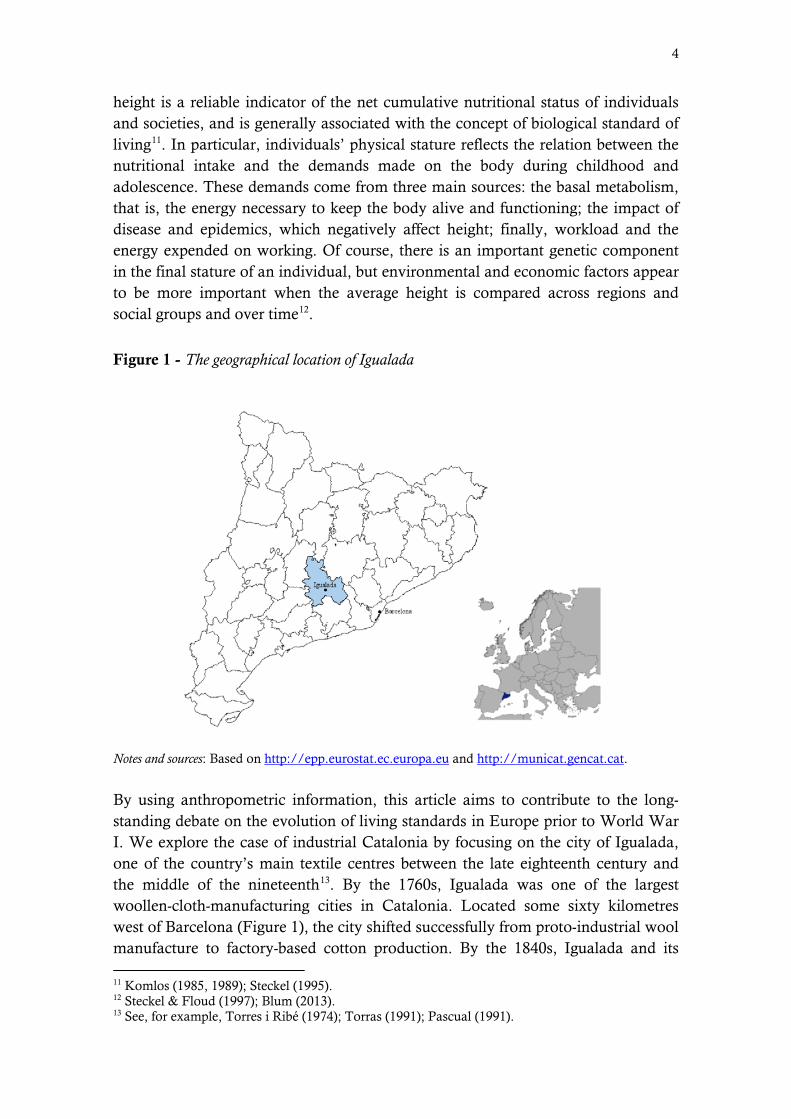
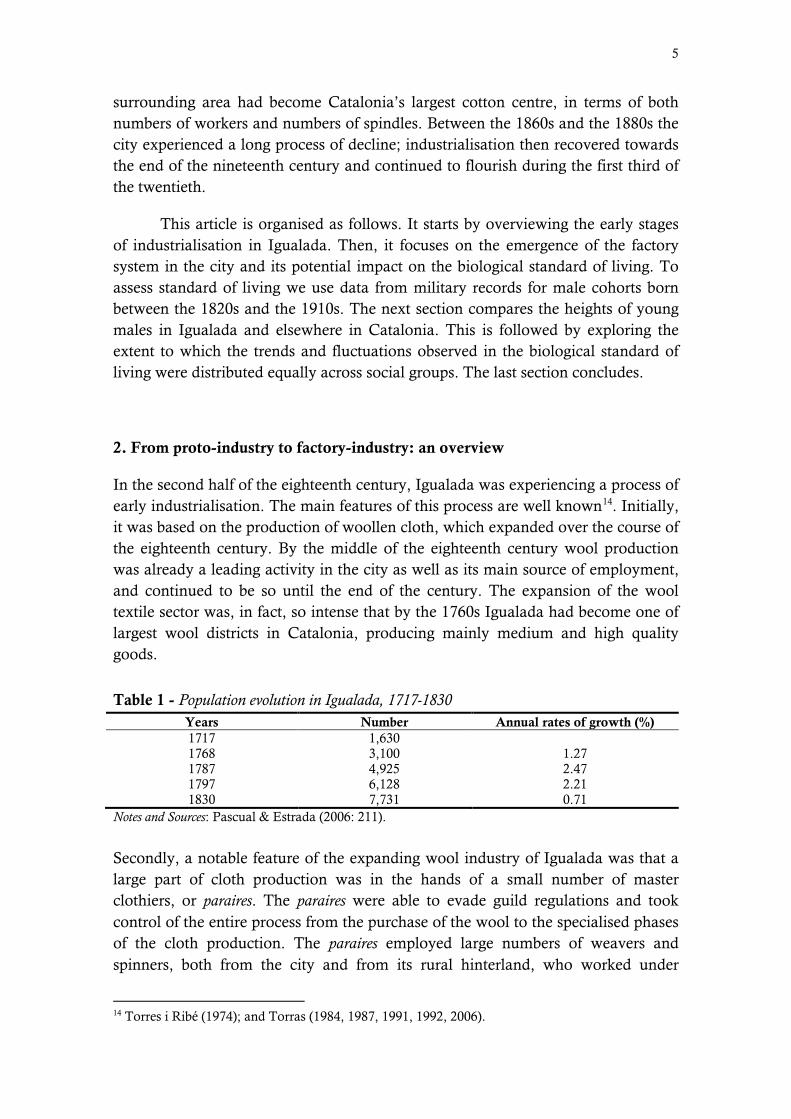
Figure 1 - The geographical location of Igualada
Notes and sources: Based on http://epp.eurostat.ec.europa.eu and http://municat.gencat.cat.
By using anthropometric information, this article aims to contribute to the long-standing debate on the evolution of living standards in Europe prior to World War I. We explore the case of industrial Catalonia by focusing on the city of Igualada, one of the country’s main textile centres between the late eighteenth century and the middle of the nineteenth13. By the 1760s, Igualada was one of the largest woollen-cloth-manufacturing cities in Catalonia. Located some sixty kilometres west of Barcelona (Figure 1), the city shifted successfully from proto-industrial wool manufacture to factory-based cotton production. By the 1840s, Igualada and its 11 Komlos (1985, 1989); Steckel (1995). 12 Steckel & Floud (1997); Blum (2013). 13 See, for example, Torres i Ribé (1974); Torras (1991); Pascual (1991).
5
surrounding area had become Catalonia’s largest cotton centre, in terms of both numbers of workers and numbers of spindles. Between the 1860s and the 1880s the city experienced a long process of decline; industrialisation then recovered towards the end of the nineteenth century and continued to flourish during the first third of the twentieth.
This article is organised as follows. It starts by overviewing the early stages of industrialisation in Igualada. Then, it focuses on the emergence of the factory system in the city and its potential impact on the biological standard of living. To assess standard of living we use data from military records for male cohorts born between the 1820s and the 1910s. The next section compares the heights of young males in Igualada and elsewhere in Catalonia. This is followed by exploring the extent to which the trends and fluctuations observed in the biological standard of living were distributed equally across social groups. The last section concludes.
2. From proto-industry to factory-industry: an overview
In the second half of the eighteenth century, Igualada was experiencing a process of early industrialisation. The main features of this process are well known14. Initially, it was based on the production of woollen cloth, which expanded over the course of the eighteenth century. By the middle of the eighteenth century wool production was already a leading activity in the city as well as its main source of employment, and continued to be so until the end of the century. The expansion of the wool textile sector was, in fact, so intense that by the 1760s Igualada had become one of largest wool districts in Catalonia, producing mainly medium and high quality goods.
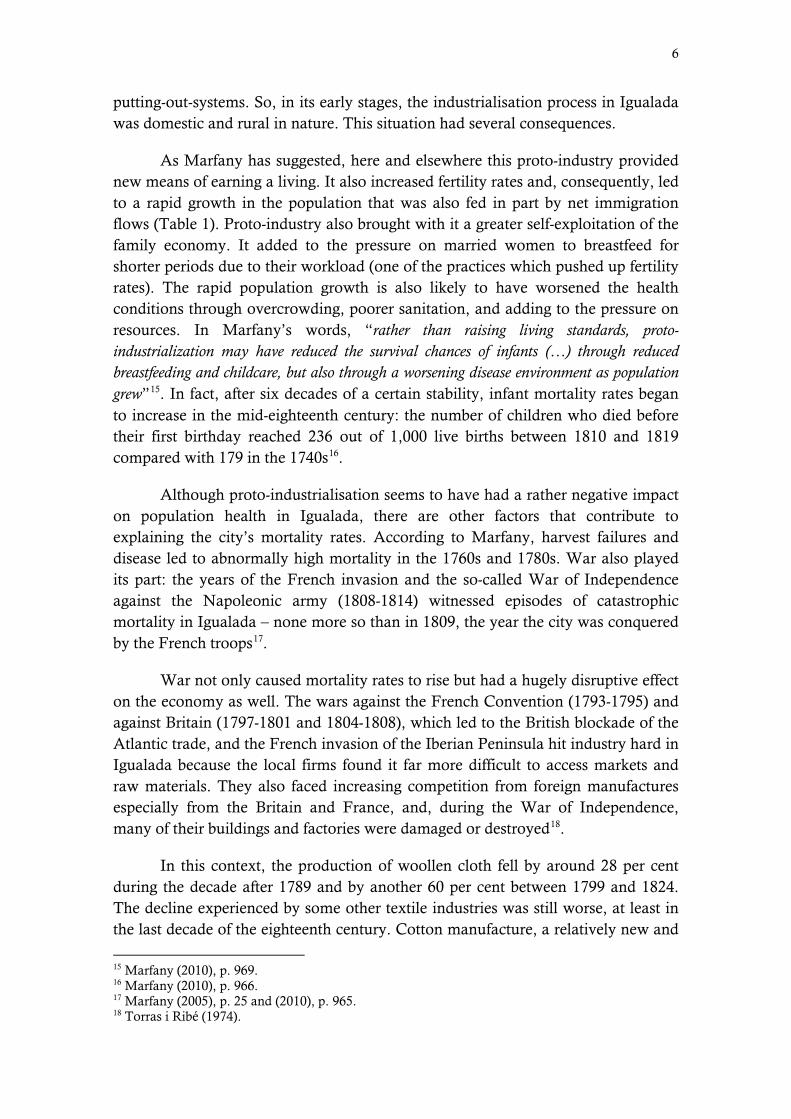
Table 1 - Population evolution in Igualada, 1717-1830 Years Number Annual rates of growth (%) 1717 1,630 1768 3,100 1.27 1787 4,925 2.47 1797 6,128 2.21 1830 7,731 0.71
Notes and Sources: Pascual & Estrada (2006: 211).
Secondly, a notable feature of the expanding wool industry of Igualada was that a large part of cloth production was in the hands of a small number of master clothiers, or paraires. The paraires were able to evade guild regulations and took control of the entire process from the purchase of the wool to the specialised phases of the cloth production. The paraires employed large numbers of weavers and spinners, both from the city and from its rural hinterland, who worked under
14 Torres i Ribé (1974); and Torras (1984, 1987, 1991, 1992, 2006).
6
putting-out-systems. So, in its early stages, the industrialisation process in Igualada was domestic and rural in nature. This situation had several consequences.
As Marfany has suggested, here and elsewhere this proto-industry provided new means of earning a living. It also increased fertility rates and, consequently, led to a rapid growth in the population that was also fed in part by net immigration flows (Table 1). Proto-industry also brought with it a greater self-exploitation of the family economy. It added to the pressure on married women to breastfeed for shorter periods due to their workload (one of the practices which pushed up fertility rates). The rapid population growth is also likely to have worsened the health conditions through overcrowding, poorer sanitation, and adding to the pressure on resources. In Marfany’s words, “rather than raising living standards, proto-industrialization may have reduced the survival chances of infants (…) through reduced breastfeeding and childcare, but also through a worsening disease environment as population grew”15. In fact, after six decades of a certain stability, infant mortality rates began to increase in the mid-eighteenth century: the number of children who died before their first birthday reached 236 out of 1,000 live births between 1810 and 1819 compared with 179 in the 1740s16.
Although proto-industrialisation seems to have had a rather negative impact on population health in Igualada, there are other factors that contribute to explaining the city’s mortality rates. According to Marfany, harvest failures and disease led to abnormally high mortality in the 1760s and 1780s. War also played its part: the years of the French invasion and the so-called War of Independence against the Napoleonic army (1808-1814) witnessed episodes of catastrophic mortality in Igualada – none more so than in 1809, the year the city was conquered by the French troops17.
War not only caused mortality rates to rise but had a hugely disruptive effect on the economy as well. The wars against the French Convention (1793-1795) and against Britain (1797-1801 and 1804-1808), which led to the British blockade of the Atlantic trade, and the French invasion of the Iberian Peninsula hit industry hard in Igualada because the local firms found it far more difficult to access markets and raw materials. They also faced increasing competition from foreign manufactures especially from the Britain and France, and, during the War of Independence, many of their buildings and factories were damaged or destroyed18.
In this context, the production of woollen cloth fell by around 28 per cent during the decade after 1789 and by another 60 per cent between 1799 and 1824. The decline experienced by some other textile industries was still worse, at least in the last decade of the eighteenth century. Cotton manufacture, a relatively new and
15 Marfany (2010), p. 969. 16 Marfany (2010), p. 966. 17 Marfany (2005), p. 25 and (2010), p. 965. 18 Torras i Ribé (1974).
7
still modest activity in the city, fell by 75 per cent from 1789 to 1799. However, while wool production was unable to recover from the difficulties caused by wars, the cotton industry slowly clawed its way to success19. In the 1820s Igualada had more than 150 manufacturers of yarn and cotton fabrics, but only 20 producers of woollen cloths; by the 1840s, only two wool factories remained. The cotton industry employed at least 2,000 workers and had already emerged as the leading sector in the city’s economy. Igualada had established itself as Catalonia’s leading cotton centre: by 1841, it ranked second in terms of capital invested and value of production, and first in terms of the number of workers employed and spindles in use20.
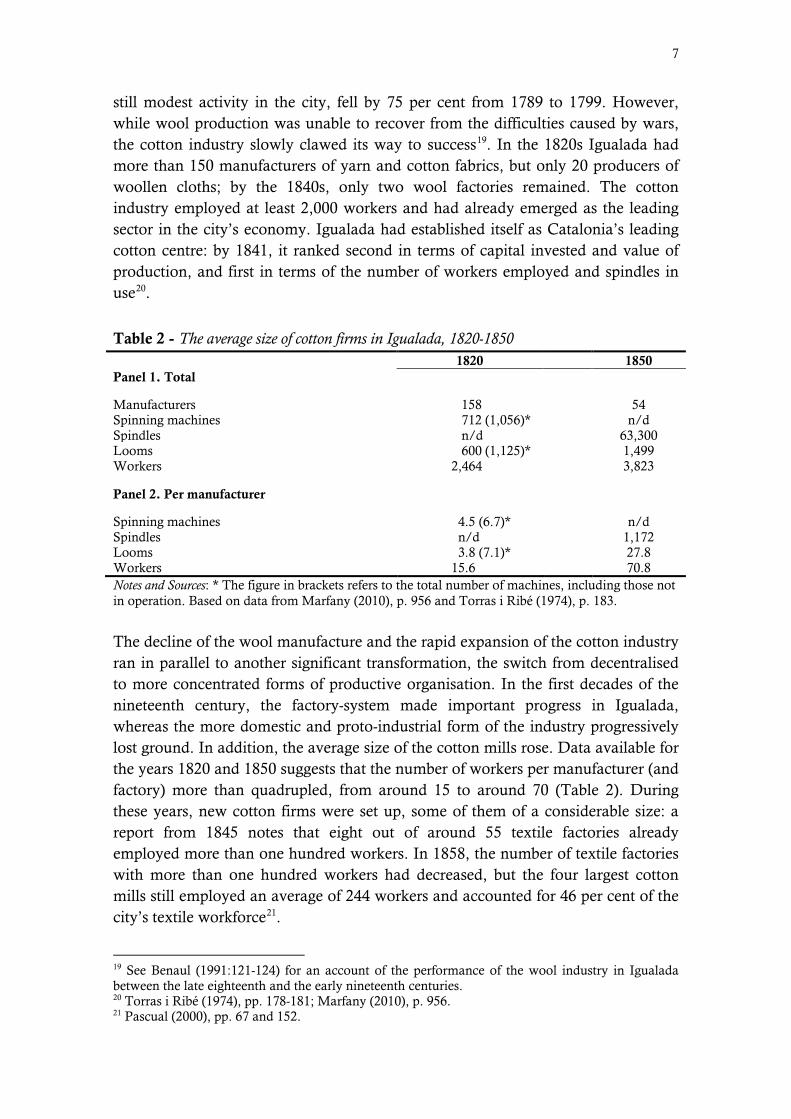
Table 2 - The average size of cotton firms in Igualada, 1820-1850 1820 1850
Panel 1. Total
Manufacturers 158 54 Spinning machines 712 (1,056)* n/d Spindles n/d 63,300 Looms 600 (1,125)* 1,499 Workers 2,464 3,823
Panel 2. Per manufacturer
Spinning machines 4.5 (6.7)* n/d Spindles n/d 1,172 Looms 3.8 (7.1)* 27.8 Workers 15.6 70.8 Notes and Sources: * The figure in brackets refers to the total number of machines, including those not in operation. Based on data from Marfany (2010), p. 956 and Torras i Ribé (1974), p. 183.
The decline of the wool manufacture and the rapid expansion of the cotton industry ran in parallel to another significant transformation, the switch from decentralised to more concentrated forms of productive organisation. In the first decades of the nineteenth century, the factory-system made important progress in Igualada, whereas the more domestic and proto-industrial form of the industry progressively lost ground. In addition, the average size of the cotton mills rose. Data available for the years 1820 and 1850 suggests that the number of workers per manufacturer (and factory) more than quadrupled, from around 15 to around 70 (Table 2). During these years, new cotton firms were set up, some of them of a considerable size: a report from 1845 notes that eight out of around 55 textile factories already employed more than one hundred workers. In 1858, the number of textile factories with more than one hundred workers had decreased, but the four largest cotton mills still employed an average of 244 workers and accounted for 46 per cent of the city’s textile workforce21.
19 See Benaul (1991:121-124) for an account of the performance of the wool industry in Igualada between the late eighteenth and the early nineteenth centuries. 20 Torras i Ribé (1974), pp. 178-181; Marfany (2010), p. 956. 21 Pascual (2000), pp. 67 and 152.
8
3. The emergence of the factory system and its impact on height, 1824-1914: evidence and hypotheses
Did the transition towards the factory-system and its consolidation impact the standard of living of the population? Fragmentary as it still is, the existing information on infant mortality for the eighteenth and nineteenth centuries offers a rather pessimistic view of the evolution of living standards in the early phases of industrialisation in Igualada22. New evidence based on height data for the period when the factory system was emerging points in the same direction. These height data refer to the cohorts born between 1824 and 1914 and have been compiled from the local lists of recruitment for military service, known as the Acts of Classification and Declaration of Soldiers (Table 3 and Figure 2). The original height data used in this article are not affected by truncation, which is one of the potential shortcomings of military samples23. Nevertheless, they have other shortcomings that might affect the homogeneity of the series, although we have tried to solve them as far as possible.
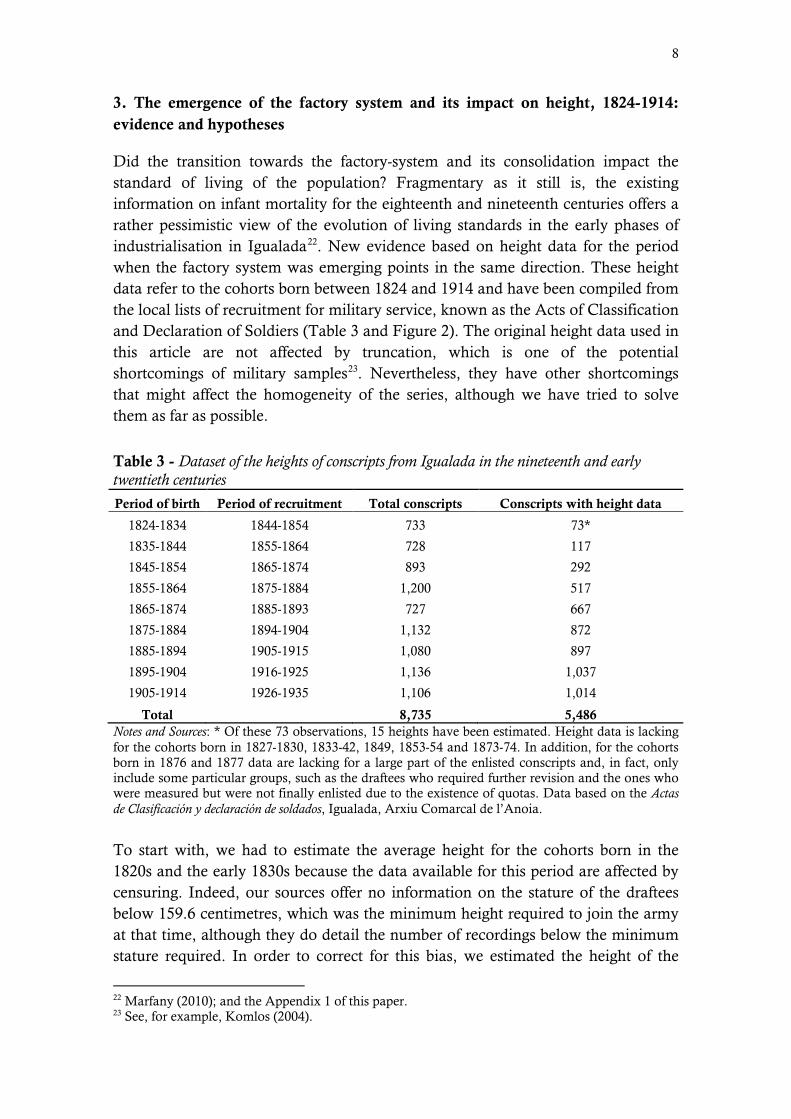
Table 3 - Dataset of the heights of conscripts from Igualada in the nineteenth and early twentieth centuries
Period of birth Period of recruitment Total conscripts Conscripts with height data
1824-1834 1844-1854 733 73*
1835-1844 1855-1864 728 117
1845-1854 1865-1874 893 292
1855-1864 1875-1884 1,200 517
1865-1874 1885-1893 727 667
1875-1884 1894-1904 1,132 872
1885-1894 1905-1915 1,080 897
1895-1904 1916-1925 1,136 1,037
1905-1914 1926-1935 1,106 1,014
Total 8,735 5,486 Notes and Sources: * Of these 73 observations, 15 heights have been estimated. Height data is lacking for the cohorts born in 1827-1830, 1833-42, 1849, 1853-54 and 1873-74. In addition, for the cohorts born in 1876 and 1877 data are lacking for a large part of the enlisted conscripts and, in fact, only include some particular groups, such as the draftees who required further revision and the ones who were measured but were not finally enlisted due to the existence of quotas. Data based on the Actas de Clasificación y declaración de soldados, Igualada, Arxiu Comarcal de l’Anoia.
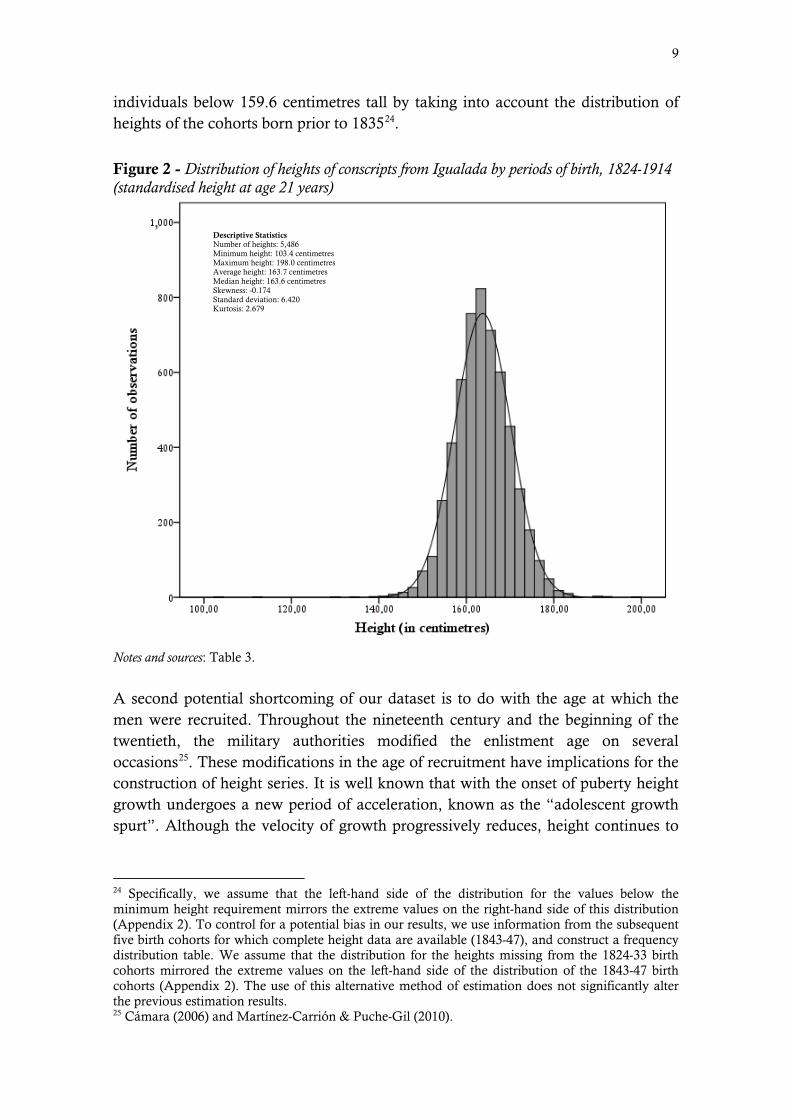
To start with, we had to estimate the average height for the cohorts born in the 1820s and the early 1830s because the data available for this period are affected by censuring. Indeed, our sources offer no information on the stature of the draftees below 159.6 centimetres, which was the minimum height required to join the army at that time, although they do detail the number of recordings below the minimum stature required. In order to correct for this bias, we estimated the height of the
22 Marfany (2010); and the Appendix 1 of this paper. 23 See, for example, Komlos (2004).
9
individuals below 159.6 centimetres tall by taking into account the distribution of heights of the cohorts born prior to 183524.
Figure 2 - Distribution of heights of conscripts from Igualada by periods of birth, 1824-1914 (standardised height at age 21 years)
Notes and sources: Table 3.
A second potential shortcoming of our dataset is to do with the age at which the men were recruited. Throughout the nineteenth century and the beginning of the twentieth, the military authorities modified the enlistment age on several occasions25. These modifications in the age of recruitment have implications for the construction of height series. It is well known that with the onset of puberty height growth undergoes a new period of acceleration, known as the “adolescent growth spurt”. Although the velocity of growth progressively reduces, height continues to
24 Specifically, we assume that the left-hand side of the distribution for the values below the minimum height requirement mirrors the extreme values on the right-hand side of this distribution (Appendix 2). To control for a potential bias in our results, we use information from the subsequent five birth cohorts for which complete height data are available (1843-47), and construct a frequency distribution table. We assume that the distribution for the heights missing from the 1824-33 birth cohorts mirrored the extreme values on the left-hand side of the distribution of the 1843-47 birth cohorts (Appendix 2). The use of this alternative method of estimation does not significantly alter the previous estimation results. 25 Cámara (2006) and Martínez-Carrión & Puche-Gil (2010).
Descriptive Statistics Number of heights: 5,486 Minimum height: 103.4 centimetres Maximum height: 198.0 centimetres Average height: 163.7 centimetres Median height: 163.6 centimetres Skewness: -0.174 Standard deviation: 6.420 Kurtosis: 2.679

10
increase until the late teens or early twenties26. Therefore, comparing the height of conscripts measured at different moments of their growth spurt may bias the final results.
Table 4 - Estimates of the absolute variation of the 50th percentile height across the cohorts of conscripts in Igualada born between 1826 and 1890
Conscripts Year of Year of with height P50 Height variation
Age birth recruitment Data cm age cm
18 1826/1833 1844/1851 27 162.63
19 1825/1832 1844/1851 31 163.09 18 to 19 0.46
19 1876-1880 1895-1899 389 161.90
20 1881-1885 1901-1905 500 162.60 19 to 20 0.70
21 1886-1890 1907-1911 468 163.25 20 to 21 0.65
Notes and sources: See text, Table 3.
In order to overcome this problem, we standardised the heights of the draftees at the age of 21 years for the periods in which a different recruitment age was established. Several procedures can be used to standardise the heights of conscripts over time. For reasons of data availability, we used a very simple method (Table 4)27. First, we took the 50th percentile in height of four different groups of cohorts of recruits measured at different ages, namely draftees born in 1825, 1826, 1832 and 1833 who were recruited at the ages of 18 and 19 years; conscripts born between 1876 and 1880 who enlisted at the age of 19; soldiers born in the period 1881-85 recruited at the age of 20, and, finally, draftees born between 1886 and 1890 enlisted at the age of 21. Second, we calculated the absolute variation of the 50th percentile height across the different age cohorts. Third, we applied these variations to the corresponding cohorts in order to standardise heights. Thus, we assume that a man will be 0.65 centimetres taller at the age of 21 than at the age of 20. Similarly, we assume that 19 year-olds would have grown a further 1.35 centimetres by the age of 21. We also assume that a man will grow 1.81 centimetres between the ages of 18 and 21 years. Fortunately, our results are not very different from those reported by other scholars using different methodologies28.
Finally, for the cohorts born in the 1820s and the early 1830s (recruitments of 1844 and 1851) we have approximately 75 observations – far fewer than for subsequent cohorts. Of course this situation affects the confidence intervals, which are greater for the first decades of the nineteenth century than for subsequent periods, as will be shown below.
26 See, for example, Floud, Wachter & Gregory (1990). 27 This method was developed and first used in Spanish historical anthropometrics by Ramon-Muñoz, J.M. (2009), and has recently been applied by other scholars such as Ayuda & Puche-Gil (2014). 28 Cámara (2007) and Martínez-Carrión & Moreno-Lázaro (2007).
11
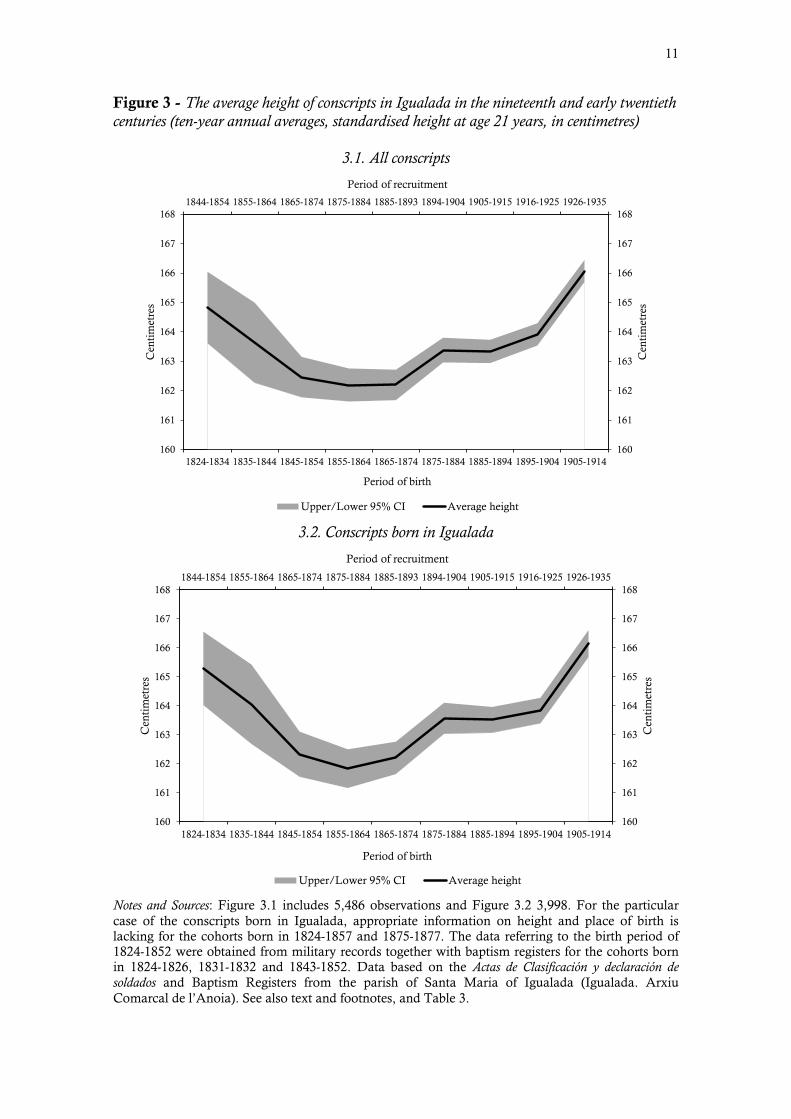
Figure 3 - The average height of conscripts in Igualada in the nineteenth and early twentieth centuries (ten-year annual averages, standardised height at age 21 years, in centimetres)
3.1. All conscripts
1844-1854 1855-1864 1865-1874 1875-1884 1885-1893 1894-1904 1905-1915 1916-1925 1926-1935
160
161
162
163
164
165
166
167
168
160
161
162
163
164
165
166
167
168
1824-1834 1835-1844 1845-1854 1855-1864 1865-1874 1875-1884 1885-1894 1895-1904 1905-1914
Period of recruitment
Cen
tim
etre
s
Cen
tim
etre
s
Period of birth
Upper/Lower 95% CI Average height
3.2. Conscripts born in Igualada
1844-1854 1855-1864 1865-1874 1875-1884 1885-1893 1894-1904 1905-1915 1916-1925 1926-1935
160
161
162
163
164
165
166
167
168
160
161
162
163
164
165
166
167
168
1824-1834 1835-1844 1845-1854 1855-1864 1865-1874 1875-1884 1885-1894 1895-1904 1905-1914
Period of recruitment
Cen
tim
etre
s
Cen
tim
etre
s
Period of birth
Upper/Lower 95% CI Average height
Notes and Sources: Figure 3.1 includes 5,486 observations and Figure 3.2 3,998. For the particular case of the conscripts born in Igualada, appropriate information on height and place of birth is lacking for the cohorts born in 1824-1857 and 1875-1877. The data referring to the birth period of 1824-1852 were obtained from military records together with baptism registers for the cohorts born in 1824-1826, 1831-1832 and 1843-1852. Data based on the Actas de Clasificación y declaración de soldados and Baptism Registers from the parish of Santa Maria of Igualada (Igualada. Arxiu Comarcal de l’Anoia). See also text and footnotes, and Table 3.
12
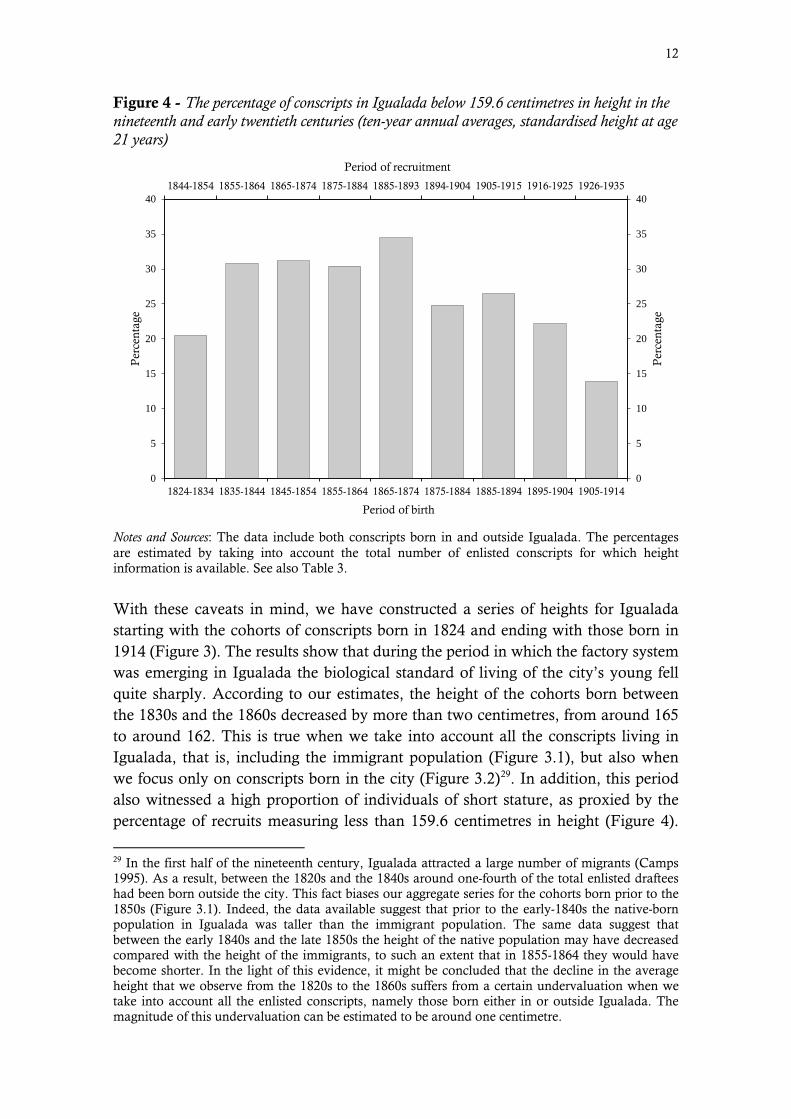
Figure 4 - The percentage of conscripts in Igualada below 159.6 centimetres in height in the nineteenth and early twentieth centuries (ten-year annual averages, standardised height at age 21 years)
1844-1854 1855-1864 1865-1874 1875-1884 1885-1893 1894-1904 1905-1915 1916-1925 1926-1935
0
5
10
15
20
25
30
35
40
0
5
10
15
20
25
30
35
40
1824-1834 1835-1844 1845-1854 1855-1864 1865-1874 1875-1884 1885-1894 1895-1904 1905-1914
Period of recruitment
Per
cent
age
Per
cent
age
Period of birth
Notes and Sources: The data include both conscripts born in and outside Igualada. The percentages are estimated by taking into account the total number of enlisted conscripts for which height information is available. See also Table 3.
With these caveats in mind, we have constructed a series of heights for Igualada starting with the cohorts of conscripts born in 1824 and ending with those born in 1914 (Figure 3). The results show that during the period in which the factory system was emerging in Igualada the biological standard of living of the city’s young fell quite sharply. According to our estimates, the height of the cohorts born between the 1830s and the 1860s decreased by more than two centimetres, from around 165 to around 162. This is true when we take into account all the conscripts living in Igualada, that is, including the immigrant population (Figure 3.1), but also when we focus only on conscripts born in the city (Figure 3.2)29. In addition, this period also witnessed a high proportion of individuals of short stature, as proxied by the percentage of recruits measuring less than 159.6 centimetres in height (Figure 4).
29 In the first half of the nineteenth century, Igualada attracted a large number of migrants (Camps 1995). As a result, between the 1820s and the 1840s around one-fourth of the total enlisted draftees had been born outside the city. This fact biases our aggregate series for the cohorts born prior to the 1850s (Figure 3.1). Indeed, the data available suggest that prior to the early-1840s the native-born population in Igualada was taller than the immigrant population. The same data suggest that between the early 1840s and the late 1850s the height of the native population may have decreased compared with the height of the immigrants, to such an extent that in 1855-1864 they would have become shorter. In the light of this evidence, it might be concluded that the decline in the average height that we observe from the 1820s to the 1860s suffers from a certain undervaluation when we take into account all the enlisted conscripts, namely those born either in or outside Igualada. The magnitude of this undervaluation can be estimated to be around one centimetre.
13
Short stature is generally associated with adverse sanitary situations, inappropriate feeding, and poor socioeconomic conditions.
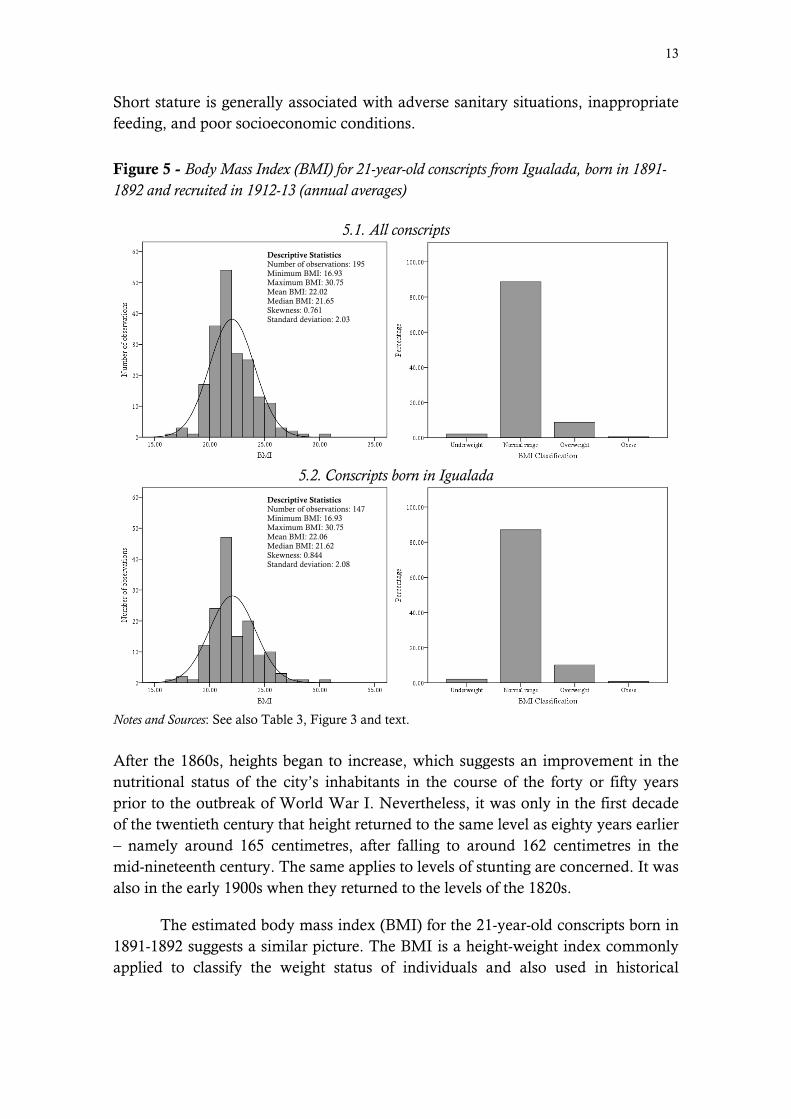
Figure 5 - Body Mass Index (BMI) for 21-year-old conscripts from Igualada, born in 1891-1892 and recruited in 1912-13 (annual averages)
5.1. All conscripts
5.2. Conscripts born in Igualada
Notes and Sources: See also Table 3, Figure 3 and text.
After the 1860s, heights began to increase, which suggests an improvement in the nutritional status of the city’s inhabitants in the course of the forty or fifty years prior to the outbreak of World War I. Nevertheless, it was only in the first decade of the twentieth century that height returned to the same level as eighty years earlier – namely around 165 centimetres, after falling to around 162 centimetres in the mid-nineteenth century. The same applies to levels of stunting are concerned. It was also in the early 1900s when they returned to the levels of the 1820s.
The estimated body mass index (BMI) for the 21-year-old conscripts born in 1891-1892 suggests a similar picture. The BMI is a height-weight index commonly applied to classify the weight status of individuals and also used in historical
Descriptive Statistics Number of observations: 195 Minimum BMI: 16.93 Maximum BMI: 30.75 Mean BMI: 22.02 Median BMI: 21.65 Skewness: 0.761 Standard deviation: 2.03
Descriptive Statistics Number of observations: 147 Minimum BMI: 16.93 Maximum BMI: 30.75 Mean BMI: 22.06 Median BMI: 21.62 Skewness: 0.844 Standard deviation: 2.08

14
analyses of nutritional conditions30. It is calculated by dividing the weight of the individual (in kilograms) by the square of his or her height (in metres). According to the international BMI classification for modern standards elaborated by the World Health Organization (1995), values below 18.50 correspond to underweight, values between 18.50 and 24.99 to normal weight, values between 25.00 and 29.99 indicate overweight, and, finally, those above 29.99 indicate obesity.
In Figure 5 we apply these cut-off points to the cohorts for which we can calculate BMI values prior to 1914. The results are revealing: they show that, by modern standards, only two per cent of Igualada conscripts born in 1891-92 and measured and weighed in 1912-13 fell within the category of underweight, while most of them (88 per cent) had normal weight, the average BMI being 22.0 kg/m2. We take these results as further evidence of a recovery in the biological living standard of the city’s inhabitants after the 1860s. Moreover, we might speculate that for the cohorts born in the mid-nineteenth century the percentage of underweight recruits was higher and, because of this, we hypothesise that the risk of morbidity and mortality of these cohorts was also greater. However, the lack of appropriate data makes it impossible to confirm this hypothesis.
Interestingly, the long-term trends emerging from height data are not so different from those based on demographic variables (Appendix 1, Figure A1.1). Both sources suggest a pessimistic view of the impact of industrialisation on living standards during the period in which the factory-system was becoming established, with high infant mortality rates and a decline in the height of young males between the 1830s and the 1860s.
These findings are perhaps not surprising. In Britain, the emergence and spread of the factory-system in the late eighteenth and early nineteenth centuries transformed both working and living conditions. Leisure time declined as working hours increased by around 25-30 per cent in the century after 175031. The irregular working patterns that characterised pre-industrial times were also progressively substituted by the more regular, monotonous and disciplined schedules of the mechanised factories32. Child labour was used intensively during the Industrial Revolution and, to some extent, reduced married women’s labour33. While working conditions probably became harder between the mid-eighteenth and the mid-nineteenth century, they were not compensated by either substantial gains in real wages or clear improvements in food consumption34. Finally, a number of cities grew in parallel to the spread of factory-based industrialisation, offering
30 There is abundant literature on historical anthropometrics and BMI. See, among others, the recent works by Hiermeyer (2010), Komlos and Brabec (2010), Floud, Fogel, Harris & Hong (2011), Carson (2013), Costa (2013), as well as the references quoted in all these works. 31 Voth (1998, 2001, 2003). 32 Thompson (1967); Clark (1994). 33 Humphries (2010), p. 118. 34 Feinstein (1998); Mokyr (1988).
15
opportunities for higher wages35. However, they also tended to be overcrowded and had poor housing and sanitary conditions, increasing the transmission of diseases. In fact, mortality rates were higher and average height was lower among the inhabitants of industrial cities than in those living in rural areas36.
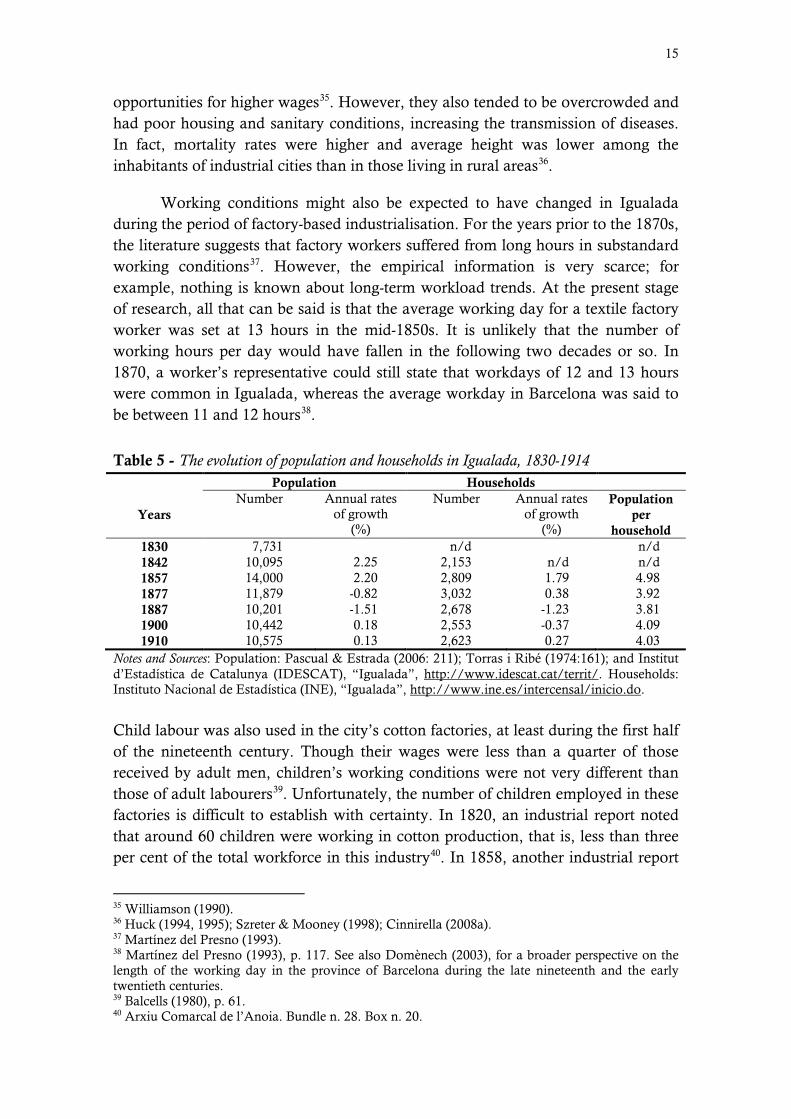
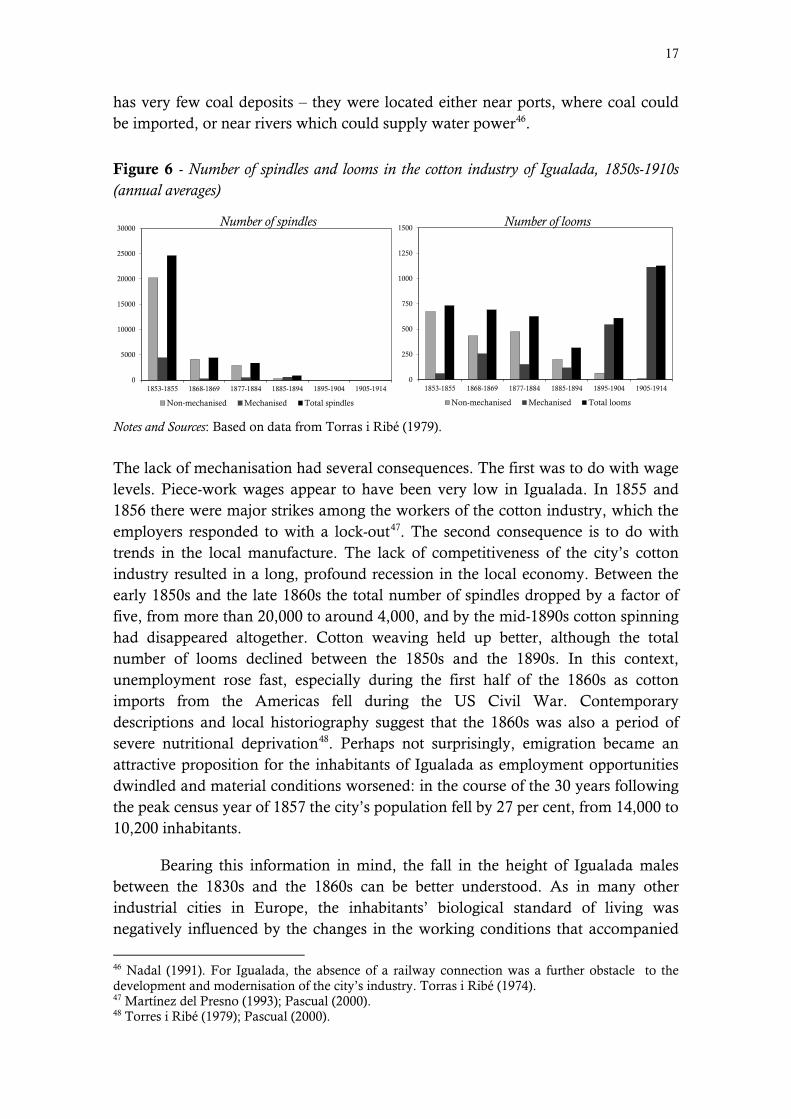
Working conditions might also be expected to have changed in Igualada during the period of factory-based industrialisation. For the years prior to the 1870s, the literature suggests that factory workers suffered from long hours in substandard working conditions37. However, the empirical information is very scarce; for example, nothing is known about long-term workload trends. At the present stage of research, all that can be said is that the average working day for a textile factory worker was set at 13 hours in the mid-1850s. It is unlikely that the number of working hours per day would have fallen in the following two decades or so. In 1870, a worker’s representative could still state that workdays of 12 and 13 hours were common in Igualada, whereas the average workday in Barcelona was said to be between 11 and 12 hours38.
Table 5 - The evolution of population and households in Igualada, 1830-1914 Population Households
Years Number Annual rates
of growth (%)
Number Annual rates of growth
(%)
Population per
household 1830 7,731 n/d n/d 1842 10,095 2.25 2,153 n/d n/d 1857 14,000 2.20 2,809 1.79 4.98 1877 11,879 -0.82 3,032 0.38 3.92 1887 10,201 -1.51 2,678 -1.23 3.81 1900 10,442 0.18 2,553 -0.37 4.09 1910 10,575 0.13 2,623 0.27 4.03
Notes and Sources: Population: Pascual & Estrada (2006: 211); Torras i Ribé (1974:161); and Institut d’Estadística de Catalunya (IDESCAT), “Igualada”, http://www.idescat.cat/territ/. Households: Instituto Nacional de Estadística (INE), “Igualada”, http://www.ine.es/intercensal/inicio.do.
Child labour was also used in the city’s cotton factories, at least during the first half of the nineteenth century. Though their wages were less than a quarter of those received by adult men, children’s working conditions were not very different than those of adult labourers39. Unfortunately, the number of children employed in these factories is difficult to establish with certainty. In 1820, an industrial report noted that around 60 children were working in cotton production, that is, less than three per cent of the total workforce in this industry40. In 1858, another industrial report
35 Williamson (1990). 36 Huck (1994, 1995); Szreter & Mooney (1998); Cinnirella (2008a). 37 Martínez del Presno (1993). 38 Martínez del Presno (1993), p. 117. See also Domènech (2003), for a broader perspective on the length of the working day in the province of Barcelona during the late nineteenth and the early twentieth centuries. 39 Balcells (1980), p. 61. 40 Arxiu Comarcal de l’Anoia. Bundle n. 28. Box n. 20.
16
stated that textile factories employed 184 children, who accounted for around 11 per cent of the city’s total textile workforce. The same report also indicated that the numbers of men and women working in the textile manufacture were similar41. Fragmentary as it is, the existing information suggests a rise in child factory labour, in both absolute and relative terms, as the factory system spread and the cotton industry expanded.
Paralleling this expansion of the cotton industry, the city also experienced a period of rapid demographic increase until the mid-1850s (Table 5). In the peak census year of 1857, Igualada had 14,000 inhabitants, as against 7,700 in 1830. During this period the population density rose from 933 to 1,689 inhabitants per square kilometre. Immigration was also high before the late 1850s and, in fact, accounted for a large share of this growth42. In this situation, the demand for housing soared: supply progressively adjusted to demand and new dwellings were built, though most of this adjustment seems to have consisted of adding new floors to existing houses. The research by Pascual & Estrada on housing is clear in this respect, arguing that during the first half of the nineteenth century Igualada experienced vertical urban growth43. Buildings of three and even four storeys became quite common, with the owner of the dwelling living in the first floor and the tenants in the rest. Interestingly, Pascual & Estrada also suggest that as demographic pressure increased, dwellings were divided up in order to house more than one family. This means that by the mid-nineteenth century it was likely that ten or even more people were living in dwellings of around 90 square metres44. Although further research is needed, the evidence available suggests that between the 1830s and the 1850s housing conditions deteriorated sharply.
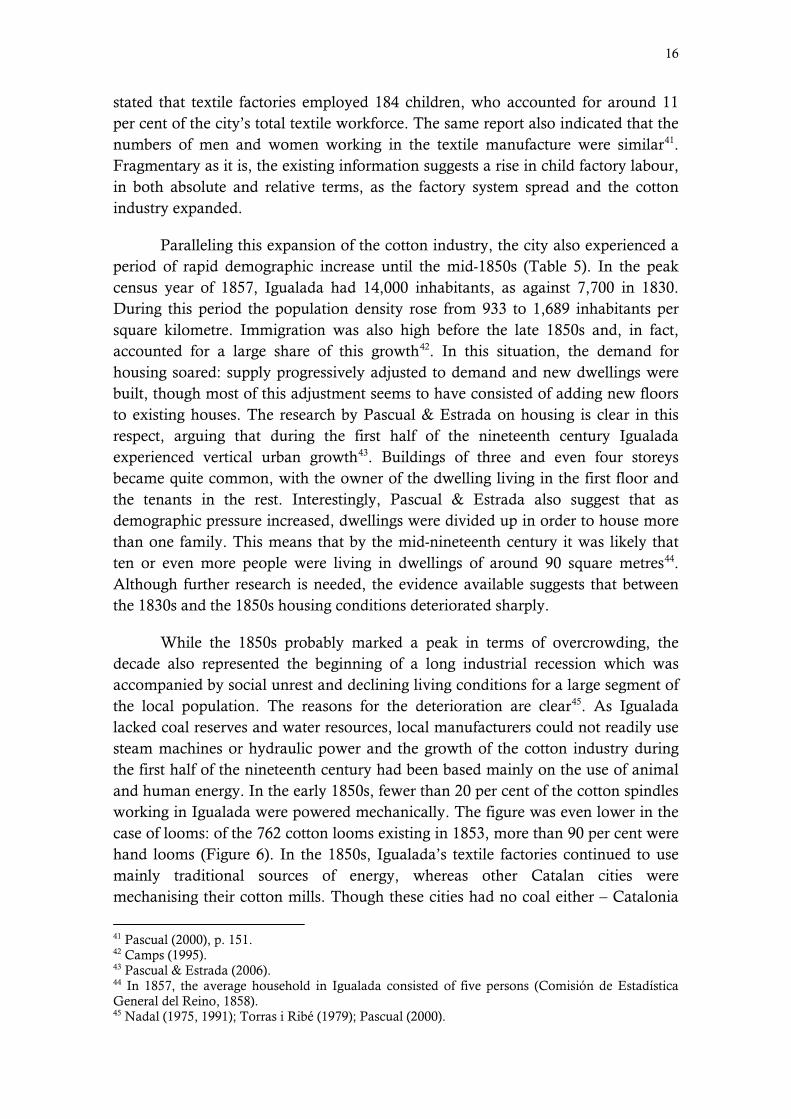
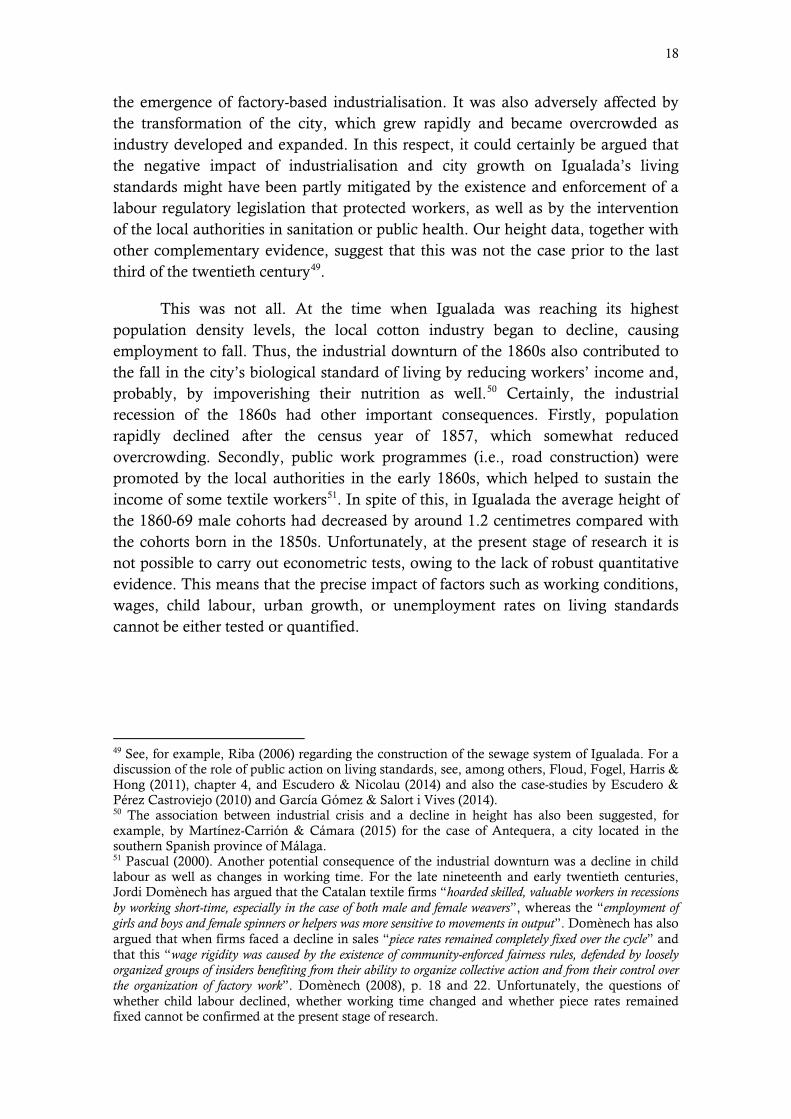
While the 1850s probably marked a peak in terms of overcrowding, the decade also represented the beginning of a long industrial recession which was accompanied by social unrest and declining living conditions for a large segment of the local population. The reasons for the deterioration are clear45. As Igualada lacked coal reserves and water resources, local manufacturers could not readily use steam machines or hydraulic power and the growth of the cotton industry during the first half of the nineteenth century had been based mainly on the use of animal and human energy. In the early 1850s, fewer than 20 per cent of the cotton spindles working in Igualada were powered mechanically. The figure was even lower in the case of looms: of the 762 cotton looms existing in 1853, more than 90 per cent were hand looms (Figure 6). In the 1850s, Igualada’s textile factories continued to use mainly traditional sources of energy, whereas other Catalan cities were mechanising their cotton mills. Though these cities had no coal either – Catalonia
41 Pascual (2000), p. 151. 42 Camps (1995). 43 Pascual & Estrada (2006). 44 In 1857, the average household in Igualada consisted of five persons (Comisión de Estadística General del Reino, 1858). 45 Nadal (1975, 1991); Torras i Ribé (1979); Pascual (2000).
17
has very few coal deposits – they were located either near ports, where coal could be imported, or near rivers which could supply water power46.
Figure 6 - Number of spindles and looms in the cotton industry of Igualada, 1850s-1910s (annual averages)
0
5000
10000
15000
20000
25000
30000
1853-1855 1868-1869 1877-1884 1885-1894 1895-1904 1905-1914
Non-mechanised Mechanised Total spindles
0
250
500
750
1000
1250
1500
1853-1855 1868-1869 1877-1884 1885-1894 1895-1904 1905-1914
Non-mechanised Mechanised Total looms
Notes and Sources: Based on data from Torras i Ribé (1979).
The lack of mechanisation had several consequences. The first was to do with wage levels. Piece-work wages appear to have been very low in Igualada. In 1855 and 1856 there were major strikes among the workers of the cotton industry, which the employers responded to with a lock-out47. The second consequence is to do with trends in the local manufacture. The lack of competitiveness of the city’s cotton industry resulted in a long, profound recession in the local economy. Between the early 1850s and the late 1860s the total number of spindles dropped by a factor of five, from more than 20,000 to around 4,000, and by the mid-1890s cotton spinning had disappeared altogether. Cotton weaving held up better, although the total number of looms declined between the 1850s and the 1890s. In this context, unemployment rose fast, especially during the first half of the 1860s as cotton imports from the Americas fell during the US Civil War. Contemporary descriptions and local historiography suggest that the 1860s was also a period of severe nutritional deprivation48. Perhaps not surprisingly, emigration became an attractive proposition for the inhabitants of Igualada as employment opportunities dwindled and material conditions worsened: in the course of the 30 years following the peak census year of 1857 the city’s population fell by 27 per cent, from 14,000 to 10,200 inhabitants.
Bearing this information in mind, the fall in the height of Igualada males between the 1830s and the 1860s can be better understood. As in many other industrial cities in Europe, the inhabitants’ biological standard of living was negatively influenced by the changes in the working conditions that accompanied
46 Nadal (1991). For Igualada, the absence of a railway connection was a further obstacle to the development and modernisation of the city’s industry. Torras i Ribé (1974). 47 Martínez del Presno (1993); Pascual (2000). 48 Torres i Ribé (1979); Pascual (2000).
Number of spindles Number of looms
18
the emergence of factory-based industrialisation. It was also adversely affected by the transformation of the city, which grew rapidly and became overcrowded as industry developed and expanded. In this respect, it could certainly be argued that the negative impact of industrialisation and city growth on Igualada’s living standards might have been partly mitigated by the existence and enforcement of a labour regulatory legislation that protected workers, as well as by the intervention of the local authorities in sanitation or public health. Our height data, together with other complementary evidence, suggest that this was not the case prior to the last third of the twentieth century49.
This was not all. At the time when Igualada was reaching its highest population density levels, the local cotton industry began to decline, causing employment to fall. Thus, the industrial downturn of the 1860s also contributed to the fall in the city’s biological standard of living by reducing workers’ income and, probably, by impoverishing their nutrition as well.50 Certainly, the industrial recession of the 1860s had other important consequences. Firstly, population rapidly declined after the census year of 1857, which somewhat reduced overcrowding. Secondly, public work programmes (i.e., road construction) were promoted by the local authorities in the early 1860s, which helped to sustain the income of some textile workers51. In spite of this, in Igualada the average height of the 1860-69 male cohorts had decreased by around 1.2 centimetres compared with the cohorts born in the 1850s. Unfortunately, at the present stage of research it is not possible to carry out econometric tests, owing to the lack of robust quantitative evidence. This means that the precise impact of factors such as working conditions, wages, child labour, urban growth, or unemployment rates on living standards cannot be either tested or quantified.
49 See, for example, Riba (2006) regarding the construction of the sewage system of Igualada. For a discussion of the role of public action on living standards, see, among others, Floud, Fogel, Harris & Hong (2011), chapter 4, and Escudero & Nicolau (2014) and also the case-studies by Escudero & Pérez Castroviejo (2010) and García Gómez & Salort i Vives (2014). 50 The association between industrial crisis and a decline in height has also been suggested, for example, by Martínez-Carrión & Cámara (2015) for the case of Antequera, a city located in the southern Spanish province of Málaga. 51 Pascual (2000). Another potential consequence of the industrial downturn was a decline in child labour as well as changes in working time. For the late nineteenth and early twentieth centuries, Jordi Domènech has argued that the Catalan textile firms “hoarded skilled, valuable workers in recessions by working short-time, especially in the case of both male and female weavers”, whereas the “employment of girls and boys and female spinners or helpers was more sensitive to movements in output”. Domènech has also argued that when firms faced a decline in sales “piece rates remained completely fixed over the cycle” and that this “wage rigidity was caused by the existence of community-enforced fairness rules, defended by loosely organized groups of insiders benefiting from their ability to organize collective action and from their control over the organization of factory work”. Domènech (2008), p. 18 and 22. Unfortunately, the questions of whether child labour declined, whether working time changed and whether piece rates remained fixed cannot be confirmed at the present stage of research.

19
4. Igualada inside the context of Catalonia: a comparative approach
But did the biological living standard of the inhabitants of an industrial city like Igualada deteriorate compared with other areas of Catalonia? Conceivably, the fall in height we have documented for the years prior to the 1870s may have been part of a more general trend; perhaps the inhabitants of other towns and cities or the rural population experienced an even more dramatic decline in height.
The only way to test this possibility is to compare the heights of young males in Igualada and elsewhere in Catalonia. At present, the only available height data for Catalonia are from the rural western towns of Balaguer, Cervera, Juneda, and Tàrrega, and the central and southern industrial cities of Manresa and Reus52. With these data for individual towns and cities, we have constructed two different aggregate series for the cohorts born between 1843 and 1914: one for Rural Western Catalonia (RWC) and the other for Industrial Central and Southern Catalonia (ICSC).
Figure 7 - Heights of conscripts from Igualada, rural Western Catalonia (RWC) and Industrial Central & Southern Catalonia (ICSC) in the nineteenth and early twentieth centuries (five-year moving averages, non-standardised height, in centimetres)
160
161
162
163
164
165
166
167
1681863 1867 1871 1875 1879 1883 1886 1890 1894 1898 1903 1908 1912 1916 1920 1924 1928 1932
160
161
162
163
164
165
166
167
168
1843 1847 1851 1855 1859 1863 1867 1871 1875 1879 1883 1887 1891 1895 1899 1903 1907 1911
Year of recruitment
Year of birth
RECRUITMENT AGE AT 20 YEARS RECRUITMENT AGE AT 19 YEARS RECRUITMENT AGE AT 21 YEARS
Igualada Rural (RWC) Industrial (ICSC) Notes and Sources: Table 3, Ramon-Muñoz, J.M. (2009, 2011), updated data, and text.
These aggregate series, together with the series for Igualada, are displayed and compared in Figures 7 and 8). They give rise to a number of comments. To start with, in the three decades before 1870 the cohorts of Igualada were shorter not only 52 Ramon-Muñoz, J.M. (2009, 2011).
20
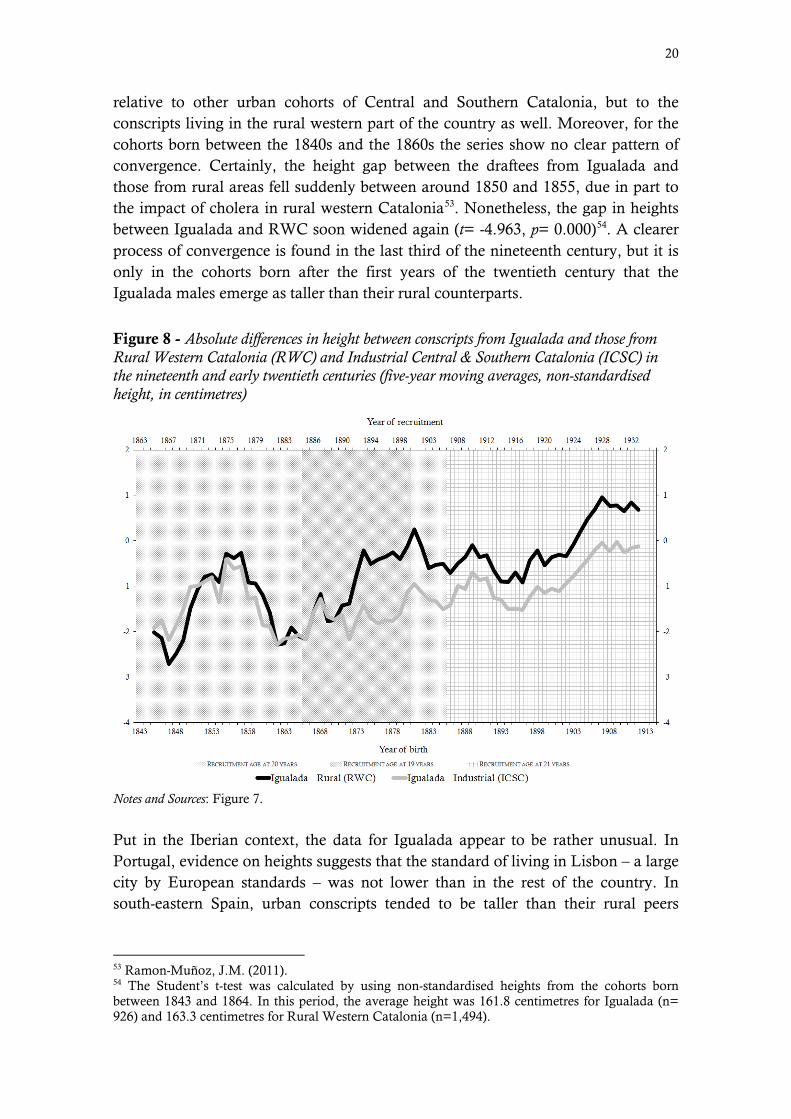
relative to other urban cohorts of Central and Southern Catalonia, but to the conscripts living in the rural western part of the country as well. Moreover, for the cohorts born between the 1840s and the 1860s the series show no clear pattern of convergence. Certainly, the height gap between the draftees from Igualada and those from rural areas fell suddenly between around 1850 and 1855, due in part to the impact of cholera in rural western Catalonia53. Nonetheless, the gap in heights between Igualada and RWC soon widened again (t= -4.963, p= 0.000)54. A clearer process of convergence is found in the last third of the nineteenth century, but it is only in the cohorts born after the first years of the twentieth century that the Igualada males emerge as taller than their rural counterparts.
Figure 8 - Absolute differences in height between conscripts from Igualada and those from Rural Western Catalonia (RWC) and Industrial Central & Southern Catalonia (ICSC) in the nineteenth and early twentieth centuries (five-year moving averages, non-standardised height, in centimetres)
Notes and Sources: Figure 7.
Put in the Iberian context, the data for Igualada appear to be rather unusual. In Portugal, evidence on heights suggests that the standard of living in Lisbon – a large city by European standards – was not lower than in the rest of the country. In south-eastern Spain, urban conscripts tended to be taller than their rural peers
53 Ramon-Muñoz, J.M. (2011). 54 The Student’s t-test was calculated by using non-standardised heights from the cohorts born between 1843 and 1864. In this period, the average height was 161.8 centimetres for Igualada (n= 926) and 163.3 centimetres for Rural Western Catalonia (n=1,494).

21
between the 1830s and the 1890s55, this was also the case in the northern Province of Bizkaia between the mid-1850s and the early 1910s56, while in central Spain an urban premium emerged in the latter part of the nineteenth century57. In Igualada, on the other hand, this urban advantage can be only clearly established during the decade prior to the outbreak of World War I.
The pattern found in Igualada also contrasts with the trends evidenced by other Catalan urban areas for which data are available (Figures 7 and 8). The conscripts from Igualada were shorter than those living in Manresa or Reus; this difference in height was substantial and statistically significant for the cohorts born from the early 1840s to the early 1860s (t= -5.741, p= 0.000)58. Throughout this period, the height gap between Igualada and the series for ICSC fluctuated in much the same way as the gap between Igualada and RWC. However, height differences between the cohorts from Igualada and those from Manresa and Reus widens slightly comparing those born in the 1840s and those born in the 1860s. From the 1860s onwards, a process of convergence in height is also found between Igualada and the other central and southern Catalan cities for which information is available. In spite of this, it was only over the first decade of the twentieth century that Igualada’s young males reached a similar height to their peers in Manresa and Reus.
The evidence presented in previous sections can help to suggest why males were shorter in Igualada than in other industrial Catalan cities between the 1840s and 1860s. However, three factors need to be stressed. First, in the years around 1860, the evidence available suggests that in Manresa and Reus a lower percentage of the population was employed in factories than in Igualada59. Second, in the three decades after 1850, the Igualada cotton textile industry performed worse than the textile industries of Manresa and Reus. Third, and perhaps most importantly, in the first half of the nineteenth century population growth was higher in Igualada than in other industrial cities in central and southern Catalonia. Partially as a result of this, by the mid-nineteenth century Igualada had a very high population density (more than 1,700 inhabitants per square kilometre in the census year of 1857) compared to Manresa (less than 400) and Reus (around 530)60.
55 Martínez-Carrión & Pérez-Castejón (1998b). However, a recent study of nine municipalities in the south-eastern region of Valencia found that in the 1859-1899 birth cohorts rural conscripts were between 0.99 and 0.45 centimetres taller than their urban peers, the differences being statistically significant. Ayuda & Puche-Gil (2014). 56 Martínez-Carrión, Pérez-Castroviejo, Puche-Gil & Ramon-Muñoz (2014). 57 Martínez-Carrión & Moreno-Lázaro (2007); Hernández & Moreno-Lázaro (2009, 2011). 58 Again, the Student’s t-test was calculated by using non-standardised heights from the cohorts born between 1843 and 1864. In this period, the average height was 163.3 centimetres for Industrial Central & Southern Catalonia (n=3,136). 59 Giménez Guited (1862). 60 Comisión de Estadística General del Reino (1858).
22
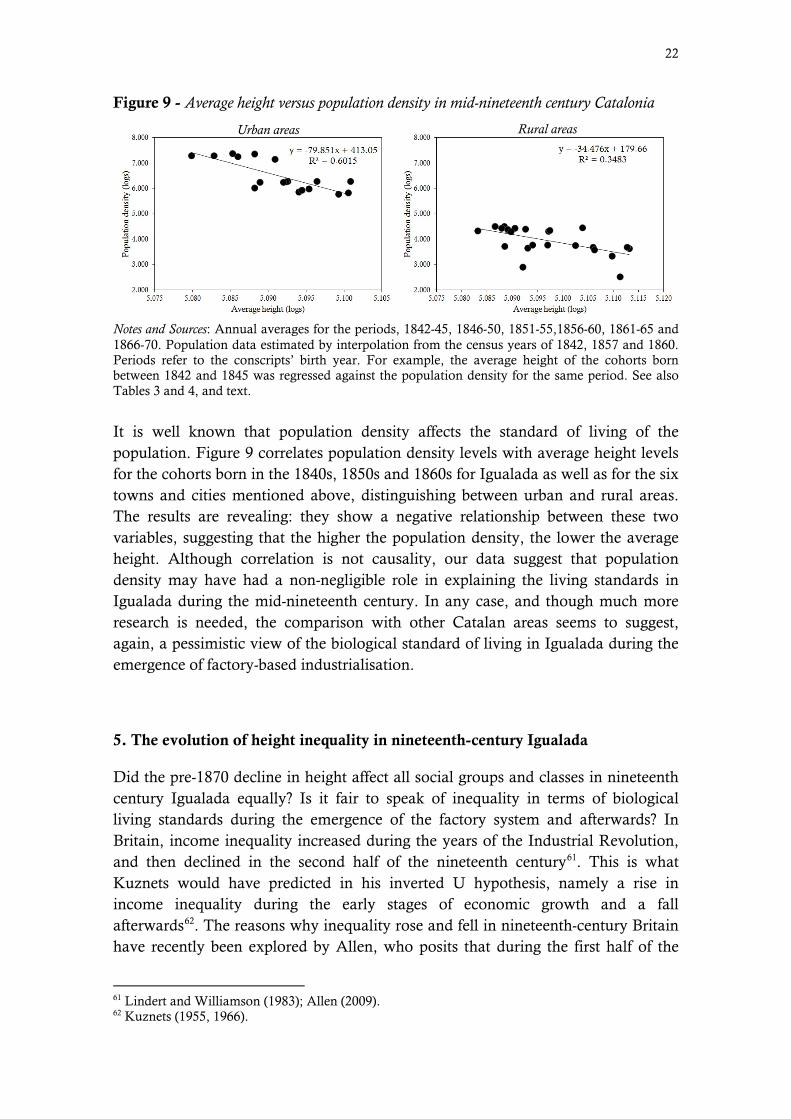
Figure 9 - Average height versus population density in mid-nineteenth century Catalonia
Notes and Sources: Annual averages for the periods, 1842-45, 1846-50, 1851-55,1856-60, 1861-65 and 1866-70. Population data estimated by interpolation from the census years of 1842, 1857 and 1860. Periods refer to the conscripts’ birth year. For example, the average height of the cohorts born between 1842 and 1845 was regressed against the population density for the same period. See also Tables 3 and 4, and text.
It is well known that population density affects the standard of living of the population. Figure 9 correlates population density levels with average height levels for the cohorts born in the 1840s, 1850s and 1860s for Igualada as well as for the six towns and cities mentioned above, distinguishing between urban and rural areas. The results are revealing: they show a negative relationship between these two variables, suggesting that the higher the population density, the lower the average height. Although correlation is not causality, our data suggest that population density may have had a non-negligible role in explaining the living standards in Igualada during the mid-nineteenth century. In any case, and though much more research is needed, the comparison with other Catalan areas seems to suggest, again, a pessimistic view of the biological standard of living in Igualada during the emergence of factory-based industrialisation.
5. The evolution of height inequality in nineteenth-century Igualada
Did the pre-1870 decline in height affect all social groups and classes in nineteenth century Igualada equally? Is it fair to speak of inequality in terms of biological living standards during the emergence of the factory system and afterwards? In Britain, income inequality increased during the years of the Industrial Revolution, and then declined in the second half of the nineteenth century61. This is what Kuznets would have predicted in his inverted U hypothesis, namely a rise in income inequality during the early stages of economic growth and a fall afterwards62. The reasons why inequality rose and fell in nineteenth-century Britain have recently been explored by Allen, who posits that during the first half of the
61 Lindert and Williamson (1983); Allen (2009). 62 Kuznets (1955, 1966).
Urban areas Rural areas

23
nineteenth century technical change increased the demand for capital and raised the profit rate, whereas real wages stagnated in a context in which output per worker expanded63. In contrast, from the mid-nineteenth century onwards wages rose in line with productivity.
These trends in income inequality find partial confirmation through the use of height data. Komlos has shown that upper-class English youths were markedly taller than lower-class youths in the late eighteenth and early nineteenth centuries64. He has also observed that the differences in height between these two groups did not substantially change comparing cohorts born in the 1840s with those born in the last decades of the eighteenth century. In other words, the inequality trends based on height data do not match those based on income data. However, recent research on height trends during the classical period of the Industrial Revolution has shown that the average height of certain occupational groups such as clerks and students increased in comparison with other occupations65. These findings indicate a rising height inequality across time and social groups in Britain, since height tends to correlate with occupation and economic status66.
Social and occupational differences in height have also been observed in other northern European countries. For example, the research by Baten and Lantzsch & Schuster’s into the physical stature of Bavarian conscripts during the first half of the nineteenth century reveals both rising inequality according to socioeconomic status and a confirmation of Kuznets’ inverted U hypothesis67. In Switzerland, differences in class-specific average height have also been observed for the cohorts born in the decades between the mid-1850s and the early 1930s. These differences seem to have remained constant in Basel and Zurich, but in Bern the upper classes seem to have grown more than the lower classes68. In southern Sweden, socioeconomic differences in height were also apparent in the first half of the nineteenth century. These differences decreased between the 1860s and the 1960s, although not dramatically: the most systematic and consistent difference was that sons of fathers in white collar occupations were taller than others69.
63 Allen (2009). 64 Komlos (2007). 65 Cinnirella (2008a). 66 See, among others, Komlos (1990); Kuh, Power & Rodgers (1991); Alter, Neven & Oris (2004). 67 Baten (2000); Lantzsch & Schuster’s (2009). 68 Schoch, Staub & Pfister (2012). 69 Öberg (2014).
24
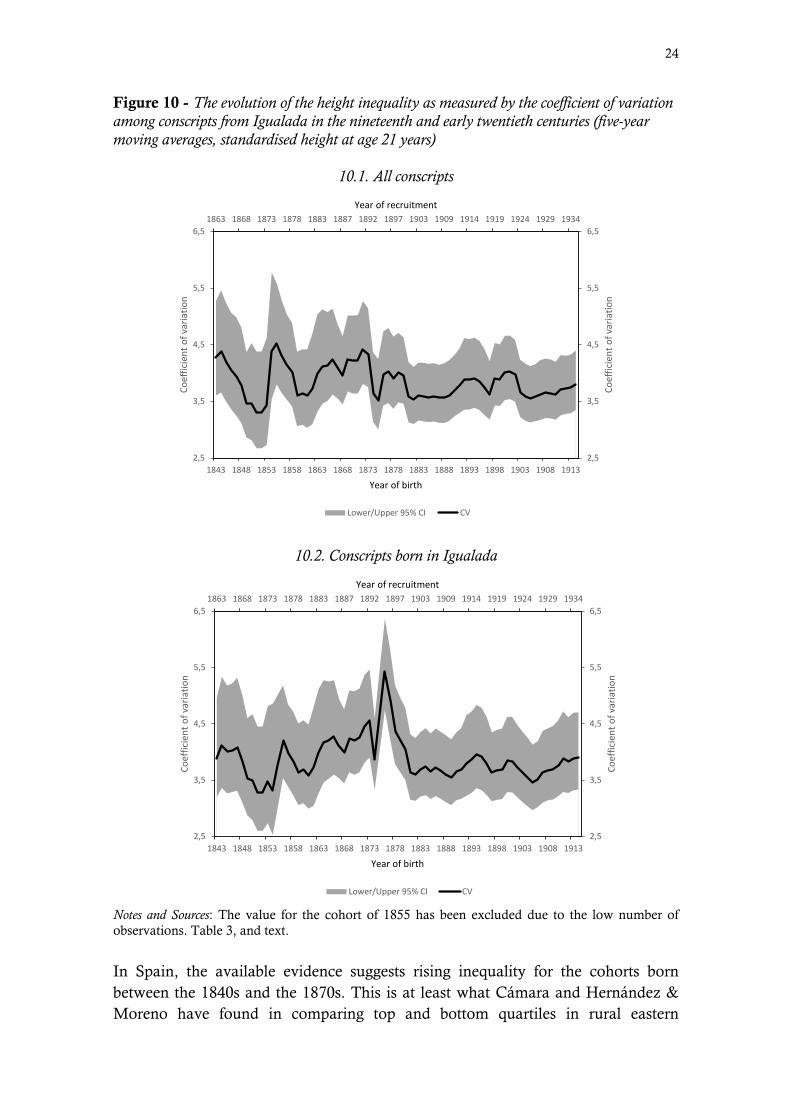
Figure 10 - The evolution of the height inequality as measured by the coefficient of variation among conscripts from Igualada in the nineteenth and early twentieth centuries (five-year moving averages, standardised height at age 21 years)
10.1. All conscripts
1863 1868 1873 1878 1883 1887 1892 1897 1903 1909 1914 1919 1924 1929 1934
2,5
3,5
4,5
5,5
6,5
2,5
3,5
4,5
5,5
6,5
1843 1848 1853 1858 1863 1868 1873 1878 1883 1888 1893 1898 1903 1908 1913
Year of recruitment
Coef
ficie
nt o
f var
iatio
n
Coef
ficie
nt o
f var
iatio
n
Year of birth
Lower/Upper 95% CI CV
10.2. Conscripts born in Igualada
1863 1868 1873 1878 1883 1887 1892 1897 1903 1909 1914 1919 1924 1929 1934
2,5
3,5
4,5
5,5
6,5
2,5
3,5
4,5
5,5
6,5
1843 1848 1853 1858 1863 1868 1873 1878 1883 1888 1893 1898 1903 1908 1913
Year of recruitment
Coef
ficie
nt o
f var
iatio
n
Coef
ficie
nt o
f var
iatio
n
Year of birth
Lower/Upper 95% CI CV
Notes and Sources: The value for the cohort of 1855 has been excluded due to the low number of observations. Table 3, and text.
In Spain, the available evidence suggests rising inequality for the cohorts born between the 1840s and the 1870s. This is at least what Cámara and Hernández & Moreno have found in comparing top and bottom quartiles in rural eastern
25
Andalusia and in Castile and León70. For the cohorts born between the 1880s and the 1910s, there is no consensus: according to Quiroga & Coll71, inequality between socio-professional groups in Spain increased in the cohorts born from around 1885 to around 1895, and decreased during the two decades before 1914. However, Hernández & Moreno-Lázaro’s data for Castile and León suggest no change in inequality between the cohorts born during the mid-1880s and the early 1910s72, while, according to Ayuda and Puche-Gil, height inequality fell in Valencia between the 1870s and the 1910s73. Martínez-Carrión, Pérez de Perceval and Martínez-Soto also found higher inequality levels in the 1870s than in the years around 1910 for the mining area of Riotinto (Huelva, Andalusia)74. On the other hand, Prados de la Escosura’s estimates show a long-term upward trend for income inequality during the second half of the nineteenth century75, even though there were downward oscillations between the 1850s and the mid-1860s and from the mid-1880s to the mid-1890s76.
Figure 10 plots the evolution of height inequality of the birth cohorts between 1843 and 1914. It distinguishes between two groups of conscripts: the first one comprises all the draftees living in Igualada during the period of measurement, and the second only Igualada-born conscripts (and is thus not directly influenced by immigration flows). It also uses the coefficient of variation (CV) as a measure of height inequality. This choice requires some justification, in part because it has not been effectively used by Spanish scholars working on historical anthropometrics, who have preferred to compare the average height across top and bottom quartiles or across different occupational groups77. Introduced by Baten and applied in many studies of the biological standard of living78, the use of the CV of height offers several advantages over other height inequality measures. For example, it does not require information on subjects’ occupations and so it avoids the problem of obtaining equivalent classifications of social or occupational groups for the comparisons of data from different localities, regions or countries.
Measured by the CV, and despite the large confidence intervals of the data, using a confidence level of 95 per cent the evidence for Igualada suggests periods of rising height inequality in the decades after 1850, but also phases in which inequality dropped substantially. Specifically, we cannot rule out the possibility that
70 Cámara (2009); Hernández & Moreno (2009). 71 Quiroga & Coll (2000); Quiroga (2001). 72 Hernández & Moreno-Lázaro (2009). 73 Ayuda & Puche-Gil (2014). 74 Martínez-Carrión, Pérez de Perceval and Martínez-Soto (2014). 75 Prados de la Escosura (2008). 76 According to Prados de la Escosura (2008), personal income distribution in Spain fits a Kuznets curve when the period 1850-2000 is taken as whole. 77 To our knowledge, the only exceptions to this rule were Quiroga & Coll (2000) and Quiroga (2001), who, in fact, compared the CV among socio-professional groups, and, previous versions of Ramon-Muñoz R. & Ramon-Muñoz, J.M. (2015). Recently, the CV of height was also used by Martínez-Carrión, Pérez de Perceval & Martínez-Soto (2014) and Ayuda & Puche-Gil (2014). 78 Baten (2000). See, also, Blum (2014).
26
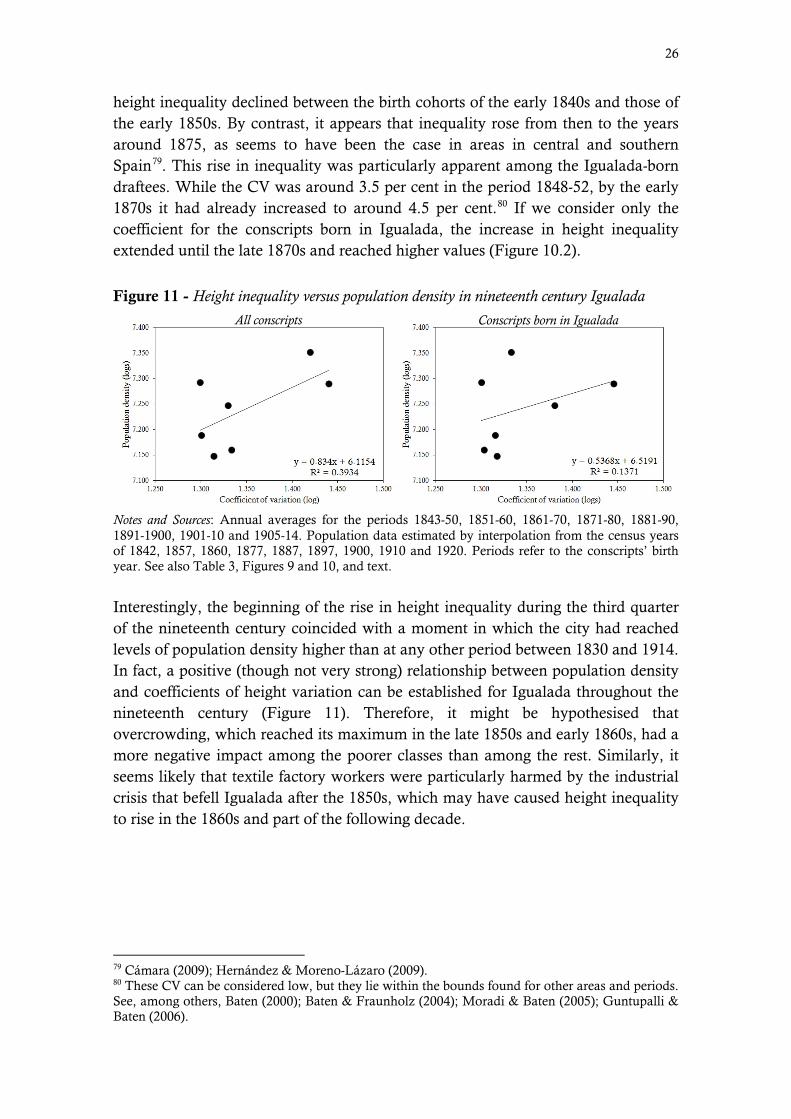
height inequality declined between the birth cohorts of the early 1840s and those of the early 1850s. By contrast, it appears that inequality rose from then to the years around 1875, as seems to have been the case in areas in central and southern Spain79. This rise in inequality was particularly apparent among the Igualada-born draftees. While the CV was around 3.5 per cent in the period 1848-52, by the early 1870s it had already increased to around 4.5 per cent.80 If we consider only the coefficient for the conscripts born in Igualada, the increase in height inequality extended until the late 1870s and reached higher values (Figure 10.2).
Figure 11 - Height inequality versus population density in nineteenth century Igualada
Notes and Sources: Annual averages for the periods 1843-50, 1851-60, 1861-70, 1871-80, 1881-90, 1891-1900, 1901-10 and 1905-14. Population data estimated by interpolation from the census years of 1842, 1857, 1860, 1877, 1887, 1897, 1900, 1910 and 1920. Periods refer to the conscripts’ birth year. See also Table 3, Figures 9 and 10, and text.
Interestingly, the beginning of the rise in height inequality during the third quarter of the nineteenth century coincided with a moment in which the city had reached levels of population density higher than at any other period between 1830 and 1914. In fact, a positive (though not very strong) relationship between population density and coefficients of height variation can be established for Igualada throughout the nineteenth century (Figure 11). Therefore, it might be hypothesised that overcrowding, which reached its maximum in the late 1850s and early 1860s, had a more negative impact among the poorer classes than among the rest. Similarly, it seems likely that textile factory workers were particularly harmed by the industrial crisis that befell Igualada after the 1850s, which may have caused height inequality to rise in the 1860s and part of the following decade.
79 Cámara (2009); Hernández & Moreno-Lázaro (2009). 80 These CV can be considered low, but they lie within the bounds found for other areas and periods. See, among others, Baten (2000); Baten & Fraunholz (2004); Moradi & Baten (2005); Guntupalli & Baten (2006).
All conscripts Conscripts born in Igualada
27
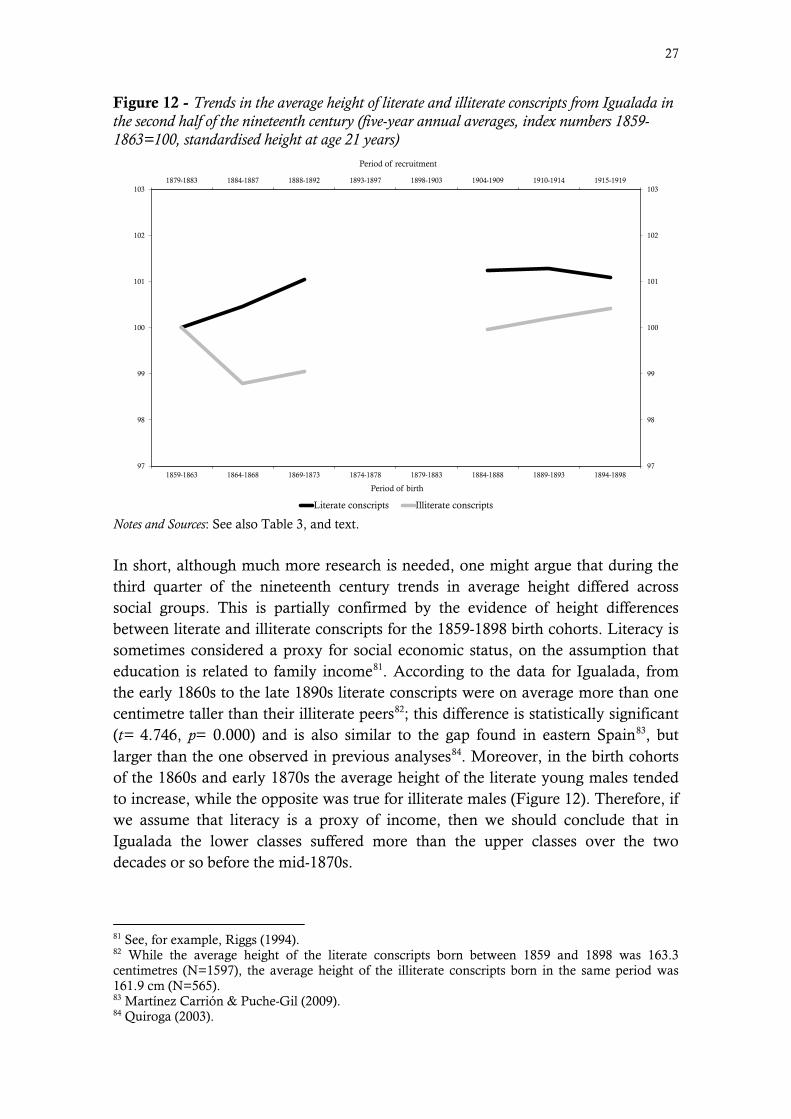
Figure 12 - Trends in the average height of literate and illiterate conscripts from Igualada in the second half of the nineteenth century (five-year annual averages, index numbers 1859-1863=100, standardised height at age 21 years)
1879-1883 1884-1887 1888-1892 1893-1897 1898-1903 1904-1909 1910-1914 1915-1919
97
98
99
100
101
102
103
97
98
99
100
101
102
103
1859-1863 1864-1868 1869-1873 1874-1878 1879-1883 1884-1888 1889-1893 1894-1898
Period of recruitment
Period of birth
Literate conscripts Illiterate conscripts
Notes and Sources: See also Table 3, and text.
In short, although much more research is needed, one might argue that during the third quarter of the nineteenth century trends in average height differed across social groups. This is partially confirmed by the evidence of height differences between literate and illiterate conscripts for the 1859-1898 birth cohorts. Literacy is sometimes considered a proxy for social economic status, on the assumption that education is related to family income81. According to the data for Igualada, from the early 1860s to the late 1890s literate conscripts were on average more than one centimetre taller than their illiterate peers82; this difference is statistically significant (t= 4.746, p= 0.000) and is also similar to the gap found in eastern Spain83, but larger than the one observed in previous analyses84. Moreover, in the birth cohorts of the 1860s and early 1870s the average height of the literate young males tended to increase, while the opposite was true for illiterate males (Figure 12). Therefore, if we assume that literacy is a proxy of income, then we should conclude that in Igualada the lower classes suffered more than the upper classes over the two decades or so before the mid-1870s.
81 See, for example, Riggs (1994). 82 While the average height of the literate conscripts born between 1859 and 1898 was 163.3 centimetres (N=1597), the average height of the illiterate conscripts born in the same period was 161.9 cm (N=565). 83 Martínez Carrión & Puche-Gil (2009). 84 Quiroga (2003).
28
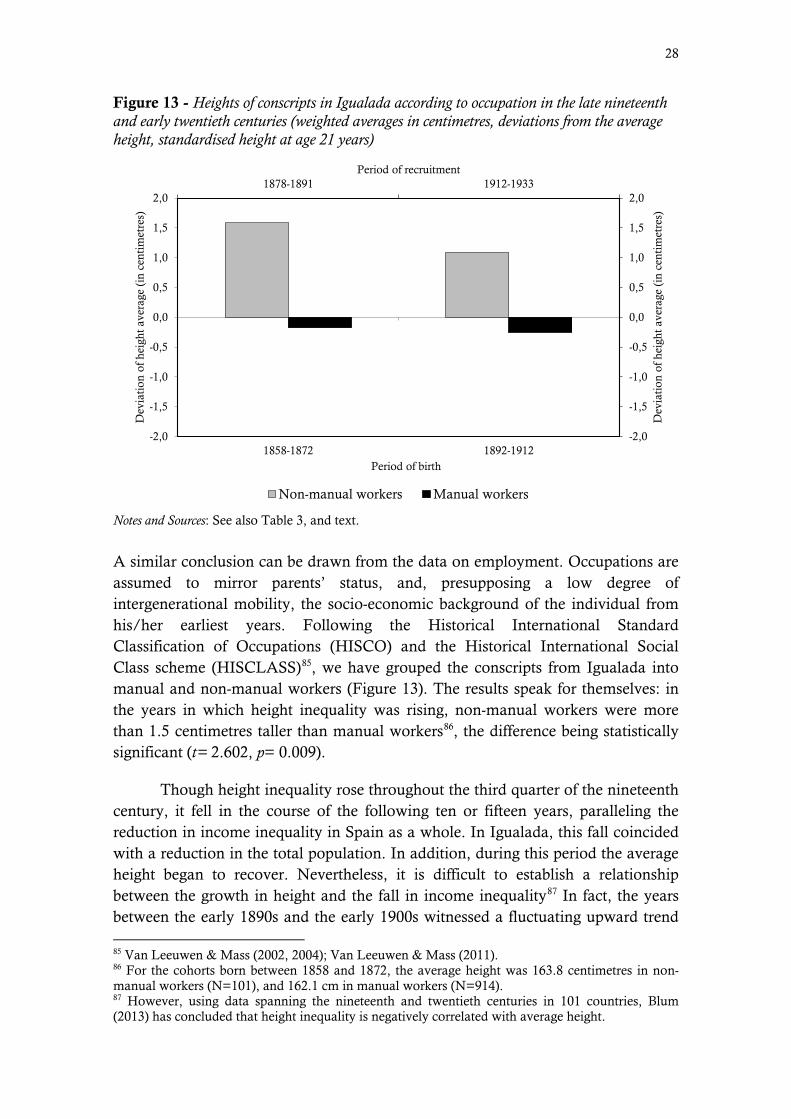
Figure 13 - Heights of conscripts in Igualada according to occupation in the late nineteenth and early twentieth centuries (weighted averages in centimetres, deviations from the average height, standardised height at age 21 years)
-2,0
-1,5
-1,0
-0,5
0,0
0,5
1,0
1,5
2,01878-1891 1912-1933
-2,0
-1,5
-1,0
-0,5
0,0
0,5
1,0
1,5
2,0
1858-1872 1892-1912
Dev
iati
on o
f hei
ght a
vera
ge (
in c
enti
met
res)
Period of recruitment
Dev
iati
on o
f hei
ght a
vera
ge (
in c
enti
met
res)
Period of birth
Non-manual workers Manual workers
Notes and Sources: See also Table 3, and text.
A similar conclusion can be drawn from the data on employment. Occupations are assumed to mirror parents’ status, and, presupposing a low degree of intergenerational mobility, the socio-economic background of the individual from his/her earliest years. Following the Historical International Standard Classification of Occupations (HISCO) and the Historical International Social Class scheme (HISCLASS)85, we have grouped the conscripts from Igualada into manual and non-manual workers (Figure 13). The results speak for themselves: in the years in which height inequality was rising, non-manual workers were more than 1.5 centimetres taller than manual workers86, the difference being statistically significant (t= 2.602, p= 0.009).
Though height inequality rose throughout the third quarter of the nineteenth century, it fell in the course of the following ten or fifteen years, paralleling the reduction in income inequality in Spain as a whole. In Igualada, this fall coincided with a reduction in the total population. In addition, during this period the average height began to recover. Nevertheless, it is difficult to establish a relationship between the growth in height and the fall in income inequality87 In fact, the years between the early 1890s and the early 1900s witnessed a fluctuating upward trend 85 Van Leeuwen & Mass (2002, 2004); Van Leeuwen & Mass (2011). 86 For the cohorts born between 1858 and 1872, the average height was 163.8 centimetres in non-manual workers (N=101), and 162.1 cm in manual workers (N=914). 87 However, using data spanning the nineteenth and twentieth centuries in 101 countries, Blum (2013) has concluded that height inequality is negatively correlated with average height.

29
in height inequality despite the rise in average height. The 1890s also ushered in a new period of economic prosperity for the city, which apparently did not reduce height inequality88. During the first years of the twentieth century height inequality fell, but it soon rose again until at least the outbreak of World War I.
To sum up, height inequality increased during the third quarter of the nineteenth century due in part to the fall in the standard of living among the lower classes. Instead, height inequality experienced a declining trend afterwards. In this respect, the case of Igualada appears to fit the Kuznets pattern on inequality quite well, at least for the cohorts of conscripts born in Igualada. Nevertheless, in the early 1890s, and again during the five or ten years before the outbreak of World War I, height inequality increased, but it never reached the levels observed in the two or three decades after 1850.
6. Conclusions
Focusing on the industrial city of Igualada, this article has aimed to shed light on the evolution of the standard of living during the early decades of industrialisation in Catalonia. By providing new evidence on the physical height of young males born prior to World War I, we show that the height of youths did not clearly improve until the cohorts born after 1870, and had worsened prior to this date. In addition, a comparative approach has suggested that for the cohorts born during the middle decades of the nineteenth century the biological standard of living was lower in Igualada than in other rural and urban areas of Catalonia. Finally, our article provides evidence that the deterioration of the living standards observed between the 1830s and the 1860s was not distributed equally across social groups. During the third quarter of the nineteenth century, height inequality increased; between the late 1850s and the early 1870s the height of illiterate conscripts declined both in absolute terms and relative to literate conscripts, and, last but not least, for the birth cohorts between 1858 and 1873 – a period in which height inequality was rising – manual workers were more than 1.5 centimetres shorter than non-manual workers.
Though our article does not provide a conclusive explanation of these trends, we hypothesise that in Igualada the emergence of the factory system worsened the working and living conditions at least due to the increase in child labour and, above all, to the growth of the city and chronic overcrowding. Interestingly, we also show a further decline in the physical height of the cohorts born during the 1860s, a decade of industrial recession and high unemployment. Finally, we suggest that overcrowding and the industrial recession had a more negative impact among the lower classes than among the rest of the population.
88 Pascual (1991).
30
The findings summarised above are of interest for a more general debate. They provide further support for the pessimistic view of the evolution of the standard of living during the early stages of industrialisation. In fact, the decline in living standards we have found from the use of anthropometric evidence is not so far removed from the experience of areas of continental Europe which were quick to industrialise. For example, in northern Italy, heights fell by about three centimetres between the 1750s and the 1830s and probably stagnated from then until the 1860s89. In Saxony, the physical stature of young males began to decline in the middle of the 1770s, a tendency that continued up to the middle of the nineteenth century90. In the Alsacian city of Mulhouse, height dropped almost two centimetres between the early 1830s and the late 1850s91, while in the eastern Belgian commune of Verviers the fall was around three centimetres during the four first decades of the nineteenth century.92 In all these regions and cities, urbanisation had a negative impact on height; and, in the case of Saxony, increases in height (and income) inequality are recorded between the eighteenth and the nineteenth century93. In short, the case of Igualada, which is representative of the more industrialised and densely populated parts of Catalonia prior to the 1850s, mirrors quite closely the experience of areas of continental Europe that started a process of modern economic growth relatively early.
This is a work in progress and much more research is still needed. The dataset must be enlarged, while some of the hypotheses regarding the determinants of height trends and levels need to be tested. Nevertheless, the article has made it clear that in Catalonia, as in other European areas, modern economic growth was not achieved without considerable costs in terms of living standards. These costs need to be both considered and quantified in the process of analysing Catalan industrialisation. Our article represents a first step in this direction.
89 A’Hearn (2003). 90 Cinnirella (2008b). 91 Heyberger (2005). 92 Alter, Neven & Oris (2004). 93 For Germany, see also Twarog (1997), Baten & Murray (2000), Baten (2001), Ewert (2006), Lantzsch & Schuster (2009), among others; for Italy see, for example, Sanna, Floris & Cosseddu (1993), Danubio, Gruppioni & Vecchi (2003), Federico (2003) and Arcaleni (2006); and for France, see Aron, Dumont & Le Roy Ladurie (1972), Van Meerten (1990), Komlos (1993b), Weir (1997) and Heyberger (2014), among others. Further references on the evolution of the biological living standards during the early phases of modern economic growth in Europe, as well as in other continents, can be found, for example, in Steckel and Floud (1997), Komlos (1998), Komlos and Baten (1998), Haines (2004) and Steckel (2009). It is worth noting that some of the studies we have just referred to (and many others that could also be mentioned) deal with what is known as the early-industrial-growth puzzle or, in the American context, the antebellum puzzle (Komlos, 1998) – namely, the drop in height in a context of accelerated economic growth.
31
Appendix 1: Infant mortality rates in Igualada
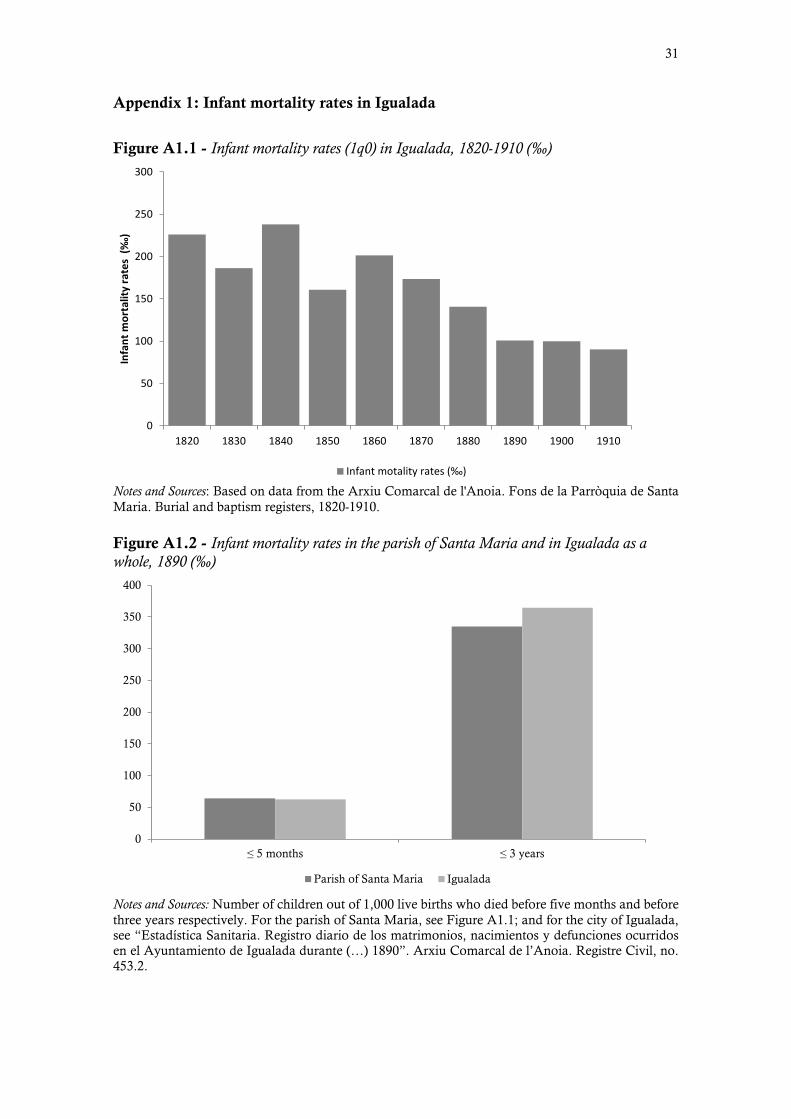
Figure A1.1 - Infant mortality rates (1q0) in Igualada, 1820-1910 (‰)
0
50
100
150
200
250
300
1820 1830 1840 1850 1860 1870 1880 1890 1900 1910
Infa
nt m
orta
lity
rate
s (‰
)
Infant motality rates (‰)
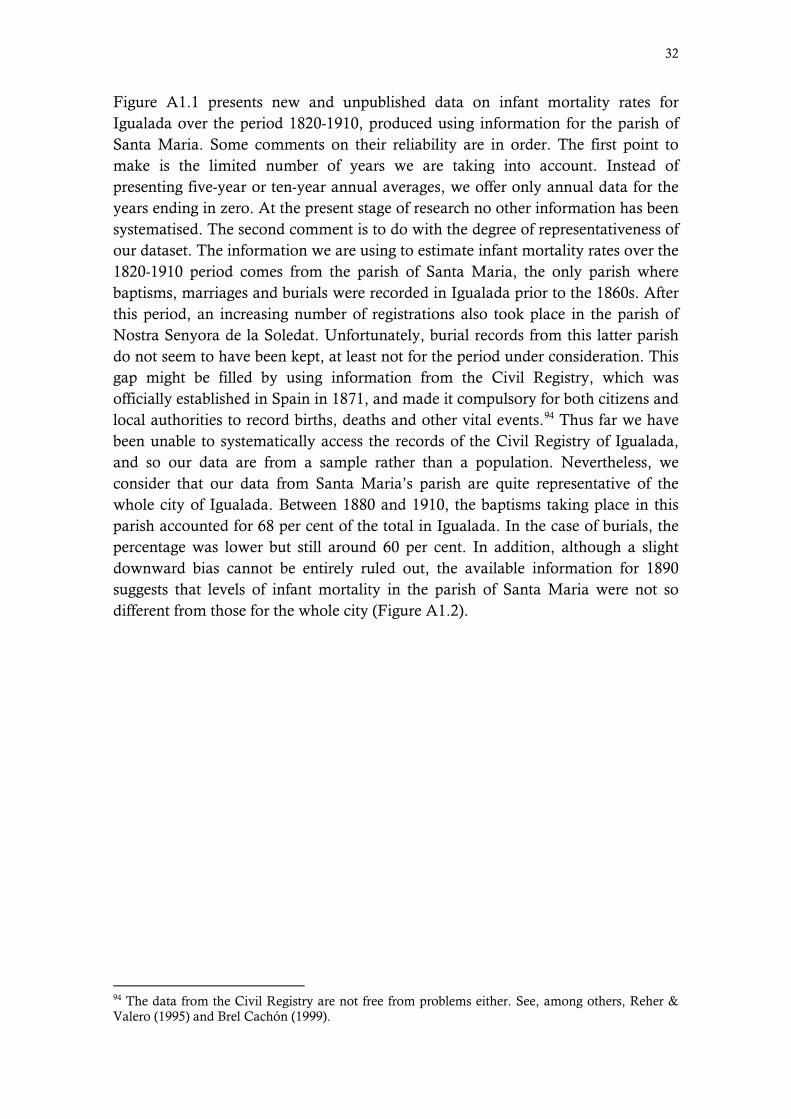
Notes and Sources: Based on data from the Arxiu Comarcal de l'Anoia. Fons de la Parròquia de Santa Maria. Burial and baptism registers, 1820-1910. Figure A1.2 - Infant mortality rates in the parish of Santa Maria and in Igualada as a whole, 1890 (‰)
0
50
100
150
200
250
300
350
400
≤ 5 months ≤ 3 years
Parish of Santa Maria Igualada
Notes and Sources: Number of children out of 1,000 live births who died before five months and before three years respectively. For the parish of Santa Maria, see Figure A1.1; and for the city of Igualada, see “Estadística Sanitaria. Registro diario de los matrimonios, nacimientos y defunciones ocurridos en el Ayuntamiento de Igualada durante (…) 1890”. Arxiu Comarcal de l’Anoia. Registre Civil, no. 453.2.
32
Figure A1.1 presents new and unpublished data on infant mortality rates for Igualada over the period 1820-1910, produced using information for the parish of Santa Maria. Some comments on their reliability are in order. The first point to make is the limited number of years we are taking into account. Instead of presenting five-year or ten-year annual averages, we offer only annual data for the years ending in zero. At the present stage of research no other information has been systematised. The second comment is to do with the degree of representativeness of our dataset. The information we are using to estimate infant mortality rates over the 1820-1910 period comes from the parish of Santa Maria, the only parish where baptisms, marriages and burials were recorded in Igualada prior to the 1860s. After this period, an increasing number of registrations also took place in the parish of Nostra Senyora de la Soledat. Unfortunately, burial records from this latter parish do not seem to have been kept, at least not for the period under consideration. This gap might be filled by using information from the Civil Registry, which was officially established in Spain in 1871, and made it compulsory for both citizens and local authorities to record births, deaths and other vital events.94 Thus far we have been unable to systematically access the records of the Civil Registry of Igualada, and so our data are from a sample rather than a population. Nevertheless, we consider that our data from Santa Maria’s parish are quite representative of the whole city of Igualada. Between 1880 and 1910, the baptisms taking place in this parish accounted for 68 per cent of the total in Igualada. In the case of burials, the percentage was lower but still around 60 per cent. In addition, although a slight downward bias cannot be entirely ruled out, the available information for 1890 suggests that levels of infant mortality in the parish of Santa Maria were not so different from those for the whole city (Figure A1.2).
94 The data from the Civil Registry are not free from problems either. See, among others, Reher & Valero (1995) and Brel Cachón (1999).

33
Appendix 2: Distribution of heights of conscripts from Igualada by periods of birth, 1824-1847
Notes and sources: In our sources, the conscripts’ height for the recruitment years 1844 and 1851 is originally given in pies or feet, pulgadas or inches (12 pulgadas=1 pie), and líneas or lines (144 líneas=1 pie). These units of length have been converted to the metric system by assuming that 1 foot was equivalent to 32.48 centimetres, as proposed by Cámara (2006: 114). For the birth cohorts born prior to 1896, the heights have been standardised at the age of 21 years following the method explained later in this section. See also Table 3 and text. References
A’Hearn, Brian (2003), “Anthropometric Evidence on Living Standards in Northern Italy, 1730-1860”, Journal of Economic History, 63(2), pp. 351-381.
Allen, Robert C. (2009), “Engels’ Pause: Technical Change, Capital Accumulation, and Inequality in the British Industrial Revolution”, Explorations in Economic History, 46 (4), pp. 418-435.
Alter, George, Muriel Neven & Michel Oris (2004), “Stature in transition – a micro-level study from nineteenth century Belgium”, Social Science History, 28 (2), 231–247.
Arcaleni, Emilia (2006), “Secular trend and regional differences in the stature of Italians, 1854-1980”, Economics and Human Biology, 4 (1), pp. 24-38.
Aron, Jean P.; Paul Dumont, & Emmanuel LeRoy Ladurie (1972), Anthropologie du conscrit français, d'après les comptes numériques et sommaires du recrutement de l'armée (1819-1826), Paris, Mouton.
Ayuda, María-Isabel & Javier Puche-Gil (2014), “Determinants of height and biological inequality in Mediterranean Spain, 1859–1967”, Economics and Human Biology, 15 (December), 101–119.
Balcells, A. (coord.) (1980), Història dels Països Catalans. 2. De 1714 a 1975. Barcelona, EDHASA.
Baten, Jörg (2000), “Economic development and the distribution of nutritional resources in Bavaria, 1797–1839”, Journal of Income Distribution, 9 (1), pp. 89-106.
Baten, Jörg (2001), “Climate, Grain production and Nutritional Status in Southern Germany during the 19th Century”, Journal of European Economic History, 30 (1), pp. 9-47.
Descriptive Statistics Number of heights: 251 Minimum height: 140.6 centimetres Maximum height: 189.6 centimetres Mean height: 162.8 centimetres Median height: 162.6 centimetres Skewness: 0.513 Standard deviation: 6.935
Descriptive Statistics Number of heights: 58 Minimum height: 161.3 centimetres Maximum height: 180.0 centimetres Mean height: 166.3 centimetres Median height: 164.4 centimetres Skewness: 2.410 Standard deviation: 3.945
Period of birth, 1824-1833 Period of birth, 1843-1847
34
Baten, Jörg & John E. Murray (2000), “Heights of Men and Women in 19th-Century Bavaria: Economic, Nutritional, and Disease influences”, Explorations in Economic History, 37 (4), pp. 351–369.
Baten, Jörg & Uwe Fraunholz (2004), “Did Partial Globalization Increase Inequality? The Case of the Latin American Periphery, 1950–2000”, CESifo Economic Studies, 50 (1), pp. 45–84.
Benaul, Josep Maria (1991), “La indústria tèxtil llanera a Catalunya, 1750-1870. El procés d’industrialització al districte industrial de Sabadell-Terrassa”. Unpublished PhD Thesis. Bellaterra: Universitat Autònoma de Barcelona.
Blum, Matthias (2013), “The influence of inequality on the standard of living: Worldwide anthropometric evidence from the 19th and 20th centuries”, Economics and Human Biology, 11 (4), pp. 436-452.
Blum, Matthias (2014), “Estimating male and female height inequality”, Economics & Human Biology, 14 (July), pp. 103-108.
Brel Cachón, María Pilar (1999), “Comparación de los libros parroquiales y de los registros civiles. Una aportación a la validez de las fuentes demográficas a finales del siglo XIX”, Boletín de la Asociación de Demografía Histórica, 17 (2), pp. 91-114.
Cain, Louis & Sok Chul Hong (2009), “Survival in 19th century cities: The larger the city, the smaller your chances”, Explorations in Economic History, 46 (4), pp. 450-463.
Cámara, Antonio D. (2006), “Fuentes antropométricas en España: problemas metodológicos para los siglos XVIII y XIX”, Historia Agraria. Revista de Agricultura e Historia Rural, 38, pp. 105-118.
Cámara, Antonio D. (2009), “Long-term Trends in Height in Rural Eastern Andalusia”, Historia Agraria. Revista de Agricultura e Historia Rural, 47, pp. 45-67.
Camps, Enriqueta (1995), La formación del mercado de trabajo industrial en la Cataluña del siglo XIX, Madrid, Ministerio de Trabajo y Seguridad Social.
Carson, Scott A. (2013), “Differences in body mass indices for males imprisoned in the 19th century American South”, Journal of Bioeconomics, 15 (1), pp 1-16.
Cinnirella, Francesco (2008a), “Optimists or pessimists? A reconsideration of nutritional status in Britain, 1740–1865”, European Review of Economic History, 12 (3), pp. 325-354.
Cinnirella, Francesco (2008b), “On the road to industrialization: nutritional status in Saxony, 1690–1850”, Cliometrica, 2 (3), pp 229-257.
Costa, Dora, L. (2013), “Health and the Economy in the United States, from 1750 to the Present”, NBER Working Paper, n. 19685.
Clark, Gregory (1994), “Factory Discipline”, Journal of Economic History, 54 (1), pp. 128-63.
Comisión de Estadística General del Reino (1858), Censo de la población de España, según el recuento verificado por la Comisión en 21 de mayo de 1857, Madrid.
Danubio, M. E., Gruppioni, G. & Vecchi, F. (2003), “Height and secular trend in conscripts born in the Central Apennines (Italy), 1865–1972”, Annals of Human Biology, 30 (2), pp. 225–331.
Domènech, Jordi (2007), “Working hours in the European periphery: The length of the working day in Spain, 1885-1920”, Explorations in Economic History, 44 (3), pp. 469-486.
Domènech, Jordi (2008), “Labour market adjustment a hundred years ago: the case of the Catalan textile industry, 1880–1913”, Economic History Review, 61 (1), pp. 1-25.
35
Escudero, Antonio (2002): “Volviendo a un viejo debate: el nivel de vida de la clase obrera británica durante la Revolución Industrial”, Revista de Historia Industrial, 21, pp. 13-60.
Escudero, Antonio & Roser Nicolau (2014), “Urban penalty: nuevas hipótesis y caso español (1860-1920)”, Historia Social, 80 (3), pp. 9-33.
Escudero, Antonio & Pedro María Pérez Castroviejo (2010), “The living standard of miners in Biscay (1876-1936): wages, the human development index and height”, Revista de Historia Económica - Journal of Iberian and Latin American Economic History, 28 (3), pp. 503-534.
Ewert, Ulf Christian (2006), “The biological standard of living on the decline: episodes from Germany during early industrialisation”, European Review of Economic History, 10 (1), pp. 51-88.
Federico, Giovanni (2003), “Heights, calories and welfare: a new perspective on Italian industrialization, 1854–1913”, Economics and Human Biology, 1 (3), pp. 289–308.
Feinstein, Charles H. (1998), “Pessimism Perpetuated: Real Wages and the Standards of Living in Britain during and after the Industrial Revolution”, Journal of Economic History, 58 (3), pp. 625-658.
Floud, Roderick; Kenneth Wachter & Annabel Gregory (1990), Height, Health and History: Nutritional Status in the United Kingdom, 1750-1980, Cambridge, Cambridge University Press.
Floud, Roderick; Robert W. Fogel, Bernard Harris & Sok Chul Hong (2011), The Changing Body. Health, Nutrition, and Human Development in the Western World since 1700, Cambridge, Cambridge University Press.
Freixa y Rabasó, Eusebio (1867), Guía de quintas: dedicada a los alcaldes y secretarios de Ayuntamientos, Madrid, Imprenta de C. Moliner y Compañía, Fourth edition.
García Gómez, José Joaquín & Salvador Salort i Vives (2014), “La reforma sanitaria en Alcoi (1836-1914): industrialización, urbanización, fallors de mercado e intervención pública”, Historia Social, 80 (3), pp. 95-112.
García i Balañà, Albert (2004), La fabricació de la fàbrica. Treball i política a la Catalunya cotonera (1784-1874), Barcelona, Ajuntament d’Igualada - Publicacions de l’Abadia de Montserrat.
Giménez Guited, Francisco (1862), Guía fabril e industrial de España, publicada con el apoyo y autorización de S.M, Madrid / Barcelona, Librería Española / Librería del Plus Ultra.
Guntupalli, Aravinda Meera & Joerg Baten (2006), “The development and inequality of heights in North, West, and East India 1915–1944”, Explorations in Economic History, 43 (4), pp. 578-608.
Haines, Michael R. (2004), “Growing Incomes, Shrinking People –Can Economic Development Be Hazardous to Your Health?”, Social Science History, 28 (2), pp. 249-270.
Heyberger, L. (2005), La révolution des corps. Décroissance et croissance staturale des habitants des villes et des campagnes en France, 1780-1940, Strasbourg & Belfort, Presses Universitaires de Strasbourg & Université de Technologie Belfort-Montbéliard.
Hernández, Ricardo & Javier Moreno-Lázaro (2009), “El nivel de vida en el medio rural de Castilla y León. Una constatación antropométrica”, Historia Agraria. Revista de Agricultura e Historia Rural, 47, pp. 143-166.
Hernández, Ricardo & Javier Moreno-Lázaro (2011), “Industrialización, desindustrialización y niveles de vida en las ciudades de Castilla y León, 1840-1935. Indicadores antropométricos y demográficos”, Historia Social, 69, pp. 25-48.
36
Hiermeyer, Martin (2010), “Height and BMI values of German conscripts in 2000, 2001 and 1906”, Economics and Human Biology, 7 (3), pp. 366–375.
Huck, Paul (1994), “Infant Mortality in Nine Industrial Parishes in Northern England, 1813-1836”, Population Studies, 48 (3), pp. 513-526.
Huck, Paul (1995), “Infant Mortality and Living Standards of English Workers during the Industrial Revolution”, Journal of Economic History, 55 (3), pp. 528-550.
Humphries, Jane (2010), Childhood and Child Labour in the British Industrial Revolution, Cambridge, Cambridge University Press.
Komlos, John (1985), “Stature and Nutrition in the Habsburg Monarchy: The Standard of Living and Economic Development in the Eighteenth Century”, American Historical Review, 90 (5), pp. 1149-1161.
Komlos, John (1989), Nutrition and economic development in the eighteenth-century Habsburg Monarchy. Princeton, Princeton University Press.
Komlos, John (1990), ‘‘Height and Social Status in Eighteenth-Century Germany”, Journal of Interdisciplinary History, 20 (4), pp. 607–621.
Komlos, John (1993a), “The Secular Trend in the Biological Standard of Living in the United Kingdom, 1730-1860”, Economic History Review, 46 (1), pp. 115-144.
Komlos, John (1993b),”The Nutritional Status of French Students”, Journal of Interdisciplinary History, 24 (3), pp. 493-508.
Komlos, John (1998), “Shrinking in a Growing Economy? The Mystery of Physical Stature during the Industrial Revolution”, Journal of Economic History, 58 (3), pp. 779-802.
Komlos, John (2004), “How to (and How not to) Analyze Deficient Height Size Samples”, Historical Methods, 37 (4), pp.160-173.
Komlos, John (2007), “On English pygmies and giants: the physical stature of English youth in the late 18th and early 19th centuries”, Research in Economic History, 25, pp.149-168.
Komlos, John & Joerg Baten (1998) (eds.), The Biological Standard of Living in Comparative Perspective, Stuttgart, Franz Steiner Verlag.
Komlos, John & Marek Brabec (2010), “The Trend of BMI Values by Deciles of US Adults, birth cohorts 1882-1986”, NBER Working Paper, no. 16252.
Kuh, Diana L.; Chris Power & Bryan Rodgers (1991), ‘‘Secular trends in social class and sex differences in adult height’’, International Journal of Epidemiology, 20 (4), pp. 1001–1009.
Kuznets, Simon (1955), “Economic Growth and Income Inequality”, American Economic Review, 45 (1), pp. 1-28.
Kuznets, Simon (1966), Modern Economic Growth, New Haven, Yale University Press.
Lantzsch, Jana & Klaus Schuster (2009), “Socioeconomic status and physical stature in 19th-century Bavaria”, Economics and Human Biology, 7 (1), pp. 46–54.
Lindert, Peter H. & Jeffrey G. Williamson (1982), “Revising England’s social tables, 1688-1913”, Explorations in Economic History, 19 (4), pp. 385-408.
Marfany, Julie (2005), “La crisis de mortalidad en una comunidad catalana, Igualada, 1680-1819”, Revista de Demografía Histórica, 23 (2), pp. 13-41.
Marfany, Julie (2010), “Is it still helpful to talk about protoindustrialization? Some suggestions from a Catalan case study”, Economic History Review, 63 (4), pp. 942–973.
37
María-Dolores, Ramón & José Miguel Martínez-Carrión (2011), “The relationship between height and economic development in Spain, 1850-1958”, Economics and Human Biology, 9 (1), pp. 30-44.
Martínez de Presno, Jorge P. (1993), Moviments socials a Igualada al segle XIX (anys 1854-1890), Barcelona, Ajuntament d’Igualada/Publicacions de l’Abadia de Montserrat.
Martínez-Carrión, José Miguel (2002) (ed.), El nivel de vida en la España Rural, siglos XVIII-XX, Alacant, Publicaciones de la Universidad de Alicante.
Martínez-Carrión, José Miguel (2012), “La talla de los europeos, 1700-2000: ciclos, crecimiento y desigualdad”, Investigaciones de Historia Económica, 8 (3), pp. 176-187.
Martínez-Carrión, José-Miguel & Antonio D. Cámara (2015), “El nivel de vida biológico durante el declive de la industrialización andaluza: el caso de Antequera”, Revista de Historia Industrial, 58, pp. 129-159.
Martínez-Carrión, José-Miguel & Javier Moreno-Lázaro (2007), “Was there an urban height penalty in Spain, 1840–1913?”, Economics and Human Biology, 5 (1), pp. 144–164.
Martínez-Carrión, José-Miguel & Juan-José Pérez Castejón (1998a), “Heights and Standards of Living in Spain, 1860-1969: Evidence from the Southeastern Region”, in John Komlos and Jörg Baten (eds.), The Biological Standard of Living in Comparative Perspective, Stuttgart, Franz Steiner Verleg, pp. 344-358.
Martínez-Carrión, José-Miguel & Juan-José Pérez Castejón (1998b), “Height and standards of living during the industrialisation of Spain: The case of Elche”, European Review of Economic History, 2 (2), pp. 201-230.
Martínez-Carrión, José-Miguel & Pedro M. Pérez-Castroviejo, Javier Puche-Gil & Josep-Maria Ramon-Muñoz (2014), “La brecha rural-urbana de la estatura y el nivel de vida al comienzo de la industrialización española”, Historia Social, 80 (3), pp. 35-57.
Martínez-Carrión, José-Miguel, Miguel A. Pérez de Perceval & Ángel P. Martínez-Soto (2014), “Desigualdad y bienestar biológico durante el boom minero. Riotinto, 1836-1935”, Documentos de trabajo de la Asociación Española de Historia Económica, no. 1401.
Martínez-Carrión, José-Miguel & Javier Puche-Gil (2009), “Alfabetización, bienestar biológico y desigualdad: la Comunidad valenciana, 1850-1970”, Historia Agraria, 47, pp. 167-186.
Mokyr, Joel (1988), “Is There Still Life in the Pessimist Case? Consumption during the Industrial Revolution, 1790-1850”, Journal of Economic History, 48 (1), pp. 69-92.
Moradi, Alexander & Joerg Baten (2005), “Inequality in Sub-Saharan Africa: New Data and New Insights from Anthropometric Estimates”, World Development, 33(8), pp. 1233-1265.
Mora-Sitjà, Natàlia (2007), “Labour market integration in a pre-industrial economy: Catalonia, 1772-1816”, Oxford Economic Papers, 59 (1), pp. 156-77.
Muñoz Pradas, Francesc (1992), “Nivells i tendències de la mortalitat a les localitats del Penedès (segles XVII-XIX)”, Estudis d'Història Agrària, 9, pp. 181-202.
Nadal, Jordi (1975), El fracaso de la Revolución Industrial en España, 1814-1913, Barcelona, Ariel.
Nadal, Jordi (1985): “Catalunya, la fàbrica d’Espanya”, in Jordi Nadal & Jordi Maluquer de Motes, Catalunya, la fàbrica d’Espanya. Un segle d’industrialització catalana, 1833-1936, Barcelona, Ajuntament de Barcelona – Generalitat de Catalunya, pp. 131-135.
38
Nadal, Jordi (1991), “La indústria cotonera”, in Jordi Nadal et alii (editors), Història econòmica de la Catalunya contemporània. Segle XIX. Indústria, transports i finances, Barcelona, Enciclopèdia Catalana, pp. 13-86.
Nadal, Jordi (1992), “Demografía y economia en el origen de la Cataluña moderna. Un ejemplo local: Palamós (1705-1839)”, in Jordi Nadal, Bautismos, desposorios y entierros: Estudios de historia demográfica, Barcelona, Ariel, pp. 149-173. Originally published in Estudios de Historia Moderna, 6, 1961.
Öberg, Stefan (2014), “Long-term changes of socioeconomic differences in height among young adult men in Southern Sweden, 1818–1968”, Economics and Human Biology, 15 (December), 140–152
Pascual, Pere (1991), Fàbrica i treball a Igualada de la primera meitat del segle XX, Barcelona, Ajuntament d’Igualada - Publicacions de l’Abadia de Montserrat.
Pascual, Pere (2000), Els Torelló. Una família Igualadina d’advocats I propietaris. 1. Liberalisme, conservadorisme i canvi econòmic i social (1820-1930), Barcelona, Fundació Salvador Vives i Casajuana.
Pascual, Pere & Gemma Estrada (2006), “L'habitatge obrer a Igualada durant el segle XIX”, Miscellanea Aqualatensia. Recerques sobre la comarca de l’Anoia, 12, pp. 207-239.
Pollard, Sidney (1981), The peaceful conquest. The industrialization of Europe 1760-1970, Oxford, Oxford University Press.
Prados de la Escosura, Leandro (2008), “Inequality, poverty and the Kuznets curve in Spain, 1850–2000”, European Review of Economic History, 12 (3), pp. 287-324.
Quiroga, Gloria (2001), “Estatura, diferencias regionales y sociales y niveles de vida en España (1893-1954)”, Revista de Historia Económica, 19, pp. 175-200.
Quiroga, Gloria (2003), “Literacy, education and welfare in Spain (1893-1954)”, Paedagogica Historica: International journal of the history of education, 39 (5), pp. 599-619.
Quiroga, Gloria & Sebastián Coll (2000), “Income distribution in the mirror of height differences: the case of Spain 1895–1950”, Journal of Income Distribution, 9 (1), pp. 107-131.
Ramon-Muñoz, Josep-Maria (2009), “Bienestar biológico y crecimiento agrario en la Cataluña rural, 1840-1936”, Historia Agraria, 47, pp. 119-142.
Ramon-Muñoz, Josep-Maria (2011), “Industrialización, urbanización y bienestar biológico en Cataluña, 1840-1935: una aproximación antropométrica”, Revista de Historia Industrial, 46, pp. 41-71.
Reher, David-Sven & Ángeles Valero (1995), Fuentes de información demográfica en España. Madrid, Centro de Investigaciones Sociológicas.
Reis, Jaime (2009), “’Urban Premium’ or ‘Urban Penalty’? The Case of Lisbon, 1840-1936”, Historia Agraria, 47, pp. 69-94.
Riba, Josep (2006), “Etapes dels sanejaments privats i públics de la ciutat d’Igualada”, Miscellanea Aqualatensia. Recerques sobre la comarca de l’Anoia, 12, pp. 323-352.
Riggs, Paul (1994), “The Standard of Living in Scotland, 1800-1850”, in John Komlos (ed.), Stature, Living Standards and Economic Development. Essays in Anthropometric History, Chicago, The University of Chicago Press, pp. 60-75.
Rosés, Joan Ramon; Julio Martínez-Galarraga & Daniel A. Tirado (2010), “The upswing of regional income inequality in Spain (1860-1930)”, Explorations in Economic History, 47 (2), pp. 244-257.
39
Sánchez, Alejandro (1989), “La era de la manufactura algodonera en Barcelona, 1736-1839”, Estudis d’Historia Social, 48-49, pp. 65-113.
Sánchez, Alejandro (2000), “Crisis económica y respuesta empresarial. Los inicios del sistema fabril en la industria algodonera catalana, 1797-1839”, Revista de Historia Económica, 18, pp. 485-523.
Sanna, E., G. Floris & G. G. Cosseddu (1993), “Secular trend in height in Sardinian conscripts drafted from 1879-1883 to 1983-1986”, Anthropologischer Anzeiger, 51 (3), pp. 225-232.
Schoch, Tobias; Kaspar Staub & Christian Pfister (2012), “Social inequality and the biological standard of living: An anthropometric analysis of Swiss conscription data, 1875–1950”, Economics and Human Biology, 10 (2), pp. 154–173.
Steckel, Richard H. (1995), “Stature and the standard of living”, Journal of Economic Literature, 33 (4), pp. 1903–1940.
Steckel, Richard H. (2009), “Heights and human welfare: recent developments and new directions”, Explorations in Economic History, 46(1), pp. 1-23.
Steckel, Richard H. & Roderick Floud (1997), “Introduction”, in Richard H. Steckel & Roderick Floud (eds.), Health and Welfare during Industrialization. Chicago: University of Chicago Press, pp. 1-17
Szreter, Simon & Graham Mooney (1998), “Urbanization, Mortality, and the Standard of Living Debate: New Estimates of the Expectation of Life at Birth in Nineteenth-Century British Cities”, Economic History Review, LI (1), pp. 84-112.
Thompson, Edward P. (1967), “Time, Work-Discipline, and Industrial Capitalism”, Past and Present, 38 (1), pp. 56-97.
Thomson, J.K.J. (1992), A distinctive industrialization. Cotton in Barcelona, 1728-1832, Cambridge, Cambridge University Press.
Torras i Ribé, Josep Maria (1974), “Trajectòria d’un procés d’industrialització frustrat”, Miscellanea Aqualatensia, 2, pp. 151-97.
Torras i Ribé, Josep Maria (1979), La revolució industrial a la comarca de l’Anoia. Barcelona: Rafael Dalmau, Editor.
Torras i Ribé, Josep Maria (1986), “Igualada”, in Josep Maria Torras i Ribé (ed.): Historia de l'Anoia. Volum 1, Manresa, Parcir, pp. 33-187.
Torras, Jaume (1984), “Especialización agrícola e industria rural en Cataluña en el siglo XVIII”, Revista de Historia Económica, 2 (3), pp. 113-127.
Torras, Jaume (1987), “Fabricants sense fàbrica. Estudi d'una empresa llanera d'Igualada (1726-1765)”, Recerques, 11, pp. 144-160.
Torras, Jaume (1988), “L’economia catalana abans del 1800. Un esquema”, in Jordi Nadal et alii (eds.), Història econòmica de la Catalunya contemporània. Segle XIX. La formació d’una societat industrial, Barcelona, Enciclopèdia Catalana, pp. 14-38.
Torras, Jaume (1991), “The old and the new. Marketing networks and textile growth in eighteenth-century Spain”, in Maxine Berg (editor): Markets and manufacture in early industrial Europe, London, Routledge, pp. 93-113.
Torras, Jaume (1992), “Gremio, familia y cambio económico. Pelaires y tejedores en Igualada, 1695-1769”, Revista de Historia Industrial, 2, pp. 11-30.
Torras, Jaume (2006), Fabricants sense fàbrica. Els Torelló, d’Igualada (1691–1794), Vic, Eumo.

40
Twarog, Sophia (1997), “Heights and Living Standards in Germany, 1850-1939: The Case of Wurttemberg”, in Richard Steckel & Roderick Floud (eds.) (1997), Health and Welfare during Industrialization, Chicago, University of Chicago Press, pp. 285-330.
Valls, Francesc (2004), La Catalunya atlàntica. Aiguardent i teixits a l’arrencada industrial catalana, Vic, Eumo Editorial.
Van Leeuwen, Marco H. D. & Ineke Mass (2002), HISCO. Historical International Standard Classification of Occupations, Leuven, Leuven University Press.
Van Leeuwen, Marco H. D. & Ineke Mass (2004), “Creating a Historical International Standard Classification of Occupations: An Exercise in Multinational, Interdisciplinary Cooperation”, Historical Methods, 37, pp. 186-197.
Van Leeuwen, Marco H. D. & Ineke Mass (2011), HISCLASS. A historical international social class scheme. Leuven: Leuven University Press.
Van Meerten, Michiel A. (1990), “Développement économique et stature en France, XIXe-XXe siècles”, Annales. Économies, Sociétés, Civilisations, 45 (3), pp. 755-777.
Vilar, Pierre (1962), La Catalogne dans l'Espagne moderne. Recherches sur les fondements économiques des structures nationales. Tomes I-III, Paris, S.E.V.P.E.N.
Voth, Hans-Joachim (1998), “Time and Work in Eighteenth-Century London”, Journal of Economic History, 58 (1), pp. 29-58.
Voth, Hans-Joachim (2001), "The Longest Years - New Estimates of Labor Input in England, 1760-1830”, Journal of Economic History, 61 (4), pp. 1065-1082.
Voth, Hans-Joachim (2003), “Living Standards during the Industrial Revolution: An Economist's Guide”, American Economic Review, 93 (2), pp. 221-226.
Voth, Hans-Joachim (2004), “Living Standards and the Urban Environment”, in Roderick Floud and Paul Johnson (eds.), The Cambridge Economic History of Modern Britain. Volume 1. Industrialisation, 1700-1860, Cambridge, Cambridge University Press, pp. 268-94.
Weir, David R. (1997), “Economic welfare and physical well-being in France, 1750–1990”, in Richard H. Steckel & Roderick Floud (eds.), Health and welfare during industrialization. University of Chicago Press, Chicago, pp 161–200.
Williamson, Jeffrey G. (1985), Did British Capitalism Breed Inequality? Boston, Allen & Unwin.
Williamson, Jeffrey G. (1990), Coping with City Growth during the British Industrial Revolution, Cambridge, Cambridge University Press.