Embed Size (px)
Citation preview
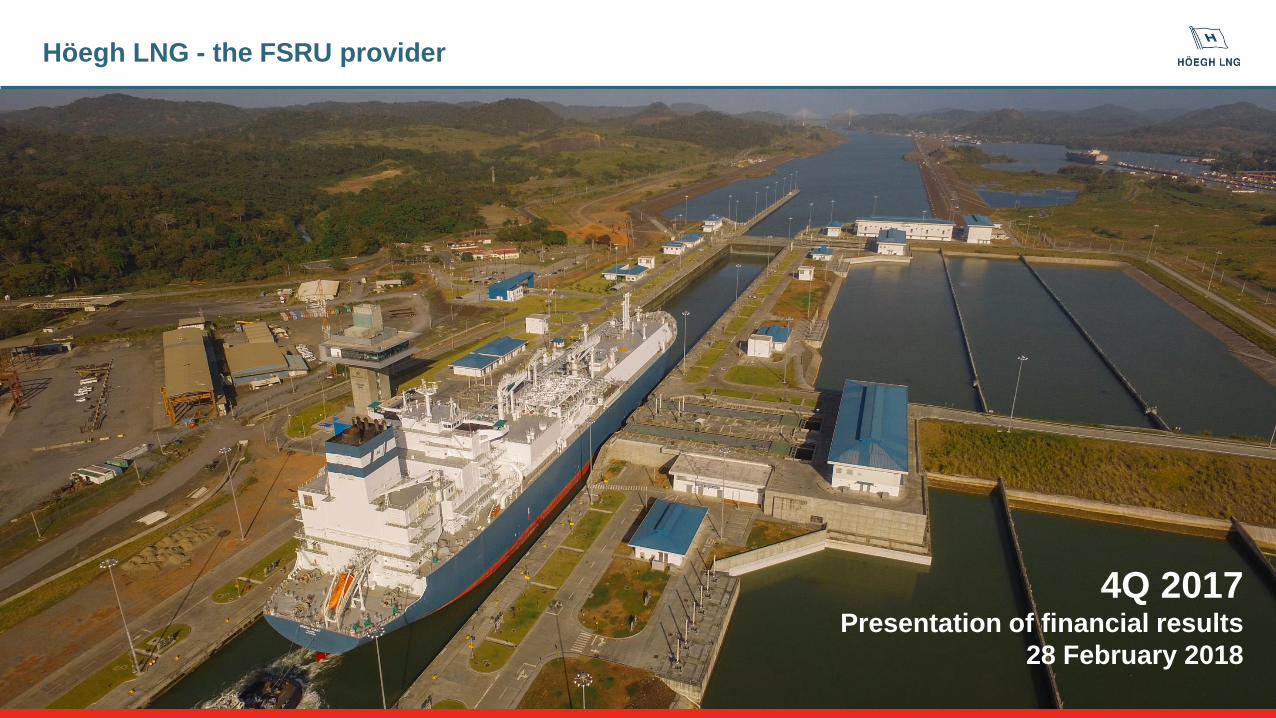
Höegh LNG - the FSRU provider
1
4Q 2017Presentation of financial results
28 February 2018
Forward looking statements
2
This presentation contains forward-looking statements which reflects management’s current expectations, estimates and projections about Höegh LNG’s
operations. All statements, other than statements of historical facts, that address activities and events that will, should, could or may occur in the future are
forward-looking statements. Words such as “may,” “could,” “should,” “would,” “expect,” “plan,” “anticipate,” “intend,” “forecast,” “believe,” “estimate,” “predict,”
“propose,” “potential,” “continue” or the negative of these terms and similar expressions are intended to identify such forward-looking statements. These
statements are not guarantees of future performance and are subject to certain risks, uncertainties and other factors, some of which are beyond our control and
are difficult to predict. Therefore, actual outcomes and results may differ materially from what is expressed or forecasted in such forward-looking statements.
You should not place undue reliance on these forward-looking statements, which speak only as of the date of this presentation. Unless legally required, Höegh
LNG undertakes no obligation to update publicly any forward-looking statements whether as a result of new information, future events or otherwise.
Among the important factors that could cause actual results to differ materially from those in the forward-looking statements are: changes in LNG transportation
and regasification market trends; changes in the supply and demand for LNG; changes in trading patterns; changes in applicable maintenance and regulatory
standards; political events affecting production and consumption of LNG and Höegh LNG’s ability to operate and control its vessels; change in the financial
stability of clients of the Company; Höegh LNG’s ability to win upcoming tenders and securing employment for the FSRUs on order; changes in Höegh LNG’s
ability to convert LNG carriers to FSRUs including the cost and time of completing such conversions; changes in Höegh LNG’s ability to complete and deliver
projects awarded; changes to the Company’s cost base; changes in the availability of vessels to purchase; failure by yards to comply with delivery schedules;
changes to vessels’ useful lives; changes in the ability of Höegh LNG to obtain additional financing, including the impact from changes in financial markets;
changes in the ability to achieve commercial success for the projects being developed by the Company; changes in applicable regulations and laws; and
unpredictable or unknown factors herein also could have material adverse effects on forward-looking statements.

Agenda
3
▪ Highlights
▪ Operational update
▪ Market update
▪ Financials
▪ Summary
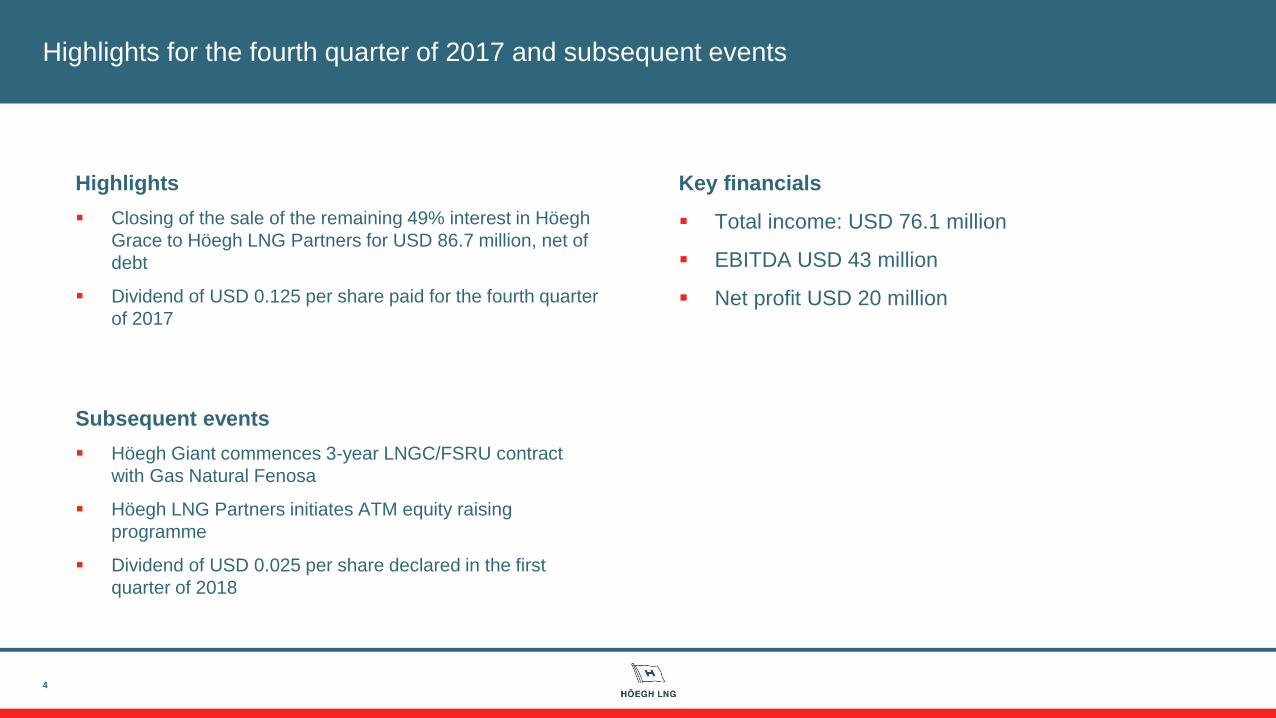
Highlights for the fourth quarter of 2017 and subsequent events
Key financials
▪ Total income: USD 76.1 million
▪ EBITDA USD 43 million
▪ Net profit USD 20 million
4
Highlights
▪ Closing of the sale of the remaining 49% interest in Höegh
Grace to Höegh LNG Partners for USD 86.7 million, net of
debt
▪ Dividend of USD 0.125 per share paid for the fourth quarter
of 2017
Subsequent events
▪ Höegh Giant commences 3-year LNGC/FSRU contract
with Gas Natural Fenosa
▪ Höegh LNG Partners initiates ATM equity raising
programme
▪ Dividend of USD 0.025 per share declared in the first
quarter of 2018

Agenda
5
▪ Highlights
▪ Operational update
▪ Market update
▪ Financials
▪ Summary
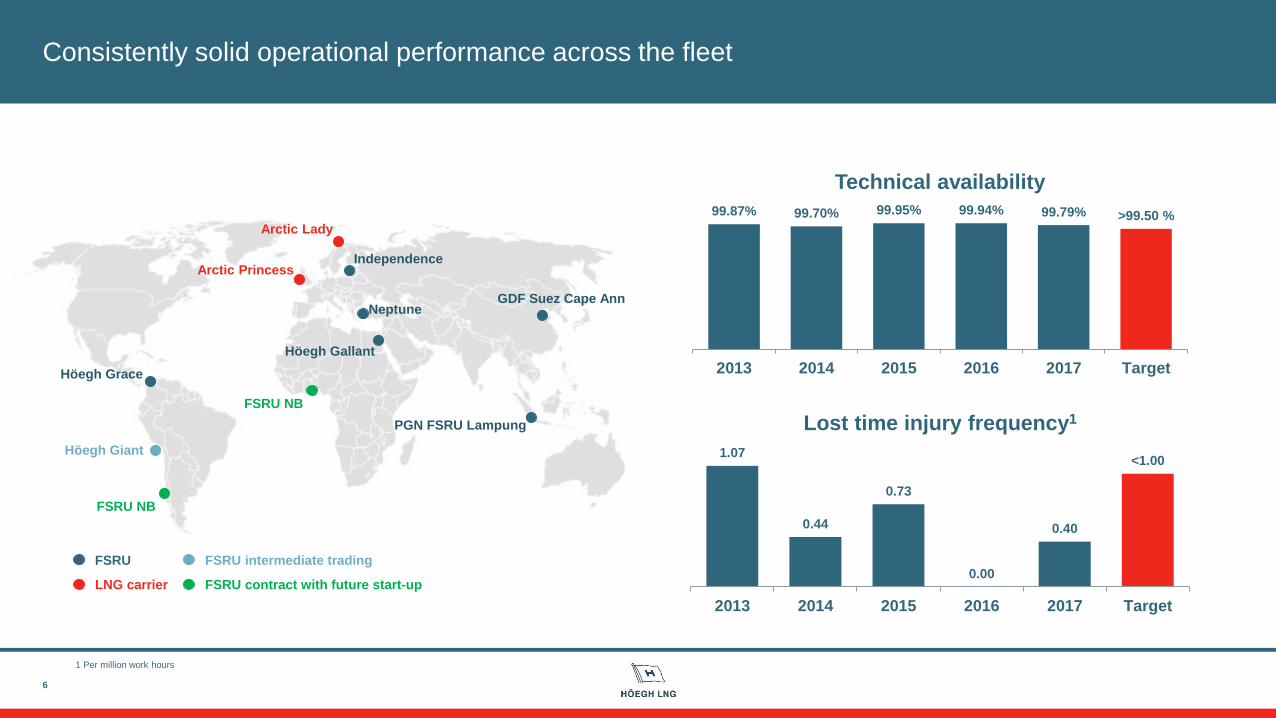
Consistently solid operational performance across the fleet
6
GDF Suez Cape Ann
PGN FSRU Lampung
Neptune
Independence
Höegh Grace
Höegh Giant
Arctic Princess
Arctic Lady
Höegh Gallant
FSRU NB
FSRU intermediate trading
LNG carrier
FSRU
FSRU contract with future start-up
99.87% 99.70% 99.95% 99.94% 99.79% >99.50 %
2013 2014 2015 2016 2017 Target
Technical availability
1.07
0.44
0.73
0.00
0.40
<1.00
2013 2014 2015 2016 2017 Target
Lost time injury frequency1FSRU NB
1 Per million work hours
Project execution update
GNL Penco, Chile
▪ The GNL Penco FSRU project continues its revised
environmental approval process, in accordance with GNL
Penco’s plans
▪ Solid commercial platform given GNL Penco’s long-term
contract to deliver electricity to the Chilean market
Quantum Power, Ghana
▪ Quantum power/Höegh LNG FSRU solution represents the
fastest way for Ghana to access LNG markets
▪ Remains subject to government approval
7
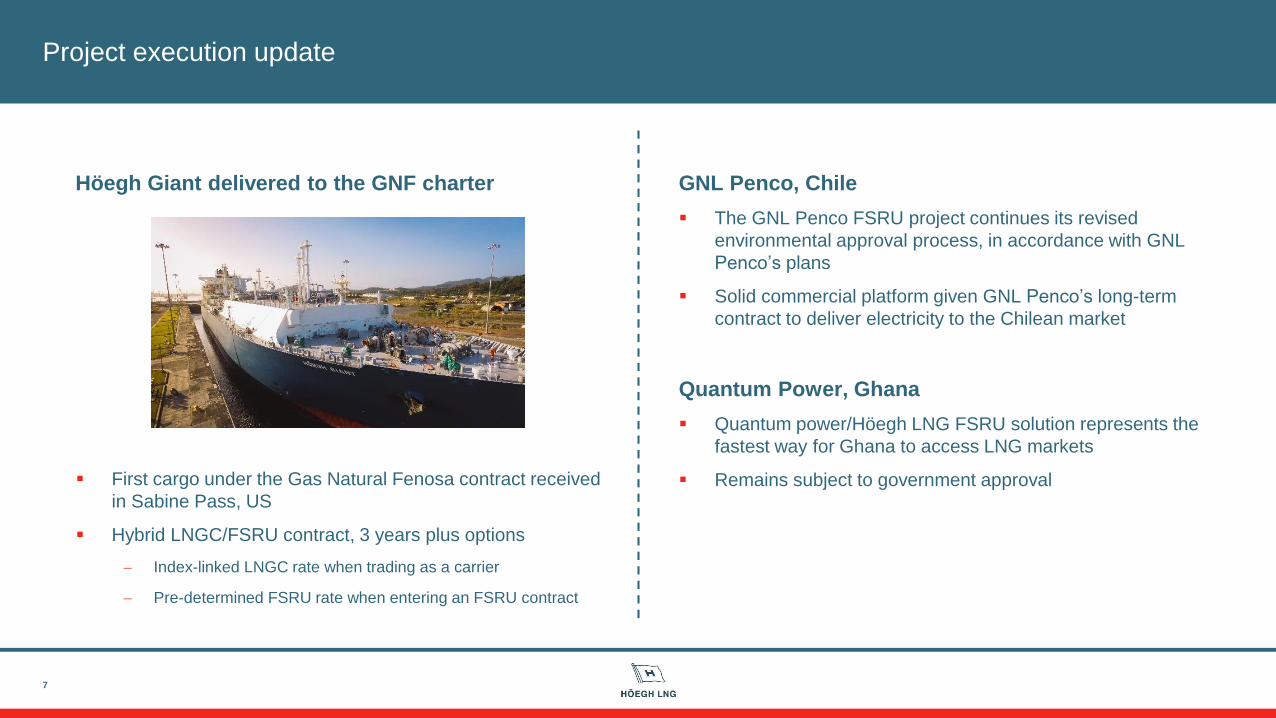
▪ First cargo under the Gas Natural Fenosa contract received
in Sabine Pass, US
▪ Hybrid LNGC/FSRU contract, 3 years plus options
Index-linked LNGC rate when trading as a carrier
Pre-determined FSRU rate when entering an FSRU contract
Höegh Giant delivered to the GNF charter
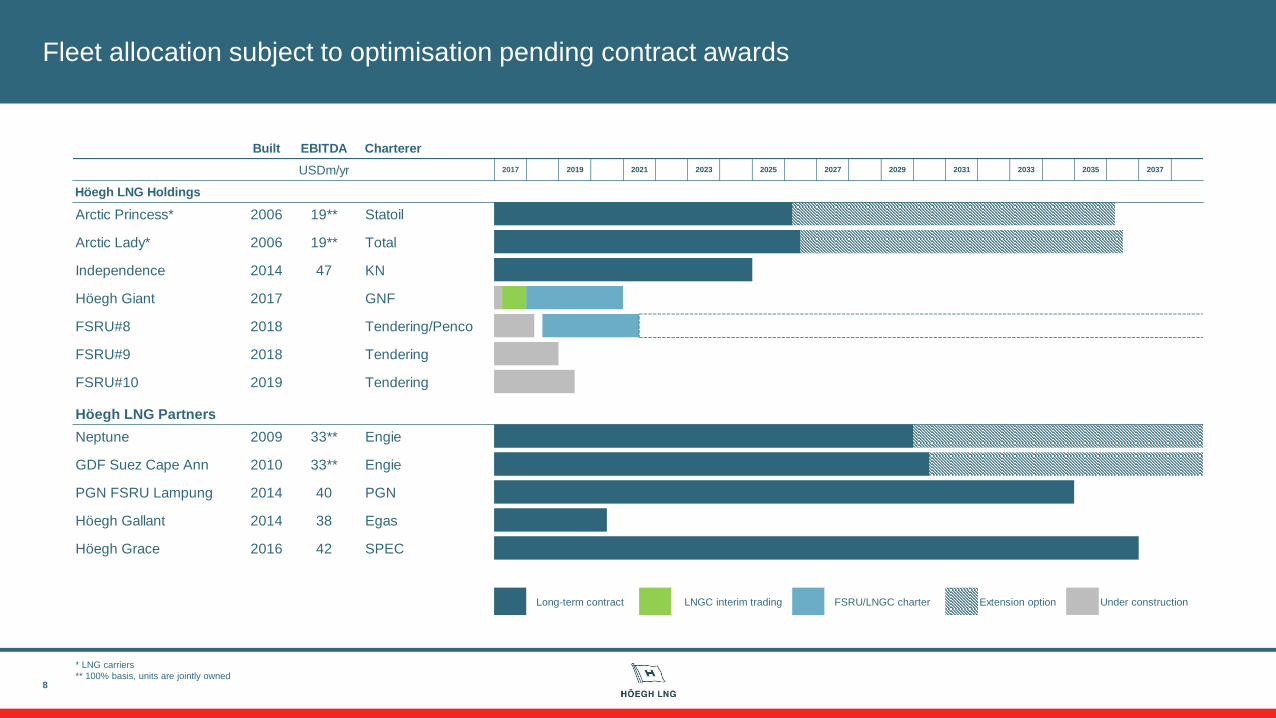
Fleet allocation subject to optimisation pending contract awards
8
* LNG carriers
** 100% basis, units are jointly owned
Built EBITDA Charterer
USDm/yr 2020 2022 2024 2026 2028 2030 2032 2034 2036 2038
Höegh LNG Holdings
Arctic Princess* 2006 19** Statoil
Arctic Lady* 2006 19** Total
Independence 2014 47 KN
Höegh Giant 2017 GNF
FSRU#8 2018 Tendering/Penco
FSRU#9 2018 Tendering
FSRU#10 2019 Tendering
Höegh LNG Partners
Neptune 2009 33** Engie
GDF Suez Cape Ann 2010 33** Engie
PGN FSRU Lampung 2014 40 PGN
Höegh Gallant 2014 38 Egas
Höegh Grace 2016 42 SPEC
Long-term contract LNGC interim trading FSRU/LNGC charter Extension option Under construction
2017 2019 2021 2023 2025 2027 2029 2031 2033 2035 2037

Increasing business development activity
9
▪ In discussions for interim employment for FSRU #8 from
mid-2018 until start-up under the contract with GNL Penco
in Chile
▪ Main commercial focus on securing long-term employment
for FSRU #9 and #10, which deliver in December 2018 and
May 2019 respectively
▪ Currently involved in several advanced tendering
processes with decisions expected in 2018
▪ Business development activity continues to increase
Coinciding with LNG trade exceeding expectations
New tenders being launched
Ongoing tender processes picking up momentum
LNG net exports, 2017 y/y growth vs expectations
Source: Shell LNG outlook 2018

Agenda
10
▪ Highlights
▪ Operational update
▪ Market update
▪ Financials
▪ Summary

LNG trade up 11% in 2017
11
0
50
100
150
200
250
300
350
2010 2011 2012 2013 2014 2015 2016 2017
mtp
a
LNG trade by exporter
Qatar MEG ex Qatar Africa Asia Australia USA South America Europe
0
50
100
150
200
250
300
350
2010 2011 2012 2013 2014 2015 2016 2017
mtp
a
LNG trade by importer
Japan+Korea China RoA MEG Africa Europe North America South America
Australia
and US
volumes
Chinese
imports
exceeding
South
korea
Source: Waterborne LNG, IHS Markit
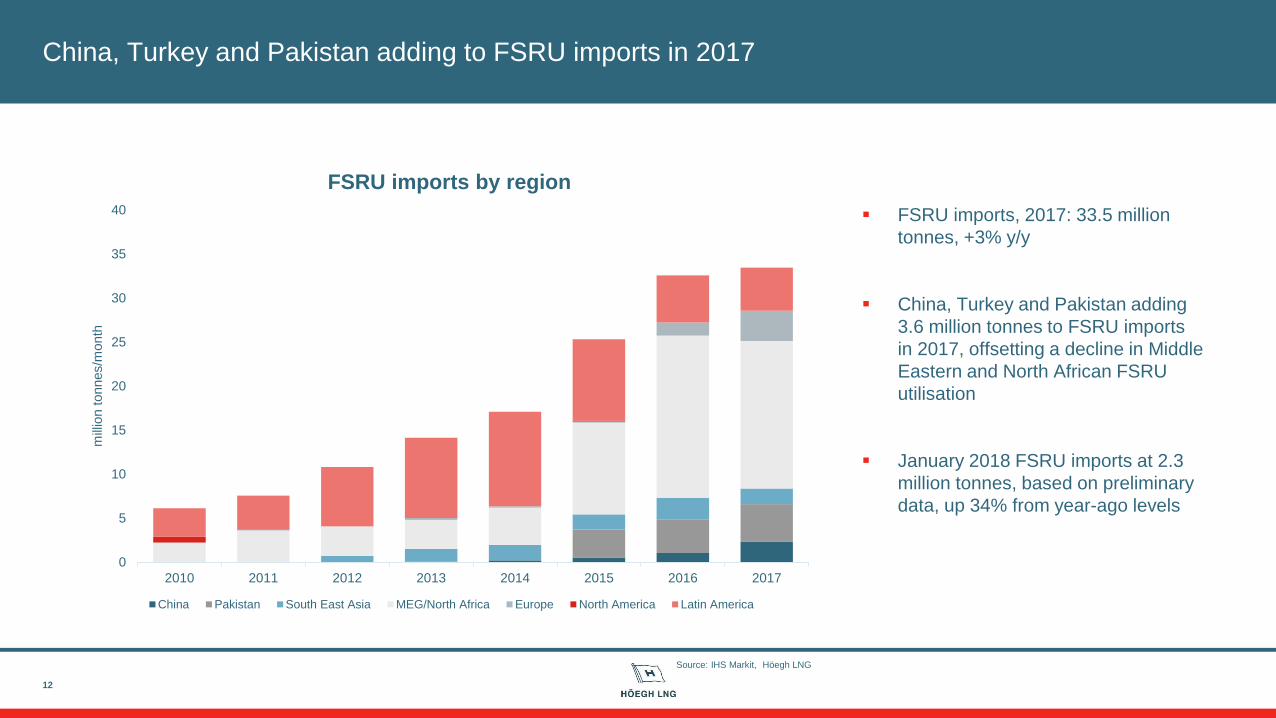
China, Turkey and Pakistan adding to FSRU imports in 2017
▪ FSRU imports, 2017: 33.5 million
tonnes, +3% y/y
▪ China, Turkey and Pakistan adding
3.6 million tonnes to FSRU imports
in 2017, offsetting a decline in Middle
Eastern and North African FSRU
utilisation
▪ January 2018 FSRU imports at 2.3
million tonnes, based on preliminary
data, up 34% from year-ago levels
12
0
5
10
15
20
25
30
35
40
2010 2011 2012 2013 2014 2015 2016 2017
mill
ion t
onnes/m
onth
FSRU imports by region
China Pakistan South East Asia MEG/North Africa Europe North America Latin America
Source: IHS Markit, Höegh LNG
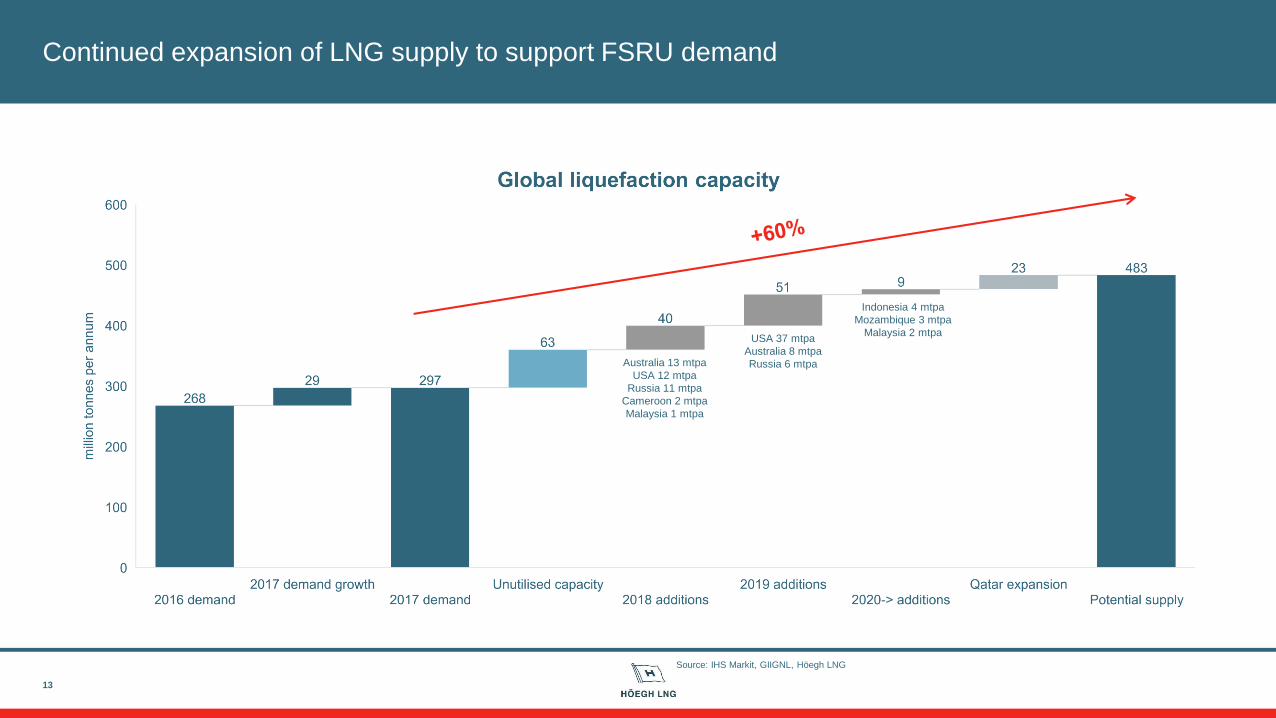
Continued expansion of LNG supply to support FSRU demand
13
Australia 13 mtpa
USA 12 mtpa
Russia 11 mtpa
Cameroon 2 mtpa
Malaysia 1 mtpa
USA 37 mtpa
Australia 8 mtpa
Russia 6 mtpa
Indonesia 4 mtpa
Mozambique 3 mtpa
Malaysia 2 mtpa
Source: IHS Markit, GIIGNL, Höegh LNG
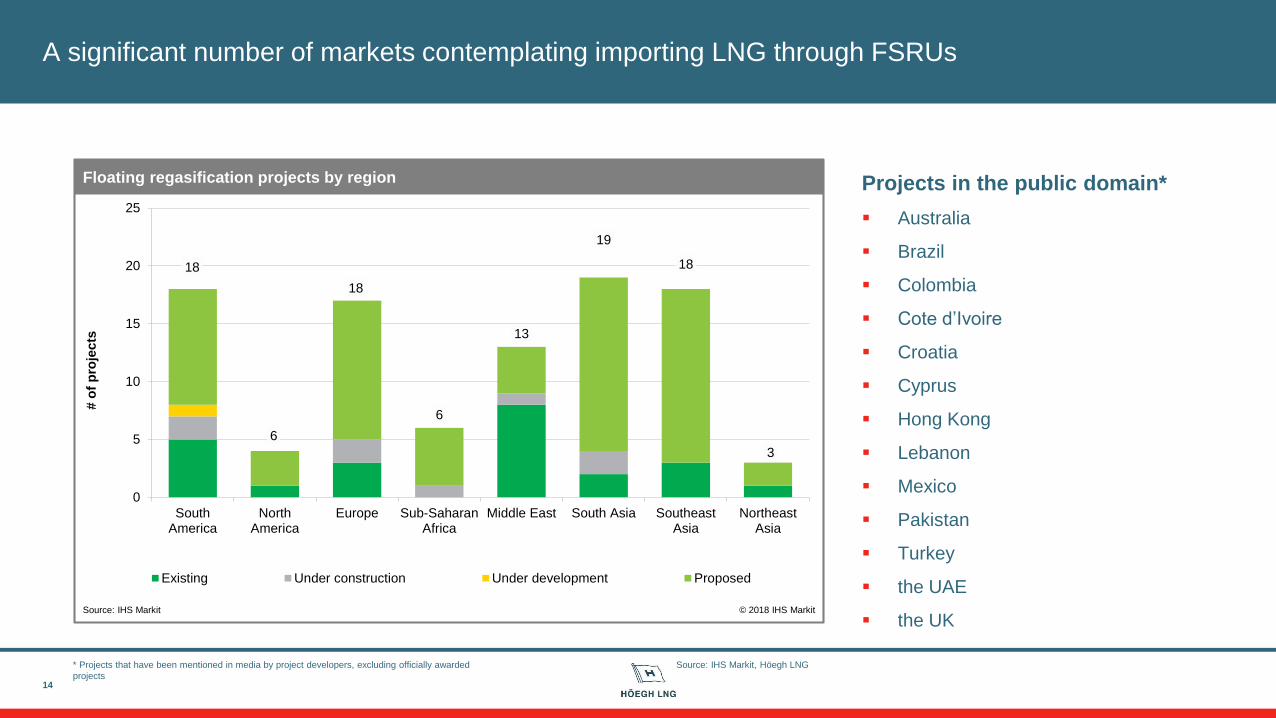
A significant number of markets contemplating importing LNG through FSRUs
Projects in the public domain*
▪ Australia
▪ Brazil
▪ Colombia
▪ Cote d’Ivoire
▪ Croatia
▪ Cyprus
▪ Hong Kong
▪ Lebanon
▪ Mexico
▪ Pakistan
▪ Turkey
▪ the UAE
▪ the UK
14
18
6
18
6
13
19
18
3
0
5
10
15
20
25
SouthAmerica
NorthAmerica
Europe Sub-SaharanAfrica
Middle East South Asia SoutheastAsia
NortheastAsia
Existing Under construction Under development Proposed
Floating regasification projects by region
Source: IHS Markit © 2018 IHS Markit
# o
f p
roje
cts
Source: IHS Markit, Höegh LNG* Projects that have been mentioned in media by project developers, excluding officially awarded
projects
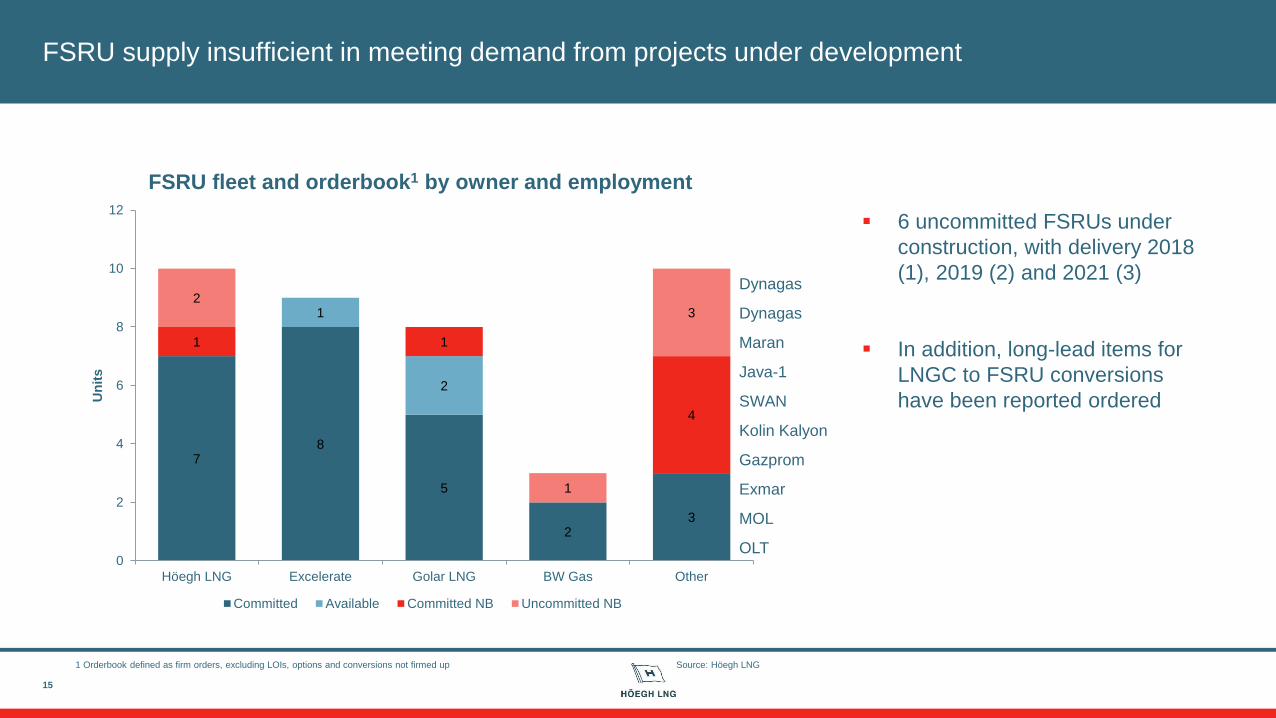
FSRU supply insufficient in meeting demand from projects under development
▪ 6 uncommitted FSRUs under
construction, with delivery 2018
(1), 2019 (2) and 2021 (3)
▪ In addition, long-lead items for
LNGC to FSRU conversions
have been reported ordered
15
78
5
23
1
2
1 1
4
2
1
3
0
2
4
6
8
10
12
Höegh LNG Excelerate Golar LNG BW Gas Other
Un
its
FSRU fleet and orderbook1 by owner and employment
Committed Available Committed NB Uncommitted NB
OLT
MOL
Gazprom
Maran
Kolin Kalyon
SWAN
Dynagas
Dynagas
Java-1
Exmar
Source: Höegh LNG1 Orderbook defined as firm orders, excluding LOIs, options and conversions not firmed up

Increased momentum in LNGC markets – rates at four-year high levels
▪ LNGC spot rates reached
USD 80,000 per day towards the end
of 2017, the best in four years
▪ 1-yr TC rates USD ~55,000 per day;
longer-term TC rates in the low USD
60,000s
▪ All Höegh LNG FSRUs have full
trading capabilities as LNGCs
Fuel consumption similar to LNGCs
Operating expenses similar to
LNGCs
16
TFDE headline rate assessment: Spot vs. 1-year TC
Source: Clarkson Platou

Agenda
17
▪ Highlights
▪ Operational update
▪ Market update
▪ Financials
▪ Summary
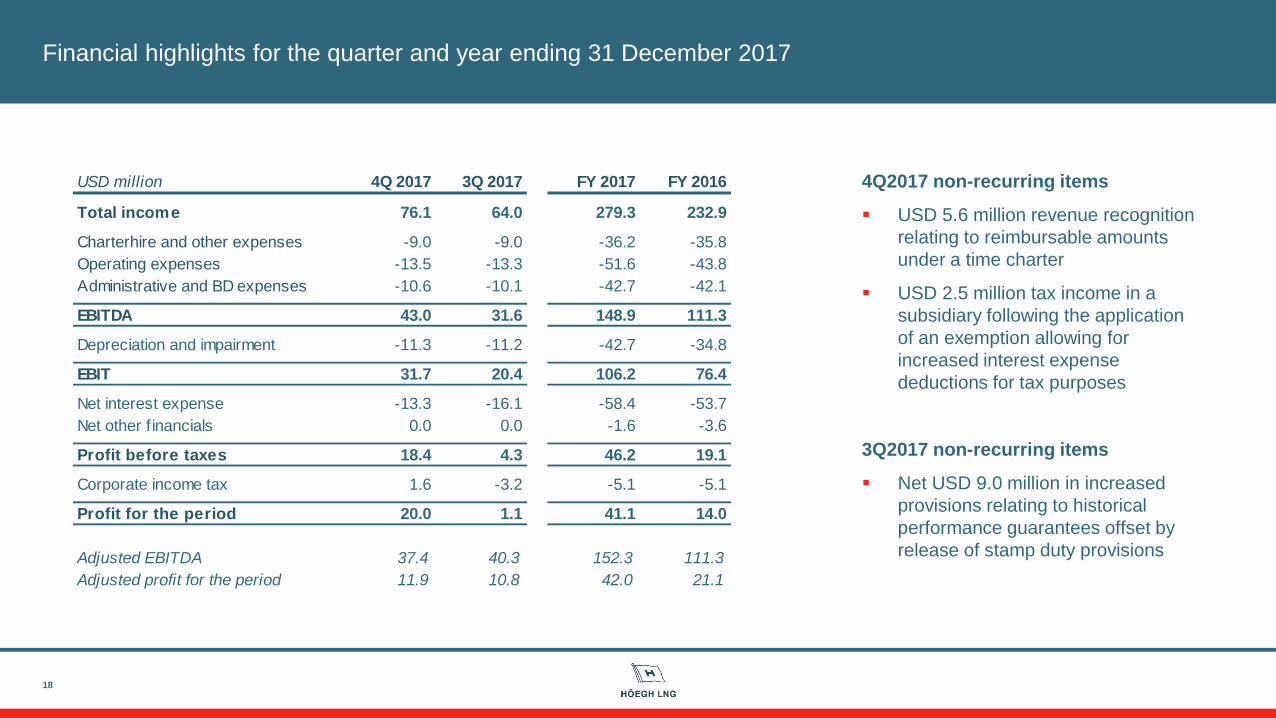
USD million 4Q 2017 3Q 2017 FY 2017 FY 2016
Total income 76.1 64.0 279.3 232.9
Charterhire and other expenses -9.0 -9.0 -36.2 -35.8
Operating expenses -13.5 -13.3 -51.6 -43.8
Administrative and BD expenses -10.6 -10.1 -42.7 -42.1
EBITDA 43.0 31.6 148.9 111.3
Depreciation and impairment -11.3 -11.2 -42.7 -34.8
EBIT 31.7 20.4 106.2 76.4
Net interest expense -13.3 -16.1 -58.4 -53.7
Net other f inancials 0.0 0.0 -1.6 -3.6
Profit before taxes 18.4 4.3 46.2 19.1
Corporate income tax 1.6 -3.2 -5.1 -5.1
Profit for the period 20.0 1.1 41.1 14.0
Adjusted EBITDA 37.4 40.3 152.3 111.3
Adjusted profit for the period 11.9 10.8 42.0 21.1
Financial highlights for the quarter and year ending 31 December 2017
18
4Q2017 non-recurring items
▪ USD 5.6 million revenue recognition
relating to reimbursable amounts
under a time charter
▪ USD 2.5 million tax income in a
subsidiary following the application
of an exemption allowing for
increased interest expense
deductions for tax purposes
3Q2017 non-recurring items
▪ Net USD 9.0 million in increased
provisions relating to historical
performance guarantees offset by
release of stamp duty provisions
USD million 4Q 2017 3Q 2017 4Q 2016
Investments in FSRUs 1,386 1,397 1,140
Investments in new buildings 233 202 130
Other 92 94 103
Long-term restrcited cash 14 14 19
Marketable securities 74 24 136
Cash and short-term restricted cash 160 261 186
Total assets 1,959 1,992 1,713
Equity attributable to the parent 479 452 446
Non-controlling interests 226 124 150
Total equity 705 576 596
Interest bearing debt 1,156 1,261 936
Other 98 156 182
Total equity and liabilities 1,959 1,992 1,713
NIBD 908 962 585
Adjusted equity 763 649 677
Adjusted equity ratio 39.2% 32.7% 39.7%
Strong financial position
19
32.7%
3.6%1.9% 0.6% 0.5% 0.5% 0.4% 39.2%
0%
5%
10%
15%
20%
25%
30%
35%
40%
45%
50%
Equity
ratio,
adju
ste
d f
or
hedgin
g
Equity ratio development
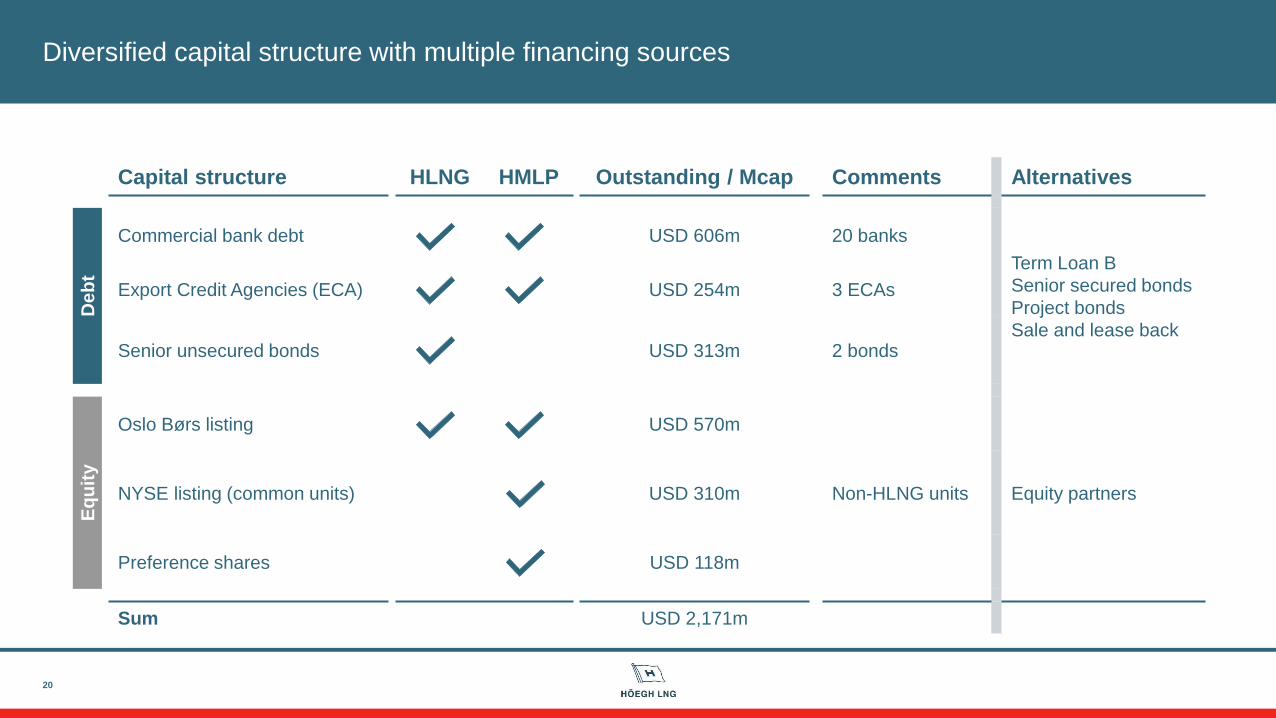
Capital structure HLNG HMLP Outstanding / Mcap Comments Alternatives
De
bt
Commercial bank debt USD 606m 20 banks
Term Loan B
Senior secured bonds
Project bonds
Sale and lease back
Export Credit Agencies (ECA) USD 254m 3 ECAs
Senior unsecured bonds USD 313m 2 bonds
Eq
uit
y
Oslo Børs listing USD 570m
Equity partnersNYSE listing (common units) USD 310m Non-HLNG units
Preference shares USD 118m
Sum USD 2,171m
Diversified capital structure with multiple financing sources
20

0
50
100
150
200
250
300
350
400
450
500
2018 2019 2020 2021 2022
US
D m
illio
n
Debt repayment schedule
Amortisation Amortisation refinanced debt Balloons Bonds
Debt repayments spread out in time
▪ Amortisation includes debt on
FSRUs #8-10, assuming that
financing for FSRUs #9-10 are
structured similarly to FSRU #8
▪ Amortisation of refinanced debt
assumes similar amortisation profile
as the current facilities, and that
balloons are refinanced in full
▪ Commercial debt tranches on
Independence, Gallant, Grace and
Lampung mature ahead of ECA
tranches with 12 year tenors
21
Independence
Höegh Gallant
HLNG02
Höegh Grace
Lampung
HLNG03
Höegh Giant
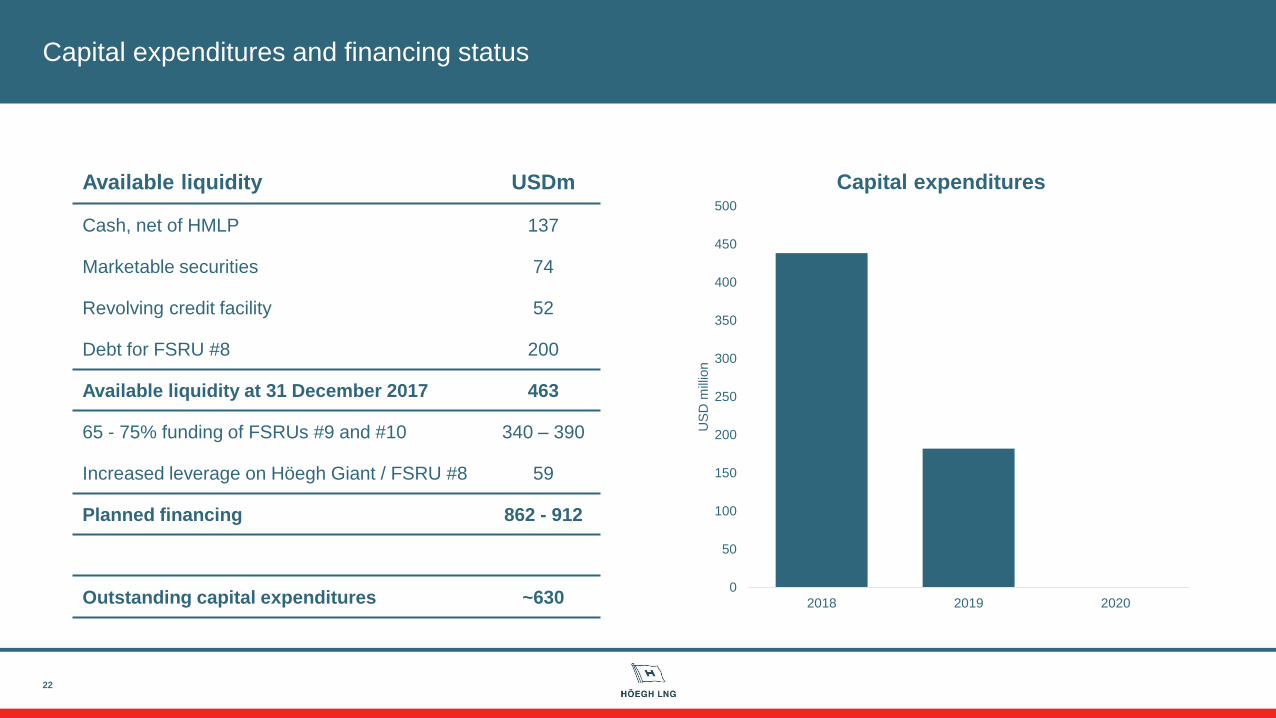
Capital expenditures and financing status
22
Available liquidity USDm
Cash, net of HMLP 137
Marketable securities 74
Revolving credit facility 52
Debt for FSRU #8 200
Available liquidity at 31 December 2017 463
65 - 75% funding of FSRUs #9 and #10 340 – 390
Increased leverage on Höegh Giant / FSRU #8 59
Planned financing 862 - 912
Outstanding capital expenditures ~6300
50
100
150
200
250
300
350
400
450
500
2018 2019 2020
US
D m
illio
n
Capital expenditures
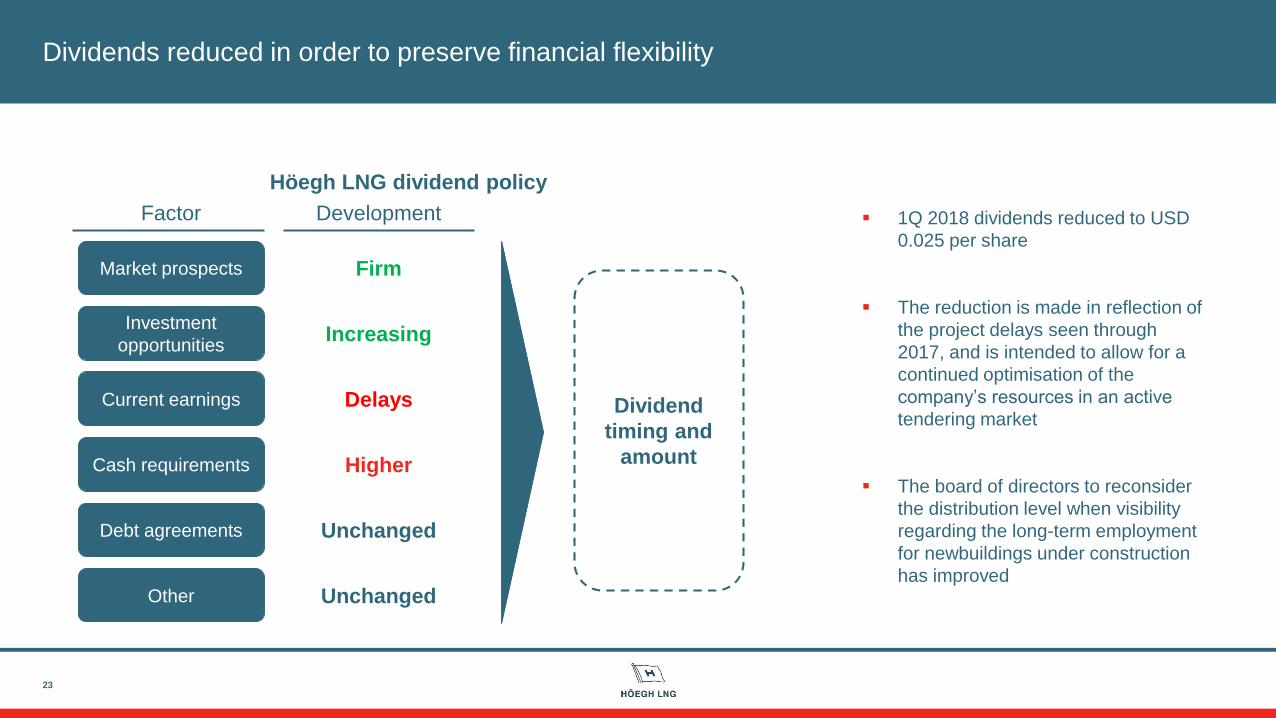
Dividends reduced in order to preserve financial flexibility
23
▪ 1Q 2018 dividends reduced to USD
0.025 per share
▪ The reduction is made in reflection of
the project delays seen through
2017, and is intended to allow for a
continued optimisation of the
company’s resources in an active
tendering market
▪ The board of directors to reconsider
the distribution level when visibility
regarding the long-term employment
for newbuildings under construction
has improved
Höegh LNG dividend policy
Market prospects
Current earnings
Investment
opportunities
Cash requirements
Debt agreements
Other
Factor Development
Dividend
timing and
amount
Firm
Increasing
Delays
Higher
Unchanged
Unchanged
Agenda
24
▪ Highlights
▪ Operational update
▪ Market update
▪ Financials
▪ Summary
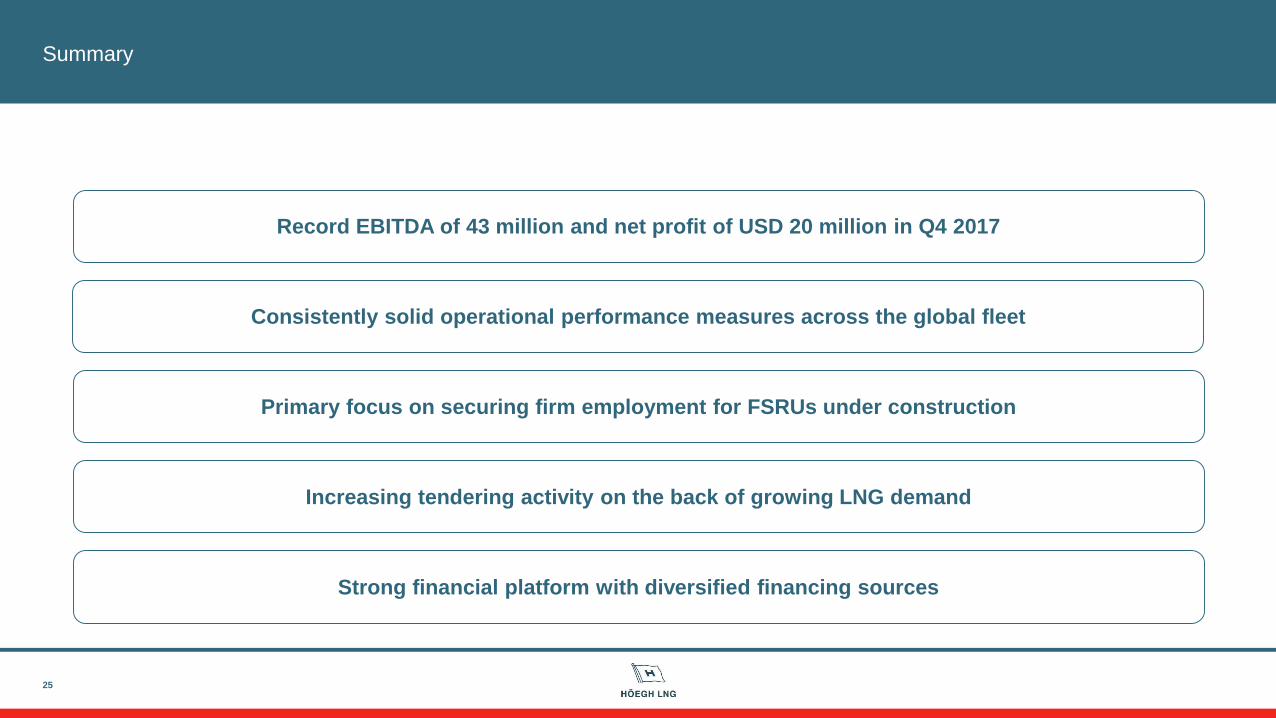
Summary
25
Consistently solid operational performance measures across the global fleet
Record EBITDA of 43 million and net profit of USD 20 million in Q4 2017
Strong financial platform with diversified financing sources
Increasing tendering activity on the back of growing LNG demand
Primary focus on securing firm employment for FSRUs under construction
26
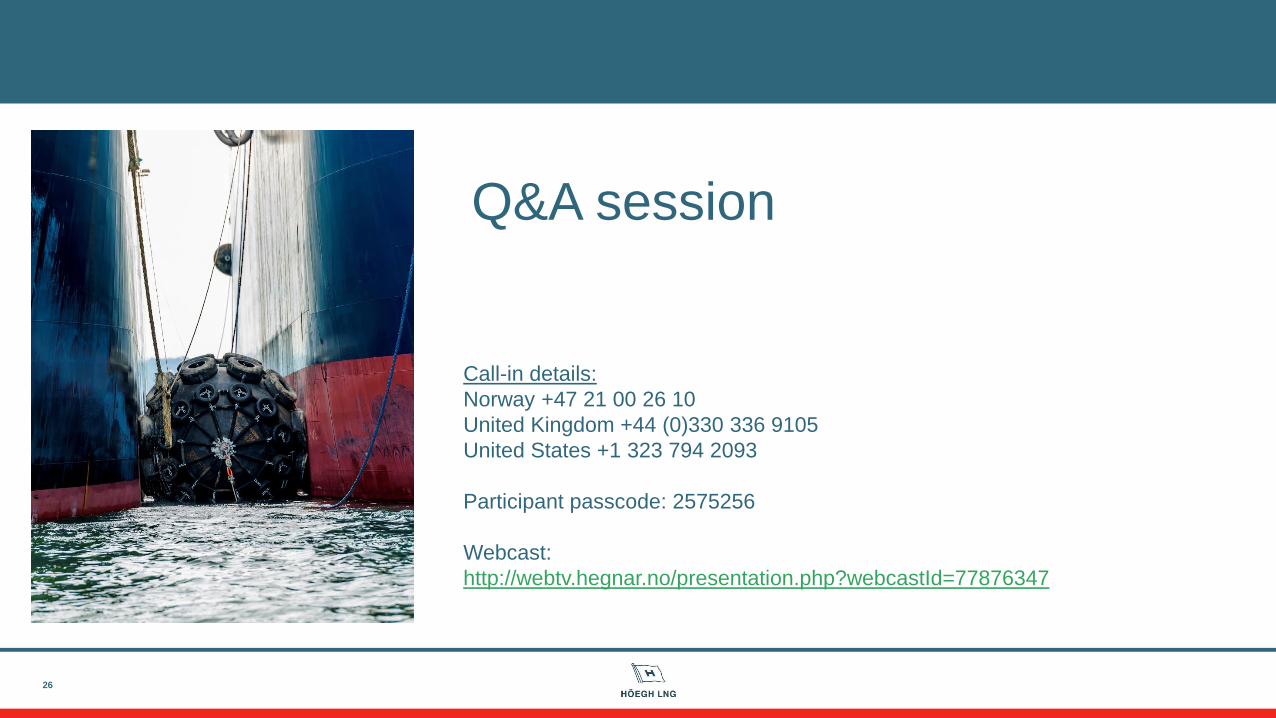
Q&A session
Call-in details:
Norway +47 21 00 26 10
United Kingdom +44 (0)330 336 9105
United States +1 323 794 2093
Participant passcode: 2575256
Webcast:
http://webtv.hegnar.no/presentation.php?webcastId=77876347
Agenda
27
▪ Appendices
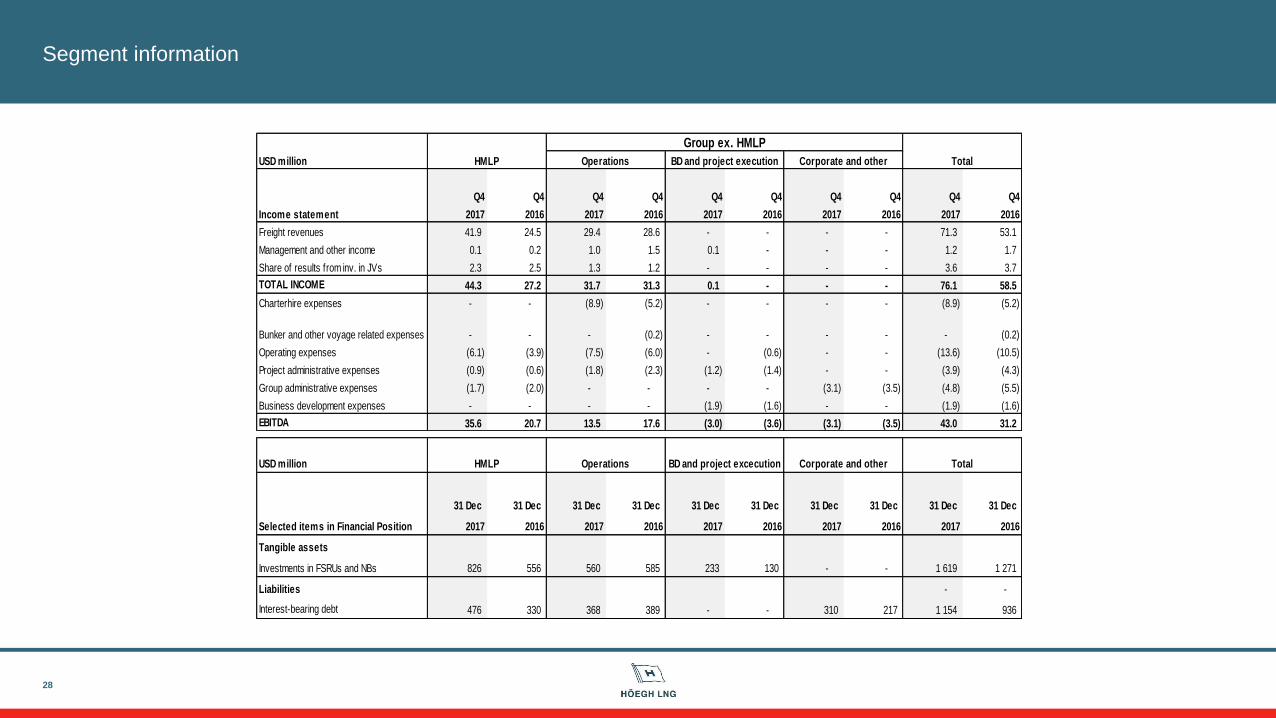
Segment information
28
Group ex. HMLP
USD million HMLP Operations BD and project execution Corporate and other Total
Q4 Q4 Q4 Q4 Q4 Q4 Q4 Q4 Q4 Q4
Income statement 2017 2016 2017 2016 2017 2016 2017 2016 2017 2016
Freight revenues 41.9 24.5 29.4 28.6 - - - - 71.3 53.1
Management and other income 0.1 0.2 1.0 1.5 0.1 - - - 1.2 1.7
Share of results from inv. in JVs 2.3 2.5 1.3 1.2 - - - - 3.6 3.7
TOTAL INCOME 44.3 27.2 31.7 31.3 0.1 - - - 76.1 58.5
Charterhire expenses - - (8.9) (5.2) - - - - (8.9) (5.2)
Bunker and other voyage related expenses - - - (0.2) - - - - - (0.2)
Operating expenses (6.1) (3.9) (7.5) (6.0) - (0.6) - - (13.6) (10.5)
Project administrative expenses (0.9) (0.6) (1.8) (2.3) (1.2) (1.4) - - (3.9) (4.3)
Group administrative expenses (1.7) (2.0) - - - - (3.1) (3.5) (4.8) (5.5)
Business development expenses - - - - (1.9) (1.6) - - (1.9) (1.6)
EBITDA 35.6 20.7 13.5 17.6 (3.0) (3.6) (3.1) (3.5) 43.0 31.2
USD million
31 Dec 31 Dec 31 Dec 31 Dec 31 Dec 31 Dec 31 Dec 31 Dec 31 Dec 31 Dec
Selected items in Financial Position 2017 2016 2017 2016 2017 2016 2017 2016 2017 2016
Tangible assets
Investments in FSRUs and NBs 826 556 560 585 233 130 - - 1 619 1 271
Liabilities - -
Interest-bearing debt 476 330 368 389 - - 310 217 1 154 936
TotalHMLP Operations BD and project excecution Corporate and other


