Embed Size (px)
Citation preview

Passion to excelHEG Limited | Annual report 2010-11
Registered Office:Mandideep (Near Bhopal)Distt. Raisen - 462046, Madhya Pradesh, Indiawebsite: www.hegltd.com/www.lnjbhilwara.com A
PR
OD
UCT
• in
fo@
tris
ysco
m.c
om
The LNJ Bhilwara Group.*Established in 1961 *A USD 1-billion conglomerate *Amongthe leading business groups in India *Diversified interests intextiles, graphite electrodes, power generation, powerengineering, ITeS and consultancy services *Promoted by Shri L. N. Jhunjhunwala.
Business verticals
Power
The Group possesses expertise in thermal and hydropower generation withan installed capacity of 412 MW in India (120 MW for thermal and 292 MWfor hydro power) and power consultancy
It provides 100% of its power requirements
The Group has five companies in this vertical – Bhilwara Energy Ltd, MalanaPower Company Ltd, AD Hydro Power Ltd, NHPL and ICCS Ltd
(` cr)
Metric 2010-11 2009-10
Sales 241 215EBIDTA 119 181Profit after tax (79) 98Capital employed 3,518 3,335
Graphite electrodes
The Group operates in this business through HEG Ltd, India’s leadingmanufacturer and exporter of graphite electrodes
The Group is one of the lowest cost producers of graphite electrodes in theworld with a strong presence in the value-added ultra high power (UHP)segment
(` cr)
Metric 2010-11 2009-10
Sales 1,300 1,279EBIDTA 262 354Profit after tax 129 171Capital employed 1,092 915
ITeS
The Group has two companies in this business vertical, Bhilwara Infotech Ltdand Bhilwara Scribe Pvt. Ltd
The Group provides services in IT consultancy and healthcare BPO
(` cr)
Metric 2010-11 2009-10
Sales 19 13EBIDTA 3 2Profit after tax 2 (4)Capital employed 7 4
Group statistics
Pioneering pedigree
Possesses India’s second-largest spindle capacity
Largest Indian producer and exporter of polyester/viscose
blended yarn
Provides largest range in grey, dyed and mélange yarn
Possesses the world’s largest single-location plant for
graphite electrodes with an installed capacity of 66,000 TPA
Commissioned India’s first hydropower project financed by
the International Finance Corporation, Washington
Emerged as the first merchant power producer in India’s
hydro sector
Awards and recognition
Winner of the SRTEPC (The Synthetic and Rayon Textiles
Export Promotion Council) award for exports for the last 17
years – a record in the Indian textiles space and Rajiv Gandhi
National Quality Award (RSWM Ltd.)
Recipient of the CAPEXIL award for 19 consecutive years
and the prestigious Rajiv Gandhi National Quality award
(HEG Ltd.)
Awarded the Greentech Environment Excellence Award
(Malana Power Company Ltd)
Number of
Companies
14March 31, 2011
Number of Manufacturing
facilities
24March 31, 2011
Human capital
25,000March 31, 2011
Revenue
crore4,739
2010-11
`
Exports
crore2,252
2010-11
`
Profit after tax
crore238 2010-11
`
Textiles
The Group manufactures India’s largest range of yarns through six companies
Its fabrics include polyester, denim, worsted, automotive fabric and technicaltextiles, among others
RSWM Ltd is the flagship of the business and the Group
Other business entities include BSL Ltd, Maral Overseas Ltd, BMD Pvt. Ltd,Cheslind Textiles Ltd and BTTL Ltd
(` cr)
Metric 2010-11 2009-10
Sales 3,166 2,450EBIDTA 499 323Profit after tax 174 63Capital employed 2,384 2,075
This is an indicative map only.
50 glorious years A journey that began in 1961
with a single textile unit in the
lesser known region of
Bhilwara, Rajasthan has, over
five decades, created one of
India’s leading business
conglomerates, firmly etching
itself in the global space.
EBIDTA
crore900 2010-11
`
3534
33
36
30
32
21
22
31
2324
15
14
29 2513
1
3
54
8 6
7 216
11
12
26
27
17
19 1820
28
9
10
LNJ Bhilwara Group
TEXTILES RSWM Limited1. Kharigram Fibre Dyeing, Spinning Dyed & Grey Yarn2. Mayur Nagar, Banswara Spinning PV Blended, Cotton & Open End Grey Yarn3. Mandpam Melange, Cotton Dyed Yarn & Yarn Dyeing4. Rishabhdev Spinning PV Blended Grey Yarn5. Ringas Fibre Dyeing & Spinning Dyed Yarn6. LNJ Nagar, Mordi Weaving & PV Fabric Processing & Finishing7. LNJ Nagar, Mordi Cotton Ring & Open End Spinning, Denim Fabric
Weaving & Rope Dyeing, Processing & Finishing8. LNJ Nagar, Mordi Thermal PowerCheslind Textiles Ltd.9. Bagalur Spinning Cotton, Compact, Gassed & Mercerized Yarn
& Knitting10. Pondicherry Spinning Cotton, Compact, Gassed & Mercerized Yarn
& KnittingMaral Overseas Ltd.11. Maral Sarovar Cotton Spinning, Knitting, Dyeing & Finishing, Knitted
Garments12. Maral Sarovar Captive Thermal Power13. Noida Knitted GarmentsBSL Ltd.14. Bhilwara PV & Worsted Spinning, PV & Worsted Weaving
& Silk Fabric15. Jaisalmer Wind Power GenerationBMD Pvt. Ltd.16. LNJ Nagar, Mordi Automotive Furnishing Fabric, Flame Retardant
Fabric, Furnishing FabricBhilwara Technical Textiles Ltd.17. LNJ Nagar, Mordi Technical Textiles
GRAPHITE HEG Ltd.18. Mandideep Graphite Electrodes19. Mandideep Captive Thermal Power20. Tawa Captive Hydro Electric Power
POWER Bhilwara Energy Ltd.21. Pathankot UBDC Stage III Hydro Electric Power Generation22. Tawang Nyam Jang Chhu Hydro Electric Power GenerationMalana Power Company Ltd.23. Malana (Kullu) Hydro Electric Power GenerationAD Hydro Power Ltd.24. Allain-Duhangan Hydro Electric Power Generation
(Manali)Indo Canadian Consultancy Services Ltd.25. Noida Power Engineering Services
INFORMATION TECHNOLOGY Bhilwara Scribe Pvt. Ltd.26. Bhopal Medical Transcription Services27. Bengaluru Medical Transcription ServicesBhilwara Infotech Ltd.28. Bengaluru IT Services
OFFICESCorporate Office29. Noida (NCR-Delhi)Regional / Marketing30. Mumbai 34. Ludhiana31. Kolkata 35. Amritsar32. Bengaluru 36. Bhilwara33. New Delhi

‘Passion to excel!’This organisational DNA inspires out-of-the-boxthinking, challenging the status quo and walkingthe road not traveled.The result: We have grown our business everysingle year since 1977.
Passion to excel

HEG Limited2
ContentsHEG Limited | Annual Report 2010-11
Corporate informationKey data about the corporate
03Chairman’s statementAn insight into the strategicdirection of the Company goingforward.
14Management discussion andanalysisA detailed discussion on the sector,business operations and financialhealth of the Company.
18Directors’ ReportA report from the Board on theCompany’s performance andoutlook.
26
Corporate GovernanceA report on the governancepractices in the Company
34Standalone financialsDetailed statements highlightingthe Company financial health
43Consolidated financialsDetailed statements highlightingthe financial health of theconglomerate
73

Annual Report 2010-11 3
CorporateInformation
Board of DirectorsL. N. Jhunjhunwala, Chairman-Emeritus
Ravi Jhunjhunwala, Chairman &
Managing Director
Shekhar Agarwal, Vice-Chairman
D. N. Davar, Director
K. N. Memani, Director
Kamal Gupta, Director
P. Murari, Director
Lalit Mohan Lohani, Nominee Director -
LIC
O. P. Bahl, Director
Riju Jhunjhunwala, Director
Chief Operating OfficerK. Vaidyanathan
Chief Strategy & ProjectOfficerJacob Mani
Chief Financial OfficerManvinder Singh Ajmani
Chief Human ResourceOfficerT. Dev Joshi
Company SecretaryAshish Sabharwal
BankersState Bank of India
Punjab National Bank
HDFC Bank Ltd
The Hongkong &
Shanghai Banking Corp.
IDBI Bank Ltd
DEG, Germany
Central Bank of India
Kotak Mahindra Bank
Standard Chartered Bank
AuditorsDoogar & Associates
S. S. Kothari Mehta & Co.
RegistrarM/s. MCS Ltd
F-65, First Floor,
Okhla Industrial Area,
Phase-I, New Delhi – 110020
Stock Exchanges where theCompany's shares are listed:Bombay Stock Exchange Ltd
National Stock Exchange of India Ltd
Madhya Pradesh Stock Exchange Ltd
Corporate OfficeBhilwara Towers, A-12, Sector-1
Noida - 201301, U.P., India
Phone: +91 (0120) 4390300
Fax: +91 (0120) 2531648
Registered OfficeMandideep (Near Bhopal)
Distt. Raisen - 462046
Madhya Pradesh, India
Phone: +91 (07480) 233524, 233527,
Fax: +91 (07480) 233522
WorksGraphite Electrodes & Thermal Power
Plant
Mandideep (Near Bhopal)
Distt. Raisen - 462046
Madhya Pradesh, India
Phone: +91 (07480) 233524, 233527,
Fax: +91 (07480) 233522
Hydro Electric Power
Village Ranipur, Tawa Nagar
Distt. Hoshangabad - 461001
Madhya Pradesh, India
Phone: +91 (07572) 272810, 272859
Fax: +91 (07572) 272849

Right product Passion to excel
At HEG, our passion to excel is highlighted in our proactive ability toidentify long-term opportunities and capitalise on them with speed.
� We recognised that as customer preferences became more demanding, graphite electrodetechnologies would need to evolve to meet emerging standards.
� As the steel industry moved towards bigger and better electric arc furnaces using UHPelectrodes, we made corresponding investments in capacity, capable of producing 100% UHPelectrodes.
HEG Limited4

� Our product basket comprises graphite electrodes ranging from 12 to 30 inches in diameter andlengths of 72” to 110”, addressing a wide spectrum of users
The result: Our sales volume grew 9.5% CAGR over the five years leading to 2010-11.
100,000The projected demand addition
of UHP grade graphite electrodes (tonnes) over the next five years
Annual Report 2010-11 5
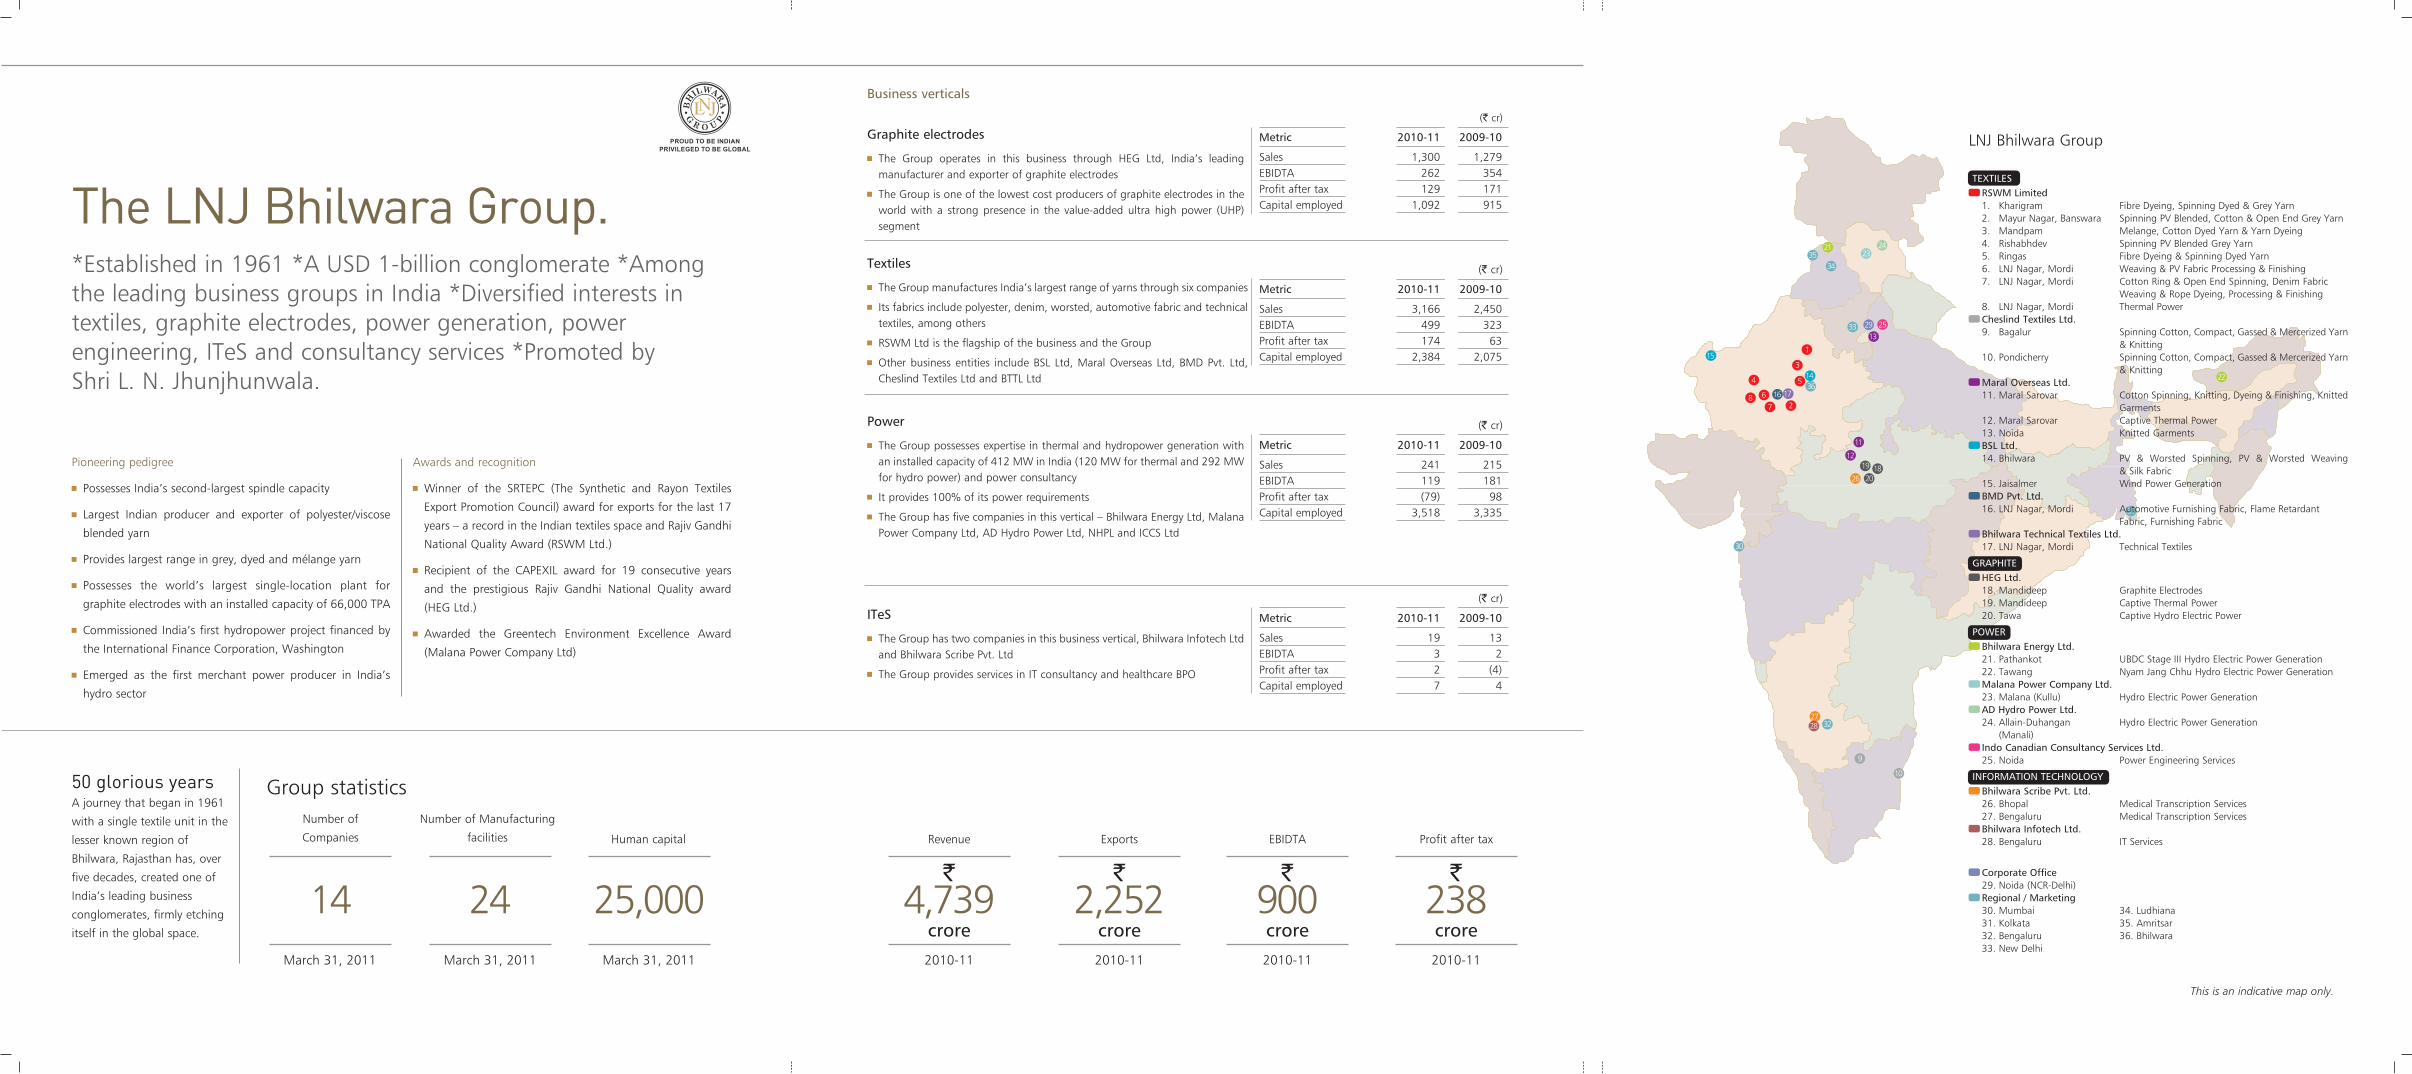
� We increased our installed capacity from 24,000 MT in 2000-01 to 66,000 MT in 2010-11 for acumulative investment of over Rs 600 crore; an average 4,200 MT was added every year across the lastdecade; we multiplied our capacity 2.5x in the last decade in line with the steel sector uptrend, thefastest capacity growth in our sector; we are investing Rs 225 crore in production capacityenhancement to 80,000 TPA (first phase commenced in 2010-11)
Growing capacityPassion to excel
At HEG, we demonstrated our business commitment through awillingness to expand capacities in good markets and bad.
HEG Limited6

� We invested Rs 73 crore in technologically-efficient equipment in our current capacity expansion
� We operated our manufacturing plants at about 85% capacity utilisation; significantly higher thanthe global average, even in adverse market conditions
The result: We possess the world’s largest single-site graphite electrode plant.
8%The percentage of the global graphite
electrode supply provided by HEG
Annual Report 2010-11 7

� We have completed successive project expansion at competitive costs.
� We invested in global capacities, resulting in attractive economies of scale
� We optimised raw material use and facilities to achieve cost-competencies
� We invested in a 77-MW captive power generation capacity (includes 13.5-MW hydroelectric power),enhancing our competitiveness in a power-intensive business (a tonne of output needs about 5,000-6,000 units of power); the incremental power generated provides stable revenues
Cost advantagePassion to excel
At HEG, our competitive advantage is derived from our positioning asone of the world’s lowest cost graphite electrode manufacturers.
HEG Limited8

� We significantly optimised our finance costs from 5.24% to 3.29% of net revenues.
The result: Business grew continuously since 1977. EBIDTA grew at 16.64% CAGR over the last fiveyears.
250bpsReduction in the average debt cost over
2009-10 in an environment of rising interest rates
Annual Report 2010-11 9

� We created an expansive footprint across more than 80 countries; we enjoy a large and growingcustomer base in the US, Europe, CIS, the Middle east and Southeast Asia
� Our key export clients include Arcelormittal, Nucor (US), Posco (Korea), Megasa (Spain), Evraz(Russia) Sidenor (Greece), Ezz group (Egypt), Hyundai Steel (South Korea) and Tata Steel, amongothers.
� We widened our global footprint through several new export destinations in 2010-11
Expansive reach Passion to excel
At HEG, we strive to achieve just-in-time delivery to customersworldwide, resulting in dependability and repeat business.
HEG Limited10

� We catered to about 50 domestic customers, accounting for about 20% of our business volumes;some key domestic clients include SAIL, Tata Steel and Jindal
� We sold 38% of our products to the world's top 20 steel companies.
The result: Exports increased from Rs 290.52 crore in 2005-06 to Rs 854.31 crore in 2010-11 at a24.08% CAGR over the same period.
80%The proportion of exports in our net sales, 2010-11
Annual Report 2010-11 11

� We maintained a prudent balance between rewarding shareholders and business reinvestment
� We grew our reserves from Rs 533.70 crore as in 2009 to Rs 773.47 crore as in 2011
� We strengthened our financial statements through an attractive overall gearing of 1.12 as on 31st March, 2011
Statement strengthPassion to excel
At HEG, we successfully translated our competitive positioninginto our financial performance
HEG Limited12

� We announced a buy-back of Rs 67.50 crore worth of shares, amounting to 9.95% of our total paid-upcapital and free reserves
The result: A strong Balance Sheet facilitates the Company in undertaking future growth initiatives
0.34 Long-term debt equity as on 31st March, 2011
Annual Report 2010-11 13

HEG Limited14
Despite various challenges, like economic uncertainty
and natural disasters, the world economy as a whole
was successful in retracing growth. The financial crisis
has not left a deep impact on growth in developing
economies, as they continue to make good progress
compared with the developed world. A double-dip
scenario was evaded and we are experiencing the
positives of increased global economic activity.
The Indian economy displayed a certain degree of
insulation against negative global developments, and
benefited from sustainable growth, primarily based
on domestic demand. Though we are facing a high
inflationary pressure, our economy is treading a
positive direction with gross domestic product
expected to grow at a rate of over 8% in 2011-12.
With greater government impetus on economic
progress, we are hopeful that the Indian economy will
Fiscal 2011 was a significantyear for global economicrecovery, showingnoteworthy turnaround over the previous years’performance.
Chairman’s Message

Annual Report 2010-11 15
continue to be one of the best
performers worldwide.
In such an environment, the global steel
industry posted impressive growth, both
in value and volume terms. In CY2010,
the steel industry achieved peak
production levels of over 1.4 billion
tonnes. Growth since then has been
encouraging. The current year started
on an encouraging note, with
performance expected to surpass earlier
record levels.
Our products find applications in steel
making through the EAF route and
overall growth naturally results in the
growth of the EAF segment, to comply
with better environment standards,
thereby providing fillip to graphite
electrode consumption. Steel
production through the EAF route, is
expected to touch a new peak in the
short-term, implying robust demand.
We are observing that new capacities
are being established and many steel
giants are converting their existing
conventional steel production facilities
into EAF plants to comply with better
environment standards. We believe this
will drive greater demand for graphite
electrodes, going forward.
We, at HEG Limited, are proud to be a
part of few global organisations who
manufacture graphite electrodes. The
Company built its successful growth
story over the past few decades through
the implementation of a focused
strategy which resulted in cost
consciousness, international quality,
integrated manufacture and strong
customer relations.
Further, I am glad to share that we are
expanding our graphite electrode
capacity from 66,000 tonnes to 80,000
tonnes per annum. The first phase of the
expansion is operational and full-
capacity commercial production is
expected to be on stream by October
2011. We have invested around
` 225 crore towards this expansion,
through a combination of internal
accruals and debt. This capacity
expansion is being carried out at a
relatively low capital investment which
we believe will translate into lucrative
payback in the near future.
With this expansion, we will be
successful in consolidating our position
We are expanding our graphite
electrode capacity from the current
rate of 66,000 tonnes to 80,000
tonnes per annum. The first phase
of the expansion is operational and
full- capacity commercial production
is expected to be on stream by
October 2011.
We invested around towards this
expansion through a combination of
internal accruals and debt.
` 225 crore

HEG Limited16
as the world’s largest single-site
producer of graphite electrodes. Such a
large single-site facility benefits us
significantly, owing to better cost
containment, greater quality control and
easier operations management. We
expect this expansion to benefit us as
demand is continuously improving,
evident from the strengthening of our
order book. Capacity utilisation levels are
rising throughout the industry, driven by
higher demand, which should lead to a
better pricing of graphite electrodes.
With larger capacity, post the expansion,
we will derive greater benefits from a
conducive operating scenario.
While demand and pricing scenarios
seem encouraging, let me briefly discuss
the manufacturing side of our business.
Manufacturing graphite electrodes
involves two main cost components –
needle coke and power. Needle coke for
CY 2011 was booked at competitive
rates and we tied up with our suppliers
for the entire requirement, keeping in
view our expanded capacity.
The other important cost component is
power. Your Company is well-positioned
in this regard, as we have three captive
power plants with a total rated capacity
of 77 MW. Around 64 MW capacity
comes from two thermal power plants
whereas the hydel power plant
contributes 13.5 MW. All three power
plants operated optimally during the
year. The total power generation
capacity is sufficient even for our
expanded graphite electrode capacity.
Your Company lays strong emphasis on
providing the best service and product
experience to its global customer base.
Quality of graphite electrodes remained
a focal point of our operations and we
continue to deliver products of
international standards.
No business would be successful unless
supported by quality committed talent.
We believe that we engaged some of
the best talent in the industry. We
provide superior training programmes
and lay emphasis on developing our
human resources to drive organisational
growth.
Business growth and societal progress
go hand in hand. As a successful
company, we believe in sharing what we
create. Towards that end, we continued
to implement initiatives and
demonstrate our corporate social
responsibility. We adopted a few villages
in Madhya Pradesh, with an aim to
improve their lifestyle. We focuesed on
higher education, granting scholarships,
improving infrastructure and
maintaining higher standards of living,
Your Company is well-positioned in
this regard, as we have three captive
power plants with a total rated
capacity of 77 MW. Around 64 MW
capacity comes from two thermal
power plants whereas the hydel power
plant contributes towards the
remaining 13.5 MW capacity.

Annual Report 2010-11 17
among others. Additionally, we
emphasise community healthcare and
family welfare. To create social capital
and deliver our CSR activities, we have
formed the Graphite Education and
Welfare Society, a non-profit trust.
As I look ahead, I foresee the graphite
electrode industry being on a high-
growth path. With the Company’s
inherent advantages that include a large
single-site facility, low-cost production,
world-class products, broad client base
and growing business prospects, we are
confident of capturing opportunities
which will take the Company to the next
level of success.
As I conclude, I would like to thank you
for the continued trust and support
extended by you in our Management
and the Board of Directors. I take this
opportunity to also thank our
customers, employees, suppliers, service
providers, financial institutions and
bankers for their contribution towards
the Company’s success. Let us all
reaffirm our commitment towards the
growth of HEG Limited as the industry
leader.
Best wishes,
Ravi Jhunjhunwala
Chairman and Managing Director

HEG Limited18
The macroeconomicscenarioThe year 2010 witnessed a significant
turnaround in terms of strengthening
economic conditions, supported by
global activity growth. Though this
recovery is gaining pace, it continues to
remain fragile, as large fiscal and
monetary adjustments work their way
through the system.
Advanced economies are witnessing
sluggish growth rates, touching only
around 3.5% during the first half of
2010. For the years 2011 and 2012,
growth rates are forecasted at around
4.5%, with developed economies
growing at only 2.5%, whereas
developing economies are expected to
grow 6.5%. This is due to the developed
world being laced by high
unemployment, a surge in inventory
levels and low financial stability.
Concrete steps are being taken by way
of proactive policies to achieve internal
and external rebalancing.
As most developing countries continue
to pose a stronger, balanced and
sustained performance, the recent
Middle East crisis betrayed an unsettling
reality. As the crisis continues to
escalate, significant and sustained
instability in this region is sending crude
oil prices on a march. Oil, being the
backbone of the world economy,
concerns over resolving the crisis are
gaining paramount importance to
maintain the global economic growth
balance.
The Indian economic outlook continues
to be robust despite the existing
challenges. The GDP growth rate
improved to 8.5% in FY 2011 as
compared with 8% in FY 2010, even as
fiscal deficit reduced to 4.8% of GDP.
These healthy growth rates were
supported by the booming domestic
capital markets, better than expected
monsoons, boosted growth of the
agricultural sector and strong
performances by the manufacturing,
construction, trade, hotel, transport and
communication, insurance, real estate
sectors. Amidst this economic growth,
ManagementDiscussion and Analysis
The GDP growth rate improved
in FY 2011 as compared with
8% in FY 2010, even as fiscal
deficit reduced to 4.8% of GDP.
8.5%

Annual Report 2010-11 19
there continues to be concerns over
rising inflation, which are expected to
moderate going forward.
Encouraging sectoraloutlookA new record for global crude steel
production was set in the year 2010,
making it a historic year for the steel
industry.
As per World Steel Association, world
crude steel production in 2010
measured 1,414 mmt, 15% higher
than the corresponding period. Asia
attributed to a lion’s share of the total
production at 897.9 mmt, with China
marking 626.7 mmt. Over 50% growth
was contributed by China, Japan and the
US, followed by Russia and India.
Capacity utilisation remained close to
75% in the fourth quarter of 2010, with
an annual rate of around 77%. World
crude steel production in 2011 was also
on an uptick, with the first quarter
marking 8.8% higher as compared with
the corresponding period of 2010.
Steel prices are on the rise, but as the
graphite electrodes business is sensitive
to volumes and not prices of steel, price
fluctuations do not affect the graphite
electrodes business directly.
The 2011 steel production outlook
remains optimistic, supported by an
expected growth in demand. Though
there are dampeners to this forecast, the
overall expectation is cautiously
optimistic.
Growth in the steel industry fuels Electric
Arc Furnace industry growth. The EAF
industry too, performed well, with
earlier record levels expected to be
surpassed soon. Hence, the outlook for
the graphite electrode industry looks
positive.
HEG Limited manufactures international
grade Ultra High Power (UHP) graphite
electrodes which are used in Electric Arc
Furnaces. The Company is one of the
few global players manufacturing
graphite electrodes and has formed a
unique position in the industry.
Despite rising demands, realisations
remain muted. This trend is expected to
change going forward, with margins
projected to enhance. Being an
established player in this market, we
expect to capitalise on a significant share
of the expected demand growth. This
will prove beneficial in terms of higher
market share, and in turn, will raise
performance margins.
Operating perspectivesGraphite electrodesHEG Limited is the world’s largest single-
site manufacturer of graphite electrodes.
Established over 30 years ago, as part of
the LNJ Bhilwara group, the Company
focuses on manufacturing international
quality UHP (Ultra High Power) grade of
graphite electrodes. The Company’s
manufacturing facility, with a rated
capacity of 66,000 tonnes (soon to be
expanded to 80,000 tonnes) of graphite
electrodes, is located at Mandideep,
near Bhopal in Madhya Pradesh.
During the year under review, a part of
the proposed capacity expansion from
the earlier 66,000 tonnes to current
80,000 tonnes was executed. This
achievement further sharpened HEG
Limited’s focus on state-of-the-art
technology, higher quality, cost-
efficiencies and economies of scale. As
the Electric Arc Furnace (EAF) industry is
taking significant steps towards growth,
the capacity expansion is in line with the
expected demand rise.
HEG Limited, being a key exporter of
graphite electrodes, caters to global
demand, with a presence in the US,
Europe, Russia, the Middle east and
Southeast Asia. The Company’s client
base is impressive and spread over more
than 25 countries, with reputed steel
producers like Arcelor Mittal, POSCO,
Krupp Thyssen, Nucor, SAIL, TISCO,
Jindal and Hyundai, among others,
as clients.

HEG Limited20
During the downturn, the customers
who were then cautious and adopted a
wait-and-watch attitude, began
contributing to the Company’s
operational performance, as business
visibility improved. With its endeavour
to scale new heights, the Company is
assertively working towards expanding
its client base, thus opening new
avenues for growth and profitability.
Capacity utilisation was in the high
eighties, and the Company aims to
improve utilisation levels as demand
increases. Margins were at moderate
levels, due to muted realisations and
additional costs. The two main inputs in
this industry are needle coke and power.
Needle coke costs for CY 2011 were
frozen, with rates more or less similar to
those of the previous year. Power being
captive, the Company had access to
reliable, dependable and low cost
supply.
As the industry witnessed an uptick in
performance, order booking firmed up,
and the Company started booking
orders on a half-yearly basis compared
with previous orders, which were
dominantly on a quarterly rolling basis.
PowerFor HEG Limited, power is a key business
vertical, as it is a major input and cost
component. The Company has a total
rated captive power generation capacity
of around 77 MW, of which 64 MW is
generated through two thermal power
plants, and around 13.5 MW through
the hydroelectric power plant.
The three captive power plants are
strategically placed, with regard to the
graphite electrode manufacturing
facility, strengthening HEG Limited’s
unique business model.
As the Company increases the annual
manufacturing capacity of graphite
electrodes from 66,000 tonnes to
80,000 tonnes, the power requirement
will also increase to support additional
production. HEG’s foresighted planning
ensured that even at expanded electrode
capacities, the Company has sufficient
power resources to meet additional
requirements.
The two thermal power plants
performed at optimum capacity during a
major part of the year. The hydroelectric
power plant also operated at an ideal
capacity, due to sufficient water reserves
in the catchment area.
The Company continues to sell power on
a merchant sales basis and due to excess
capacities some of the surplus power is
sold on a daily basis until full capacity
production at expanded levels is
reached.
Review of financialperformanceDuring the year under review, revenues
increased marginally by 2% at `1,299.3
crore, from `1,268.5 crore in the
previous year. The EBITDA for the year
was at `262.3 crore as compared with
`354.0 crore in the previous year. The
profit before tax was `168.1crore
(`242.3crore in FY 2010), and the net
profit from ordinary activities after tax
was `128.9 crore (`171.1 crore in
FY 2010).
Segment-wise performanceThe graphite electrode division revenue
was marginally higher by 2% in FY 2011
at `1,079.4 crore as compared with
`1,062.8 crore in FY 2010. PBIT was at
`155.2 crore as compared with `256
crore in the previous year. The return on
sales was 14% during the year under
review.
In the power division, revenue was
higher by 7% at `196.7 crore as
compared with `183.8 crore in the
previous year. The PBIT of the power
division was higher by 14% at `46.6
crore compared with `41.9 crore in the
previous year. The return on sales was
24% as compared with 23% in the
previous year.
A strong balance sheet HEG Limited continues to portray a
strong, stable and sustainable balance
sheet. Largely on account of internal
accruals, net worth increased to `816.3
crore in FY 2011 from `730.6 crore last
year. As on 31st March, 2011, the long-
term debt was `275.41 crore, resulting
in a debt equity ratio of 0.34. The return
on net worth and capital employed were
16% and 12% respectively.
In March 2011, the Company
announced an offer of buy-back of
equity shares. The buy-back will take
place at a price not exceeding `350.0
per share. The total buy-back will not
exceed `67.5 crore, 9.95% of the total
paid up capital and free reserves as on
31st March, 2010. The last date for buy-
back is 13th March, 2012.
Opportunities and threatsHEG Limited continues to deliver
superior performance as one of the
world’s leading graphite electrode
manufacturers. The Company, with its
manufacturing facility at Mandideep,
Madhya Pradesh, the largest single-site
manufacturing unit globally, is rapidly
expanding capacities and developing
capabilities across functions.

Annual Report 2010-11 21
During 2010, the steel industry reached
record production of 1.4 billion tonnes,
an increase of 15% compared with the
corresponding period. The recovery of
the steel industry continues to be rapid,
despite the current economic and
political instability in a few countries
across the world. The Company’s
presence in one of the fastest-growing
industries poses huge opportunities for
growth. Supported by overall industry
growth, electric arc furnace production
is expected to grow at a faster pace,
with 2010 production clocking higher
by around 20% than 2009 levels. 2011
production is expected close to the peak
levels of 2007, and 2012 production is
expected to surpass earlier peak levels.
With higher environmental awareness,
there is an increased interest in steel
production through the electric arc
furnace route. This mounting interest
provides enormous opportunities for the
Company to augment its business and
escalate the investment scale.
To support the expected growth in
demand, HEG Limited is in the process
of expanding the graphite electrode
manufacturing facility capacity. The
Company is steadily expanding its
capacity from 66,000 tonnes to 80,000
tonnes, with the first phase of expansion
already operational, and the second and
final phase expected to be completed in
the near future.
HEG Limited has always invested in
expanding internal capabilities towards
building high-performance production
levels. The Company took advantage of
market opportunities by way of
increasing technological sophistication,
enhancing capacities, efficiencies,
productivity and quality improvement.
Regarding the key raw materials used to
manufacture graphite electrodes –
needle coke and power – the Company
is secure. Needle coke prices were frozen
for the entire year and supplies are
expected to be sufficient in the near
future. Power, being captive, is also
sufficient for the expanded production
capacity of graphite electrodes.
Realisations were muted for most part of
year however, with increased activity in
the industry expected to improve
realisation levels.
With regards to competition, the
Company operates in an oligopolistic
market, comprising few major players.
Due to the business being
technologically advanced, with a long
gestation period, few new greenfield
plants are expected to be established,
though brownfield expansions like
HEG’s are a trend throughout the
industry.
Risks and concernsEconomic recovery during the year
under review was positive, but was
affected by political unrest and natural
disasters. The protests, which resulted in
political instability in the Middle East
and North African nations, were crucial
in determining crude oil dynamics,
which is the engine of economic
growth. With oil prices soaring, the
world is facing a great threat, due to
most developed nations having a high
dependency on this resource.
The tragic events in Japan shook the

HEG Limited22
foundation of the global economy, but
are not expected to spurt recessionary
conditions again. This incident was one
of the world’s biggest disasters to have
affected such an advanced nation like
Japan, that the effects of this disaster on
the world economy are yet unknown.
HEG Limited’s clientele is diverse and
spread globally. The Company is
exposed to some risk, as economies all
over the world are affected by such
events and disasters, resulting in market
fluctuations. In the near future, negative
effects on a few orders will not affect
the Company’s performance to a great
extent, but continued undesirable
effects on the order book could prove
detrimental.
Due to its international transactions, the
Company is also exposed to foreign
currency fluctuation risk. Hence,
conscious efforts are made towards
mitigating volatility risks by employing
prudent hedging policies.
An operating concern for the Company
is working capital requirements. The
production process for graphite
electrodes is spread over a few months.
Difficulty in sourcing the right working
capital mix may affect operational
functioning and growth.
Another big challenge for the Company
is employee recruitment and retention.
Efforts are made to upskill people
capability, recognise the right talent and
appropriately reward them for their
contribution. The Company’s key focus
area is to build and maintain a healthy
and progressive work environment.
Research and DevelopmentResearch and development continues to
be one of HEG Limited’s key focus areas.
Research is aimed at identifying ways to
develop and sharpen technology,
improve operational practices, maximise
raw material utilisation from captive
sources, introduce advanced quality
control standards and preserve the
environment.
In March 2011, the Company announced an offer of buy-back of equity shares. The buy-back will take place at a
price not exceeding `350.0 per share. The total buy-back will not exceed `67.5 crore, 9.95% of total paid up capital
and free reserves as on March 31, 2010.
`67.5crore

Annual Report 2010-11 23
Building on the experience gained since
inception, the Company established
teams to ensure that process technology
is implemented in-line with the best
practices followed throughout the
industry. The Company entered into
collaborations with leading institutions
across India, like IIT Kanpur and RRL,
Bhopal, with an aim towards achieving
research and development goals.
Human ResourceIn the current competitive and global
business environment, HEG believes that
people are the key enablers for
organisational success. The Company
aims at developing progressive human
resource values, with the aim to improve
performance orientation, increase
transparency, professionalism and
accountability, and sharpen skills and
competency development.
Based on our long-term business plans,
we aim to identify, induct and train the
most appropriate human resources with
the latest techniques. Our existing work
force clearly defined growth and
business delivery models, charted as per
their performances, competencies and
scope of growth. Moreover, the
Company adopted mechanisms like
Balanced Score Card, towards improving
individual and macro-level
performances. We continuously work
towards introducing newer techniques,
with the aim to improve human
resource potential.
During 2010-11, employee strength
decreased to 1,049 as compared with
1,079 employees in the previous year.
There is adequate management
bandwidth commensurate with the size
of the operations, with responsibilities
shared appropriately and not dependent
on a single person. We have a team of
professionals who steer the operations
and monitor the Company’s growth
plans.
Industrial relationsAs in the past, industrial relations across
the Company were cordial, with no
labour unrests or strikes during the
period under review. This was the result
of the management’s and employee’s
continuous efforts to adopt a work
culture which suits the ever changing
needs of the people. As always, we
continue to emphasise on transparency
and boost ideas and innovations, which
provide a stimulus to the entire
organisation. We truly believe that
people are the core strength of any
organisation.
Fostering a quality-conscious organisationalstructureFocus on quality is of utmost priority at
HEG Limited. Quality consciousness
gained prominence over the years, not
only in the production process, but also
in organisational functioning.
Being a global manufacturer of graphite
electrodes, the Company initiated many
high-level processes to ensure superior
quality of products manufactured. Our
efforts over the years resulted in the
creation of non-lapsable, secure and
superior production at the Mandideep
facility, the largest, single site
manufacturing facility of graphite
electrodes in the world.

HEG Limited24
The Company, while working towards
capacity expansion from 66,000 tonnes
to 80,000 tonnes during the period
under review, revised the allocated
budget and infused an additional
investment, dedicated towards
capturing enhanced quality of processes
to ensure superior end results. This
emphasises the importance given to
increased technological sophistication
aimed at enhancing execution quality.
Apart from the above, the Company’s
workforce is continuously educated and
trained towards maintaining and
enhancing the quality of services
delivered. Measures such as
comprehensive Statistical Process
Control (SPC) systems and Six Sigma are
woven into various processes to ensure
systems strengthening. As a step
towards increasing automation of
functions, real time assessment was
incorporated via Electronic Data Capture
System, specifically designed to suit
organisational requirements.
Hence, the Company continues to be
recognised for its quality consciousness
and ability to deliver as per customer
needs.
Environmental and socialinitiativesEcological ImpactHEG developed world-class practices by
nurturing sustainability and protecting
the environment. We responded to the
emerging expectations of environmental
safety standards, giving it the utmost
importance. HEG Limited strictly adheres
to compliances and ensures minimal
harm to the environment.
As a step towards the same, we
increased our focus on recycling
by-products and waste at our
manufacturing facility. At the facility, we
give paramount importance to reduction
of energy consumption and pollution
emission. In fact, graphite electrodes are
used in electric arc furnaces, which are
in turn used for steel-making by melting
steel scrap. Hence, the entire cycle of the
EAF industry also focuses on
environmental conservation.
An integral part of HEG Limited’s
Corporate Social Responsibility initiative
is taking care of local community needs.
We adopted a few villages near
Mandideep as part of our CSR, where
we focus on macro and micro
development. Efforts are aimed towards
improving the standard of living and
providing impetus to growth. With the
idea that the youth is our future, we
initiated efforts towards enhancing their
skills and talents, providing them with a
better platform going forward.
Further, our education initiative took the
shape of the Graphite Education and
Welfare Society. Through this
organisation, we provide a high level of
education with an emphasis on growth
in technology and the importance of

Annual Report 2010-11 25
Information Technology in current
times. Hence, we have started ‘Smart
Classes’ to assist us deliver the same,
with the response being overwhelming.
During the year, we also allocated a
substantial budget towards medical
camps and associations with NGO’s.
These efforts were made towards
rendering meaningful assistance to the
common man, thereby strengthening
the fabric of society.
Internal Control Systemsand Risk ManagementThe Company has a strong and
adequate internal control system to
ensure safeguarding of assets,
maintenance of financial records,
due compliance of all applicable laws
and effective risk monitoring
and maintenance of management
information systems.
Risk management is affected through an
integrated process, with a formal system
established for regulatory and risk
management.
The organisational structure is well-
planned and ensures clear functional
authority limits aimed towards effective
authorisation of transactions. The
management closely tracks the
Company’s functioning through a
strong and effective reporting system,
established via the internal audit cell,
thereby enabling the management to
make informed decisions well in time.
Modern IT-enabled systems assist in
complete functioning and maintenance
of the reporting process in all divisions
of the offices, as well as the
manufacturing facility. This enables a
high degree of transparency to flow
through the reporting process, thereby
enabling a sound system of internal
controls. It also supports monitoring of
operating parameters, indicating any
material deviation from annual plans,
budgets and capital expenditure.
An independent check on the
management is established through
audit procedures, which the Board duly
recognises, further improving the
Company’s functioning.
OutlookConsidering HEG Limited’s success story
so far, the outlook continues to be
equally strong and bright. The Company
has great potential for growth in the
UHP grade graphite electrodes market,
which is growing from strength to
strength. The growth in the Electric Arc
Furnace route of steel production is
fuelled by the steel industry growth,
which is on an uptick, with production
nearly outperforming earlier record
levels.
HEG is well-equipped to meet and take
advantage of the industry’s rising
demand. The Company is in the process
of expanding its capacity from the earlier
rated 66,000 tonnes to 80,000 tonnes.
With the first phase of expansion in
operation, the total capacity expansion
to 80,000 tonnes is expected by October
2011.
Trade opportunities are increasing due
to excellent export prospects at
competitive prices. The Company’s
diverse global customer base helps
mitigate concentration risks. We
continue to focus on growing
economies and aim to maximise
favorable business opportunities.
HEG believes that it is well poised to
leverage its strengths and achievements
as a preferred global manufacturer of
UHP grade graphite electrodes, and take
bigger strides with favourable market
support going forward.
Cautionary statementStatements in this document that are
not historical facts are ‘forward-looking’
statements. These ‘forward-looking’
statements may include the Company’s
objectives, strategies, intentions,
projections, expectations, and
assumptions regarding the business and
the markets in which the Company
operates. The statements are based on
information which is currently available
to us, and the Company assumes no
obligation to update these statements as
circumstances change. There may be a
material difference between actual
results and those expressed herein. The
risks, uncertainties and important
factors that could influence the
Company’s operations and business are
the global and domestic economic
conditions, the market demand and
supply for products, price fluctuations,
currency and market fluctuations,
change in Government’s regulations,
statutes and tax regimes, and other
factors not specifically mentioned herein
but those that are common to the
industry.
HEG Limited26
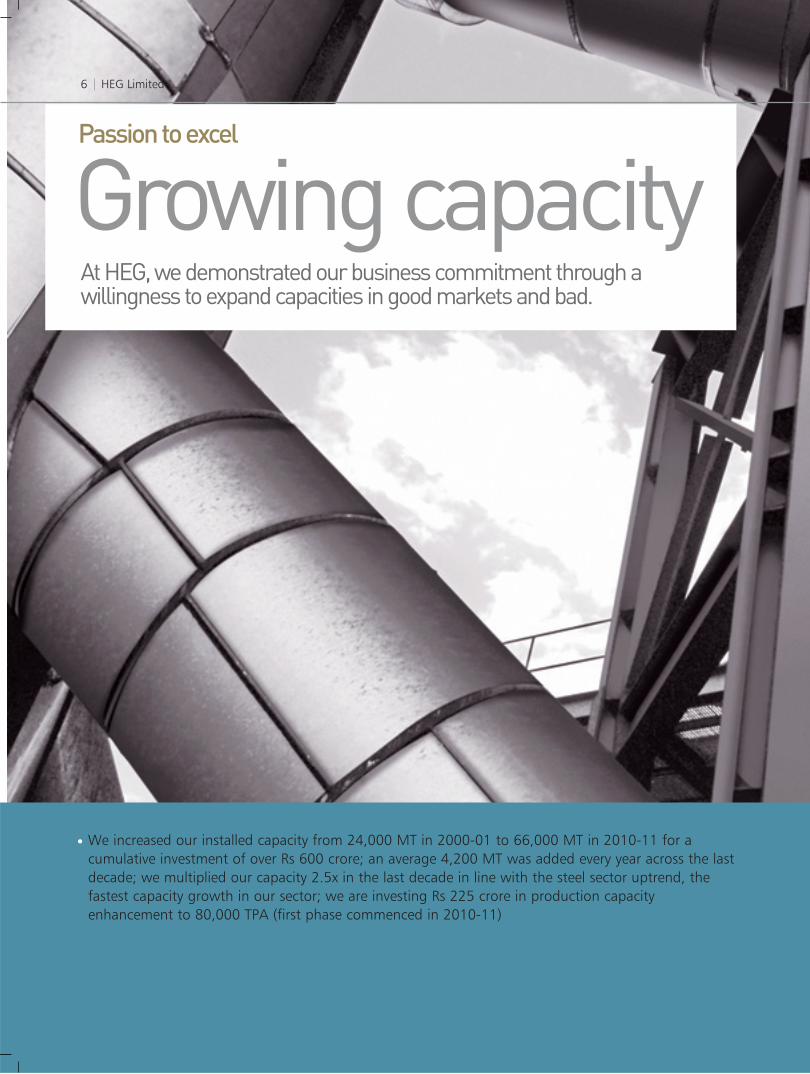
Your Directors have pleasure in presenting their 39th annual report and audited statements of accounts for the year ended 31st
March, 2011.
1. (i) Financial results
Directors’ Report
(` in crore)
2010-11 2009-10
Turnover :Domestic 444.95 461.17Export 854.31 807.27Less : Excise Duty 22.71 21.15
: Inter Division Sales 162.90 115.89Net Sales 1,113.65 1,131.40Other Income 38.43 14.99Total Income 1,152.08 1,146.39Profit before Interest, Depreciation and Amortisation 262.35 354.00Interest 36.62 59.26Profit before Depreciation and Amortisation 225.73 294.74Depreciation and Amortisation 57.65 52.41Profit Before Tax 168.07 242.32Provision for Taxation:-Current year 42.97 70.48Deferred (1.28) (0.09)Fringe Benefit Taxes - (0.01)Income Tax for earlier years (2.48) 0.88Net Profit for the Period 128.86 171.06EPS (Basic) 30.08 41.10EPS (Diluted) 30.08 40.91(ii) AppropriationsAmount available for appropriation 362.62 316.94Dividend :a) On Equity Shares
i) Interim Dividend 21.42 -ii) Proposed Dividend 21.42 42.83
b) Corporate Dividend Taxi) On Interim Dividend 3.41 -ii) On final Dividend 3.48 7.28
Transfer to :a) General Reserve 25.00 25.00b) Capital Redemption Reserve - 3.30c) Debenture Redemption Reserve 19.04 4.77Balance carried forward 268.85 233.76

Annual Report 2010-11 27
2. Overall PerformanceThe Company recorded Net Sales `1113.65 crore as comparedwith `1131.40 crore in the previous year. The Net Profit was at`128.86 crore as compared with `171.06 crore in 2009-10translating to basic earning per share at `30.08 as against`41.10 in FY 2009-10.
3. Subsidiary Company & ConsolidatedFinancial Statements The statement pursuant to Section 212 of the Companies Act,1956 relating to the Subsidiary Company ‘M/s HEG GraphiteProducts and Services Ltd’ is annexed. Also, the consolidatedfinancial statements along with the Auditors Report thereon,form part of the Annual Report.
In terms of the Circular of the Ministry of Corporate Affairsdated 8th February, 2011, the Board of Directors has decidednot to annex the annual accounts of the Subsidiary company inthis Annual Report. The annual accounts of the Subsidiarycompany and the related detailed information shall be madeavailable to the shareholders of the Company and theSubsidiary company seeking such information at any point oftime. The annual accounts of the Subsidiary Company shall alsobe kept for inspection by any shareholder at the registeredoffice of the Company and of the Subsidiary Company. TheCompany shall furnish a hard copy of details of accounts ofSubsidiary Company to any shareholder on demand.
4. DividendThe Board of Directors had approved the payment of Interim-Dividend @ `5/- per Equity Share of `10/- each at its meetingheld on the 7th February, 2011.
The Board, has recommended a final dividend at the rate of`5/- per share on Equity Shares of `10/- each for the financialyear ended 31s March, 2011, subject to your approval at theAnnual General Meeting.
5. OperationsGraphite ElectrodesDuring the year under review, the production volumes ofGraphite Electrodes were higher as compared with the lastfinancial year. Growth in volumes was offset by moderation inrealisations which contributed to lower margins.
Power GenerationHEG’s strategic planning resulted in reliable captive powergeneration of about 77 MW. The current capacity of power willbe self-sufficient even at expanded graphite electrode capacitylevels of 80,000 TPA.
6. Capacity Expansion of the GraphiteElectrode Plant at MandideepThe expansion plan of graphite electrode manufacturingcapacity of the Company to 80,000 TPA from current level of66,000 TPA is progressing as per schedule.
Phase I of the capacity expansion is operational, with fullcapacity commercial production expected to be operational byOctober 2011.
7. Buyback of its Equity Shares by theCompanyThe Board of Directors of the Company approved the Buybackof its Equity Shares from open market through Stock Exchangesvide a Resolution passed at its meeting held on the 14thMarch, 2011. The Buyback was approved for an aggregateamount upto `67.50 Crores. The Buyback of sharescommenced on the 11th April, 2011.
8. Corporate GovernanceA report on Corporate Governance forms part of the AnnualReport along with the Auditors’ Certificate on its compliance.
9. Management Discussion and AnalysisManagement Discussion and Analysis Report as required underthe Listing Agreements with the Stock Exchanges forms part ofthe Annual Report.
10. Internal Control Systems and AdequacythereofThe Company has an adequate internal control systemcommensurate with the size and nature of its business.
Internal audit programme covers various areas of activities andperiodical reports are submitted to the management. The AuditCommittee reviews financial statements and internal auditreports along with internal control systems. The Company hasa well-defined organisational structure, authority levels and
HEG Limited28
internal rules and guidelines for conducting businesstransactions.
11. Personnela) Industrial RelationsIndustrial relations during the period under review generallyremained cordial at all the plants of the Company.
b) Particulars of EmployeesThe information of employees receiving salary in excess of thelimits as prescribed under the provisions of sub section (2A) ofSection 217 of the Companies Act,1956, who were employedthroughout or for a part of the financial year under review isgiven as an annexure forming part of this Report.
12. Public DepositsYour Company has not invited any deposits from public/shareholders in accordance with Section 58A of the CompaniesAct, 1956.
13. Conservation of Energy, TechnologyAbsorption, Foreign Exchange Earnings andOutgoThe information with regard to Conservation of Energy,Technology Absorption, Foreign Exchange Earnings and Outgoin accordance with the provisions of Section 217(1)(e) of theCompanies Act, 1956 read with the Companies (Disclosures ofparticulars in the Report of Board of Directors) Rules, 1988, isgiven as an annexure forming part of this Report.
14. Directorsa) Shri Riju Jhunjhunwala at his request was relieved from theposition of Executive Director w.e.f. 27th July, 2010 andcontinues to be a Non-Executive Director
b) Three of your Directors namely Shri L.N. Jhunjhunwala, Dr.Kamal Gupta and Shri P. Murari shall retire by rotation at theensuing Annual General Meeting and being eligible, offerthemselves for re-appointment. The Board recommends theirreappointment.
c) LIC nominated Shri Lalit Mohan Lohani as its nominee on theBoard of the Company in place of Shri Mohanraj Nair. Hisappointment was approved w.e.f. 27th July, 2010. The Boardappreciates the services rendered by Shri Mohanraj Nair duringhis tenure as Director of the Company.
d) Your Directors inform you about the sad demise of Shri V.K.Mehta, who was Director on the Board of the Company andappreciate the valuable services rendered by Shri V K Mehtaduring his tenure as a Director of the Company. Shri Niket A.R.
Mehta, who was Alternate Director to Shri V.K. Mehta,consequently ceased to be the Alternate Director.
15. AuditorsM/s Doogar & Associates, Chartered Accountants and M/s S.S.Kothari Mehta & Co., Chartered Accountants, Auditors of theCompany, will retire from their office at the ensuing AnnualGeneral Meeting. They are, however, eligible for re-appointment. They have furnished a Certificate to the effectthat their appointment will be in accordance with limitsspecified in sub-section (IB) of Section 224 of the CompaniesAct, 1956. You are requested to consider their appointment.
The Auditors’ Report read alongwith notes to accounts is selfexplanatory and therefore does not call for any furthercomments.
16. Directors Responsibility StatementThe Directors confirm that:
(i) in preparation of the annual accounts, the applicableaccounting standards have been followed and there are nomaterial departures from the same;
(ii) they have selected such accounting policies and appliedthem consistently and made judgments and estimates that arereasonable and prudent so as to give a true and fair view of thestate of affairs of the Company at the end of the financial yearended 31st March, 2011 and of the profit of the Company forthe year under review;
(iii) they have taken proper and sufficient care for maintenanceof adequate accounting records in accordance with theprovisions of the Companies Act, 1956 for safeguarding theassets of the Company and for preventing and detecting fraudsand other irregularities; and
(iv) they have prepared the annual accounts on a goingconcern basis.
17. AcknowledgementsYour Directors wish to place on record, their appreciation forthe valuable assistance and support received by your Companyfrom banks, financial institutions, Central Government, Govt.of Madhya Pradesh, Govt. of Uttar Pradesh and theirdepartments. The Board also thanks the employees at all levels,for the dedication, commitment and hard work put in by themfor the Company’s achievements.
For and on Behalf of the Board of Directors
Place : Noida Ravi JhunjhunwalaDated: April 29, 2011 Chairman & Managing Director
Annual Report 2010-11 29
Annexure I to the Directors’ Report
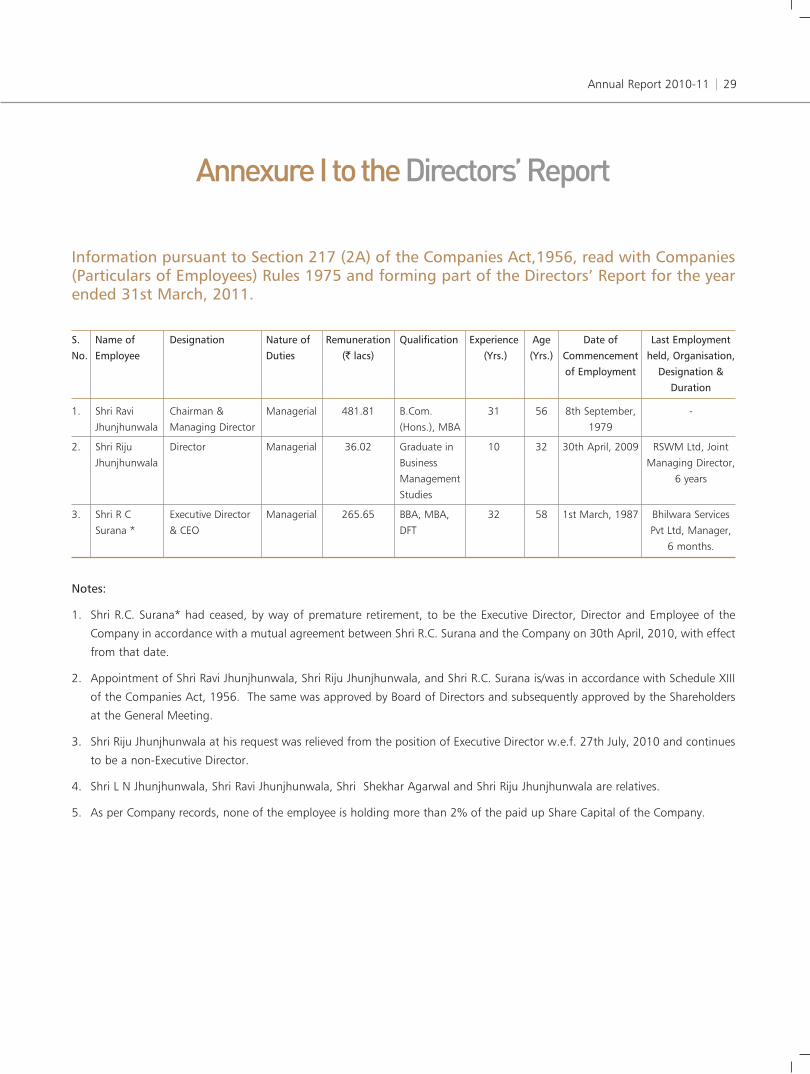
Information pursuant to Section 217 (2A) of the Companies Act,1956, read with Companies(Particulars of Employees) Rules 1975 and forming part of the Directors’ Report for the yearended 31st March, 2011.
S. Name of Designation Nature of Remuneration Qualification Experience Age Date of Last EmploymentNo. Employee Duties (` lacs) (Yrs.) (Yrs.) Commencement held, Organisation,
of Employment Designation &Duration
1. Shri Ravi Chairman & Managerial 481.81 B.Com. 31 56 8th September, -
Jhunjhunwala Managing Director (Hons.), MBA 1979
2. Shri Riju Director Managerial 36.02 Graduate in 10 32 30th April, 2009 RSWM Ltd, Joint
Jhunjhunwala Business Managing Director,
Management 6 years
Studies
3. Shri R C Executive Director Managerial 265.65 BBA, MBA, 32 58 1st March, 1987 Bhilwara Services
Surana * & CEO DFT Pvt Ltd, Manager,
6 months.
Notes:
1. Shri R.C. Surana* had ceased, by way of premature retirement, to be the Executive Director, Director and Employee of the
Company in accordance with a mutual agreement between Shri R.C. Surana and the Company on 30th April, 2010, with effect
from that date.
2. Appointment of Shri Ravi Jhunjhunwala, Shri Riju Jhunjhunwala, and Shri R.C. Surana is/was in accordance with Schedule XIII
of the Companies Act, 1956. The same was approved by Board of Directors and subsequently approved by the Shareholders
at the General Meeting.
3. Shri Riju Jhunjhunwala at his request was relieved from the position of Executive Director w.e.f. 27th July, 2010 and continues
to be a non-Executive Director.
4. Shri L N Jhunjhunwala, Shri Ravi Jhunjhunwala, Shri Shekhar Agarwal and Shri Riju Jhunjhunwala are relatives.
5. As per Company records, none of the employee is holding more than 2% of the paid up Share Capital of the Company.

HEG Limited30
Annexure II to the Directors’ Report
Statement of Particulars Pursuant to the Companies (Disclosure of Particulars in the Reportof Board of Directors) Rules, 1988
Information as Prescribed in Form A
Particulars Graphite
(A) Conservation of Energy(a) Energy Conservation Measures taken :
1. Installation of VFD in SA fan at CPP unit 1 & 2.
2. Installation of FRP blades in cooling tower fans of CPP.
(b) Additional investments & proposals, if any, being implemented for reduction of consumption of energy :1. Installation of new lighting transformer. Initial investment cost would be about ` 12 lacs.
2. Install/use thermostatic controllers for cooling tower.
3. Replacement of Al blade of cooling tower of hall#5 by FRP blade.
4. Installation of optimum rating energy efficient motors in CW pump
(c) Impact of measures at (a) & (b) for reduction of energy consumption & consequent impact on the cost ofproduction of goods :1. The saving in electrical energy consumption on account of the above implemented measure is in range of 13.61 lacs kwh
per year .
2. The proposed saving (1,2,3,4) for the project which is being implemented would be about in the range of 2.0 lacs kwh/
year.
2010-11 2009-10
Electricity
Purchased
Units (lacs) 3243.44 2585.76
Total amount (` lacs) 17462.08 13055.52
Rate / Unit (`) 5.38 5.05
Own Generation
Generated Units - -
Units / Litre of fuel oil - -
Cost of generation / Unit (`) - -
Fuel Consumption
Quantity (KL) 16115.135 11033.00
Total amount (` lacs) 5118.90 3027.67
Average rate per KL (`) 31765 27442
Computation / Unit of Production
Product description / Unit – MT Graphite Electrode
Electricity Consumed / Unit 5823 5897
Fuel Oil consumed (KL) / Unit 0.289 0.252

Annual Report 2010-11 31
(B) Technology AbsorptionThe particulars with respect of absorption in the prescribed form are given below:-
i) Research & Development (R & D)
1. Specific areas in which 1. Use of Advance characterisation techniques for understanding the properties of raw
R&D carried out by the materials as well as finished products.
Company 2. Exploring alternative methods & formulations to improve quality of graphite electrodes.
3. Development of Carbon / Graphite products for various applications such as Gas & Water
filters, Cryosorption pump, Fuel cell, Quick heat removal etc.
2. Benefits derived as a 1. Stringent quality control for raw materials.
result of the above R&D 2. Quality Improvement in Graphite Electrodes.
3. Carbon / Graphite products development used for Thermal, Energy, Environment and
Electronics Applications.
3. Future plan of action 1. Development of Specialty products like carbon / graphite rods and blocks and carbon-
carbon composites.
2. Development of Graphite based conductive coating material.
3. Development of Impregnated Activated Carbon Fabric (ACF) suitable for removal of
Pollutants and Toxic Gases.
(C) Export & Foreign Exchange Earnings and Outgo(` in Lacs)
Earnings : 80457.61
Outgo : 4060.98
4. Expenditure incurred on R&D
2010-11 2009-10
a) Capital 46.05 5.77
b) Recurring 118.13 173.43
c) Total 164.18 179.20
d) Total R&D expenditure as a percentage of total turnover 0.15 0.16
ii) Technological Absorption, Adaptation and Innovation
1. Efforts, in brief, made 1. Efforts made to develop high surface area ACF / ACS for various adsorption applications.
towards technology 2. Efforts made to develop 100% mesophase pitch from coal tar pitch.
absorption, adaption and 3. Efforts made to scale-up know how (taken from National Research Development
innovation Corporation, New Delhi) for development of Porous Conducting Carbon Paper for fuel
cell application.
2 Benefits derived as a result Scope for new business in Carbon / Graphite specialties.
of the above efforts
3 In case of recently imported Nil.
technology the requisite All our efforts are made through in house R&D activities and collaborative research in India.
information, in brief
(` in lacs)

HEG Limited32
Statement Pursuant to Section 212 of the Companies Act,1956 Relating to Subsidiary Companies
1 Name of the subsidiary company HEG Graphite Products and Services Limited
2 Financial year of the subsidiary company Year ended 31st March, 2011
3 Extent of the interest of holding company in the subsidiary company 100% (wholly owned subsidiary)
4 Total advances made by the holding company to the subsidiary company Nil
stood as at the close of financial years ended 31st March, 2011
5 Net aggregate amount of subsidiary’s Profit / (Losses) so far as they
concern members of holding company and not dealt within the
holding company’s account :
i) For subsidiary financial year (67,575)
ii) For subsidiary’s previous financial years since it became subsidiary (48,680)
6 Net Aggregate amount of subsidiary’s Profit / (Losses) so far as they
concern members of holding company and dealt within the holding
company’s account :
i) For subsidiary Financial Year Nil
ii) For subsidiary’s Previous Financial years since it became subsidiary Nil
7 As the financial year of the subsidiary company does not coincide with
the financial year of the holding Company, information u/s 212 (5) of
the Companies Act, 1956 is given below:-
a) Is there any changes in the holding company’s interest in the N.A.
subsidiary company between the end of the financial year of
the subsidiary company and the holding Company
b) Is there any material changes which have occurred between the N.A.
ended of financial year of subsidiary company and end of
financial year of holding company
i) Fixed Assets of subsidiary company N.A.
ii) Investments of subsidiary company N.A.
iii) Money lent by the subsidiary Company N.A.
iv) Total advances made by the holding company N.A.
as on 31st March, 2011

Annual Report 2010-11 33
The expansion plan of graphite electrode manufacturing capacity of the Company to 80,000 TPA from current level of 66,000TPA is progressing as per schedule. Phase I of the capacity expansion is operational, with full capacity commercial productionexpected to be operational by October 2011.

HEG Limited34
1. Company’s Philosophy on CorporateGovernanceThe Company’s philosophy on Corporate Governance envisages
the attainment of the highest levels of transparency,
accountability and equity, in all facets of its operations, and all
its interactions with the stakeholders including shareholders,
employees, customers, government, suppliers and lenders and
to build the confidence of the society in general. The Company
believes in adopting the philosophy of professionalism,
transparency and accountability in all areas and is committed
to pursue growth by adhering to the highest national and
international standards of Corporate Governance.
2. Board of Directors(i) CompositionThe Board has an appropriate composition of Executive and
Independent Directors. The Independent Directors on the
Board are experienced, competent and highly reputed persons
from their respective fields. The Independent Directors take
active part at the Board and Committee Meetings, which adds
value in the decision making process of the Board of Directors.
The details of composition of the Board, number of other
Directorship, Chairmanship/Membership of Committee of each
Director in other Companies, attendance of Directors at the
Board Meetings and last Annual General Meeting are given
below:
Corporate Governance Report
Name of Director Category of No. of other Board Committees* in No. of Board WhetherDirectorship Directorships other Companies in which Meetings attended the
in public Ltd. Member Chairman attended last AGMCompanies Yes/No
Shri L N Jhunjhunwala Chairman Emeritus-
Promoter Non-Executive 06 02 0 0 No
Shri Ravi Jhunjhunwala Chairman & Managing
Director-Promoter Executive 09 01 02 07 No
Shri Shekhar Agarwal Vice-Chairman-Promoter
Non-Executive 05 03 0 07 No
Shri D N Davar Non-Executive & Independent 14 05 04 07 Yes
Dr. Kamal Gupta Non-Executive & Independent 06 02 05 06 No
Shri K N Memani Non-Executive & Independent 12 05 05 03 No
Shri P Murari Non-Executive & Independent 09 05 01 01 No
Shri Lalit Mohan Lohani Non-Executive & Independent 0 0 0 03 No
(LIC Nominee)
Dr. O. P. Bahl Non-Executive & Independent 01 0 0 06 No
Shri Riju Jhunjhunwala Director-Promoter–Non-Executive 04 04 0 07 No
* Only Audit Committee and Shareholders Grievance Committee have been considered.
Note: Shri L N Jhunjhunwala, Shri Ravi Jhunjhunwala, Shri Shekhar Agarwal and Shri Riju Jhunjhunwala are relatives.

Annual Report 2010-11 35
(ii) Shareholding of Non-Executive DirectorsThe number of Equity Shares of the Company held by Non-
Executive Directors of the Company are as under:-
Name of Director No. of Equity Shares held
Shri L N Jhunjhunwala 179740
Shri D N Davar 1000
Dr. Kamal Gupta 200
Shri Riju Jhunjhunwala 233290
(iii) Board MeetingsThe Board meets at least once in every quarter to review
quarterly results and other items on agenda. Additional
meetings are held when necessary. Seven Board Meetings
were held during the financial year ended 31st March, 2011.
These were held on 8th April, 2010, 30th April, 2010, 27th
July, 2010, 28th October, 2010, 1st February, 2011, 7th
February, 2011 and 14th March, 2011.
3. Audit Committee(i) Broad Terms of ReferenceThe terms of reference of the Audit Committee are as per
Section 292 A of the Companies Act,1956 and the guidelines
set out in the listing agreements with the Stock Exchanges that
inter-alia include overseeing financial reporting processes,
reviewing periodic financial results, reviewing with the
management the financial statements and adequacy of internal
control systems, reviewing the adequacy of internal audit
function, risk management, discussions with the Internal and
Statutory Auditors about the scope of audit including the
observations of the auditors and discussion with them on any
significant findings.
(ii) Composition of the CommitteeThe composition of the Audit Committee is as under:-
Sl Name of Designation Category
No. Director
1. Shri D.N. Davar Chairman Non-Executive
Independent Director
2. Shri Shekhar Member Non-Executive
Agarwal Promoter Director
3. Dr. Kamal Gupta Member Non-Executive
Independent Director
All these Directors possess knowledge of Corporate Finance,
Accounts & Corporate Laws. The Statutory Auditors, Internal
Auditors and Senior Executives of the Company are invited to
attend the meetings of the Committee, whenever necessary.
The Company Secretary acts as Secretary of the Committee.
(iii) Meetings and AttendanceDuring the financial year ended 31st March, 2011, four
meetings were held on 30th April, 2010, 27th July, 2010, 28th
October, 2010 and 1st February, 2011.
The attendance at the above Meeting was as under: -
Sl No. Name of Director No. of meetings attended
1. Shri D.N. Davar 4
2. Shri Shekhar Agarwal * 2
3. Dr. Kamal Gupta 4
4. Shri Mohanraj Nair * 1
* Shri Mohanraj Nair, was Nominee Director of LIC and also a
Member of Audit Committee. He ceased to be Director in the
Company w.e.f. 27th July, 2010. Shri Shekhar Agarwal was
inducted as member of the Audit Committee w.e.f. 27th July,
2010.

HEG Limited36
4. Remuneration Committeei) Broad Terms of ReferenceTo review & decide the policy on specific remuneration package
of Managing Director and other whole time Directors.
ii) Composition of the CommitteeThe composition of the Remuneration Committee is as under:-
Sl Name of Designation Category
No. Director
1. Shri D.N. Davar Chairman Non-Executive
Independent Director
2. Dr. Kamal Gupta Member Non-Executive
Independent Director
3. Dr. O.P. Bahl Member Non-Executive
Independent Director
The Company Secretary acts as Secretary of the Committee.
iii) Meetings and AttendanceDuring the financial year ended 31st March, 2011, two
meetings were held on 30th April, 2010 and 1st February,
2011.
The attendance at the above Meeting was as under: -
Sl No. Name of the Director No. of Meetings attended
1. Shri D.N. Davar 2
2. Dr. Kamal Gupta 2
3. Dr. O.P. Bahl * 1
4. Shri Mohanraj Nair * 1
* Shri Mohanraj Nair, was Nominee Director of LIC and also a
Member of Remuneration Committee. He ceased to be Director
in the Company w.e.f. 27th July, 2010. Dr. O P Bahl, was
inducted as member of the Remuneration Committee w.e.f.
27th July, 2010.
iv) Remuneration PolicyThe Company’s remuneration policy is based on the principles
of (i) pay for responsibility (ii) pay for performance and
potential and (iii) pay for growth. The Company pays
remuneration to the Chairman & Managing Director and
Executive Directors while Non Executive Directors are paid
sitting fees only. The remuneration of Chairman & Managing
Director and Executive Directors is decided by the Board of
Directors, on recommendations of the Remuneration
Committee and thereafter approved by the shareholders.
Name of Director Salary Benefits Commission Sitting Fee Total
Shri Ravi Jhunjhunwala 6418571 6117785 35644690 - 48181046
Shri Riju Jhunjhunwala 774194 806076 1901376 120000 3601646
Shri R C Surana * 20255000 6310188 - - 26565188
Shri L. N. Jhunjhunwala - - - - -
Shri Shekhar Agarwal - - - 220000 220000
Shri D. N. Davar - - - 460000 460000
Shri K. N. Memani - - - 60000 60000
Dr. Kamal Gupta - - - 420000 420000
Shri P. Murari - - - 20000 20000
Shri Mohan Raj Nair ** - - - 80000 80000
Shri Lalit Mohan Lohani ** - - - 60000 60000
Dr. O.P. Bahl - - - 400000 400000
* Shri R C Surana had ceased by way of premature retirement to be the Executive Director, Director and Employee of the Company
in accordance with a mutual agreement between Shri R C Surana and the Company w.e.f. 30th April, 2010.
** Shri Lalit Mohan Lohani was nominated by Life Insurance Corporation of India, as its Nominee Director in place of Shri Mohan
Raj Nair with effect from 27th July, 2010.
(v) Details of Remuneration to the Directors for the year ended 31st March, 2011 (Amount in `)

Annual Report 2010-11 37
5. Shareholders’ / Investors’ GrievanceCommittee(i) Composition of the CommitteeThe composition of the Committee is as under:-
Sl Name of Designation CategoryNo. Director
1. Shri L.N. Chairman Non Executive Jhunjhunwala Promoter Director
2. Shri Ravi Member Executive PromoterJhunjhunwala Director
3. Dr. Kamal Member Non Executive Gupta Independent Director
Shri Ashish Sabharwal, Company Secretary is the ComplianceOfficer.
(ii) Meetings and AttendanceDuring the financial year ended 31st March, 2011, two meetingswere held on 28th October, 2010 and 25th March, 2011.
The attendance at the above Meetings was as under: -
Sl No. Name of the Director No. of Meetings attended
1. Shri L.N. Jhunjhunwala -2. Shri Ravi Jhunjhunwala 23. Dr. Kamal Gupta 2
The Company received 43 complaints during the year and allwere resolved to the satisfaction of the shareholders. There wasno valid request for transfer of shares pending as on31.03.2011.
6. General Body Meetings a. Annual General MeetingThe last three Annual General Meetings were held as per detailbelow:
Date of Relevant Venue/ Time of Whether AGM Financial Location Meeting any special
Year where held resolutionpassed
27th Sept, 2007-2008 Mandideep, 12.30 P.M. No
2008 (Near Bhopal)
Distt Raisen (M.P.)
Pin – 462046
19th Sept, 2008-2009 Mandideep, 12.30 P.M. No
2009 (Near Bhopal)
Distt Raisen (M.P.)
Pin – 462046
20th Sept, 2009-2010 Mandideep, 2.00 P.M. No
2010 (Near Bhopal)
Distt Raisen (M.P.)
Pin – 462046
b. Extraordinary General MeetingTwo Extraordinary General Meetings were held during thefinancial year 2010-11 as per detail below:
Date of Relevant Venue/Location Time of Whether anyEOGM Financial where held Meeting special resolution
Year passed
7th 2010-11 Mandideep, 2.00 P.M. YesMay, (Near Bhopal),2010 Distt Raisen (M.P.)
Pin – 46204611th 2010-11 Mandideep, 2.00 P.M. YesMarch, (Near Bhopal),2011 Distt Raisen (M.P.)
Pin – 462046
There were no matters required to be passed by theshareholders through postal ballot, in any of the aforesaidmeetings, as required under the provisions of Section 192A ofthe Companies Act, 1956.
There are no matters proposed to be passed by the Companythrough postal ballot in the ensuing Annual General Meeting.
7. Disclosures(i) There are no materially significant transactions with therelated parties viz. Promoters, Director or the Management,their Subsidiaries or relatives conflicting with Company'sinterest. Suitable disclosure as required by the AccountingStandard (AS18) has been made in the Annual Report.
(ii) There are no pecuniary relationships or transactions of non-executive directors vis-à-vis the Company that have a potentialconflict with the interests of the Company.
(iii) No penalties or strictures have been imposed on theCompany by Stock Exchange or SEBI or any statutory authorityon any matter related to capital markets during last three years.
(iv) The Company has complied with the mandatoryrequirements and complied with the non-mandatoryrequirements relating to the remuneration committee to theextent detailed above.
(v) No personnel has been denied any access to the AuditCommittee of the Company.
(vi) The Company has complied with all the applicableAccounting Standards.
(vii) The Chairman & Managing Director and Chief FinancialOfficer have certified to the Board, interalia the accuracy offinancial statements and adequacy of Internal Controls for thefinancial reporting purpose as required under Clause 49(V) ofthe Listing Agreement, for the year ended 31.03.2011.
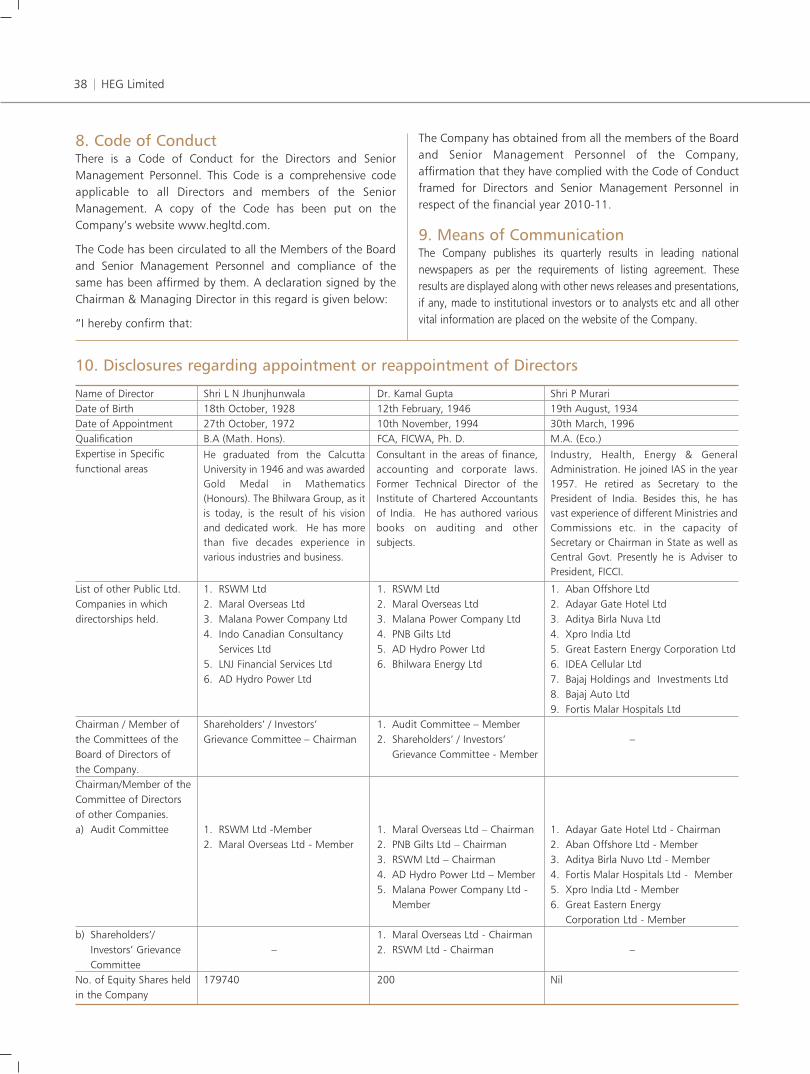
HEG Limited38
8. Code of ConductThere is a Code of Conduct for the Directors and SeniorManagement Personnel. This Code is a comprehensive codeapplicable to all Directors and members of the SeniorManagement. A copy of the Code has been put on theCompany’s website www.hegltd.com.
The Code has been circulated to all the Members of the Boardand Senior Management Personnel and compliance of thesame has been affirmed by them. A declaration signed by theChairman & Managing Director in this regard is given below:
“I hereby confirm that:
The Company has obtained from all the members of the Boardand Senior Management Personnel of the Company,affirmation that they have complied with the Code of Conductframed for Directors and Senior Management Personnel inrespect of the financial year 2010-11.
9. Means of CommunicationThe Company publishes its quarterly results in leading nationalnewspapers as per the requirements of listing agreement. Theseresults are displayed along with other news releases and presentations,if any, made to institutional investors or to analysts etc and all othervital information are placed on the website of the Company.
Name of Director Shri L N Jhunjhunwala Dr. Kamal Gupta Shri P MurariDate of Birth 18th October, 1928 12th February, 1946 19th August, 1934Date of Appointment 27th October, 1972 10th November, 1994 30th March, 1996Qualification B.A (Math. Hons). FCA, FICWA, Ph. D. M.A. (Eco.)Expertise in Specific functional areas
List of other Public Ltd. 1. RSWM Ltd 1. RSWM Ltd 1. Aban Offshore LtdCompanies in which 2. Maral Overseas Ltd 2. Maral Overseas Ltd 2. Adayar Gate Hotel Ltddirectorships held. 3. Malana Power Company Ltd 3. Malana Power Company Ltd 3. Aditya Birla Nuva Ltd
4. Indo Canadian Consultancy 4. PNB Gilts Ltd 4. Xpro India LtdServices Ltd 5. AD Hydro Power Ltd 5. Great Eastern Energy Corporation Ltd
5. LNJ Financial Services Ltd 6. Bhilwara Energy Ltd 6. IDEA Cellular Ltd6. AD Hydro Power Ltd 7. Bajaj Holdings and Investments Ltd
8. Bajaj Auto Ltd9. Fortis Malar Hospitals Ltd
Chairman / Member of Shareholders’ / Investors’ 1. Audit Committee – Memberthe Committees of the Grievance Committee – Chairman 2. Shareholders’ / Investors’ –Board of Directors of Grievance Committee - Memberthe Company.Chairman/Member of theCommittee of Directors of other Companies.a) Audit Committee 1. RSWM Ltd -Member 1. Maral Overseas Ltd – Chairman 1. Adayar Gate Hotel Ltd - Chairman
2. Maral Overseas Ltd - Member 2. PNB Gilts Ltd – Chairman 2. Aban Offshore Ltd - Member3. RSWM Ltd – Chairman 3. Aditya Birla Nuvo Ltd - Member4. AD Hydro Power Ltd – Member 4. Fortis Malar Hospitals Ltd - Member5. Malana Power Company Ltd - 5. Xpro India Ltd - Member
Member 6. Great Eastern EnergyCorporation Ltd - Member
b) Shareholders’/ 1. Maral Overseas Ltd - ChairmanInvestors’ Grievance – 2. RSWM Ltd - Chairman –Committee
No. of Equity Shares held 179740 200 Nilin the Company
10. Disclosures regarding appointment or reappointment of Directors
He graduated from the CalcuttaUniversity in 1946 and was awardedGold Medal in Mathematics(Honours). The Bhilwara Group, as itis today, is the result of his visionand dedicated work. He has morethan five decades experience invarious industries and business.
Consultant in the areas of finance,accounting and corporate laws.Former Technical Director of theInstitute of Chartered Accountantsof India. He has authored variousbooks on auditing and othersubjects.
Industry, Health, Energy & GeneralAdministration. He joined IAS in the year1957. He retired as Secretary to thePresident of India. Besides this, he hasvast experience of different Ministries andCommissions etc. in the capacity ofSecretary or Chairman in State as well asCentral Govt. Presently he is Adviser toPresident, FICCI.

Annual Report 2010-11 39
11. Shareholders Information
a) Annual General Meeting: 16th September, 2011 at 2.00 p.m. at the Registered Office of the Company at
Date & Time, Venue Mandideep, Near Bhopal, Distt. Raisen, Madhya Pradesh - 462 046.
b) Financial Calendar: Financial Year: 1st April, 2011 – 31st March, 2012.
Reporting:
(a) First Quarter Results - Within 45 days of end of the 1st Qtr
(b) Second Quarter Results - Within 45 days of end of the 2nd Qtr
(c) Third Quarter Results - Within 45 days of end of the 3rd Qtr
(d) Results for the FY - Within 60 days of end of the FY
c) Date of Book Closure 6th September, 2011 to 16th September, 2011 (both days inclusive)
d) Dividend payment date The dividend, if declared, shall be paid/dispatched to the shareholders between
September 26, 2011 and September 29, 2011.
e) Listing of :
(i) Shares on Stock Exchanges (i) 1. Bombay Stock Exchange Ltd.
2. National Stock Exchange of India Ltd.
3. Madhya Pradesh Stock Exchange Ltd.
(ii) Non-convertible Debentures (ii) WDM segment of Bombay Stock Exchange Ltd.
Listing Fee, as prescribed has been duly paid.
f) Stock Code/ISIN No. (i) Equity Shares:
BSE: 509631
NSE: HEG
ISIN No.: INE 545A01016
(ii) Non-convertible Debentures:
ISIN No.: INE545A07039, INE545A07047, INE545A07054
Month High Low High Low High Low
April, 2010 388.00 341.00 387.60 340.10 18047.86 17276.80
May, 2010 376.00 307.00 376.00 307.15 17536.86 15960.15
June, 2010 333.65 301.30 333.90 302.00 17919.62 16318.39
July, 2010 366.00 305.45 369.40 306.20 18237.56 17395.58
August, 2010 334.00 306.60 333.80 306.00 18475.27 17819.99
September, 2010 341.50 297.10 341.70 298.00 20267.98 18027.12
October, 2010 326.00 270.00 321.00 270.50 20854.55 19768.96
November, 2010 308.40 245.50 309.60 245.00 21108.64 18954.82
December, 2010 305.45 233.00 288.00 235.50 20552.03 19074.57
January, 2011 288.00 200.00 267.70 199.00 20664.80 18038.48
February, 2011 209.75 171.70 208.50 176.40 18690.97 17295.62
March, 2011 226.20 199.00 226.20 197.10 19575.16 17792.17
g. i) Market Price Data: Monthly High Low values (in `) at NSE & BSE and comparison with BSE Sensex.
NSE BSE BSE SENSEX

HEG Limited40
ii) Comparative chart of Company’s share price movement vis-à-vis the movement of BSE Sensex during FY 2010-11:
No. of equity shares held No. of shareholders % of shareholders No. of shares held % of sharehoding
1-500 36766 94.95 3849106 8.98
501-1000 1064 2.75 808835 1.89
1001-2000 441 1.14 657098 1.53
2001 – 3000 152 0.39 381719 0.89
3001 – 4000 52 0.13 184561 0.43
4001 – 5000 43 0.11 201330 0.47
5001 – 10000 77 0.20 566990 1.32
10001 and above 127 0.33 36195268 84.48
Total 38722 100.00 42844907 100.00
j) Distribution of shareholding as on 31st March, 2011.
h) Registrar or Transfer Agent M/s. MCS Ltd.
F-65, Ist Floor,Okhla Industrial Area, Phase-I, New Delhi-110020.
E-mail for Investor Grievances: [email protected]
i) Share Transfer System: Share Transfers are attended and registered on fortnightly basis and the same are returned
within 30 days from the date of receipt, if the documents are in order in all respects.
Apr
500
450
400
350
387.6376
333.9 333.8
369.4
18047.86
17536.86
17919.62
300
250
200
150
100
50
22,000
21,000
20,000
19,000
18,000
17,000
16,000
15,000
14,000
13,000
12,000
11,000
10,000May Jun Jul Aug Sep Oct Nov Dec Jan Feb Mar
18237.56 341.7321
309.6288
267.7
208.5
226.2
18475.27
20267.98
20854.55
21108.64
20552.03
20664.80
18690.97
19575.16
BSEHEG

Annual Report 2010-11 41
Category No. of shareholders % of shareholders No. of shares held %age of
shareholding
Promoters and Promoter Group 25 0.06 22396508 52.27
Mutual Funds / UTI 10 0.03 1159834 2.71
Financial Institutions / Banks 11 0.03 8152 0.02
Insurance Companies 5 0.01 4356875 10.17
Foreign Institutional Investors 31 0.08 1170658 2.73
Bodies Corporate 936 2.42 3399305 7.93
Individuals 37215 96.11 6857308 16.00
Others:
I) Trusts 5 0.01 25283 0.06
II) Foreign Corporate Bodies 2 0.01 3266762 7.62
III) NRI Individuals 482 1.24 204222 0.48
Total 38722 100.00 42844907 100.00
k) Category of Shareholders
l) Dematerialisation of shares 4,12,90,017 shares were dematerialised till 31.3.2011 which was 96.37% of the total
and liquidity. paid up Equity Share Capital of the Company on that date. Trading in shares of the Company
is permitted in dematerialised form only.
m) Outstanding GDRs/ADRs/
Warrants or any Convertible There are no such instruments outstanding as on 31st March, 2011.
instruments, conversion date
and likely impact on equity.
n) Plant Locations a) Mandideep (Near Bhopal), Distt. Raisen, Madhya Pradesh - 462 046.
b) Village Ranipur, Tawa Nagar, Distt. Hoshangabad – 461 001.
o) Address for correspondence: HEG Ltd.
Secretarial Department
Bhilwara Towers,
A-12, Sector –1, NOIDA-201301
Phone: 0120-4390300, 4390000
Fax: 0120-2531648, 2531745
E-mail: [email protected]
Website: www.hegltd.com

HEG Limited42
Compliance Certificate
To
The Members of
HEG Limited
We have reviewed the implementation of Corporate Governance procedures by the Company during the year ended 31st March,
2011, with the relevant records and documents maintained by the Company, furnished to us for our review and the report on
Corporate Governance as approved by the Board of Directors.
The compliance of conditions of Corporate Governance is the responsibility of the management. Our examination is neither an
audit nor an expression of opinion on the financial statements of the Company.
On the basis of the above and according to the information and explanations given to us, in our opinion, the Company has
complied in all material respects with the conditions of Corporate Governance as stipulated in Clause 49 of the Listing Agreement
with the Stock Exchanges.
We further state that our examination of such compliance is neither an assurance as to the viability of the Company nor the
efficiency or effectiveness with which the management has conducted the affairs of the Company.
For S. S. Kothari Mehta & Co. For Doogar & Associates
Chartered Accountants Chartered Accountants
Firm Regn. No. 000756N Firm Regn. No.000561N
Arun K Tulsian Mukesh Goyal
Partner Partner
Membership No. 089907 Membership No. 081810
Place: Noida (U.P.)
Date: 29th April, 2011
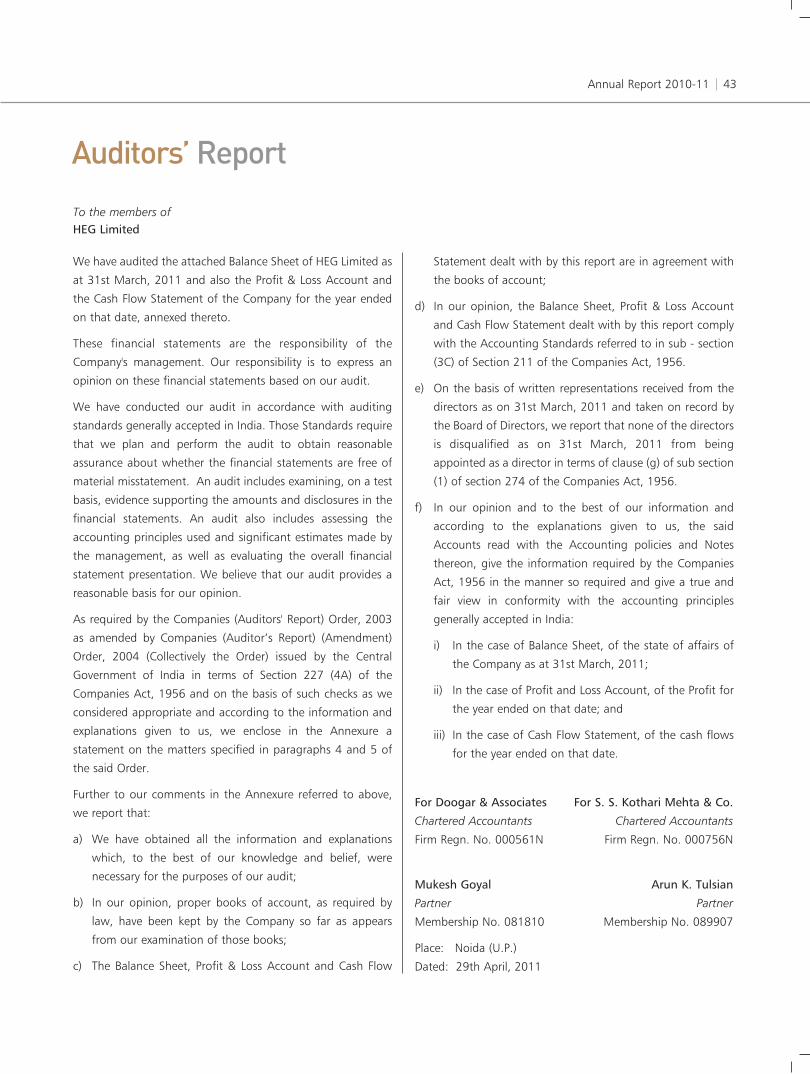
Annual Report 2010-11 43
Auditors’ Report
To the members ofHEG Limited
We have audited the attached Balance Sheet of HEG Limited as
at 31st March, 2011 and also the Profit & Loss Account and
the Cash Flow Statement of the Company for the year ended
on that date, annexed thereto.
These financial statements are the responsibility of the
Company's management. Our responsibility is to express an
opinion on these financial statements based on our audit.
We have conducted our audit in accordance with auditing
standards generally accepted in India. Those Standards require
that we plan and perform the audit to obtain reasonable
assurance about whether the financial statements are free of
material misstatement. An audit includes examining, on a test
basis, evidence supporting the amounts and disclosures in the
financial statements. An audit also includes assessing the
accounting principles used and significant estimates made by
the management, as well as evaluating the overall financial
statement presentation. We believe that our audit provides a
reasonable basis for our opinion.
As required by the Companies (Auditors' Report) Order, 2003
as amended by Companies (Auditor’s Report) (Amendment)
Order, 2004 (Collectively the Order) issued by the Central
Government of India in terms of Section 227 (4A) of the
Companies Act, 1956 and on the basis of such checks as we
considered appropriate and according to the information and
explanations given to us, we enclose in the Annexure a
statement on the matters specified in paragraphs 4 and 5 of
the said Order.
Further to our comments in the Annexure referred to above,
we report that:
a) We have obtained all the information and explanations
which, to the best of our knowledge and belief, were
necessary for the purposes of our audit;
b) In our opinion, proper books of account, as required by
law, have been kept by the Company so far as appears
from our examination of those books;
c) The Balance Sheet, Profit & Loss Account and Cash Flow
Statement dealt with by this report are in agreement with
the books of account;
d) In our opinion, the Balance Sheet, Profit & Loss Account
and Cash Flow Statement dealt with by this report comply
with the Accounting Standards referred to in sub - section
(3C) of Section 211 of the Companies Act, 1956.
e) On the basis of written representations received from the
directors as on 31st March, 2011 and taken on record by
the Board of Directors, we report that none of the directors
is disqualified as on 31st March, 2011 from being
appointed as a director in terms of clause (g) of sub section
(1) of section 274 of the Companies Act, 1956.
f) In our opinion and to the best of our information and
according to the explanations given to us, the said
Accounts read with the Accounting policies and Notes
thereon, give the information required by the Companies
Act, 1956 in the manner so required and give a true and
fair view in conformity with the accounting principles
generally accepted in India:
i) In the case of Balance Sheet, of the state of affairs of
the Company as at 31st March, 2011;
ii) In the case of Profit and Loss Account, of the Profit for
the year ended on that date; and
iii) In the case of Cash Flow Statement, of the cash flows
for the year ended on that date.
For Doogar & Associates For S. S. Kothari Mehta & Co.
Chartered Accountants Chartered Accountants
Firm Regn. No. 000561N Firm Regn. No. 000756N
Mukesh Goyal Arun K. Tulsian
Partner Partner
Membership No. 081810 Membership No. 089907
Place: Noida (U.P.)
Dated: 29th April, 2011

HEG Limited44
Annexure to Auditors’ Report
(Annexure referred to in our report of even date)
1. a) The Company has maintained proper records showing fullparticulars including quantitative details and situation offixed assets.
b) Verification of the fixed assets is being conducted based ona programme by the management designed to cover allassets over a period of three years, which, in our opinion,is reasonable having regard to the size of the Companyand nature of its business. Discrepancies noticed on suchverification as compared to book records were not materialand have been properly adjusted in the books of account.
c) No Substantial part of the fixed assets was disposed offduring the year.
2. a) The inventory has been physically verified during the yearby the management at all its locations, except stocks lyingwith third parties and in transit which have been verifiedwith reference to correspondence of third parties orsubsequent receipts of goods. In our opinion, thefrequency of such verification is reasonable.
b) The procedures for the physical verification of inventoryfollowed by the management are, in our opinion,reasonable and adequate in relation to the size of theCompany and nature of its business.
c) In our opinion, the Company is maintaining proper recordsof inventory. The discrepancies noticed on physicalverification of inventory as compared to book records werenot material and have been properly dealt with in thebooks of account.
3. a) The Company has not granted any loans, secured orunsecured, to companies, firms or other parties covered inthe register maintained under section 301 of theCompanies Act, 1956. Accordingly clauses 4 (iii) (b) to (d)of the Order are not applicable.
b) The Company has not taken any loan, secured orunsecured, from companies, firms or other parties coveredin the register maintained under section 301 of theCompanies Act, 1956. Accordingly clauses 4 (iii) (f) and (g)of the Order are not applicable.
4. In our opinion, and according to the information andexplanations given to us during the course of audit, there areadequate internal control systems commensurate with size ofthe Company and the nature of its business with regard topurchase of inventory and fixed assets and for the sale ofgoods and services. Further, on the basis of our examinationof the books & records of the Company, carried out in
accordance with the generally accepted auditing practices inIndia, we have neither come across nor have we beeninformed of any instance of major weaknesses in the aforesaidinternal control systems.
5. a) Based upon the audit procedures applied by us andaccording to the information and explanations given to us,we are of the opinion that the particulars of contracts andarrangements referred to in section 301 of the Act havebeen entered in the register required to be maintainedunder that section.
b) In our opinion, and according to the information andexplanations given to us, the transactions made inpursuance of contracts or arrangements entered in theregister maintained under Section 301 of the Act andaggregating during the year to Rupees five lacs or more inrespect of each party have been made at prices which arereasonable having regard to market prices for suchtransactions, prevailing at the relevant time, where suchmarket prices are available.
6. The Company has not accepted any deposits from the publicwithin the meaning of sections 58A and 58AA or any otherrelevant provisions of the Companies Act, 1956 including theCompanies (Acceptance of Deposit) Rules, 1975.
7. In our opinion, the Company has an internal audit systemcommensurate with its size & nature of its business.
8. We have broadly reviewed the Cost Accounting records,maintained by the Company pursuant to the Rules prescribedby the Central Government for the maintenance of costrecords under clause (d) of sub-section (1) of section 209 ofthe Act, and are of the opinion that, prima facie, theprescribed accounts and records have been made andmaintained. We are, however, not required to make a detailedexamination of such books and records.
9. a) According to the examination of records of the Company,undisputed statutory dues including Provident Fund,Investor Education and Protection Fund, Employees StateInsurance, Income-tax, Sales-tax, Wealth-tax, Service tax,Custom Duty, Excise Duty, Cess and other materialstatutory dues, as applicable, have been generally regularlydeposited with the appropriate authorities during the year.There are no such dues outstanding for more than sixmonths from the date they became payable as on the dateof balance sheet.
b) According to the information and explanations given to usand as per the books and records examined by us, there
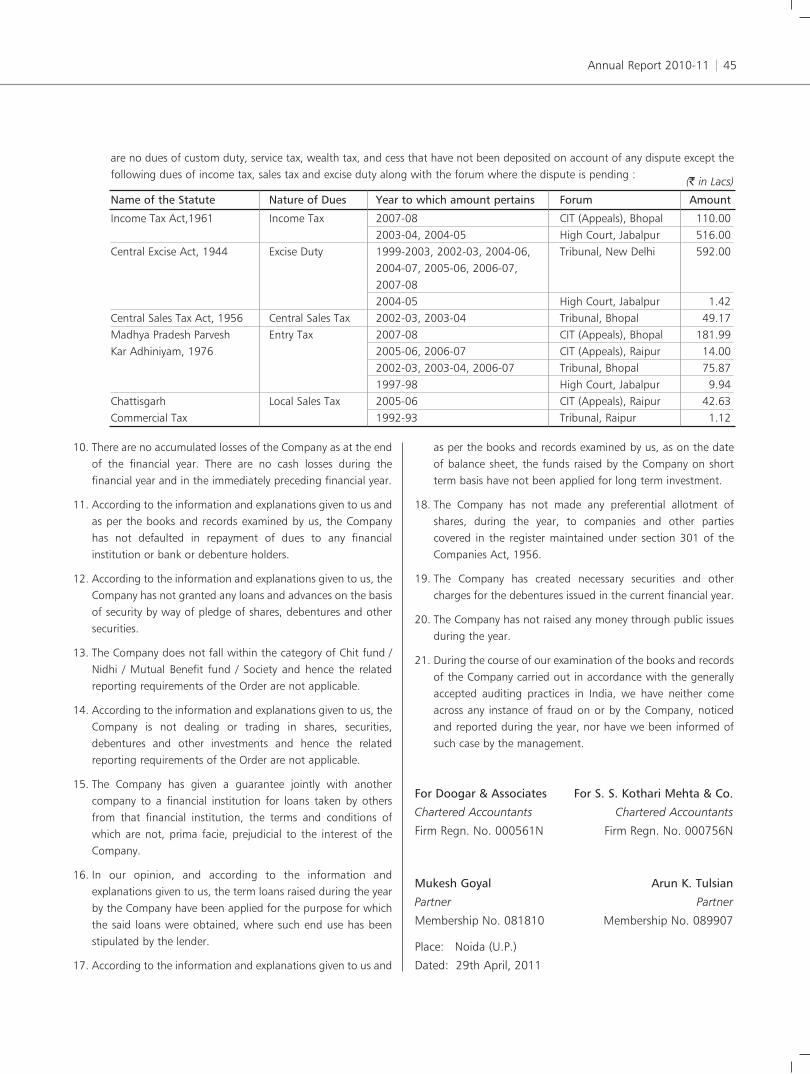
Annual Report 2010-11 45
are no dues of custom duty, service tax, wealth tax, and cess that have not been deposited on account of any dispute except thefollowing dues of income tax, sales tax and excise duty along with the forum where the dispute is pending :
10. There are no accumulated losses of the Company as at the endof the financial year. There are no cash losses during thefinancial year and in the immediately preceding financial year.
11. According to the information and explanations given to us andas per the books and records examined by us, the Companyhas not defaulted in repayment of dues to any financialinstitution or bank or debenture holders.
12. According to the information and explanations given to us, theCompany has not granted any loans and advances on the basisof security by way of pledge of shares, debentures and othersecurities.
13. The Company does not fall within the category of Chit fund /Nidhi / Mutual Benefit fund / Society and hence the relatedreporting requirements of the Order are not applicable.
14. According to the information and explanations given to us, theCompany is not dealing or trading in shares, securities,debentures and other investments and hence the relatedreporting requirements of the Order are not applicable.
15. The Company has given a guarantee jointly with anothercompany to a financial institution for loans taken by othersfrom that financial institution, the terms and conditions ofwhich are not, prima facie, prejudicial to the interest of theCompany.
16. In our opinion, and according to the information andexplanations given to us, the term loans raised during the yearby the Company have been applied for the purpose for whichthe said loans were obtained, where such end use has beenstipulated by the lender.
17. According to the information and explanations given to us and
as per the books and records examined by us, as on the dateof balance sheet, the funds raised by the Company on shortterm basis have not been applied for long term investment.
18. The Company has not made any preferential allotment ofshares, during the year, to companies and other partiescovered in the register maintained under section 301 of theCompanies Act, 1956.
19. The Company has created necessary securities and othercharges for the debentures issued in the current financial year.
20. The Company has not raised any money through public issuesduring the year.
21. During the course of our examination of the books and recordsof the Company carried out in accordance with the generallyaccepted auditing practices in India, we have neither comeacross any instance of fraud on or by the Company, noticedand reported during the year, nor have we been informed ofsuch case by the management.
For Doogar & Associates For S. S. Kothari Mehta & Co.
Chartered Accountants Chartered Accountants
Firm Regn. No. 000561N Firm Regn. No. 000756N
Mukesh Goyal Arun K. Tulsian
Partner Partner
Membership No. 081810 Membership No. 089907
Place: Noida (U.P.)
Dated: 29th April, 2011
Name of the Statute Nature of Dues Year to which amount pertains Forum Amount
Income Tax Act,1961 Income Tax 2007-08 CIT (Appeals), Bhopal 110.002003-04, 2004-05 High Court, Jabalpur 516.00
Central Excise Act, 1944 Excise Duty 1999-2003, 2002-03, 2004-06, Tribunal, New Delhi 592.002004-07, 2005-06, 2006-07, 2007-082004-05 High Court, Jabalpur 1.42
Central Sales Tax Act, 1956 Central Sales Tax 2002-03, 2003-04 Tribunal, Bhopal 49.17Madhya Pradesh Parvesh Entry Tax 2007-08 CIT (Appeals), Bhopal 181.99Kar Adhiniyam, 1976 2005-06, 2006-07 CIT (Appeals), Raipur 14.00
2002-03, 2003-04, 2006-07 Tribunal, Bhopal 75.871997-98 High Court, Jabalpur 9.94
Chattisgarh Local Sales Tax 2005-06 CIT (Appeals), Raipur 42.63Commercial Tax 1992-93 Tribunal, Raipur 1.12
(` in Lacs)

HEG Limited46
Balance Sheet As at March 31, 2011
Signed in terms of our report of even date
For Doogar & Associates For S.S. Kothari Mehta & Co. Ravi JhunjhunwalaChartered Accountants Chartered Accountants Chairman & Managing DirectorFirm Regn. No. 000561N Firm Regn. No. 000756N Shekhar Agarwal
Vice ChairmanMukesh Goyal Arun K. Tulsian D.N. DavarPartner Partner DirectorMembership No. 081810 Membership No. 089907 Riju Jhunjhunwala
DirectorManvinder Singh AjmaniChief Financial Officer
Place : Noida (U.P.) Ashish SabharwalDated : 29th April, 2011 Company Secretary
Schedules As at As at
March 31, 2011 March 31, 2010
SOURCES OF FUNDS
Shareholders' Funds
Share Capital 1 4,284.53 4,260.76
Reserves & Surplus 2 77,346.80 68,828.50
81,631.33 73,089.26
Loan Funds 3
Secured Loans 76,833.73 71,608.64
Unsecured Loans 14,198.31 1,471.66
91,032.04 73,080.30
Deferred Tax Liability 4 7,360.71 7,488.78
Total 180,024.09 153,658.34
APPLICATION OF FUNDS
Fixed Assets 5
Gross Block 104,416.54 99,463.71
Less: Depreciation 38,556.14 33,676.21
Net Block 65,860.40 65,787.50
Capital Work in Progress 7,858.25 5,809.91
73,718.64 71,597.41
Investments 6 10,187.55 6,699.61
Current Assets, Loans & Advances 7
Inventories 50,952.18 34,281.79
Sundry Debtors 39,529.35 44,023.97
Cash & Bank Balances 1,178.40 449.36
Loans and Advances 19,185.75 12,447.77
110,845.68 91,202.89
Less : Current Liabilities and Provisions 8
Liabilities 13,226.33 10,128.65
Provisions 1,501.46 5,747.69
14,727.79 15,876.34
Net Current Assets 96,117.89 75,326.55
Miscellaneous Expenditure 9 – 34.77
(to the extent not written off or adjusted)
Total 180,024.09 153,658.34
Notes to Accounts 15
(` in Lacs)

Annual Report 2010-11 47
Profit and Loss Account For the year ended March 31, 2011
Signed in terms of our report of even date
For Doogar & Associates For S.S. Kothari Mehta & Co. Ravi JhunjhunwalaChartered Accountants Chartered Accountants Chairman & Managing DirectorFirm Regn. No. 000561N Firm Regn. No. 000756N Shekhar Agarwal
Vice ChairmanMukesh Goyal Arun K. Tulsian D.N. DavarPartner Partner DirectorMembership No. 081810 Membership No. 089907 Riju Jhunjhunwala
DirectorManvinder Singh AjmaniChief Financial Officer
Place : Noida (U.P.) Ashish SabharwalDated : 29th April, 2011 Company Secretary
Schedules Year ended Year ended
March 31, 2011 March 31, 2010
INCOMEGross Turnover 129,925.87 126,844.58 Less: Inter divisional Sales (16,289.55) (11,589.13)Less: Excise Duty (2,271.50) (2,115.48)Net Turnover 111,364.82 113,139.97 Other Income 10 3,842.73 1,499.02 Increase/(Decrease) in Stocks 11 11,772.82 (703.42)
126,980.37 113,935.57 EXPENDITUREConsumption of Materials 12 61,297.67 47,356.60 Manufacturing and Other Expenses 13 55,737.24 42,768.55 Less: Inter divisional Purchases (16,289.55) (11,589.13)Total Expenditure 100,745.35 78,536.02 Profit before Interest, Depreciation and Amortisation 26,235.02 35,399.55 Financial Expenses 14 3,662.28 5,925.82 Profit before Depreciation and Amortisation 22,572.73 29,473.73 Depreciation 5 5,730.52 5,137.06 Amortisation - Misc. Expenditure written off 9 34.77 104.30 Profit before Tax 16,807.45 24,232.37 Less: Taxation - Current 4,297.50 7,048.03
- Deferred (128.07) (9.06)- Fringe Benefit Tax – (1.11)- Earlier Years (248.20) 87.97
Profit after Tax 12,886.22 17,106.54 Balance brought forward from previous year 23,376.02 14,587.48 Amount available for appropriation 36,262.24 31,694.02 APPROPRIATIONSGeneral Reserve 2,500.00 2,500.00 Capital Redemption Reserve – 329.57 Debenture Redemption Reserve 1,904.49 477.13 Interim Dividend on Equity Shares 2,142.25 – Corporate Dividend Tax on Interim Dividend 340.58 – Proposed Dividend on Equity Shares 2,142.25 4,283.36 Corporate Dividend Tax on Proposed dividend 347.53 727.96 Balance Carried Forward 26,885.16 23,376.02 Notes To Accounts 15
Earning Per Share (`) See Note No. 19 (F) of Schedule 15
- Basic 30.08 41.10
- Diluted 30.08 40.91
(` in Lacs)

HEG Limited48
Schedules annexed to and forming part of the accounts
As at As at
March 31, 2011 March 31, 2010
Authorised5,50,00,000 (5,50,00,000) Equity Shares of `10/- each 5,500.00 5,500.00
15,00,000 (15,00,000) Preference shares of `100/- each 1,500.00 1,500.00 7,000.00 7,000.00
Issued & Subscribed & Paid Up4,26,07,174 (4,25,73,005) Equity Shares of `10/- each fully paid up 4,260.72 4,257.30
Nil (15,50,725) Less: Shares bought back and extinguished – 155.07 2,37,733 (15,84,894) Add: Shares issued on FCCB conversion 23.77 158.49
Add : Forfeited Equity Shares 0.04 0.04 4,28,44,907 (4,26,07,174) 4,284.53 4,260.76
Of the above ;i) 2,21,96,821 (2,21,96,821) Equity shares have been issued as fully paid up bonus shares by capitalisation of Reserves.
ii) 3,00,000 (3,00,000) Equity shares have been issued as fully paid up pursuant to a contract without payment being received in cash.
iii) 10,700 (10,700) Equity shares have been issued at par as fully paid up to the members of erstwhile subsidiary company Bhilwara VikingPetroleum Limited pursuant to amalgamation.
iv) 58,30,144 (55,92,411) Equity shares have been issued as fully paid up shares upon conversion of Foreign Currency ConvertibleBonds.(FCCBs)
Figures in paranthesis represent previous year figures
1) Addition in the previous year represents preferential warrants money forfeited.
2) Additions represent share premium on conversion of FCCBs `446.39 Lacs and `158.27 Lacs on account of write back of provision ofpremium on redemption of FCCB created out of this account in earlier periods.
(` in Lacs)
Schedule SHARE CAPITAL1
March 31, 2010 Additions Deductions March 31, 2011
Capital Reserve (1) 3138.24 0.00 – 3138.24 (1411.79) (1726.45) – (3138.24)
Debenture Redemption Reserve 477.13 1904.49 – 2381.62 0.00 (477.13) – (477.13)
Capital Redemption Reserve 1604.99 0.00 – 1604.99 (1449.92) (155.07) – (1604.99)
Share Premium (2) 7414.95 604.66 – 8019.61 (5693.32) (3228.71) (1507.08) (7414.95)
General Reserve 32817.18 2500.00 – 35317.18 (30227.40) (2589.78) – (32817.18)
Profit & Loss Account 23376.02 12886.22 9377.08 26885.16(14587.48) (17106.54) (8318.02) (23376.02)68828.50 17895.37 9377.08 77346.80
(53369.90) (25283.69) (9825.10) (68828.50)
Schedule RESERVES AND SURPLUS2

Annual Report 2010-11 49
1. Secured redeemable Non-Convertible Debentures (NCD) of `15,000 Lacs have been allotted on private placement basis. These NCDsaggregating to `10,000 Lacs allotted on 17th December, 2009 shall fall due for redemption in two equal installments after a periodof two years and three years respectively and NCDs aggregating to `5,000 Lacs allotted on 30th October, 2009 shall fall due forredemption after a period of three years from its date of allotment. The NCDs have been issued in demat mode and are listed inWholesale Debt Segment of Bombay Stock Exchange.
2. Term loans from Financial Institutions and Banks and redeemable Non Convertible Debentures stated as above are/shall be secured byway of joint equitable mortgage of all the immovable properties (present and future) of graphite & thermal power units and hydel unitof the Company situated at Mandideep and Tawanagar respectively ranking on pari- passu basis and hypothecation of all movableassets of the Company (except book debts) subject to prior charge of the Company's bankers on specified movable assets in respect ofworking capital borrowings.
3. Working Capital Borrowings from Banks are secured by hypothecation of all stocks present and future, stores, spare parts, packingmaterials, raw materials, finished goods, goods in transit / process, book debts, outstanding monies receivable, claims, bills etc. andsecond charge by way of joint equitable mortgage of immovable properties of the Company in respect of Graphite & Thermal Powerunits at Mandideep and hydel unit at Tawanagar. The said charge in favour of bank shall rank sub-ordinate and subservient to theexisting charges created by the Company in favour of financial Institutions and banks for their term loans.
4. The Company had issued unsecured 1% Foreign Currency Convertible Bonds (FCCBs) in July 2005 due for redemption in 2010amounting to USD 28.75 million convertible at the option of the bondholders into Equity Shares of `10/- each at a conversion priceof `192.06 per share. FCCBs amounting to USD 25.75 million have been converted into Equity Shares out of which FCCBs amountingto USD 1.05 million were converted during the financial year (previous year USD 7 Million). FCCBs amounting to USD 3 million werebought back in the earlier period in accordance with guidelines issued by the Reserve Bank of India.
Opening Balance 7,488.78 7,497.84Addition / (deduction) during the year (128.07) (9.06)Closing Balance 7,360.71 7,488.78(Refer note no. 4 of schedule 15B)
Schedule DEFERRED TAX LIABILITY4
As at As at
March 31, 2011 March 31, 2010
Secured LoansSecured Redeemable Non-Convertible Debentures 15,000.00 15,000.00 Term Loans- From Banks 12,540.74 6,042.23 Short Term Working Capital Borrowings - From Banks 49,292.99 50,566.41
76,833.73 71,608.64 Unsecured LoansForeign Currency Convertible Bonds – 471.66 Term Loans- From Banks – –Short Term Borrowings from Banks 14,198.31 1,000.00
14,198.31 1,471.66 Total Loans 91,032.04 73,080.30
(` in Lacs)
Schedule LOANS3
Schedules annexed to and forming part of the accounts

HEG Limited50
Schedules annexed to and forming part of the accounts
GROSS BLOCK DEPRECIATION NET BLOCKSL Particulars Cost Additions Cost Adjustments Gross
No. as at during Sale/ as at Up to on Provision Up to As at As at31.03.2010 the year Adjustments 31.3.2011 31.03.2010 deduction for the year 31.3.2011 31.3.2011 31.3.2010
A Tangible Assets1. Free Hold Land 68.44 37.59 – 106.03 – – – – 106.03 68.44 2. Lease Hold Land 464.51 – – 464.51 88.91 – 9.52 98.43 366.07 375.60 3. Building 13,484.57 1,848.50 265.73 15,067.34 4,560.90 131.45 817.99 5,247.44 9,819.90 8,923.66 4. Plant & Machinery 81,379.20 3,431.69 625.47 84,185.42 27,001.45 520.85 4,429.74 30,910.34 53,275.08 54,377.75 5. Railway Sidings 418.99 – – 418.99 100.37 – 19.90 120.27 298.72 318.62 6. Furniture & Fixtures 453.21 37.74 3.75 487.20 290.95 1.99 33.65 322.61 164.59 162.27 7. Office Equipment 882.22 130.20 72.23 940.19 618.11 68.82 106.37 655.66 284.53 264.10 8. Electrical Installation 1,193.02 203.57 9.37 1,387.22 432.40 3.11 122.16 551.45 835.77 760.61 9. Vehicles 841.02 280.95 180.35 941.62 357.64 124.38 148.35 381.61 560.01 483.38 B Intangible Assets1 Software (Bought out) 278.54 139.48 – 418.02 225.48 – 42.85 268.33 149.69 53.06
99,463.71 6,109.72 1,156.90 104,416.54 33,676.21 850.60 5,730.52 38,556.14 65,860.40 65,787.50 Capital Work In Progress – – 7,858.25 5,809.91 Total 99,463.71 6,109.72 1,156.90 104,416.54 33,676.21 850.60 5,730.52 38,556.14 73,718.65 71,597.41 Previous Year 85,346.09 14,787.43 669.81 99,463.71 28,943.62 404.46 5,137.06 33,676.21 71,597.41 69,825.18
Notes1) Assets amounting to `83.13 lacs (`83.13 lacs) (Gross) are owned jointly with RSWM Ltd.
2) Capital Work In Progress includes `607.42 (Previous year `167.53 Lacs) being pre-operative expenditure and `3,840.31 Lacs (Previousyear `2,113.47 Lacs) being capital stores
3) Freehold land includes agricultural land in village Kirat Nagar, District Raisen, Madhya Pradesh measuring 0.26 acre in the Company'spossession pending registration in favour of the Company.
Schedule FIXED ASSETS5
(` in lacs)
As at As at
March 31, 2011 March 31, 2010
A Long Term Investmentsi) Quoted - Fully Paid
18 (18) Equity Shares of `2/-each of Ballarpur Ind. Ltd. 0.01 0.01 Total of quoted investment 0.01 0.01 Investment In Associates
ii) Unquoted - Fully Paid4,190,000 (4,190,000) Equity Shares of `10/- each of Bhilwara Infotech Ltd. 419.00 419.00
39,190,500 (39,190,500) Equity Shares of `10/- each of Bhilwara Energy Ltd.(*) 2,612.70 2,612.70 400,000 (400,000) 0.01% Preference Shares of `100/- each of Bhilwara Energy Ltd. 4,000.00 4,000.00
iii) Investment In Subsidiary Unquoted - Fully Paid50,000 (50,000) Equity Shares of `10/- each of HEG Graphite Products &
Services Ltd. (Includes 6 Shares held by the nominees of the Company.) 5.00 5.00 B Current Investment In Mutual Funds
250,000 (250,000) Units of LIC Mutual Fund Dhan Smriddhi of `10/- each 25.00 25.00 Nil (150,000) Units of SBI One India -Growth of `10/-each – 15.00
24,927,240.29 (0) Units of SBI Premier Liquid Fund-Super Institutional - Daily Dividend 2,500.82 – 9,988,718.25 (0) Units of SBI Premier Liquid Fund- Institutional - Daily Dividend 1,002.12 –
3,527.94 40.00 Total 10,564.65 7,076.71 Less: Provision for diminution in value of investments 377.10 377.10
10,187.55 6,699.61 Aggregate Market Value of Quoted Investments 0.01 0.01
(*) Includes 1,30,63,500 Equity Shares received as bonus shares in the previous year.
Schedule INVESTMENTS (Non-Trade)6

Annual Report 2010-11 51
Schedules annexed to and forming part of the accounts
As at As at
March 31, 2011 March 31, 2010
Current AssetsInventories (As taken, valued and certified by the Management)Stock-in-trade 8,697.20 3,773.06 Work-in-process 24,742.11 17,893.43 Raw Materials [incl in-transit / Third Parties `3,477.13 lacs (`4,890.76 lacs)] 12,752.98 9,750.70 Stores & Spares / Loose Tools (Incl in-transit/Third Parties `135.89 Lacs (`158.45 Lacs)) 4,759.89 2,864.60
50,952.18 34,281.79 Sundry Debtors (Unsecured)Due for a period exceeding six months
- Considered good 9,018.82 6,632.55 - Considered doubtful – 13.96
9,018.82 6,646.51 Less : Provision for doubtful debts – 13.96
9,018.82 6,632.55 Others (Considered good) 30,510.53 37,391.42
39,529.35 44,023.97 Cash & Bank Balances :Cash in hand (including stamp & hundi papers) 13.48 7.83 Cheques in hand 90.46 36.20 With scheduled banks
- Current Accounts 856.49 255.96 - Fixed Deposits / Margin money accounts 0.29 0.29 - Dividend / Special purpose accounts 217.68 149.08
1,178.40 449.36 Loans and advances (Refer Note 13 of Schedule 15-B)Loans (Secured, considered good) 119.19 91.88 Loans (Unsecured, considered good) 111.64 100.52 Advances recoverable in cash or kind or for value to be received 13,300.36 9,775.94 Advances for Capital Expenditure 3,503.16 622.79 Balance with Excise Department including Cenvat Credit 1,681.09 1,289.91 Deposit with Government Deptt. and others 470.31 566.73 Considered doubtful – – Less : Provision for doubtful advances – –
19,185.75 12,447.77110,845.68 91,202.89
(` in Lacs)
Schedule CURRENT ASSETS, LOANS AND ADVANCES7
Units Value Total value
(per unit) (` in lacs)
During the year, the Company has purchased the following investmentI) Birla Sun Life Saving Fund - Instl - Daily Dividend-Reinvestment 10,040,591.69 10.0068 1,004.74 II) Reliance Money Manager Fund - Institutional Option-Daily Dividend Plan 330,695.42 1,001.3715 3,311.49 III) JP Morgan India Liquid Fund-Super Inst. Daily Dividend Plan-Reinvest 50,154,319.09 10.0079 5,019.39 IV) Kotak Floater Long Term - Daily Dividend 39,772,320.05 10.0798 4,008.97 V) Reliance Liquid Fund - Cash Plan Daily Dividend Option 22,476,705.45 11.1415 2,504.24 VI) SBI Premier Liquid Fund - Institutional - Daily Dividend 9,988,718.25 10.0325 1,002.12 VII) SBI Premier Liquid Fund - Super Institutional - Daily Dividend 24,927,240.29 10.0325 2,500.83 During the year, the Company has sold the following investmentI) Birla Sun Life Saving Fund - Instl - Daily Dividend-Reinvestment 10,040,591.69 10.0068 1,004.74 II) Reliance Money Manager Fund - Institutional Option-Daily Dividend Plan 330,695.42 1,001.3715 3,311.49 III) JP Morgan India Liquid Fund-Super Inst. Daily Dividend Plan-Reinvest 50,154,319.09 10.0079 5,019.39 IV) Kotak Floater Long Term - Daily Dividend 39,772,320.05 10.0798 4,008.97 V) Reliance Liquid Fund - Cash Plan Daily Dividend Option 22,476,705.45 11.1415 2,504.24
Figures in parenthesis represent previous year figures.
Schedule INVESTMENTS (Contd...)6

HEG Limited52
Schedules annexed to and forming part of the accounts
As at As at
March 31, 2011 March 31, 2010
Current LiabilitiesSundry Creditors - Micro and Small Enterprises (Refer Note no. 14 of Schedule 15 B) 26.28 – Sundry Creditors - Other than Micro and Small Enterprises 4,362.69 4,797.99 Sundry Creditors for Capital Expenditure 125.67 200.40 Other Liabilities 4,526.56 3,896.13 Unclaimed Dividend** 217.68 149.08 Sundry Deposits 488.37 445.96 Advances from Customers 2,980.14 174.18 Interest accrued but not due on loans 498.94 464.91
13,226.33 10,128.65 Proposed Dividend Including Corporate Dividend Tax 2,489.77 5,011.32 Provision for Taxation (Net of Advance Tax `26,185.61 lacs (`22,167.16 lacs)) (988.32) 578.10 Provision for premium on redemption of FCCBs – 158.27
1,501.46 5,747.69 14,727.79 15,876.34
** Investor Education & Protection Fund is credited by unclaimed dividend amounts outstanding on expiry of seven years from dividenddeclaration.
(` in Lacs)
Schedule CURRENT LIABILITIES AND PROVISIONS8
Year ended Year ended
March 31, 2011 March 31, 2010
Foreign Currency Fluctuation (Net) 2,348.05 479.95 Accrued Redemption Premium on Non Trade Investment 475.73 373.70 Miscellaneous Sales / Receipts 145.09 4.46 Write-back of Provision on Investments Sold – 180.08 Profit on Sale of Investments 1.38 9.95 Rent Receipts 242.54 204.84 Interest [Including TDS Nil (`9.04 Lacs)] 127.42 74.20 Dividend Income from Investment in Mutual fund schemes 51.78 9.75 Liabilities / provisions no longer required, written back 443.83 157.41 Profit on sale of Fixed Assets 6.90 4.68
3,842.73 1,499.02
(` in Lacs)
Schedule OTHER INCOME10
Opening Balance 34.77 139.07 Less: Charged off to Profit and Loss account 34.77 104.30 Closing Balance 0.00 34.77
Schedule MISCELLANEOUS EXPENDITURE (to the extent not written off or adjusted)9
Closing StockStock-in-trade 8,697.20 3,773.06 Work-in-Process 24,742.11 17,893.43
33,439.31 21,666.49 Less: Opening StockStock-in-trade 3,773.06 6,603.20 Work-in-Process 17,893.43 15,766.71
21,666.49 22,369.91 Increase/(Decrease) in Stocks 11,772.82 (703.42)
Schedule INCREASE/(DECREASE) IN STOCKS11

Annual Report 2010-11 53
Year ended Year ended
March 31, 2011 March 31, 2010
Opening Stock 4,859.95 14,165.27 Add : Purchases 65,713.56 38,051.27
70,573.51 52,216.54 Less: Closing Stock 9,275.84 4,859.94 Consumption of Materials * 61,297.67 47,356.60
(*) Includes loss of material on account of theft - Exceptional item `360.85 Lacs in the previous year(*) Net of DEPB Accrued
(` in Lacs)
Schedule CONSUMPTION OF MATERIALS12
Manufacturing ExpensesConsumption of Stores & Spares including Refractory blocks 8,824.91 5,071.44 Excise duty on Increase / (Decrease) in Finished Stock (38.64) 23.72 Power & fuel 23,118.90 16,828.11 Repairs and Maintenance of :
Plant & Machinery 3,083.64 1,908.90 Building 603.77 323.47 Others 251.53 116.59
Job/Process Charges 254.98 199.05 Power generation charges 111.01 75.78 Payment to and Provision for EmployeesSalary, Wages and Bonus etc. 3,494.54 3,086.60 Contribution to Provident, Gratuity and other Funds 431.25 421.72 Workmen & Staff Welfare & Safety measures expenses 481.52 393.88 Selling ExpensesFreight and forwarding and other selling expenses 7,494.94 6,841.11 Packing Expenses (including Packing material consumption) 1,567.20 1,144.60Commission 1,569.16 1,578.18 Claims, Rebates and Discount 1,174.06 1,654.03 Administrative & Other ExpensesInsurance 284.50 232.26 Rent 106.43 130.67 Rates & Taxes 78.38 102.17 Directors' Remuneration including sitting fees & incidental expenses 791.60 880.51 Donations 30.12 3.62 Loss on fixed assets sold / discarded 214.74 188.82 Provision for - Diminution/(Restatement of diminution) in value of Investments – (15.31)Provision for doubtful debts & advances – 13.96 Travelling Expenses 189.21 206.79 Postage & Communication 72.56 70.02 Legal & Professional Expenses 775.93 595.62 Vehicle Running & Maintenance 107.26 92.47 Miscellaneous Expenses 663.75 599.77
55,737.24 42,768.55
Schedule MANUFACTURING AND OTHER EXPENSES 13
Schedules annexed to and forming part of the accounts

HEG Limited54
Schedules annexed to and forming part of the accounts
Year ended Year ended
March 31, 2011 March 31, 2010
Interest on Debentures 1,347.50 527.44 Term Loans 185.35 1,591.23 Working Capital Borrowings 1,785.56 3,489.41 Foreign Currency Convertible Bonds – 24.30
Bank Charges 343.87 293.44 Total (Net of Financial Expenses Capitalised `341.24 Lacs (previous year `37.74 Lacs) 3,662.28 5,925.82
(` in Lacs)
Schedule FINANCIAL EXPENSES 14
A. SIGNIFICANT ACCOUNTING POLICIES1. Basis of preparation of financial statements
The financial statements have been prepared to comply in all material respects with the Accounting Standards notified byCompanies (Accounting Standards) Rules, 2006, (as amended and as applicable from time to time) and the relevant provisions ofthe Companies Act, 1956. The financial statements have been prepared under the historical cost convention on going concernbasis. The accounting policies have been consistently applied by the Company and are consistent with those used in the previousyear. Accounting policies not specifically referred to otherwise are consistent and in consonance with the generally acceptedaccounting principles in India.
2. Use of estimatesThe preparation of financial statements in conformity with generally accepted accounting principles requires management to makeestimates and assumptions that affect the reported amounts of assets and liabilities and disclosure of contingent liabilities at thedate of the financial statements that are based upon management’s best knowledge of current events and actions. Differencebetween the actual result and estimates are recognised in the period in which the results are known/ materialised.
3. Revenue recognitionSale of goodsRevenue is recognised to the extent that it is probable that the economic benefits will flow to the Company and the revenue canbe reliably measured.
a) Revenue is recognised in respect of export sales on the basis of shipment of goods to customer and in respect of domestic saleson dispatch from factory. Quality rebates, claims and other discounts are disclosed separately.
b) Domestic Sales includes excise duty. However, excise duty on sales is reduced from gross turnover for disclosing net turnover.
c) Power generated at the power plants is primarily consumed by the manufacturing units and excess power is sold to SEBs whichis included in the sales as below:
i) Power generated at Hydel Power unit at Tawa and Thermal Power unit at Mandideep are transferred to Graphite unit atMPEB rate.
ii) Excess power generated is sold to SEB’s at rate stipulated by SEB’s.
d) Inter-divisional sales comprising of sale of power from power plants to Graphite unit is reduced from gross turnover in derivingnet turnover.
e) Income and Export Incentives / benefits are accounted for on accrual basis and as per principles given under AS-9 – RevenueRecognition.
DividendsRevenue in respect of dividends is recognised when the shareholders’ right to receive payment is established by the balance sheetdate.
4. Valuation of inventoriesa) Finished goods and work in progress are valued at lower of historical cost or net realisable value. Cost of inventories comprises
Schedule SIGNIFICANT ACCOUNTING POLICIES & NOTES TO ACCOUNTS15

Annual Report 2010-11 55
of cost of purchase, cost of conversion and other costs incurred in bringing them to their respective present location andcondition. By products are valued at net realisable value. Cost of finished goods and by- products includes excise duty. Cost isdetermined on a weighted average basis.
b) Stores, Spares and Raw Materials are valued at lower of historical cost or net realisable value. However materials & other itemsheld for use in the production of inventories are not written below cost if the finished products in which they will beincorporated are expected to be sold at or above cost. Cost is determined on a weighted average basis.
c) Historical cost is determined on the basis of weighted average method.
d) Obsolete stocks are identified once every year on the basis of technical evaluation and are charged off to revenue.
e) Net realisable value is the estimated selling price in the ordinary course of business, less estimated costs of completion andestimated costs necessary to make the sale.
5. InvestmentsInvestments that are readily realisable and intended to be held for not more than a year are classified as current investments. Allother investments are classified as long-term investments. Current investments are carried at lower of cost and fair value. Long-term investments are carried at cost individually. However, provision for diminution in value is made to recognise a decline otherthan temporary in the value of the investments in case of long term investments.
6. Fixed assetsFixed assets are stated at historical cost less accumulated depreciation and impairment loss if any. Historical cost comprises thepurchase price (net of CENVAT / duty credits wherever applicable) and all direct costs attributable to bringing the asset to itsworking condition for intended use.
7. Intangible assetsCapital Expenditure on purchase and development of identifiable non-monetary assets without physical substance is recognised asIntangible Assets in accordance with principles given under AS-26 – Intangible Assets. These are grouped and separately shownunder the schedule of Fixed Assets. These are amortised over their respective expected useful lives.
8. Expenses incurred during construction periodPreliminary project expenditure, capital expenditure, indirect expenditure incidental and related to construction / implementation,interest on borrowings to finance fixed assets and expenditure on start-up / commissioning of assets forming part of a compositeproject are capitalised upto the date of commissioning of the project as the cost of respective assets.
9. DepreciationDepreciation is charged on the following basis:a) On Plant & Machinery and other assets of Hydel Power Project at Tawa, at the rates notified under the Electricity Act as per
approval of Department of Company Affairs, which are as follows:
Sl. No. Description of Asset Rate of Depreciation (%)
1 Land 5.002 Factory Building 3.023 Non Factory Building 3.024 Plant & Machinery
i) Dams, Spillways weirs, canals, reinforced concrete Flumes and symphons 1.95ii) Hydraulic control valves and other hydraulic works 3.40iii) Transformers having a rating of 100 KVA and over 7.81
5 Electrical Installationi) Batteries 33.40ii) Lines on Fabricated steel operating at normal voltages higher than 66 kv 5.27iii) Residual 7.84
6 Furniture and Fixtures 12.777 Office Equipment and other assets 12.778 Vehicles 33.40
Schedule SIGNIFICANT ACCOUNTING POLICIES & NOTES TO ACCOUNTS (Contd...)15
Schedules annexed to and forming part of the accounts

HEG Limited56
Schedules annexed to and forming part of the accounts
b) i) On Plant & Machinery other than those mentioned at (a) above, on straight line method,
ii) On other fixed assets, on written down value method, in the manner and as per rates prescribed in Schedule XIV of theCompanies Act, 1956.
c) Cost of acquisition & improvement of lease hold land is amortised over the lease period.
d) The Thermal Power Plant and certain Plant & Machinery of Graphite Unit of the Company have been considered as ContinuousProcess Plant based on technical opinion and depreciation has been provided for accordingly.
e) Assets costing upto `5,000 are fully depreciated in the year of purchase.
10. Impairment of assetsAssets are grouped at the lowest levels for which there are separately identifiable cash flows (i.e. cash generating units). For thepurpose of assessing impairment at each Balance Sheet date, Assets within a Cash Generating Unit are reviewed for impairmentwherever events or changes in circumstances indicate that the carrying amount may not be recoverable. An impairment loss isrecognised for the amount at which the assets under individual Cash Generating Unit are carried in the books exceeds itsrecoverable amount being the higher of the assets net selling price and its value in use. Value in use is based on the present valueof the estimated future cash flows relating to the assets.
Previously recognised impairment losses, relating to assets other than goodwill, are reversed where the recoverable amountincreases because of favourable changes in the estimates used to determine the recoverable amount since the last impairment wasrecognised. A reversal of an asset impairment loss is limited to its carrying amount that would have been determined (net ofdepreciation or amortisation) had no impairment loss been recognised in prior years.
11. Foreign exchange transactions / translationa) 1. Export and Import transactions are accounted for at the prevailing conversion rates.
2. Monetary items denominated in foreign currencies (except financial instruments designated as Hedging Instruments) andoutstanding at the year end are translated at year end conversion rates.
3. Any income or expense on account of exchange difference either on settlement or on translation is recognised in the profitand loss account.
b) Pursuant to The Institute of Chartered Accountants of India (ICAI) announcement “Accounting for Derivatives” on the earlyadoption of Accounting Standard AS 30 “Financial Instruments: Recognition and Measurement”, the Company had earlyadopted the AS-30 in earlier financial years, to the extent that such adoption does not conflict with existing mandatoryaccounting standards and other authoritative pronouncements, Company law and other regulatory requirements.
The Company uses various financial instruments to hedge its exposure to movements in foreign exchange rates. A financialinstrument is designated as an effective hedge after the management objectively evaluates at the inception of each contractas to whether the instrument is effective in offsetting the cash flows attributable to the hedged risk. The same evaluation iscarried out at the end of each reporting period. In the absence of such hedge being identified or being continued to beidentified as an effective hedge, the value thereof is taken to profit & loss Account.
Exchange differences relating to cash flow hedge are accumulated in a hedging reserve account. Amounts from hedgingreserve account are transferred to profit & loss account when
i) the forecast transaction materialises,
ii) the hedging instrument expires or is sold, terminated or exercised (except for the replacement or rollover of a hedginginstrument into another hedging instrument where such replacement or rollover is part of the Company’s hedgingstrategy),
iii) the hedge no longer meets the criteria for hedge accounting in AS 30,
iv) the Company revokes the designation.
Hedge effectiveness of financial instruments designated as Hedging instruments is evaluated at the end of each financialreporting period.
12. Research and developmentRevenue Expenditure on research and development including salaries, consumables and power & fuel is charged to Profit and LossAccount under respective heads of expenditure. Capital expenditure is shown as addition to fixed assets.
Schedule SIGNIFICANT ACCOUNTING POLICIES & NOTES TO ACCOUNTS (Contd...)15

Annual Report 2010-11 57
13. Employees benefitsExpenses and liabilities in respect of employee benefits are recorded in accordance with Accounting Standard 15 – EmployeeBenefits.
a) Provident fund & ESIThe Company makes contribution to statutory provident fund and Employee State Insurance in accordance with EmployeesProvident Fund and Miscellaneous Provisions Act, 1952 and Employee State Insurance Act, 1948 which is a definedcontribution plan and contribution paid or payable is recognised as an expense in the period in which services are rendered bythe employee.
b) GratuityGratuity is a post employment benefit and is in the nature of a defined benefit plan. The liability recognised in the balancesheet in respect of gratuity is the present value of the defined benefit/obligation at the balance sheet date less the fair valueof plan assets, together with adjustment for unrecognised actuarial gains or losses and past service costs. The definedbenefit/obligation is calculated at or near the balance sheet date by an independent actuary using the projected unit creditmethod. Actuarial gains and losses arising form past experience and changes in actuarial assumptions are charged or creditedto the Profit and Loss Account in the year to which such gains or losses relate.
c) Leave EncashmentLiability in respect of leave encashment becoming due or expected after the balance sheet date is estimated on the basis of anactuarial valuation performed by an independent Actuary using the projected unit credit method.
d) Superannuation BenefitThe Company makes contribution to superannuation fund which is a post employment benefit in the nature of a definedcontribution plan & contribution paid or payable is recognised as an expense in the period in which services are rendered bythe employee.
e) Other Short Term BenefitsExpense in respect of other short term benefits is recognised on the basis of the amount paid or payable for the period duringwhich services are rendered by the employee.
14. LeasesWhere the Company is the lesseeLeases where the lessor effectively retains substantially all the risks and benefits of the ownership of the leased item, are classifiedas operating leases. Operating lease payments are recognised as an expense in the Profit and Loss account on a straight line basisover the lease term.
Where the Company is the lessorAssets subject to operating leases are included in fixed assets. Lease income is recognised in the Profit and Loss Account on astraight-line basis over the lease term. Costs, including depreciation are recognised as an expense in the Profit and Loss Account.Initial direct costs such as legal costs, brokerage costs, etc. are recognised immediately in the Profit and Loss Account.
15. Segment accounting & reportingIdentification of segmentsThe Company’s operating businesses are organised and managed separately according to the nature of products manufacturedand services provided, with each segment representing a strategic business unit that offers different products.
Allocation of common costsCommon allocable costs are allocated to each segment on reasonable basis.
Unallocated itemsUnallocable assets and liabilities represents the assets and liabilities not allocable to any segment as identified as per the AccountingStandard.
Segment policiesThe Company prepares its segment information in conformity with the accounting policies adopted for preparing and presentingthe financial statements of the Company as a whole.
Schedule SIGNIFICANT ACCOUNTING POLICIES & NOTES TO ACCOUNTS (Contd...)15
Schedules annexed to and forming part of the accounts

HEG Limited58
Schedules annexed to and forming part of the accounts
16. Taxes on incomeTax expense comprises of current and deferred. Provision for Current Tax is made in accordance with the provisions of Income TaxAct, 1961.
In accordance with Accounting Standard AS-22 ‘Accounting for Taxes on Income’ as notified by Companies Accounting StandardRules, 2006 Deferred Tax Liability/ Asset arising from timing differences between book and income tax profits is accounted for atthe current rate of tax to the extent these differences are expected to crystallise in later years. However, deferred Tax Assets arerecognised only if there is a reasonable/ virtual certainty of realisation thereof. Deferred tax is measured based on the tax rates andthe tax laws enacted or substantively enacted at the balance sheet date.
17. Government grant & subsidiesGrants and subsidies from the government are recognised when there is reasonable assurance that the grant/subsidy will bereceived and all attaching conditions will be complied with.
When the grant or subsidy relates to an expense item, it is recognised as income over the periods necessary to match them on asystematic basis to the costs, which it is intended to compensate.
Where the grant or subsidy relates to an asset, its value is deducted from the gross value of the asset concerned in arriving at thecarrying amount of the related asset.
18. Borrowing costBorrowing costs directly attributable to the acquisition, construction or production of an asset that necessarily takes a substantialperiod of time to get ready for its intended use or sale are capitalised as part of the cost of the respective asset. All other borrowingcosts are expensed in the period they occur. Borrowing costs consist of interest and other costs that an entity incurs in connectionwith the borrowing of funds.
19. Provisions, contingent liabilities and contingent assetsA provision is recognised when there is a present obligation as a result of a past event and it is probable that an outflow ofresources embodying economic benefits will be required to settle the obligation and a reliable estimate can be made of the amountof obligation. A contingent liability is recognised for:
a) a present obligation that arises from past events but is not recognised as a provision because either the possibility that anoutflow of resources embodying economic benefits will be required to settle the obligation is remote or a reliable estimate ofthe amount of the obligation cannot be made.
b) a possible obligation that arises from past events and the existence of which will be confirmed only by the occurrence or non-occurrence of one or more uncertain future events not wholly within the control of the Company.
c) Contingent assets are neither accounted for nor disclosed in the financial statements.
20. Miscellaneous expenditureExpenditure incurred on issuance of foreign currency convertible bonds are being amortised over a period of five years from thedate of the issue of said bonds being the tenor of such bonds.
21. Earning per shareBasic earnings per share are calculated by dividing the net profit or loss for the period attributable to equity shareholders (afterdeducting preference dividends and attributable taxes) by the weighted average number of equity shares outstanding during theperiod. Partly paid equity shares are treated as a fraction of an equity share to the extent that they were entitled to participate individends relative to a fully paid equity share during the reporting period. The weighted average number of equity sharesoutstanding during the period is adjusted for events of bonus issue, bonus element in a rights issue to existing shareholders, sharesplit, and reverse share split (consolidation of shares).
For the purpose of calculating diluted earnings per share, the net profit or loss for the period attributable to equity shareholdersand the weighted average number of shares outstanding during the period are adjusted for the effects of all dilutive potentialequity shares.
22. Cash and cash equivalentsCash and cash equivalents for the purposes of cash flow statement comprise cash at bank and in hand and cheques in hand.
Schedule SIGNIFICANT ACCOUNTING POLICIES & NOTES TO ACCOUNTS (Contd...)15

Annual Report 2010-11 59
B. NOTES TO ACCOUNTS
Schedule SIGNIFICANT ACCOUNTING POLICIES & NOTES TO ACCOUNTS (Contd...)15
As at As atMarch 31, 2011 March 31, 2010
1 Contingent liabilitiesa) Claims against the Company not acknowledged as debts :
i) Excise duty under appeal 509.90 564.05 ii) Other matters 1,619.23 1,008.56
b) Bank Guarantees 8,895.31 4,094.70 c) The Company has provided Guarantee in favour of International Finance Corporation
(IFC) with M/s RSWM Ltd. on joint and several basis on behalf of M/s AD Hydro Power Ltd. 600.00 600.00 d) Bills discounted with bankers 1,524.83 4,833.79 e) Pending export obligation against Advance Licences & EPCG Licences 952.59 2,118.78
2 Estimated amount of contracts remaining to be executed on capital account, notprovided for (net of advances of `3503.16 Lacs (`622.79 Lacs)) 7,020.77 704.30
3 There are no present obligations requiring provisions in accordance with the guiding principles as enunciated in AccountingStandard (AS)-29 'Provisions, Contingent Liabilities & Contingent Assets'
4 As per Accounting Standard 22 "Accounting for Taxes on Income", required disclosures are given below:
6 In accordance with the provisions of Accounting Standard on impairment of Assets, (AS-28), the management has madeassessment of assets in use & considering the business prospects related thereto, no provision is considered necessary in theseaccounts on account of impairment of assets.
7 Auditors' remuneration paid / payable during the year included in miscellaneous expenses :
8 a) Computation of net profit in accordance with section 349 of the Companies Act, 1956 for the purpose of section 198 of thesaid Act
(` in Lacs)
As at As atMarch 31, 2011 March 31, 2010
Deferred Tax LiabilitiesArising on Account of timing difference- Accumulated Depreciation 7,789.76 7,809.65 Deferred Tax AssetsArising on Account of timing difference- Due to section 43B of the Income Tax Act 303.79 192.70 - Others 125.26 128.18 Net Deferred Tax Liability 7,360.71 7,488.78
5 Work in process includes Refractory Blocks and other consumable stores lying at shop floor. 25.31 93.18
(` in Lacs)
As at As atMarch 31, 2011 March 31, 2010
Statutory Audit Fee 19.00 18.00Other services 7.35 1.31Reimbursement of expenses 2.49 2.88
28.84 22.19
(` in Lacs)
As at As atMarch 31, 2011 March 31, 2010
Profit for the year before taxation as per Profit and Loss account 16,807.45 24,232.37 Add: Directors' Remuneration 772.28 865.11
Miscellaneous Expenditure written off / provisions 34.77 104.30 17,614.50 25,201.78
Less: Profit /(Loss) on sale of Fixed Assets (Net) (207.85) (184.14)Less: Profit /(Loss) on sale of Investment (Net) 1.38 9.95
Write-back of Diminution in Value of Investments sold – 180.08 Net Profit on which commission is payable 17,820.96 25,195.89 Commission of net profit 375.46 664.67
(` in Lacs)
Schedules annexed to and forming part of the accounts

HEG Limited60
Schedules annexed to and forming part of the accounts
b) Details of remuneration & perquisites of managerial personnel :
(*) Apart from above, Keyman Insurance policy valuing `11.71 Lacs has been assigned during the year to Shri R.C. Surana(Previous year `190.16 Lacs to Shri Ravi Jhunjhunwala) in accordance with their terms of engagement.
9 The following transactions are accounted for on the basis of estimates / available data, with final adjustments being carried out inthe year of settlement.
a) Claims lodged with insurance companies.
b) Interest on income tax refunds granted on summary basis, pending finalisation of assessments is treated as income in the yearof accrual. Final adjustments are carried out in the year of completion of assessment.
10 Term loans, Bonds and Debentures falling due in next 12 months `6,536 Lacs (previous year `2,904 Lacs).
11 Capitalisation of pre-operative expenditure The following expenditure has been capitalised / included under Capital work in progress:
12 a) In the opinion of the management and to the best of their knowledge and belief, the value on realisation of loans, advancesand other current assets in the ordinary course of business will not be less than amount at which they are stated in the balancesheet.
b) Loans and advances include :
Schedule SIGNIFICANT ACCOUNTING POLICIES & NOTES TO ACCOUNTS (Contd...)15
As at As atMarch 31, 2011 March 31, 2010
Salary (*) 274.48 103.37 Commission 375.46 664.67 Other perquisites 112.23 81.67
762.17 849.71 Provident Fund 8.94 12.40 Superannuation 11.17 3.00 Total 782.28 865.11
(` in Lacs)
As at As atMarch 31, 2011 March 31, 2010
a) Insurance Expenses 24.83 23.48 Financial Expenses 341.24 37.74 Administrative Overheads & Other Cost 533.92 560.64 Total 900.00 621.86
b) The same has been capitalised / is lying under Capital work in progress as under:Building 41.74 71.06 Plant & Machinery 250.64 383.28 Capital work in progress 607.62 167.53 Total 900.00 621.87
(` in Lacs)
As at As atMarch 31, 2011 March 31, 2010
i) Due from officers of the Company – – ii) the maximum amount at any time during the year – –
(` in Lacs)
As at As atMarch 31, 2011 March 31, 2010
c) Sitting fee to non executive directors 18.40 15.40
(` in Lacs)
As the liabilities for gratuity and leave encashment are provided on an actuarial valuation basis for the Company as a whole,the amount pertaining to the directors are not included above.

Annual Report 2010-11 61
13 On the basis of information made available to the Company by its creditors regarding registration under the provisions of Micro,Small and Medium Enterprises Development Act, 2006 ("Act"), none of the dues outstanding to the enterprises which are definedunder the said Act are exceeding the limit of 45 days. Required disclosures are as under:
15 The Company had allotted 47,30,000 Preferential Warrants of `365/- each on 5th June, 2008. These Warrants were convertibleinto equity shares within 18 months from the date of allotment. Since no warrant had been converted till 4th December, 2009,the aggregate amount of `1726.45 lacs received in respect of the same has been forfeited by the Company in the previous year.The funds had been utilised for long term working capital requirement.
14 a) The Company has following foreign currency exposures outstanding as on balance sheet date:
Schedule SIGNIFICANT ACCOUNTING POLICIES & NOTES TO ACCOUNTS (Contd...)15
As at As atMarch 31, 2011 March 31, 2010
a) Delayed payments due as at the end of each accounting year on account of principal and interest due thereon. – –
b) Total interest paid on all delayed payments during the year under the provisions of the act. – –
c) Interest due on principal amounts paid beyond the due date during the year but without the interest amounts under the Act. – –
d) Interest accrued but not due. – – e) Total interest due but not paid. – –
(` in Lacs)
As at As at As at As atMarch 31, 2011 March 31, 2010 March 31, 2011 March 31, 2010
Amount Amount Amount Amount(FC Million) (FC Million) (` in Lacs) (` in Lacs)
a) Secured LoanUSD 117.39 61.10 52,343.44 27,829.33Euro 17.48 24.94 11,043.45 15,127.85GBP 0.11 0.00 81.61 –
b) Unsecured Loan USD 23.80 1.05 10,614.38 471.66 c) Debtors (Net of Advances)
USD 16.54 71.30 7,375.19 35,158.83 Euro 12.86 35.59 9,194.90 21,586.89 GBP 0.11 0.00 81.61 – AED (3.86) 0.00 (468.02) –
d) Creditors (Net of Advances)USD (0.14) 0.52 (61.81) 224.96 Euro (2.52) 0.00 (1,593.83) – GBP (0.00) 0.00 (0.13) – Total USD 157.84 133.98 70,271.19 63,684.78 Total EURO 27.82 60.53 18,644.52 36,714.74 Total GBP 2.28 0.00 163.09 – Total AED (3.86) 0.00 (468.02) –
Sl. No. Particulars Purpose Amount Amount
(i) Plain Vanilla Forwards Hedging $ 26.5 mn. $ 19.0 mn.(ii) Cross Currency Forwards Hedging 10.0 mn. 4.5 mn.
b) The foreign currency exposures that are not hedged by derivative instruments or otherwise are as under:
Schedules annexed to and forming part of the accounts

HEG Limited62
Schedules annexed to and forming part of the accounts
16 Related party disclosure as required by Accounting Standard (AS-18) issued by the Institute of Chartered Accountants of
India :
A List of Related Parties & Relationships
As at As at
March 31, 2011 March 31, 2010
a) Enterprises that directly or indirectly through one or more
intermediaries, control or are controlled by or are under common
control with the reporting enterprise (this includes holding
companies, subsidiaries and fellow subsidiaries).
i) HEG Graphite Products & Services Ltd. Subsidiary Subsidiary
b) Associates and joint ventures
i) Bhilwara Energy Limited Associate Associate
ii) Bhilwara Infotech Ltd Associate Associate
c) Individuals owning directly or indirectly, an interest in the Shri L.N. Jhunjhunwala Shri L.N. Jhunjhunwala
voting power of the reporting enterprise that gives them Shri Ravi Jhunjhunwala Shri Ravi Jhunjhunwala
control or significant influence over the enterprise, and Shri Riju Jhunjhunwala Shri Riju Jhunjhunwala
relatives of any such individual.
d) Key Management Personnel and their relatives Shri Ravi Jhunjhunwala Shri Ravi Jhunjhunwala
Shri Riju Jhunjhunwala Shri Riju Jhunjhunwala
Shri R.C. Surana
e) Enterprises over which any person described in (c) or (d) is able
to exercise significant influence.
i) RSWM Ltd.
ii) Malana Power Company Limited
iii) A D Hydropower Limited
iv) Delhi Knits Pvt Ltd
v) Bhilwara Scribe Pvt. Ltd.
vi) Ganga Yamuna Auto Pvt Ltd
vii) Deepak Knits & Texturise Pvt. Ltd.
viii) Maral Overseas Ltd.
ix) LNJ Financial Services Ltd
x) Investors India Ltd
xi) Indo Canadian Consultancy Services Limited
xii) Bhilwara Technical Textiles Ltd.
xiii) BMD Pvt Ltd
xiv) Bhilwara Services Pvt Ltd.
xv) LNJ Bhilwara Textile Anusandhan Vikas Kendra
xvi) Niviedan Vanijya Niyojan Ltd
xvii) NJC Power Ltd
xviii) Balephi Jalbidhyut Company Ltd, Nepal
xix) Green Ventures Pvt Ltd, Nepal
xx) Bhilwara Green Energy Ltd
xxi) Agarwal Finestate Pvt Ltd
Schedule SIGNIFICANT ACCOUNTING POLICIES & NOTES TO ACCOUNTS (Contd...)15

Annual Report 2010-11 63
B The following transactions were carried out / outstanding with related parties in the ordinary course of business
17 One case of loss of material, by theft, was detected during the previous year involving an amount of `360.85 lacs which has beenshown as "Loss of material by theft" and is included in Schedule 12 : Consumption of materials in the Profit & Loss account in theprevious year
18 AS - 15 'EMPLOYEE BENEFITS'The Company has adopted Revised Accounting Standard - 15 'Employee Benefits' and the required disclosures are given hereunder:
Defined Contribution PlanContribution to Defined Contribution Plan, recognised as expense for the year are as under :
Schedule SIGNIFICANT ACCOUNTING POLICIES & NOTES TO ACCOUNTS (Contd...)15
As at As atMarch 31, 2011 March 31, 2010
1 With parties referred to in (a) above.i) Investment in Equity of HEG Graphite Products & Services Limited 5.00 5.00
2 With parties referred to in (b) above.i) Investment in Cumulative Redeemable Preference shares of Bhilwara Energy Ltd 4,000.00 4,000.00 ii) Investment in Equity of Bhilwara Energy Limited 2,612.70 2,612.70 iii) Investment in Equity of Bhilwara Infotech Limited 419.00 419.00 iv) Share Application money refund from Bhilwara Infotech Limited – 62.08 v) Redemption premium accrued on Preference Shares 849.43 373.70
3 With parties referred to in (c) above.i) Sitting fees paid to Sh. L N Jhunjhunwala – – ii) Salaries, Perquisites and Commission paid during the year to Sh. Ravi Jhunjhunwala(*) 481.81 597.62 iii) Salaries, Perquisites and Commission paid during the year to Sh. Riju Jhunjhunwala 34.82 121.46
4 With parties referred to in (d) above.i) Salaries, Perquisites and Commission paid during the year to Sh. Ravi Jhunjhunwala (*) 481.81 597.62 ii) Salaries, Perquisites and Commission paid during the year to Sh. Riju Jhunjhunwala 34.82 121.46 iii) Salaries, Perquisites and Commission paid during the year to Sh. R.C. Surana 265.65 146.03
(*) Apart from above, Keyman Insurance policy valuing `11.71 Lacs has been assigned during the year to Shri R.C.Surana (Previous year `190.16 Lacs to Shri Ravi Jhunjhunwala) in accordance with their terms of engagement.
5 With parties referred to in (e) above.a) Purchase of consumables 11.57 4.64 b) Rent Received 32.54 32.82 c) Rent Paid 115.14 115.14 d) Consultancy charges paid 13.84 2.10 e) Purchase of Machinery – – f) Guarantee given to IFC for AD Hydro Power Limited 600.00 600.00
(` in Lacs)
(` in Lacs)FY 2010-11 FY 2009-10
Employer's contribution to Provident Fund 175.96 168.31 Employer's contribution to Superannuation Fund 107.95 106.58 Employer's contribution to ESI 39.17 15.89
Schedules annexed to and forming part of the accounts

HEG Limited64
Schedules annexed to and forming part of the accounts
Defined Benefit PlanThe employees' gratuity fund scheme managed by a trust is a defined benefit plan. The present value of obligation is determinedbased on actuarial valuation using the Projected Unit Credit Method, which recognises each period of service as giving rise toadditional unit of employee benefit entitlement and measures each unit separately to build up the final obligation. The obligationfor leave encashment is recognised in the same manner as gratuity. The Company has maintained a fund with LIC.
1 Reconciliation of opening and closing balances of Defined Benefit Obligation.
2 Reconciliation of opening and closing balances of Fair Value of Plan Assets
3 Reconciliation of amount recognised in Balance Sheet
Schedule SIGNIFICANT ACCOUNTING POLICIES & NOTES TO ACCOUNTS (Contd...)15
Gratuity Gratuity Leave Leave(Funded) (Funded) encashment encashment
FY 2010-11 FY 2009-10 (unfunded) (Unfunded)FY 2010-11 FY 2009-10
Defined Benefit obligation at the beginning of the year 997.95 886.71 275.05 237.28Current Service Cost 52.00 48.95 30.20 25.51Interest Cost 79.84 62.07 22.00 16.61Actuarial (gain)/loss 4.79 52.62 32.68 15.13Past Service Cost 33.26 –Benefits Paid (103.42) (127.99) (30.76) (19.47)Settlement cost – – – –Defined Benefit obligation at the end of the year 1,031.15 955.62 329.17 275.06
(` in Lacs)
Gratuity Gratuity Leave Leave(Funded) (Funded) encashment encashment
FY 2010-11 FY 2009-10 (unfunded) (Unfunded)FY 2010-11 FY 2009-10
Fair Value of Plan Assets as at 31st March, 2011 960.22 900.09 – – Present value of obligation as at 31st March, 2011 1,031.15 955.61 329.17 275.05 Net asset/(liability) recognised in the Balance Sheet (70.93) (55.52) (329.17) (275.05)
(` in Lacs)
Gratuity Gratuity(Funded) (Funded)
FY 2010-11 FY 2009-10
Fair value of plan assets as at the beginning of the year 906.29 834.08 Expected Return 90.63 83.41 Actuarial (gain)/loss 31.05 59.50 Contribution by Employer 97.78 51.09 Benefits Paid (103.42) (127.99)Settlement cost – – Fair value of plan assets as at the end of the year 960.22 900.09 Actual return on plan assets 59.58 123.86
(` in Lacs)

Annual Report 2010-11 65
4 Expense recognised during the year under the heads
Schedule SIGNIFICANT ACCOUNTING POLICIES & NOTES TO ACCOUNTS (Contd...)15
6 Principal Actuarial Assumptions
Withdrawal Rates
The estimates of rate of escalation in salary considered in actuarial valuation, take into account inflation, seniority, promotion andother relevant factors including supply and demand in the employment market. The above information is certified by the actuary.
Gratuity Gratuity Leave Leave(Funded) (Funded) encashment encashment
FY 2010-11 FY 2009-10 (unfunded) (Unfunded)FY 2010-11 FY 2009-10
Mortality Table (LIC) 1994-96 duly 1994-96 duly 1994-96 duly 1994-96 dulymodified modified modified modified
Discount rate as at 31st March, 2011 8.00% 7.00% 7.00% 7.00%Future Salary Increase 5.50% 4.50% 4.50% 4.50%Expected rate of return on plan assets 10.00% 10.00% 0.00% 0.00%Retirement Age 60 years 60 years 60 years 60 years
(` in Lacs)
FY 2010-11 FY 2009-10
Age Withdrawal rates Age Withdrawal rates
Upto 30 years 3.00% Upto 30 years 3.00%From 31 to 2.00% Upto 44 years 2.00%
44 years Above 44 years 1.00% Above 44 years 1.00%
(` in Lacs)
Gratuity Gratuity Leave Leave(Funded) (Funded) encashment encashment
FY 2010-11 FY 2009-10 (unfunded) (Unfunded)FY 2010-11 FY 2009-10
Current Service Cost 52.00 48.95 30.20 25.51 Past Service Cost 33.26 – Interest Cost 79.84 62.07 22.00 16.61 Expected return on plan assets (90.63) (83.41) – Net Actuarial (gain)/ loss recognised during the period 35.84 (6.88) 32.68 15.13 Expenses recognised in the statement of Profit & Loss 77.05 53.99 84.88 57.25
(` in Lacs)
5 Actual Return on Plan Assets
Gratuity Gratuity(Funded) (Funded)
FY 2010-11 FY 2009-10
Expected Return on Plan Assets 90.63 82.02 Actuarial (gain)/ loss 31.05 43.92 Actual return on plan assets 59.58 125.94
(` in Lacs)
Schedules annexed to and forming part of the accounts

HEG Limited66
Schedules annexed to and forming part of the accounts
Amounts for the current and previous three periods in respect leave encashment are as follows
Amounts for the current and previous three periods in respect of gratuity are as follows
Provident FundThe Guidance note issued by Accounting Standard Board (ASB) on implementation AS-15. Employee Benefit (Revised 2005) statesthat provident funds set up by the employers, which require interest shortfall to be met by the employer, needs to be treated asdefined benefit plan.
The funds does not have any existing deficit or interest shortfall. In regard to any future obligation arising due to interest shortfall(ie government interest to be paid on provident fund scheme exceeds rate of interest earned on investment), pending the issuanceof Guidance Note from the actuarial society of India, the Company’s actuary has expressed his inability to reliably measure thesame.
Schedule SIGNIFICANT ACCOUNTING POLICIES & NOTES TO ACCOUNTS (Contd...)15
Leave encashment
Particulars 2010-11 2009-10 2008-09 2007-08
PBO (C) 329.17 275.05 237.28 239.08 Plan assets – – – – Net Assets/ (Liability) (329.17) (275.05) (237.28) (239.08)Experience adjustment on plan assetsExperience adjustment on plan liabilities (35.29) (15.13) – –
(` in Lacs)
Gratuity
Particulars 2010-11 2009-10 2008-09 2007-08
PBO (C) 1,031.15 997.95 886.71 902.81 Plan assets 960.22 900.09 834.08 893.10 Net Assets/ (Liability) (70.93) (55.52) (52.64) 9.71 Experience adjustment on plan assets (12.59) (46.30) 27.62 Experience adjustment on plan liabilities (31.05) 92.86 (78.56)
(` in Lacs)
19 Additional Information (` in Lacs)FY 2010-11 FY 2009-10
A) Installed capacity (as certified by the Management, being a technical matter relied upon by Auditors)i) Graphite Electrodes & Anodes MT 66,000 66,000ii) Thermal Power MW 63.00 63.00iii) Hydel Power MW 13.50 13.50
B) Value of Imports (CIF basis) in respect of :Raw Materials 38,364.35 21,287.04 Components & spare parts 431.74 445.93 Capital goods 3,292.21 342.27
C) Expenditure in Foreign Currency (Cash basis) on account of :Commission, Consultancy, Travelling, Interest and Others. 1,884.89 2,151.41
D) Amount remitted in foreign currency on account of dividend 1,354.70 1,039.97 Number of NRI / OCB shareholders 276 225 Number of shares held by above shareholders 13,547,024 15,999,470 Year to which the dividend relates 2009-10 2008-09 Amount remitted in foreign currency on account of interim dividend 821.39 – Number of NRI / OCB shareholders 386 – Number of shares held by above shareholders 16,427,876 – Year to which the dividend relates 2010-11 –

Annual Report 2010-11 67
Schedule SIGNIFICANT ACCOUNTING POLICIES & NOTES TO ACCOUNTS (Contd...)15
(` in Lacs)FY 2010-11 FY 2009-10
E) Earnings in Foreign currency :i) Export of goods calculated on FOB basis 80,457.61 76,375.18
F) Earnings Per Share as required by Accounting Standard (AS -20) :The basic and diluted Earning Per Share is as under :Net Profit After Tax 12,886.22 17,106.54 Weighted average no. of Equity Shares outstanding(*) 42,837,805 43,252,479 Basic Earning Per Share (`) Weighted equity Shares 42,837,805 (previous year 41,621,334) 30.08 41.10 Diluted Earning Per Share (`) Potential equity Shares 42,837,805(previous year 42,281,957) 30.08 40.91
(*) Weighted average no. of Equity Shares have been calculated on the basis of number of days these shares were outstandingduring the period.
G) Provision for Income Tax for Earlier years has been made based on Income Tax Assessment cases pending at AppellateJurisdictions on which Income Tax Demand has arisen and the cases are sub-judice.
No. of No. of Amount inshareholders shares held equivalent
INR
As at 31.03.2011i) Dividend for the year 2009-10
a) Amount remitted directly by the Company in foreign currency to non-resident shareholders 4 11,853,067 1,185.31
b) Amount paid in rupee to non-resident shareholders on repatriation basis 272 1,693,957 169.40Total of (a) & (b) 276 13,547,024 1,354.70
ii) Interim Dividend for the year 2010-11a) Amount remitted directly by the Company in foreign
currency to non-resident shareholders 5 14,746,955 737.35b) Amount paid in rupee to non-resident shareholders
on repatriation basis 381 1,680,921 84.05Total of (a) & (b) 386 16,427,876 821.39
As at 31.03.2010Dividend for the year 2008-09a) Amount remitted directly by the Company in foreign
currency to non-resident shareholders 5 14,746,955 958.55b) Amount paid in rupee to non-resident shareholders
on repatriation basis 220 1,252,515 81.41Total of (a) & (b) 225 15,999,470 1,039.97
(` in Lacs)
Schedules annexed to and forming part of the accounts

HEG Limited68
Schedules annexed to and forming part of the accounts
H) Segment Reporting
Schedule SIGNIFICANT ACCOUNTING POLICIES & NOTES TO ACCOUNTS (Contd...)15
Graphite Power Unallocable Totalitems / others
A Business Segments
Segments Revenue
External Sales / other income 111,010.45 19,683.11 803.54 131,497.10
(Net of Excise Duty) (106,970.56) (18,386.66) (870.91) (126,228.12)
Inter Segment Transfers 16,289.55 16,289.55
(11,589.13) (11,589.13)
Total Revenue 111,010.45 35,972.66 803.54 147,786.66
(106,970.56) (29,975.78) (871.91) (137,817.25)
Segment Result
Segment Results 15,515.82 4,654.94 298.98 20,469.74
(25,241.13) (4,185.80) (731.27) (30,158.19)
Less: Financial Expenses 3,662.28
(5,925.82)
Profit Before Tax 16,807.45
(24,232.37)
Less: Income Tax (incl Deferred) 3,921.22
(7,125.83)
Net Profit For the year 12,886.22
(17,106.54)
Other Information
Unallocated Assets (91.13) (91.13)
(8,318.93) (8,318.93)
Segment Assets 158,209.41 24,395.57 182,604.99
(136,345.65) (24,870.09) (161,215.74)
Total Assets 158,209.41 24,395.57 (91.13) 182,513.86
(136,345.65) (24,870.09) (8,318.93) (169,534.67)
Segment Liabilities 101,897.30 329.42 102,226.71
(81,654.24) (488.26) (82,142.50)
Unallocated Liabilities 1,043.35 1,043.35
(1,802.81) (1,802.81)
Total Liabilities 101,897.30 329.42 1,043.35 103,270.06
(81,654.24) (488.26) (1,802.81) (83,945.31)
Capital Employed 77,979.93 22,581.66 11,100.26 111,661.85
(63,353.00) (21,795.67) (6,313.15) (91,462.82)
Capital Exp.incurred during the year 7,030.58 1,072.15 55.32 8,158.06
(5,429.00) (1,699.83) (45.79) (7,174.62)
Depreciation 4,226.83 1,446.00 57.69 5,730.52
(3,685.26) (1,378.52) (73.27) (5,137.05)
Other Non Cash Expenses – – 34.77 34.77
– – (104.30) (104.30)
(` in Lacs)

Annual Report 2010-11 69
(Previous Year's figures have been regrouped and recast wherever considered necessary.
Figures in amount have been rounded off to nearest lacs upto two decimals. Figures in bracket relate to the previous year.
The Schedules referred to in the Balance Sheet and Profit and Loss Account form an integral part of the accounts.
I) In terms of Notification No.S.O.301(E) dated 8th February, 2011, issued by Ministry of Corporate Affairs, the Board of Directorsof the Company has given its consent at the Board Meeting held on 29th April 2011 for non-disclosure of informationcontained in para 3(i)(a), 3(ii)(a), 3(ii)(b), 3(ii)(d), of Part II of Schedule VI.
Schedule SIGNIFICANT ACCOUNTING POLICIES & NOTES TO ACCOUNTS (Contd...)15
Graphite Power Unallocable Totalitems / others
B Geographical SegmentSegment RevenueBased on Location of CustomersDomestic 25,579.15 18,310.08 1,373.03 45,262.26
(26,243.36) (18,386.66) (870.91) (45,500.92)Export 85,431.30 – 85,431.30
(80,727.20) – (80,727.20)Segment AssetsBased on Location of assetsIn India 151,178.83 23,323.42 (146.45) 174,355.80
(130,916.65) (23,170.25) (8,273.15) (162,360.05)Cost to acquire assets by location 7,030.58 1,072.15 55.32 8,158.06
(5,429.00) (1,699.83) (45.79) (7,174.62)
(` in Lacs)
Signed in terms of our report of even date
For Doogar & Associates For S.S. Kothari Mehta & Co. Ravi JhunjhunwalaChartered Accountants Chartered Accountants Chairman & Managing DirectorFirm Regn. No. 000561N Firm Regn. No. 000756N Shekhar Agarwal
Vice ChairmanMukesh Goyal Arun K. Tulsian D.N. DavarPartner Partner DirectorMembership No. 081810 Membership No. 089907 Riju Jhunjhunwala
DirectorManvinder Singh AjmaniChief Financial Officer
Place : Noida (U.P.) Ashish SabharwalDated : 29th April, 2011 Company Secretary
Schedules annexed to and forming part of the accounts

HEG Limited70
Cash Flow Statement For the year ended March 31, 2011
Year ended Year ended
March 31, 2011 March 31, 2010
A CASH FLOW FROM OPERATING ACTIVITIES
Profit before Tax 16,807.45 24,232.40
Add: Depreciation 5,730.52 5,137.05
Misc. Exps. Written off 34.77 104.30
Interest Paid 3,662.28 5,925.82
Net Loss on fixed assets sold / discarded 207.85 184.14
Diminution in value of Investments (net) – (205.34)
Less: Dividend received 51.78 9.75
Interest received 127.42 74.20
Operating Profit before working capital changes 26,263.66 35,294.42
Working capital
Trade receivables 4,494.61 (11,169.67)
Inventories (16,670.38) 6,690.62
Loans & advances / Other current assets (3,857.61) 2,768.56
Liabilities and provisions (1,073.82) 3,917.63
Cash from operating activities 6,666.69 37,501.56
Income / Wealth Tax 3,892.50 7,134.89
Net Cash from operating activities 2,774.19 30,366.67
B CASH FLOW FROM INVESTING ACTIVITIES
Addition in Fixed Assets (8,158.06) (7,174.62)
Sale of Fixed Assets 98.46 81.21
Advances for Capital Expenditure (2,880.37) 1,052.76
Sundry Creditors for Capital Expenditure (74.73) (817.19)
Investments (3,487.94) 1,859.82
Dividend Received 51.78 9.75
Interest received 127.42 74.20
Net Cash from investing activities (14,323.44) (4,914.07)
(` in Lacs)
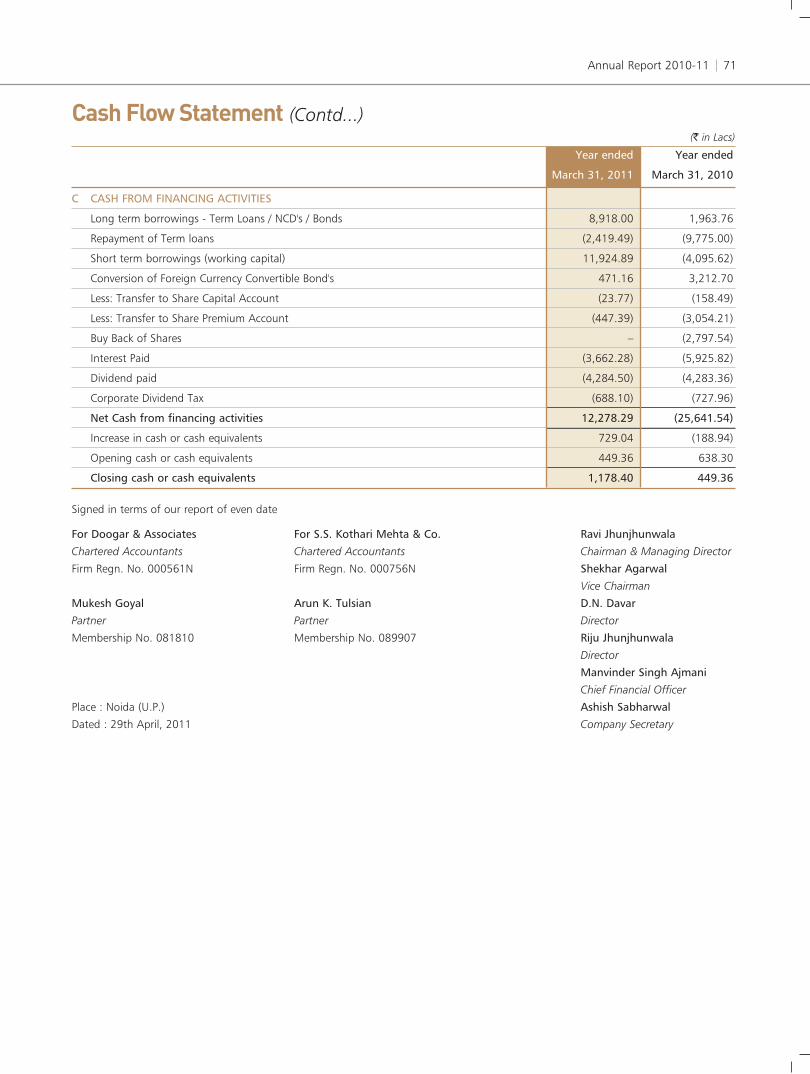
Annual Report 2010-11 71
Signed in terms of our report of even date
For Doogar & Associates For S.S. Kothari Mehta & Co. Ravi Jhunjhunwala
Chartered Accountants Chartered Accountants Chairman & Managing Director
Firm Regn. No. 000561N Firm Regn. No. 000756N Shekhar Agarwal
Vice Chairman
Mukesh Goyal Arun K. Tulsian D.N. Davar
Partner Partner Director
Membership No. 081810 Membership No. 089907 Riju Jhunjhunwala
Director
Manvinder Singh Ajmani
Chief Financial Officer
Place : Noida (U.P.) Ashish Sabharwal
Dated : 29th April, 2011 Company Secretary
Year ended Year ended
March 31, 2011 March 31, 2010
C CASH FROM FINANCING ACTIVITIES
Long term borrowings - Term Loans / NCD's / Bonds 8,918.00 1,963.76
Repayment of Term loans (2,419.49) (9,775.00)
Short term borrowings (working capital) 11,924.89 (4,095.62)
Conversion of Foreign Currency Convertible Bond's 471.16 3,212.70
Less: Transfer to Share Capital Account (23.77) (158.49)
Less: Transfer to Share Premium Account (447.39) (3,054.21)
Buy Back of Shares – (2,797.54)
Interest Paid (3,662.28) (5,925.82)
Dividend paid (4,284.50) (4,283.36)
Corporate Dividend Tax (688.10) (727.96)
Net Cash from financing activities 12,278.29 (25,641.54)
Increase in cash or cash equivalents 729.04 (188.94)
Opening cash or cash equivalents 449.36 638.30
Closing cash or cash equivalents 1,178.40 449.36
(` in Lacs)
Cash Flow Statement (Contd...)

HEG Limited72
Balance Sheet AbstractBalance Sheet Abstract and Company’s General Business Profile For the year ended March 31, 2011
(as per part (iv) of Schedule VI of the Companies Act, 1956)
3 1 0 3
State Code
Balance Sheet Date
I. Registration Details
II. Capital raised during the year (amount in ` Thousands)
III. Position of mobilisation and deployment of funds (amount in ` Thousands)
2 0 1 1
Balance Sheet Date 0 8 2 9 0 1 0
Total assets
Private placement
N I L
Sources of Funds
Application of Funds
Reserves and surplus
IV. Performance of the Company (amount in ` Thousands)
Item Code No. (ITC code) Product descriptionsV. Generic Names of three principal products/services of Company (as per monetary terms)
Rights issue
N I L
Bonus issue
N I L
Public issue
N I L
1 8 0 0 2 4 0 9
Total liabilities
1 8 0 0 2 4 0 9
7 7 3 4 6 8 0
Unsecured loans
1 4 1 9 8 3 1
Paid–up capital
4 2 8 4 5 3
Secured loans
7 6 8 3 3 7 3
Deferred tax
7 3 6 0 7 1
Net fixed assets
7 3 7 1 8 6 4
Net current assets
9 6 1 1 7 8 9
Accumulated Losses
N I L
Turnover
1 2 9 9 2 5 8 7
8 5 4 5 1 1 1
Total expenditure
1 0 0 7 4 5 3 5
Profit / loss before tax
+ 1 6 8 0 7 4 5(+/–)
Profit / loss after tax
+ 1 2 8 8 6 2 2(+/–)
Earnings per share (`)
3 0 . 0 8
Dividend @ %
1 0 0 %
G R A P H I T E E L E C T R O D E
Investments
1 0 1 8 7 5 5
Miscellaneous expenditure
N I L
Signed in terms of our report of even date
For Doogar & Associates For S.S. Kothari Mehta & Co. Ravi JhunjhunwalaChartered Accountants Chartered Accountants Chairman & Managing DirectorFirm Regn. No. 000561N Firm Regn. No. 000756N Shekhar Agarwal
Vice ChairmanMukesh Goyal Arun K. Tulsian D.N. DavarPartner Partner DirectorMembership No. 081810 Membership No. 089907 Riju Jhunjhunwala
DirectorManvinder Singh AjmaniChief Financial Officer
Place : Noida (U.P.) Ashish SabharwalDated : 29th April, 2011 Company Secretary

Annual Report 2010-11 73
Auditors’ Report on Consolidated Financial Statement
To the Board of Directors,HEG Limited
We have audited the attached consolidated Balance Sheet of
HEG LIMITED and its Subsidiary and Associates (Collectively
“the Group”) as at 31st March, 2011, and also the
consolidated Profit and Loss account and the consolidated
Cash Flow Statement for the year ended on that date annexed
thereto. These consolidated financial statements are the
responsibility of the Company’s management. Our
responsibility is to express an opinion on these financial
statements based on our audit.
We conducted our audit in accordance with generally accepted
auditing standards in India. Those Standards require that we
plan and perform the audit to obtain reasonable assurance
about whether the financial statements are prepared, in all
material respects, in accordance with identified financial
reporting framework and are free of material misstatements.
An audit includes examining, on a test basis, evidence
supporting the amounts and disclosures in the financial
statements. An audit also includes assessing the accounting
principles used and significant estimates made by
management, as well as evaluating the overall financial
statement presentation. We believe that our audit provides a
reasonable basis for our opinion.
We did not audit the financial statements of the subsidiary,
whose adjusted financial statements reflect total assets of
`4.32 lacs (previous year `4.51 lacs) and total liabilities of
`5.00 lacs (previous year `5.00 lacs) as at 31st March, 2011
and total revenues of ` NIL (previous year ` NIL), total expenses
of `0.19 lacs (previous year `0.49 lacs) and net cash flows of
`4.43 lacs (previous year `4.62 lacs) for the year then ended.
These financial statements have been audited by other auditor
whose report have been furnished to us, and our opinion, in so
far as it relates to the amounts included in respect of the
subsidiary, is based solely on the report of the other auditor.
The financial statements of the Associates and Subsidiaries of
the Associates are Unaudited / provisional and have been
approved/ acknowledged by the Board of Directors of the
respective Associates, whose certificates have been furnished
to us, and our opinion, in so far as it relates to these amounts
included in respect of Associates and Subsidiaries of the
Associates are based solely on these certification.
We report that the consolidated financial statements have
been prepared by the Company in accordance with the
requirements of Accounting Standard (AS) - 21, ‘Consolidated
Financial Statements’ and Accounting Standard (AS) - 23,
‘Accounting for Investment in Associate in Consolidated
Financial Statement’s notified pursuant to the Companies
(Accounting Standards) Rules, 2006 and on the basis of the
separate audited financial statements of the Group included in
the Consolidated Financial Statements.
Based on our audit and on consideration of the report of other
auditor on separate financial statement and on the other
financial information of the subsidiary and associates, in our
opinion and to the best of our information and according to
the explanations given to us, the attached consolidated
financial statements give a true and fair view in conformity
with the accounting principles generally accepted in India:
i) In the case of Consolidated Balance Sheet, of the
consolidated state of affairs of The Group as at 31st March,
2011;
ii) In the case of Consolidated Profit & Loss account, of the
consolidated results of operations of The Group for the
year ended on that date; and
iii) In the case of Consolidated Cash Flow Statement, of the
consolidated cash flows of The Group for the year ended
on that date.
For Doogar & Associates For S. S. Kothari Mehta & Co.
Chartered Accountants Chartered Accountants
Firm Regn. No. 000561N Firm Regn. No. 000756N
Mukesh Goyal Arun K. Tulsian
Partner Partner
Membership No. 081810 Membership No. 089907
Place: New Delhi
Dated: 29th April, 2011

HEG Limited74
Consolidated Balance Sheet As at March 31, 2011
Signed in terms of our report of even date
For Doogar & Associates For S.S. Kothari Mehta & Co. Ravi JhunjhunwalaChartered Accountants Chartered Accountants Chairman & Managing DirectorFirm Regn. No. 000561N Firm Regn. No. 000756N Shekhar Agarwal
Vice ChairmanMukesh Goyal Arun K. Tulsian D.N. DavarPartner Partner DirectorMembership No. 081810 Membership No. 089907 Riju Jhunjhunwala
DirectorManvinder Singh AjmaniChief Financial Officer
Place : Noida (U.P.) Ashish SabharwalDated : 29th April, 2011 Company Secretary
Schedules As at As at
March 31, 2011 March 31, 2010
SOURCES OF FUNDS
Shareholders' Funds
Share Capital 1 4,284.53 4,260.76
Reserves & Surplus 2 86,759.39 78,990.86
91,043.92 83,251.62
Loan Funds 3
Secured Loans 76,833.73 71,608.64
Unsecured Loans 14,198.31 1,471.66
91,032.04 73,080.30
Deferred Tax Liability 4 7,360.71 7,488.78
Total 189,436.67 163,820.70
APPLICATION OF FUNDS
Fixed Assets 5
Gross Block 104,416.54 99,463.71
Less: Depreciation 38,556.14 33,676.21
Net Block 65,860.40 65,787.50
Capital Work in Progress 7,858.25 5,809.91
73,718.64 71,597.41
Investments 6 19,595.81 16,857.46
Current Assets, Loans & Advances 7
Inventories 50,952.18 34,281.79
Sundry Debtors 39,529.35 44,023.97
Cash & Bank Balances 1,182.84 453.98
Loans and Advances 19,185.75 12,447.77
110,850.11 91,207.51
Less : Current Liabilities and Provisions 8
Liabilities 13,226.44 10,128.76
Provisions 1,501.46 5,747.69
14,727.90 15,876.45
Net Current Assets 96,122.22 75,331.06
Miscellaneous Expenditure 9 – 34.77
(to the extent not written off or adjusted)
Total 189,436.67 163,820.70
Notes to Accounts 15
(` in Lacs)

Annual Report 2010-11 75
Consolidated Profit and Loss Account For the year ended March 31, 2011
Signed in terms of our report of even date
For Doogar & Associates For S.S. Kothari Mehta & Co. Ravi JhunjhunwalaChartered Accountants Chartered Accountants Chairman & Managing DirectorFirm Regn. No. 000561N Firm Regn. No. 000756N Shekhar Agarwal
Vice ChairmanMukesh Goyal Arun K. Tulsian D.N. DavarPartner Partner DirectorMembership No. 081810 Membership No. 089907 Riju Jhunjhunwala
DirectorManvinder Singh AjmaniChief Financial Officer
Place : Noida (U.P.) Ashish SabharwalDated : 29th April, 2011 Company Secretary
Schedules Year ended Year ended
March 31, 2011 March 31, 2010
INCOMEGross Turnover 129,925.87 126,844.58 Less: Inter divisional Sales (16,289.55) (11,589.13)Less: Excise Duty (2,271.50) (2,115.48)Net Turnover 111,364.82 113,139.97 Other Income 10 3,842.73 1,499.02 Increase/(Decrease) in Stocks 11 11,772.82 (703.42)
126,980.37 113,935.57 EXPENDITUREConsumption of Materials 12 61,297.67 47,356.60 Manufacturing and Other Expenses 13 55,737.42 42,769.03 Less: Inter divisional Purchases (16,289.55) (11,589.13)Total Expenditure 100,745.54 78,536.50 Profit Before Interest, Depreciation and Amortisation 26,234.84 35,399.07 Financial Expenses 14 3,662.29 5,925.83 Profit Before Depreciation and Amortisation 22,572.54 29,473.24 Depreciation 5 5,730.52 5,137.06 Amortisation - Misc. Expenditure written off 9 34.77 104.30 Profit Before Tax 16,807.26 24,231.88 Less: Taxation - Current 4,297.50 7,048.03
- Deferred (128.07) (9.06)- Fringe Benefit Tax – (1.11)- Earlier Years (248.20) 87.97
Profit After Tax 12,886.03 17,106.05 Share in Result of Associates (749.59) 1,402.02 Balance brought forward from previous year 24,777.54 14,587.48 Amount available for appropriation 36,913.98 33,095.55 APPROPRIATIONSGeneral Reserve 2,500.00 2,500.00 Capital Redemption Reserve – 329.57 Debenture Redemption Reserve 1,904.49 477.13 Interim Dividend on Equity Shares 2,142.25 Corporate Dividend Tax on Interim Dividend 340.58 Proposed Dividend on Equity Shares 2,142.25 4,283.36 Corporate Dividend Tax on Proposed dividend 347.53 727.96 Balance Carried Forward 27,536.89 24,777.53 Notes to accounts 15 Earning Per Share (`) See Note No. 18 (a) of Schedule 15- Basic 28.33 44.47 - Diluted 28.33 44.25
(` in Lacs)

HEG Limited76
Schedules annexed to and forming part of the consolidated accounts
As at As at
March 31, 2011 March 31, 2010
Authorised5,50,00,000 (5,50,00,000) Equity Shares of `10/- each 5,500.00 5,500.00
15,00,000 (15,00,000) Preference shares of `100/- each 1,500.00 1,500.00 7,000.00 7,000.00
Issued & Subscribed & Paid Up4,26,07,174 (4,25,73,005) Equity Shares of `10/- each fully paid up 4,260.72 4,257.30
Nil (15,50,725) Less: Shares bought back and extinguished – 155.07 2,37,733 (15,84,894) Add: Shares issued on FCCB conversion 23.77 158.49
Add : Forfeited Equity Shares 0.04 0.04 4,28,44,907 (4,26,07,174) 4,284.53 4,260.76
Of the above ;i) 2,21,96,821 (2,21,96,821) Equity shares have been issued as fully paid up bonus shares by capitalisation of Reserves.
ii) 3,00,000 (3,00,000) Equity shares have been issued as fully paid up pursuant to a contract without payment being received in cash.
iii) 10,700 (10,700) Equity shares have been issued at par as fully paid up to the members of erstwhile subsidiary company Bhilwara VikingPetroleum Limited pursuant to amalgamation.
iv) 58,30,144 (55,92,411) Equity shares have been issued as fully paid up shares upon conversion of Foreign Currency ConvertibleBonds.(FCCBs)
Figures in paranthesis represent previous year figures
1) Addition in the previous year represents preferential warrants money forfeited.
2) Additions represent share premium on conversion of FCCBs `446.39 Lacs and `158.27 Lacs on account of write back of provision ofpremium on redemption of FCCBs created out of this account in earlier periods.
(` in Lacs)
Schedule SHARE CAPITAL1
March 31, 2010 Additions Deductions March 31, 2011
Capital Reserve (1) 3138.24 0.00 – 3138.24 (1411.79) (1726.45) – (3138.24)
Debenture Redemption Reserve 477.13 1904.49 – 2381.62 0.00 (477.13) – (477.13)
Capital Redemption Reserve 1604.99 0.00 – 1604.99 (1449.92) (155.07) – (1604.99)
Share Premium (2) 7414.95 604.66 – 8019.61 (5693.32) (3228.71) (1507.07) (7414.95)
General Reserve 32817.18 2500.00 – 35317.18 (30227.40) (2589.78) – (32817.18)
Profit & Loss Account 23375.52 12886.03 9377.08 26884.49 (14587.48) (17106.05) (8318.02) (23375.54)68828.01 17895.18 9377.08 77346.13
(53369.90) (25283.19) (9825.09) (68828.01)Add: Share in Reserve of AssociatesCapital Reserve 6631.43 0.00 0.00 6631.43
(8273.43) 0.00 (1642.00) (6631.43)Profit and Loss Account 3531.42 188.09 937.68 2781.83
(2129.40) (1402.02) 0.00 (3531.42)78990.86 18083.27 10,314.76 86759.39
(63772.72) (26685.21) (11467.09) 78990.86
Schedule RESERVES AND SURPLUS2

Annual Report 2010-11 77
1. Secured redeemable Non-Convertible Debentures (NCD) of `15,000 Lacs have been allotted on private placement basis. These NCDsaggregating to `10,000 Lacs allotted on 17th December, 2009 shall fall due for redemption in two equal installments after a periodof two years and three years respectively and NCDs aggregating to `5,000 Lacs allotted on 30th October, 2009 shall fall due forredemption after a period of three years from its date of allotment. The NCDs have been issued in demat mode and are listed inWholesale Debt Segment of Bombay Stock Exchange.
2. Term loans from Financial Institutions and Banks and redeemable Non Convertible Debentures stated as above are/shall be secured byway of joint equitable mortgage of all the immovable properties (present and future) of graphite & thermal power units and hydel unitof the Company situated at Mandideep and Tawanagar respectively ranking on pari- passu basis and hypothecation of all movableassets of the Company (except book debts) subject to prior charge of the Company's bankers on specified movable assets in respect ofworking capital borrowings.
3. Working Capital Borrowings from Banks are secured by hypothecation of all stocks present and future, stores, spare parts, packingmaterials, raw materials, finished goods, goods in transit / process, book debts, outstanding monies receivable, claims, bills etc. andsecond charge by way of joint equitable mortgage of immovable properties of the Company in respect of Graphite & Thermal Powerunits at Mandideep and hydel unit at Tawanagar. The said charge in favour of bank shall rank sub-ordinate and subservient to theexisting charges created by the Company in favour of financial Institutions and banks for their term loans.
4. The Company had issued unsecured 1% Foreign Currency Convertible Bonds (FCCBs) in July 2005 due for redemption in 2010amounting to USD 28.75 million convertible at the option of the bondholders into Equity Shares of `10/- each at a conversion priceof `192.06 per share. FCCB's amounting to USD 25.75 million have been converted into Equity Shares out of which FCCBs amountingto USD 1.05 million were converted during the financial year (previous year USD 7 Million). FCCBs amounting to USD 3 million werebought back in the earlier period in accordance with guidelines issued by the Reserve Bank of India.
Opening Balance 7,488.78 7,497.84Addition / (deduction) during the year (128.07) (9.06)Closing Balance 7,360.71 7,488.78(Refer note no. 4 of schedule 15B)
Schedule DEFERRED TAX LIABILITY4
As at As at
March 31, 2011 March 31, 2010
Secured LoansSecured Redeemable Non-Convertible Debentures 15,000.00 15,000.00 Term Loans - From Banks 12,540.74 6,042.23 Short Term Working Capital Borrowings- From Banks 49,292.99 50,566.41
76,833.73 71,608.64 Unsecured LoansForeign Currency Convertible Bonds – 471.66 Term Loans- From Banks – – Short Term Borrowings from Banks 14,198.31 1,000.00
14,198.31 1,471.66 Total Loans 91,032.04 73,080.30
(` in Lacs)
Schedule LOANS3
Schedules annexed to and forming part of the consolidated accounts

HEG Limited78
Schedules annexed to and forming part of the consolidated accounts
GROSS BLOCK DEPRECIATION NET BLOCKSL Particulars Cost Additions Cost Adjustments Gross
No. as at during Sale/ as at Up to on Provision Up to As at As at31.03.2010 the year Adjustments 31.3.2011 31.03.2010 deduction for the year 31.3.2011 31.3.20101 31.3.2010
A Tangible Assets1. Free Hold Land 68.44 37.59 – 106.03 – – – – 106.03 68.44 2. Lease Hold Land 464.51 – – 464.51 88.91 – 9.52 98.43 366.07 375.60 3. Building 13,484.57 1,848.50 265.73 15,067.34 4,560.90 131.45 817.99 5,247.44 9,819.90 8,923.66 4. Plant & Machinery 81,379.20 3,431.69 625.47 84,185.42 27,001.45 520.85 4,429.74 30,910.34 53,275.08 54,377.75 5. Railway Sidings 418.99 – – 418.99 100.37 – 19.90 120.27 298.72 318.62 6. Furniture & Fixtures 453.21 37.74 3.75 487.20 290.95 1.99 33.65 322.61 164.59 162.27 7. Office Equipment 882.22 130.20 72.23 940.19 618.11 68.82 106.37 655.66 284.53 264.10 8. Electrical Installation 1,193.02 203.57 9.37 1,387.22 432.40 3.11 122.16 551.45 835.77 760.61 9. Vehicles 841.02 280.95 180.35 941.62 357.64 124.38 148.35 381.61 560.01 483.38 B Intangible Assets1 Software (Bought out) 278.54 139.48 – 418.02 225.48 – 42.85 268.33 149.69 53.06
99,463.71 6,109.72 1,156.90 104,416.54 33,676.22 850.60 5,730.52 38,556.14 65,860.40 65,787.49 Capital Work In Progress – – 7,858.25 5,809.91 Total 99,463.71 6,109.72 1,156.90 104,416.54 33,676.22 850.60 5,730.52 38,556.14 73,718.65 71,597.41 Previous Year 85,346.09 14,787.43 669.81 99,463.71 28,943.61 404.46 5,137.06 33,676.21 71,597.41 69,825.18
Notes1) Assets amounting to `83.13 lacs (`83.13 lacs) (Gross) are owned jointly with RSWM Ltd.2) Capital Work In Progress includes `607.42 (Previous year `167.53 Lacs) being pre-operative expenditure and `3840.31 Lacs (Previous year
`2,113.47 Lacs) being capital stores.3) Freehold land includes agricultural land in village Kirat Nagar, District Raisen, Madhya Pradesh measuring 0.26 acre in the Company's possession
pending registration in favour of the Company.
Schedule FIXED ASSETS5
(` in lacs)
As at As at
March 31, 2011 March 31, 2010
A Long Term Investmentsi) Quoted - Fully Paid
18 (18) Equity Shares of `2/-each of Ballarpur Ind. Ltd. 0.01 0.01 Total of quoted investment 0.01 0.01 Investment In Associates
ii) Unquoted - Fully Paid4,190,000 (4,190,000) Equity Shares of `10/- each of Bhilwara Infotech Ltd. 419.00 419.00
39,190,500 (39,190,500) Equity Shares of `10/- each of Bhilwara Energy Ltd.(*) 2,612.70 2,612.70 400,000 (400,000) 0.01% Preference Shares of `100/- each of Bhilwara Energy Ltd. 4,000.00 4,000.00
B Current Investment In Mutual Funds250,000 (250,000) Units of LIC Mutual Fund Dhan Smriddhi of `10/- each 25.00 25.00
Nil (150,000) Units of SBI One India -Growth of `10/-each – 15.00 24,927,240.29 (0) Units of SBI Premier Liquid Fund-Super Institutional - Daily Dividend 2,500.82 –
9,988,718.25 (0) Units of SBI Premier Liquid Fund- Institutional - Daily Dividend 1,002.12 – 3,527.94 40.00
Total 10,559.65 7,071.71 Less: Provision for diminution in value of investments 377.10 377.10
10,182.55 6,694.61 Add : Increase in Value of Investment in AssociatesOpening Balance 10,162.85 8,760.83 Add: During the year (749.59) 1,402.02 Closing Balance 9,413.26 10,162.85
19,595.81 16,857.46 Aggregate Market Value of Quoted Investments 0.01 0.01
(*) Includes 1,30,63,500 Equity Shares received as bonus shares in the previous year.
Schedule INVESTMENTS (Non-Trade)6

Annual Report 2010-11 79
As at As at
March 31, 2011 March 31, 2010
Current AssetsInventories (As taken, valued and certified by the Management)Stock-in-trade 8,697.20 3,773.06 Work-in-process 24,742.11 17,893.43 Raw Materials[incl in-transit / Third Parties `3477.13 lacs (`4890.76 lacs)] 12,752.98 9,750.70 Stores & Spares / Loose Tools (Incl in-transit/Third Parties `135.89 Lacs (`158.45 Lacs)) 4,759.89 2,864.60
50,952.18 34,281.79 Sundry Debtors (Unsecured)Due for a period exceeding six months
- Considered good 9,018.82 6,632.55 - Considered doubtful – 13.96
9,018.82 6,646.51 Less : Provision for doubtful debts – 13.96
9,018.82 6,632.55 Others (Considered good) 30,510.53 37,391.42
39,529.35 44,023.97 Cash & Bank Balances :Cash in hand (including stamp & hundi papers) 13.48 7.83 Cheques in hand 90.46 36.20 With scheduled banks
- Current Accounts 860.92 260.59 - Fixed Deposits / Margin money accounts 0.29 0.29 - Dividend / Special purpose accounts 217.68 149.08
1,182.84 453.99 Loans and advances (Refer Note 13 of Schedule 15-B)Loans (Secured, considered good) 119.19 91.88 Loans (Unsecured, considered good) 111.64 100.52 Advances recoverable in cash or kind or for value to be received 13,300.36 9,775.94 Advances for Capital Expenditure 3,503.16 622.79 Balance with Excise Department including Cenvat Credit 1,681.09 1,289.91 Deposit with Government Deptt. and others 470.31 566.73 Considered doubtful – – Less : Provision for doubtful advances – –
19,185.75 12,447.77110,850.11 91,207.52
(` in Lacs)
Schedule CURRENT ASSETS, LOANS AND ADVANCES7
Units Value Total value
(per unit) (` in lacs)
During the year, the Company has purchased the following investmentI) Birla Sun Life Saving Fund - Instl - Daily Dividend-Reinvestment 10,040,591.69 10.0068 1,004.74 II) Reliance Money Manager Fund - Institutional Option-Daily Dividend Plan 330,695.42 1,001.3715 3,311.49 III) JP Morgan India Liquid Fund-Super Inst.Daily Dividend Plan-Reinvest 50,154,319.09 10.0079 5,019.39 IV) Kotak Floater Long Term - Daily Dividend 39,772,320.05 10.0798 4,008.97 V) Reliance Liquid Fund -Cash Plan Daily Dividend Option 22,476,705.45 11.1415 2,504.24 VI) SBI Premier Liquid Fund - Institutional - Daily Dividend 9,988,718.25 10.0325 1,002.12 VII) SBI Premier Liquid Fund - Super Institutional - Daily Dividend 24,927,240.29 10.0325 2,500.83 During the year , the Company has sold the following investmentI) Birla Sun Life Saving Fund - Instl - Daily Dividend-Reinvestment 10,040,591.69 10.0068 1,004.74 II) Reliance Money Manager Fund - Institutional Option-Daily Dividend Plan 330,695.42 1,001.3715 3,311.49 III) JP Morgan India Liquid Fund-Super Inst.Daily Dividend Plan-Reinvest 50,154,319.09 10.0079 5,019.39 IV) Kotak Floater Long Term - Daily Dividend 39,772,320.05 10.0798 4,008.97 V) Reliance Liquid Fund - Cash Plan Daily Dividend Option 22,476,705.45 11.1415 2,504.24
Figures in parenthesis represent previous year figures.
Schedule INVESTMENTS (Contd...)6
Schedules annexed to and forming part of the consolidated accounts

HEG Limited80
Schedules annexed to and forming part of the consolidated accounts
As at As at
March 31, 2011 March 31, 2010
Current LiabilitiesSundry Creditors - Micro and Small Enterprises (Refer Note no. 14 of Schedule 15 B) 26.28 – Sundry Creditors - Other than Micro and Small Enterprises 4,362.69 4,797.99 Sundry Creditors for Capital Expenditure 125.67 200.40 Other Liabilities 4,526.67 3,896.24 Unclaimed Dividend** 217.68 149.08 Sundry Deposits 488.37 445.96 Advances from Customers 2,980.14 174.18 Interest accrued but not due on loans 498.94 464.91
13,226.44 10,128.76 Proposed Dividend Including Corporate Dividend Tax 2,489.77 5,011.32 Provision for Taxation (Net of Advance Tax `26,185.61 lacs (`22,167.16 lacs)) (988.32) 578.10 Provision for premium on redemption on FCCBs – 158.27
1,501.46 5,747.69 14,727.90 15,876.44
** Investor Education & Protection Fund is credited by unclaimed dividend amounts outstanding on expiry of seven years from dividenddeclaration.
(` in Lacs)
Schedule CURRENT LIABILITIES AND PROVISIONS8
Year ended Year ended
March 31, 2011 March 31, 2010
Foreign Currency Fluctuation (Net) 2,348.05 479.95 Accrued Redemption Premium On Non Trade Investment 475.73 373.70 Miscellaneous Sales / Receipts 145.09 4.46 Write-back of Provision on Investments Sold – 180.08 Profit on Sale of Investments 1.38 9.95 Rent Receipts 242.54 204.84 Interest [Including TDS Nil (`9.04 Lacs)] 127.42 74.20 Dividend Income from Investment in Mutual fund schemes 51.78 9.75 Liabilities / provisions no longer required, written back 443.83 157.41 Profit on sale of Fixed Assets 6.90 4.68
3,842.73 1,499.02
(` in Lacs)
Schedule OTHER INCOME10
Opening Balance 34.77 139.07 Less: Charged off to Profit and Loss account 34.77 104.30 Closing Balance 0.00 34.77
Schedule MISCELLANEOUS EXPENDITURE (to the extent not written off or adjusted)9
Closing StockStock-in-trade 8,697.20 3,773.06 Work-in-Process 24,742.11 17,893.43
33,439.31 21,666.49 Less: Opening StockStock-in-trade 3,773.06 6,603.20 Work-in-Process 17,893.43 15,766.71
21,666.49 22,369.91 Increase/(Decrease) in Stocks 11,772.82 (703.42)
Schedule INCREASE/(DECREASE) IN STOCKS11

Annual Report 2010-11 81
Year ended Year ended
March 31, 2011 March 31, 2010
Opening Stock 4,859.95 14,165.27 Add : Purchases 65,713.56 38,051.27
70,573.51 52,216.54 Less: Closing Stock 9,275.84 4,859.94 Consumption of Materials * 61,297.67 47,356.60
(*) Includes loss of material on account of theft- Exceptional item `360.85 Lacs in the previous year(*) Net of DEPB Accrued
(` in Lacs)
Schedule CONSUMPTION OF MATERIALS12
Manufacturing ExpensesConsumption of Stores & Spares including Refractory blocks 8,824.91 5,071.44 Excise duty on Increase / (Decrease) in Finished Stock (38.64) 23.72 Power & fuel 23,118.90 16,828.11 Repairs and Maintenance of :
Plant & Machinery 3,083.64 1,908.90 Building 603.77 323.47 Others 251.53 116.59
Job/Process Charges 254.98 199.05 Power generation charges 111.01 75.78 Payment to and Provision for EmployeesSalary, Wages and Bonus etc. 3,494.54 3,086.60 Contribution to Provident, Gratuity and other Funds 431.25 421.72 Workmen & Staff Welfare & Safety measures expenses 481.52 393.88 Selling ExpensesFreight and forwarding and other selling expenses 7,494.94 6,841.11 Packing Expenses (including Packing material consumption) 1,567.20 1,144.60Commission 1,569.16 1,578.18 Claims, Rebates and Discount 1,174.06 1,654.03 Administrative & Other ExpensesInsurance 284.50 232.26 Rent 106.43 130.67 Rates & Taxes 78.38 102.17 Directors' Remuneration including sitting fees & incidental expenses 791.60 880.51 Donations 30.12 3.62 Loss on fixed assets sold / discarded 214.74 188.82 Provision for - Diminution/(Restatement of diminution) in value of Investments – (15.31)Provision for doubtful debts & advances – 13.96 Travelling Expenses 189.21 206.79 Postage & Communication 72.56 70.02 Legal & Professional Expenses 776.01 595.62 Vehicle Running & Maintenance 107.26 92.47 Miscellaneous Expenses 663.86 600.23
55,737.42 42,769.03
Schedule MANUFACTURING AND OTHER EXPENSES 13
Schedules annexed to and forming part of the consolidated accounts

HEG Limited82
Schedules annexed to and forming part of the consolidated accounts
Year ended Year ended
March 31, 2011 March 31, 2010
Interest on Debentures 1,347.50 527.44 Term Loans 185.35 1,591.23 Working Capital Borrowings 1,785.56 3,489.41 Foreign Currency Convertible Bonds – 24.30
Bank Charges 343.88 293.45 Total (Net of Financial Expenses Capitalised `341.24 Lacs (previous year `37.74 Lacs) 3,662.29 5,925.83
(` in Lacs)
Schedule FINANCIAL EXPENSES 14
A. SIGNIFICANT ACCOUNTING POLICIES1. Basis and Principles of Consolidation
The Consolidated Financial Statement (CFS) of the Company and its Subsidiaries are prepared under historical cost convention andon the accounting principles of going concern, in accordance with Generally Accepted Accounting Principles (‘GAAP’) applicablein India and in the same manner as the Company has followed for its separate financial statements, using uniform accountingpolicies for similar transaction. All significant Intra-group balances, Intra-group transactions, resulting unrealised profits have beeneliminated on consolidation and the figures have been recast, rearranged or regrouped, wherever considered necessary.
The following Components considered in preparation of Consolidated Financial Statements:-
a) Subsidiary Companies.
The consolidation of the financial statements of the Parent and its Subsidiaries has been done on line-by-line basis by addingtogether, like items of assets, liabilities, income and expenses as per AS 21.
b) Investment in Associates.
The Group’s investment in Associates is accounted using Equity Method as per AS 23.
Schedule SIGNIFICANT ACCOUNTING POLICIES AND NOTES ON ACCOUNTS ON CONSOLIDATED FINANCIAL STATEMENTS15
Ownership Period Audited/BoardName Country (%) Considered ApprovedHEG Graphite Products & Services Ltd. India 100% 01.04.2010 to Audited
31.03.2011
Ownership Period Audited/BoardName Country (%) Considered ApprovedBhilwara Infotech Ltd. India 48.43% 01.04.2010 to Provisional
31.03.2011Bhilwara Energy Ltd. India 25.8% 01.04.2010 to Provisional (Acknowledged by
31.03.2011 Board of BEL)Indo Canadian Consultancy Services India 13.16% 01.04.2010 to Provisional (Acknowledged byLtd. (Subsidiary of BEL) 31.03.2011 Board of BEL)Malana Power Corporation Limited India 13.16% 01.04.2010 to Provisional (Acknowledged by(Subsidiary of BEL) 31.03.2011 Board of BEL)AD Hydro Power Ltd. India 11.58% 01.04.2010 to Provisional (Acknowledged by(Fellow Subsidiary of BEL) 31.03.2011 Board of BEL)NJC Hydro Power Ltd. India 25.8% 01.04.2010 to Provisional (Acknowledged by(subsidiary of BEL) 31.03.2011 Board of BEL)Green Ventures Pvt.Ltd. Nepal 16.34% 01.04.2010 to Provisional (Acknowledged by(Subsidiary of BEL) 31.03.2011 Board of BEL)Balephi Jal Vidyut Co. Ltd Nepal 15.48% 01.04.2010 to Provisional (Acknowledged by
31.03.2011 Board of BEL)Bhilwara Green Energy Limited India 25.8% 01.04.2010 to Provisional (Acknowledged by
31.03.2011 Board of BEL)

Annual Report 2010-11 83
2. Accounting PoliciesThe Accounting Policies of the Parent and of its Subsidiaries are similar and in line with the Generally Accepted Principles (‘GAAP’)in India.
As the Accounting Policies of the Parent have been mentioned in the separate financial statements of the Parent, therefore thesame has not been reproduced here.
3. Previous year figuresM/s HEG Graphite Products & Services Ltd. has become subsidiary of the Company w.e.f. 18.09.2009.
4. Goodwill / capital reserveThe excess of cost to the Company of its investment in the Subsidiaries and Joint Ventures over the Parent’s position of equity ofthe subsidiary at the date on which investment is made, is described as ‘Goodwill’ on consolidation and recognised as an asset inthe Consolidated Financial Statements.
5. Minority interestMinority Interest in the Net Assets of the subsidiaries consist of the amount of equity attributable to Minorities at the date on whichinvestment is made and Minorities’ share of movements in equity since the date when Parent Subsidiary relationship came intoexistence, to the date of Balance Sheet.
B. NOTES TO ACCOUNTS
Schedule SIGNIFICANT ACCOUNTING POLICIES AND NOTES ON ACCOUNTS ON CONSOLIDATED FINANCIAL STATEMENTS (Contd...)15
As at As atMarch 31, 2011 March 31, 2010
1 Contingent liabilitiesa) Claims against the Company not acknowledged as debts :
i) Excise duty under appeal 509.90 564.05 ii) Other matters 1,619.23 1,008.56
b) Bank Guarantees 8,895.31 4,094.70 c) The Company has provided Guarantee in favour of International Finance Corporation
(IFC) with M/s RSWM Ltd. on joint and several basis on behalf of M/s AD Hydro Power Ltd. 600.00 600.00 d) Bills discounted with bankers 1,524.83 4,833.79 e) Pending export obligation against Advance Licences & EPCG Licences 952.59 2,118.78
2 Estimated amount of contracts remaining to be executed on capital account, notprovided for (net of advances of `3503.16 Lacs (`622.79 Lacs)) 7,020.77 704.30
(` in Lacs)
3 There are no present obligations requiring provisions in accordance with the guiding principles as enunciated in AccountingStandard (AS)-29 'Provisions, Contingent Liabilities & Contingent Assets'
4 As per Accounting Standard 22 "Accounting for Taxes on Income", required disclosures are given below:
As at As atMarch 31, 2011 March 31, 2010
Deferred Tax LiabilitiesArising on Account of timing difference- Accumulated Depreciation 7,789.76 7,809.65 Deferred Tax AssetsArising on Account of timing difference- Due to section 43B of the Income Tax Act 303.79 192.70 - Others 125.26 128.18 Net Deferred Tax Liability 7,360.70 7,488.77
5 Work in process includes Refractory Blocks and other consumable stores lying at shop floor. 25.31 93.18
(` in Lacs)
6 In accordance with the provisions of Accounting Standard on impairment of Assets, (AS-28), the management has madeassessment of assets in use & considering the business prospects related thereto, no provision is considered necessary in theseaccounts on account of impairment of assets.
Schedules annexed to and forming part of the consolidated accounts

HEG Limited84
Schedules annexed to and forming part of the consolidated accounts
7 Auditors' remuneration paid / payable during the year included in miscellaneous expenses :
Schedule SIGNIFICANT ACCOUNTING POLICIES AND NOTES ON ACCOUNTS ON CONSOLIDATED FINANCIAL STATEMENTS (Contd...)15
8 a) Details of remuneration & perquisites of managerial personnel :
As at As atMarch 31, 2011 March 31, 2010
Statutory Audit Fee 19.00 18.00Other services 7.35 1.31Reimbursement of expenses 2.49 2.88
28.84 22.19
(` in Lacs)
(*) Apart from above, Keyman Insurance policy valuing `11.71 Lacs has been assigned during the year to Shri R.C. Surana(Previous year `190.16 Lacs to Shri Ravi Jhunjhunwala) in accordance with their terms of engagement.
9 The following transactions are accounted for on the basis of estimates / available data, with final adjustments being carried out inthe year of settlement.
a) Claims lodged with insurance companies.
b) Interest on income tax refunds granted on summary basis, pending finalisation of assessments is treated as income in the yearof accrual. Final adjustments are carried out in the year of completion of assessment.
10 Term loans, Bonds and Debentures falling due in next 12 months `6,536 Lacs (previous year `2,904 Lacs).
11 Capitalisation of pre-operative expenditure The following expenditure has been capitalised / included under Capital work in progress:
As at As atMarch 31, 2011 March 31, 2010
Salary (*) 274.48 103.37 Commission 375.46 664.67 Other perquisites 112.23 81.67
762.17 849.71 Provident Fund 8.94 12.40 Superannuation 11.17 3.00 Total 782.28 865.11
(` in Lacs)
As at As atMarch 31, 2011 March 31, 2010
b) Sitting fee to non executive directors 18.40 15.40
(` in Lacs)
As at As atMarch 31, 2011 March 31, 2010
a) Insurance Expenses 24.83 23.48 Financial Expenses 341.24 37.74 Administrative Overheads & Other Cost 533.92 560.64 Total 900.00 621.86
b) The same has been capitalised / is lying under Capital work in progress as under:Building 41.74 71.06 Plant & Machinery 250.64 383.28 Capital work in progress 607.62 167.53 Total 900.00 621.87
(` in Lacs)
As the liabilities for gratuity and leave encashment are provided on an actuarial valuation basis for the Company as a whole,the amount pertaining to the directors are not included above.

Annual Report 2010-11 85
12 a) In the opinion of the management and to the best of their knowledge and belief, the value on realisation of loans, advancesand other current assets in the ordinary course of business will not be less than amount at which they are stated in the balancesheet.
b) Loans and advances include :
Schedule SIGNIFICANT ACCOUNTING POLICIES AND NOTES ON ACCOUNTS ON CONSOLIDATED FINANCIAL STATEMENTS (Contd...)15
As at As atMarch 31, 2011 March 31, 2010
i) Due from officers of the Company – – ii) the maximum amount at any time during the year – –
(` in Lacs)
14 The Company had allotted 47,30,000 Preferential Warrants of `365/- each on 5th June, 2008. These Warrants were convertibleinto equity shares within 18 months from the date of allotment. Since no warrant had been converted till 4th December, 2009,the aggregate amount of `1726.45 lacs received in respect of the same has been forfeited by the Company in the previous year.The funds had been utilised for long term working capital requirement.
13 a) The Company has following foreign currency exposures outstanding as on balance sheet date:
As at As at As at As atMarch 31, 2011 March 31, 2010 March 31, 2011 March 31, 2010
Amount Amount Amount Amount(FC Million) (FC Million) (` in Lacs) (` in Lacs)
a) Secured LoanUSD 117.39 61.10 52,343.44 27,829.33 Euro 17.48 24.94 11,043.45 15,127.85 GBP 0.11 0.00 81.61 –
b) Unsecured LoanUSD 23.80 1.05 10,614.38 471.66
c) Debtors (Net of Advances)USD 16.54 71.30 7,375.19 35,158.83 Euro 12.86 35.59 9,194.90 21,586.89 GBP 0.11 0.00 81.61 – AED (3.86) 0.00 (468.02) –
d) Creditors (Net of Advances)USD (0.14) 0.52 (61.81) 224.96 Euro (2.52) 0.00 (1593.83) – GBP (0.00) 0.00 (0.13) – Total USD 157.84 133.98 70,271.19 63,684.78 Total EURO 27.82 60.53 18,644.52 36,714.74 Total GBP 2.28 0.00 163.09 – Total AED (3.86) 0.00 (468.02) –
Sl. No. Particulars Purpose Amount Amount
(i) Plain Vanilla Forwards Hedging $ 26.5 mn. $ 19.0 mn.(ii) Cross Currency Forwards Hedging 10.0 mn. 4.5 mn.
b) The foreign currency exposures that are not hedged by derivative instruments or otherwise are as under
Schedules annexed to and forming part of the consolidated accounts

HEG Limited86
Schedules annexed to and forming part of the consolidated accounts
15 Related party disclosure as required by Accounting Standard (AS-18) issued by the Institute of Chartered Accountants of
India :
A List of Related Parties & Relationships
As at As at
March 31, 2011 March 31, 2010
a) Enterprises that directly or indirectly through one or more
intermediaries, control or are controlled by or are under common
control with the reporting enterprise (this includes holding
companies, subsidiaries and fellow subsidiaries).
i) HEG Graphite Products & Services Ltd. Subsidiary Subsidiary
b) Associates and joint ventures
i) Bhilwara Energy Limited Associate Associate
ii) Bhilwara Infotech Ltd Associate Associate
c) Individuals owning directly or indirectly, an interest in the voting Shri L.N. Jhunjhunwala Shri L.N. Jhunjhunwala
power of the reporting enterprise that gives them control or Shri Ravi Jhunjhunwala Shri Ravi Jhunjhunwala
significant influence over the enterprise, and relatives of any Shri Riju Jhunjhunwala Shri Riju Jhunjhunwala
such individual.
d) Key Management Personnel and their relatives Shri Ravi Jhunjhunwala Shri Ravi Jhunjhunwala
Shri Riju Jhunjhunwala Shri Riju Jhunjhunwala
Shri R.C. Surana
e) Enterprises over which any person described in (c) or (d) is able
to exercise significant influence.
i) RSWM Ltd.
ii) Malana Power Company Limited
iii) A D Hydropower Limited
iv) Delhi Knits Pvt Ltd
v) Bhilwara Scribe Pvt. Ltd.
vi) Ganga Yamuna Auto Pvt Ltd
vii) Deepak Knits & Texturise Pvt. Ltd.
viii) Maral Overseas Ltd.
ix) LNJ Financial Services Ltd
x) Investors India Ltd
xi) Indo Canadian Consultancy Services Limited
xii) Bhilwara Technical Textiles Ltd.
xiii) BMD Pvt Ltd
xiv) Bhilwara Services Pvt Ltd.
xv) LNJ Bhilwara Textile Anusandhan Vikas Kendra
xvi) Niviedan Vanijya Niyojan Ltd
xvii) NJC Power Ltd
xviii) Balephi Jalbidhyut Company Ltd, Nepal
xix) Green Ventures Pvt Ltd, Nepal
xx) Bhilwara Green Energy Ltd
xxi) Agarwal Finestate Pvt Ltd
Schedule SIGNIFICANT ACCOUNTING POLICIES AND NOTES ON ACCOUNTS ON CONSOLIDATED FINANCIAL STATEMENTS (Contd...)15

Annual Report 2010-11 87
B The following transactions were carried out / outstanding with related parties in the ordinary course of business
16 One case of loss of material, by theft, was detected during the previous year involving an amount of `360.85 lacs which has beenshown as "Loss of material by theft" and is included in Schedule 12 : Consumption of materials in the Profit & Loss account in theprevious year
17 AS - 15 'EMPLOYEE BENEFITS'The Company has adopted Revised Accounting Standard - 15 'Employee Benefits' and the required disclosures are given hereunder:
Defined Contribution PlanContribution to Defined Contribution Plan, recognised as expense for the year are as under :
Schedule SIGNIFICANT ACCOUNTING POLICIES AND NOTES ON ACCOUNTS ON CONSOLIDATED FINANCIAL STATEMENTS (Contd...)15
As at As atMarch 31, 2011 March 31, 2010
1 With parties referred to in (a) above.i) Investment in Equity of HEG Graphite Products & Services Limited 5.00 5.00
2 With parties referred to in (b) above.i) Investment in Cumulative Redeemable Preference shares of Bhilwara Energy Ltd 4,000.00 4,000.00 ii) Investment in Equity of Bhilwara Energy Limited 2,612.70 2,612.70 iii) Investment in Equity of Bhilwara Infotech Limited 419.00 419.00 iv) Share Application money refund from Bhilwara Infotech Limited – 62.08 v) Redemption premium accrued on Preference Shares 849.43 373.70
3 With parties referred to in (c) above.i) Sitting fees paid to Sh. L N Jhunjhunwala – – ii) Salaries, Perquisites and Commission paid during the year to Sh. Ravi Jhunjhunwala(*) 481.81 597.62 iii) Salaries, Perquisites and Commission paid during the year to Sh. Riju Jhunjhunwala 34.82 121.46
4 With parties referred to in (d) above.i) Salaries, Perquisites and Commission paid during the year to Sh. Ravi Jhunjhunwala (*) 481.81 597.62 ii) Salaries, Perquisites and Commission paid during the year to Sh. Riju Jhunjhunwala 34.82 121.46 iii) Salaries, Perquisites and Commission paid during the year to Sh. R.C. Surana 265.65 146.03
(*) Apart from above, Keyman Insurance policy valuing `11.71 Lacs has been assigned during the year to Shri R.C.Surana (Previous year `190.16 Lacs to Shri Ravi Jhunjhunwala) in accordance with their terms of engagement.
5 With parties referred to in (e) above.a) Purchase of consumables 11.57 4.64 b) Rent Received 32.54 32.82 c) Rent Paid 115.14 115.14 d) Consultancy charges paid 13.84 2.10 e) Purchase of Machinery – – f) Guarantee given to IFC for AD Hydro Power Limited 600.00 600.00
(` in Lacs)
(` in Lacs)FY 2010-11 FY 2009-10
Employer's contribution to Provident Fund 175.96 168.31 Employer's contribution to Superannuation Fund 107.95 106.58 Employer's contribution to ESI 39.17 15.89
Schedules annexed to and forming part of the consolidated accounts

HEG Limited88
Schedules annexed to and forming part of the consolidated accounts
Defined Benefit PlanThe employees' gratuity fund scheme managed by a trust is a defined benefit plan. The present value of obligation is determinedbased on actuarial valuation using the Projected Unit Credit Method, which recognises each period of service as giving rise toadditional unit of employee benefit entitlement and measures each unit separately to build up the final obligation. The obligationfor leave encashment is recognised in the same manner as gratuity. The Company has maintained a fund with Life InsuranceCorporation of India.
1 Reconciliation of opening and closing balances of Defined Benefit Obligation.
2 Reconciliation of opening and closing balances of Fair Value of Plan Assets
3 Reconciliation of amount recognised in Balance Sheet
Schedule SIGNIFICANT ACCOUNTING POLICIES AND NOTES ON ACCOUNTS ON CONSOLIDATED FINANCIAL STATEMENTS (Contd...)15
Gratuity Gratuity Leave Leave(Funded) (Funded) encashment encashment
FY 2010-11 FY 2009-10 (unfunded) (Unfunded)FY 2010-11 FY 2009-10
Defined Benefit obligation at the beginning of the year 997.95 886.71 275.05 237.28Current Service Cost 52.00 48.95 30.20 25.51Interest Cost 79.84 62.07 22.00 16.61Actuarial (gain)/loss 4.79 52.62 32.68 15.13Past Service Cost 33.26 –Benefits Paid (103.42) (127.99) (30.76) (19.47)Settlement cost – – – –Defined Benefit obligation at the end of the year 1,031.15 955.62 329.17 275.06
(` in Lacs)
Gratuity Gratuity Leave Leave(Funded) (Funded) encashment encashment
FY 2010-11 FY 2009-10 (unfunded) (Unfunded)FY 2010-11 FY 2009-10
Fair Value of Plan Assets as at 31st March, 2011 960.22 900.09 – – Present value of obligation as at 31st March, 2011 1,031.15 955.61 329.17 275.05 Net asset/(liability) recognised in the Balance Sheet (70.93) (55.52) (329.17) (275.05)
(` in Lacs)
Gratuity Gratuity(Funded) (Funded)
FY 2010-11 FY 2009-10
Fair value of plan assets as at the beginning of the year 906.29 834.08 Expected Return 90.63 83.41 Actuarial (gain)/loss 31.05 59.50 Contribution by Employer 97.78 51.09 Benefits Paid (103.42) (127.99)Settlement cost – – Fair value of plan assets as at the end of the year 960.22 900.09 Actual return on plan assets 59.58 123.86
(` in Lacs)
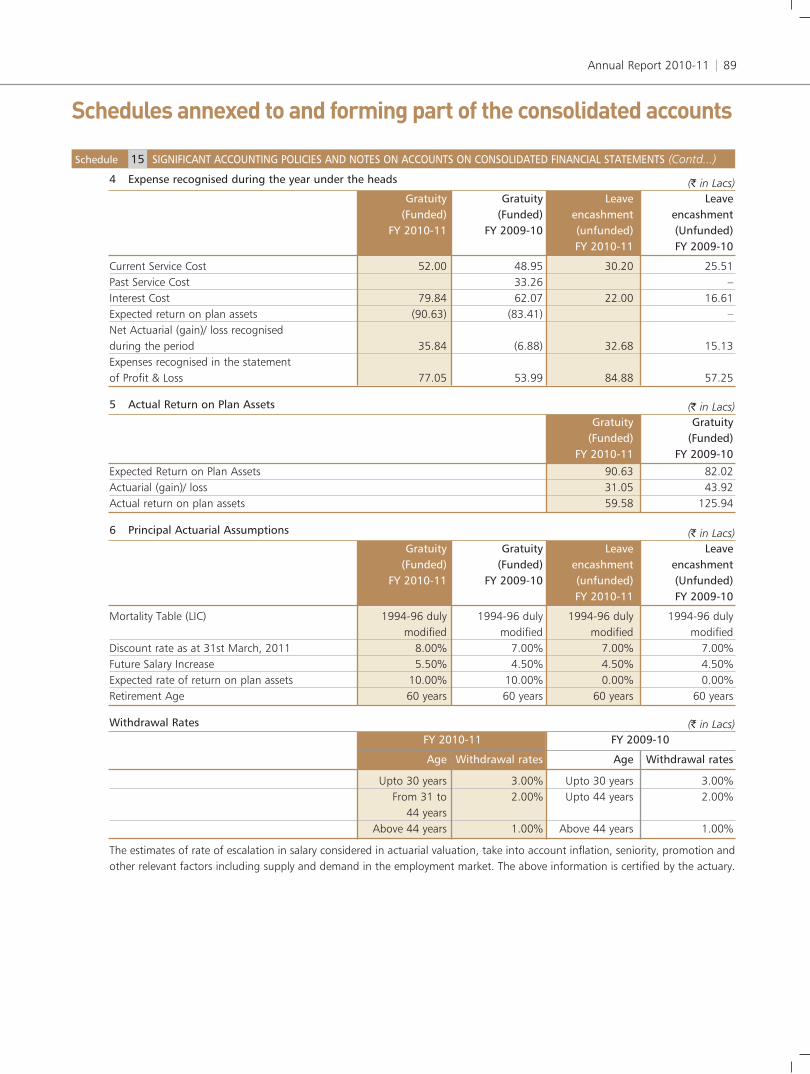
Annual Report 2010-11 89
4 Expense recognised during the year under the heads
Schedule SIGNIFICANT ACCOUNTING POLICIES AND NOTES ON ACCOUNTS ON CONSOLIDATED FINANCIAL STATEMENTS (Contd...)15
6 Principal Actuarial Assumptions
Withdrawal Rates
The estimates of rate of escalation in salary considered in actuarial valuation, take into account inflation, seniority, promotion andother relevant factors including supply and demand in the employment market. The above information is certified by the actuary.
Gratuity Gratuity Leave Leave(Funded) (Funded) encashment encashment
FY 2010-11 FY 2009-10 (unfunded) (Unfunded)FY 2010-11 FY 2009-10
Mortality Table (LIC) 1994-96 duly 1994-96 duly 1994-96 duly 1994-96 dulymodified modified modified modified
Discount rate as at 31st March, 2011 8.00% 7.00% 7.00% 7.00%Future Salary Increase 5.50% 4.50% 4.50% 4.50%Expected rate of return on plan assets 10.00% 10.00% 0.00% 0.00%Retirement Age 60 years 60 years 60 years 60 years
(` in Lacs)
FY 2010-11 FY 2009-10
Age Withdrawal rates Age Withdrawal rates
Upto 30 years 3.00% Upto 30 years 3.00%From 31 to 2.00% Upto 44 years 2.00%
44 years Above 44 years 1.00% Above 44 years 1.00%
(` in Lacs)
Gratuity Gratuity Leave Leave(Funded) (Funded) encashment encashment
FY 2010-11 FY 2009-10 (unfunded) (Unfunded)FY 2010-11 FY 2009-10
Current Service Cost 52.00 48.95 30.20 25.51 Past Service Cost 33.26 – Interest Cost 79.84 62.07 22.00 16.61 Expected return on plan assets (90.63) (83.41) – Net Actuarial (gain)/ loss recognised during the period 35.84 (6.88) 32.68 15.13 Expenses recognised in the statement of Profit & Loss 77.05 53.99 84.88 57.25
(` in Lacs)
5 Actual Return on Plan Assets
Gratuity Gratuity(Funded) (Funded)
FY 2010-11 FY 2009-10
Expected Return on Plan Assets 90.63 82.02 Actuarial (gain)/ loss 31.05 43.92 Actual return on plan assets 59.58 125.94
(` in Lacs)
Schedules annexed to and forming part of the consolidated accounts

HEG Limited90
Schedules annexed to and forming part of the consolidated accounts
Amounts for the current and previous three periods in respect of leave encashment are as follows
Amounts for the current and previous three periods in respect gratuity are as follows
Provident FundThe Guidance note issued by Accounting Standard Board (ASB) on implementation AS-15. Employee Benefit (Revised 2005) statesthat provident funds set up by the employers, which require interest shortfall to be met by the employer, needs to be treated asdefined benefit plan.
The funds does not have any existing deficit or interest shortfall. In regard to any future obligation arising due to interest shortfall(ie government interest to be paid on provident fund scheme exceeds rate of interest earned on investment), pending the issuanceof Guidance note from the actuarial Society of India, the Company’s actuary has expressed his inability to reliably measure thesame.
Schedule SIGNIFICANT ACCOUNTING POLICIES AND NOTES ON ACCOUNTS ON CONSOLIDATED FINANCIAL STATEMENTS (Contd...)15
Leave encashment
Particulars 2010-11 2009-10 2008-09 2007-08
PBO (C) 329.17 275.05 237.28 239.08 Plan assets – – – – Net Assets/ (Liability) (329.17) (275.05) (237.28) (239.08)Experience adjustment on plan assetsExperience adjustment on plan liabilities (35.29) (15.13) – –
(` in Lacs)
Gratuity
Particulars 2010-11 2009-10 2008-09 2007-08
PBO (C) 1,031.15 997.95 886.71 902.81 Plan assets 960.22 900.09 834.08 893.10 Net Assets/ (Liability) (70.93) (55.52) (52.64) 9.71 Experience adjustment on plan assets (12.59) (46.30) 27.62 Experience adjustment on plan liabilities (31.05) 92.86 (78.56)
(` in Lacs)
18 a) Earnings Per Share as required by Accounting Standard (AS-20) :The basic and diluted Earning Per Share is as under :
b) Provision for Income Tax for Earlier years has been made based on Income Tax Assessment cases pending at AppellateJurisdictions on which Income Tax Demand has arisen and the cases are sub-judice.
(` in Lacs)FY 2010-11 FY 2009-10
Net Profit After Tax 12,886.03 17,106.05 Weighted average no. of Equity Shares outstanding(*) 42,837,805 43,252,479 Basic Earning Per Share (`) Weighted equity Shares 42,837,805 (previous year 41,621,334) 28.33 44.77 Diluted Earning Per Share (`) Potential equity Shares 42,837,805(previous year 42,281,957) 28.33 44.25
(*) Weighted average no. of Equity Shares have been calculated on the basis of number of days these shares were outstandingduring the period.

Annual Report 2010-11 91
c) Segment Reporting
Schedule SIGNIFICANT ACCOUNTING POLICIES AND NOTES ON ACCOUNTS ON CONSOLIDATED FINANCIAL STATEMENTS (Contd...)15
Graphite Power Unallocable Totalitems / others
A Business Segments
Segments Revenue
External Sales / other income 111,010.45 19,683.11 803.54 131,497.10
(Net of Excise Duty) (106,970.56) (18,386.66) (870.91) (126,228.12)
Inter Segment Transfers 16,289.55 16,289.55
(11,589.13) (11,589.13)
Total Revenue 111,010.45 35,972.66 803.54 147,786.66
(106,970.56) (29,975.78) (871.91) (137,817.25)
Segment Result
Segment Results 15,515.82 4,654.94 298.98 20,469.74
(25,241.13) (4,185.80) (731.27) (30,159.00)
Less: Financial Expenses 3,662.29
(5,925.82)
Profit Before Tax 16,807.26
(24,231.88)
Less: Income Tax (incl Deferred) 3,921.22
(7,125.83)
Net Profit For the year 12,886.03
(17,106.05)
Other Information
Unallocated Assets (91.13) (91.13)
(8,318.93) (8,318.93)
Segment Assets 158,209.41 24,395.57 182,604.99
(136,345.65) (24,870.09) (161,215.74)
Total Assets 158,209.41 24,395.57 (91.13) 182,513.86
(136,345.65) (24,870.09) (8,318.93) (169,534.67)
Segment Liabilities 101,897.30 329.42 102,226.71
(81,654.24) (488.26) (82,142.50)
Unallocated Liabilities 1,043.35 1,043.35
(1,802.81) (1,802.81)
Total Liabilities 101,897.30 329.42 1,043.35 103,270.06
(81,654.24) (488.26) (1,802.81) (83,945.31)
Capital Employed 77,979.93 22,581.66 11,100.26 111,661.85
(63,353.00) (21,795.67) (6,313.15) (91,462.82)
Capital Exp.incurred during the year 7,030.58 1,072.15 55.32 8,158.06
(5,429.00) (1,699.83) (45.79) (7,174.62)
Depreciation 4,226.83 1,446.00 57.69 5,730.52
(3,685.26) (1,378.52) (73.27) (5,137.05)
Other Non Cash Expenses – – 34.77 34.77
– – (104.30) (104.30)
(` in Lacs)
Schedules annexed to and forming part of the consolidated accounts

HEG Limited92
Schedules annexed to and forming part of the consolidated accounts
Previous Year's figures have been regrouped and recast wherever considered necessary.
Figures in amount have been rounded off to nearest lacs upto two decimals. Figures in bracket relate to the previous year.
The Schedules referred to in the Balance Sheet and Profit and Loss Account form an integral part of the accounts.
Schedule SIGNIFICANT ACCOUNTING POLICIES AND NOTES ON ACCOUNTS ON CONSOLIDATED FINANCIAL STATEMENTS (Contd...)15
Graphite Power Unallocable Totalitems / others
B Geographical SegmentSegment RevenueBased on Location of CustomersDomestic 25,579.15 18,310.08 1,373.03 45,262.26
(26,243.36) (18,386.66) (870.91) (45,500.92)Export 85,431.30 – 85,431.30
(80,727.20) – (80,727.20)Segment AssetsBased on Location of assetsIn India 151,178.83 23,323.42 (146.45) 174,355.80
(130,916.65) (23,170.25) (8,273.15) (162,360.05)Cost to acquire assets by location 7,030.58 1,072.15 55.32 8,158.06
(5,429.00) (1,699.83) (45.79) (7,174.62)
(` in Lacs)
Signed in terms of our report of even date
For Doogar & Associates For S.S. Kothari Mehta & Co. Ravi JhunjhunwalaChartered Accountants Chartered Accountants Chairman & Managing DirectorFirm Regn. No. 000561N Firm Regn. No. 000756N Shekhar Agarwal
Vice ChairmanMukesh Goyal Arun K. Tulsian D.N. DavarPartner Partner DirectorMembership No. 081810 Membership No. 089907 Riju Jhunjhunwala
DirectorManvinder Singh AjmaniChief Financial Officer
Place : Noida (U.P.) Ashish SabharwalDated : 29th April, 2011 Company Secretary
d) Information pertaining to Subsidiary Companies u/s 212 (8) of the Companies Act, 1956
Note: The annual accounts of the subsidiary company and the related detailed information shall be made available to the
shareholders of the Company and the subsidiary company seeking such information at any point of time. The annual accounts of
the subsidiary company shall also be kept for inspection by any shareholder at the head office of the Company and of the subsidiary
company. The Company shall furnish a hard copy of details of accounts of subsidiary company to any shareholder on demand.
Sl No. Particulars HEG Graphite Products and Services Ltd.Financial year ending on 31-03-2011
1 Share Capital 5.002 Reserve & surplus / (Accumulated Losses) (0.68)3 Total Assets 5.004 Total Liabilities 5.005 Details of Investments (except in case of investment in the subsidiaries) –6 Total Turnover –7 Profit / (Loss) before taxation (0.68)8 Taxation –9 Profit / (Loss) after taxation (0.68)10 Proposed Dividend –
(` in lacs)
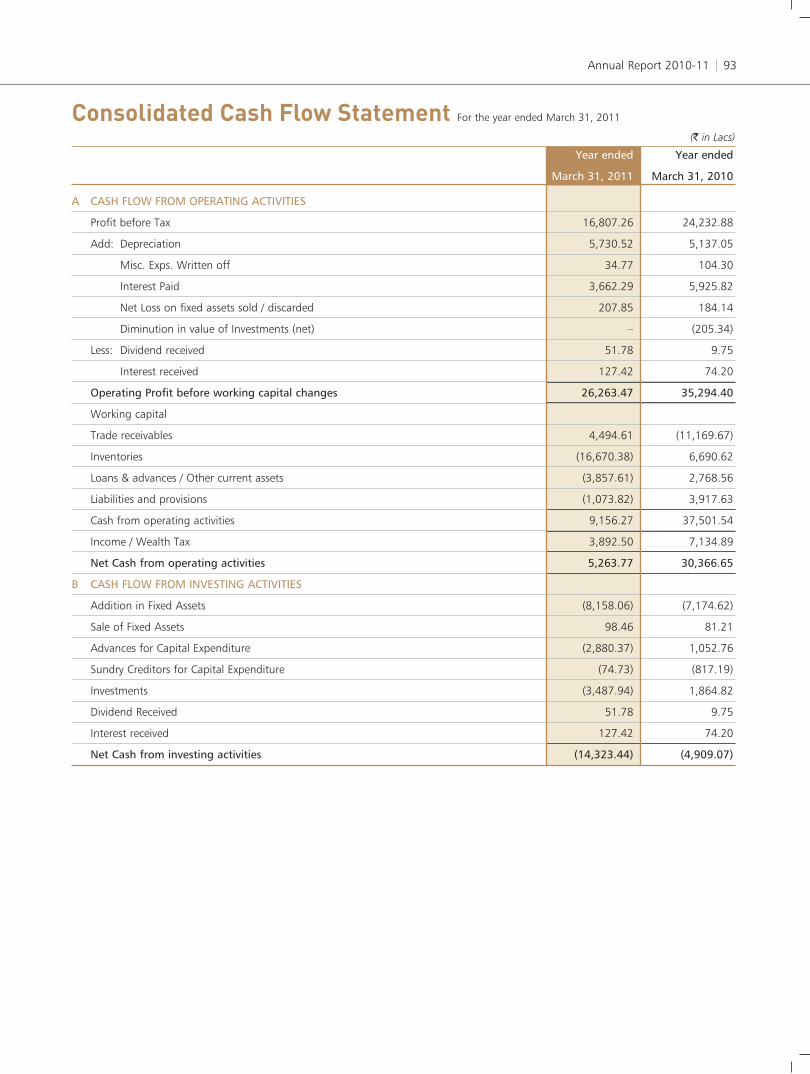
Annual Report 2010-11 93
Consolidated Cash Flow Statement For the year ended March 31, 2011
Year ended Year ended
March 31, 2011 March 31, 2010
A CASH FLOW FROM OPERATING ACTIVITIES
Profit before Tax 16,807.26 24,232.88
Add: Depreciation 5,730.52 5,137.05
Misc. Exps. Written off 34.77 104.30
Interest Paid 3,662.29 5,925.82
Net Loss on fixed assets sold / discarded 207.85 184.14
Diminution in value of Investments (net) – (205.34)
Less: Dividend received 51.78 9.75
Interest received 127.42 74.20
Operating Profit before working capital changes 26,263.47 35,294.40
Working capital
Trade receivables 4,494.61 (11,169.67)
Inventories (16,670.38) 6,690.62
Loans & advances / Other current assets (3,857.61) 2,768.56
Liabilities and provisions (1,073.82) 3,917.63
Cash from operating activities 9,156.27 37,501.54
Income / Wealth Tax 3,892.50 7,134.89
Net Cash from operating activities 5,263.77 30,366.65
B CASH FLOW FROM INVESTING ACTIVITIES
Addition in Fixed Assets (8,158.06) (7,174.62)
Sale of Fixed Assets 98.46 81.21
Advances for Capital Expenditure (2,880.37) 1,052.76
Sundry Creditors for Capital Expenditure (74.73) (817.19)
Investments (3,487.94) 1,864.82
Dividend Received 51.78 9.75
Interest received 127.42 74.20
Net Cash from investing activities (14,323.44) (4,909.07)
(` in Lacs)

HEG Limited94
Signed in terms of our report of even date
For Doogar & Associates For S.S. Kothari Mehta & Co. Ravi Jhunjhunwala
Chartered Accountants Chartered Accountants Chairman & Managing Director
Firm Regn. No. 000561N Firm Regn. No. 000756N Shekhar Agarwal
Vice Chairman
Mukesh Goyal Arun K. Tulsian D.N. Davar
Partner Partner Director
Membership No. 081810 Membership No. 089907 Riju Jhunjhunwala
Director
Manvinder Singh Ajmani
Chief Financial Officer
Place : Noida (U.P.) Ashish Sabharwal
Dated : 29th April, 2011 Company Secretary
Year ended Year ended
March 31, 2011 March 31, 2010
C CASH FROM FINANCING ACTIVITIES
Long term borrowings - Term Loans / NCD's / Bonds 8,918.00 1,963.76
Repayment of Term loans (2,419.49) (9,775.00)
Short term borrowings (working capital) 11,924.89 (4,095.62)
Conversion of Foreign Currency Convertible Bond's 471.16 3,212.70
Less: Transfer to Share Capital Account (23.77) (158.49)
Less: Transfer to Share Premium Account (447.39) (3,054.21)
Buy Back of Shares – (2,797.54)
Interest Paid (3,662.28) (5,925.82)
Dividend paid (4,284.50) (4,283.36)
Corporate Dividend Tax (688.10) (727.96)
Net Cash from financing activities 9,788.52 (25,641.54)
Increase in Cash or cash equivalents 728.86 (184.32)
Opening cash or cash equivalents 453.98 638.30
Closing cash or cash equivalents 1,182.84 453.98
(` in Lacs)
Consolidated Cash Flow Statement (Contd...)

NOTES

NOTES