Embed Size (px)
Citation preview
1
Hedonic Pricing of Chocolate Quality Characteristics: Is there A Difference for Fruit or Nut Chocolate?
Willie B. Bedell and Michael R. Reed1 University of Kentucky
October 2017
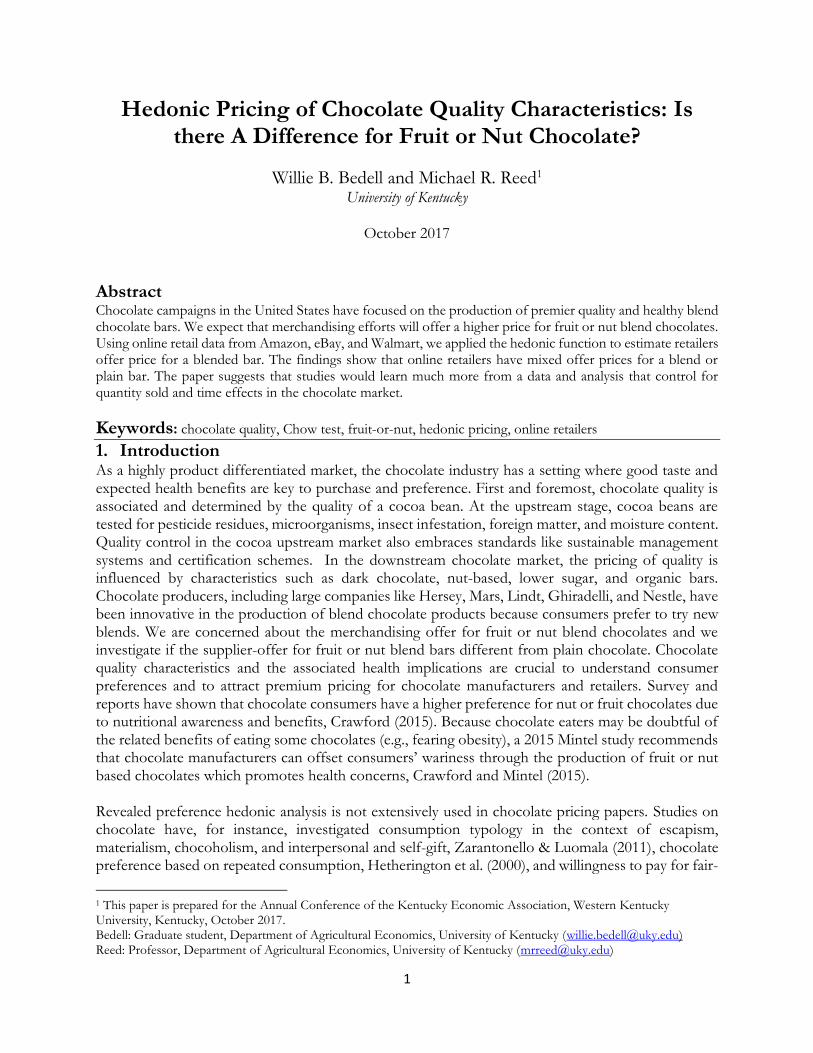
Abstract Chocolate campaigns in the United States have focused on the production of premier quality and healthy blend chocolate bars. We expect that merchandising efforts will offer a higher price for fruit or nut blend chocolates. Using online retail data from Amazon, eBay, and Walmart, we applied the hedonic function to estimate retailers offer price for a blended bar. The findings show that online retailers have mixed offer prices for a blend or plain bar. The paper suggests that studies would learn much more from a data and analysis that control for quantity sold and time effects in the chocolate market.
Keywords: chocolate quality, Chow test, fruit-or-nut, hedonic pricing, online retailers
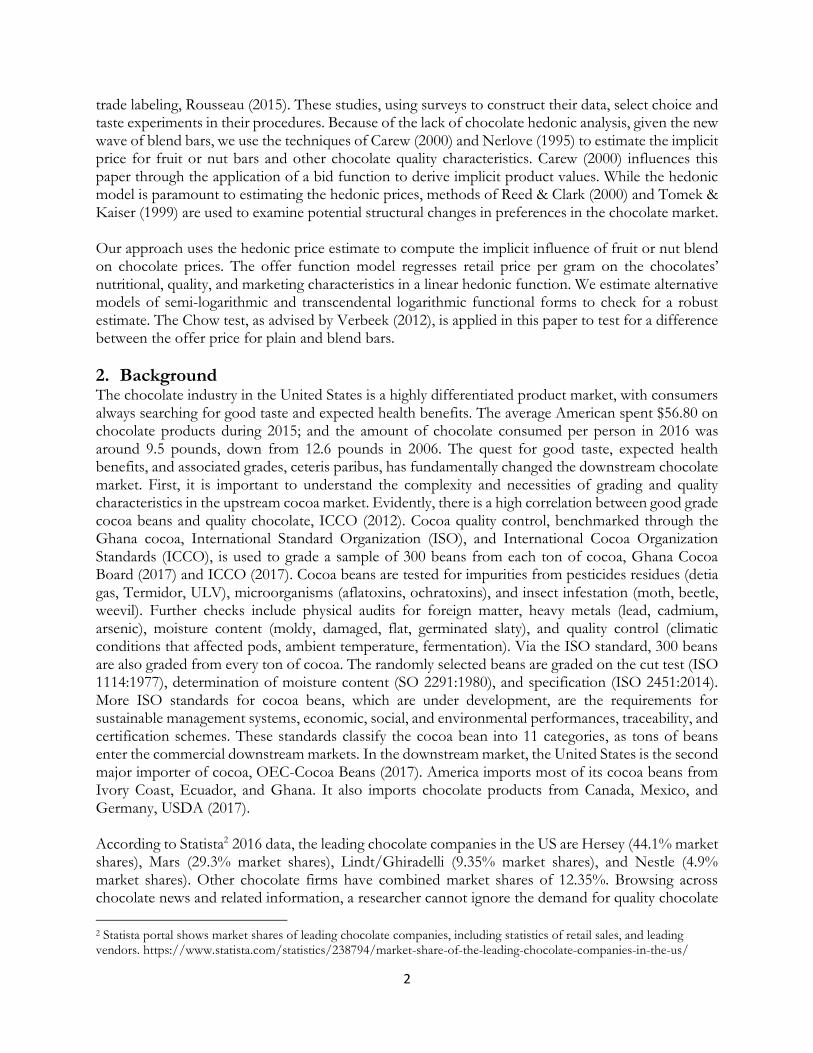
1. Introduction As a highly product differentiated market, the chocolate industry has a setting where good taste and expected health benefits are key to purchase and preference. First and foremost, chocolate quality is associated and determined by the quality of a cocoa bean. At the upstream stage, cocoa beans are tested for pesticide residues, microorganisms, insect infestation, foreign matter, and moisture content. Quality control in the cocoa upstream market also embraces standards like sustainable management systems and certification schemes. In the downstream chocolate market, the pricing of quality is influenced by characteristics such as dark chocolate, nut-based, lower sugar, and organic bars. Chocolate producers, including large companies like Hersey, Mars, Lindt, Ghiradelli, and Nestle, have been innovative in the production of blend chocolate products because consumers prefer to try new blends. We are concerned about the merchandising offer for fruit or nut blend chocolates and we investigate if the supplier-offer for fruit or nut blend bars different from plain chocolate. Chocolate quality characteristics and the associated health implications are crucial to understand consumer preferences and to attract premium pricing for chocolate manufacturers and retailers. Survey and reports have shown that chocolate consumers have a higher preference for nut or fruit chocolates due to nutritional awareness and benefits, Crawford (2015). Because chocolate eaters may be doubtful of the related benefits of eating some chocolates (e.g., fearing obesity), a 2015 Mintel study recommends that chocolate manufacturers can offset consumers’ wariness through the production of fruit or nut based chocolates which promotes health concerns, Crawford and Mintel (2015). Revealed preference hedonic analysis is not extensively used in chocolate pricing papers. Studies on chocolate have, for instance, investigated consumption typology in the context of escapism, materialism, chocoholism, and interpersonal and self-gift, Zarantonello & Luomala (2011), chocolate preference based on repeated consumption, Hetherington et al. (2000), and willingness to pay for fair-
1 This paper is prepared for the Annual Conference of the Kentucky Economic Association, Western Kentucky University, Kentucky, October 2017. Bedell: Graduate student, Department of Agricultural Economics, University of Kentucky ([email protected]) Reed: Professor, Department of Agricultural Economics, University of Kentucky ([email protected])
2
trade labeling, Rousseau (2015). These studies, using surveys to construct their data, select choice and taste experiments in their procedures. Because of the lack of chocolate hedonic analysis, given the new wave of blend bars, we use the techniques of Carew (2000) and Nerlove (1995) to estimate the implicit price for fruit or nut bars and other chocolate quality characteristics. Carew (2000) influences this paper through the application of a bid function to derive implicit product values. While the hedonic model is paramount to estimating the hedonic prices, methods of Reed & Clark (2000) and Tomek & Kaiser (1999) are used to examine potential structural changes in preferences in the chocolate market.
Our approach uses the hedonic price estimate to compute the implicit influence of fruit or nut blend on chocolate prices. The offer function model regresses retail price per gram on the chocolates’ nutritional, quality, and marketing characteristics in a linear hedonic function. We estimate alternative models of semi-logarithmic and transcendental logarithmic functional forms to check for a robust estimate. The Chow test, as advised by Verbeek (2012), is applied in this paper to test for a difference between the offer price for plain and blend bars.
2. Background The chocolate industry in the United States is a highly differentiated product market, with consumers always searching for good taste and expected health benefits. The average American spent $56.80 on chocolate products during 2015; and the amount of chocolate consumed per person in 2016 was around 9.5 pounds, down from 12.6 pounds in 2006. The quest for good taste, expected health benefits, and associated grades, ceteris paribus, has fundamentally changed the downstream chocolate market. First, it is important to understand the complexity and necessities of grading and quality characteristics in the upstream cocoa market. Evidently, there is a high correlation between good grade cocoa beans and quality chocolate, ICCO (2012). Cocoa quality control, benchmarked through the Ghana cocoa, International Standard Organization (ISO), and International Cocoa Organization Standards (ICCO), is used to grade a sample of 300 beans from each ton of cocoa, Ghana Cocoa Board (2017) and ICCO (2017). Cocoa beans are tested for impurities from pesticides residues (detia gas, Termidor, ULV), microorganisms (aflatoxins, ochratoxins), and insect infestation (moth, beetle, weevil). Further checks include physical audits for foreign matter, heavy metals (lead, cadmium, arsenic), moisture content (moldy, damaged, flat, germinated slaty), and quality control (climatic conditions that affected pods, ambient temperature, fermentation). Via the ISO standard, 300 beans are also graded from every ton of cocoa. The randomly selected beans are graded on the cut test (ISO 1114:1977), determination of moisture content (SO 2291:1980), and specification (ISO 2451:2014). More ISO standards for cocoa beans, which are under development, are the requirements for sustainable management systems, economic, social, and environmental performances, traceability, and certification schemes. These standards classify the cocoa bean into 11 categories, as tons of beans enter the commercial downstream markets. In the downstream market, the United States is the second major importer of cocoa, OEC-Cocoa Beans (2017). America imports most of its cocoa beans from Ivory Coast, Ecuador, and Ghana. It also imports chocolate products from Canada, Mexico, and Germany, USDA (2017). According to Statista2 2016 data, the leading chocolate companies in the US are Hersey (44.1% market shares), Mars (29.3% market shares), Lindt/Ghiradelli (9.35% market shares), and Nestle (4.9% market shares). Other chocolate firms have combined market shares of 12.35%. Browsing across chocolate news and related information, a researcher cannot ignore the demand for quality chocolate
2 Statista portal shows market shares of leading chocolate companies, including statistics of retail sales, and leading vendors. https://www.statista.com/statistics/238794/market-share-of-the-leading-chocolate-companies-in-the-us/
3
with great ingredients. Quality characteristics and grades in the chocolate market are classified as dark chocolate, nut-based, lower sugar, milk, sweet, semi-sweet; white, and pre-melted chocolate. The preference for these characteristics may also be different between male and female. Chocolate quality specifications might include country of chocolate production, the origin of cocoa beans, and certification and credence information such as organic certification, Non-GMO statement, and ethical trade statement. Chocolate manufacturers find that despite the call for quality chocolate, the chocolate demand for is inelastic to price. "What we find is whether times are good or times are bad, consumers still want to treat themselves," said Tracey Massey, president of Mars Chocolate North America, Daniels (2016). Massey’s focal point is that innovation in chocolate products is critical for this industry because consumers like to try new blends. He noted that consumers always go back to their old favorites. The statements from Massey seem conflicting, but it creates a revealing idea which is linked to the research question in this study. In terms of pricing and sales, Nielsen reported that mainstream chocolate still represents most industry sales (88%), followed by the premium category. Seasonal chocolate is a big seller during holidays. Yet, seasonal chocolate has a lower-margin due to promotional activities.3 The innovative campaigns, which are presumably caused by changes in consumer preferences to try new blends of chocolates and merchandising efforts to meet consumer demand, lead us to our fundamental research questions: What does retailer offer to sell fruit or nut blend bars to chocolate consumers; is the supplier-offer for fruit or nut blend bars different from plain chocolate? Given the research questions, we generate the hypothesis that retailers offer a premium price for fruit and nut blended chocolate bars. Our expectation of the null hypothesis is sourced by an a priori observation: When quality and healthy chocolates are advertised or promoted, it is highly associated with fruit or nut blend chocolates. Therefore, the objectives of this study aimed to compare chocolate market qualities, to show the factors that affect the growth potential of the chocolate market, and to assess if it is necessary for chocolate firms to adapt to change in this differentiated product market. This study is relevant to motivate decisions on quality pricing, health implications, and strategic marketing. The blending of nuts or dried fruits with chocolate products and the accompanying information on health benefits have become noticeable in the chocolate market. Illustratively, a survey conducted by the Almond Board of California in 2015, which targeted 5,400 global chocolate eaters, finds that 70% of chocolate consumers have a higher preference for nuts or dried fruits chocolate blend because of the nutritional awareness and health benefits, Crawford (2015). The Almond Board Found 85% of the respondents strongly agreed or somewhat agreed on the nut or fruit nutritional perception and 77% agreed that blending with fruit or nut makes the chocolate sweet, energizing, and satisfying. In the same light by choosing nut or fruit blend, a Mintel research discloses that 15% of chocolate consumers are doubtful of the related benefits of eating some chocolates (e.g., fearing obesity). Anyways, Mintel assumed that the reduction among chocolate eaters can be offset through the production of fruit or nut based chocolates which promotes health concerns, Crawford and Mintel
(2015).4 Research shows that the health implications of eating chocolate are based on findings that chocolate improves insulin resistance, flow-mediated dilatation, and reduce diastolic blood and mean
3 Nielsen study consumers worldwide in more than 100 countries to analyze consumers trends and habits. Chocolates are reported by Nielsen as US biggest confectionary treats. http://www.nielsen.com/us/en/insights/news/2016/americas-sweetest-treat-is-delivering-candy-crushing-growth.html 4 Elizabeth Crawford writes an article addressing factors that are driving consumer demands for chocolate, emphasizing on nuts and dried fruit. Crawford benchmarks the survey conducted by the Almond Board of California and a Mintel research. http://www.foodnavigator-usa.com/Markets/Driving-consumer-demands-for-chocolate-includes-nuts-dried-fruit.
4
arterial pressure. Hooper et al. (2012) find that chocolate reduces low-density lipoprotein (LDL) cholesterol and increases high-density lipoprotein (HDL) cholesterol. LDL is regarded as bad cholesterol and HDL is the good cholesterol. Serafini et al. (2003) results suggest that dark chocolate may promote cardiovascular health through the increase of antioxidant capacity. Whereas, milk chocolate may affect the antioxidant capacity negatively. Nevertheless, chocolate consumers are cautious about chocolate products. Chocolate bars may carry unappreciated ingredients such as high fructose corn syrup (GMO sweeteners), butter, artificial colors, and a cheaper polyglycerol polyricinoleate (PGPR). According to Fox-Health News, North America rebounded from a 15% downturn in the chocolate market over 5 years, 2008 to 2012. In 2012, the sales of reduced-fat chocolates increased by 6%. This jump was attributed to the processing of healthy bars by chocolate manufacturers.5
3. Literature Review This paper contributes to the literature by applying hedonic analysis to estimate the preference for blend chocolate bars and to check for the difference between plain and blend bars. Studies on chocolate have, for instance, investigated consumption typology in the context of escapism, materialism, chocoholism, and interpersonal and self-gift, Zarantonello & Luomala (2011); pricing chocolate in the online retail market, Fedoseeva & Herrmann (2017); chocolate preference based on repeated consumption, Hetherington et al. (2000); and willingness to pay for fair-trade labelling in chocolate characteristics, Rousseau (2015) and Vlaeminck & Vranken (2015). These studies favored the stated preference method for their data construction. Hence, collecting information from consumers and chocolate retailers. Their methodologies applied procedures like qualitative and multivariate panel approaches, and choice and taste experiments. As a result of limited studies on chocolate hedonic analysis, our review section focuses on price analysis papers that use hedonic models to capture the willingness to pay for quality in agricultural products. Waugh (1928) attempted to discover the important quality characteristics which influenced high or low prices in vegetables. Therein, he considered that vegetables are mostly affected by their physical characteristics, including size, shape, color, maturity, uniformity, and similar factors. He argued that the market must produce varieties which the marketplace wants and is willing to pay. That is, aligning grading and packing policies to demand. At the time, Waugh criticized using consumer-demand surveys due to their empirical challenges in measuring consumer preferences quantitatively and inaccurately accessing the actual demand which depends not only upon quality but also upon price. Waugh (1928) assumed that if a market reveals a premium for certain qualities in an agricultural product, the producer can and will adapt production and marketing policies to the demand for the qualities. This is the case when marginal revenue made through the premium qualities offsets the marginal cost of growing the quality product. Waugh assumptions are necessary to argue that chocolate producers will be responsive to produce quality bars if they attain a marginal profit from sales of the quality bars. Carew (2000) contributes to the hedonic literature through his emphasis on quality characteristics, marketing factors, and interaction effects. Contextualizing the Canadian apple industry, Carew highlighted that quality attributes are influencing factors that determine prices in an agricultural product market. Moreover, the study presents that product characteristics are affected by other quality
5 Fox News Health published in June, 2013 the “Demand for healthier chocolates on the rise in US”. This article referenced an analysis that was conducted and reported by Euromonitor. http://www.foxnews.com/health/2013/06/04/demand-for-healthier-chocolates-on-rise-in-us.html
5
features. The larger the price difference between quality characteristics implies a willingness to pay (WTP) for a more desirable grade or quality. Basically, Carew shaped the structure of this study through the application of the hedonic price function to derive the implicit product values. Sticking to the theoretical and characteristics frameworks by Suvannunt (1976), Waugh (1928), and Rosen (1974), Carew developed a bid function which models that consumers are willing to make a bid for different bundles of characteristics. And, the offers of those product characteristics are provided by the suppliers.
µ = µ (z1, z2,…, zm ; g) (1) Where µ depicts the wholesaler's bid function; z depicts the product and marketing characteristics, and g depicts the expenditures of apple producers. To estimate the hedonic price, Carew (2000) constructs a dataset from weekly transaction data on apples by apple quality and marketing characteristics. The data covered three marketing years (1994-1996). Carew’s specification regressed the deflated price on the characteristics, including second order interaction terms, to control for homogeneity of variance. The results find that grades and marketing factors influence product quality premiums or discounts; and the interactions among grade attributes and marketing factors demonstrate characteristics interdependencies. Relative to concern for structural change, grading standards ought to be revised to reflect changing consumer preferences and to incorporate other quality elements. Nerlove (1995) contributes to the literature by focusing on the concept of exogenous price on the wine market. This analysis focused on utility maximization in the Swedish wine market. Nerlove regressed quantity sold on product price and quality attributes. Nerlove (1995) assumes no market restriction and the presence of perfect substitution among wine varieties. The lesson learned from this study purports that if the quantity supplied is exogenously determined, the results from a hedonic specification, using an endogenous price as the dependent variable, might be misleading and bias. This argument informs our study to regress quantity supplied on price, if and only if we sense that chocolate supplied in the US chocolate market is not determined by price.
The difference in consumer preference for products' qualities and the market supply in response to consumer demand, in the long run, could imply a structural change. Ideally, this study seeks to induce the thought of checking for a structural change in the chocolate market in favor of fruit or nut chocolate. Reed and Clark (2000), in their technical paper, discussed structural change and competition in seven US food markets. Structural change is highly associated with trends in market variables and can be tested for, an argument made by the authors. Most empirical studies seek to capture a structural change in a model parameter. Rather, Reed and Clark’s approach tests for unpredictable changing trends. Trends in consumer demand or the long-run structure of an industry are necessary to depict structural change. For example, Reed and Clark highlight an argument that changing trend in consumer behavior leads to a changing structure in the food sector. Controlling for shifts in estimates provides information on the industry structure. Reed and Clark contribute to the literature through the proposition that shifters can be checked and tested for, rather than explicitly presented in a model. Even though structural change can be incorporated directly into a very general and powerful set of market models, trends in market variables can indicate with structural change. It is hard to prove the statistical inference for structural change. As there is no silver bullet to econometric modeling, it becomes a valued judgment of either to test or explicitly control for a structural change.
Tomek and Kaiser (1999) also agreed that it is an empirical challenge to account for structural change in a model. However, they criticized procedures which use diagnostic tests as selection criteria to
6
explain the structural change. Unlike the latter study, Tomek & Kaiser supported the idea of explicitly controlling for changing model specifications and trends. They stressed that using a test to validate the structural change violates the law of logic. That is, a test for structural change is a joint test of the other conditioning specifications of the model. Rejecting the null of no structural change may merely reflect other identified problems in the model. Parameter consistency is an integral issue in estimation. The authors argued that given a situation where a structural break must have occurred, the possibility of its determination should be carried out by logic and not by empirical data mining: Structural change should explicitly be modeled. Or else, the researcher should assume a constant parameter for the sample period. For example, examining the model specification for the demand of fluid milk in the United States, Tomek & Kaiser’s empirical specification developed a variable of the difference in advertising programs over the sample period to account for structural change through the changing age distribution and healthfulness influences on the demand for fluid milk.
4. Theoretical Model The empirical analysis in this paper is underpinned by hedonic theory. Pioneered by works of Lancaster (1966) and Rosen (1978), the theory rests on the underlying assumption and justification of characteristics. We think it is fair to say that the chocolate market is a characteristic market, as we have mentioned and try to show in the contextual background. The chocolate market exhibits characteristics such color, taste, and production origin that are important to consumers. In this section, we present the theoretical framework and its underlying assumptions which explain how varieties and qualities of chocolate may be demanded. We incorporate this framework and its functions to guide the construction of our data and to build our empirical specification. Lancaster’s (1966) consumer theory also revealed that output yielded through inputs is a collection of characteristics. He assumed goods hold characteristics which give rise to utility. Furthermore, Lancaster argued that goods have more than one characteristic, and combined goods possess varying utilities than separate goods. To sum things up, practically, utility is reflected in the chocolate market by means of price and quality characteristics, which are valued orderly.
z = βy (2) Equation (2) shows a model of consumer behavior. In a linear relationship, the author assumed that the amount of characteristics z in a good is provided by a vector of consumption technology β and level of activities y. Rosen (1974) hedonic theory argued that implicit prices guide both the consumer and producer decisions. In his theoretical framework, market equilibrium combines buyers and seller’s goals through a hedonic price regression. We assume that chocolate consumers have a bid function which manifests their willingness to pay for chocolate qualities and the linked utilities. Also, chocolate producers are thoughtful of factor cost and decide on the package of characteristics and marketing policies to assemble in a chocolate bar. Given consumer and seller decisions, Rosen argues that implicit demand is in equilibrium to implicit supply and equilibrium is guided by price. Thus, estimating the function in Equation (3).
P(z) = p(z1, z2,…, zn) (3) Where P(z) depicts the set of hedonic prices, and z1, to zn is the measurable characteristics contained in each chocolate bar. The hedonic theory assumes perfect information, close substitutes, and no market limitations; and hedonic model is disadvantageous to empirical pitfalls of multicollinearity, omitted variable bias, choice of functional form, market segmentation, expected versus actual characteristics, and attitude toward market risks.
7
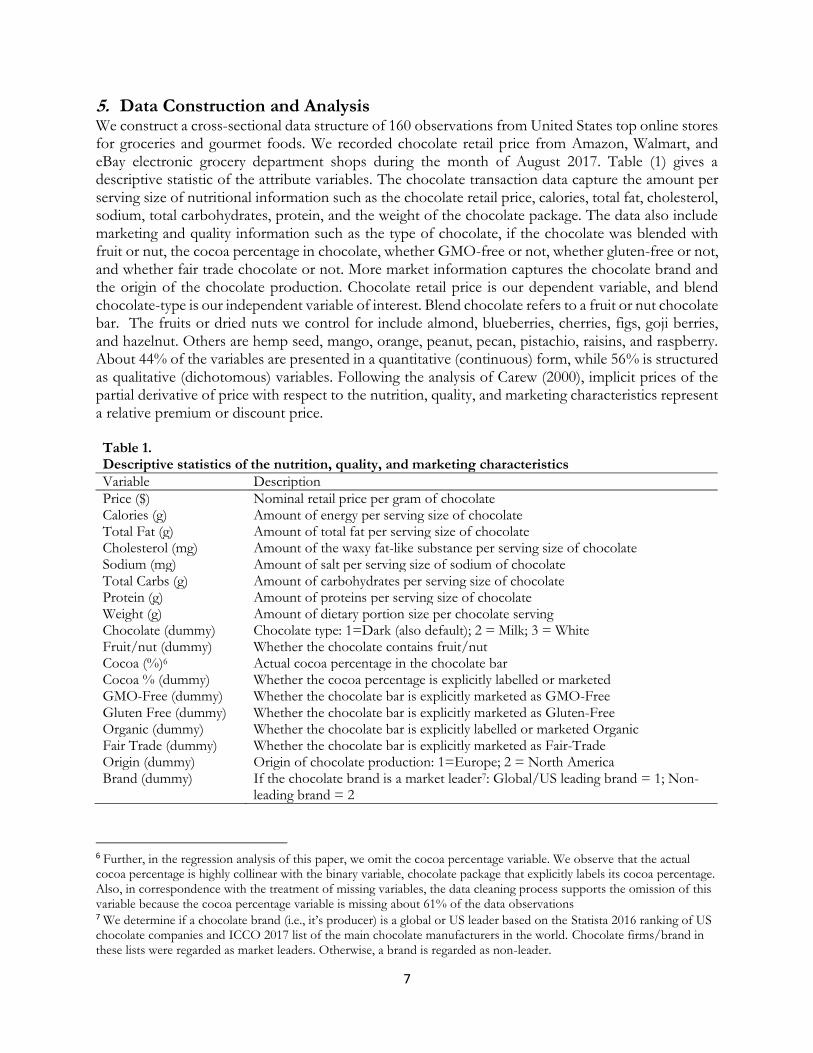
5. Data Construction and Analysis We construct a cross-sectional data structure of 160 observations from United States top online stores for groceries and gourmet foods. We recorded chocolate retail price from Amazon, Walmart, and eBay electronic grocery department shops during the month of August 2017. Table (1) gives a descriptive statistic of the attribute variables. The chocolate transaction data capture the amount per serving size of nutritional information such as the chocolate retail price, calories, total fat, cholesterol, sodium, total carbohydrates, protein, and the weight of the chocolate package. The data also include marketing and quality information such as the type of chocolate, if the chocolate was blended with fruit or nut, the cocoa percentage in chocolate, whether GMO-free or not, whether gluten-free or not, and whether fair trade chocolate or not. More market information captures the chocolate brand and the origin of the chocolate production. Chocolate retail price is our dependent variable, and blend chocolate-type is our independent variable of interest. Blend chocolate refers to a fruit or nut chocolate bar. The fruits or dried nuts we control for include almond, blueberries, cherries, figs, goji berries, and hazelnut. Others are hemp seed, mango, orange, peanut, pecan, pistachio, raisins, and raspberry. About 44% of the variables are presented in a quantitative (continuous) form, while 56% is structured as qualitative (dichotomous) variables. Following the analysis of Carew (2000), implicit prices of the partial derivative of price with respect to the nutrition, quality, and marketing characteristics represent a relative premium or discount price. Table 1. Descriptive statistics of the nutrition, quality, and marketing characteristics
Variable Description
Price ($) Nominal retail price per gram of chocolate Calories (g) Amount of energy per serving size of chocolate Total Fat (g) Amount of total fat per serving size of chocolate Cholesterol (mg) Amount of the waxy fat-like substance per serving size of chocolate Sodium (mg) Amount of salt per serving size of sodium of chocolate Total Carbs (g) Amount of carbohydrates per serving size of chocolate Protein (g) Amount of proteins per serving size of chocolate Weight (g) Amount of dietary portion size per chocolate serving Chocolate (dummy) Chocolate type: 1=Dark (also default); 2 = Milk; 3 = White Fruit/nut (dummy) Whether the chocolate contains fruit/nut Cocoa (%)6 Actual cocoa percentage in the chocolate bar Cocoa % (dummy) Whether the cocoa percentage is explicitly labelled or marketed GMO-Free (dummy) Whether the chocolate bar is explicitly marketed as GMO-Free Gluten Free (dummy) Whether the chocolate bar is explicitly marketed as Gluten-Free Organic (dummy) Whether the chocolate bar is explicitly labelled or marketed Organic Fair Trade (dummy) Whether the chocolate bar is explicitly marketed as Fair-Trade Origin (dummy) Origin of chocolate production: 1=Europe; 2 = North America Brand (dummy) If the chocolate brand is a market leader7: Global/US leading brand = 1; Non-
leading brand = 2
6 Further, in the regression analysis of this paper, we omit the cocoa percentage variable. We observe that the actual cocoa percentage is highly collinear with the binary variable, chocolate package that explicitly labels its cocoa percentage. Also, in correspondence with the treatment of missing variables, the data cleaning process supports the omission of this variable because the cocoa percentage variable is missing about 61% of the data observations 7 We determine if a chocolate brand (i.e., it’s producer) is a global or US leader based on the Statista 2016 ranking of US chocolate companies and ICCO 2017 list of the main chocolate manufacturers in the world. Chocolate firms/brand in these lists were regarded as market leaders. Otherwise, a brand is regarded as non-leader.
8
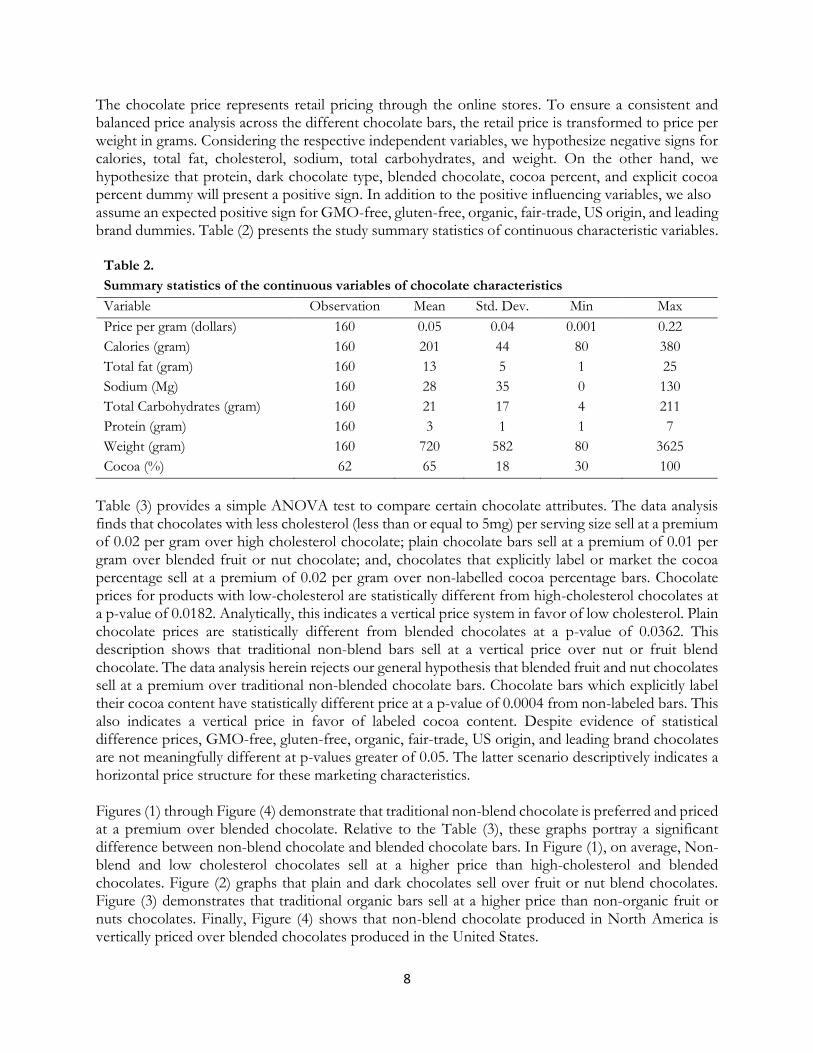
The chocolate price represents retail pricing through the online stores. To ensure a consistent and balanced price analysis across the different chocolate bars, the retail price is transformed to price per weight in grams. Considering the respective independent variables, we hypothesize negative signs for calories, total fat, cholesterol, sodium, total carbohydrates, and weight. On the other hand, we hypothesize that protein, dark chocolate type, blended chocolate, cocoa percent, and explicit cocoa percent dummy will present a positive sign. In addition to the positive influencing variables, we also assume an expected positive sign for GMO-free, gluten-free, organic, fair-trade, US origin, and leading brand dummies. Table (2) presents the study summary statistics of continuous characteristic variables.
Table 2.
Summary statistics of the continuous variables of chocolate characteristics
Variable Observation Mean Std. Dev. Min Max
Price per gram (dollars) 160 0.05 0.04 0.001 0.22
Calories (gram) 160 201 44 80 380
Total fat (gram) 160 13 5 1 25
Sodium (Mg) 160 28 35 0 130
Total Carbohydrates (gram) 160 21 17 4 211
Protein (gram) 160 3 1 1 7
Weight (gram) 160 720 582 80 3625
Cocoa (%) 62 65 18 30 100
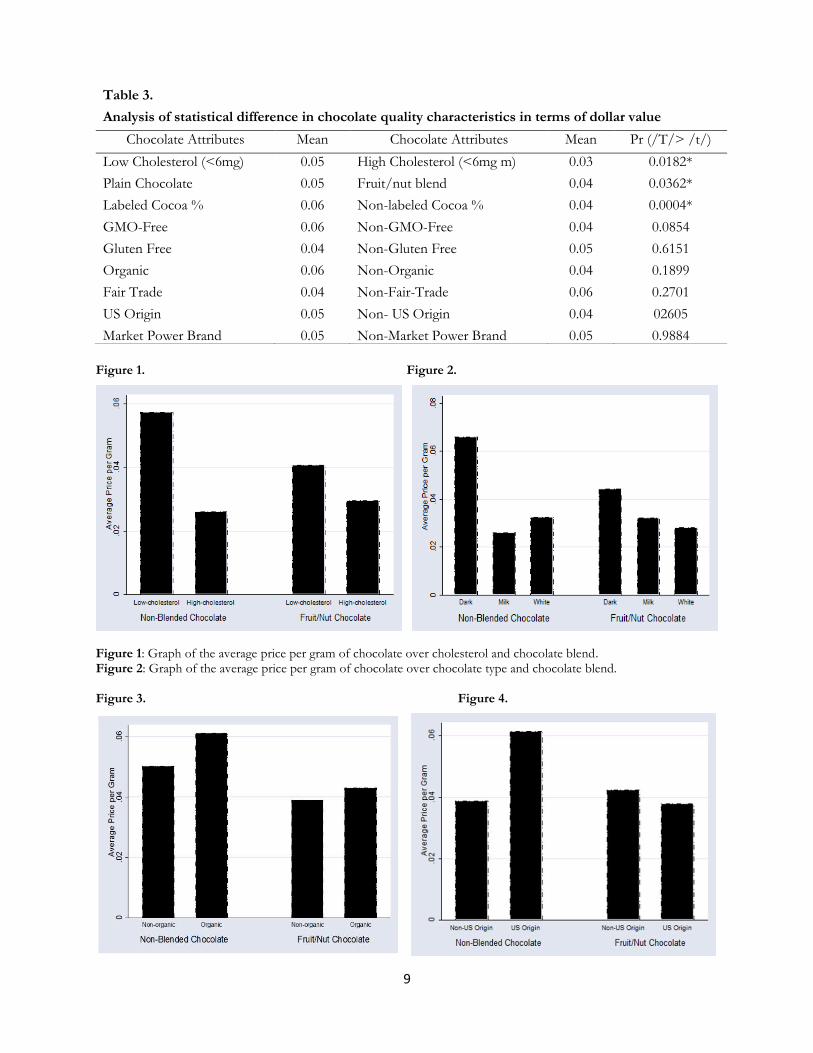
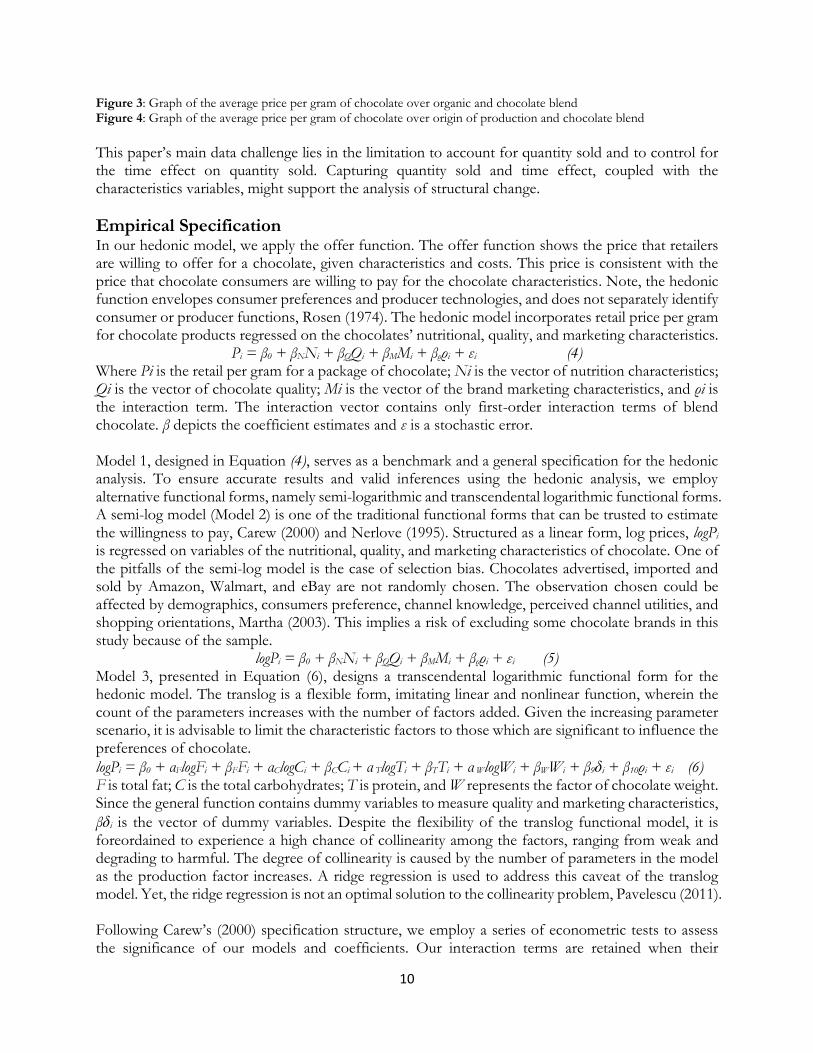
Table (3) provides a simple ANOVA test to compare certain chocolate attributes. The data analysis finds that chocolates with less cholesterol (less than or equal to 5mg) per serving size sell at a premium of 0.02 per gram over high cholesterol chocolate; plain chocolate bars sell at a premium of 0.01 per gram over blended fruit or nut chocolate; and, chocolates that explicitly label or market the cocoa percentage sell at a premium of 0.02 per gram over non-labelled cocoa percentage bars. Chocolate prices for products with low-cholesterol are statistically different from high-cholesterol chocolates at a p-value of 0.0182. Analytically, this indicates a vertical price system in favor of low cholesterol. Plain chocolate prices are statistically different from blended chocolates at a p-value of 0.0362. This description shows that traditional non-blend bars sell at a vertical price over nut or fruit blend chocolate. The data analysis herein rejects our general hypothesis that blended fruit and nut chocolates sell at a premium over traditional non-blended chocolate bars. Chocolate bars which explicitly label their cocoa content have statistically different price at a p-value of 0.0004 from non-labeled bars. This also indicates a vertical price in favor of labeled cocoa content. Despite evidence of statistical difference prices, GMO-free, gluten-free, organic, fair-trade, US origin, and leading brand chocolates are not meaningfully different at p-values greater of 0.05. The latter scenario descriptively indicates a horizontal price structure for these marketing characteristics. Figures (1) through Figure (4) demonstrate that traditional non-blend chocolate is preferred and priced at a premium over blended chocolate. Relative to the Table (3), these graphs portray a significant difference between non-blend chocolate and blended chocolate bars. In Figure (1), on average, Non-blend and low cholesterol chocolates sell at a higher price than high-cholesterol and blended chocolates. Figure (2) graphs that plain and dark chocolates sell over fruit or nut blend chocolates. Figure (3) demonstrates that traditional organic bars sell at a higher price than non-organic fruit or nuts chocolates. Finally, Figure (4) shows that non-blend chocolate produced in North America is vertically priced over blended chocolates produced in the United States.
9
Figure 1. Figure 2.
Figure 1: Graph of the average price per gram of chocolate over cholesterol and chocolate blend. Figure 2: Graph of the average price per gram of chocolate over chocolate type and chocolate blend. Figure 3. Figure 4.
Table 3.
Analysis of statistical difference in chocolate quality characteristics in terms of dollar value
Chocolate Attributes Mean Chocolate Attributes Mean Pr (/T/> /t/)
Low Cholesterol (<6mg) 0.05 High Cholesterol (<6mg m) 0.03 0.0182*
Plain Chocolate 0.05 Fruit/nut blend 0.04 0.0362*
Labeled Cocoa % 0.06 Non-labeled Cocoa % 0.04 0.0004*
GMO-Free 0.06 Non-GMO-Free 0.04 0.0854
Gluten Free 0.04 Non-Gluten Free 0.05 0.6151
Organic 0.06 Non-Organic 0.04 0.1899
Fair Trade 0.04 Non-Fair-Trade 0.06 0.2701
US Origin 0.05 Non- US Origin 0.04 02605
Market Power Brand 0.05 Non-Market Power Brand 0.05 0.9884
10
Figure 3: Graph of the average price per gram of chocolate over organic and chocolate blend Figure 4: Graph of the average price per gram of chocolate over origin of production and chocolate blend
This paper’s main data challenge lies in the limitation to account for quantity sold and to control for the time effect on quantity sold. Capturing quantity sold and time effect, coupled with the characteristics variables, might support the analysis of structural change.
Empirical Specification In our hedonic model, we apply the offer function. The offer function shows the price that retailers are willing to offer for a chocolate, given characteristics and costs. This price is consistent with the price that chocolate consumers are willing to pay for the chocolate characteristics. Note, the hedonic function envelopes consumer preferences and producer technologies, and does not separately identify consumer or producer functions, Rosen (1974). The hedonic model incorporates retail price per gram for chocolate products regressed on the chocolates’ nutritional, quality, and marketing characteristics.
Pi = β0 + βNNi + βQQi + βMMi + βρρi + εi (4) Where Pi is the retail per gram for a package of chocolate; Ni is the vector of nutrition characteristics; Qi is the vector of chocolate quality; Mi is the vector of the brand marketing characteristics, and ρi is the interaction term. The interaction vector contains only first-order interaction terms of blend chocolate. β depicts the coefficient estimates and ε is a stochastic error. Model 1, designed in Equation (4), serves as a benchmark and a general specification for the hedonic analysis. To ensure accurate results and valid inferences using the hedonic analysis, we employ alternative functional forms, namely semi-logarithmic and transcendental logarithmic functional forms. A semi-log model (Model 2) is one of the traditional functional forms that can be trusted to estimate the willingness to pay, Carew (2000) and Nerlove (1995). Structured as a linear form, log prices, logPi is regressed on variables of the nutritional, quality, and marketing characteristics of chocolate. One of the pitfalls of the semi-log model is the case of selection bias. Chocolates advertised, imported and sold by Amazon, Walmart, and eBay are not randomly chosen. The observation chosen could be affected by demographics, consumers preference, channel knowledge, perceived channel utilities, and shopping orientations, Martha (2003). This implies a risk of excluding some chocolate brands in this study because of the sample.
logPi = β0 + βNNi + βQQi + βMMi + βρρi + εi (5) Model 3, presented in Equation (6), designs a transcendental logarithmic functional form for the hedonic model. The translog is a flexible form, imitating linear and nonlinear function, wherein the count of the parameters increases with the number of factors added. Given the increasing parameter scenario, it is advisable to limit the characteristic factors to those which are significant to influence the preferences of chocolate.
logPi = β0 + αFlogFi + βFFi + αClogCi + βCCi + α TlogTi + βTTi + α WlogWi + βWWi + β9ẟi + β10ρi + εi (6) F is total fat; C is the total carbohydrates; T is protein, and W represents the factor of chocolate weight. Since the general function contains dummy variables to measure quality and marketing characteristics,
βẟi is the vector of dummy variables. Despite the flexibility of the translog functional model, it is foreordained to experience a high chance of collinearity among the factors, ranging from weak and degrading to harmful. The degree of collinearity is caused by the number of parameters in the model as the production factor increases. A ridge regression is used to address this caveat of the translog model. Yet, the ridge regression is not an optimal solution to the collinearity problem, Pavelescu (2011). Following Carew’s (2000) specification structure, we employ a series of econometric tests to assess the significance of our models and coefficients. Our interaction terms are retained when their
11
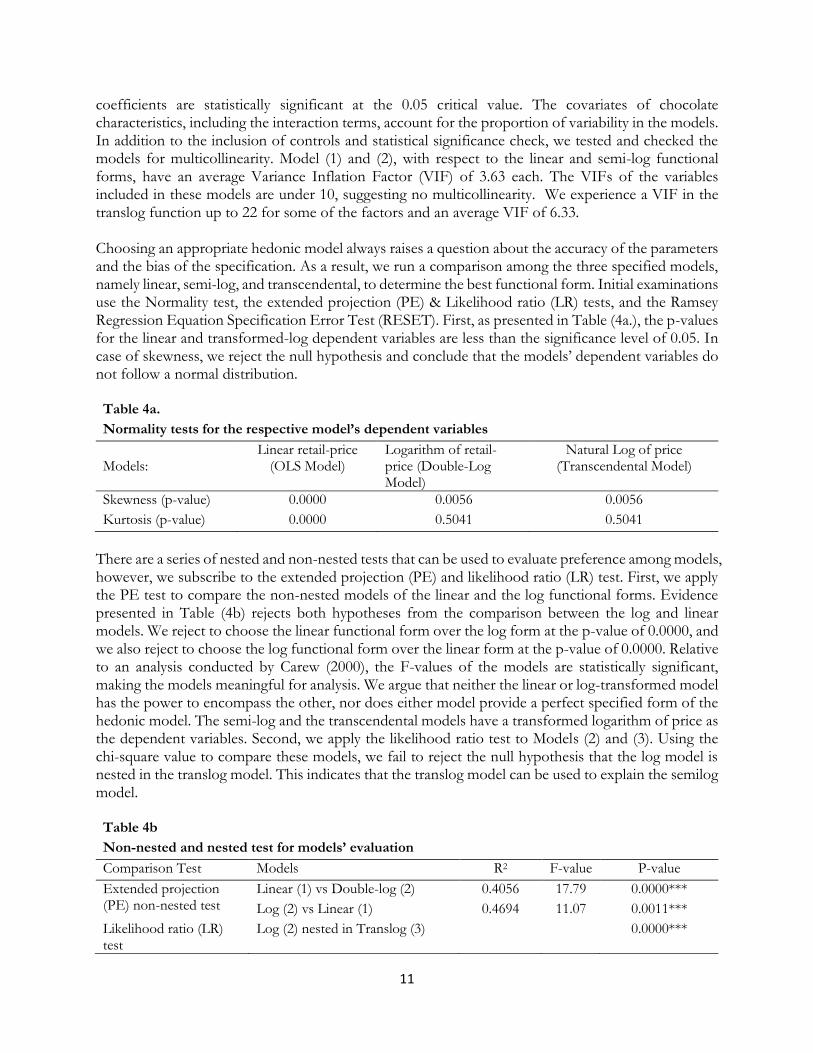
coefficients are statistically significant at the 0.05 critical value. The covariates of chocolate characteristics, including the interaction terms, account for the proportion of variability in the models. In addition to the inclusion of controls and statistical significance check, we tested and checked the models for multicollinearity. Model (1) and (2), with respect to the linear and semi-log functional forms, have an average Variance Inflation Factor (VIF) of 3.63 each. The VIFs of the variables included in these models are under 10, suggesting no multicollinearity. We experience a VIF in the translog function up to 22 for some of the factors and an average VIF of 6.33. Choosing an appropriate hedonic model always raises a question about the accuracy of the parameters and the bias of the specification. As a result, we run a comparison among the three specified models, namely linear, semi-log, and transcendental, to determine the best functional form. Initial examinations use the Normality test, the extended projection (PE) & Likelihood ratio (LR) tests, and the Ramsey Regression Equation Specification Error Test (RESET). First, as presented in Table (4a.), the p-values for the linear and transformed-log dependent variables are less than the significance level of 0.05. In case of skewness, we reject the null hypothesis and conclude that the models’ dependent variables do not follow a normal distribution. Table 4a.
Normality tests for the respective model’s dependent variables
Models:
Linear retail-price (OLS Model)
Logarithm of retail-price (Double-Log Model)
Natural Log of price (Transcendental Model)
Skewness (p-value) 0.0000 0.0056 0.0056
Kurtosis (p-value) 0.0000 0.5041 0.5041
There are a series of nested and non-nested tests that can be used to evaluate preference among models, however, we subscribe to the extended projection (PE) and likelihood ratio (LR) test. First, we apply the PE test to compare the non-nested models of the linear and the log functional forms. Evidence presented in Table (4b) rejects both hypotheses from the comparison between the log and linear models. We reject to choose the linear functional form over the log form at the p-value of 0.0000, and we also reject to choose the log functional form over the linear form at the p-value of 0.0000. Relative to an analysis conducted by Carew (2000), the F-values of the models are statistically significant, making the models meaningful for analysis. We argue that neither the linear or log-transformed model has the power to encompass the other, nor does either model provide a perfect specified form of the hedonic model. The semi-log and the transcendental models have a transformed logarithm of price as the dependent variables. Second, we apply the likelihood ratio test to Models (2) and (3). Using the chi-square value to compare these models, we fail to reject the null hypothesis that the log model is nested in the translog model. This indicates that the translog model can be used to explain the semilog model. Table 4b
Non-nested and nested test for models’ evaluation
Comparison Test Models R2 F-value P-value
Extended projection (PE) non-nested test
Linear (1) vs Double-log (2) 0.4056 17.79 0.0000***
Log (2) vs Linear (1) 0.4694 11.07 0.0011***
Likelihood ratio (LR) test
Log (2) nested in Translog (3) 0.0000***
12
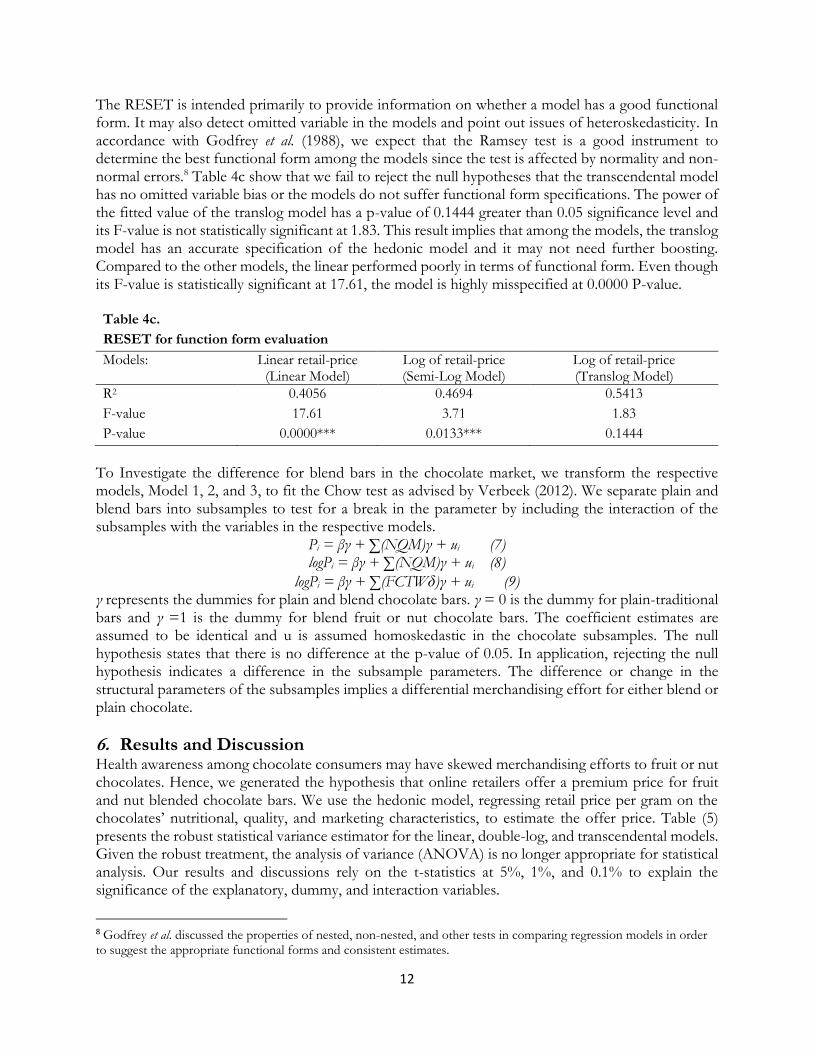
The RESET is intended primarily to provide information on whether a model has a good functional form. It may also detect omitted variable in the models and point out issues of heteroskedasticity. In accordance with Godfrey et al. (1988), we expect that the Ramsey test is a good instrument to determine the best functional form among the models since the test is affected by normality and non-normal errors.8 Table 4c show that we fail to reject the null hypotheses that the transcendental model has no omitted variable bias or the models do not suffer functional form specifications. The power of the fitted value of the translog model has a p-value of 0.1444 greater than 0.05 significance level and its F-value is not statistically significant at 1.83. This result implies that among the models, the translog model has an accurate specification of the hedonic model and it may not need further boosting. Compared to the other models, the linear performed poorly in terms of functional form. Even though its F-value is statistically significant at 17.61, the model is highly misspecified at 0.0000 P-value.
Table 4c.
RESET for function form evaluation
Models: Linear retail-price (Linear Model)
Log of retail-price (Semi-Log Model)
Log of retail-price (Translog Model)
R2 0.4056 0.4694 0.5413
F-value 17.61 3.71 1.83
P-value 0.0000*** 0.0133*** 0.1444
To Investigate the difference for blend bars in the chocolate market, we transform the respective models, Model 1, 2, and 3, to fit the Chow test as advised by Verbeek (2012). We separate plain and blend bars into subsamples to test for a break in the parameter by including the interaction of the subsamples with the variables in the respective models.
Pi = βγ + ∑(NQM)γ + ui (7) logPi = βγ + ∑(NQM)γ + ui (8)
logPi = βγ + ∑(FCTWẟ)γ + ui (9) γ represents the dummies for plain and blend chocolate bars. γ = 0 is the dummy for plain-traditional bars and γ =1 is the dummy for blend fruit or nut chocolate bars. The coefficient estimates are assumed to be identical and u is assumed homoskedastic in the chocolate subsamples. The null hypothesis states that there is no difference at the p-value of 0.05. In application, rejecting the null hypothesis indicates a difference in the subsample parameters. The difference or change in the structural parameters of the subsamples implies a differential merchandising effort for either blend or plain chocolate.
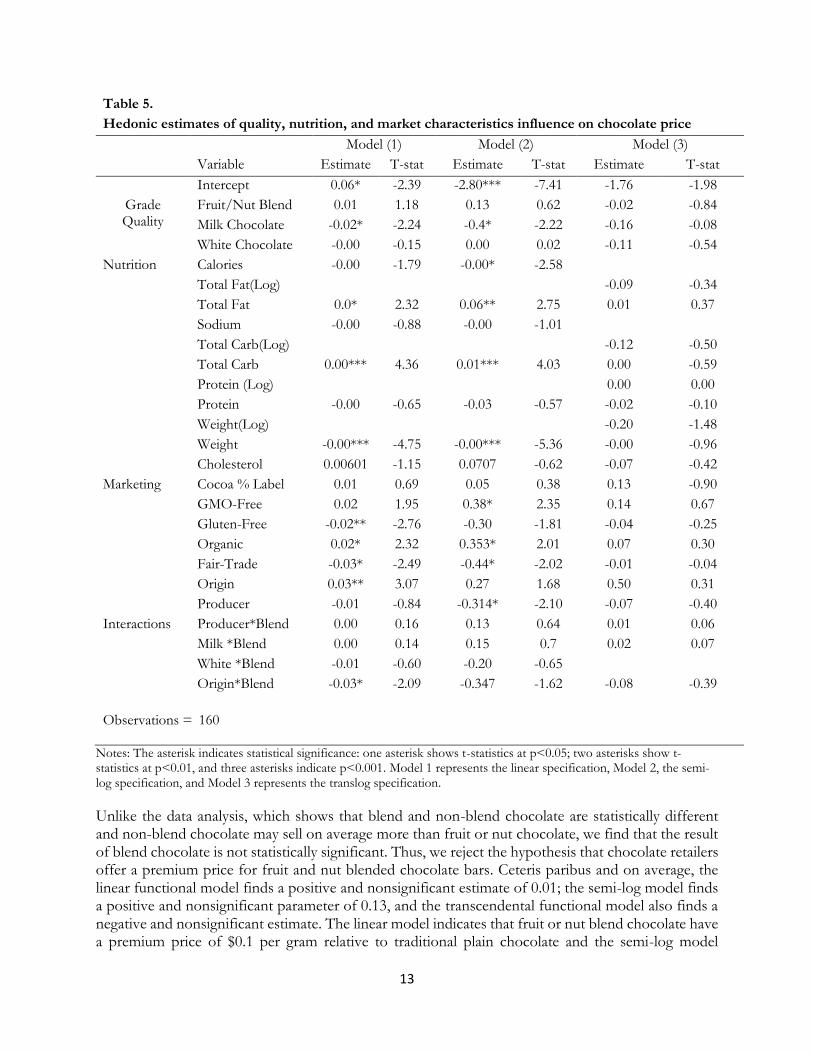
6. Results and Discussion Health awareness among chocolate consumers may have skewed merchandising efforts to fruit or nut chocolates. Hence, we generated the hypothesis that online retailers offer a premium price for fruit and nut blended chocolate bars. We use the hedonic model, regressing retail price per gram on the chocolates’ nutritional, quality, and marketing characteristics, to estimate the offer price. Table (5) presents the robust statistical variance estimator for the linear, double-log, and transcendental models. Given the robust treatment, the analysis of variance (ANOVA) is no longer appropriate for statistical analysis. Our results and discussions rely on the t-statistics at 5%, 1%, and 0.1% to explain the significance of the explanatory, dummy, and interaction variables.
8 Godfrey et al. discussed the properties of nested, non-nested, and other tests in comparing regression models in order to suggest the appropriate functional forms and consistent estimates.
13
Table 5.
Hedonic estimates of quality, nutrition, and market characteristics influence on chocolate price
Model (1) Model (2) Model (3)
Variable Estimate T-stat Estimate T-stat Estimate T-stat
Intercept 0.06* -2.39 -2.80*** -7.41 -1.76 -1.98
Grade Quality
Fruit/Nut Blend 0.01 1.18 0.13 0.62 -0.02 -0.84
Milk Chocolate -0.02* -2.24 -0.4* -2.22 -0.16 -0.08
White Chocolate -0.00 -0.15 0.00 0.02 -0.11 -0.54
Nutrition Calories -0.00 -1.79 -0.00* -2.58
Total Fat(Log)
-0.09 -0.34
Total Fat 0.0* 2.32 0.06** 2.75 0.01 0.37
Sodium -0.00 -0.88 -0.00 -1.01
Total Carb(Log)
-0.12 -0.50
Total Carb 0.00*** 4.36 0.01*** 4.03 0.00 -0.59
Protein (Log)
0.00 0.00
Protein -0.00 -0.65 -0.03 -0.57 -0.02 -0.10
Weight(Log)
-0.20 -1.48
Weight -0.00*** -4.75 -0.00*** -5.36 -0.00 -0.96
Cholesterol 0.00601 -1.15 0.0707 -0.62 -0.07 -0.42
Marketing Cocoa % Label 0.01 0.69 0.05 0.38 0.13 -0.90
GMO-Free 0.02 1.95 0.38* 2.35 0.14 0.67
Gluten-Free -0.02** -2.76 -0.30 -1.81 -0.04 -0.25
Organic 0.02* 2.32 0.353* 2.01 0.07 0.30
Fair-Trade -0.03* -2.49 -0.44* -2.02 -0.01 -0.04
Origin 0.03** 3.07 0.27 1.68 0.50 0.31
Producer -0.01 -0.84 -0.314* -2.10 -0.07 -0.40
Interactions Producer*Blend 0.00 0.16 0.13 0.64 0.01 0.06
Milk *Blend 0.00 0.14 0.15 0.7 0.02 0.07
White *Blend -0.01 -0.60 -0.20 -0.65
Origin*Blend -0.03* -2.09 -0.347 -1.62 -0.08 -0.39
Observations = 160
Notes: The asterisk indicates statistical significance: one asterisk shows t-statistics at p<0.05; two asterisks show t-statistics at p<0.01, and three asterisks indicate p<0.001. Model 1 represents the linear specification, Model 2, the semi-log specification, and Model 3 represents the translog specification.
Unlike the data analysis, which shows that blend and non-blend chocolate are statistically different and non-blend chocolate may sell on average more than fruit or nut chocolate, we find that the result of blend chocolate is not statistically significant. Thus, we reject the hypothesis that chocolate retailers offer a premium price for fruit and nut blended chocolate bars. Ceteris paribus and on average, the linear functional model finds a positive and nonsignificant estimate of 0.01; the semi-log model finds a positive and nonsignificant parameter of 0.13, and the transcendental functional model also finds a negative and nonsignificant estimate. The linear model indicates that fruit or nut blend chocolate have a premium price of $0.1 per gram relative to traditional plain chocolate and the semi-log model
14
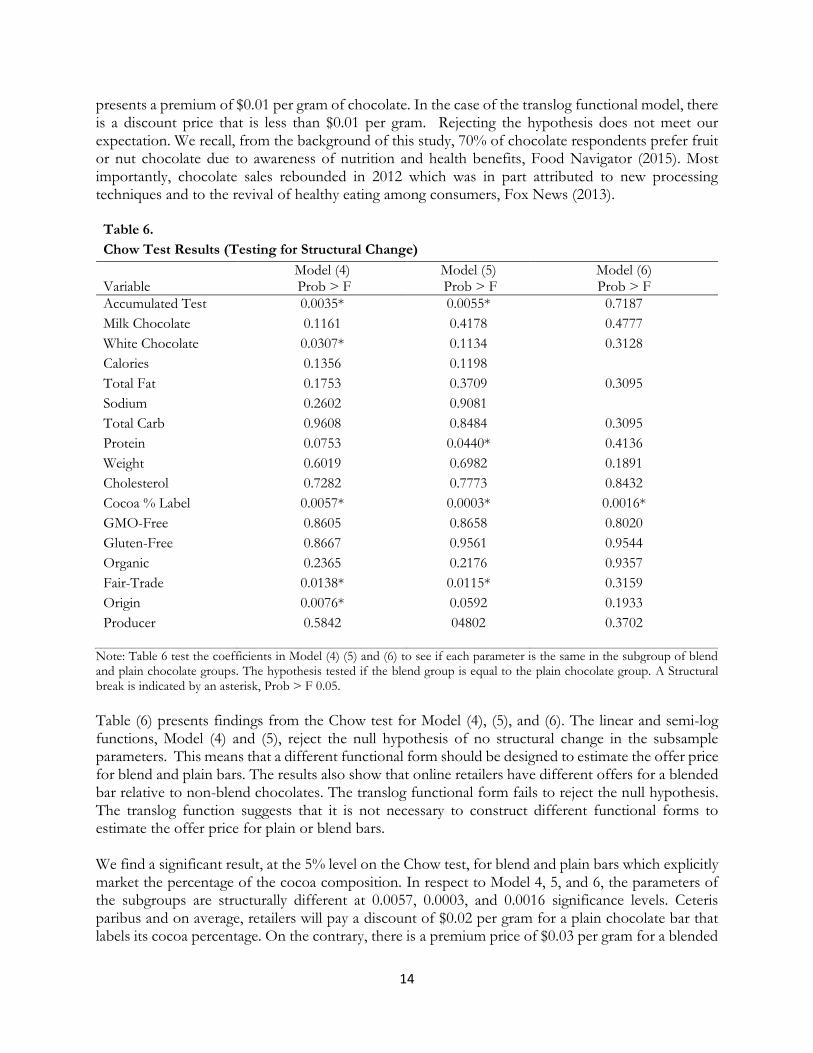
presents a premium of $0.01 per gram of chocolate. In the case of the translog functional model, there is a discount price that is less than $0.01 per gram. Rejecting the hypothesis does not meet our expectation. We recall, from the background of this study, 70% of chocolate respondents prefer fruit or nut chocolate due to awareness of nutrition and health benefits, Food Navigator (2015). Most importantly, chocolate sales rebounded in 2012 which was in part attributed to new processing techniques and to the revival of healthy eating among consumers, Fox News (2013).
Table 6.
Chow Test Results (Testing for Structural Change)
Variable
Model (4) Prob > F
Model (5) Prob > F
Model (6) Prob > F
Accumulated Test 0.0035* 0.0055* 0.7187
Milk Chocolate 0.1161 0.4178 0.4777
White Chocolate 0.0307* 0.1134 0.3128
Calories 0.1356 0.1198
Total Fat 0.1753 0.3709 0.3095
Sodium 0.2602 0.9081
Total Carb 0.9608 0.8484 0.3095
Protein 0.0753 0.0440* 0.4136
Weight 0.6019 0.6982 0.1891
Cholesterol 0.7282 0.7773 0.8432
Cocoa % Label 0.0057* 0.0003* 0.0016*
GMO-Free 0.8605 0.8658 0.8020
Gluten-Free 0.8667 0.9561 0.9544
Organic 0.2365 0.2176 0.9357
Fair-Trade 0.0138* 0.0115* 0.3159
Origin 0.0076* 0.0592 0.1933
Producer
0.5842 04802 0.3702
Note: Table 6 test the coefficients in Model (4) (5) and (6) to see if each parameter is the same in the subgroup of blend and plain chocolate groups. The hypothesis tested if the blend group is equal to the plain chocolate group. A Structural break is indicated by an asterisk, Prob > F 0.05.
Table (6) presents findings from the Chow test for Model (4), (5), and (6). The linear and semi-log functions, Model (4) and (5), reject the null hypothesis of no structural change in the subsample parameters. This means that a different functional form should be designed to estimate the offer price for blend and plain bars. The results also show that online retailers have different offers for a blended bar relative to non-blend chocolates. The translog functional form fails to reject the null hypothesis. The translog function suggests that it is not necessary to construct different functional forms to estimate the offer price for plain or blend bars. We find a significant result, at the 5% level on the Chow test, for blend and plain bars which explicitly market the percentage of the cocoa composition. In respect to Model 4, 5, and 6, the parameters of the subgroups are structurally different at 0.0057, 0.0003, and 0.0016 significance levels. Ceteris paribus and on average, retailers will pay a discount of $0.02 per gram for a plain chocolate bar that labels its cocoa percentage. On the contrary, there is a premium price of $0.03 per gram for a blended

15
bar that explicitly labels its cocoa proportion. At 5%, Model (4) and (5) find a significant difference in the fair-trade parameters between a blend and plain bars at 0.0138 and 0.0115 F-values. These different parameters show a premium price of $0.03 per gram for fair-trade plain chocolate bars and a discount of $0.04 for fair-trade blend chocolate bars. Moreover, Model (4) and (5) individually show that white chocolate and protein characteristic coefficients are structural different between a blend and plain bars at the F-value of 0.0307 and 0.0440. These results present a premium price of $0.04 per gram for white blend chocolate and a discount of $0.02 per gram for white plain chocolate. There is a premium of $0.01 for a high-protein plain chocolate bar and a discount of $0.01 for a high-protein blend bars. These results from the Chow test imply that online retailers have mixed offer prices for a blend or plain bar. Even though our variable of interest does not manifest a statistical result to support our general hypothesis, our results present that factors of total fat, total carbohydrates, chocolate-weight, chocolate type, GMO-free, gluten-free, organic, and fair-trade chiefly influence chocolate prices. Through Model (1) and (2), we find negative and significant estimates for milk chocolate, relative to dark chocolate. Model 1 shows that milk chocolate is priced lower by $0.02. Model (2) presents an estimate for milk chocolate, which influence price by -$0.02 per gram. We anticipate this result and conform to the argument that dark chocolate quality is superior to other types of chocolates. Dark chocolates have been linked with good health benefits for centuries, including serving as antioxidants.
We find a positive and statistically significant result for higher total fat in chocolate products. Still, in Model 1 and Model (2), the premium for higher total fat bars is less than $0.01 per gram. Although unexpected, this significant result of a preference for high-fat chocolate lends support to the argument that American consumers crave high fat and carbohydrates in food such as chocolates, Yanovski (2003) and Drewnowski & Specter (2004). Additionally, Model (1) and Model (2) show a positive and significant result for total carbohydrates. An increase in 1 gram of carbohydrates increases the price, but the premium is less than $0.01 per gram. This finding also supports the argument that American chocolate consumers desire high carbohydrate bars, Yanovski (2003). Weight is also a deciding factor in the determination of chocolate prices. Model (1) and (2) report a negative and significant result for chocolate weight variable. Yet, this result is very small, increasing the discount price by $0.01 per gram. A priori, we expect that large chocolate package will reduce the price per gram of chocolate. As expected, chocolate retailers offer a discount for a larger package. There is a price premium of $0.02 per gram for organic-branded chocolates compared to non-organic marketed chocolates, as shown in Model (1). Positive and statistically significant, Model (2) indicates that organic marketed chocolate sells at a premium of 0.35% above non-organic bars. The dollar value of this premium is about $0.02. We expected this result because the eating culture today is turning to organic food. The result is consistent with the ICCO report, ICCO (2017). ICCO highlights that the demand for organic cocoa products is growing, attributed to safety and environmental concerns. A 2013 to 2018 outlook from US Organic Food Market Forecast projects a compound annual growth rate of 14%, Daniells (2014). Another marketing finding, displayed in Model (1), shows that chocolates produced in the US have a positive and significant effect on price. As expected, this credence factor results in a premium of $0.03 per gram for US chocolate over imported bars.
In the case of gluten-free & fair-trade bars and chocolates produced by the major market players, we find a negative effect on price. Model (2) shows that gluten-free chocolates sell at a discount of $0.02 per gram. This result is contrary to the idea and argument about eating healthy chocolates. Another unexpected finding is the result of fair-trade marketed chocolates. Model (1) and (2), respectively,
16
present negative estimates of 0.03 and 0.44. The linear hedonic model finds a price discount of $0.03. Similarly, in the semi-log hedonic model, fair-trade bars sell at a discount of $0.02 per gram or 44% less than chocolates not labeled fair-trade. Chocolate producers and consumers must increase their commitment and involvement to facilitate fair-trade chocolate in order to enjoy a premium in the market. On the other hand, the discount effects relative to gluten-free and fair-trade bar might suggest that online retailers may offer lower prices to lure consumers to their brand and to increase sales. Smaller players in the chocolate market enjoy a premium relative to the market leaders like Hersey, Mars, Lindt/Ghiradelli, Nestle, and Mondelēz. Model (2) shows that retailers offer a discount for leading chocolate brands. On average, a 0.31% discount valued at $0.02 is offered for leading brands, relatively to smaller brands like Himalania and Endanger Species chocolates. The higher price offered by retailers for smaller manufacturer brands might indicate a higher cost or better brand image.
7. Conclusion
Concerns surrounding chocolate producers’ innovative campaigns and consumer awareness of health benefits in chocolate have motivated this study. Consequently, it is that chocolate merchandisers will offer a higher price for fruit or nut chocolate blend. In this paper, the analysis of implicit prices for the mentioned characteristic in chocolate bars is estimated through the hedonic model. Build on the hedonic theory, we fit our online data, from Amazon, eBay, and Walmart, to the hedonic price function to estimate the influences of chocolate quality, nutrition, and market characteristics on retail prices. Our variable of interest, nut or fruit blend chocolate, is not statistically different from other chocolate across our hedonic models. Thus, this study argues that blend chocolate does not get a premium price above traditional plain chocolate bars. Further investigating this result, using the Chow test show that there is an offer difference between blend and plain chocolates. In accordance with the Chow test, there are shifts in the blend and plain chocolate subgroup parameters. The test suggests that retailers design different strategies to estimate the offer price for plain and blend bars. Merchandising efforts of chocolate companies offer a different and premium price for fruit or nut that are made from white chocolate and fruit or nut bars that labeled their cocoa percentage. On the contrary, retailers offered a discount price for fair-trade and high protein blend bars. Product attributes such as total fat, total carbohydrates, chocolate-weight, chocolate type, GMO-free, gluten-free, organic, and fair-trade poise to significantly influence chocolate sales through discount and premier prices. Retailers offer a discount for milk chocolate compared to dark chocolate. This anticipated result suggest that chocolate eaters have faith in the health benefits, i.e., dark chocolate is an antioxidant and a pro-heart food. There is a premium placed on high-fat and chocolate rich in carbs. Producers understand that American consumers crave for high fat and carbohydrates in food such as chocolates. We find that online traders offer a discount price for gluten-free and fair-trade chocolate brands. Unlike fair-trade bars, organic, Non-GMO, and locally produced chocolate enjoy premium prices. The organic and GMO-free results reflect the concerns for sustainable and healthier eating among consumers and the incentives for producers to branch into these market segments. The credence of being a US producer also fetch a premier for locally produced bars. Finally, we find that the retailers offer a discount price to leading chocolate brands. Merchants will offer a premium for smaller packaged chocolate. Producers and merchants need to promote eating healthier chocolate, including fair-trade activism, to influence consumer demand for quality chocolates and to benefit from premium pricing. This study
17
calls for more robust research where a bigger dataset would include additional factors such as sales period and quantity sold per period. The inclusion of these variables would explicitly control or test for structural change in the chocolate market.
References Boxall, P. C., & Adamowicz, W. L. (2002). Understanding heterogeneous preferences in
random utility models: a latent class approach. Environmental and resource economics, 23(4), 421-446.
Carew, R. (2000). A hedonic analysis of apple prices and product quality characteristics in British Columbia. Canadian Journal of Agricultural Economics/Revue canadienne d'agroeconomie, 48(3), 241-257.
Crawford, Elizabeth (2015, June 1). https://www.foodnavigator-usa.com/Article/2015/06/01/Driving-consumer-demands-for-chocolate-includes-nuts-dried-fruit.
Crawford, Elizabeth (2015, April 6). https://www.foodnavigator-usa.com/Article/2015/04/06/Chocolate-sales-slow-rising-costs-competition-health-concerns.
Daniels, Jeff (2016, April 7). https://www.cnbc.com/2016/04/07/us-chocolatiers-looking-for-new-sweet-spot.html.
Daniells, Stephens (2014), US Organic food market to grow. http://www.foodnavigator-usa.com/Markets/US-organic-food-market-to-grow-14-from-2013-18.
Davis, G. C. (1997). The logic of testing structural change in meat demand: a methodological analysis and appraisal. American Journal of Agricultural Economics, 79(4), 1186-1192.
Drewnowski, A., & Specter, S. E. (2004). Poverty and obesity: the role of energy density and energy costs. The American journal of clinical nutrition, 79(1), 6-16.
Fedoseeva, S., Grein, T., & Herrmann, R. (2017). How German Online Retailers Price Foods: An Empirical Analysis for Chocolate Products. International Journal on Food System Dynamics, 8(1), 32-44.
Fox News (2013, June 4). http://www.foxnews.com/health/2013/06/04/demand-for-healthier-chocolates-on-rise-in-us.html.
Ghana Cocoa Board. https://www.cocobod.gh/ghana_cocospesification.php. Godfrey, L. G., McAleer, M., & McKENZIE, C. R. (1988). Variable addition and Lagrange
multiplier tests for linear and logarithmic regression models. The Review of Economics and Statistics, 492-503.
Hetherington, M. M., Bell, A., & Rolls, B. J. (2000). Effects of repeat consumption on pleasantness, preference and intake. British Food Journal, 102(7), 507-521.
Hooper, L., Kay, C., Abdelhamid, A., Kroon, P. A., Cohn, J. S., Rimm, E. B., & Cassidy, A. (2012). Effects of chocolate, cocoa, and flavan-3-ols on cardiovascular health: a systematic review and meta-analysis of randomized trials. The American journal of clinical nutrition, 95(3), 740-751.
ICCO (2012, March 27). https://www.icco.org/faq/59-fermentation-a-drying/108-how-is-the-quality-of-cocoa-checked-by-hand-by-machine.html.
ICCO (2017, January 3). https://www.icco.org/about-cocoa/fine-or-flavour-cocoa.html Lancaster, K. J. (1966). A new approach to consumer theory. Journal of political economy,
74(2), 132-157. MARTHA, G. R. (2003). The Impact of Perceived Channel Utilities, Shopping Orientations,
and Demographics on the Consumer's Online Buying Behavior. New Directions in Research on E-commerce, 85.
http://www.foxnews.com/health/2013/06/04/demand-for-healthier-chocolates-on-rise-in-us.html.
18
Mintel (2015, February). http://store.mintel.com/chocolate-confectionery-us-february-2015. Nerlove, M. (1995). Hedonic price functions and the measurement of preferences: The case
of Swedish wine consumers. European economic review, 39(9), 1697-1716. Pavelescu, F. M. (2011). Some aspects of the translog production function
estimation. Romanian Journal of Economics, 32(1), 41. Reed, A. J., & Clark, J. S. (2000). Structural change and competition in seven US food
markets. US Department of Agriculture, Economic Research Service. Rosen, S. (1974). Hedonic prices and implicit markets: product differentiation in pure
competition. Journal of political economy, 82(1), 34-55. Rousseau, S. (2015). The role of organic and fair trade labels when choosing chocolate. Food
Quality and Preference, 44, 92-100. Tomek, W. G., & Kaiser, H. M. (2014). Agricultural product prices. Cornell University Press. USDA (2017). https://www.ers.usda.gov/data-products/us-food-imports/ Verbeek, M. (2008). A guide to modern econometrics. John Wiley & Sons. Waugh, F. V. (1928). Quality factors influencing vegetable prices. Journal of farm
economics, 10(2), 185-196. Wohlgenant, M. K. (2001). Marketing margins: Empirical analysis. Handbook of agricultural
economics, 1, 933-970. Wohlgenant, M. K., & Haidacher, R. C. (1989). Retail to farm linkage for a complete demand
system of food commodities (No. 1775). US Dept. of Agriculture, Economic Research Service. Yanovski, S. (2003). Sugar and fat: cravings and aversions. The Journal of nutrition, 133(3),
835S-837S. Zarantonello, L., & Luomala, H. T. (2011). Dear Mr Chocolate: constructing a typology of
contextualized chocolate consumption experiences through qualitative diary research. Qualitative market research: An international Journal, 14(1), 55-82.