Embed Size (px)
Citation preview

JOUHNAL OF UHBAN ECONOMICS 5, 471-484 (1978)
1
Hedonic Prices, Price Indices and Housing MarketsALLEN C. GOODMAN 1
Center for Metropolitan Planning and Hesearch and Department of PoliticialEconomy, The Johns Hopkins University, Baltimore, Maryland 21218
Received November 18, 1976; revised March 1, 1977
This. paper extends hedonic price analysis to the formation of housingprice indices measuring variation within a metropolitan area. In formingthese indices fifteen submarkets, heterogeneous across time and space, aredescribed within a short-run equilibrium model. Linear functional forms aregenerally rejected using a method proposed by Box and Cox. Aggregationof hedonic price coefficients into standardized units yields significantly higherhousing prices in the central city than in its suburbs, as well as differentialeffects of structural and neighborhood improvements among submarkets.
I. INTRODUCTION
The characterization of housing services has been elusive in terms of agood with many components that may be valued independently of eachother. Court [6] and later Griliches [11] introduced techniques of hedonicprice analysis, in which the valuations of various components are deter-mined implicitly. through regression analysis.2 These hedonic prices, whencalculated and applied to "market basket" houses, reveal price differentialsof up to twenty percent between the city and suburban submarkets of ametropolitan area. The price differentials shrink only slowly over timeand disappear only in units of relatively high structural quality.
A review of the theory compares the view of hedonic prices as long-runequilibrium values of housing components, with a model considering a
series of short-run equilibria ,in sub markets separated by time and space.
1 I would like to thank John Quigley, Guy Orcutt, and Eric Hanushek of mydoctoral dissertation committee for their assistance, and the Department of Housingand Urban Development for financial aid (Grant H-2304). Neither group is re-sponsible for any errors that remain, nor do the views necessarily represent thoseof HUD.
. Court introduced this analysis in 1939. It appears to have remained relativelyunused until Griliches [11]. For further discussion on general use and appucation tohousing markets, see Griliches [12], Rosen [23], and Ball [2].
471
0094-1190/78/0054-0471$02.00/0Copyright@ 1978by AcademicPress, Inc.
All rights of reproductionin any form reserved.
--

472 ALLEN C. GOODMAN
Within such a framework the long-run equilibrium is seen to be a specificcase subject to empirical verification. Subsequent analysis of covariancerejects hedonic prices as long-run equilibrium values, in favor of theshort run model.
The theory also provides no basis for a priori determination of func-tional form. Alternative forms are analyzed systematically by submarketsusing a method developed by Box and Cox. A joint maximization of likeli-hood functions is then used to determine functional form across the metro-
politan area. The technique generally rejects linear forms in favor ofmultiplicative models.
The final section of the paper evaluates standardized bundles of hous-ing services among submarkets according to the hedonic price coefficientsestimated earlier. The results of this procedure show central city housesto be as much as twenty percent more expensive than comparable sub-urban houses, providing justification for such behavior as the "flight tothe suburbs." The "rebundling" process also reveals the expected qualitypremiums for better structures or better neighborhoods. Valuations ofimprovements in structure are found to be greater in the suburbs than inthe city. This contrasts, however, to neighborhood improvement whosevalue appears to be constant throughout the metropolitan area. Priceconvergency (between city and suburb) over the three year period inhouses with substantial structural quality appears to reveal a more unifiedmarket for this type of structure than for lesser quality structures or anyneighborhood category.
II. HEDONIC PRICE STRUCTURES-INTERPRETEDAND REINTERPRETED
Housing has typically been analyzed as a long-lived durable good,existing in a market in long-run equilibrium. This has led to an interpre-tation of hedonic price coefficients as "shadow prices" reflecting streamsof returns from given attributes of the house. Subsequently, such co-efficients may then be inserted into models from which, given a linearbudget constraint, demand relationships for housing and its attributescan be estimated.3
Hedonic price approaches (as noted in Griliches [10]) are based onthe research strategy which asserts that a large number of models of aparticular heterogeneous commodity can be comprehended in terms of asmaller number of attributes, or components. Simply stated,
P = f(C),
. The nature of long-run equilibrium is discussed by Apgar [1]. A particularly goodcritique of the problems underlying such an assumption is presented by Kain andQuigley [14].
I
(1)

PRICE INDICES AND HOUSING. MARKETS 473
in which P is the selling price of an individual house and C is a set ofcomponents that is thought to contribute to that price. The hedonic priceof the ith component of set C is defined as apjaci. There is no theoreticallinkage between the functional notation and a specific functional form,although linear and log-linear forms are generally used.
The hedonic price of a given component is a reduced form measure,an interaction of supply and demand market forces; the requirements forits mapping into utility space are stringent. In particular, it is necessaryto have a single market in long-run equilibrium for the valuation of agood in terms of production cost, and the valuation in terms of utility,to be equal. Many observers have noted that high conversion costs ofresidential capital, consumer immobility and heterogeneity of the com-modity appear to violate assumptions upon which a long-run equilibrium(and the pressure for housing price uniformity implicit therein) inhousing markets must be based.4
The possibility of spatial and temporal separation of markets is well-recognized. Kravis and Lipsey [17J note that international differences inregression coefficients for heavy engines could be expected if the variousmarkets are isolated from each other, a useful analogy to housing stock,which is not generally mobile (and whose purchasers may be similarlyimmobile due to discrimination, segregation, workplace or income con-straints). Straszheim [25J contends that even within the Standard Metro-politan Statistical Area (SMSA) as a whole, hedonic prices must beestimated within smaller submarkets.5 Regarding temporal separation,there is no apparent rationale for the restriction of either relative orabsolute prices of components to constant values.
It follows, then, that the relationship noted in Eq. (1) is too restrictive,imposing uniformity of coefficients across both space and time. A moregeneral form, encompassing both long- and short-run equilibria is:
Pnt = fnt(C1nt, .,', C1nt), (2)
referring to the ith component in the nth submarket at time t. The hedonicprices determined are not necessarily long-run equilibrium supply prices,but rather a set of market prices that reflect the composition and locationof existing stocks of residential capital and neighborhood components.Analysis of such price disparities can be clarified if the demand for givencomponents in the SMSA is considered to be segmented by workplace
. A good discussion of these problems can be found in Ingram et al. [13, pp. 18-22].Kain and Quigley (Chapter 2 and Appendix) consider an additive hedonic pricemodel in which each coefficient is composed of a production cost and a quasi-rentreflecting the degree of competition in the market..Schnare and Struyk [24] find little evidence of submarket segmentation for theBoston area, however.

474 ALLEN C. GOODMAN
considerations, discrimination or search costs, for example. Such seg-mented demand functions for individual components interact with rela-tively inelastic short-run supply functions to produce varying pricesamong submarkets. A long-run equilibrium price is seen to be the casewhere apjaC1nt is constant across all nand t.
Functional form of the hedonic price relationship has been conjecturalin treatment. Linear functions have often been useful, following bothfrom the notion of linear coefficients as shadow prices, and from theirsuitability in the estimation of demand elasticities of housing "character-istics."6 GriIiches [10] has considered a transformation proposed by Boxand Cox [3] as a systematic means for choosing among a set of functionalforms among which linear and log-linear are special cases.7
This transformation involves a search on as many as k + 1 elements ofthe vector of nonlinear parameters A, in a relationship such that
po - 1 k (3i= (30+ L:- (X/'i -1) + €.
Ao 1 Ai
As Aiapproaches 0, the function is continuous. Moreover, both the linearand log-linear forms can be seen as special cases of this general trans-formation. The case to be examined involves a search on AO,with all othervalues of Aset to one.8
Hypotheses of varying levels of rigor can be tested. A stronger assump-tion would hold that the true functional form is similar to the generaltransformation, and that proper estimation of A will complete the speci-fication. Weaker statements would concern the choice among variousspecifications; values not significantly different from zero would lead torejection of hypotheses of linearity, while values not significantly; differentfrom one would lead to rejection of the semi-log form.9
(3)
III. INDICES OF HOUSING PRICES
Although hedonic price methods were originally formulated to examinespecifically the measurement of quality controlled price changes, such
.Referring to an analysis introduced by Lancaster [I8, 19]. See also, King [15].7 These are by no means the only forms available. Lapham [20] considers others.8 To consider continuity, using I'HopitaI's Rule, differentiate the generalized func-
tion, (Y' -"-1 )/A). Its limit is In Y as Aapproaches zero. The case noted becomes a testof linear against semi-log form. Log-log transformations have been considered, yetappear to exhibit instabHities in the maximization of the relevant likelihood function.For further explanation of the general procedure see Box and Cox [3] and Zarembka[27]..A hypothesis somewhere by tween the two in rigor would reject both linearity andlog-linearity with a value of A significantly different from both zero and one. Thegeneral transformation using A can be manipulated to become:
Y = (1 + }.{fo + A~{f,X,)"1'
PRICE INDICES AND HOUSING MARKETS 475
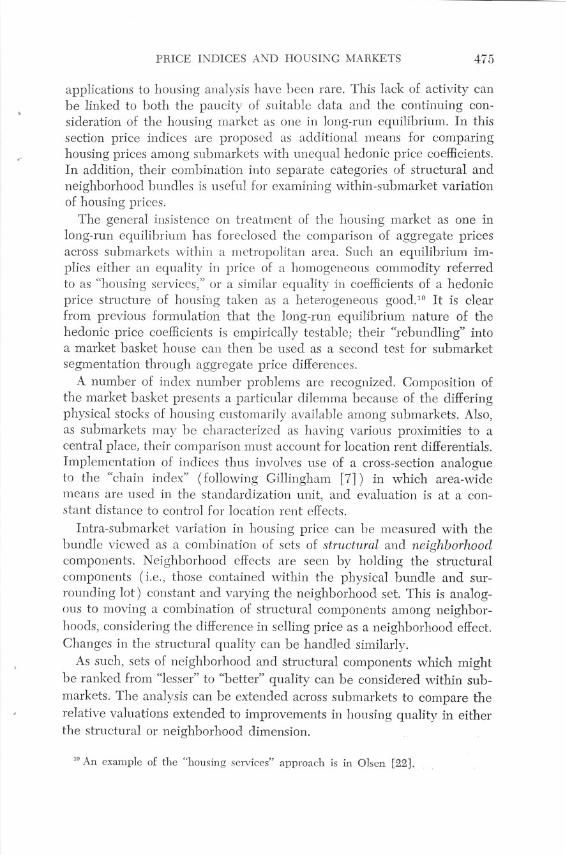
applications to housing analysis have been rare. This lack of activity canbe linked to both the paucity of suitable data and the continuing con-sideration of the housing market as one in long-run equilibrium. In thissection price indices are proposed as additional means for comparinghousing prices among submarkets with unequal hedonic price coefficients.In addition, their combination into separate categories of structural andneighborhood bundles is useful for examining within-submarket variationof housing prices.
The general insistence on treatment of the housing market as one inlong-run equilibrium has foreclosed the comparison of aggregate pricesacross submarkets within a metropolitan area. Such an equilibrium im-plies either an equality in price of a homogeneous commodity referredto as "housing services," or a similar equality in coefficients of a hedonicprice structure of housing taken as a heterogeneous good.lO It is clearfrom previous formulation that the long-run equilibrium nature of thehedonic price coefficients is empirically testable; their "rebundling" intoa market basket house can then be used as a second test for submarketsegmentation through aggregate price differences.
A number of index number problems are recognized. Composition ofthe market basket presents a particular dilemma because of the differingphysical stocks of housing customarily available among submarkets. Also,as submarkets may be characterized as having various proximities to acentral place, their comparison must account for location rent differentials.Implementation of indices thus involves use of a cross-section analogueto the "chain index" (following Gillingham [7]) in which area-widemeans are used in the standardization unit, and evaluation is at a con-stant distance to control for location rent effects.
Intra-submarket variation in housing price can be measured with thebundle viewed as a combination of sets of structural and neighborhoodcomponents. Neighborhood effects are seen by holding the structuralcomponents (i.e., those contained within the physical bundle and sur-rounding lot) constant and varying the neighborhood set. This is analog-ous to moving a combination of structural components among neighbor-hoods, considering the difference in selling price as a neighborhood effect.Changes in the structural quality can be handled similarly.
As such, sets of neighborhood and structural components which mightbe ranked from "lesser" to "better" quality can be considered within sub-markets. The analysis can be extended across submarkets to compare therelative valuations extended to improvements in housing quality in eitherthe structural or neighborhood dimension.
10 An example of the "housing services" approach is in Olsen [22J.

476 ALLEN C. GOODMAN
IV. EMPIRICAL FINDINGS ON REGRESSION MODELS
In this section, empirical analysis of hedonic price coefficients is pre-sented with special emphasis directed toward hypotheses concerning theindependence of hedonic price structures with respect to time and/orspace, and functional forms of the hedonic relationships. Application ofcovariance analysis to subsets of the metropolitan (entire SMSA) sampleyields significant differences in coefficients across both space and time.Examination of functional forms rejects hypotheses of linearity or log-linearity in the hedonic price relationships, while preserving the results ofearlier findings with regard to heterogeneity of coefficients.
The general strategy involves a sequential disaggregation of the database, in terms of time and submarket area. Although the conceptual modelis formulated in terms of temporally and spatially separate submarkets,determination of the separate nature of the coefficients is an empiricalmatter-hence, SMSA results are disaggregated to test the hypotheses.
The data base is a set of 1835 single family houses sold in the NewHaven SMSA from 1967 through 1969. Measures of school and neighbor-hood quality were added by King, and socio-economic dimensions werederived from the Census Bureau's First and Fifth Count block groupstatistics. These neighborhood aggregation units, typically 20 to 25%of the size of a census tract, add considerable explanatory power, overthe customary tract aggregation level.ll
Analysis of regression coefficients tests for their equality across bothspace and time; the null hypotheses are that entire sets of coefficients areequal. Stratification of the sample by year for either the SMSA or geo-graphically segmented submarkets leads to rejection of the null hypothesisof equality across time. Similar stratification by submarket for either the3-year period or separate years leads to rejection of the null hypothesisof equality across space. A final extention of the disaggregation of markets(Table 1) is a nested analysis of covariance by year and submarket. Thecomposite results confirm the finding of coefficient heterogeneity by timeand area for various submarket breakdowns.12 This leads to the rejectionof hedonic price coefficients as shadow prices of components in marketsthat are in long-run equilibrium.13
U For more detail on the housingsample,see King [16, Chapter 3]. Moreinforma-tion on bI'ock groups can be found in Goodman [8] and Bureau of Census [26]. Oneneighborhood variable that has been excluded is the property tax rate. Tests for itscapitalization into housing prices, on estimated coefficients, have revealed little sensi-tivityin the results presented.
12 Goodman [9J discusses methods for comparing alternative submarket breakdowns.'"Schnare and Struyk [24J inspect relative change in the standard error of estimate
(large changes imply heterogeneity), a procedure that reduces type II statistical error.Here, subsequent rebundling of the coefficients into indices provides a second test.
...
PRICE INDICES AND HOUSING MARKETS 477
TABLE 1
Nested Analysis of Covariance by Year and Submarket
..
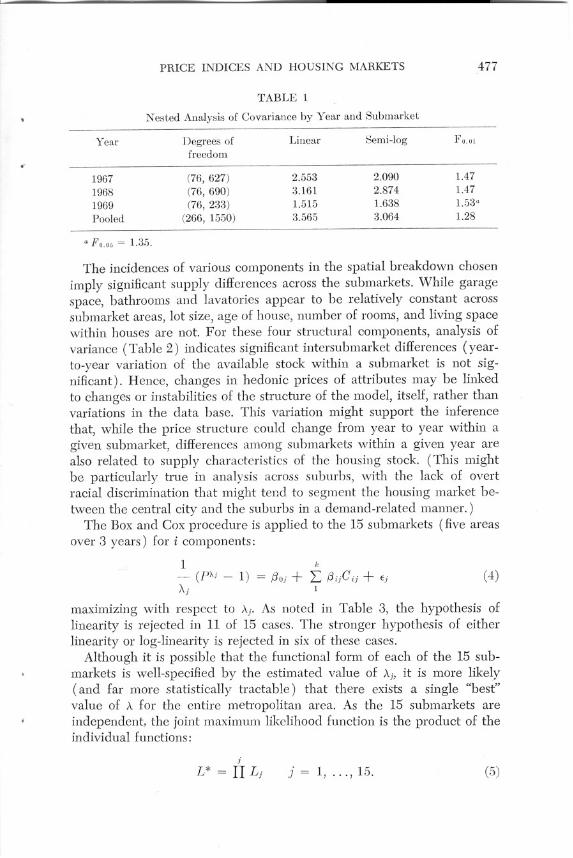
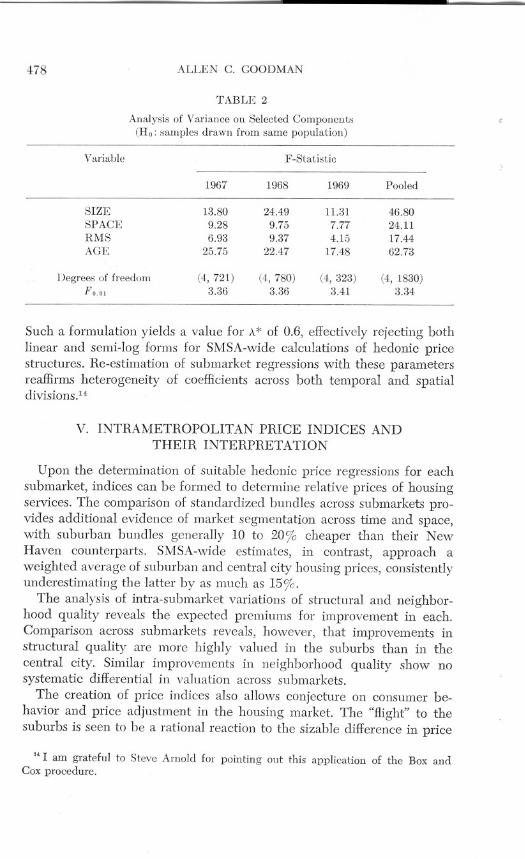
The incidences of various components in the spatial breakdown chosenimply significant supply differences across the submarkets. While garagespace, bathrooms and lavatories appear to be relatively constant acrosssubmarket areas, lot size, age of house, number of rooms, and living spacewithin houses are not. For these four structural components, analysis ofvariance (Table 2) indicates significant intersubmarket differences (year-to-year variation of the available stock within a submarket is not sig-nificant). Hence, changes in hedonic prices of attributes may be linkedto changes or instabilities of the structure of the model, itself, rather thanvariations in the data base. This variation might support the inferencethat, while the price structure could change from year to year within agiven submarket, differences among submarkets within a given year arealso related to supply characteristics of the housing stock. (This mightbe particularly true in analysis across suburbs, with the lack of overtracial discrimination that might tend to segment the housing market be-tween the central city and the suburbs in a demand-related manner.)
The Box and Cox procedure is applied to the 15 submarkets (five areasover 3 years) for i components:
1- (p., - 1) = {30j+A'J
maximizing with respect to Aj. As noted in Table 3, the hypothesis oflinearity is rejected in 11 of 15 cases. The stronger hypothesis of eitherlinearity or log-linearity is rejected in six of these cases.
Although it is possible that the functional form of each of the 15 sub-markets is well-specified by the estimated value of '\j, it is more likely(and far more statistically tractable) that there exists a single "best"value of A for the entire metropolitan area. As the 15 submarkets areindependent, the joint maximum likelihood function is the product of theindividual functions:
Ie
L {3ijCij + ~j1
(4)
j
L* = II Lj f = 1, ..,,15. (,5)
Year Degrees of Linear Semi-log Fo.Dlfreedom
1967 (76, 627) 2.553 2.090 1.47
1968 (76, 690) 3.161 2.874 1.47
1969 (76, 233) 1.515 1.638 1.53"
Pooled (266, 1550) 3.565 3.064 1.28
" Fo.D5= 1.35.
478 ALLEN C. GOODMAN
TABLE 2
Analysis of Variance on Selected Components(Ho: samples drawn from same population)
Variable F -Statistic
Such a formulation yields a value for .\.*of 0.6, effectively rejecting bothlinear and semi-log forms for SMSA-wide calculations of hedonic pricestructures. Re-estimation of submarket regressions with these parametersreaffirms heterogeneity of coefficients across both temporal and spatialdivisions.14
V. INTRAMETROPOLIT AN PRICE INDICES ANDTHEIR INTERPRETATION
Upon the determination of suitable hedonic price regressions for eachsubmarket, indices can be formed to determine relative prices of housingservices. The comparison of standardized bundles across submarkets pro-vides additional evidence of market segmentation across time and space,with suburban bundles generally 10 to 2°% cheaper than their NewHaven counterparts. SMSA-wide estimates, in contrast, approach aweighted average of suburban and central city housing prices, consistentlyunderestimating the latter by as much as 15%.
The anaIysis of intra-submarket variations of structural and neighbor-hood quality reveals the expected premiums for improvement in each.Comparison across submarkets reveals, however, that improvements instructural quality are more highly valued in the suburbs than in thecentral city. Similar improvements in neighborhood quality show nosystematic differential in valuation across submarkets.
The creation of price indices also allows conjecture on consumer be-havior and price adjustment in the housing market. The "Hight" to thesuburbs is seen to be a rational reaction to the sizable difference in price
1< I am grateful to Steve Arnold for pointing out this application of the Box andCox procedure.
1967 1968 1969 Pooled
SIZE 13.80 24.49 11.31 46.80SP ACE 9.28 9.75 7.77 24.11RMS 6.93 9.37 4.15 17.44AGE 25.75 22.47 17.48 62.73
Degrees of freedom (4,721) (4,780) (4,323) (4, 1830)Fo.o! 3.36 3.36 3.41 3.34

PRICE INDICES AND HOUSING MARKETS 479
TABLE 3
Box and Cox Tests Against Null Hypotheses of Linearity(Alt. hyp: semi-log form value of A, as noted)
Submarket
196719681969
Note: Tests performed on submarkets stratified by year. I, New Haven City; II,Western suburbs; III, Harnden; IV, Wallingford-Cheshire; and V, Eastern suburbs.
" If Ho: A = 1 is rejected at 5% level.
between the city and its suburbs. Also, price differentials appear to con-verge slightly in all bundles over the 3 years, but reach near-equality onlyin structures of high physical quality, implying that the market is moreunified and responds more quickly to price differentials than do themarkets for units of lesser physical quality housing.
As noted earlier, crucial elements in this analysis are the choice andweighting of the components of the standard bundle. As such comparisonsof price across sectors of a metropolitan region lead to difficulties analog-ous to those involving Paasch and Laspeyres indices in time series work,a cross-section analogue to the chain-link index, with component weightsaveraged among areas, is adopted. A related problem is the interpretationof a bundle composed of mean measurements of components (such as 1.24bathrooms or 0.65 fireplaces). The option of "constructing" houses withinteger weights, where appropriate, will be followed in the use of indices.
Griliches [11] notes that the construction of an index for a goodanalyzed with hedonic price methods, deals, in fact, with a distributionof sample means. If the standard error of estimate for a given observationis (J', and the number of houses in the sample is n, then the standard errorof the average index price of the sample wHI be (J'/vn. The appropriatesignificance test, then, for determining the differential effects upon ahousing bundle is the difference between sample means.
Three separate structures of physical components and three separateneighborhoods of neighborhood components are presented in Table 4 toconsider the effects of physical and neighborhood quality change. Theycan be roughly described as lower-middle, middle, and upper-middleclass conceptions of housing and neighborhoods; a matrix of the ninepossible combinations of structure-neighborhoods is constructed to revealinteractions among them. Analysis by geographic sector is displayed inTable 5a for two sets of indices representing New Haven (central city)
I II III IV V
0.7" 1.2 0.0" 0.0" 0.6"
0.6" 0.9 0.6" 0.0" 0.5"0.5" 0.8 0.1" 0.0" 1.1

SIZEBRICKHWGARAGERMSBATHLAVSP ACEFP
480
BLACKPOOREDUCTIPSCOREPCN
Also: Constant; distance, 3.5 miles; and SPDIS.Notes: SIZE, Lot size in square feet; BRICK, "1" if house is all brick; "0" otherwise;
H\V, "1" if hardwood floors; "0" otherwise; GAR, Number of covered garage spaces;AGE, Age of house in years ; RMS, Number of rooms excluding bathrooms, lavatories;BATH, Number of full bathrooms; LAV, Number of lavatories; SPACE, Indoor livingspace in square feet; SPDIS, Space X log (distance) X 0.001; FP, Number of fireplaces;BLACK, Percentage black population; POOR, Percentage families with income lessthan $5,000; EDUC, Percentage of population over age 25 with 13 or more years ofeducation; TIP, "1" if BLACK is greater than 5% and less than 15%; "0" otherwise;PCN, Principal components measure of neighborhood attitudes; Distance is in logarithms.
and its suburbs. Prices are evaluated at a distance of 3.5 miles from theCBD (corresponding roughly to New Haven's border with the suburbs)to control for location rents relative to the center of the city.'5
The results are surprising. The general trend for prices in the late1960's was upward and the inclusion of year dummies in a pooled modelyields a positive, significant coefficient for both 1968 and 1969, yet use ofseparately estimated models shows insignificant price increases in manyareas (indeed, declines in some sub markets ) in 1968, followed by risesin 1969. Furthermore, controIling for both structure and neighborhood
,. Sensitivity analysis to the composition of the index bundles reveals a stable rela-tionship in the results that follow. Neither do the findings appear to be sensitive tothe choice of distance for bundle valuation.
ALLEN C. GOODMAN
TABLE 4
Structure and Neighborhood Specifications
SI SII SIll
19,000 21,954 23,000No No NoYes Yes Yes
2 1 135 30 25
6 7 71 1 20 1 1
1,350 1,441 1,5000 1 0
NI NIl NIlI
6 4 28 8 5
25 30 35Yes No No
60 75 85-0.2 0.3 0.7
PRICE INDICES AND HOUSING MARKETS 481
TABLE 5
Structure-Neighborhood Indicesa(New Haven/Suburbs)
a. Submarket estimates.
SII 196719681969
SI 196719681969
SIll 196719681969
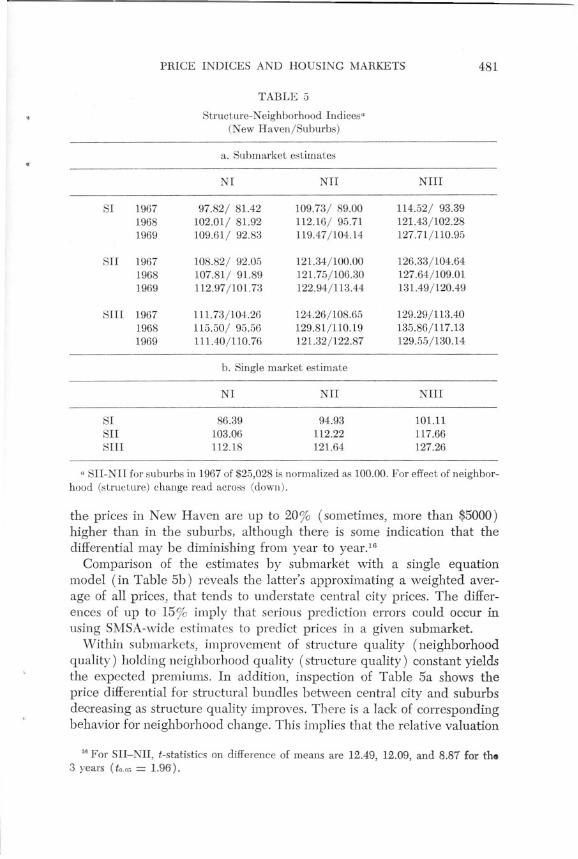
a SII-NII for suburbs in 1967 of $25,028 is normalized as 100.00. For effect of neighbor-hood (structure) change read across (down).
the prices in New Haven are up to 20% (sometimes, more than $5000)higher than in the suburbs, although there is some indication that thedifferential may be diminishing from year to year!6
Comparison of the estimates by submarket with a single equationmodel (in Table 5b) reveals the latter's approximating a weighted aver-age of all prices, that tends to understate central city prices. The differ-ences of up to 15% imply that serious prediction enol'S could occur inusing SMSA-wide estimates to predict prices in a given submarket.
Within submarkets, improvement of structure quality (neighborhoodquality) holding neighborhood quality (structure quality) constant yieldsthe expected premiums. In addition, inspection of Table 5a shows theprice differential for structural bundles between central city and suburbsdecreasing as structure quality improves. There is a lack of correspondingbehavior for neighborhood change. This implies that the relative valuation
1. For SII-NII, t-statistics on difference of means are 12.49, 12.09, and 8.87 for tho3 years (t = 1.96).
NI NIl NIII
97.82/ 81.42 109.73/ 89.00 114.52/ 93.39102.01/ 81.92 112.16/ 95.71 121.43/102.28109.61/ 92.83 119.47/104.14 127.71/110.95
108.82/ 92.05 121.34/100.00 126.33/104.64107.81/ 91.89 121.75/106.30 127.64/109.01112.97/101.73 122.94/113.44 131.49/120.49
111.73/104.26 124.26/108.65 129.29/113.40115.50/ 95.56 129.81/110.19 135.86/117.13111.40/110.76 121.32/122.87 129.55/130.14
b. Single market estimate
NI NIl NIII
Sl 86.39 94.93 101.11SII 103.06 112.22 117.66SIll 112.18 121.64 127.26
482 ALLEN C. GOODMAN
of physical improvements is greater in the suburbs than in the central city;neighborhood improvements appear to be constantly valued in bothsubmarkets.
In view of the substantial price differentials between city and suburbsit would seem that the well-documented £light to the suburbs was arational one. The sizable fall in the cost of housing services as well as thepossibility of an expected capital gain from an "undervalued" suburbanasset, could be seen to outweigh the frictions in the market such as mov-ing and closing costS.11The segmented nature of the metropolitan hous-ing market (both in demand and supply relationships), as well as theheterogeneous nature of the good (which may make explicit comparisondifficult) may allow such differentials to exist and persist, even in theface of substantial mobility.'s
Price differentials seem to disappear for SIll structures, regardless ofneighborhood quality, by the third year of the sample, indicating a moreunified market than for structures of lesser quality. This would implythat the market adjusts more quickly for this category of housing qualityeither because of better information among the buyers about the good,or because the transactions costs fall as a percentage of the price asquality improves, reducing the impact of market frictions.
That similar neighborhood improvements do not appear to decreasethe differential is puzzling in this context. Perhaps the specmcation ofneighborhood quality is incomplete without such dimensions as crimea.nd pollution (included only marginally in the principal componentsmeasure). Assuming that both would be more prevalent in New Haventhan in the suburbs, their omission would understate the price differential,reinforcing, incidentally, the explanation of movement to the suburbs.Improvement of neighborhood quality in the well-specified model, how-ever, might narrow the differential in a manner similar to the improve-ment of structural quality.
CONCLUSIONS
This study appears to clarify several aspects of housing analysis usinghedonic prices, with respect to market segmentation, functional form andbehavior of prices within submarkets. In positing various spatially andtemporally separate submarkets, covariance analysis indicates heterogene-ity of coefficients. These coefficients, when rebundled with standardizedhousing packages, reveal significant price differences between submarkets
11 Literature on "flight to the suburbs" includes Bradburn et al. [4], and Bradfordand Kelejian [5]. Market frictions are discussed in Maisel [21].
,.Straszheim [25] notes that households appear to have strong preferences for lotsize and age of housing, in particular.
..
PRICE INDICES AND HOUSING MARKETS 483
.that are obscured by single market assumptions and estimation pro-cedures.
The often used linear functional form is found to be overly restrictive.Consideration of other forms with the procedure developed by Box andCox indicates that a multiplicative form is generally preferable. Maxi-mization of a joint likelihood function over independent submarketsreveals the proper functional form for the SMSA as a whole.
Intrametropolitan examination of structural and neighborhood qualityreveals that the relative valuation of physical improvements in housing issmaller in the central city than in the suburbs, while the relative valuationof improved neighborhoods is relatively constant. Price adjustment pro-cesses imply that markets are more unified with respect to structural thanneighborhood quality, but that the process is slow and generally in-complete for the entire metropolitan housing market. Movement fromcity to suburb is seen to be a rational reaction to the sizable differencesin price between the two submarkets.
In general, then, it appears that hedonic price methods can be appliedto separate parts of metropolitan areas to measure price differences bothwithin and among such submarkets. In that there are several well-recog-nized impediments to housing price uniformity related to spatial criteria,judicious subdivision of the metropolitan market reveals valuable informa-tion about price variation within the metropolitan area. Although singleequation models can give serviceable answers about prices, on average,separate equations may offer more insight into the important short-runbehavior of markets within the metropolitan area.
.
REFERENCES
,
1. W. C. Apgar Jr., Census data and housing analysis: Old data sources and newapplications, Conference on the Economics of Residential Location and UrbanHousing, Cambridge, Massachusetts (1975).
2. M. J. Ball, Recent empirical work on the determinants of relative house prices,Urban Stud., 10, 213-31 (1973).
3. G. E. P. Box and D. R. Cox, An analysis of transformations, /. Royal Statist. Soc.,B26, 211-43 (1964).
4. N. Bradburn, S. Sudman, and G. Gockel, "Side by Side," Quadrangle, Chicago(1971).
5. D. E. Bradford and H. H. Kelejian, An econometric model of the Hight to thesuburbs, /. Polito Econ., 81, 566-89 (1973).
6. A. T. Court, Hedonic price indexes with automotive examples, in "The Dynamia;of Automobile Demand," General Motors, New York (1939).
7. R. Gillingham, Place to place rent comparisons, Anal. Econ. Soc. Measurement,4, 153-74 (1975).
8. A. C. Goodman, A comparison of block group and census tract data in a hedonichousing price model, Land Econ., 53, 483-487 (1977).

484 ALLEN C. GOODMAN
9. A. C. Goodman, "Neighborhood Effects, Hedonic Prices and the ResidentialHousing Choice," Ph.D. dissertation, Yale University (1976).
10. Z. Griliches, Hedonic price indexes revisited, in "Price Indexes and QualityChange" (Griliches, Ed), Harvard, Cambridge, Massachusetts (1971).
11. Z. Griliches, Hedonic price indices for automobiles: an econometric analysis ofquality change, in "Price Indexes and Quality Change" (Griliches, Ed.),Harvard, Cambridge, Massachusetts (1971).
12. Z. Griliches, Ed., "Price Indexes and Quality Change," Harvard, Cambridge,Massachusetts (1971) .
13. G. Ingram, J. F. Kain, and J. R. Ginn, "The Detroit Prototype of the NBERUrban Simulation Model," National Bureau of Economic ;Research, New York( 1974).
14. J. F. Kain and J. M. Quigley, "Housing Markets and Racial Discrimination,"Columbia, New York (1975).
15. A. T. King, The demand for housing: a Lancastrian approach, in "HouseholdProduction and Consumption" (Terleckyj, Ed.), Columbia, New York (1975).
16. A. T. King, "Property Taxes, Amenities and Residential Land Values," Ballinger,Cambridge, Massachusetts (1974).
17. I. B. Kravis and R. E. Lipsey, International price comparisons by regressionmethods, in "Price Indexes and Quality Change" (Griliches, Ed.), Harvard,Cambridge, Massachusetts (1971).
18. K. J. Lancaster, "Consumer Demand: A New Approach," Columbia, New York(1971 ).
19. K. J. Lancaster, A new approach to consumer theory, J. Polito Econ., 74, 132-57(1966) .
20. V. Lapham, Do blacks pay more for housing?, J. PolitoEcon., 79, 1244-57 (1971).21. S. Maisel, "Financing Real Estate," U. California, Berkeley (1965).22. E. O. Olsen, A competitive theory of the housing market, Amer. Econ. Rev., 59,
612-22 (1969).23. S. Rosen, Hedonic prices and implicit markets: product differentiation in pure
competition, J. PolitoEcan., 82, 34-55 (1974).24. A. B. Schnare and R. J. Struyk, Segmentation in urban housing markets, J. Urb.
Econ.,3, 146-66 (1976).25. M. R. Straszheim, "An Econometric Analysis of the Urban Housing Market,"
Columbia, New York (1975).26. U. S. Bureau of the Census, "Census Use Study: Health Information System II,
Report No. 12," Washington (1971).1.7. P. Zarembka, Transformations of variables in economics, in "Frontiers in Econo-
metrics" (Zarembka, Ed.), Academic Press, New York (1974).
f.
l"J'"',
- -'7