Embed Size (px)
Citation preview
HEDGING WITH DERIVATIVES IN THE OIL INDUSTRY
Salahedden Moftah Gadmor Bachelor of Business Economics, Brock University 2004
PROJECT SUBMITTED IN PARTIAL FULFILLMENT OF THE REQUIREMENTS FOR THE DEGREE OF
MASTER OF ARTS
In the Faculty
of Business Administration
Financial Risk Management Program
O Salahedden Gadmor 2006
SIMON FRASER UNIVERSITY
Fall 2006
All rights reserved. This work may not be reproduced in whole or in part, by photocopy or other means, without permission of the author.
APPROVAL
Name:
Degree:
Title of Project:
Salahedden Gadmor
Master of Arts
Hedging with Derivatives in the Oil Industry
Supervisory Committee:
Dr. Geoffrey Poitras Senior Supervisor Professor
Date Approved:
Dr-George Blazenko Second Reader Associate Professor
SIMON FRASER U N I W R S I ~ brary
DECLARATION OF PARTIAL COPYRIGHT LICENCE
The author, whose copyright is declared on the title page of this work, has granted to Simon Fraser University the right to lend this thesis, project or extended essay to users of the Simon Fraser University Library, and to make partial or single copies only for such users or in response to a request from the library of any other university, or other educational institution, on its own behalf or for one of its users.
The author has further granted permission to Simon Fraser University to keep or make a digital copy for use in its circulating collection (currently available to the public at the "Institutional Repository" link of the SFU Library website <www.lib.sfu.ca> at: ~http:llir.lib.sfu.calhandlell8921112>) and, without changing the content, to translate the thesislproject or extended essays, if technically possible, to any medium or format for the purpose of preservation of the digital work.
The author has further agreed that permission for multiple copying of this work for scholarly purposes may be granted by either the author or the Dean of Graduate Studies.
It is understood that copying or publication of this work for financial gain shall not be allowed without the author's written permission.
Permission for public performance, or limited permission for private scholarly use, of any multimedia materials forming part of this work, may have been granted by the author. This information may be found on the separately catalogued multimedia material and in the signed Partial Copyright Licence.
The original Partial Copyright Licence attesting to these terms, and signed by this author, may be found in the original bound copy of this work, retained in the Simon Fraser University Archive.
Simon Fraser University Library Burnaby, BC, Canada
Revised: Fall 2006
ABSTRACT
This purpose of this study is to examine the derivative use by 15 US-Oil producing companies.
This study tries to determine whether the release of SFAS No 1331138 by the federal accounting
standard Board has affected hedging product choice and strategies of oil producing companies. In
addition, this study attempt to evaluate the connection between firm characteristics and risk
management strategies in order to determine which type of firm characteristic plays a role in the
oil producing companies risk management decisions. This study verifies that SFAS 1 3311 38 does
not affect financial disclosure, derivative hedging strategies for oil companies. Moreover, some
Firm characteristics play a main role in the decision to engage in derivatives.
Keywords: oil derivatives; oil swaps; oil futures; oil price risk; oil currency risk; oil hedging.
l o my Dadand Nom. Words can never evress my gratitude to you.
ACKNOWLEDGEMENTS
I would like to thank all the people who helped me along this Journey. Thank you to
Dr.Geoffrey Poitras for your help, Guidance and encouragement. Thank you also to
Dr. Goerge Blazenko for providing me with a thorough suggesting and comments. To my parents
thank you for your continuous support and unconditional love. To my sisters, thank you for your
motivations and moral supports. Finally, to all my friends, especially Yasser and Amjad, it was
your friendship and help that kept me inspired.
A special thank you to kyong souk, Abdulgani, and Tawfik. For your help and support.
TABLE OF CONTENTS
. . Approval .......................................................................................................................................... 11
... Abstract ......................................................................................................................................... 111
Dedication ...................................................................................................................................... iv
Acknowledgements ......................................................................................................................... v
Table of Contents .......................................................................................................................... vi ...
List of Figures and Tables ......................................................................................................... VIII
1 Introduction and Background ............................................................................................. 1 1.1 Literature review of the oil industry ............................................................................... 1 1.2 History of oil prices (1985 -2006) .................................................................................... 3
The Main Four Classifications of Crude Oil ......................................................................... 6
Risk Management .................................................................................................................... 8
Risk Exposures for Oil Companies ...................................................................................... 11
.............................................................................................. The Impact of Supply Drivers 13
............................................................................................ The Impact of Demand Drivers 16 ................................................................................................... 6.1 The convenience yield 16
.................................................................................................................... 6.2 Seasonality 18
Derivatives Usage in the Oil Market ............................................................................. 19 .......................................................................................... 7.1 Exchange traded derivatives 20
............................................................................................................ 7.2 OTC derivatives 21 ..................................................................................... 7.3 Oil financial exchange markets 22
.......................................................................................................... 7.4 Forward contracts 23 ............................................................................................................. 7.5 Futures contract 25
............................................................................................................... 7.6 Energy options 29 7.7 Swaps ............................................................................................................................ 31
Relationship between the Spot, ForwardlFutures Prices and the Convenience Yield ........................................................................................................... 35
Basis Risk ................................................................................................................................ 38
.......................................................................................................... Data and Methodology 40
....................................................................................................... Derivative Use Overview 41
Risk Management Compliance with SFAS No 1331138 ..................................................... 43
Firm Characteristics and Risk Management ...................................................................... 44 1 3.1 Firm size ........................................................................................................................ 44
........................................................................................................................ 1 3.2 Liquidity 45
........................................................................................................................ 13.2 Leverage 46
Derivative Use for Oil Price Risk ......................................................................................... 47
15 Derivative Use for Foreign Currency Risk .......................................................................... 48
16 Derivative Use for Interest Rate Risk .................................................................................. 49
17 Conclusion .............................................................................................................................. 50
Appendix 1 : Sample Firms ......................................................................................................... 51 Sample f m s with derivative use ............................................................................................. 51 . . Sample firms with no denvative use ........................................................................................ 51
Appendix 2: Derivative Instrumental Use ................................................................................ 52
Appendix 3: Ratios & SFAS 1381133 .......................................................................................... 53
................................................................................................................................... Appendix 4: 54
.................................................................................................................................... Appendix 5 55
Appendix 6 ............................................................................................................................... 56
References ..................................................................................................................................... 57 Works Cited ............................................................................................................................. 57 Companies Researched ............................................................................................................ 57
vii
LIST OF FIGURES AND TABLES
Figure 1
Figure 2:
Figure 3:
Figure 4:
Figure 5:
Table 1
Table 2
History of oil prices ...................................................................................................... 5
....................................................................................... Term structure of oil futures 14
......................................................................................................... Crude oil futures 17
Cash flow of an oil price swap ................................................................................... 33
Derivatives used for Oil price Risk ............................................................................. 47
.................................................................................. The convenience yield formula 16
.......................................................................................................... Futures example 26
1 INTRODUCTION AND BACKGROUND
1.1 Literature review of the oil industry
The trading environment of the oil market is inherently unstable, with geology,
geopolitics, economics, law, taxation, finance, technology, and environmental concerns
having a strong impact at anytime on the evolution of the market structure. Some of the
main risk factors of the oil industry, such as geological risk, can be reduced by using
modem techniques and the latest technologies, but can never be completely managed.
Historically, this encouraged risk managers of the oil industry to focus on the relationship
between time and price. It takes several years and huge investments to produce crude oil
from an oil field. In addition, it takes several weeks and sound logistics to deliver the
extracted oil to the end consumers. This forms the backdrop to the growth in risk
management of the oil industry.
The fundamental pricing environment for oil transactions has undergone major changes
since the large jumps of the 1970's. The shift in production assets ownership from major
oil companies to producing countries and national companies, through different forms of
nationalization, marked the beginning of an open market. For most companies, this meant
that they could no longer simply transfer risk and added value vertically along different
steps of the oil supply.
The supply and demand equilibrium in the oil market has been strongly influenced by the
physical oil market. Oil companies and oil importing countries often consider the oil
market as a kind of dynamic counterweight to the dominance of producing countries or
more precisely, Organization of the petroleum producing countries (OPEC). As the oil
market developed, it transformed from a primarily physical market into a financial
market. This has attracted many participants, such as banks and hedge funds managers. In
particular, retail and institutional investors hoping to increase their yield through price
movements, or reduce their credit exposure by using oil as collateral, has dramatically
increased their presence in the futures market.
Since oil is a non-standard commodity, the industry has chosen a small number of
reference or market grades of crude oil to be the physical basis of a much more
sophisticated financial market that involves derivatives instruments such as forwards and
futures contracts. A large volume of activity is thus concentrated through a small number
of the trading instruments to deal with the price risk. This price differential has shaped
the pricing of different grades, locations, and delivery periods. Although, their physical
base is rather small compared to the overall production, free oil market has become a
main factor in the pricing mechanism of the short to medium term crude oil and refined
products. Consequently, the free oil market has played a significant role as seen by events
including the Gulf crisis of 1990 and the price drop of 1998.
Nowadays, the world consumption of oil exceeds $500 billion annually. In addition,
crude oil is the most active trading commodity that accounts for 10% of the total world
trade. The oil industry stems its importance mainly from the crucial and strategic role it
plays in the economies of oil exporting countries as well as oil consuming countries. In
oil exporting countries, oil prices drive revenue by a large number that could exceed
2
20% of the domestic GDP. On the other hand, the cost of oil imports for oil consuming
countries has a strong impact on the growth of the economy. Energy price shocks have
often been cited as causing adverse macroeconomic impacts on aggregate output and
employment in countries across the world.
1.2 History of oil prices (1985 -2006)
In 1947, crude oil was priced around $2.27US per barrel. Then it exceeded $12.00 US per
barrel as a result of war or conflicts in the Middle East in 1973. The events that caused a
major price shock during the last century were the 1973 Arab oil embargo, the Iraq-Iran
conflict of 1979, and the 1990 invasion of Kuwait.
Oil prices stayed in the range of $2.50 US to $3 US from 1947 to 1972. Then, these oil
prices jumped from $3 US in 1972 to $12 US in 1973. This substantial rise was due to the
Yum Kipper war in the Middle East. This was followed by the Iraq-Iran war that caused
oil prices to double, from $14 US per barrel in 1978 to $35 US per barrel in 1981.
However, the ensuing world recession and development of alternative energy resources
led to a decrease in demand and falling prices for most of the 1980's. Efforts by OPEC to
set production quotas, as an attempt to shore up prices, were largely unsuccessful and
were met by nations routinely violating these limits. As an example, in 1986,
Saudi Arabia increased production by 2 MMBPD to 5 MMBPD, causing oil prices to
plummet below $1 0 US per barrel.
In 1991, due to the Iraqi invasion of Kuwait, oil prices surged. However, it retreated in
the face of an US-led military resolution and the market saw increased supply by other
3
nations such as Saudi Arabia. Recession in the US saw a price decline until 1994 when
inflation adjusted prices hit their lowest level since 1973. Subsequently, a strong US
economy and growth in Asia led to an increase in the demand of world petroleum. for
example, demand grew 2.8% in 1995 and 2.2% in 1996. This caused the price of oil to
increase by $6US per barrel over the course of that year. Despite Iraq's re-entry into the
oil world market in December 1996, the price recovery continued well into 1997, until
the sharp downturn by the Asian economic crisis occurred.
Crude oil prices on the nearest futures chart in 2005 extended the rally that started in
2002 and posted a record high of $70.85 US in early September of 2005. Oil prices
rallied in the first half of the year based on strong demand, the second Iraq war, flat
production, and speculative buying. Crude oil demand in 2005 remained very strong, due
in large part to torrid GDP growth in China, and reached a record high of 86.2 million
barrels per day by the end of 2005.
Hurricane Katrina hit the Gulf of Mexico on August 29th, 2005. Consequently, oil prices
surged after the devastation caused by Katrina, but this turned out to be the year's peak as
oil prices dropped off sharply in late September through December. Oil prices were able
to fall in late 2005, despite the shut down of crude oil production in the Gulf of Mexico
because of a drop in demand and a large increase in petroleum supply. Crude oil prices
stabilized in December 2005 and then started to rally up in January 2006 as concern grew
regarding reduced Nigerian oil production due to rebel attacks and the increasingly tense
standoff with Iran about its nuclear research intention.
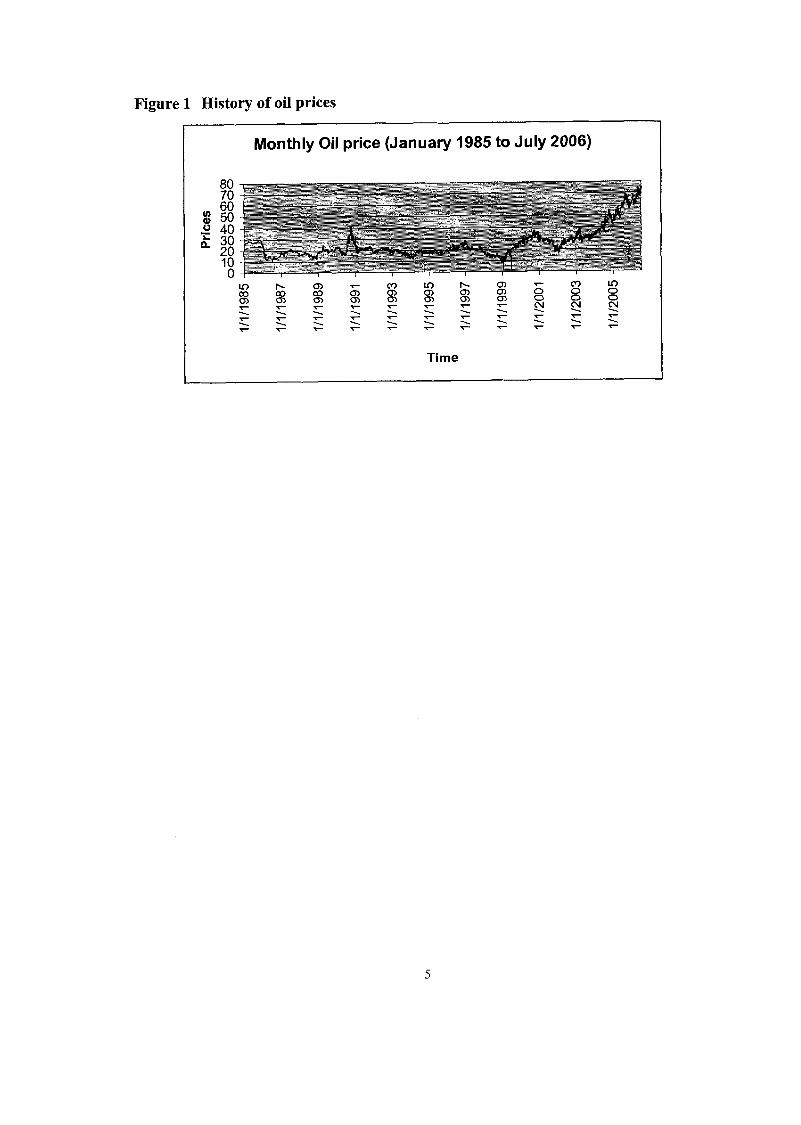
Figure 1 History of oil prices
Monthly Oil price (January 1985 to July 2006)
Time
2 THE MAIN FOUR CLASSIFICATIONS OF CRUDE OIL
The oil industry classifies crude oil by the location of its origin (e.g. West Texas
Intermediate or Brent) and often by its relative weight (light, intermediate, or heavy).
Refiners may also refer to it as "sweet", which means it contains relatively little sulfur, or
as sour, which means it contains a substantial amount of sulfur and requires more
specifications to meet current product specifications. The four main oil reference are:
1) West Texas Intermediate (WTI): also known as Texas sweet light. This is the crude
that is used as a benchmark in oil pricing and the underlying commodity of New York
Mercantile Exchange's Oil futures contract.
2) Brent crude: Comprising of 15 oils, from fields in the Brent, and ninian systems in the
east Shetland basin of North Sea. It is a light and sweet crude oil, but not as light and
sweet as WTI.
3) Dubai: used as a benchmark for Middle East oil flowing to the Asia Pacific Region.
4) OPEC Basket: It reflects the characteristics of the oil produced by OPEC members.
The OPEC Reference Basket (ORB) is made up of the following: Saharan Blend
(Algeria), Minas (Indonesia), Iran Heavy (Islamic Republic of Iran), Basra Light
(Iraq), Kuwait Export (Kuwait), Es Sider (Libya), Bonny Light (Nigeria), Qatar
Marine (Qatar), Arab Light (Saudi Arabia), Murban (UAE) and BCF 17 (Venezuela).
References to oil prices are usually to the spot price of either WTIILight Crude as traded
on New York Mercantile Exchange (NYMEX) for delivery in Cushing, Oklahoma; or to
the price of Brent as traded on the Intercontinental Exchange (ICE) for delivery at Sullom
Voe. Based on 2005 price movements, WTI is about $1.6 more than Brent, $5.13 more
than OPEC Basket. And 6.93 more than Dubai.
3 RISK MANAGEMENT
Risk managers have implemented hedging strategies using derivative instruments such as
forwards, futures and options or swaps. The objectives of these strategies include
protecting budgets, inventories or as a tool to project financing. These approaches have
mainly focused on eliminating financial risk exposure, as opposed to increasing return.
According to many studies, risk management and eliminating risk are driven by two main
theory motives:
1) Maximizing shareholder's wealth
2) Maximizing marginal utility for managers
Maximizing shareholder's wealth argues that firms hedge to reduce the various costs
involved with highly volatile cash flows. There are three lines of explanation associated
with this theory. First, hedging reduces the expected cost of financial distress
(Mayers and Smith 1982). Second, hedging may also be motivated through tax
incentives. When firms face a convex tax function, hedging can help reduce expected
taxes. In addition, hedging can also increase a firm's debt capacity, resulting in a greater
tax advantage from greater leverage (Leland 1998). Finally, hedging can also help relieve
the problem of underinvestment, when a firm may have many growth opportunities and
external financing is more expensive than internally generated funds (Foot, Scharfstein,
and Stein 1993). The maximizing marginal utility hypothesis states that by making risk
management policy decisions along with using corporate resources, managers can
diversify their personal wealth at the corporate level andlor signal their high performance
8
on the job. According to Stulz (1984), risk-averse managers engage in hedging if their
wealth and human capital are concentrated in the firm they manage and if they find the
cost of hedging on their own account is higher than the cost of hedging at the firm level.
Many attempts were made to identify which theory better explains actual hedging
activities based on the firm's characteristics; however, results were mixed. For example,
risk management activities were found to be more prevalent in large firms than in small
firms. This result contradicts the common thinking that small firms are more likely to
hedge because they are more likely to experience financial distress. However, hedging
seems to be driven by economies of scale, reflecting the high fixed costs of establishing
risk management programs. Another report by Haushalter (2002), found a positive
significant relationship between hedging and leverage, which is consistent with the theory
that hedging reduces financial distress.
Overall, there is mixed support for the value maximizing theory. Mian (1 996) surveys the
implications and reports that the only reliable observation is that hedging firms tend to be
larger. Also, Tufano (1996) examined the hedging activities on the gold industry and
found no support for value maximization theory. However, he found strong evidence
supporting the managerial risk aversion theory, in which mangers, who hold more stock,
tend to undertake more hedging activities.
Recent researches have been examining the direct relationship between firm value and
hedging. Some researchers, such as Allayannis and Weston, have supported the theory of
increasing firm value with hedging. In their study, They have found that the market value
9
(MV) of firms using foreign currency derivatives is 5% higher on average than for the
market value of nonusers. On the other hand, others like Jin and Jorion (2006), find that
hedging does not seem to affect MVs for this industry. Jin and Jorion in their paper
studied the hedging activities of 119 US Oil and gas producers from 1998 to 2001 and
examine the relation between hedging and firm value. They examined the relation
between stock return sensitivity to commodity prices and hedging. Since market
recognizes the effect of hedging, they tested if the market rewards firms that hedge with
higher MV7s, as measured by using different definitions of Tobin's Q. Tobin Q is
generally defined as the ratio of the MV to the replacement value of assets, where the
latter is usually measured as the book value (BV) of assets. In addition, they used the
current value of reserves both before and after extraction costs, which yields more precise
estimates of the replacement value of assets. Contrary to previous research, Jin and Jorion
showed that hedging has no discernible effect on firm value for oil and gas producers.
4 RISK EXPOSURES FOR OIL COMPANIES
I will outline below the risks that are integral and specific to the oil industry; however,
we need to acknowledge that some oil companies have to devise strategies that take into
consideration other kinds of risk that are associated with their internal operations.
1) Commodity price risk: for oil companies, commodity price risk is the crude oil
price risk. This risk arises significantly when companies engage in contracts to sell or
buy the crude oil in the future. Oil price movements can significantly affect the
operation, asset value, cash flow, potential revenue and profits of oil companies. Oil
price changes can be attributed to numerous factors beyond the company's control.
This can include expected inflation rate, interest rate changes, strength of some major
currencies, some political and economic events, demand and supply of the crude oil.
Oil companies use a wide range of derivatives to mitigate unexpected price
movement effects on cash flow and earnings. These instruments are aimed to secure
a predictable cash flow that can assist in planning and forecasting future revenues,
thus ensure that the financial commitments can be met and profitable projects can be
carried out.
Foreign exchange rate risk: this is one of the most important kinds of risk exposure
for oil companies. When hedging oil price risk, an exchange rate risk may be
incurred, because most contracts are traded in or indexed to the US dollar. Many
European end-users actually pay their energy supplies in Euros, and consequently,
they become highly sensitive to any lack of correlation between currencies and
between the currency market and the oil market. Most oil companies have their
operations, development activities and investments across countries; therefore, they
generate revenues and incur costs in different currencies. This makes cash flow from
operations greatly affected by the fluctuation in foreign currency exchange rates.
3) Interest rate risk: this risk refers to the variability of the value of the firm resulting
from interest rate changes. These fluctuations would have a strong effect on long-
term debts, financing costs, cash balances and forward contract hedging. A
significant prolonged decrease in interest rates could have a strong impact on the
difference between the forward oil price over the current spot price, and ultimately,
the realized price under new forward oil price contracts engaged by the company.
4) Credit risk: this is the risk that a loss will be experienced because of default by the
counterpart in the derivative transaction. Also, it expresses the exposure of the
forward cash flow and deferred payments to market risks. It must be considered with
regard to: the risk component of the underlying index (for example, volatility,
correlation, liquidity); the maturity and type of the instruments, for example, short-
term versus long-term, buying versus selling, swap versus option; and the relative
level of the market.
THE IMPACT OF SUPPLY DRIVERS
Crude oil function with supply that does not exist in money markets: production and
storage. This would require consideration of the long term effects, which have to do with
expected market production capacity and cost in the long run. Historical data will not
show the effect that expected technology improvements (such as drawing crude oil from
the ground) have on the market; however, the effect may be expressed by knowledgeable
traders in determining forward prices.
The crude oil's storage limitation problem creates volatile day-to-day behavior. Another
consequence of limited storage is that while spot prices exhibit high volatility, the
forward prices show volatilities that decrease significantly as the forward price expiration
increases. The latter volatility characteristic has to do with the fact that in the long run we
expect the supply and demand to be balanced, resulting in long-term forward prices that
reflect this relatively stable equilibrium price level. See the figure 2 below.
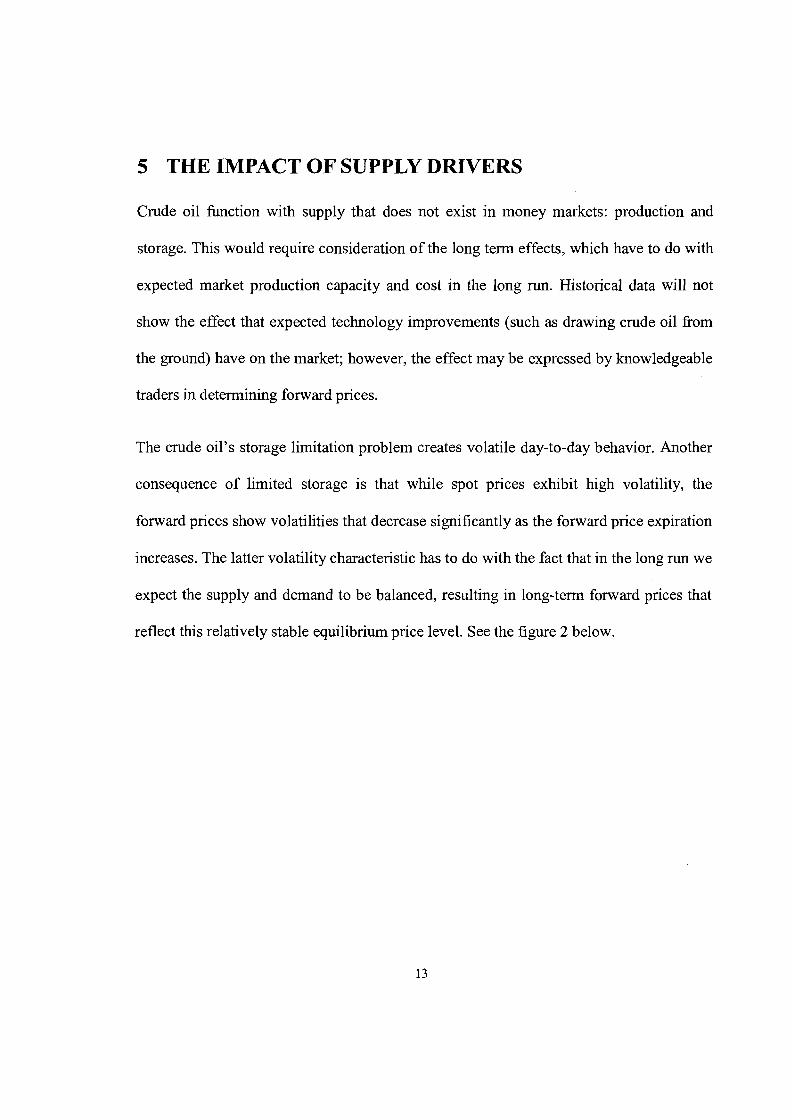
Figure 2: Term structure of oil futures
Term structure of Light sweet crude oil Futures prices (Dec 2006- Dec 2008)
I Maturities
From Figure (2), we can see that the future prices of crude oil went through relative
considerable changes from December 2006 to almost February 2008, rising from 60.36 to
67.81. After that, futures have become more stable with changes that were relatively
unsubstantial , rising from 67.92 in March 2008 to 68.08 in December 2008.
Ultimately, when discussing movements in the price of oil, it is essential to confront the
issue of storage capacity. Storage limitations cause oil markets to have higher spot price
volatility than is seen in money markets.
Overall, the issue of storage accounts for oil prices exhibiting a spilt personality. Oil
prices are driven both by the short-term conditions of storage and by the long term
conditions of future potential oil supply. Oil forward prices reflect these two drivers,
resulting in short-term forward prices with very different behaviour from long-term
forward prices. Short-term forwards reflect oil currently in storage; while the long-term
forward prices exhibit the behavior of future potential oil - i.e. oil in the ground.(Dragana
Pilipovic, Energy Risk, 1998).
6 THE IMPACT OF DEMAND DRIVERS
In the oil market, demand drivers introduce the issue of convenience yield and
seasonality that have no parallel in the money market.
6.1 The convenience yield
An oil refiner is unlikely to regard a future contract on crude oil in the same way as crude
oil held in inventory. The crude oil in inventory can be input to the refining process,
whereas, a future contract cannot be used for this purpose. Thus, the ownership of the
physical asset enables the company to keep a production process running and perhaps
profit from temporary local shortages. A futures contract does not do the same. The
benefits from holding the physical assets are sometimes referred to as the convenience
yield provided by the commodity. If the dollar amount of storage costs is known and has
a present value of U, according to John C. Hull (Options, futures, and Other derivatives)
the convenience yield y is defined such that:
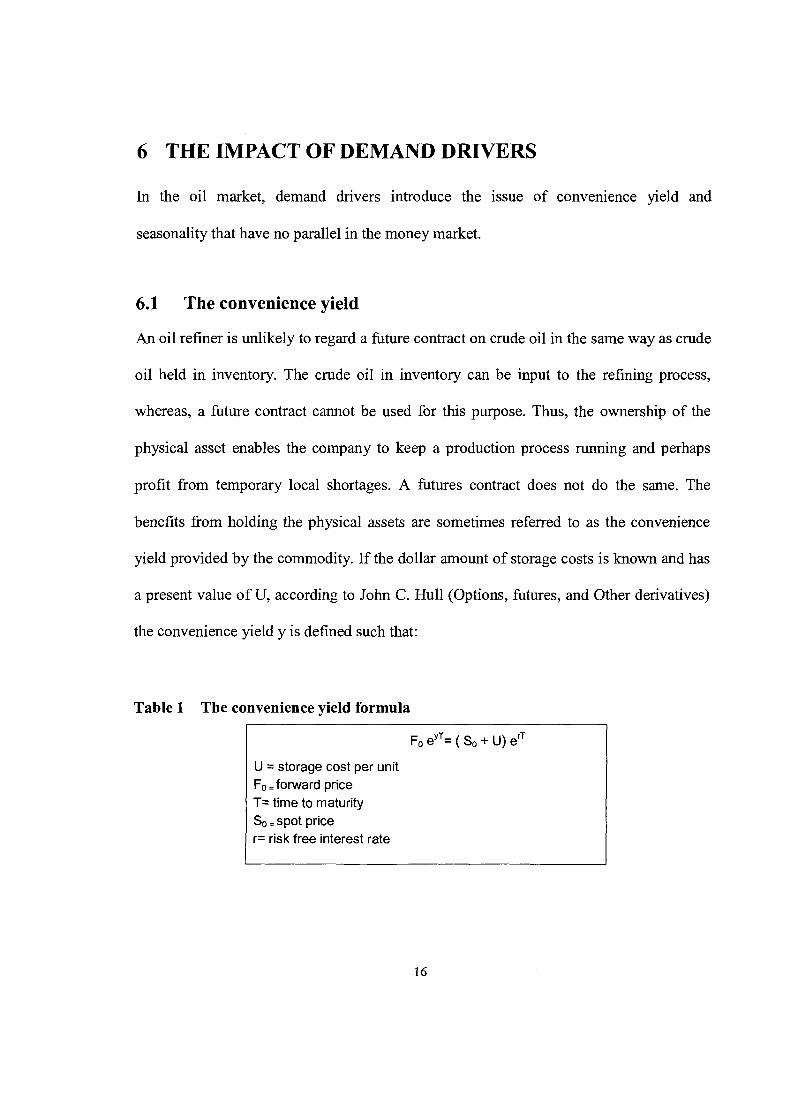
Table 1 The convenience yield formula
U = storage cost per unit Fo =forward price T= time to maturity So= spot price r= risk free interest rate
The convenience yield simply measures the extent to which the left hand side is less than
the right hand side. The convenience yield reflects the market's expectation concerning
the future availability of the commodity. The greater the possibility that shortages will
occur, the higher the convenience yield will be. If commodity users have higher
inventories, there is very little chance of shortages in the near future and the convenience
yield tends to be low. On the other hand, low inventories tend to lead to a high
convenience yield.
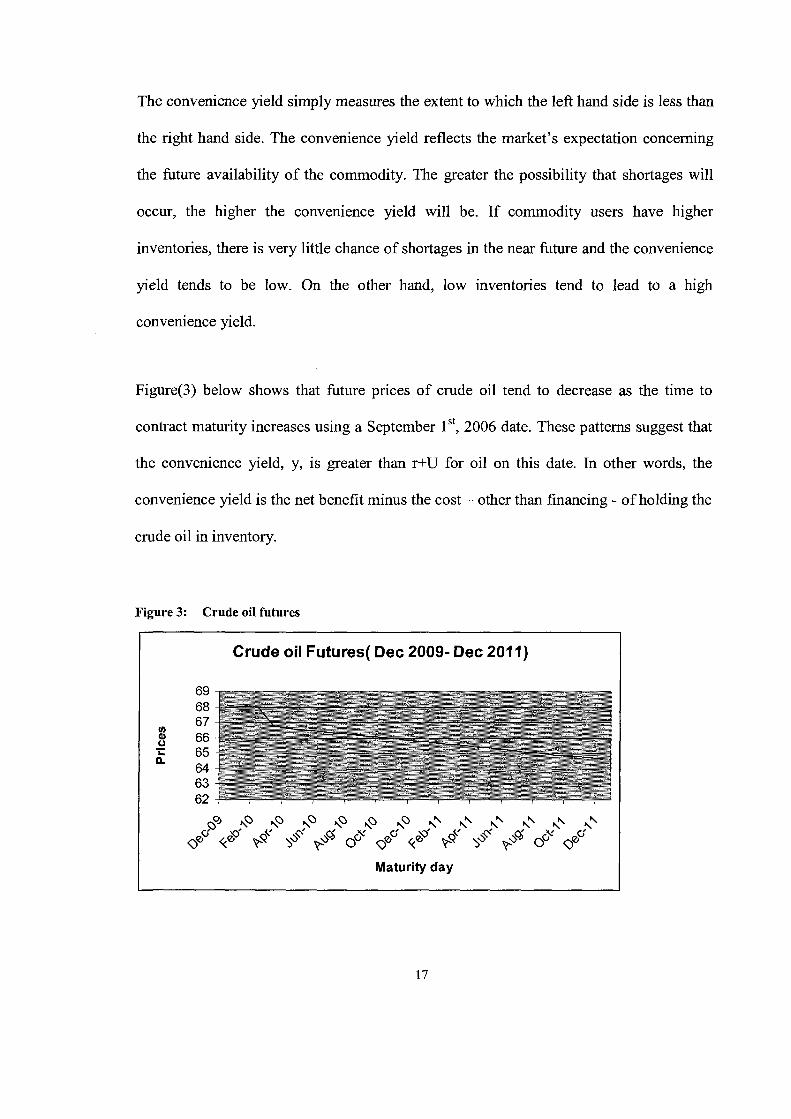
Figure(3) below shows that future prices of crude oil tend to decrease as the time to
contract maturity increases using a September l", 2006 date. These patterns suggest that
the convenience yield, y, is greater than r+U for oil on this date. In other words, the
convenience yield is the net benefit minus the cost - other than financing - of holding the
crude oil in inventory.
Figure 3: Crude oil futures
Crude oil Futures( Dec 2009- Dec 201 1)
Maturity day
6.2 Seasonality
On the demand side, we have to consider the significant seasonality effects of
consumption. Aggregate consumption demand creates seasonality. In the oil market, the
seasonality effect on demand is evident; oil demand is influenced substantially by
weather conditions that are mainly captured in seasonal patterns. As an example of this
seasonality in demand, the United States consumes heating oil mostly during the winter.
Hence, heating oil prices peak during winter and then drop to their annual lows in the
summer. These seasonality effects can be seen and measured not only through the
historical spot price data, but also by observing the forward price market.
7 DERIVATIVES USAGE IN THE OIL MARKET
Derivatives allow investors to transfer risk to others who could profit from taking the
risk. The company transferring the risk achieves price certainty, but loses the opportunity
to make additional profits when prices move opposite to the expected. At the same time,
the company taking on the risk will lose if the counterparty's expectations are realized.
Except for transaction costs, the winner's gains are equal to the loser's losses. Similar to
insurance, derivatives protect against some adverse events. Because of their flexibility in
dealing with price risk, derivatives have become an increasingly popular way to isolate
cash earnings from price fluctuations. The most commonly used derivative contracts are
forward contracts, futures contracts, options, and swaps.
Prior to 1973, oil transactions were mostly done through contract sales within
integrated system of the major oil companies. The buyer and the seller were committee
trade oil, often at a fixed price for a set of period of time, which could go as far as three
years. The spot market fimctioned as a residual market for imbalances between oil
companies, refineries and market demand. After the 1973 oil crisis, when Middle Eastern
oil producing countries restricted their oil supplies, the spot market started to play a more
important role. Spot prices rather than contract prices became the main indicator of the
overall market condition. By 1984, the spot market accounted for 85-90% of
internationally traded oil.
From the late 1980's through to the late 1990's, derivatives have proliferated across the
oil industry. This financial revolution came about as a result of structural development in
both the financial services sector and the oil industry.
During the 1 9 9 0 ' ~ ~ financial institutions faced shrinking profit margins and increasing
over brokering of their traditional lines of business, such as interest rate swaps and
currency trading. They reacted to these trends by trying to "push the envelope" of their
portfolio of financial products in three dimensions: product complexity, range of
instruments underlying the derivatives contracts and customer base.
Before I start explaining the different derivative contracts, it is essential to outline the two
main markets in which these derivatives operate:
7.1 Exchange traded derivatives
Exchange traded crude oil derivatives include oil futures and options on oil futures.
Crude oil futures contracts were first introduced on the New York cotton exchange in
1974. The initial contracts failed to attract sufficient trading volume mainly because of a
period of a very low volatility. Industry participation also cited the inconvenient delivery
requirement, Rotterdam, as a reason for the lack of interest. However, in the late 1970's
and early 1980's futures contracts were more successfully introduced and this was mainly
attributed to the successive deregulation in the energy industry, which made the prices
more volatile. Crude Oil futures contracts were introduced on the New York Mercantile
Exchange (NYMEX) on March 30, 1983. One contract gives the obligation of the
delivery of 1,000 barrels (42,000 gallons) of light sweet crude oil at Cushing, Oklahoma,
or at the seller's facility.
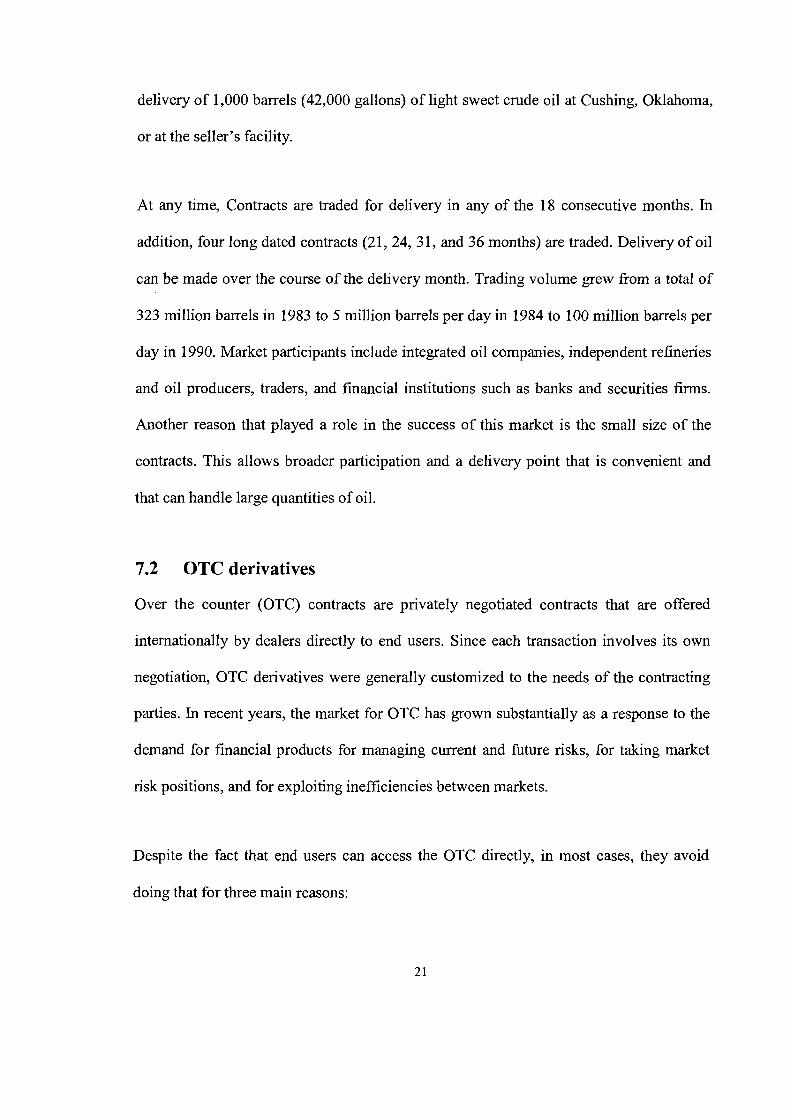
At any time, Contracts are traded for delivery in any of the 18 consecutive months. In
addition, four long dated contracts (21,24, 3 1, and 36 months) are traded. Delivery of oil
can be made over the course of the delivery month. Trading volume grew from a total of
323 million barrels in 1983 to 5 million barrels per day in 1984 to 100 million barrels per
day in 1990. Market participants include integrated oil companies, independent refineries
and oil producers, traders, and financial institutions such as banks and securities firms.
Another reason that played a role in the success of this market is the small size of the
contracts. This allows broader participation and a delivery point that is convenient and
that can handle large quantities of oil.
7.2 OTC derivatives
Over the counter (OTC) contracts are privately negotiated contracts that are offered
internationally by dealers directly to end users. Since each transaction involves its own
negotiation, OTC derivatives were generally customized to the needs of the contracting
parties. In recent years, the market for OTC has grown substantially as a response to the
demand for financial products for managing current and future risks, for taking market
risk positions, and for exploiting inefficiencies between markets.
Despite the fact that end users can access the OTC directly, in most cases, they avoid
doing that for three main reasons:
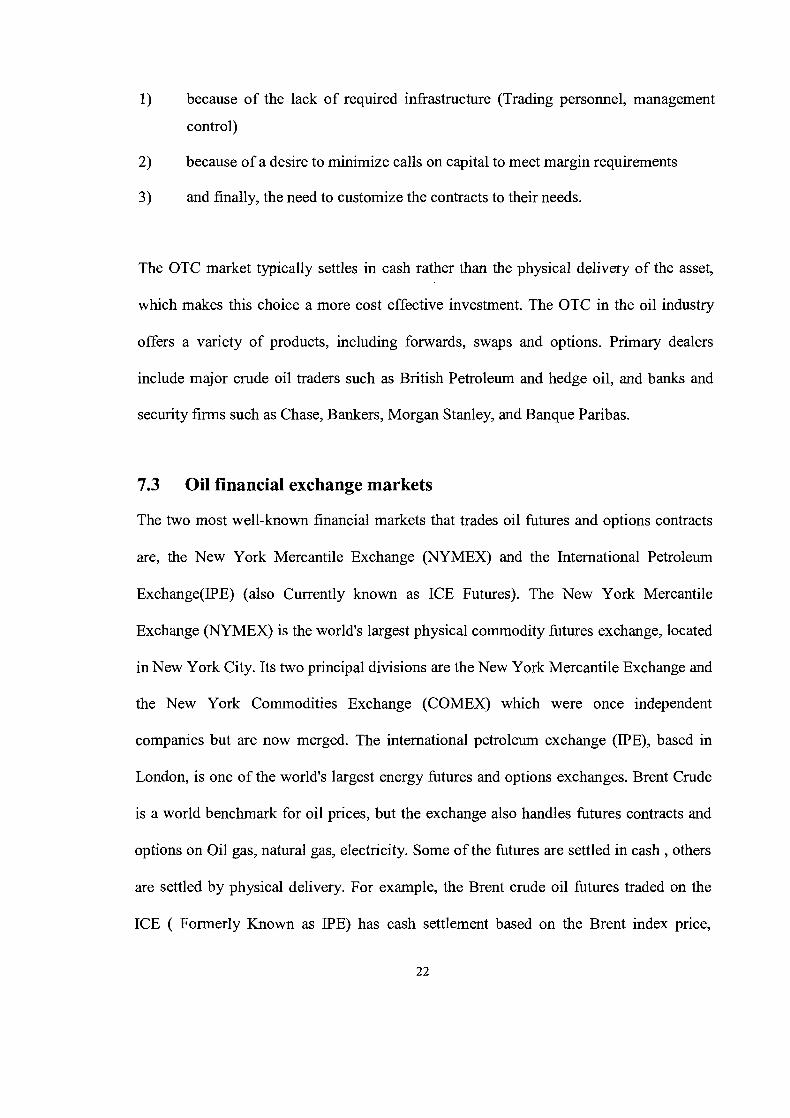
1) because of the lack of required infrastructure (Trading personnel, management
control)
2) because of a desire to minimize calls on capital to meet margin requirements
3) and finally, the need to customize the contracts to their needs.
The OTC market typically settles in cash rather than the physical delivery of the asset,
which makes this choice a more cost effective investment. The OTC in the oil industry
offers a variety of products, including forwards, swaps and options. Primary dealers
include major crude oil traders such as British Petroleum and hedge oil, and banks and
security firms such as Chase, Bankers, Morgan Stanley, and Banque Paribas.
7.3 Oil financial exchange markets
The two most well-known financial markets that trades oil futures and options contracts
are, the New York Mercantile Exchange (NYMEX) and the International Petroleum
Exchange(IPE) (also Currently known as ICE Futures). The New York Mercantile
Exchange (NYMEX) is the world's largest physical commodity futures exchange, located
in New York City. Its two principal divisions are the New York Mercantile Exchange and
the New York Commodities Exchange (COMEX) which were once independent
companies but are now merged. The international petroleum exchange (IPE), based in
London, is one of the world's largest energy futures and options exchanges. Brent Crude
is a world benchmark for oil prices, but the exchange also handles futures contracts and
options on Oil gas, natural gas, electricity. Some of the futures are settled in cash , others
are settled by physical delivery. For example, the Brent crude oil futures traded on the
ICE ( Formerly Known as IPE) has cash settlement based on the Brent index price,
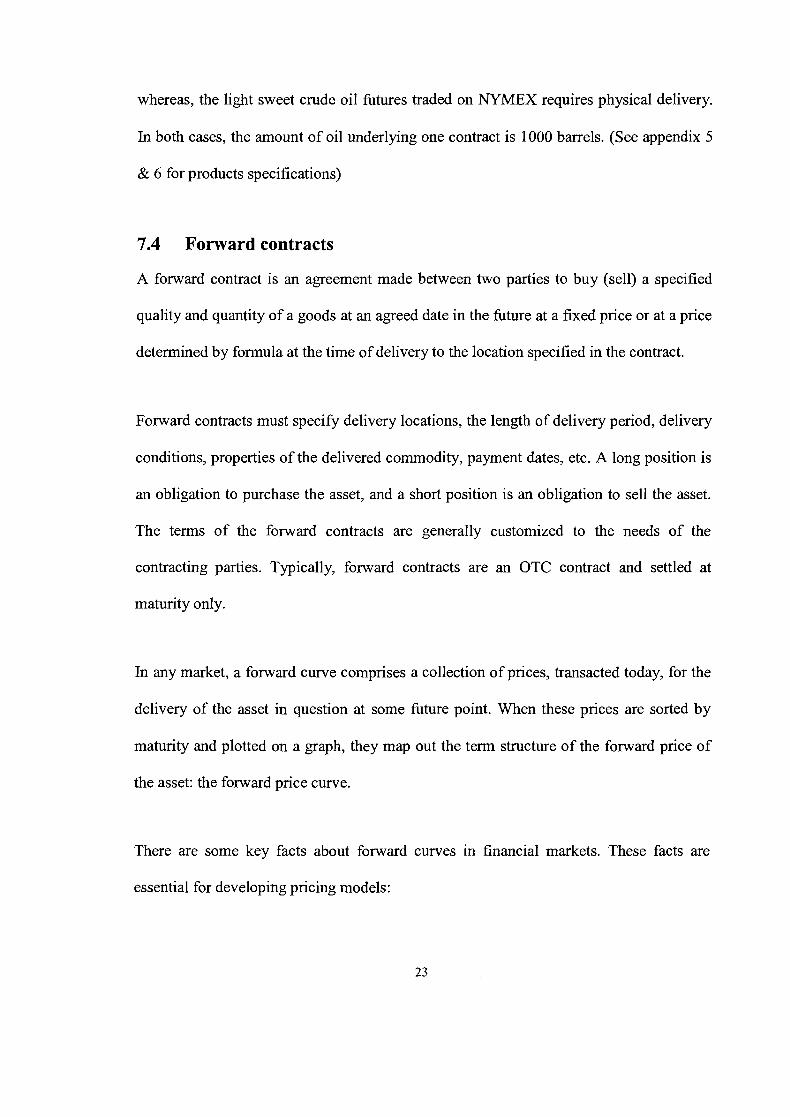
whereas, the light sweet crude oil futures traded on NYMEX requires physical delivery.
In both cases, the amount of oil underlying one contract is 1000 barrels. (See appendix 5
& 6 for products specifications)
7.4 Forward contracts
A forward contract is an agreement made between two parties to buy (sell) a specified
quality and quantity of a goods at an agreed date in the future at a fixed price or at a price
determined by formula at the time of delivery to the location specified in the contract.
Forward contracts must specify delivery locations, the length of delivery period, delivery
conditions, properties of the delivered commodity, payment dates, etc. A long position is
an obligation to purchase the asset, and a short position is an obligation to sell the asset.
The terms of the forward contracts are generally customized to the needs of the
contracting parties. Typically, forward contracts are an OTC contract and settled at
maturity only.
In any market, a forward curve comprises a collection of prices, transacted today, for the
delivery of the asset in question at some future point. When these prices are sorted by
maturity and plotted on a graph, they map out the term structure of the forward price of
the asset: the forward price curve.
There are some key facts about forward curves in financial markets. These facts are
essential for developing pricing models:
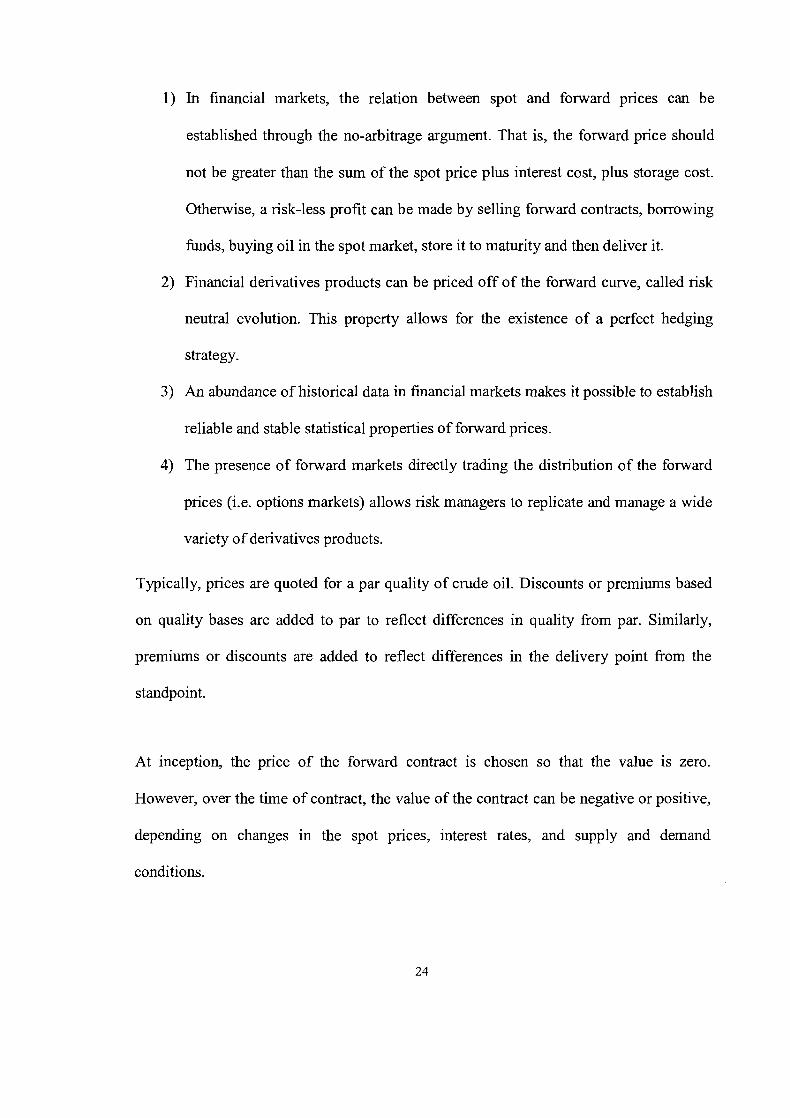
1) In financial markets, the relation between spot and forward prices can be
established through the no-arbitrage argument. That is, the forward price should
not be greater than the sum of the spot price plus interest cost, plus storage cost.
Otherwise, a risk-less profit can be made by selling forward contracts, borrowing
funds, buying oil in the spot market, store it to maturity and then deliver it.
2) Financial derivatives products can be priced off of the forward curve, called risk
neutral evolution. This property allows for the existence of a perfect hedging
strategy.
3) An abundance of historical data in financial markets makes it possible to establish
reliable and stable statistical properties of forward prices.
4) The presence of forward markets directly trading the distribution of the forward
prices (i.e. options markets) allows risk managers to replicate and manage a wide
variety of derivatives products.
Typically, prices are quoted for a par quality of crude oil. Discounts or premiums based
on quality bases are added to par to reflect differences in quality from par. Similarly,
premiums or discounts are added to reflect differences in the delivery point from the
standpoint.
At inception, the price of the forward contract is chosen so that the value is zero.
However, over the time of contract, the value of the contract can be negative or positive,
depending on changes in the spot prices, interest rates, and supply and demand
conditions.
7.5 Futures contract
Futures contract can be defined as a contract that obligates the holder to buy or sell an
asset at a predetermined delivery price during a specified future time period. The main
difference to a forward contract is that futures are market to market, that is, settled daily
based on its change in value, usually at the end of the day. It is exchange traded and its
terms are standardized. Unlike a forward contract, buyers and sellers of futures contracts
deal with an exchange, not with each other. For example, a producer wanting to sell crude
oil in December 2006 can sell a futures contract for 1,000 barrels of West Texas
Intermediate (WTI) to the NYMEX, and a refinery can buy a December 2006 oil future
from the exchange. The December futures price is the one that causes offers to sell to
equal bids to buy i.e., the demand for futures equals the supply. The December futures
price is public, same as the volume of trade. If the buyer of a December futures finds later
that he does not need the oil, he can get out of the contract by selling a December oil
future at the prevailing price. Since he has both bought and sold a December oil future, he
has met his obligations to the exchange by netting them out.
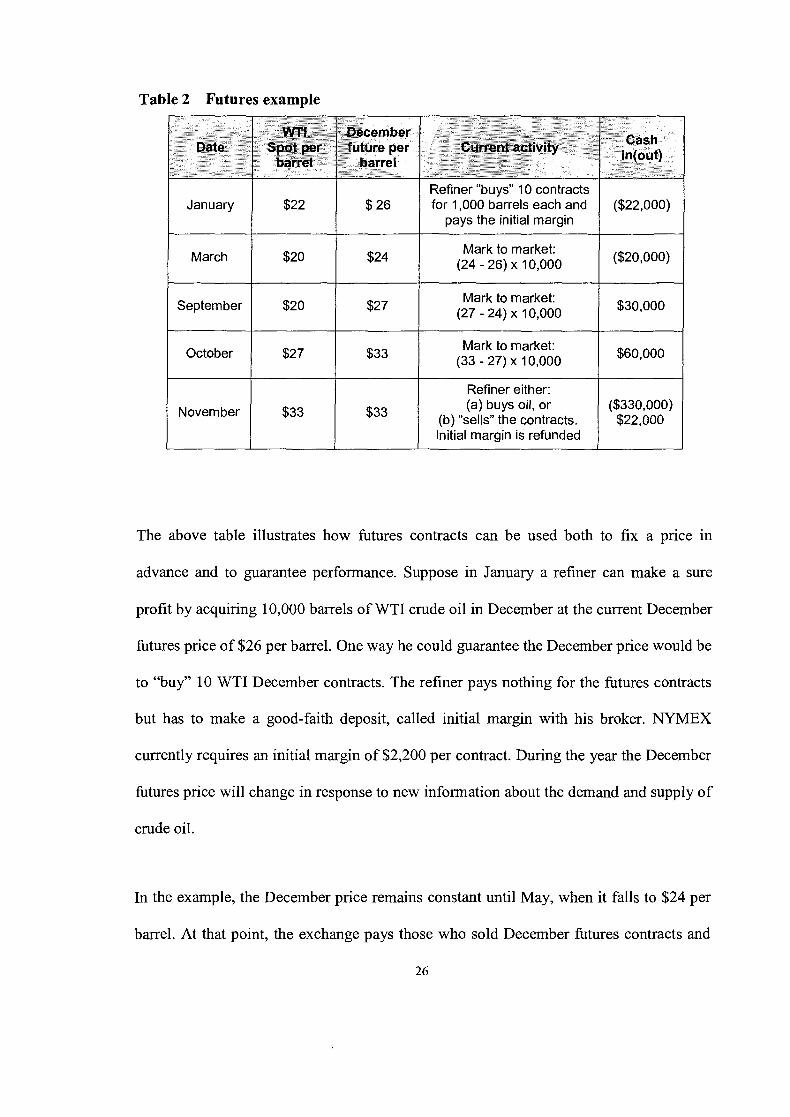
Table 2 Futures example
January
March
September
October
Novem ber
Refiner "buys" 10 contracts $22 $26 for 1,000 barrels each and
pays the initial margin
$20 $24 Mark to market:
(24 - 26) x 10,000
$20 $27 Mark to market:
(27 - 24) x 10,000
$27 $33 Mark to market:
(33 - 27) x 10,000
Refiner either: (a) buys oil, or
$33 1 $33 1 (b) "sells" the contracts. Initial margin is refunded
The above table illustrates how futures contracts can be used both to fix a price in
advance and to guarantee performance. Suppose in January a refiner can make a sure
profit by acquiring 10,000 barrels of WTI crude oil in December at the current December
futures price of $26 per barrel. One way he could guarantee the December price would be
to "buy" 10 WTI December contracts. The refiner pays nothing for the futures contracts
but has to make a good-faith deposit, called initial margin with his broker. NYMEX
currently requires an initial margin of $2,200 per contract. During the year the December
fitures price will change in response to new information about the demand and supply of
crude oil.
In the example, the December price remains constant until May, when it falls to $24 per
barrel. At that point, the exchange pays those who sold December futures contracts and
26
collects fi-om those who bought them. The money comes fi-om the margin accounts of the
refiner and other buyers. The broker then issues a "margin call," requiring the refiner to
restore his margin account by adding $20,000 to it.
This "marking to market" is done every day and may be done several times during a
single day. Brokers close out parties that are unable to pay (make their margin calls) by
selling their clients' futures contracts. Usually, the initial margin is enough to cover a
defaulting party's losses. If not, the broker covers the loss. If the broker cannot, the
exchange does. Following settlement after the first change in the December futures price,
the process is started anew, but with the current price of the December future used as the
basis for calculating gains and losses.
In this example, let suppose that In September, the December futures price increases to
$27 per barrel, the refiner's contract is marked to market, and he receives $30,000 from
the exchange. In October, the price increases again to $33 per barrel, and the refiner
receives an additional $60,000. By the end of November, the WTI spot price and the
December futures price are necessarily the same, for the following reason. The refiner
can either demand delivery and buy the oil at the spot price or "sell" his contract. In
either event, his initial margin is refunded, sometimes with interest. If he buys oil he pays
$33 per barrel or $330,000, but his trading profit is $70,000 ($30,000 + $60,000 -
$20,000). Effectively, he ends up paying $26 per barrel [($330,000 - $70,000)/ 10,0001,
which is precisely the January price for December futures. If he "sells" his contract, he
keeps the trading profit of $70,000.
Several features of futures are worth emphasizing. First, a party who elects to hold the
contract until maturity is guaranteed the price he paid when he initially bought the
contract. The buyer of the futures contract can always demand delivery; the seller can
always insist on delivering. As a result, at maturity the December futures price for WTI
and the spot market price will be the same. If the WTI price were lower, people would
sell futures contracts and deliver oil for a guaranteed profit. If the WTI price were higher,
people would buy futures and demand delivery, again for a guaranteed profit. Only when
the December futures price and the December spot price are the same is the opportunity
for a sure profit eliminated.
Second, a party can sell oil futures even though he has no access to oil. Likewise, a party
can buy oil even though he has no use for it. Speculators routinely buy and sell futures
contracts in anticipation of price changes. Instead of delivering or accepting oil, they
close out their positions before the contracts mature. Speculators perform the useful
function of taking on the price risk that producers and refiners do not wish to bear.
Third, futures allow a party to make a commitment to buy or sell large amounts of oil (or
other commodities) for a very small initial commitment, the initial margin. An investment
of $22,000 is enough to commit a party to buy (sell) $260,000 of oil when the futures
price is $26 per barrel. Consequently, traders can make large profits or suffer huge losses
from small changes in the futures price. This leverage has been the source of spectacular
failures in the past. (See appendix 5 &6 for futures contract specifications).
7.6 Energy options
An option is a contract that gives the buyer of the contract the right to buy ( call option)
or sell (put option) at a specified price (strike price) over a specified period of time.
American options allow the buyer to exercise his right either to buy or sell at any time
until the option expires. European options can be exercised only at maturity.
Whether the option is sold on an exchange or on the OTC market, the buyer pays for it up
front. For example, the option to buy a thousand 1000 barrels of crude oil at a price of
$50 per barrel in December 2002 may cost $0.73. If the price in December exceeds $50,
the buyer can exercise his option and buy the crude oil for $50. More commonly, the
option writer pays the buyer the difference between the market price and the strike price.
If the Crude Oil is less than $50 per barrel, the buyer lets the option expire and loses
$0.73. Options are used successfully to put floors and ceilings on prices.
Energy options comprise a huge global market, competing with energy swaps markets as
a means of managing energy price risk. Nymex, the worlds largest energy option
exchange, recorded the volume of options traded in 1998 to be 61.7% higher than four
years earlier. Nymex started trading energy options in 1986, and it has grown since then.
This growth was mainly due to two main factors: the successful launch of an OTC market
in swaps from 1986, and the extreme volatility in oil prices in 1990, the year of Iraq's
invasion of Kuwait.
In the oil market, OTC options are generally settled in a different way than exchange
traded options. Exchange options, if held to maturity, nearly always result in physical
delivery of the products. In contrast, OTC options are generally cash settled. Their value
at settlement is generally based on the average price over a period of time. Cash
settlement options work well in the oil market, as it could be very expensive to exercise
the option and then resell the product to capture the increase in value. For example, a
refiner may hold an exchange traded call option on crude oil as a protection against a rise
in crude prices. Selling this option at an acceptable price is always a possibility, but if the
option market is not liquid, then the refinery might need to exercise the option by taking
delivery at the underlying future position at the strike price. However, the refiner might
prefer to buy his crude oil from another source or for a different delivery date than the
crude controlled by the future contract. Then he will need to resell it in order to capture
the increase in value beyond the strike price. This might result in an additional
commission to pay, or the market might move unfavourably before the future position is
disposed of.
One of the main advantages of cash settlement options is that many clients favour
settlement based on average prices. Compared to settlements based on a single point in
time, they can provide a better hedge for non-specific "cash type" exposure. For example,
an oil trader buying and selling cargoes of oil can use large lumps of futures to hedge the
large lump of oil. The matching of hedges is easy, because when the trader buys cargo
and wants to hedge he can sell an equal quantity of futures to unwind his hedge. For this
operation, the futures are sold at a specified moment and bought back at a specified
moment within the timing constraint of the ship's voyage.
Options are also increasingly used to hedge cross-market risks. Cash settlement is
significantly cheaper in this kind of hedge, because in most cases the buyer is not
interested in the underlying commodity of the option, he is merely interested in the price
protection that the option provides. For example, a refinery can buy an option on gasoline
as a cross market hedge against a rise in the price of crude oil. In this case, the option
buyer is not at all interested in acquiring the underlying asset; he just wants to price
hedge the value, which is highly correlated with his underlying price exposure.
7.7 Swaps
Swaps (also called contracts for differences) are the most recent innovation in finance.
Swaps were created in part to give price certainty at a cost that is lower than the cost of
options. A swap contract is an agreement between two parties to exchange a series of
cash flows generated by underlying assets. No physical commodity is actually transferred
between the buyer and seller. The swaps contracts are agreements between the two
counterparties, or principals, outside any centralized trading facility or exchange and are
therefore characterized as OTC derivatives.
Because swaps do not involve the actual transfer of any assets or principal amounts, a
base must be established in order to determine the amounts that will periodically be
swapped. This principal base is known as the "notional amount" of the contract. For
example, one person might want to "swap" the variable earnings on a million dollar stock
portfolio for the fixed interest earned on a treasury bond of the same market value. The
notional amount of this swap is $1 million. Swapping avoids the expense of selling the
portfolio and buying the bond. It also permits the investor to retain any capital gains that
his portfolio might realize.
According to Jack Kellet (Standard Bank London Ltd.), the use of swaps as a risk
management tool has grown substantially in the last decade. The driving force behind this
growth has been the increasing involvement of financial intermediaries. Banks and
trading companies that understand market making and risk management have acted as an
intermediary, risk takers and structural innovators. They have bridged the gap between
market participants who wanted protection from falling prices and those who wanted
protection from rising prices. Without these intermediaries, it is unlikely that consumers
of oil would be able to match themselves with producers to offset risks of similar size and
duration.
Another principle reason why we have experienced this growth is the increase in
technical knowledge about the market and the instruments available. As end users
develop a deeper understanding of the mechanics of risk control, their inclinations to
enter into complex swaps that are tailored into specific needs increase.
As an example of a standard crude oil swaps, assume a refiner and an oil producer agree
to enter into a 10-year crude oil swap with a monthly exchange of payments. The refiner
(Party A) agrees to pay the producer (Party B) a fixed price of $30 per barrel, and the
producer agrees to pay the refiner the settlement price of a fktures contract for NYMEX
light, sweet crude oil on the final day of trading for the contract. The notional amount of
the contract is 10,000 barrels. Under this contract, the payments are netted, so that the
32
party owing the larger payment for the month makes a net payment to the party owing the
lesser amount. If the NYMEX settlement price on the final day of trading is $28 per
barrel, Party A will make a payment of $2 per barrel times 10,000, or $20,000, to Party
B. If the NYMEX price is $33 per barrel, Party B will make a payment of $30,000 to
Party A. The 10-year swap effectively creates a package of 120 cash-settled forward
contracts, one maturing each month for 10 years.
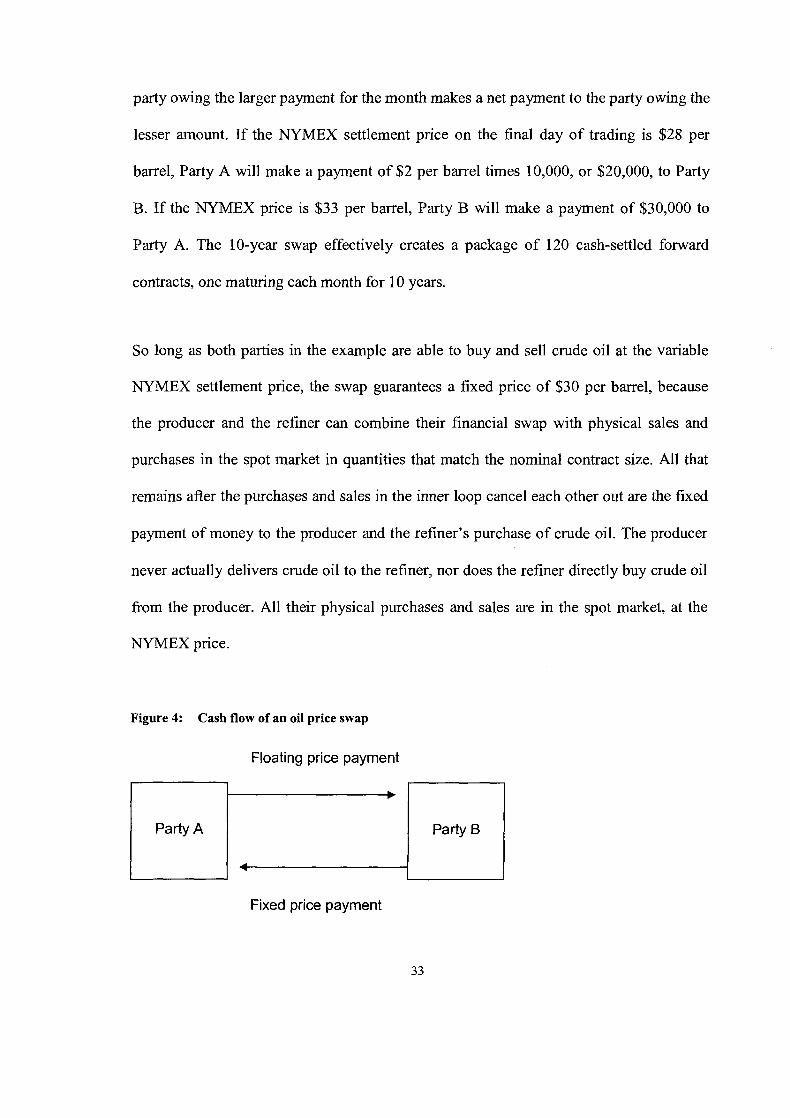
So long as both parties in the example are able to buy and sell crude oil at the variable
NYMEX settlement price, the swap guarantees a fixed price of $30 per barrel, because
the producer and the refiner can combine their financial swap with physical sales and
purchases in the spot market in quantities that match the nominal contract size. All that
remains after the purchases and sales in the inner loop cancel each other out are the fixed
payment of money to the producer and the refiner's purchase of crude oil. The producer
never actually delivers crude oil to the refiner, nor does the refiner directly buy crude oil
from the producer. All their physical purchases and sales are in the spot market, at the
NYMEX price.
Figure 4: Cash flow of an oil price swap
Floating price payment
Fixed price payment
Party B
-
Party A
b
4 P
Many of the benefits associated with swap contracts are similar to those associated with
futures or options contracts. Swaps allow users to manage price exposure risk without
having to take possession of the commodity. They differ from exchange-traded futures
and options in that they are individually negotiated instruments, users can customize
them to suit their risk management activities to a greater degree than is easily
accomplished with more standardized futures contracts or exchange-traded options. For
instance, in the example above, the floating price reference for crude oil might be
switched from the NYMEX contract, which calls for delivery at Cushing, Oklahoma, to
an Alaskan North Slope oil price for delivery at Long Beach, California. Such a swap
contract might be more useful for a refiner located in the Los Angeles area.
Although swaps can be highly customized, the counterparties are exposed to higher credit
risk because the contracts generally are not guaranteed by a clearinghouse as are
exchange-traded derivatives. In addition, customized swaps generally are less liquid
instruments, usually requiring parties to renegotiate terms before prematurely terminating
or offsetting a contract.
8 RELATIONSHIP BETWEEN THE SPOT, FORWARDIFUTURES PRICES AND THE CONVENIENCE YIELD
A distinguishing feature of the oil futures market and the energy market in general is the
behaviour of the term structure of futures prices. This term structure shows how oil future
prices are dependant upon time to contract expirations. For oil products, the term
structure exhibits a variety of shapes.
To provide an analysis of this relationship, let S(t) be the current spot price of one barrel
of oil, and F(T) be the forward price at date t to deliver one barrel at date T. For
simplicity reasons, let's assume that the delivery only takes place at the expiration date T.
Since we focus on the term structure of future prices and its effect on oil derivative value,
we can assume that interest rates are deterministic or known. This would ensure that
forward prices equal future prices, as described by Jarrow and Oldfield (1981).
Therefore, the future price of oil at time t to be delivered at time T would equal F(t,T),
the forward price.
Arbitrage implies a mathematical relationship between futures prices with different
maturities, and between spot and futures prices. A common example of such a
relationship is the traditional "cost and carry" model. This model states future prices must
exceed the spot price by the cost of carrying inventory. Let r(u) be the instantaneous
forward interest rate at date u, and w(u) be the instantaneous storage cost at date u
measured as a portion of the spot price, which is also known at time t (Craig Pirrong,
Bauer College of Business at the University of Houston).
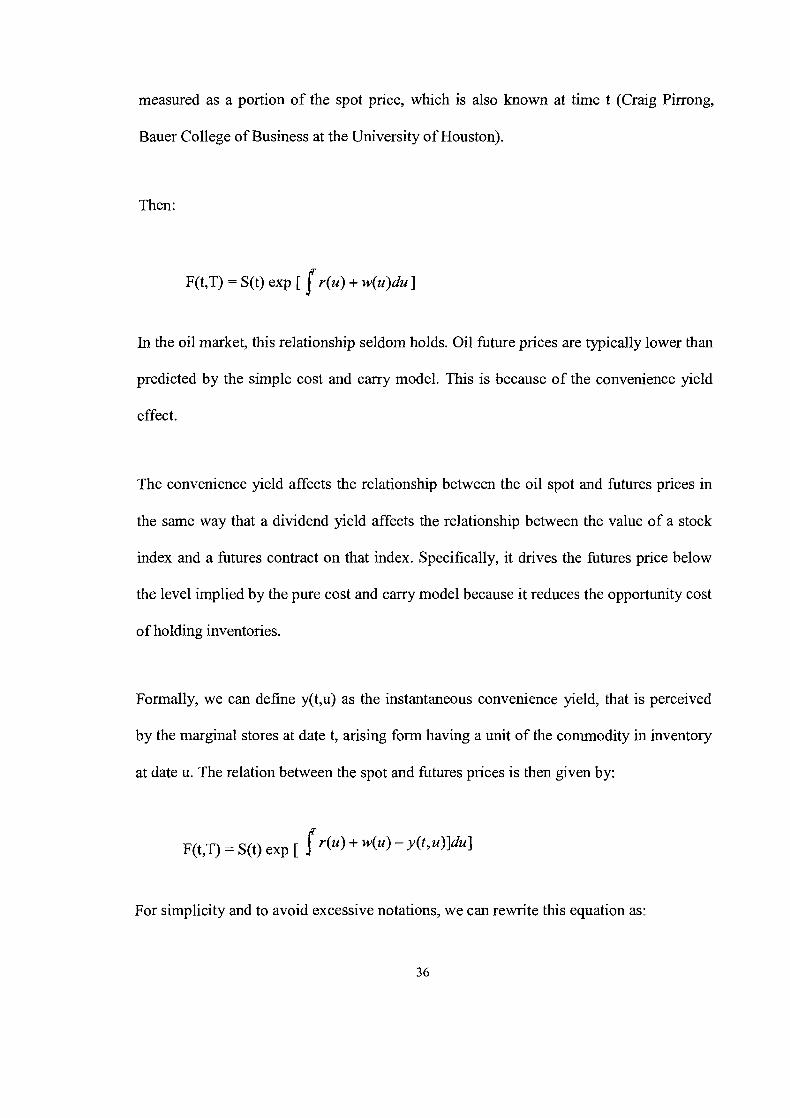
Then:
In the oil market, this relationship seldom holds. Oil future prices are typically lower than
predicted by the simple cost and carry model. This is because of the convenience yield
effect.
The convenience yield affects the relationship between the oil spot and futures prices in
the same way that a dividend yield affects the relationship between the value of a stock
index and a futures contract on that index. Specifically, it drives the fktures price below
the level implied by the pure cost and carry model because it reduces the opportunity cost
of holding inventories.
Formally, we can define y(t,u) as the instantaneous convenience yield, that is perceived
by the marginal stores at date t, arising form having a unit of the commodity in inventory
at date u. The relation between the spot and futures prices is then given by:
F(~,T) = ~ ( t ) exp [ J + W(U) - ~ ( t , U ) I ~ U I
For simplicity and to avoid excessive notations, we can rewrite this equation as:
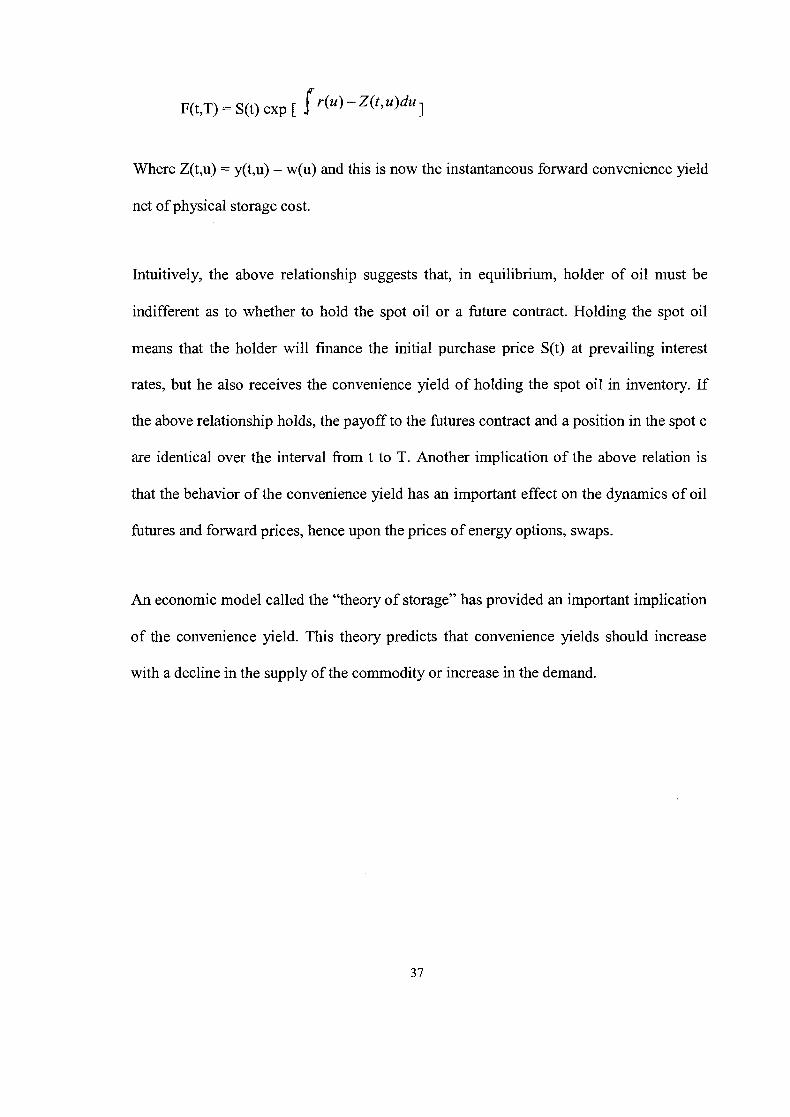
F(t,T) = S(t) exp [ I(U) - Z ( f , u)du I
Where Z(t,u) = y(t,u) - w(u) and this is now the instantaneous forward convenience yield
net of physical storage cost.
Intuitively, the above relationship suggests that, in equilibrium, holder of oil must be
indifferent as to whether to hold the spot oil or a future contract. Holding the spot oil
means that the holder will finance the initial purchase price S(t) at prevailing interest
rates, but he also receives the convenience yield of holding the spot oil in inventory. If
the above relationship holds, the payoff to the futures contract and a position in the spot c
are identical over the interval from t to T. Another implication of the above relation is
that the behavior of the convenience yield has an important effect on the dynamics of oil
futures and forward prices, hence upon the prices of energy options, swaps.
An economic model called the "theory of storage" has provided an important implication
of the convenience yield. This theory predicts that convenience yields should increase
with a decline in the supply of the commodity or increase in the demand.
9 BASIS RISK
It is very important for oil companies to consider the risk that is associated with engaging
in hedging activities. It is believed that hedgers are able to identify the precise date in the
future when an asset would be bought or sold. In addition, it is also believed that hedgers
are then able to use future contracts to remove almost all the risk arising from the price of
the asset on that date. In actuality, hedging is often not quite as straightforward which can
create a basis risk. This can be attributed to the following reasons:
1) The asset whose price is to be hedged may not be the same as the asset underlying the futures
contract.
2) The hedgers may be uncertain as to the exact date when the asset will be bought or sold.
3) The hedgers may require the futures contract to be closed out before its delivery month.
Basis in a hedging situation is as follows:
Basis = spot price of asset to be hedged - future price of contract used.
In the cases, where the assets to be hedged and the asset underlying the futures contract
are the same, the basis should be zero at expiration of the future contract. Prior to
expiration, the basis may be positive or negative. In the oil market, it is more likely that
basis would be negative. The reason for that is because future prices of crude Oil tend
increase by more than the spot price, so basis declines. This is referred to as a weakening
of the basis. Depending on the position of the hedger; basis risk can lead to improvements
or worsening of the hedger's position. For a long hedge, if the basis strengthens
expectedly, the hedger's position worsens. If the basis weakens unexpectedly, the
hedger's position improves. For a'short hedge, the reverse holds.
10 DATA AND METHODOLOGY
This study is conducted on 15 US- Oil producing companies. All companies name oil as
their primary business segment. Thus, market risk exposures are similar, leading to the
conclusion that differences in hedging policies are more likely a result of the differences
in firm characteristics.
All the sample companies are headquartered in the USA. The reason for not choosing a
diverse sample in terms of geographical locations is the fact that each geographical
region has its own distinct environmental, legal, political, and operational conditions that
have a strong impact on the companies7 policies. For example, some of the international
North African oil companies, regardless of their size and firm characteristics, are non-
hedgers. This is attributed to the fact that the financial market is not well-established in
these regions, and the expertise to engage in offshore derivative instruments is still very
limited. This study aims to explain the different derivative engagements by oil companies
8 as well as SFAS 133113 influence on their strategy.
Firm information on derivative usage, positions and accounting treatments are obtained
from their companies' annual reports and their 10K forms. Operational data such as oil
reserve statistics and cash cost, as well as financial data such as market value of assets,
liquidity ratio and debt ratio for the companies are also collected or calculated with data
from the sources mentioned above.
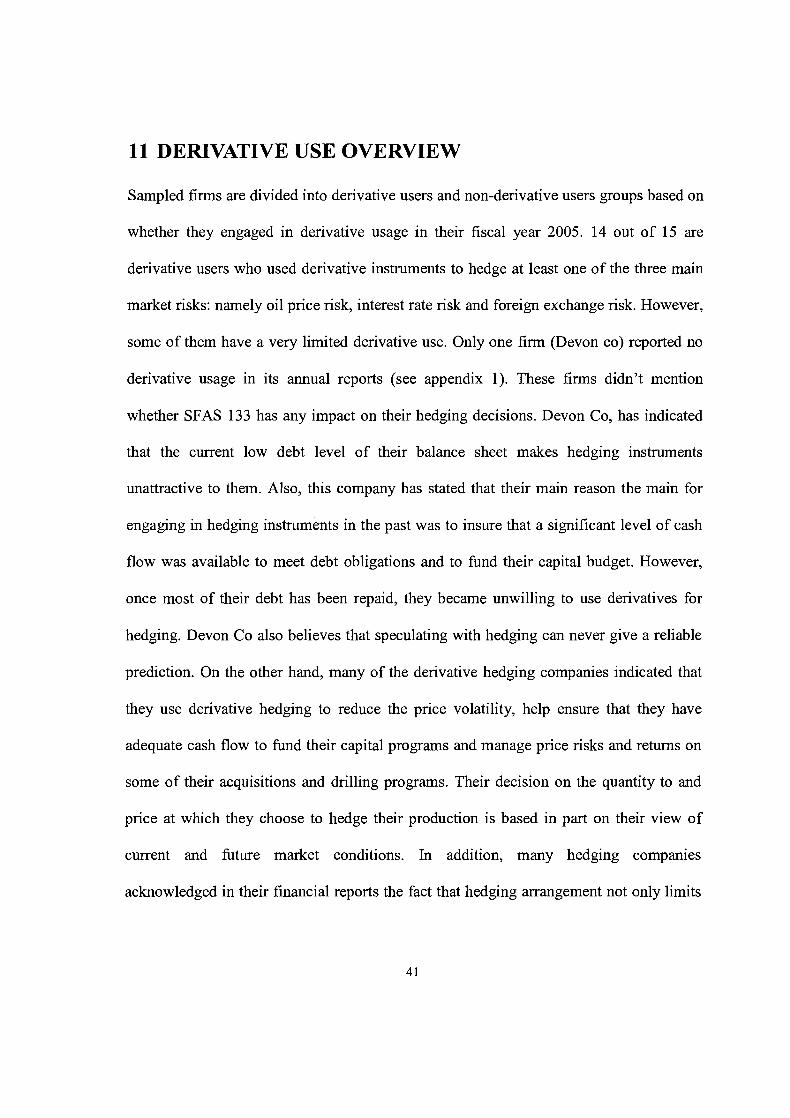
11 DERIVATIVE USE OVERVIEW
Sampled firms are divided into derivative users and non-derivative users groups based on
whether they engaged in derivative usage in their fiscal year 2005. 14 out of 15 are
derivative users who used derivative instruments to hedge at least one of the three main
market risks: namely oil price risk, interest rate risk and foreign exchange risk. However,
some of them have a very limited derivative use. Only one firm (Devon co) reported no
derivative usage in its annual reports (see appendix 1). These firms didn't mention
whether SFAS 133 has any impact on their hedging decisions. Devon Co, has indicated
that the current low debt level of their balance sheet makes hedging instruments
unattractive to them. Also, this company has stated that their main reason the main for
engaging in hedging instruments in the past was to insure that a significant level of cash
flow was available to meet debt obligations and to fund their capital budget. However,
once most of their debt has been repaid, they became unwilling to use derivatives for
hedging. Devon Co also believes that speculating with hedging can never give a reliable
prediction. On the other hand, many of the derivative hedging companies indicated that
they use derivative hedging to reduce the price volatility, help ensure that they have
adequate cash flow to h d their capital programs and manage price risks and returns on
some of their acquisitions and drilling programs. Their decision on the quantity to and
price at which they choose to hedge their production is based in part on their view of
current and future market conditions. In addition, many hedging companies
acknowledged in their financial reports the fact that hedging arrangement not only limits
the downside risk of adverse price movements, but also future revenues from favourable
price movements.
One company from the sample, Conoco Phillips co, stated that they use futures, forwards,
swaps and options in various markets to optimize the value of their supply chain, which
moves their risk profile away fiom market average prices in order to accomplish the
following objective:
- Balance physical systems. In addition to cash settlement prior to contract expiration,
exchange traded futures contract also may be settled by physical delivery of commodity,
providing another source of supply to meet our refinery requirement or market demand.
- Meet customer needs, consistent with their policy to generally remain exposed to
market prices, they use swap contracts to convert fixed -price sales contract to floating
market price.
Oil price risk is the most important risk exposure for oil companies. All of the 14 hedging
companies manage oil price risk with derivatives. The foreign exchange risk comes in
second place as 50% of the hedging companies use derivatives to manage their exposure
to this risk. Finally, interest rate risk is managed with derivatives by 28.5%.
12 RISK MANAGEMENT COMPLIANCE WITH SFAS NO 1331138
SFAS 133, Accounting for derivatives and certain hedging activities, was amended using
SFAS No. 138, accounting for certain derivatives and certain hedging activities (2000),
the new accounting standards on derivatives and hedging. These standards were forced
by the Federal Accounting Standards Board (FASB) for firms to recognize derivatives at
fair value on the balance sheet. This amendment was released as a result of the growing
use and complexity of the derivative market since the FASB was concerned that the value
and risk of derivatives were not well understood by firms. SFAS No. 133/138 requires
companies using derivative instruments to document all relationships between hedging
instruments and hedged items, as well as risk management objectives and strategies for
undertaking various hedged transactions. They must link all hedging derivatives to
specific forecasted transactions and then make the assessment, both at the hedge's
inception and on an ongoing basis, to determine whether the derivatives used are
effective in offsetting the cash flow of the hedged items. In other words, SFAS No. 133,
requires fair valuations of all derivatives on the balance sheet; gains and losses on
derivatives are recorded immediately in net income.
13 FIRM CHARACTERISTICS AND RISK MANAGEMENT
This study will attempt to evaluate the connection between firm characteristics and risk
management strategies in order to determine which type of firm characteristics plays a
role in the oil producing companies' risk management decisions. The non-derivative
users are also included in the analysis of the firms' characteristics. This may help give us
an insight into their non-hedging philosophies. The main firm characteristics included
are: firm size, leverage, and liquidity.
13.1 Firm size
Firm size is measured by the market value of assets and the company's total oil reserves.
The market value of the assets can be obtained from the market value of equity plus total
liability minus the book value of equity. In addition, the company's oil reserve is a
common indicator of the firm size. The shareholders maximization hypothesis (Yanbo Jin
and Phillippe Joroin ) predicts that firm size is negatively correlated with the degree of
hedging. Smaller firms, which have limited negotiation power and thus facing higher
financing costs, tend to hedge more in order to avoid seeking costly external financing. In
the sample, firm market value of assets ranged from US$85.14 million (Harken) to
around US382 billion (Exxon). Ten out 15 firms had a market value over 5 billion US
dollars. According to market value of assets and oil reserves, the sample firms can be
divided into three size groups:
1) 6 large firms with market value of assets over 5 billion and Oil reserves over 2 billion barrels.
6 medium size firms with either market value assets above 3 billion or oil reserves above 500 million barrels, however, they don't meet both of the requirements of large firms.
3 small firms with market value of assets less than 1 billion and oil reserves less than 500 million barrels.
Conoco Phillips and chevron with a market value near US $127.77 billions and US
$140 billions respectively falls under the large firm category. Noble affiliates Inc and
forest oil Co. fall under medium size category with market value of 8.8 billions and
3 respectively. Finally, as an example of the small size firm would be Delta petroleum
Co. and HarKen energy Co. with market value of 5 13.983 millions and 85.14 millions
respectively. The only Non-hedging firm, Devon, falls under the large firm category with
a market value about 35.24 billion.
Based on the sample, there is no direct relationship between firm size and derivative
usage. Hedging firms range from small to large companies with various hedging levels.
13.2 Liquidity
Quick ratio is the most commonly used liquidity measure. This ratio is calculated as the
ratio of cash, cash equivalents and receivables over short-term liabilities. The quick ratio
also gives an indication of the cash balance that a firm has for emergencies. Cash balance
is also an important source of funds for investments when present internally generated
f h d s fall short and external funding is costly. It is believed that the larger the cash
balance, the less the financial constraint to the firm, which leads to less need to hedge
against potential financial hardships. Devon Co, the only non-hedging firm, is among the
highest firms in terms of cash balance holdings. HarKen Energy, which has very limited
derivative use, has the biggest quick ratio of 3.2.(see appendix 3). Occidental, with
limited derivative use, has a relatively high quick ratio. Newfield exploration, with
almost 80% of hedged production, has a relative low Quick ratio. Overall, it appears that
most of the hedging firms with a high quick ratio tend to have limited derivatives use.
This supports the assumption that lower hedging activities are linked to higher
normalized (using short-term liabilities) cash balances. In addition, looking at appendix 4,
there appear to be a positive connection between the hedging percentage and the cash
balances. Firms with low cash balances are tended to hedge higher percentage of their
productions, such as, delta Co and Newfield Co, with cash balances of $2,241,000 and
$39,000,000 and production hedging percentages of 40% and 80% respectively. Whereas,
firms with high cash balances, like Exxon and occidental, tend to use limited hedging
activities. See appendix 1111
13.2 Leverage
Leverage is defined as the book value of long-term debt scaled by the company's market
value of assets (LDIMV). A firm will face financial hardships if it becomes unable to
make interest payments on its debts. Whited (1992), and Kaplan and Zinales (1997) argue
that firms with higher leverage are more likely to face financial constraints. In the oil
industry, a low level of leverage is more common. In the study sample LDMV ranged
from 0.01 6 to 0.421. And Six firms had LDMV ratio less than 0.1 0 However, these firms
happen to have very limited derivative use. Moreover, none of them hedge against all the
three risks. Most of the hedging firms have LD/MV higher than 0.1. From the sample
firms, there seems to be a positive relationship between LDMV ratio and the level of
hedging. This signals another alternative risk management strategy.
46
14 DERIVATIVE USE FOR OIL PRICE RISK
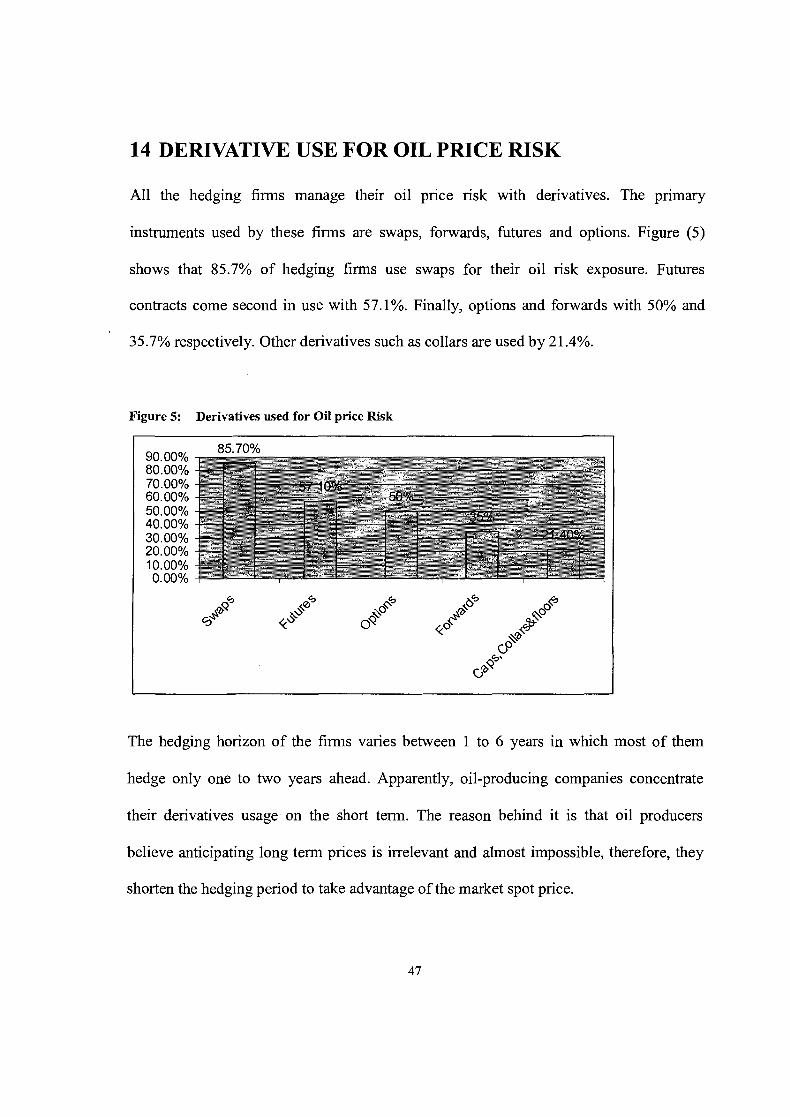
All the hedging firms manage their oil price risk with derivatives. The primary
instruments used by these firms are swaps, forwards, futures and options. Figure (5)
shows that 85.7% of hedging firms use swaps for their oil risk exposure. Futures
contracts come second in use with 57.1%. Finally, options and forwards with 50% and
35.7% respectively. Other derivatives such as collars are used by 21.4%.
Figure 5: Derivatives used for Oil price Risk
The hedging horizon of the firms varies between 1 to 6 years in which most of them
hedge only one to two years ahead. Apparently, oil-producing companies concentrate
their derivatives usage on the short term. The reason behind it is that oil producers
believe anticipating long term prices is irrelevant and almost impossible, therefore, they
shorten the hedging period to take advantage of the market spot price.
15 DERIVATIVE USE FOR FOREIGN CURRENCY RISK
50% of the derivative users (7 firms) hedge foreign currency risk. The most frequently
used contracts are forward contracts (used by 3 firms), followed by swaps, futures, and
options contracts with 1 firm each. The average hedging horizon is 2 years.
The majority of oil producing companies has international operations in different parts of
the world. However, because oil prices are quoted and traded in world markets using US
dollars, many US oil firms do not engage in foreign currency derivatives. The US dollar
is considered the primary currency for each of the companies' international operations.
The limited transaction that is completed on foreign currency is translated into US dollars
and recorded on the financial statements. In addition, most firms declared that instead of
engaging in currency derivatives, they balance their exposure to currency risk by
balancing monetary assets and liabilities and maintain domestic cash positions only at
levels necessary for operation purposes.
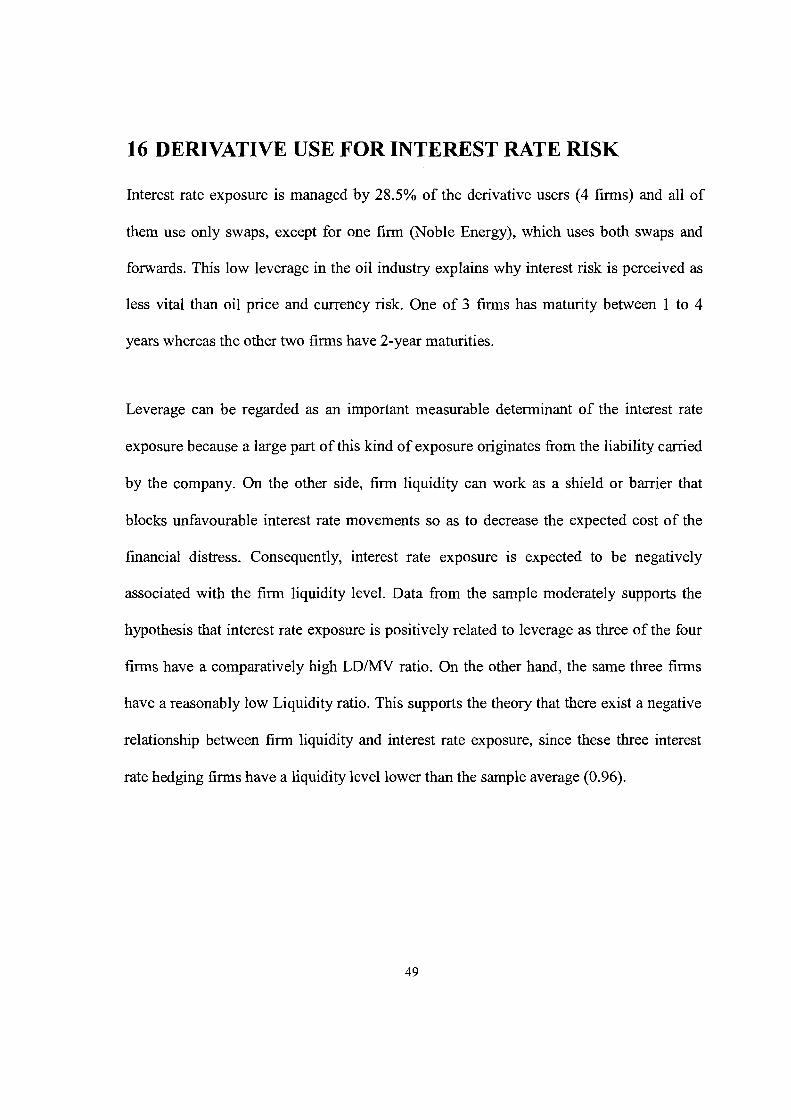
16 DERIVATIVE USE FOR INTEREST RATE RISK
Interest rate exposure is managed by 28.5% of the derivative users (4 firms) and all of
them use only swaps, except for one firm (Noble Energy), which uses both swaps and
forwards. This low leverage in the oil industry explains why interest risk is perceived as
less vital than oil price and currency risk. One of 3 firms has maturity between 1 to 4
years whereas the other two firms have 2-year maturities.
Leverage can be regarded as an important measurable determinant of the interest rate
exposure because a large part of this kind of exposure originates from the liability carried
by the company. On the other side, firm liquidity can work as a shield or barrier that
blocks unfavourable interest rate movements so as to decrease the expected cost of the
financial distress. Consequently, interest rate exposure is expected to be negatively
associated with the firm liquidity level. Data from the sample moderately supports the
hypothesis that interest rate exposure is positively related to leverage as three of the four
firms have a comparatively high LDMV ratio. On the other hand, the same three firms
have a reasonably low Liquidity ratio. This supports the theory that there exist a negative
relationship between firm liquidity and interest rate exposure, since these three interest
rate hedging firms have a liquidity level lower than the sample average (0.96).
17 CONCLUSION
This paper examines the post SFAS No. 1331138 derivative use by 15 US oil-producing
companies. It assesses the relationship between certain firm characteristics and risk
management practices. According to this paper's findings, oil price risk is the most
important risk exposure for the sample used, followed by foreign currency risk then
interest risk. Based on these findings, it is unclear whether or not firm size plays a main
role in the decision to engage in derivatives. Firms of different sizes do not use or limit
their derivative usage, whereas others of similar sizes are engaged in derivative usage.
Liquidity ratio and long term debt appear as factors in a firm's decision to hedge. Also, It
has been found that liquidity ratio has a negative relationship with hedging; the higher
this ratio the lower the tendency to hedge with derivatives. On the other hand, the long-
term debt level is found to have a positive relationship with derivative usage; the higher
this level, the higher the tendency to hedge. Eleven firms (78.5% of derivative users)
have provided a clear definition of the SFAS No 1331138 and have complied well with its
requirements. However, there appear to be different levels of financial disclosure as well
as a positive relationship between the volume of derivative usage and the level of
disclosure. Swaps are the dominant derivative used to hedge oil price risk, whereas
futures contracts were used more to hedge foreign exchange risk. Short hedging horizons
are chosen by most firms for all three risks with relatively longer horizons, on average,
for interest rate risk. Finally, this paper found that SFAS No 1331138 does not affect
financial disclosure, hedging product choice or accounting treatment for derivatives.
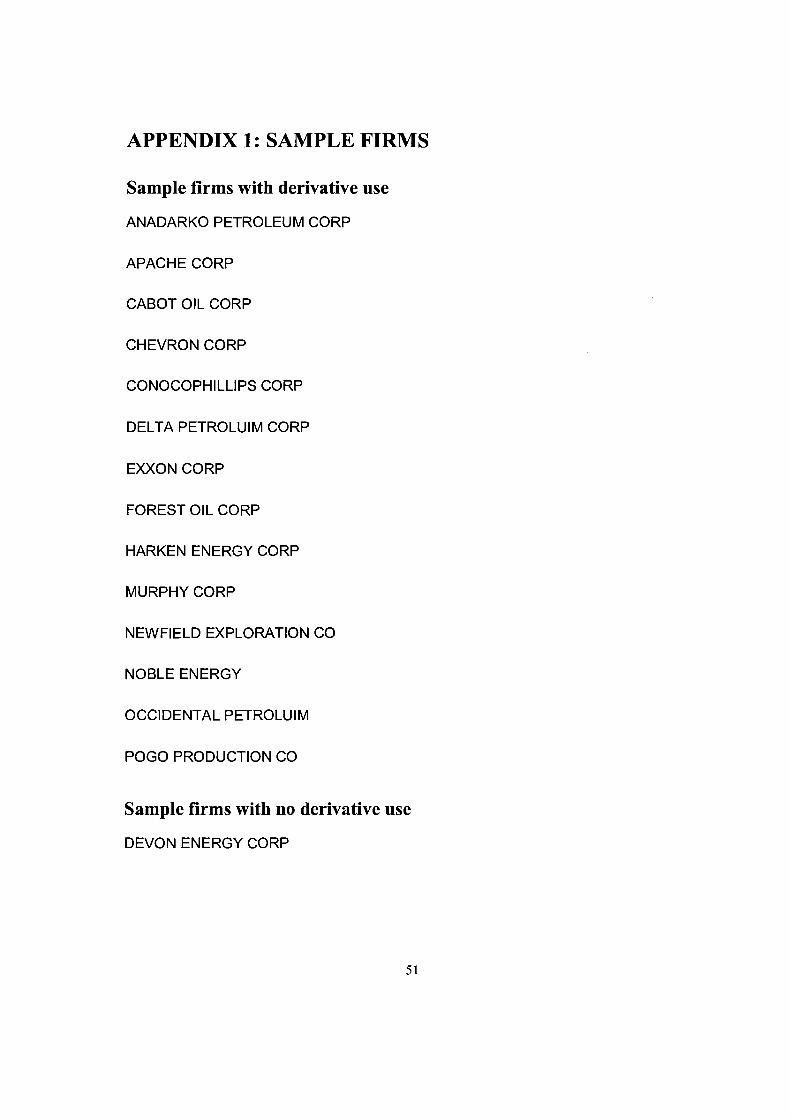
APPENDIX 1 : SAMPLE FIRMS
Sample firms with derivative use
ANADARKO PETROLEUM CORP
APACHE CORP
CABOT OIL CORP
CHEVRON CORP
CONOCOPHILLIPS CORP
DELTA PETROLUIM CORP
E M O N CORP
FOREST OIL CORP
HARKENENERGYCORP
MURPHY CORP
NEWFIELD EXPLORATION CO
NOBLE ENERGY
OCCIDENTAL PETROLUIM
POGO PRODUCTION CO
Sample firms with no derivative use
DEVON ENERGY CORP
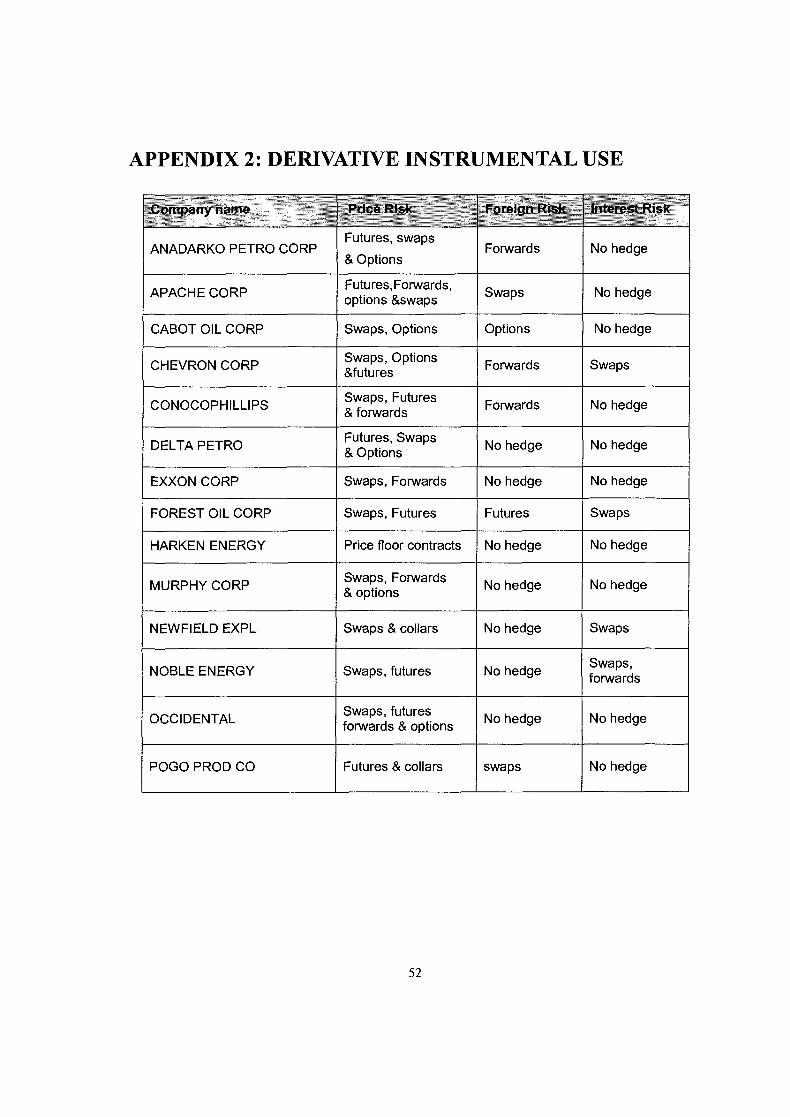
APPENDIX 2: DERIVATIVE INSTRUMENTAL USE
Company name
Futures, swaps
& Options ANADARKO PETRO CORP Forwards
APACHE CORP Futures,Forwards, options &swaps Swaps No hedge
CABOT OIL CORP Swaps, Options Options
Forwards
No hedge
Swaps CHEVRON CORP Swaps, Options &futures
Swaps, Futures & forwards Forwards No hedge
DELTA PETRO Futures, Swaps & Options No hedge No hedge
No hedge EXXON CORP Swaps, Forwards No hedge
FOREST OIL CORP Swaps, Futures Futures Swaps
No hedge HARKEN ENERGY Price floor contracts No hedge -
MURPHY CORP Swaps, Forwards & options No hedge No hedge
NEWFIELD EXPL Swaps & collars No hedge Swaps
Swaps, forwards
No hedge
NOBLE ENERGY Swaps, futures No hedge
No hedge OCCIDENTAL Swaps, futures forwards & options
- --
POGO PROD CO Futures & collars No hedge swaps
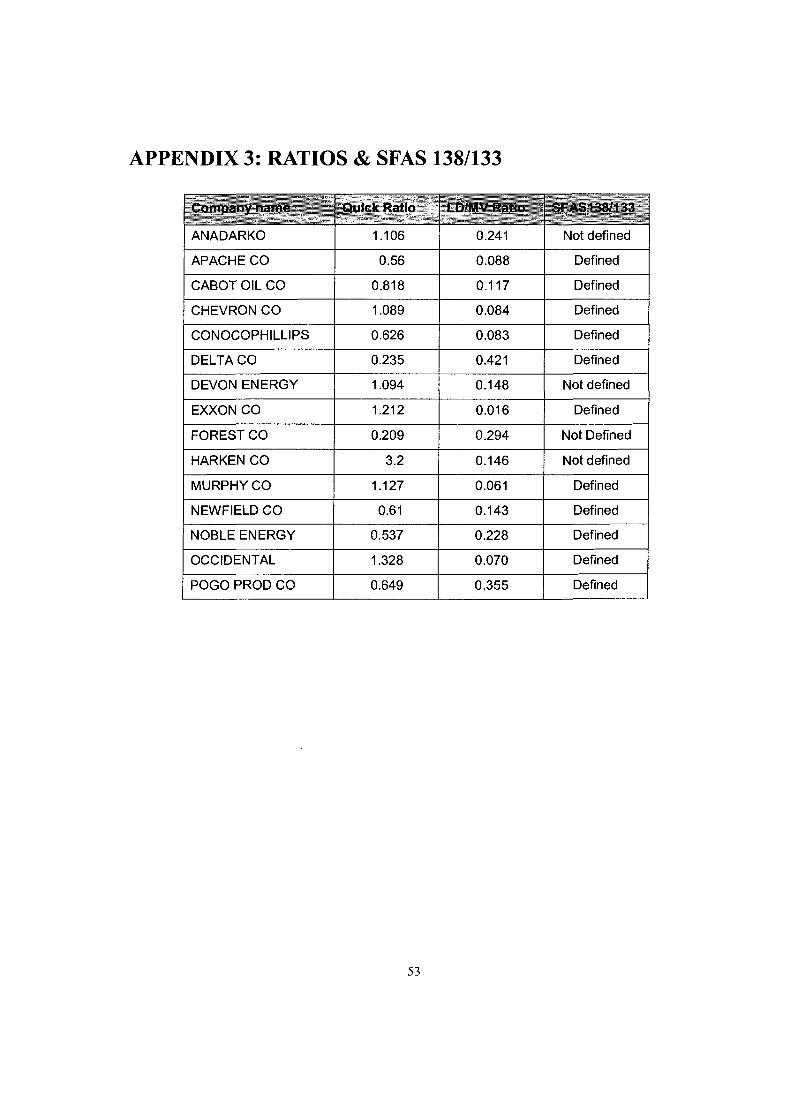
APPENDIX 3: RATIOS & SFAS 1381133
1 ANADARKO ( 1 .lo6 1 0.241 1 Not defined I ( APACHE CO I 0.56 1 0.088 1 Defined I
Company name " . f .Quick Ratio LOiMV Ratio
I CHEVRON co 1 1.089 1 0.084 1 Defined I
8FAS138M33
I I I
I CONOCOPHILLIPS 1 0.626 1 0.083 1 Defined 1
CABOT OIL CO
( DELTA CO 1 0.235 1 0.421 1 Defined I
0.81 8
I I I
0.1 17
DEVON ENERGY
FOREST CO
HARKEN CO
Defined
I I I
1.094
0.209
3.2
MURPHY CO
NEWFIELD CO
NOBLE ENERGY
0.148 I Not defined
OCCIDENTAL
POGO PROD CO
0.294
0.146
1.127
0.61
0.537
Not Defined
Not defined
1.328
0.649
0.061
0.143
0.228
Defined
Defined
Defined
0.070
0.355
Defined
Defined
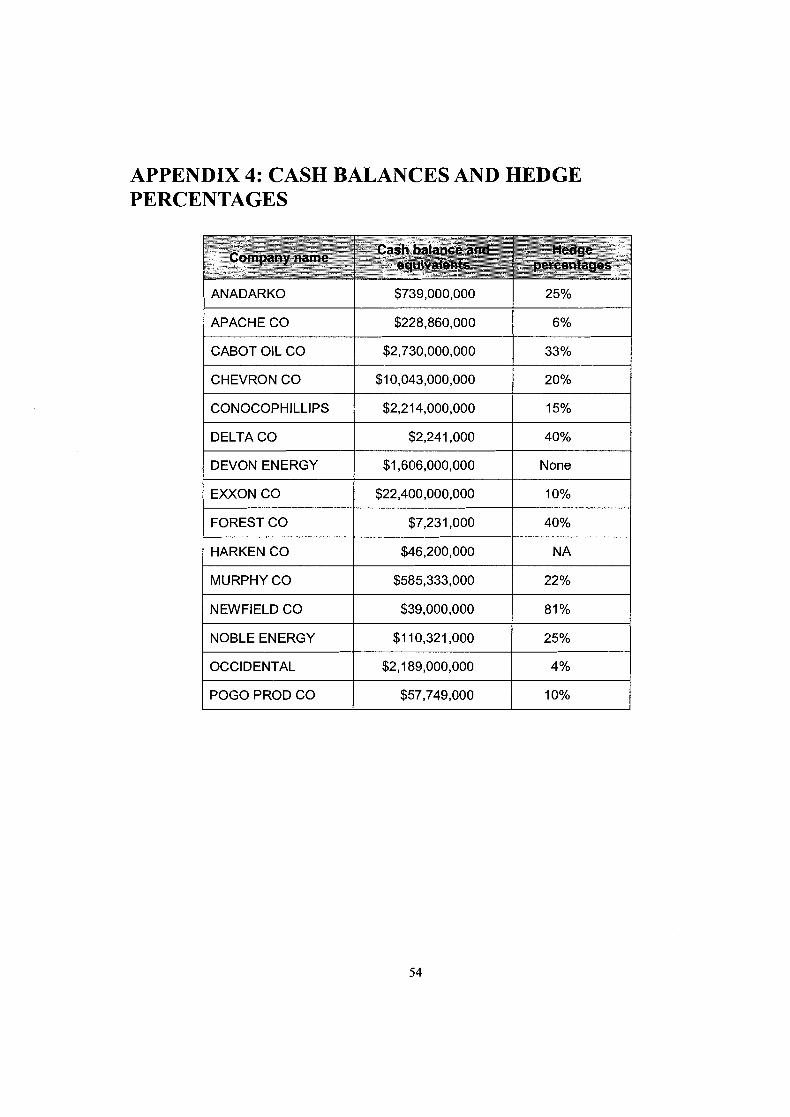
APPENDIX 4: CASH BALANCES AND HEDGE PERCENTAGES
Company name
CABOT OIL CO 1 $2,730,000,000 1 33%
ANADARKO
APACHE CO
CHEVRON CO 1 $10,043,000,000 / 2 0 1
Cash balance .and equivalents
Hedge percentages
$739,000,000
$228,860,000
FOREST CO I $7,231,000 1 40%
I
25%
6%
DELTA CO
DEVON ENERGY
EXXON CO
NOBLE ENERGY 1 $110,321,000 1 25%
$2,241,000
$1,606,000,000
$22,400,000,000
HARKEN CO
MURPHY CO
40%
None
10%
$46,200,000
$585,333,000
OCCIDENTAL
POGO PROD CO
NA
22%
$2,189,000,000
$57,749,000
4%
10%
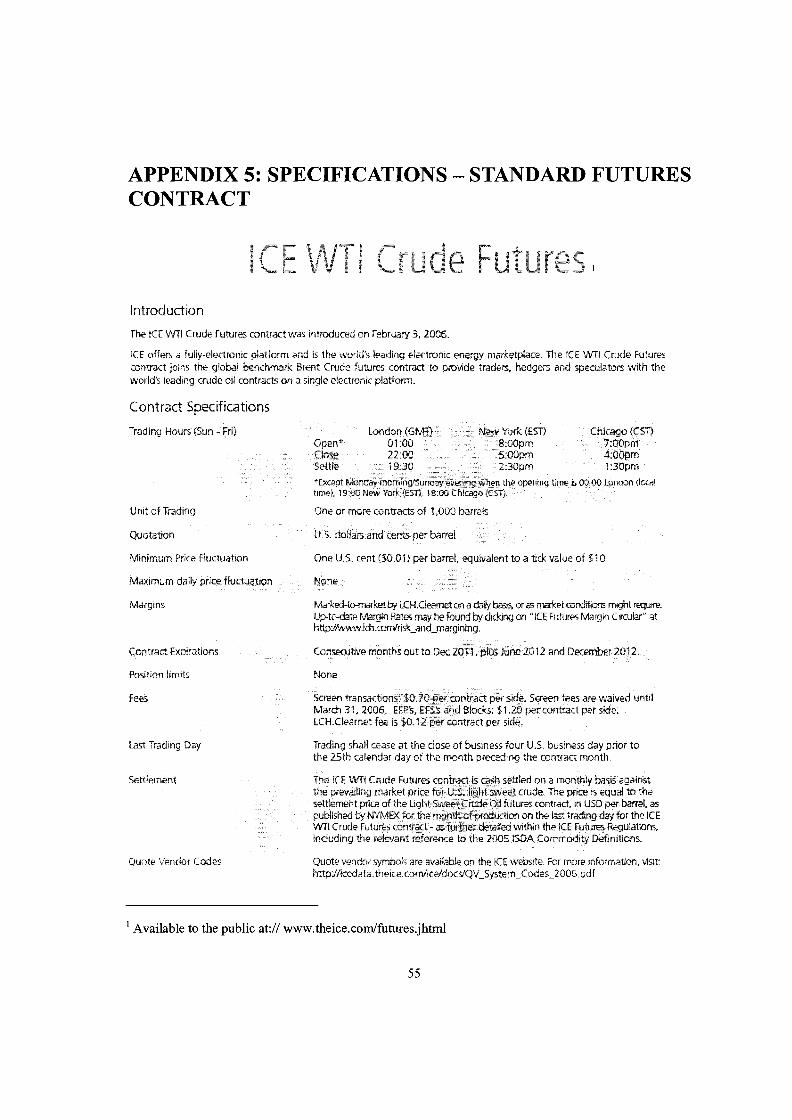
APPENDIX 5: SPECIFICATIONS - STANDARD FUTURES CONTRACT
Introduction
The ICE iWl Crude F u t u r ~ contract was mtroduced on Felwuary 3,2005
ICE offers a fully-electron~c platform and IS the mrfds leading electrun~c EnerQy marketplace. Tke ICE LtTt Cude Filture contract joins the global hefichmrk Brent Crude futures con t ra Lo prowde traders, hedgers and speculators with the wolld's ieadtng uude oif contracts on a s~ngle electrclnrc platform.
Contract Specifications
Trading Hours 6un - Frii
Un~t of Tradmg One or more contracts of 1,000 barrels
Quotatron U.5. dolas and cents per barral
M~nimum Pr~ce Fluctuation One U S cent ($0 01) per barrel, equwalent to a tttk value of $1 0
Maximum dally prfce fluctuation None
Contract fxplrations Cons~.cutrve months out to Dec 2011 I , plus lune 2012 and December 2012,
Position hmrts None
Fees Screen transactrons: $0.70 per contract per side. Screen fees are waived untrl March 31, 2W6. ESP's, EFS's and Bbcks: $ 1 20 per contract per side, LCH.Clearnet fee is $0.12 per contract per s~de.
Last 7r;ldlng Day
Settlement
Ouote Vendor Codes
Trading shall cease at the close of bustness four 13.5 business day prior to the 25th calendar day of the morlth pr~cedrng the contracr month
The LCE t%Tl Crude Futures contract is cash settled on a monthiy bark against the prwa~llng market price for US, light sweat crude f i e price 5 equd to the s&lernent pnce of the L~ght %we& CmdeQi! futures contract. m USD per t~rrel, as published by PIYEAR for the mn% d wt~on on the bsf trading day tor the ICE 'Nfl Crude Futures contra2 - a'Fut%ier detailed wthtn the 1CE Futures Regu ations. incfudrrtg the relevant reference to rhe 2005 EEA Cornmodikj Dehnrtrons.
C)~rote vendor symboir are avadable oq the ICE wehstte For more rnforrna~m, usit i-ittpi/icedata.theice cudrcdd,'clncsiQ~J_5ystem-Codes-2006 pdf
1 Available to the public at:// www.theice.com/futures.jhtml
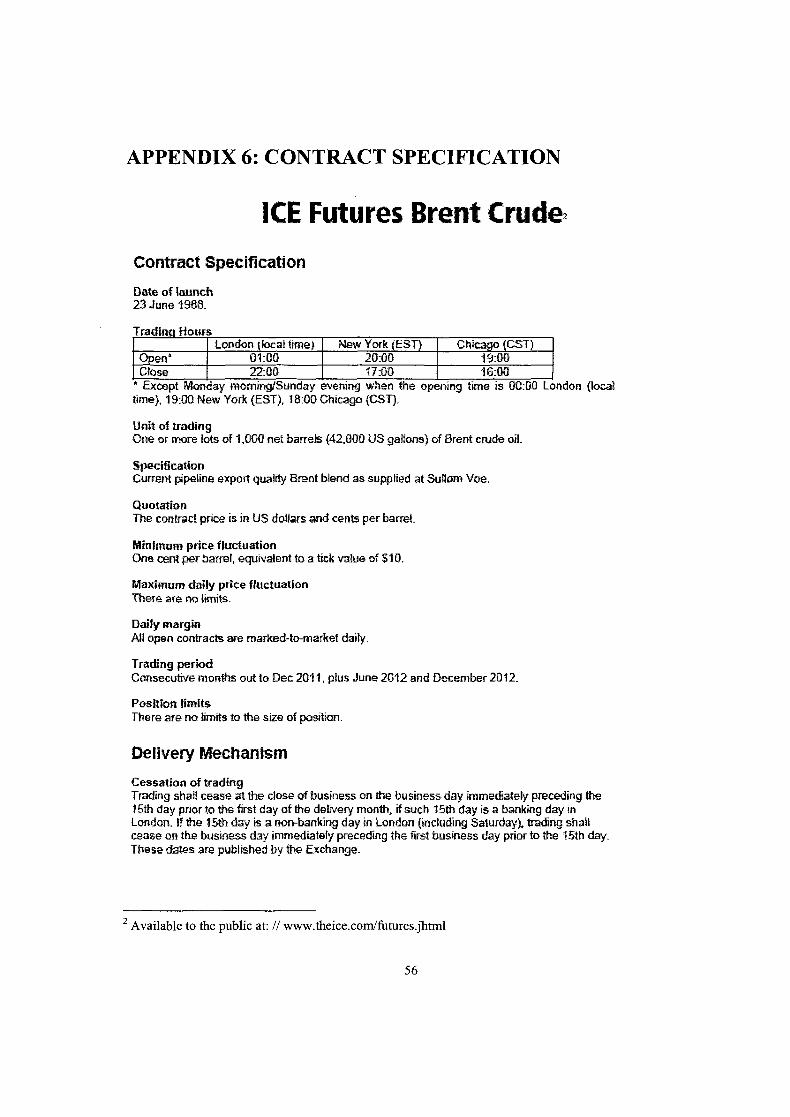
APPENDIX 6: CONTRACT SPECIFICATION
Contract Specification
Date of bunch 23 June 2988.
ndon (local time), 19:00 New Yo& [EST). 18.00 Chicago (GST).
Unit of trading One or more lots of 1.0011 net barrels (42,000 US gakms] of Brent crude oil
Spcifimtion Current pipeline export quality B~ent blend as supplied at Sulim Vm.
Quotation The conb-act price is in US dollars and cents per barrel.
Minimum price fluctuation One cent per barrel, equrwalent to a tick value d $20.
Maximem daify price fluctuation There are no limits.
Daify margin At open contracts are marked-to-rnarltet daily.
Trading period Cmsecutlve months out to Dec 201 1, plus June 20f2 and December 2012.
Position firnits There are nsr limits fa the slze of pasition.
Delivery Mec Cessation of trading Trading shell cease at the close of business on the business day immediabIy preceding the 15th day par to the first day of the delivery month, if such 15th day is a banking day in Londan. If Bkre 95th day is a eon-banking day in London (including Saturday), trading shall cease on the busmess day immediately preceding the first btlsrness day pior to the il5ti-i day. These dates are putrkshed by the Exchange.
Available to the public at: /I www.theice.corn/fitures.jhtrnl
5 6
REFERENCES
Works Cited
Allayannis, G. and Weston, J,(2001), The use of foreign currency derivatives and firm market value, Review of Financial Studies, 14,243-276.
Bloomberg.com (2006) Website by membership only, http://www.Bloomberg.com, accessed June, 2006
Eydeland, Alexander & Wolyniec, Krzysztof (2004), Energy and Power Risk Management: New Developments in Modeling, Pricing and Hedging. UK: Risk Books.
Froot,K. Scharstein, D and Stein, J (1993), Risk -management: coordinating corporate investment and financing policies. Journal of Finance, 48, 1629- 1648.
Graham, J & Daniel, R ( 2002) Do firms hedge in response to tax incentives? Journal of Finance,57, 815-839.
Guay,Wyne, and S.P Kothari, (2003), how much do firms hedge with derivatives? Journal of Financial Econometrics 80,423-461.
Harris Trevor, and Ohelson, James (1987). accounting disclosure and the market's Valuation of oil and gas properties, Accounting Review 62,65 1-670.
Haushalter,D.(2000), Financing policy, basis risk, and corporate hedging: evidence from oil and gas producers, Journal of Finance, 5 5,107-1 52.
Jin, Y. and Jorion, Phillippe ( 2006), Firm value and hedging : Evidence from U.S. oil and gas producers, Journal of Finance, 2, 893-9 19.
Kaminski, Vincent (2004), Managing energy price risk: the new challenges and solutions, London UK: Risk Books.
Mayer, D& Smith, D (1982). On the corporate demand for insurance. Journal of Business, 55, 281-296.
Mian, Shehzad, (1996), evidence on corporate hedging policy, Journal of Financial and Quantitative Analysis 3 1,419-439.
Nance, D. Smith, C.& Smithson, C (1993). On the determination of corporate hedging, Journal of Finance, 48,267-284.
Smith, C. and Stulz, R., (1984), The determinants of firm's hedging policies. Journal of Financial and Quantitative Analysis, 20,391-405
Stulz, R.(1996). Rethinking risk management, Journal of applied Corporate Finance, 9, 8-24.
Companies Researched
Anadarko Petroleum Corp. www .anadarko.com
Apache Corp.http://www.apachecorp.com
Cabot Oil Corp.www.cabotog.com
Chevron Corp.www.chevron.com
Conocophillips Corp. www.conocophillips.com
Delta Petroleum Corp. www.deltapetro.com
Exxon Corp.www.exxon.com
Forest Oil Corp.www.forestoil.com
Harken Energy Corp. www.harkenenergy.com
Murphy Corp. www.murphyoilcorp.com
Newfield Exploration Co.www.newfld.com
Noble Energy www.nobleenergyinc.com
Occidental Petroleum. www.oxy.com
Pogo Production Co. www.pogoproducing.com
Devon Energy Corp. www.devonenergy.com