Embed Size (px)
Citation preview

Munich Personal RePEc Archive
Hedging currency risk: Does it have to
be so complicated?
Haefliger, Thomas and Waelchli, Urs and Wydler, Daniel
Pictet Strategic Advisory Group, University of Bern
2002
Online at https://mpra.ub.uni-muenchen.de/26451/
MPRA Paper No. 26451, posted 10 Nov 2010 01:03 UTC

Hedging Currency Risk: Does It Have to Be so Complicated?
Thomas Haefliger
Pictet Strategic Advisory Group
Bärengasse 25
8001 Zürich
Telephone: + 41 (58) 323 78 88
Fax: + 41 (58) 323 77 50
E-Mail: [email protected]
Switzerland
Urs Wälchli
Universität Bern
Institut für Finanzmanagement
Engehaldenstrasse 4
3012 Bern
Telephone: +41 (31) 631 34 78
Fax: + 41 (31) 631 84 21
E-Mail: [email protected]
Switzerland
Daniel Wydler
Bank Von Graffenried AG
Marktgasspassage 3
3000 Berne 7
Telephone: + 41 (31) 320 51 00
Fax: + 41 (31) 320 52 11
E-Mail: [email protected]
Switzerland
First Draft: December 5, 2002
This Draft: June 16, 2003
2
Hedging Currency Risk: Does It Have to Be so Complicated?
Abstract
The question of whether foreign investments should be systematically hedged against
currency risk has not been clearly answered to date. Numerous theoretical and empirical
studies have provided contradictory conclusions. This paper examines to what extent foreign
bonds and equities are exposed to currency risk. Risk and return of different strategies are
aggregated over five reference currencies for a period from 1985 to 2000. The advantage of
this method is that the results do not depend much on the time period chosen. Empirical
evidence confirms the hypothesis that currency hedging should be fully applied to foreign
bonds, whereas foreign equities should not or only partially be hedged.

3
Introduction
International diversification has now become an established practice for most investors.
However, the impact of foreign currency risks is still a debated key issue. Are there benefits
from taking currency risks or should the investor avoid them? Various studies have shown1
that in the long run currency risk is only rewarded to a limited extent by higher returns. In
other words, the premium for currency risk is almost non-existent, or at least negligible. This
has important implications for investors when they come to define their investment strategy.
Unless they have predictive power, only a limited degree of currency exposure is advisable.
When setting up a strategy for currency risks, investors face a number of questions:
• Are bonds and equities 2 exposed to currency risks to the same degree?
• How important is the impact of diversification in global portfolios – Does it compensate
for the additional currency risk associated with foreign investments?
• Can the overall risk be significantly reduced by systematically hedging currency risk?
• Should the hedge ratio be less than one?
• Against which currency should the foreign investment be hedged: against the currency in
which the foreign investment is denominated, or against another currency such as the US
dollar, which in practice has the role of a key currency?
The drawback of most empirical studies in this field is that their results heavily depend on the
observation period chosen. If, for example, they relate to a period when the US dollar was
strong, the conclusion in most cases will be that US investors should hedge their foreign
investments against currency fluctuations, while non-US investors would be better off not
hedging their US investments at all. In this study we attempt to minimize this dependency on
1 See next section

4
a specific period. We do so by simultaneously considering the impacts for both investors
affected by movements in the exchange rate.
Our research shows that currency risk hardly carries any risk premium. Furthermore, bonds
and equities exhibit a fundamentally different currency risk exposure. As a result,
diversification benefits from going international do not compensate for the extra currency risk
taken in global bond portfolios. However, when the currency risks are hedged, a global bond
portfolio yields a better risk/return ratio than domestic bonds. This is due to interest rate
diversification. With equities, on the other hand, the diversification benefits are large enough
to offset the currency risk associated with foreign investments. Therefore, currency hedging
only marginally reduces the overall risk of the portfolio.
Literature
The question as to whether the currency risk is rewarded by higher expected returns has
produced some controversial answers in the literature. Many international asset pricing
models, such as developed by Solnik (1974), Sercu (1980) and Stulz (1981) consider the
currency risk as an additional risk factor; a price is therefore assigned to this risk. Dumas and
Solnik (1995) examine the model developed by Adler and Dumas (1983) and conclude that in
the past the currency risk for the world’s four largest markets – the US, the UK, Japan and
Germany – has been compensated with a premium. They do not quantify the size of this risk
premium, however. De Sanits and Gerard (1998) also find evidence to support the argument
that an international asset pricing model should not only include a factor for the market risk,
but also a factor for the exchange rate risk. For equities, however, the premium associated
2 The empirical analyzes provided in this study are limited to these two asset classes.
5
with currency risk only appears to make up a small part of the overall risk premium. In
addition, this premium seems to be heavily dependent on the observation period chosen.
Perold and Schulmann (1998), on the other hand, describe currency hedging as a “free lunch”
over the very long run. Empirical evidence suggests that any variation in the exchange rate
corresponds roughly to the forward discount or premium and is not correlated with the other
variables, such as returns in local currency. Currency exposure may therefore be characterized
as a game of roulette: it implies a high degree of unsystematic risk without any risk premium.
When properly applied, currency hedging does not have any impact on the expected return (if
transaction costs are moderate), but yields a substantial reduction in the overall risk of an
international portfolio.
Glen and Jorion (1993) also conclude that the performance of optimized equity and bond
portfolios is significantly improved by currency hedging. But for portfolios that are optimized
on a unhedged basis, currency hedging provides virtually no extra benefit. Asset and currency
allocation should therefore be simultaneously optimized.
Froot (1993) argues that “Hedge Friends” are myopic. In the short term it certainly is possible
to reduce variance through currency hedging. With an investment horizon of up to five (eight)
years, a hedge ratio close to 100% is therefore recommended for equities (bonds). In the
medium term, however, Froot recommends a significantly lower hedge ratio of around 35%.
But if an investor has an investment horizon of more than 10 years, hedging the currency risk
no longer improves performance. In this case, he argues, fluctuations in real exchange rates
are no longer stochastic, but follow a mean reversion. Froot therefore suggests a strategy of
“going naked”, i.e. a hedge ratio that is close to zero. However, his research is restricted to the
6
view of a British investor investing in the US market so it is questionable whether the findings
are universally valid.
It would seem that neither one extreme (100% hedging) nor the other (no hedging at all) is an
ideal solution. The question of the appropriate currency hedge ratio is still not answered.
Black (1990) comes up with a universal hedge ratio which implies that in the equilibrium all
investors – whatever their nationality – hold the same market portfolio and strive for the same
hedge ratio. Because of Siegel’s Paradox (see 2.2), this hedge ratio is significantly below
100%.
The problem is how to identify this optimal hedge ratio, as it depends on a number of
parameters such as the relative preferences of different nations or risk aversion, which in
reality cannot be objectively measured. Black (1989) illustrates how heavily the optimal
hedge ratio is influenced by the factors used: depending on the underlying loadings of these
factors, the hedge ratio varies between 30% and 80% in his research. The central conclusion
remains therefore that neither one extreme (100% hedging) nor the other (no hedging at all) is
optimal. Some simplification is obviously necessary to produce a feasible hedging rule.
Gastineau (1995) therefore postulates a simple 50/50 rule: 50% of the currency risk should be
hedged, while the other 50% is left unhedged.
Another inevitable question is: How big is the exposure of domestic investments to
fluctuations in exchange rates? Or put differently: Should an American investor hedge his
holding in Coca Cola by going short in the US dollar and going long in the euro? Jorion
(1990) shows that in the case of the US market, the returns on the stocks of multinational
companies included in the S&P 500 are influenced by currency movements. The stronger a

7
company’s international exposure, the greater the impact of currency swings on its share
price. Diermeier and Solnik (2001) show similar results for the eight biggest capital markets.
Hypotheses
Currency risk: a zero-sum game? We wonder whether currency risk is not simply a zero-
sum game. Shouldn’t the profit a Swiss investor makes on US investments when the dollar
appreciates against the Swiss franc be offset by the loss that an American investor makes on
Swiss investments? In theory the answer to this question is no. According to Jensen’s
Inequality theorem, the profit made when a currency appreciates is always greater than the
loss suffered in the depreciating currency. This phenomenon is also known as Siegel’s
Paradox. Black (1989) argues that because this difference is always positive, hedging the
entire currency risk would not be efficient.
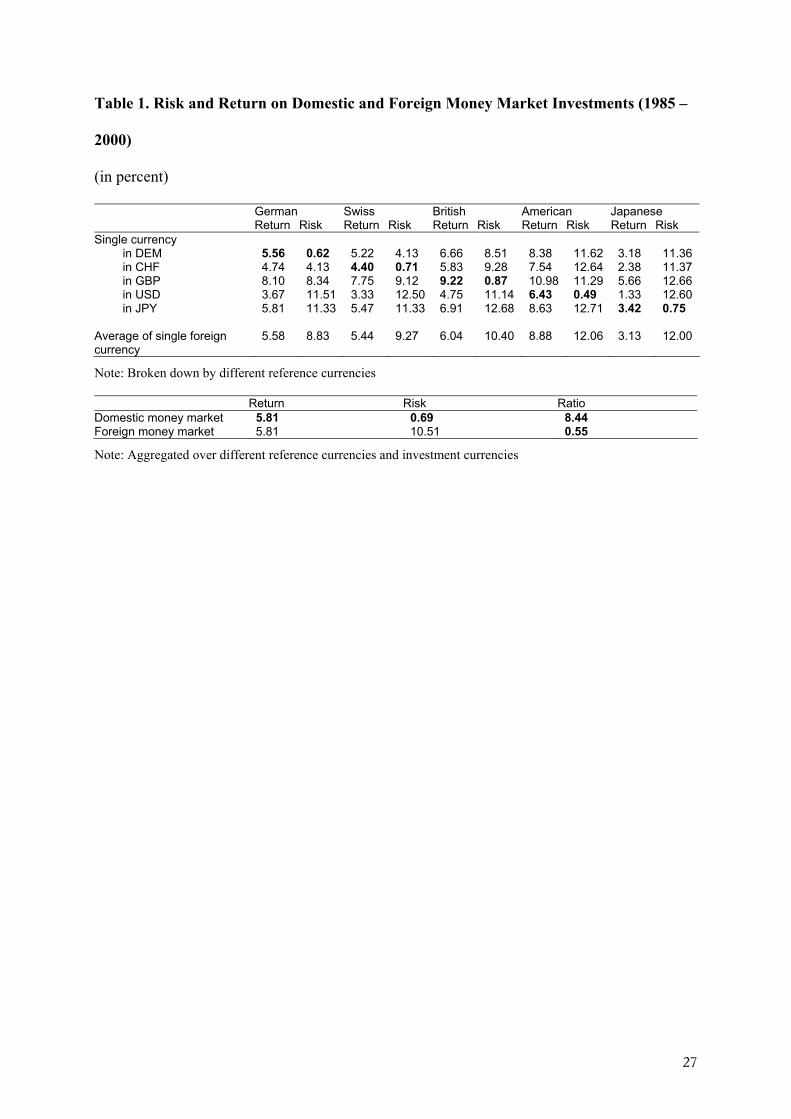
So the question is whether this theoretical phenomenon is also materially important. To find
the answer, we analyze returns and risks of money market investments, denominated in both
domestic and foreign currency, experienced on average by investors in Switzerland, Germany,
the UK, the US and Japan during the period 1985 to 2000. We explicitely choose money
market 3-months investments in order to minimize any interest rate risk and to emphasize
currency risk.3
[insert Table 1]
Siegel’s Paradox would lead us to expect that foreign investments would on average yield
higher returns than domestic investments. Apparently, this assumption is not true (see Table
3 Our methodology is described in the following chapter.

8
1). Despite the significantly higher risk, foreign money markets on average do not offer
superior returns. Table 1 shows that the average return on both domestic and foreign money
markets was 5.81% p.a. after aggregating across all investors and investment currencies. If we
look at the third figure after the decimal point, we can see that foreign investments exhibit a
premium. But the 5.814% return on the foreign money market is only marginally higher than
the return achieved on the domestic money market (5.805%).
However, investing in foreign rather than domestic money market instruments increases risk
(standard deviation) substantially. For instance, the risk for German investors in their home
market is 0.62% p.a. compared to a volatility of between 4.13% and 11.51% p.a. in foreign
money markets. As Table 1 shows, the average risk for all domestic investments of all
investors comes to 0.69% p.a., which is substantially lower than the average risk for all
foreign investments (10.51% p.a.).
We therefore conclude that foreign currency investments do not offer a significantly higher
return. This is confirmed by the marked dominance of domestic investments over foreign
investments when the return/risk ratio is examined: while domestic investments exhibit a
return of 8.44% per unit of risk, this ratio is as low as 0.55% p.a. for foreign currency
investments. Siegel’s Paradox is apparently not very predominant in the markets we examined
in this study. In what follows, we therefore consider the currency risk to be a zero-sum game.
Foreign currency risks of bonds and equities. Like money market instruments, foreign
currency bonds are also exposed to a substantial foreign currency risk. If we only hold
domestic bonds, we expect the interest rate exposure to be dominated by the currency risk
6 For example, see Denzler and Müller, 2000.

9
when going international. We postulate that if we hold an international portfolio, the benefits
from interest rate and currency diversification are not sufficient to compensate for the
additional currency risk, compared to a domestic bond portfolio.
Unlike fixed-income investments, it is questionable whether foreign equities have a higher
exposure to foreign currency risk than domestic equities. A share represents a partial
ownership of a company and does not embody any fixed payment rights. The share price is
based on the company’s expected future cash flows which, in turn, are directly or indirectly
influenced by the fluctuations in exchange rates. Shares in the Swiss multinational food giant
Nestlé, for example, carry a multiple currency risk even for Swiss investors, despite the
company being headquartered in Switzerland and its shares being listed on the Swiss Stock
Exchange. This is due to the company’s multinational business activities and its resulting
currency exposure. This makes it quite difficult to determine the true identity and the size of
the currency risks associated with the shares. The extent to which currency risks are already
hedged by the company’s risk management also has to be taken into consideration. From a
financial viewpoint it is therefore not clear a priori whether foreign equities carry a greater
currency risk than domestic equities, and whether currency hedging helps to significantly
reduce this risk.
Hypotheses for empirical analyses. Keeping in mind our conclusion from the previous
section that taking foreign currency risk is not rewarded by significantly higher expected
returns, we concentrate solely on aspects of risk in the remainder of this article. In other
words, we assume that on average (and before costs) domestic and foreign investments
generate the same returns.
As far as the differences in risk are concerned, we postulate the following hypotheses:

10
Hypotheses Bonds Equities
1. Foreign currency risk for
foreign investments
Foreign currency bonds are
fully exposed to currency risk.
Compared to domestic bonds,
their overall risk is therefore
higher. Yet, this currency risk
can be fully eliminated
through an appropriate
hedging strategy.
Foreign equities do not
necessarily carry a higher
currency exposure than
domestic equities. Their overall
risk should therefore not be
higher compared to domestic
equities. Currency hedging
does not reduce risk.
2. Impact of international
diversification
Without currency hedging:
Diversification reduces a
small amount of the overall
risk, but the extra risk due to
foreign currency exposure is
not eliminated.
With currency hedging: Due
to interest rate diversification
and the absence of currency
risk (thanks to hedging), a
globally hedged portfolio has
a lower risk than one
containing domestic bonds
only.
Without currency hedging:
Diversification substantially
lowers the overall risk. A
global foreign portfolio is less
risky than a portfolio
containing only domestic
equities.
With currency hedging: There
is no further risk reduction
from hedging the currency risk
of a fully diversified equity
portfolio.
11
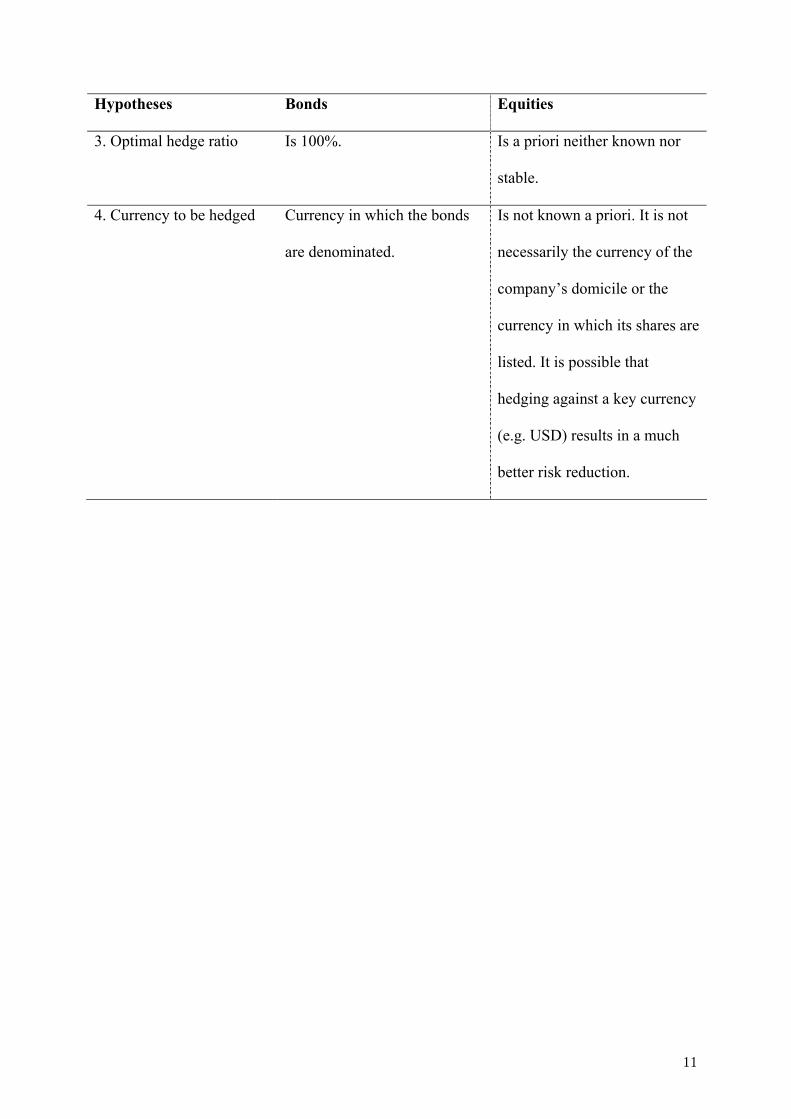
Hypotheses Bonds Equities
3. Optimal hedge ratio Is 100%. Is a priori neither known nor
stable.
4. Currency to be hedged Currency in which the bonds
are denominated.
Is not known a priori. It is not
necessarily the currency of the
company’s domicile or the
currency in which its shares are
listed. It is possible that
hedging against a key currency
(e.g. USD) results in a much
better risk reduction.

12
Data and methodology
Data. Our analysis focuses on the five financial markets of Germany, Switzerland, the UK,
the US and Japan. We concentrate on investments in equities and government bonds over the
period 1985 to 2000. All our data come from Ibbotson Associates. For the money market (see
section "Hypotheses") and the bonds we use Total Return Indices of Salomon Smith Barney.
For the equity markets we use the MSCI total return indices. The exchange rates are also
supplied by Ibbotson.
In order to capture investor’s experience, we test the hypotheses formulated in the previous
section by using different portfolio strategies. Throughout the paper we work with simple
returns and present our results on an annualized basis. In order to produce a practicable
investment strategy, continuous hedging is not applied when calculating currency-hedged
strategies. Instead, the hedging positions are only adjusted on a monthly basis, with an
offsetting position taken up in the foreign money market. Any changes in the value of the
underlying assets are therefore exposed to currency risk. Small deviations from the targeted
hedge ratio are therefore possible during the month. For mixed currency portfolios we use a
buy-and-hold methodology as it has the following three advantages: First the results do not
depend on any mean revision pattern in the FX market, second investors typically are
benchmarked by a global index based on market capitalization and thus follow buy-and-hold
rather than a frequent rebalancement, and third, less transactions consts are implied.
Analyzed Strategies. We will examine the following five strategies for equities and bonds:
1. Domestic Investments: investments in domestic government bonds or domestic equities.
2. Single Foreign Currency Investments: investments in bonds or equities denominated in a
single foreign currency or from a single country.

13
3. Multi Foreign Currency Investments: investment in a global portfolio of foreign currency
bonds or equities. The starting point is an original equal weighting of the four foreign
markets as of December 1984, but without any rebalancing (i.e. a buy-and-hold strategy).
4. Hedged Single Foreign Currency Investments: Same as strategy 2, but fully hedged back
to the respective reference currency.
5. Hedged Multi Foreign Currency Investments: Same as strategy 3, but fully hedged back to
the respective reference currency.
Particular features of the analysis method. Because of the relatively short observation
period of 72 months, there will be some reference currencies where the extra risk associated
with an international strategy paid off, and others where it did not. To produce a more general
statement, and one that is less dependent on a specific period, we will base our conclusions
mainly on the aggregate statistics for each strategy.
For each strategy we therefore calculate the average of all the mean values and standard
deviations, taking the aggregate figures for all reference currencies and investment currencies.
For example, with Strategy 1 (domestic investments only) we work out the five returns and
standard deviations across the five reference currencies. In the case of Strategy 2 we first take
the standpoint of view of the five investors considered, and determine the average risk and
return they would have achieved by investing in single currency foreign bonds or equities. In
the next step we take the overall average of the five averages just calculated; this gives the
average of 20 values. With this method we can obtain a “general” statement, such as whether
a foreign investment was worthwhile, or whether it only incurred additional risks. Currencies
which “coincidentally” performed well during a period are neutralized by the corresponding
weakness in other currencies. This allows us to draw general conclusions.

14
However, a great deal of caution is advised when interpreting the results obtained from this
method of aggregating the average returns and volatilities across different currencies. The
aggregated values are not meaningful in absolute terms. They do however provide a useful
comparison between the different strategies, as in the case of our aggregate statistics each
reference currency has the same weighting. Furthermore, compound interest calculation
implies that the average returns are not comparable between single currency and multi-
currency strategies. In purely mathematical terms, the weighted average of the returns of
different assets on a non-annualized basis (in our study this is equivalent to the return on
domestic investments and single foreign currency investments) is the same as the return on
the suitably weighted portfolio (return on multi foreign currency strategies).
But due to Jensen’s Inequality theorem, the annualized portfolio return always exceeds the
average value of the annualized return on single currency strategies. This is best illustrated by
Table 2. As far as a Swiss investor is concerned, the return of the multi foreign country equity
portfolio was 66 basis points higher on an annualized basis than the average performance of
the individual markets. But the insignificance of this outperformance is confirmed by a
comparison on a non-annualized basis, which shows that there is no difference in returns at
all. Although this effect has been acknowledged in the literature, we do not think sufficient
attention is paid to it when making empirical calculations6.
[insert Table 2]
As far as the interpretation of the results is concerned, this means that the returns in the
aggregated statistics are only provided for illustration purposes. Any differences in returns are

15
not material but are almost exclusively attributable to the problem of compound interest. Our
analysis therefore focuses purely on volatility when looking at aggregated figures. For the
same reasons, we neither find it useful to calculate the Sharpe ratio nor to use different
measures of risk aversions across investors.
Results
Bonds. Table 3 shows the risks and returns of the different portfolios for investors in all five
countries. For all five investors it appears that unhedged foreign currency bonds are far riskier
investments than domestic bonds. While the volatility of the returns on domestic bonds was
between 3.40% (in CHF) and 6.53% (in GBP), foreign currency bonds posted double-digit
volatility figures, with a few exceptions. Even diversifying across several foreign currencies
(instead of just one) is not enough to eliminate the additional currency risk (see “Multi foreign
currency portfolio”). For investors in every country except the UK, the multi foreign currency
portfolio carried a risk which was more than double that associated with domestic bonds.
[insert Table 3]
Hedging the currency risk tends to bring back the overall risk of foreign bonds to roughly the
same level as that of domestic bonds. Especially for countries with volatile bond markets (i.e.
the UK, the USA, and Japan) hedged foreign currency bonds were in some cases significantly
less risky than domestic bonds. The pattern is very uneven as far as returns go. While Swiss
and American investors would have done well by investing in foreign bonds during the period
1985 to 2000, UK investors would have fared much worse. This also clearly shows how much
empirical studies are dependent on periods and currencies: while exposure to foreign currency
risks would have paid off for some investors – mistakenly taken as a risk premium - foreign

16
bonds were a poor choice for other investors, both in terms of risk and return.
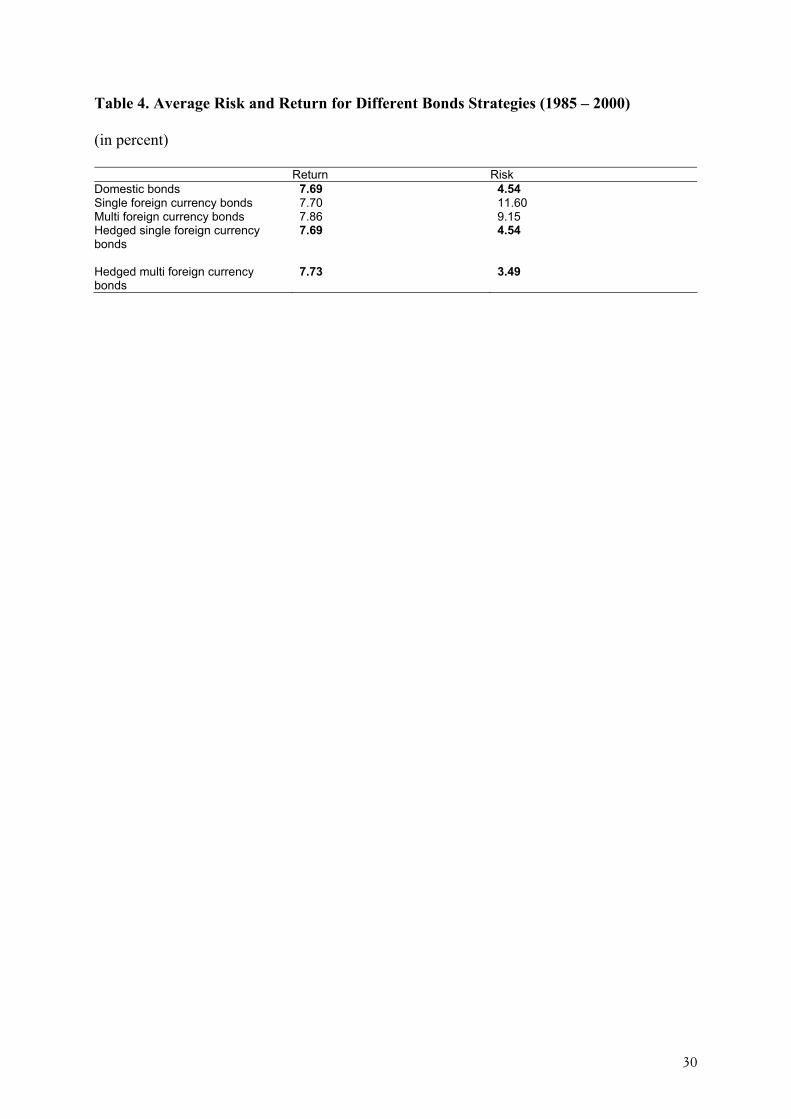
Aggregating the statistics across the various investments and reference currencies according
to our investment strategies allows us to make more general statements. Table 4 shows the
average risks and returns for investors from all five countries. As mentioned above, average
returns are not materially different across the different strategies. In fact the difference in
return within the single currency strategies is just 1 basis point, whereas the larger difference
in the mean return of the multi currency strategies (up to 17 basis points) is fully explained by
the compound effect of annualization.
[insert Table 4]
The results clearly show that foreign currency bonds are exposed to much higher risks than
domestic bonds. Investments in single foreign currency bonds carried an average risk of
11.60%, more than double that of domestic bonds (4.54%). It is also clear that these extra
risks cannot be eliminated through diversification across currencies. The risk of the multi
foreign currency bond portfolio is only about one fifth below the average risk of a single
currency bond investment (9.15% versus 11.60%)7 and is still significantly higher than the
risk of domestic bonds (4.54%).
The final question to consider is what effect currency hedging has on foreign currency bonds.
Table 4 shows that fully hedging the single currency bond investments on average yields the
same risk as for domestic bonds. If, however, the multi foreign currency bond portfolio is
7 The multi foreign currency strategy constructed in this study has not been optimised. However, we do not
think that an optimised currency mix would produce significantly different findings.
17
hedged against the currencies of its constituents8, this not only fully eliminates the additional
currency risk, but also offers the advantages of interest rate diversification. Compared to
domestic bonds, this allowed the average risk to be reduced by well over a fifth, from 4.54%
to 3.49% over the 16-year observation period.
As stated in Hypothesis 1, foreign currency bonds exhibit a substantially higher risk than
domestic bonds. Currency hedging, however, entirely eliminates currency risks. Our findings
also confirm Hypothesis 2, which states that currency diversification only marginally reduces
the extra risk of foreign currency bonds. On the other hand, on average, a multi foreign
currency bond portfolio with currency hedging is less risky than an investment in domestic
bonds.
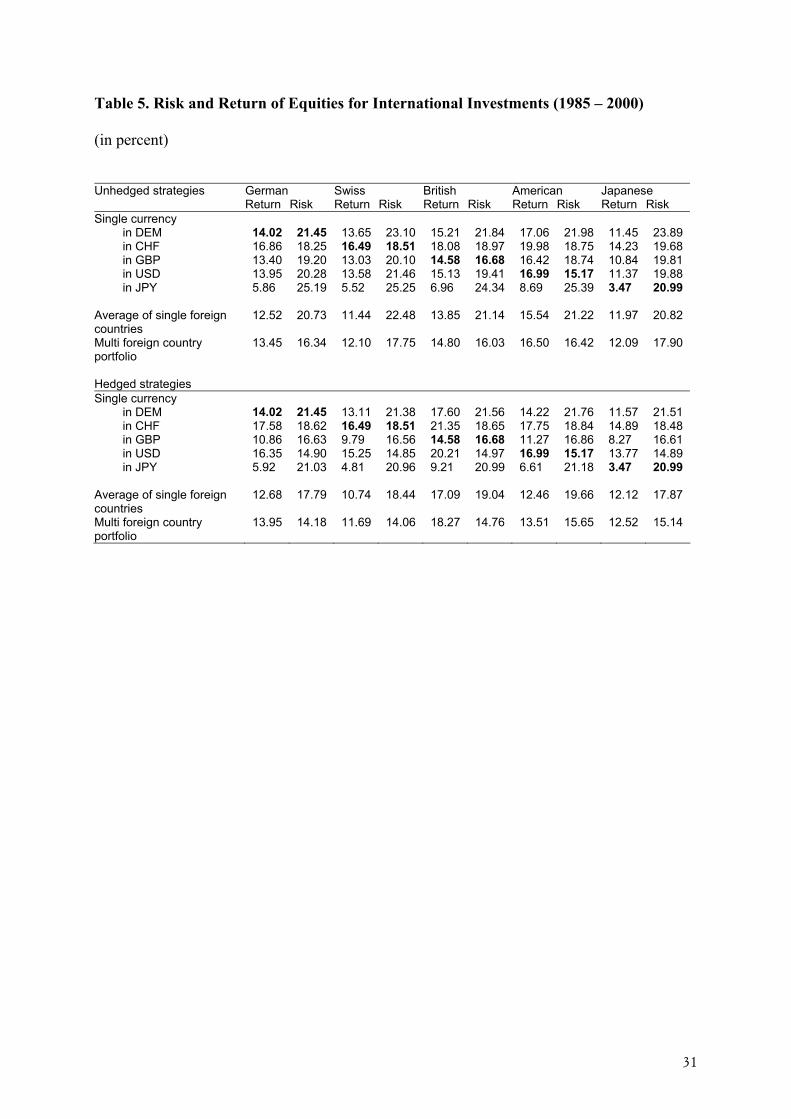
Equities. Table 5 shows the risks and returns for the different equity strategies from the
viewpoint of the five investors. Unlike with bonds, standard deviation figures do not exhibit
any clear pattern. Although it seems that domestic investments are slightly less risky than
foreign investments, the difference is not as pronounced as in the case of fixed-income
instruments. For German and Japanese investors, certain foreign markets (e.g. Swiss and UK
equities) even had less volatility than the home markets during the observation period.
Currency hedging seems to reduce the volatility of foreign investments to a certain extent.
When considering the performance of the foreign investments the benefits of hedging is less
clear across the reference currencies. While a British investor could have improved the
performance of his portfolio by hedging the currency risks, a hedging strategy would not have
paid off for US investors, as it would have cost around 300 basis points per year.
8 Here all the currencies have a hedge ratio of 100%.
18
[insert Table 5]
Obviously, these results are again dependant on the arbitrarily chosen observation period. To
reduce this dependency, the risks – and for purely indicative purposes also the returns – are
again aggregated in Table 6. Again we point on the fact, that the shown average returns are
practically the same across the different strategies. The largest difference in return arises
between the single country and the multi country strategy (up to 88 basis points). However,
this difference vanishes again as soon as returns are compared on a non-annualized basis. The
other return differences are 8 basis points or lower.
[insert Table 6]
The analysis shows that on average an investment in foreign equities only carried a slightly
higher risk (21.28%) than an investment in domestic equities (18.56%). So whereas foreign
currency bond investments would have had more than twice as much risk as domestic bonds,
the extra risk of foreign equities was only about a fifth more. By diversifying across different
foreign countries, the volatility can be reduced from of 21.28% (for a single foreign country
strategy) to 16.89% on average. With equities, the impact of diversification seems to be so
strong that a globally diversified portfolio of multi foreign country investments comes off
better even when compared to domestic equities. When aggregated over all investors, the risk
of a global portfolio (16.89%) was almost one tenth lower than the average risk of domestic
equities (18.56%). Currency hedging allowed this risk to be reduced even further (14.75%).
However, the additional risk reduction is quite small compared to the elimination of almost
two thirds of the overall risk with bonds.

19
Hypothesis 1, which postulates that foreign equities do not carry higher risks than domestic
equities, is therefore not confirmed in this strict formulation. The extra risk is small, however.
As a consequence, currency hedging tends to reduce the additional risk. Hypothesis 2 is
confirmed to some extent. The effect of diversifying across countries reduces the overall risk.
Currency hedging can in turn help to even further reduce risk, although not by very much. It
follows that contrary to our hypothesis, foreign equities are apparently exposed to some
currency risk of the country in which the shares are listed. On the other hand, this risk seems
to be relatively small. The question of whether this extra risk is attributable to foreign
currencies or to other factors, such as limited arbitrage as a result of the home country bias, is
left open.
Different hedge ratios. So far we have either not allowed for any hedging at all, or fully
(100%) hedged the securities against the currency in which they are listed. As we have shown
before, it is questionable whether 100% is effectively a suitable hedge ratio. Particularly with
equities, we postulate a very low and unstable correlation between the domicile currency (the
currency of the country where the securities are listed) and the return of the equities.
Therefore, unlike with bonds, the optimal hedge ratio for foreign equity investments might
not necessarily be 100% (Hypothesis 3). Furthermore, there is a correlation between the
different currencies. In order to test for the optimal hedge ratio, we calculate the average risk
and return for global foreign bond and equity portfolios with currency hedge ratios of 25%,
50%, 75% and 100%.
As shown in Tables 3 to 6 the overall risk of a portfolio of foreign investments can be reduced
through currency hedging. In other words, the overall risk of an unhedged foreign investment

20
(hedge ratio 0%) is higher than the risk of a fully hedged investment (hedge ratio 100%). For
example, an unhedged multi foreign country equity portfolio for an American investor had a
volatility of 16.42%, while the risk was 15.65% when fully hedged. This phenomenon can be
observed for all investors, both for bonds and equities.
Table 7 shows what happens to risk and return of multi foreign currency bond and equity
portfolios when we gradually increase the hedge ratio from 0% to 100%. We also show the
percentage risk reduction achieved by increasing the hedge ratio by another 25%.
[insert Table 7]
The results show that on average foreign currency bonds should be fully hedged. Compared to
partial hedging, the risk is much lower. A hedge ratio of 100% also seems to be the best
solution for equity investments. Focusing on the relative risk reduction, however, leads to
very interesting insights. With foreign currency bonds, additional risk reduction is important
for all the steps taken. Even increasing the hedge ratio from 75% to 100% reduces the risk by
another 15%.
With foreign equities, however, there seems to be less of a need for full hedging. On average
the risk reduction achieved is much lower than with bonds. The risk can only be reduced by
between 3% and 5% with every further increase in the hedge ratio. Increasing the hedge ratio
from 75% to 100% only reduces the risk by an additional 1%. This implies that full hedging is
not advisable for equities, particularly taking into account the transaction costs. As expected,
our Hypothesis 3 – which states that the adequate hedge ratio for bonds is 100% – is therefore

21
confirmed. Purely indicatively, the optimal hedge ratio for equities does not seem clear and is
possibly unstable, as suggested by Hypothesis 3.
Alternative hedge currencies. Finally, with a view to finding an easy to implement currency
hedging strategy, we analyze to what extent a strategy of hedging against a single “key
currency” is appropriate.
Here the main focus lies on Hypothesis 4, which states that the currency against which
securities should be hedged is clear for bonds, but not for equities. An investor might be better
off hedging his equities against another currency than the one in which they are denominated.
One simple idea is that such an alternative hedge currency could be the US dollar, because of
its position as the world’s most important trading currency. This would imply that all equities
owned by non-US investors should be hedged against the USD, while the US investor does
not need currency hedging at all.
[insert Table 8]
The effects of hedging against a leading currency are shown in Table 8. There are three
different hedging approaches: not hedging at all, fully hedging against the local currency
(“correct” hedging), and hedging against the US dollar.
In the last case, not only the USD-investments are hedged against the USD but also all the
other domestic and foreign investments. When “correctly” hedged, as much as 62% of the
overall risk of bonds can be eliminated on average. On the other hand, hedging against the
USD only reduced the risk by 13%. For equities, however, the two hedging approaches yield
only marginally different results. While hedging against the domicile currency of the equities

22
in question can cut the risk by 13%, consistent hedging against the USD eliminates as much
as 10% of the overall risk.
This is not actually a test for Hypothesis 4 – but it indicates that for equities, hedging against
the USD yields just as good results as hedging against the “correct” currency. Bonds,
however, have to be hedged against the currency in which they are denominated.
Conclusion
The question of whether foreign investments should be systematically hedged against
currency risk has not been clearly answered to date. Numerous theoretical and empirical
studies have provided conflicting conclusions. In this article we analyze some hypotheses in
the context of international diversification and the resulting foreign currency risk. We start by
postulating that foreign currency risk represents a zero-sum game. Even if theoretically not
true, we show that the impact of Siegel’s paradox is marginal at best. From this basic idea, we
develop a simple empirical method for evaluating the risk of domestic and foreign
investments. To ensure the stability and autonomy of results as far as the analysis period is
concerned, the calculations are aggregated over the various reference currencies. This method
allows us to draw inference regarding the risks of international investments, reducing the
impact of temporary and cyclical gains or losses from the perspective of individual base
currencies.
We show that bonds denominated in foreign currency are fully exposed to currency risk: on
average they are almost three times as risky as domestic bonds. By fully hedging the currency
risk, standard deviations are brought back to “domestic levels”. Next, we consider
investments in a multi-currency bond portfolio. Compared to a single foreign currency

23
investment, the unhedged bond portfolios show slightly lower volatilities on average, due to
international interest rate diversification. Still, this portfolio is more than twice as volatile as
an investment in domestic bonds. On average, only by fully hedging the multi-currency bond
portfolio against the corresponding currency basket one can achieve a lower risk than by
investing solely in the domestic bond market. If the multi-currency bond portfolio is hedged
against a single key currency (in our study against USD) rather than the corresponding
(“correct”) currency basket, only a slight reduction in risk can be achieved.
On average, international equity investments also show a higher volatility than investments in
domestic equities. Nevertheless, the extra risk for going international is much smaller than
with bond investments. Furthermore, this risk can be almost completely eliminated by
diversifying equities across countries. International diversification therefore plays a dominant
role in investing in equity markets. Contrary to our hypothesis, hedging currency risk still
helps to reduce some of the overall risk – but risk reduction is small. On the other hand, by
hedging the multi-country equity portfolio solely against the US dollar, one achieves almost
the same reduction in risk as by hedging against the “correct” currency basket.
Based on our empirical findings, the following rough guidelines have to be taken into account
when designing an investment strategy. Unless the investor has predictive power in the
currency market, currency risks must basically be eliminated, or avoided as much as possible.
Focusing on foreign currency bonds, the currency risk must be fully hedged. When fully
hedged, a global bond portfolio is preferable to domestic bonds.
Looking at foreign equities, some currency exposure can be identified, but it is impossible to
make a definite assessment of its scale or its economic properties (optimal degree of hedging,
24
dynamic changes, etc.). The extra risk is relatively small compared to the overall risk of
equity investments and can be eliminated through international diversification. This is the
reason why we suggest broad international diversification for equities, with either no currency
hedging at all or partial hedging at best.
Of course, certain reservations can be made about the methodology of our analysis. First, we
examine equally weighted portfolios rather than value weighted or even optimized portfolios.
Furthermore, we did not take into account potential diversification effects between the asset
classes, since we only look at pure bond or pure equity portfolios. However, we do not think
that this significantly affects the practical consequences we have drawn.
25
References
Adler, Michael, and Bernard Dumas. 1983. “International portfolio choice and corporate
finance: A synthesis.” Journal of Finance, vol. 38, no. 3, 925-984.
Black, Fischer. 1989. “Universal Hedging: Optimizing Currency Risk and Reward in
International Equity Portfolios.” Financial Analysts Journal, vol. 45, no. 4 (July/August), 16-
22.
Black, Fischer. 1990. “Equilibrium Exchange Rate Hedging.” Journal of Finance vol. 45, no.
3, 899-907.
De Santis, Giorgio, and Bruno Gérard. 1998. “How big is the premium for currency risk?”
Journal of Financial Economics 49, 375-412.
Denzler, Mathias, and Heinz Müller. 2000. “A Fallacy in Performance Measurement and Risk
Analysis.” Financial Markets and Portfolio Management vol. 14, no. 2, 189-193.
Diermeier, Jeff, and Bruno Solnik. 2001. “Global Pricing of Equity.” Financial Analyst
Journal, vol. 57, no. 4 (July/August), 37-47.
Dumas, Bernard, and Bruno Solnik. 1995. “The World Price of Foreign Exchange Risk.”
Journal of Finance vol. 50, no. 2, 445-479.
Froot, Kenneth A. 1993. “Currency Hedging Over Long Horizons.” NBER Working Paper
No. 4355.
Gastineau, Gary L. 1995. “The Currency Hedging Decision: A Search for Synthesis in Asset
Allocation.” Financial Analysts Journal, vol. 51, no. 3 (May/June), 8-17.

26
Glen, Jack, and Philippe Jorion. 1993. “Currency Hedging for International Portfolios.”
Journal of Finance, vol 48, no. 5, 1865-1886.
Jorion, Philippe. 1989. “Asset allocation with hedged and unhedged foreign stocks and
bonds.” Journal of Portfolio Management, vol. 15, no. 4, 49-54.
Perold, Andre F., and Evan C. Schulman. 1988. “The Free Lunch in Currency Hedging,
Implications for Investment Policy and Performance Standards.” Financial Analysts Journal,
vol. 44, no. 3 (May/June), 45-50.
Sercu, Piet. 1980. “A Generalisation of the International Asset Pricing Model.” Journal de
l'Association Française de Finance 1(1).
Solnik, Bruno. 1974. “An Equilibrium model of the international capital market.” Journal of
Economic Theory 8, 500-524.
Stulz, René M. 1981. “A model of international asset pricing.” Journal of Financial
Economics, vol. 9, no. 4, 383-406.
27
Table 1. Risk and Return on Domestic and Foreign Money Market Investments (1985 –
2000)
(in percent)
German Swiss British American Japanese Return Risk Return Risk Return Risk Return Risk Return Risk
Single currency in DEM 5.56 0.62 5.22 4.13 6.66 8.51 8.38 11.62 3.18 11.36 in CHF 4.74 4.13 4.40 0.71 5.83 9.28 7.54 12.64 2.38 11.37 in GBP 8.10 8.34 7.75 9.12 9.22 0.87 10.98 11.29 5.66 12.66 in USD 3.67 11.51 3.33 12.50 4.75 11.14 6.43 0.49 1.33 12.60 in JPY 5.81 11.33 5.47 11.33 6.91 12.68 8.63 12.71 3.42 0.75
Average of single foreign currency
5.58 8.83 5.44 9.27 6.04 10.40 8.88 12.06 3.13 12.00
Note: Broken down by different reference currencies
Return Risk Ratio
Domestic money market 5.81 0.69 8.44
Foreign money market 5.81 10.51 0.55
Note: Aggregated over different reference currencies and investment currencies

28
Table 2. Comparison of the Performance of a Portfolio of Foreign Equities With the
Weighted Average (1985-2000)
(in percent)
Portfolio of multi foreign country equities
Average of four foreign country equities
Difference
Annualized 12.10 11.44 66bp Not annualized 521.86 521.86 0bp

29
Table 3. Risk and Return of Bonds for International Investments (1985 – 2000)
(in percent)
Unhedged strategies German Swiss British American Japanese Return Risk Return Risk Return Risk Return Risk Return Risk
Single currency in DEM 7.15 3.40 6.81 5.42 8.27 9.40 10.01 12.54 4.74 11.70 in CHF 5.41 5.22 5.07 3.30 6.51 10.27 8.23 13.05 3.03 11.45 in GBP 9.82 11.45 9.47 12.02 10.97 6.53 12.75 13.59 7.34 13.84 in USD 6.34 11.79 5.99 12.76 7.44 11.72 9.17 4.83 3.94 13.09 in JPY 8.55 12.24 8.20 12.20 9.68 13.88 11.45 14.31 6.10 4.65
Average of single foreign currency
7.53 10.17 7.62 10.60 7.98 11.32 10.61 13.37 4.76 12.52
Multi foreign currency portfolio
7.74 7.11 7.74 7.71 8.07 9.04 10.80 11.34 4.96 10.53
Hedged strategies
Single currency in DEM 7.15 3.40 5.99 3.38 10.88 3.44 8.09 3.39 4.97 3.40 in CHF 6.23 3.34 5.07 3.30 9.95 3.28 7.10 3.26 4.04 3.26 in GBP 7.35 6.51 6.18 6.46 10.97 6.53 8.20 6.48 5.04 6.46 in USD 8.17 4.86 6.99 4.87 11.95 4.91 9.17 4.83 6.03 4.87 in JPY 8.27 4.71 7.09 4.67 12.05 4.65 9.27 4.68 6.10 4.65
Average of single foreign currency
7.51 4.85 6.56 4.84 11.21 4.07 8.17 4.45 5.02 4.50
Multi foreign currency portfolio
7.55 3.60 6.58 3.72 11.26 3.14 8.21 3.43 5.06 3.56
30
Table 4. Average Risk and Return for Different Bonds Strategies (1985 – 2000)
(in percent)
Return Risk
Domestic bonds 7.69 4.54
Single foreign currency bonds 7.70 11.60 Multi foreign currency bonds 7.86 9.15 Hedged single foreign currency bonds
7.69 4.54
Hedged multi foreign currency bonds
7.73 3.49
31
Table 5. Risk and Return of Equities for International Investments (1985 – 2000)
(in percent)
Unhedged strategies German Swiss British American Japanese Return Risk Return Risk Return Risk Return Risk Return Risk
Single currency in DEM 14.02 21.45 13.65 23.10 15.21 21.84 17.06 21.98 11.45 23.89 in CHF 16.86 18.25 16.49 18.51 18.08 18.97 19.98 18.75 14.23 19.68 in GBP 13.40 19.20 13.03 20.10 14.58 16.68 16.42 18.74 10.84 19.81 in USD 13.95 20.28 13.58 21.46 15.13 19.41 16.99 15.17 11.37 19.88 in JPY 5.86 25.19 5.52 25.25 6.96 24.34 8.69 25.39 3.47 20.99
Average of single foreign countries
12.52 20.73 11.44 22.48 13.85 21.14 15.54 21.22 11.97 20.82
Multi foreign country portfolio
13.45 16.34 12.10 17.75 14.80 16.03 16.50 16.42 12.09 17.90
Hedged strategies
Single currency in DEM 14.02 21.45 13.11 21.38 17.60 21.56 14.22 21.76 11.57 21.51 in CHF 17.58 18.62 16.49 18.51 21.35 18.65 17.75 18.84 14.89 18.48 in GBP 10.86 16.63 9.79 16.56 14.58 16.68 11.27 16.86 8.27 16.61 in USD 16.35 14.90 15.25 14.85 20.21 14.97 16.99 15.17 13.77 14.89 in JPY 5.92 21.03 4.81 20.96 9.21 20.99 6.61 21.18 3.47 20.99
Average of single foreign countries
12.68 17.79 10.74 18.44 17.09 19.04 12.46 19.66 12.12 17.87
Multi foreign country portfolio
13.95 14.18 11.69 14.06 18.27 14.76 13.51 15.65 12.52 15.14

32
Table 6. Average Risk and Return for Different Equity Strategies (1985 – 2000)
(in percent)
Return Risk
Domestic equities 13.11 18.56
Single foreign country equities 13.06 21.28
Multi foreign country equities 13.79 16.89
Hedged single foreign country equities
13.02 18.56
Hedged multi foreign country equities
13.99 14.75

33
Table 7. Average Risk and Return Figures for Different Hedge Ratios
(1985 – 2000)
(in percent)
Hedge ratio Multi foreign currency bonds Multi foreign country equities
Return Risk % of risk reduction
Return Risk % of risk reduction
0 7.86 9.15 13.79 16.89
25 7.92 7.26 20.7 13.92 16.01 5.2
50 7.91 5.51 24.1 14.00 15.34 4.2
75 7.85 4.10 25.6 14.02 14.92 2.8
100 7.73 3.49 14.8 13.99 14.75 1.1

34
Table 8. Comparison of Different Hedging Strategies for Global Portfolios
(1985 – 2000)
(in percent)
Unhedged “Correctly” hedged Hedged against USD Return Risk Return Risk Return Risk
Bonds 7.86 9.15 7.73 3.5 8.70 8.87 Equities 13.79 16.89 13.99 14.8 14.92 15.49