Embed Size (px)
Citation preview
1
The relationship between development, globalization and the English language
Heber Rowan
A study submitted as part of the requirements for a MA in
Development.
Dublin City University 2012
Word count
17,202
2
Declaration
I hereby certify that this material, which I submit for assessment on the program of study leading to the award of MA in Development, is entirely my own work and has not been
taken from the work of others, save as and to the extent that, such work has been cited and acknowledged within the text of my work.
Signed: Heber Rowan
________________________
3
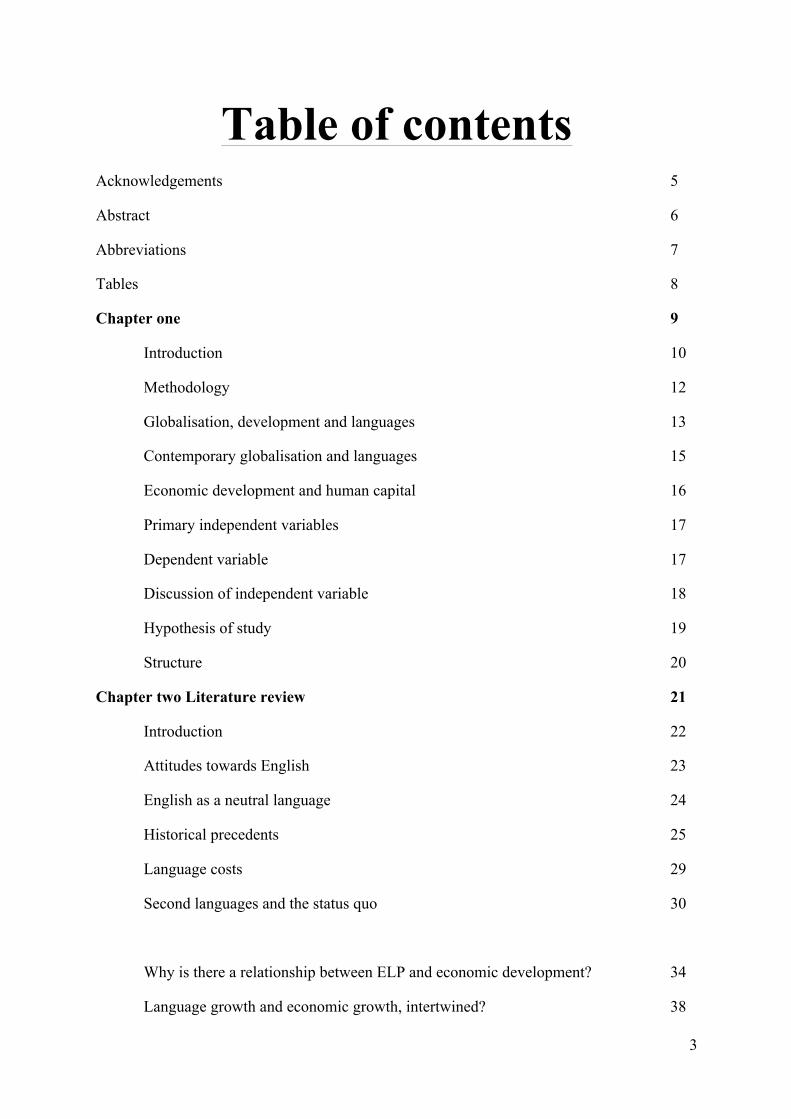
Table of contents Acknowledgements 5
Abstract 6
Abbreviations 7
Tables 8
Chapter one 9
Introduction 10
Methodology 12
Globalisation, development and languages 13
Contemporary globalisation and languages 15
Economic development and human capital 16
Primary independent variables 17
Dependent variable 17
Discussion of independent variable 18
Hypothesis of study 19
Structure 20
Chapter two Literature review 21
Introduction 22
Attitudes towards English 23
English as a neutral language 24
Historical precedents 25
Language costs 29
Second languages and the status quo 30
Why is there a relationship between ELP and economic development? 34
Language growth and economic growth, intertwined? 38
4
Regional languages 38
Cultural effects of English media 40
Social mobility from education, criticisms 41
Population 43
Conclusion 44
Chapter three Empirical findings and analysis 45
Introduction 47
Methodology 48
Indicators used 48
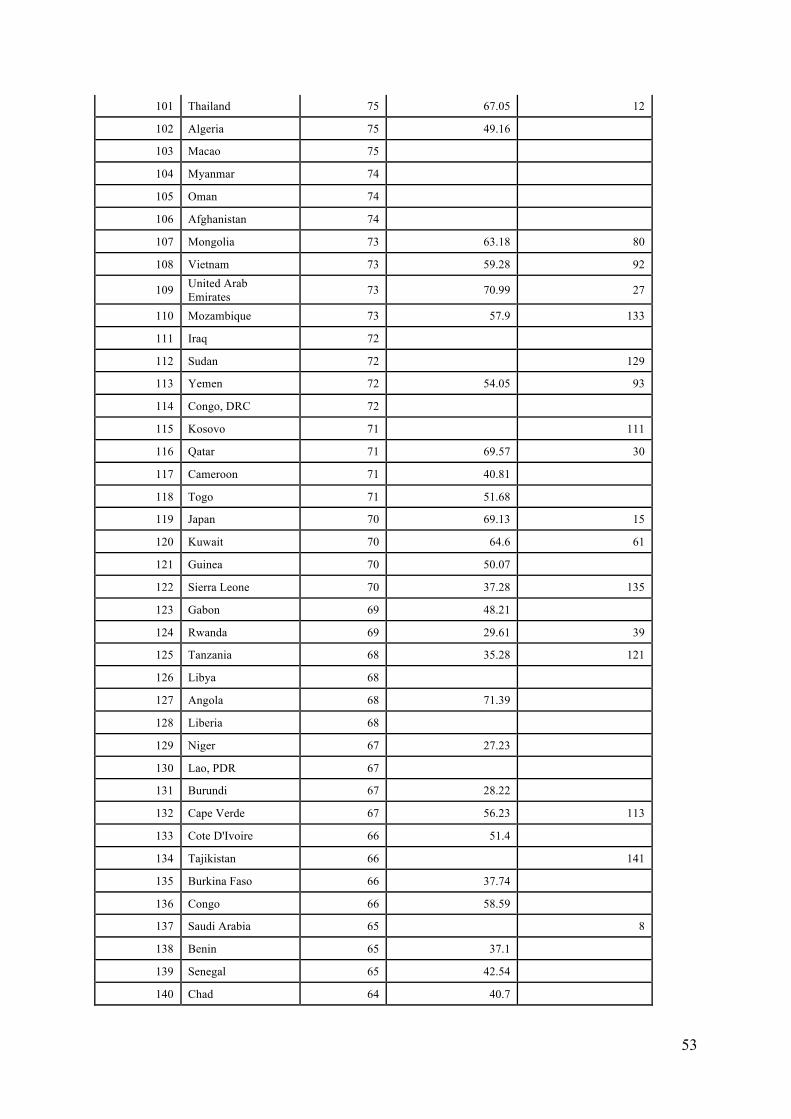
Notes on Table 7 49
Table 7 data analysis 54
Table 8 & 9 analyses 55
Table 10 and 11 analyses 59
Conclusion 63
Chapter four
Thesis conclusions
Suggestions for future study
The value of English
Appendix
Bibliography

5
Acknowledgements
This thesis would not be possible without the aid and guidance of the department of Law and Government at Dublin City University in particular, Niamh Gaynor, David Doyle and Noelle Higgins. I would also like to thank my parents for their encouragement during my studies and Travis Selmier of Tennessee University for his keen insights on this topic. Finally, I would like to thank the staff of Manba High School, Gunma, Japan for their patience while I completed this thesis.
6
Abstract
This thesis examines the relationship between international trade, development and English. It attempts to see is there is a link between prosperity levels and proficiency in the English language. As globalization has often been viewed as a panacea for development, there is a gap in our understanding of the relationships between global languages, economic development and globalization. The links between the effects of languages on FDI and trade are documented, yet there has been little study on how English proficiency levels in non-native speaking countries impact their development or/and globalization. To address that gap, this thesis posits that since language skills are vital for entering the global economy, countries with higher levels of globalization and economic development will generally have higher English language proficiency levels (ELP). This thesis compares ELP scores, globalization indexes, ease of business rankings and population, FDI, GNI, GDP and export levels in order to illustrate that relationship. It finds that both GDP and GNI per capita can be associated with higher ELP scores, meaning that stronger, economically developed states are likely to be more proficient speakers of English.
7
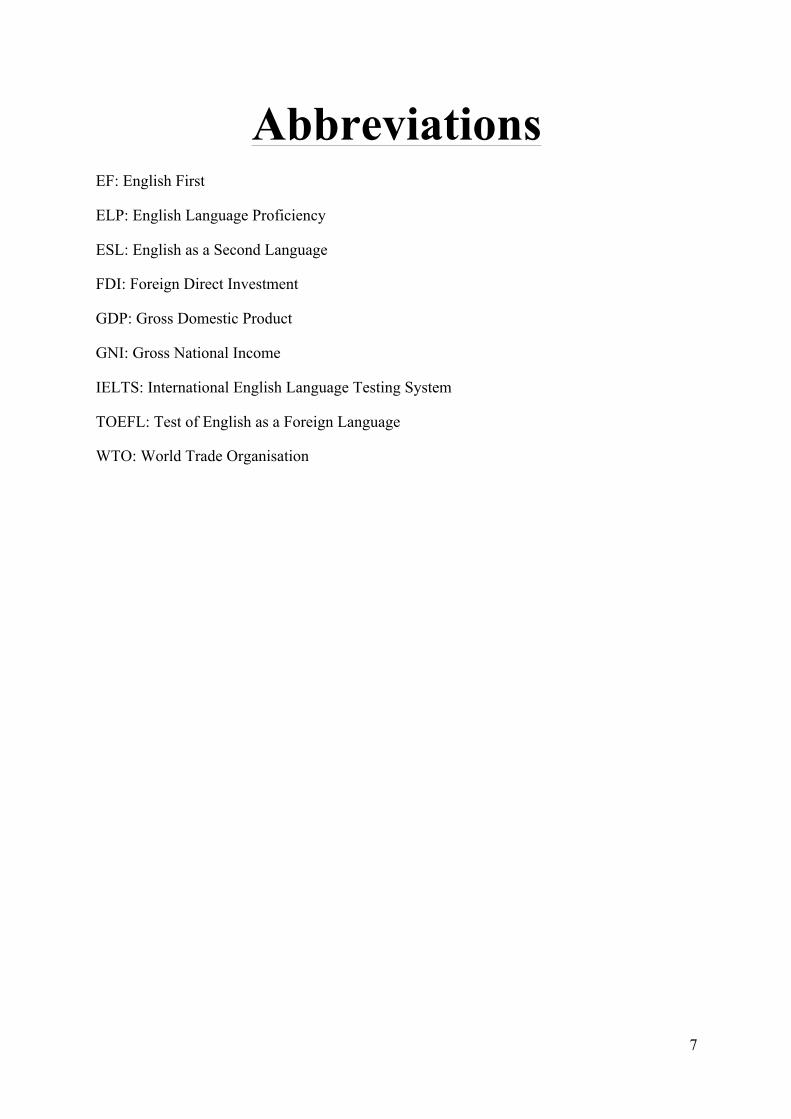
Abbreviations EF: English First
ELP: English Language Proficiency
ESL: English as a Second Language
FDI: Foreign Direct Investment
GDP: Gross Domestic Product
GNI: Gross National Income
IELTS: International English Language Testing System
TOEFL: Test of English as a Foreign Language
WTO: World Trade Organisation
8
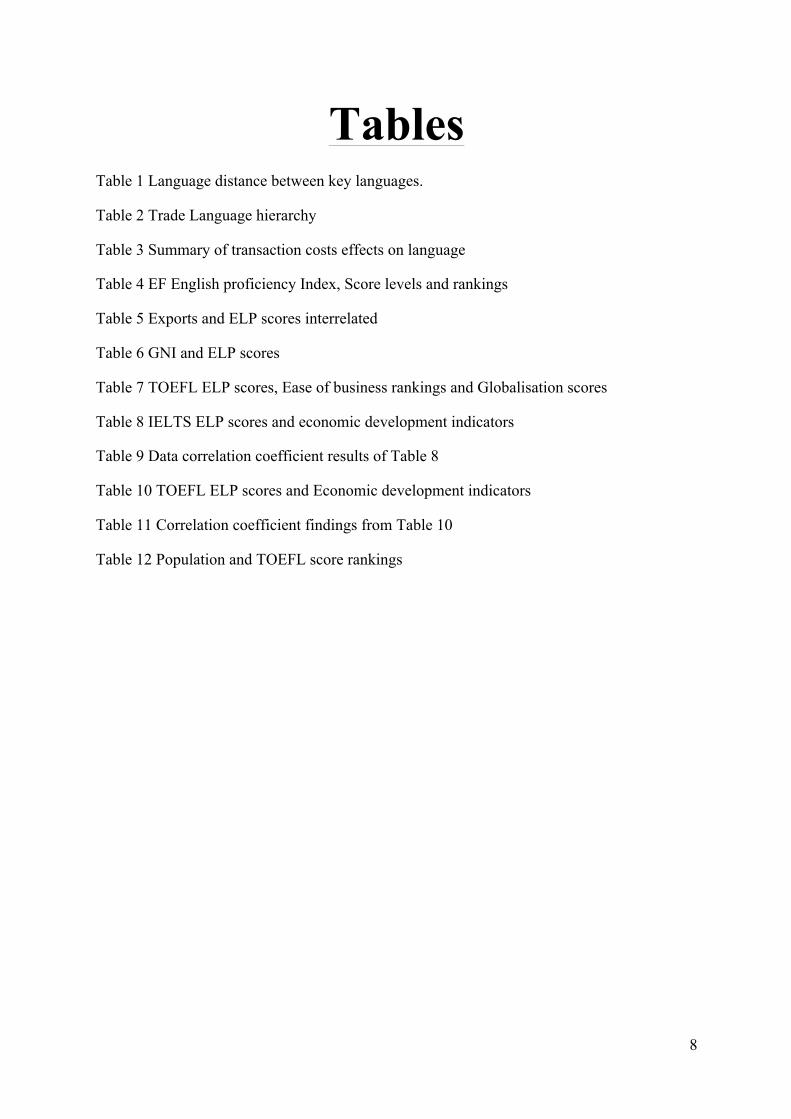
Tables Table 1 Language distance between key languages.
Table 2 Trade Language hierarchy
Table 3 Summary of transaction costs effects on language
Table 4 EF English proficiency Index, Score levels and rankings
Table 5 Exports and ELP scores interrelated
Table 6 GNI and ELP scores
Table 7 TOEFL ELP scores, Ease of business rankings and Globalisation scores
Table 8 IELTS ELP scores and economic development indicators
Table 9 Data correlation coefficient results of Table 8
Table 10 TOEFL ELP scores and Economic development indicators
Table 11 Correlation coefficient findings from Table 10
Table 12 Population and TOEFL score rankings

9
Chapter One
10
Introduction
It has been ascertained by Dreher (2006: 38) that globalized countries generally trade
more with others and that they are more economically developed1. It has been further
established by Selmier & Oh (2012) that global languages have an effect on international
trade and investments. While the effect of particular levels of global languages’ proficiency
have on countries learning those languages is little understood. English is the hallmark
‘global language’ on account of its ubiquity. Globally it is estimated that up to two billion
people worldwide are learning English today2, more than the combined populations of the
every native English speaking country in the world. With so many focusing their efforts on
the English language, it is germane that we question the utility of that endeavour by finding
out by how much learning and using English, can aid a country’s economic development. In
this thesis I examine the linkage between English language proficiency and economic
development, investigating if globalised and developed states are more often proficient
speakers of international languages. I find strong correlation between economic development
indicators such as GDP per capita, GNI per capita and ELP scores. While other languages
shall be reflected on, English is our focus. Why? Its dominance:
“The choice has fallen on English not because it is more beautiful or more expressive, but just because
it is already more widespread than any of the other potential candidates.”3
Indeed, like the modern rise of ‘Facebook’ (a social networking website), in order to connect
with the rest of the world online, millions choose one language because for them it's the best
1 Dreher, Axel. Does globalization affect growth? Evidence from a new index of globalization. Applied 2 “English has official or special status in at least seventy five countries with a total population of over two billion”. Frequently asked Questions, The English language. http://www.britishcouncil.org/learning-faq-the-english-language.htm Accessed 29/7/2012
3 Dyer, Gwynne. “The worldwide triumph of English”. 23/05/2012 The Japan Times Online
11
allows for the widest range of communication possibilities. In a globalized world, those who
can effectively utilize the largest spans of communications open to them hold ‘the edge’4 in
the global economy. First, I will look at why certain languages have that edge, then how and
by how much does speaking them matter in keeping that ‘edge’. To begin our examination of
how it does that, I will establish the ubiquity of English within the context of globalization, to
get a fix on how one language commands such an expanse of users that it is called a global
language.
Languages are a skill and since so much can be affected by language in life, it is fair
to say that they are a power of their own. In particular I will examine their symbiotic
relationship with economies. Block and Cameron (2001) argued,
“Some commentators have suggested (e.g. Heller 1999a) that languages are coming to be treated more
and more as economic commodities, and that this view is displacing traditional ideologies in which
languages were primarily symbols of ethnic or national identity. The commodification of language
affects both people’s motivations for learning languages and their choices about which languages to
learn. It also affects the choices made by institutions (local and national, public and private) as they
allocate resources for language education.”5
Therefore, it is arguable that languages are often learnt because of their close relationship to
economies (and states to a lesser extent). Thus, choosing to learn a particular language can
mean one has accepted its relevance in an economy. English is relevant in the global
economy, so arguably wherever one is, there will be an economic advantage to speaking that
language. Some countries have recognized that advantage by teaching English in public
schools from an early age. So why are such skills so central to education in most countries?
4 The desired factor in employment markets for individuals and the attractive quality for investors to a particular country. 5 Block, David. Cameron, Deborah. Globalization and Language Teaching. Taylor & Francis e-Library, 2001 p. 5
12
The economy simply demands it as new labor markets open in international spheres when
domestic economies become counterparts to the global economy; a global skill or language is
needed to interact with it. Since accepting the utility or edge of English in the global economy
appears central to achieving growth. I need to see if the facts and statistics justify the actions
of billions around the world. That is why in this thesis I investigate the relationship of
economic development indicators to ELP to see if it really matters.
Methodology
How I justify those actions, is through an examination of economic development
indicators and ELP scores. The indicators that I examine are as follows: population figures,
ease of business rankings, export levels, FDI inflow levels, GDP per capita, GNI per capita
matched with their respective globalisation index rankings. I scrutinise IELTS and TOFEL
scores of non-native Globalisation speaking countries. Our specific interest will rest with
finding out how many non-native English-speaking countries are high on globalisation scale,
GDP, GNI and ELP scores. The higher correlations I can draw with those variables, the
stronger a case I can build for my argument that a higher degree of globalization and
economic development is tied to higher levels of English proficiency and economic
development.
13
Globalization, development and languages
Since this thesis examines the impacts of ELP levels on states’ economies, I am
essentially asking if speaking more English is a good thing. Which is in effect, also asking
whether globalization is a good thing. Likewise, does it maximise the greatest ‘good’ for the
largest number of people and the least harm?
Globalization, a convergence of world affairs means change, namely that life in the
present is different from that of the past. The values and desires in a previous generation may
have been different but some aspects remain arguably constant. According to Amartya Sen
(1999: 36) development is ‘a process of expanding the real freedoms that people enjoy’6, such
as freedom from poverty, attainment of civil rights, education and health care. Sen regards
education in skills such as literacy and numeracy as basic freedoms7 as they allow for
increases in life freedoms by spreading economic opportunities in a supportive background8.
Bruthiaux (2002: 277) also concurs with Sen’s view.
“Economic development of the most urgent kind should be viewed more narrowly as
a process of societal change leading to tangible improvements in and greater control
for the most disadvantaged members of a society over their living conditions.”9
Sen (1999: 3) defines economic growth to be an important means to achieve freedoms that all
members of society aim to obtain10. Therefore from Dreher’s (2006: 38) correlations between
6 Sen, Amartya. Development as Freedom. 1999 Oxford University Press p. 36
7 Ibid p. 13 8 Ibid p.91 9 Bruthiaux, Paul. Hold Your Courses: Language Education, Language Choice, and Economic Development. TESOL Quarterly, 36:3 Language in Development (Autumn, 2002), p. 275-296
10 Sen, Amartya. Development as Freedom. 1999 Oxford University Press p. 3
14
globalization and economic growth11, we can conceive a relationship between globalization
and development. Furthermore if multilingualism levels are such a significant factor on
language costs to aid FDI (Selmier & Oh 2012), we can acknowledge a relationship between
ELP and development (specifically globalized economic development).
Understanding what ELP does (as an indicator or otherwise) is crucial to my
understanding of globalization and international investment. As language, I argue, has always
impacted the dynamics of human trade and interactions. Adam Smith once even said, “The
propensity to truck, barter, and exchange one thing for another is an innately human
characteristic”12. In modern times its influence is arguably greater, through the Internet,
media, international trade and FDI. As Block & Cameron (2001: 12) stated:
“Any invocation of ‘worldwide social relations’ unfettered by ‘the constraints of
Geography’ must immediately raise questions about language. Language is the primary medium of
human social interaction, and interaction is the means through which social relations are constructed
and maintained. While much everyday interaction still occurs, as it has throughout human history,
within local networks, large numbers of people all over the world now also participate in networks,
which go beyond the local. New communication technologies enable individuals to have regular
exchanges with distant others whom they have never met face-to-face.”13
Phillipson (2001: 187) further agrees and in essence defines English as the language of
globalization.
“English is integral to the globalisation processes that characterise the contemporary post-cold-war
phase of aggressive casino capitalism, economic restructuring, McDonalisation, and militarisation on
11 Dreher, Axel. Does globalization affect growth? Evidence from a new index of globalization. Applied Economics, 2006, 38. P. 1092 12 Smith, V. 1998. The two faces of Adam Smith. Southern Economic Journal 65(1): 1-19. 13 Block, David. Cameron, Deborah. Globalization and Language Teaching. Taylor & Francis e-Library, 2001 p. 12
15
all continents. English is dominant in international politics and commerce, its privileged role being
strengthened through such bodies as the United Nations, the World Trade Organisation, and regional
groupings such as the North American Free Trade Agreement and the European Union.”14
This is arguing that higher end processes of globalization revolve around the use of English.
However Philipson adds a caveat,
“Many write loosely that English is the world language, but to describe English in such terms ignores
the fact that a majority of the world’s citizens do not speak English, whether as a mother tongue or as a
second or foreign language”15.
Yet as Weber (1999: 12) reminds us, it simply is comparatively the world’s most influential
language16. The numbers of its native speakers, secondary speakers, the economic muscle of
the countries that speak it, its socio-literary prestige and the number of major international
fields it leads such as science and aviation for example: all exemplify its influence. Therefore
while it is not the language of the entire world, it is more so than any other. That is why I am
driven to investigate this aspect of ELP in my thesis. As it asks if globalization and the
growth of English is a good thing for an economy since so many choose to devote so much
time and energy to one language.
Economic development and human capital
English proficiency is a skill and an attribute of human capital utilised in the global
economy. I study ELP as an integral part of economic development because, like other skills,
it increases the employment opportunities available, in tertiary or services industries that are
free from the insecurities of pestilence and hunger that can characterise primary industries
14 Philipson, Robert. English for Globalisation or for the world’s people? International Review of Education. 47: ¾ Globalisation Language and Education (Jul, 2001) p.187
15 Ibid p. 188 16 Weber, George. The World’s 10 most Influential Languages. AATF National Bulletin. 24: 3 (January 1999) p.22
16
like agriculture. “Generally, the incomes of workers are closely correlated with value added
per employee”17, which means that in general, a worker’s value is determined by the level of
their skills. As economies and individuals have adjusted their education and skills to adapt to
such changing circumstances, certain basic skills have become requirements in such changing
circumstances. As Spence (2011: 34) stated,
“The highly educated, and only them, are enjoying more job opportunities and higher incomes.
Competition for highly educated workers in the tradable sector spills over to the non-tradable sector,
raising incomes in the high-value-added part of that sector as well. But with fewer jobs in the lower-
value-added part of the tradable sector, competition for similar jobs in the non-tradable sector is
increasing. This, in turn, further depresses income growth in the lower-value-added part of the non-
tradable sector. Thus, the evolving structure of the global economy has diverse effects on different
groups of people in the United States. Opportunities are expanding in the tradable sector because that
job market must remain competitive with the tradable sector. But opportunities are shrinking for the
less well educated.”18
The same could be said for developing economies. As middle-income countries expand their
education systems and their citizens make greater investments in education, they foster
human capital development, or people led growth, (particularly where there is limited natural
resources). This is why in emergent economies like South Korea one can observe high levels
of investment in education and foreign language education (5% of GDP in 2009)19. A policy
that may be working in the developing world as of late, as The Economist noted20:
“The combined output of the emerging world accounted for 38% of world GDP (at market exchange
rates) in 2010, twice its share in 1990. If GDP is instead measured at purchasing-power parity,
emerging economies overtook the developed world in 2008 and are likely to reach 54% of world GDP
this year.”
17 Spence, Micheal. 2011 ‘The Impact of Globalization on income and employment’. Foreign Affairs. July/August, 90 (4): 32 18 ibid p. 34 19 Worldbank development indicators accessed 2012 20 Economist, The. Emerging vs developed economies, Power shift. 4th August 2011
17
While a portion of that growth can be attributed to the economic growth of China,
globalization and the use of international languages has had a profound impact on trade. As
human capital becomes a valuable commodity, at times the issue may not be what you sell but
how you sell it, as “the merchant speaks the customer’s language”21. It is that reason that
makes ELP so valuable to economic development as it lowers the ‘communication costs’
between potential investors due to a shorter ‘linguistic distance’ between the two as Selmier
& Oh (2012) articulate.
So far I have provided an opening theoretical basis as to why English is seen as
crucial to growth in the global economy (i.e. why the link between economic development
and ELP levels are investigated). Next I will explain the dependent and independent variables
to specify what factors influence my research on the possible tangible benefits of English.
Primary independent variables
These comprise of factors that influence the outcome I am examining.
1. Levels of globalization, ease of business rankings, GNI per capita, GDP per capita,
FDI inflows and exports in the examined states.
2. The speaking of a non-major or major trade language in a state.
3. The population size of a state in question.
Dependent variable
My dependent variable, being the outcome of the independent variables, is as follows:
21 Graddol, David. 1997 ’The Future of English?: a Guide to Forecasting the Popularity of English in the 21st Century’. London: British Council, p. 29
18
The English language proficiency (ELP) levels in the countries researched.
Discussion of independent variables
To reiterate my research question: Do economically strong, globalized states often
speak more English than less strong ones? Hence, we examine how languages are tied to
trade and to globalization and my independent variables to provide greater substance to my
argument.
Now we will explain my selection of the independent variables.
1. Levels of globalization of the examined states. This tenant of my research concerns
us, as economically developed states are more likely to be globalized states.
Globalization levels and ease of business rankings are a means of demonstrating how
interconnected a country is to the world. GNI and GDP per capita provide with
reliable indicators of the size of the economies studied. While exports levels,
demonstrate the magnitude of their outward international trade similarly; FDI inflows
show how well a country is trusted and how valued its markets are to warrant FDI.
2. The speaking of ‘a major trade language’ may impact incentives or the cost of
speaking English for a state.
3. Population size may bear on the ELP levels in countries that have high levels of FDI
and globalization. As a larger domestic market in a country discourage high ELP as
the country may have less of a need to enter foreign markets for trade and investment,
than a small country unable to support itself through its small domestic market.
19
Hypothesis of study
I can surmise in particular that:
1. Foreign direct investment, international trade, and globalization levels are higher in
states with higher levels of English language proficiency (ELP).
Due to the ‘spin-off’ effect of international trade influenced by such an international
language, I can draw a further possible hypothesis.
2. Higher FDI levels are often linked with higher globalization figures.
In other words, the increased use of English, a major trade language, is a good thing overall
for countries to encourage in a global free market economy. This would account for the links
between high ELP levels and globalization that my comparison analysis in chapter three
demonstrates.
The success and growth of a language and its speakers, is linked with the political and
economic clout of its speakers. I consider this hypothesis and investigate the perception that
the fortunes of languages are tied to power of their speakers.
3. An increase in the economic strength or GDP growth of a country can lead to an
increase in the number of learners of that country’s national language.
4. A small population can encourage higher ELP usage while a larger population can
often mean a lower level of ELP.
Finally I raise my fourth hypothesis as a proposal to account for ELP scores in certain
countries. In chapter three we address this in detail.
20
Structure
This thesis is structured into four chapters. The chapter one introduces the concept of
a global language, the development of ELP as an essential skill of human capital, the
relationship of languages to globalization. Closing with the dependent, independent variables
and hypotheses of this thesis.
Chapter two consists of an extensive literature review on debates over the relationship
of languages and development. It covers areas such as the knowledge economy, globalization,
lingua fracas, communication costs, cultural impacts of English, foreign direct investment,
historical precedents, imperialistic and neutral attitudes towards English.
The third chapter gives an empirical analysis of economic development indicators
with ELP scores. It consists of a methodology introduction, globalization rankings of states
with ELP scores, ease of business rankings, GNI, FDI, GDP, population and export levels. It
calculates the relationships of two different ELP testing systems, IELTS and TOEFL with the
same economic development indicators (and population figures). It adjusts each series of
countries so that they can match the same indicators. It then discusses the results and notes
limitations of the data provided.
Chapter four comprises of a conclusions and final analysis of the research of this
thesis. It suggests areas for further study and concludes that are sufficient relationships to
support research question of this thesis.

21
Conclusion
Now that we have given an outline of the arguments and content in this chapter, I shall
progress to chapter two. In it we provide an extensive literature review on the relationship of
global languages to FDI and globalization: to provide awareness of current debates on
language, development and globalisation. As billions learn English they do so for its promise
of a better life. We need to know if their dreams in some way match their reality.

22
Chapter two
Literature Review
23
Introduction
Current literature on the relationship of global languages and globalization debates the
practical merit or ‘imperialist imposition’ of global languages. It contrasts economic growth
and its advantages for development with the death of languages and their culture. While there
is some literature that links globalization and languages, there has been little discussion on the
relationships between English proficiency levels, globalization and economic development.
This matters as the link between the ability of countries to improve their growth and use
human capital is generally established. Yet the degrees to which states are able to improve
with a specific skill, like an international language, are not fully understood. It is found that
they do assist trade and FDI, but none (aside from the 2011 EF proficiency report) investigate
the scale of their impact in different states. That is why we attempt to address that impact in
this thesis. Since globalization often means that states are highly geared for development, the
question arises, are English speaking countries more likely to be developed ones?
As trade is conducted through language, it is arguably a logical influence on economic
development. Similarly, it stands to reason that, global languages or lingua francas in turn
influence global trade. Trade and increased communication/relations between states can be a
mutually beneficial enterprise. As unfamiliar parties learn the value of trusting one another,
they open new markets and become less hostile to one another. According to Gartzke’s (2007:
182) capitalist peace theory, “Free markets and development (…) lead nations closer together,
or (...) down grade historical animosities” 22. Which means that on average democracy and
free trade promote peace building. For such peaceful relationships to establish and prosper,
they must open dialogues. Often when their languages are very different, a lingua franca is
sometimes used. According to House (2003: 557), a lingua franca is an intermediary
22 Gartzke, Erik. (January 2007) ‘The Capitalist Peace’. American Journal of Political Science. 51(1): 182
24
language that is characterized by its negotiability, openness to integration with other
languages and variability of speaker proficiency23. Variability of speaker proficiency is what
concerns us in this thesis, as its possible impacts on development are substantial.
However, before I address that relationship specifically, I shall discuss some current
debates in contemporary literature concerning this topic to add context to my research in
chapter three.
Attitudes towards English
In chapter one I mentioned how human capital skills such as ELP are seen as
commodity in themselves and how human capital can raise income opportunities in a state.
This is reflected in the attitudes of ESL learners. For instance, according to Katsos (2011: 3)
the world has become a place where “speaking English is becoming a basic skill rather than
an advantage”24. Particularly when a “growing number of universities require English for
admission or graduation, and many now offer degree programs entirely in English to compete
with the top-ranked institutions in the U.S and U.K”25. Boyle (1997: 177) argued concerning
the Hong Kong case,
“Hong Kong Chinese have always used the English language very pragmatically – as a means of doing
better; business and secondly, that those with English quickly felt a sense of superiority over others. In
other words, though there was no compulsion to learn English (education was voluntary), the
commercial usefulness and the social prestige of the English language made it a highly desirable
commodity.”26
23 House, Juliane. English as a lingua franca: A threat to multilingualism? Journal of Sociolinguistics 7:4, 2003 p. 557 24 English First, English Proficiency Index 2011 p. 3
25 Ibid 26 Boyle, Joseph. 1997 ‘Imperialism and the English Language in Hong Kong’. Journal of Multilingual and Multicultural Development. 18 (3): 177
25
Furthermore through the examples cited by Nunan’s (2003) report on English in the Asia-
Pacific region we can see that the age at which a number of states begin their public education
programs of the English language has fallen or remains to be low27. Despite this, authors like
Graddol (1997: 62) disagree and call it dangerous.
Public attitudes towards massive language loss in the next few decades, for example, is [sic]
unpredictable. It would be easy for concerns about this issue to become incorporated into the wider
environmental consciousness, which seems to be spreading around the world. The spread of English
might come to be regarded in a similar way as exploitative logging in rainforests; it may be seen as
providing a short-term economic gain for a few, but involving the destruction of the ecologies which
lesser-used languages inhabit, together with the loss of global linguistic diversity.28
The relationship of cultures to languages is central to literature in this subject. Thus we
counter Graddol’s views by showing how current literature agrees with us, that global English
is ‘a good thing’ within the context of my globalised society and that it is the nature of
languages to adapt to new circumstances.
English as a neutral language
With pragmatic attitudes characterising the growth of English, it is no wonder that it
often viewed as a neutral language, (akin to the manufactured language Esperanto). In this
section I argue that positive views of English are due to its relationship to international trade
and investment, painting the English language as a neutral agent in globalization.
The fundamentals of business have always been the same, trust and agreement
between different partners are always required before any trade or investment can be made.
27 Nunan, David. "The Impact of English as a Global Language on Educational Policies and Practices in the Asia-Pacific Region." TESOL Quarterly 37.4 (2003): 589-613
28 Cited by Maurais, Jacquest. Morris, Micheal A. Languages in a Globalising World. Cambridge University Press 2004 p.49
26
That trust requires a medium to convey and propagate itself, language. Adler (2001: 215)29
found that trust, is becoming the most crucial cost between trading actors, whereas authority
is a weaker factor in international trade. Language Selmier & Oh (2012) argue, is the key
component in building of trust between investors. Business, like language goes through a
variety of new circumstances that can require adaptation. In any market the cheapest medium
of exchange is required and used before others. English, as a language of multiple origins and
widespread usage is often the cheapest medium of exchange.
With billions of English speakers now in existence and so few native speakers, it
stands to reason that the majority of English conversations happen without non-native
speakers. Pidgin English or regionalised variations are an important result of those types of
conversations, promoting a ‘cultureless’ language30. Furthermore, when non-native speakers
use a foreign language more often, the idioms within that language are diluted down so that
communication is prioritized rather than idiomatically correct expression.
Idioms themselves are what make a language an expression of a culture. Though they
are not necessary per se for basic communication in trade. Meaning that the more a language
is used outside of its socio-linguistic setting among native speakers, the less tied it becomes to
them. Therefore as English has become such a widespread trade language its quotidian, non-
native usage makes it arguably less culturally threatening to others. Furthermore English-
speaking countries often have a ‘low context culture’ that requires less cultural acquaintance
to understand them than a ‘high context culture’ like that of Japan’s would. As Selmier & Oh
(2012: 27) theorised,
29 Adler, Paul S. Market, Hierarchy, and Trust: The Knowledge Economy and the Future of Capitalism. Organization Science. 12: 2 Mar – Apr 2001 p. 215
30 Selmier, W.T. and Oh, C.H. 2012 ‘The Power of Major Trade Languages in Trade and Foreign Direct Investment, Review of International Political Economy.’ Review of International Political Economy, iFirst p.3
27
“There may be a higher incentive to learn English in the Spanish world because there is less cultural
cohesion. Spanish speakers identify with their own country – Argentine, Cuban, Spanish, Mexican –
rather a cultural, and linguistic, center as there exists with French.”31
This suggests that in cases where a language is not a defining or central aspect of nation state,
the protective urge to maintain it can be less than when language and nationality are highly
interlinked, as in France for example.
“English’s variety of cultures, on the other hand, may positively influence the adoption of English as a
lingua franca. Because underlying cultures in English language transactions are contextually specified
by the contracting parties—South African, Indian, Australian, Jamaican and so on—a particular cultural
orientation is not imposed. Analogous to Abdelal and Meunier’s view contrasting the French desire for
codification of global investments’ rules of the game with an American predilection for a laissez faire
approach to global capital flows, so English transactional use may be relatively more laissez faire. That
is, English usage may assume a less culturally grounded position in international economic transactions
than would French usage32.”
Despite English’s low culture context it is argued that it encourages the phenomenon
of ‘language death’. Where a minor language’s community dies off due to the idea that
speaking the language in question, isn’t useful anymore when a majority speak another
dominant language. Echoing the fears of Graddol, Johnstone (2000: 159) states,
“The seemingly irresistible rise of global English forces other languages on the defensive, as they strive
to maintain their space in a rapidly changing world. All countries are affected, but particularly those
where English is the majority first language. To what extent will serious and large-scale social
motivation for learning other languages be able to survive among first-language English speakers over
the next fifty years? (Johnstone 2000: 159)”33
31 ibid p.21 32 ibid p.3 33 Maurais, Jacquest. Morris, Micheal A. Languages in a Globalising World. Cambridge University Press 2004 p.25
28
Since a language can uniquely express the culture it came from and states often arise from a
distinct culture, nationalism can label English as a threat. As when one learns a language from
a particular country one invariably learns or absorbs many aspects of that language’s
culture34. So when people are drawn to another language out of economic concerns, it can
mean that identity with a culture of a less widely spoken language is not worth maintaining.
Thus when culture and identity become homogenised in globalization, languages can die out.
This runs counter to my proposal that English’s growth in globalization can be a good thing.
“This global spread of English has been described as linguistic imperialism (Phillipson, 1992), the
thesis being that English, under the innocuous guise of a helpful language for business and travel, has
become a potent weapon for cultural and economic domination. Others see the spread of English more
positively, maintaining that the English language has become globalized for historical and practical
reasons, and that it can help the development of poor countries without necessarily endangering their
cultures (Quirk & Widdowson, 1985).”35
Since I am asking if higher degrees of ELP are linked with economic development and
globalization, I describe ‘the good’ as from economic growth and increased employment.
Wherein, I see English as neutral or beneficial, not imperialistic. Nederveen Pieterse (2004)
reminds us that no culture remains static, describing globalization as hybridization, where
local cultures adapt globalization differently, discounting globalization as imperialist. House
(2003: 575) also finds that “English as a lingua franca is not, for the present time, a threat to
multilingualism”36. This reminds us that all languages arise from the environment of their
speakers. For example, if speakers of a particular language live in an isolated community,
they would adapt their language to suit the distinct characteristics of their community.
Concurrently the speakers of a global language adapt their languages to that the diverse
34 MacNamara, John. 1971’The Irish Language and Nationalism’. The Crane Bag. 1(2) :42 35 Boyle, Joseph. 1997 ‘Imperialism and the English Language in Hong Kong’. Journal of Multilingual and Multicultural Development. 18 (3): 169 36 House, Juliane. English as a lingua franca: A threat to multilingualism? Journal of Sociolinguistics 7:4, 2003 p. 575
29
global community. Meaning that, in essence all languages are practical expressions of new
circumstances. Arguably, the fast adopters of new linguistic elements or new languages have
‘the edge’ over others. That is why I examine the possible effects of ELP levels, to investigate
this question.
Historical precedents
International trade has been in existence for thousands of years. Though up till
recently it was possible to avoid the global economy with isolationist policies known as
protectionism (increasing the price of imports) for example. Nowadays it is a substantial
economic challenge to remain self-sufficient, so countries have to look outward to grow.
Hence I ask, why it that way now and not previously?
“Whether we consider English a “killer language” or not, whether we regard its spread as benign
globalisation or linguistic imperialism, its expansive reach is undeniable and, for the time being,
unstoppable. Never before in human history has one language been spoken (let alone semi-spoken) so
widely and by so many.”37
Yet from history we know that no language has remained dominant for long.
“…Would the Latin forecaster, living on one of the seven hills more than two and a half thousand
years ago, have had the luck of being able to imagine the success of what would have been in today’s
terms only a regional language? Or a few centuries later, how to make the Near East student understand
the indispensable nature of Aramaic, the great international language of the times, and then what to
answer if he had retorted disdainfully that this language would no longer be spoken two thousand years
later, except in a few villages of northern Syria?”38
37 Fishman, Joshua A. The New Linguistic order. Foreign Policy, 113, Winter 1998-9. P.26 38 Maurais, Jacquest. Morris, Micheal A. Languages in a Globalising World. Cambridge University Press 2004 p.26 Citing Jacquois, Guy 1999, n,1
30
However, the concept of a global or common language has been in existence for millennia.
Latin vulgaris’s usage across the Roman Empire aided the unification of the vast empire by
easing distant trade links by breaking communication barriers within a diverse imperial army;
establishing a hegemony of commerce and culture over ancient Europe. Overall, common
languages have arisen from one form of power, economic and/or political. The question
before us is whether, if English follows this strict pattern, validating hypothesis three?
An increase in the economic strength or GDP growth of a country can lead to an increase
in the number of learners of that country’s national language.
Language costs
The effect of particular languages on economic development and international
investment arises from their effect as mediums of communication. Selmier & Oh (2012)
establish that there is a preferential, lower cost to speaking English or lingua francas in the
course of international trade and investment relative to other languages. This allows us to
understand how languages can be tied to economic development. In this section, I discuss
their findings at length as they provide a strong context to build my central argument that
degrees of ELP can be related to economic development.
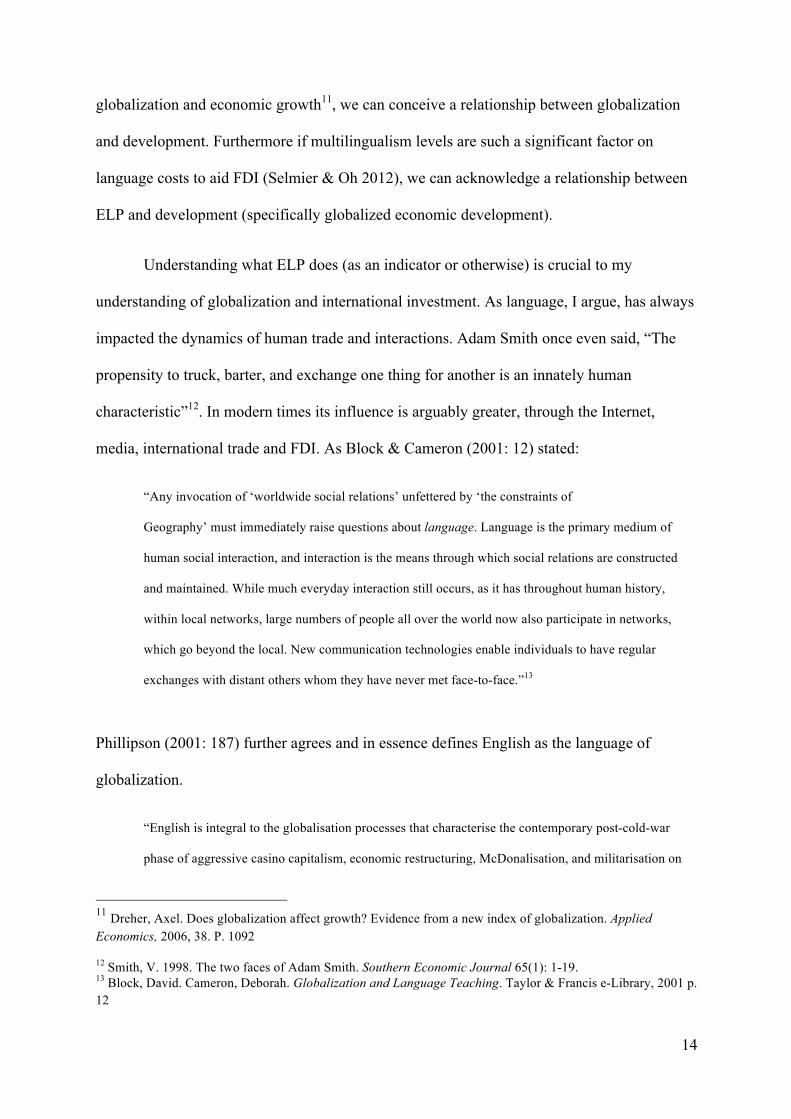
“When the respective peoples of a country-pair engage in bilateral trade and investment and speak
different languages, they must negotiate in one or both of those languages, or in a lingua franca.2
When the two languages – a ‘language pair’ – are the same or very similar, there is little linguistic im-
pediment to trade and investment as transaction costs decline (Helliwell, 1999; Hutchinson, 2002; Oh
and Selmier, 2008). But as the distance between the language pair increases, transactions costs mount
up. (…)Portuguese and Spanish speakers may easily communicate by bridging the short distance
between their language pair; this capacity to bridge exists for other tightly grouped language clusters
aside from the Romance languages. But with very distant languages like French and Chinese, language
31
learning or use of a lingua franca is required.”39
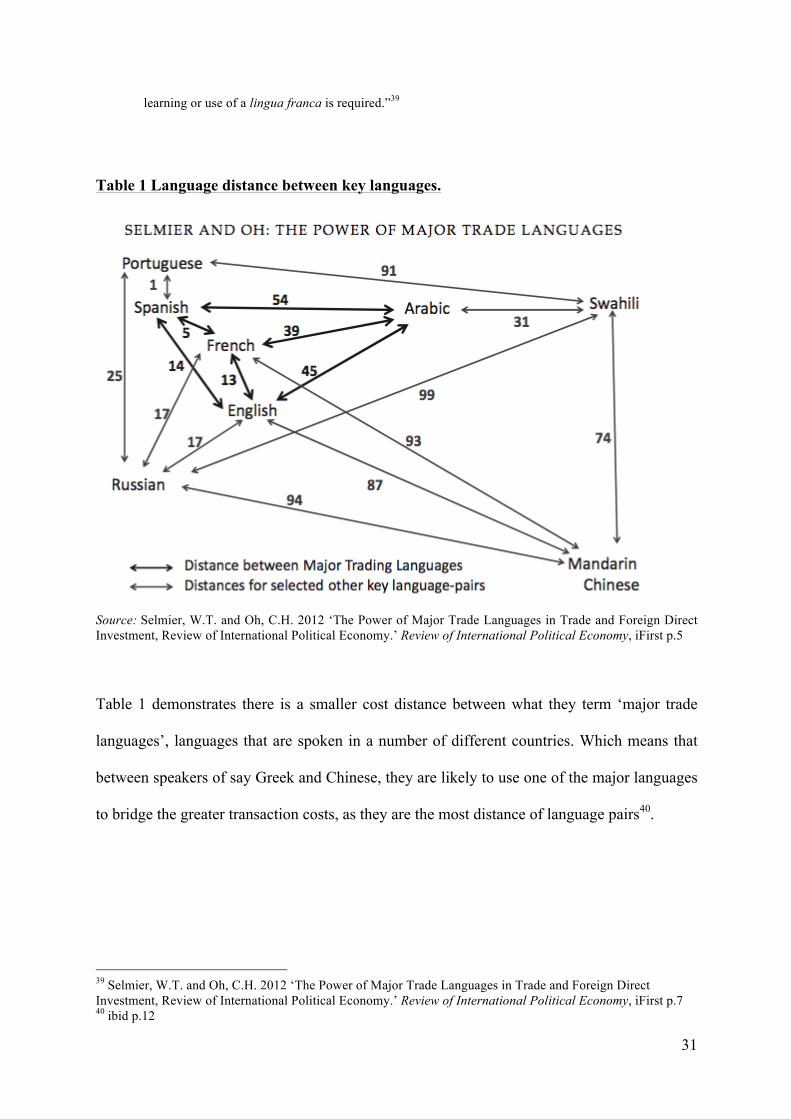
Table 1 Language distance between key languages.
Source: Selmier, W.T. and Oh, C.H. 2012 ‘The Power of Major Trade Languages in Trade and Foreign Direct Investment, Review of International Political Economy.’ Review of International Political Economy, iFirst p.5
Table 1 demonstrates there is a smaller cost distance between what they term ‘major trade
languages’, languages that are spoken in a number of different countries. Which means that
between speakers of say Greek and Chinese, they are likely to use one of the major languages
to bridge the greater transaction costs, as they are the most distance of language pairs40.
39 Selmier, W.T. and Oh, C.H. 2012 ‘The Power of Major Trade Languages in Trade and Foreign Direct Investment, Review of International Political Economy.’ Review of International Political Economy, iFirst p.7 40 ibid p.12
32
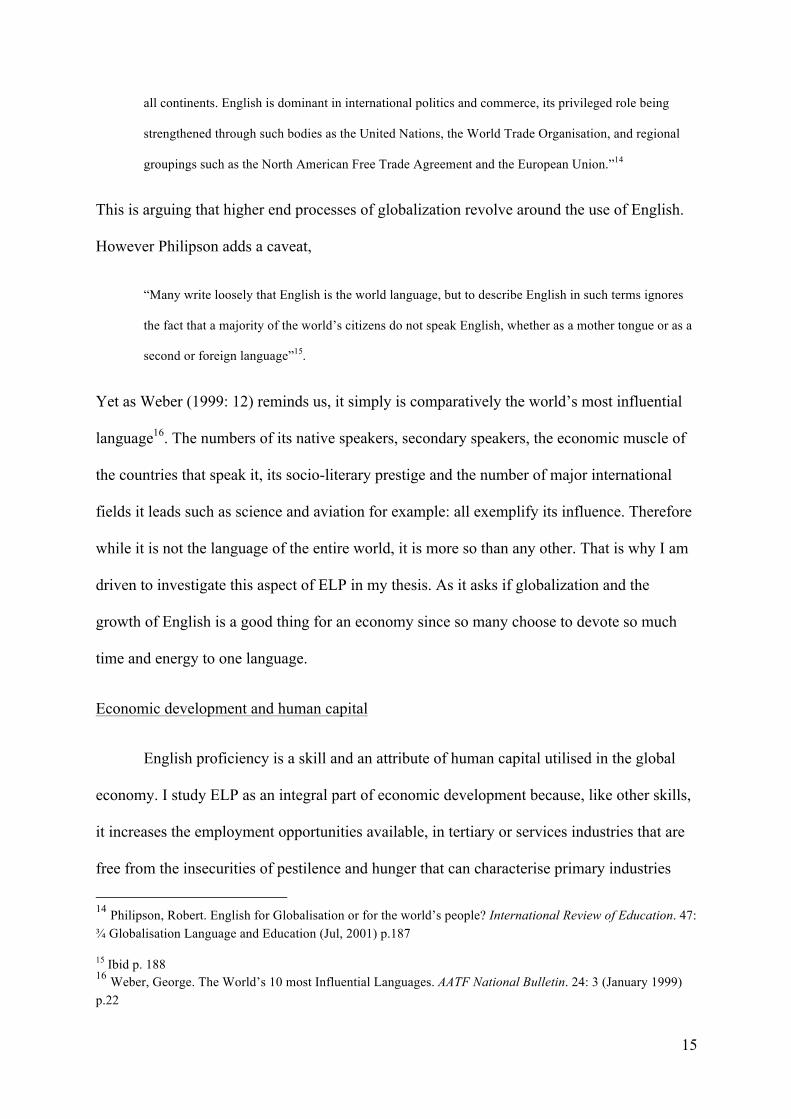
Table 2 Trade Language hierarchy
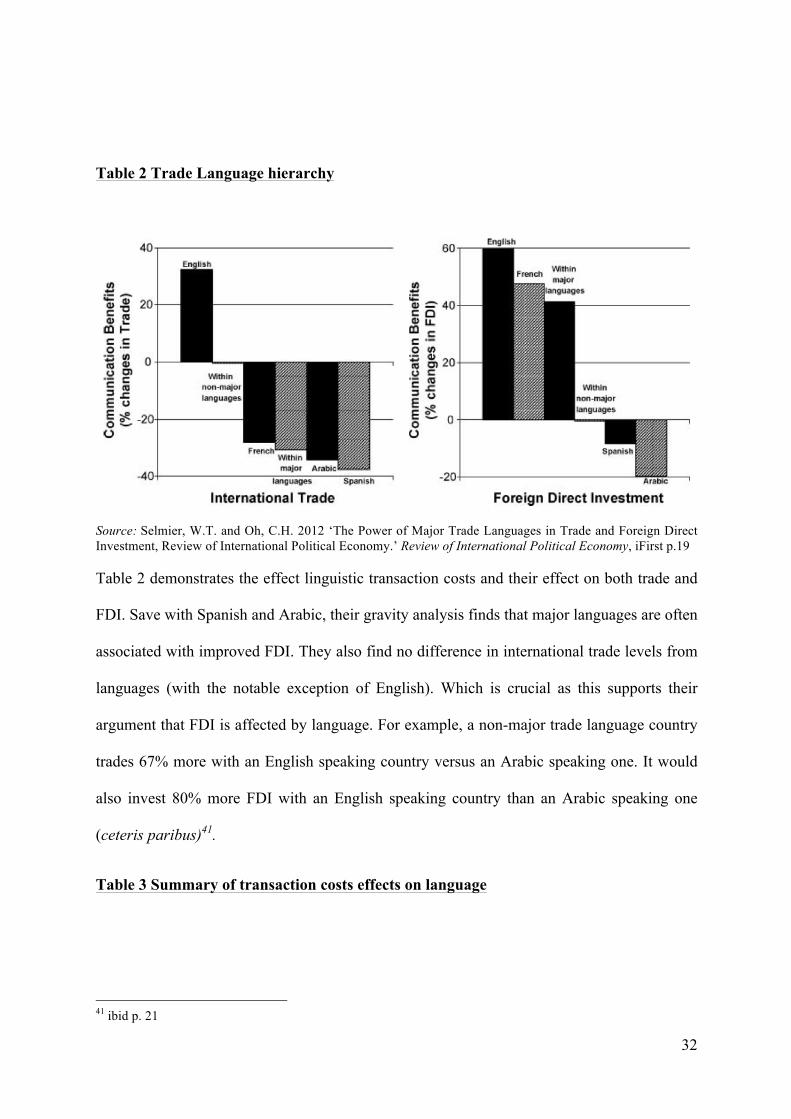
Source: Selmier, W.T. and Oh, C.H. 2012 ‘The Power of Major Trade Languages in Trade and Foreign Direct Investment, Review of International Political Economy.’ Review of International Political Economy, iFirst p.19 Table 2 demonstrates the effect linguistic transaction costs and their effect on both trade and
FDI. Save with Spanish and Arabic, their gravity analysis finds that major languages are often
associated with improved FDI. They also find no difference in international trade levels from
languages (with the notable exception of English). Which is crucial as this supports their
argument that FDI is affected by language. For example, a non-major trade language country
trades 67% more with an English speaking country versus an Arabic speaking one. It would
also invest 80% more FDI with an English speaking country than an Arabic speaking one
(ceteris paribus)41.
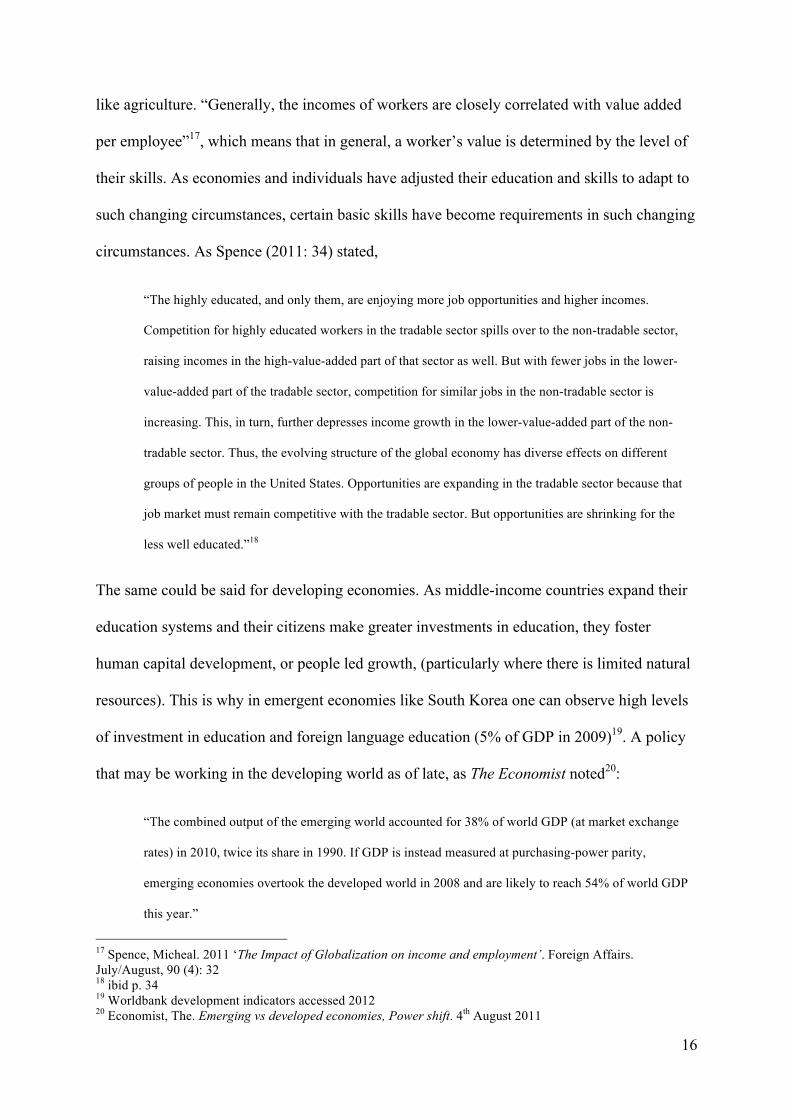
Table 3 Summary of transaction costs effects on language
41 ibid p. 21
33
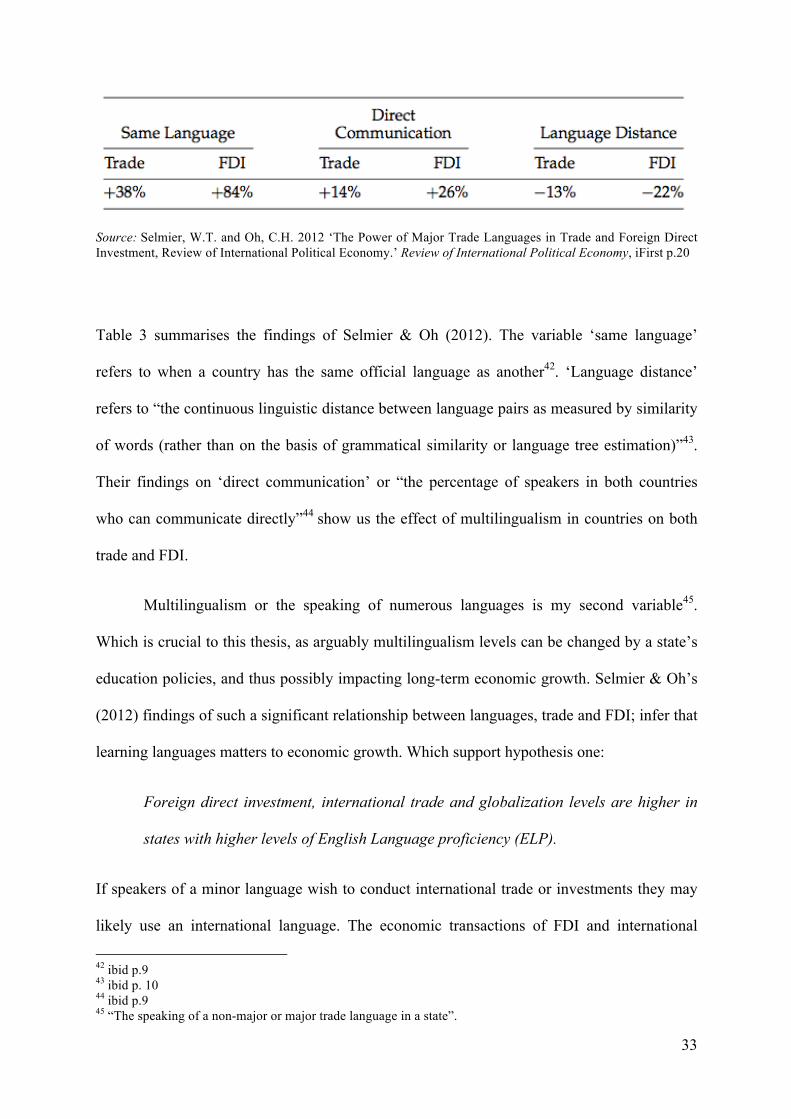
Source: Selmier, W.T. and Oh, C.H. 2012 ‘The Power of Major Trade Languages in Trade and Foreign Direct Investment, Review of International Political Economy.’ Review of International Political Economy, iFirst p.20
Table 3 summarises the findings of Selmier & Oh (2012). The variable ‘same language’
refers to when a country has the same official language as another42. ‘Language distance’
refers to “the continuous linguistic distance between language pairs as measured by similarity
of words (rather than on the basis of grammatical similarity or language tree estimation)”43.
Their findings on ‘direct communication’ or “the percentage of speakers in both countries
who can communicate directly”44 show us the effect of multilingualism in countries on both
trade and FDI.
Multilingualism or the speaking of numerous languages is my second variable45.
Which is crucial to this thesis, as arguably multilingualism levels can be changed by a state’s
education policies, and thus possibly impacting long-term economic growth. Selmier & Oh’s
(2012) findings of such a significant relationship between languages, trade and FDI; infer that
learning languages matters to economic growth. Which support hypothesis one:
Foreign direct investment, international trade and globalization levels are higher in
states with higher levels of English Language proficiency (ELP).
If speakers of a minor language wish to conduct international trade or investments they may
likely use an international language. The economic transactions of FDI and international
42 ibid p.9 43 ibid p. 10 44 ibid p.9 45 “The speaking of a non-major or major trade language in a state”.
34
trade, ultimately affect economic development, as Borensztein. De Gregorio. & Lee (1998:
121) uncover46. They demonstrate that FDI has a positive impact on economic growth and on
human capital levels, after controlling for initial income, human capital, government
consumption and the parallel market premium for foreign exchange47. As the higher the level
of human capital in the host country, the higher the effect of FDI has on economic growth48.
Dreher (2006) and Dollar (1992) further find that there is a relationship between globalization
and economic growth. Therefore I include the findings of their analysis; to show how higher
ELP levels generally mean higher economic development levels.
Second languages and the status quo
“Historically, speaking a second language – or more specifically speaking a highly
valued second language- was a marker of the social and economic elite”49. The Tables 4, 5,
and 6 are extracts from a study that demonstrates such a hypothesis and my thesis as a whole.
In effect showing that richer states generally speak better English50. It must also be noted that
the figures are not statistically controlled, as the test takers were people able to afford the test
and motivated to study for it by professional or academic reasons. Thereby not providing a
complete picture of the ELP of learners in the surveyed states. Yet the results are stimulating
as The Economist reviewed the same report,
“Finally, one surprising result is that China and India are next to each other (29th and 30th of 44) in the
rankings, despite India’s reputation as more Anglophone. Mr Hult says that the Chinese have made a
broad push for English (they're "practically obsessed with it”). But efforts like this take time to
46 Borensztein, E. De Gregorio, J. Lee, J-W. 1998 ‘How does foreign direct investment affect economic growth?’ Journal of International Economics. 45. 121
47 Ibid p. 123 48 Ibid p.121 49 English First, English Proficiency Index 2011 p. 6 http://www.ef-ireland.ie/sitecore/__/~/media/efcom/epi/pdf/EF-EPI-2011.pdf p.5 Accessed 3/6/11
50 R.L.G. Who Speaks English? Economist, The. 5th April 2011
35
marinade through entire economies, and so may have avoided notice by outsiders. India, by contrast,
has long had well-known Anglophone elites, but this is a narrow slice of the population in a country
considerably poorer and less educated than China. English has helped India out-compete China in
services, while China has excelled in manufacturing. But if China keeps up the push for English, the
subcontinental neighbour's advantage may not last”51.
This infers that ELP can be used as the tool of development, whereby with apt investment in
education; states can develop on a level playfield of ELP. Yet as Inglewood & Woodward
(1967: 40) found in less development countries when social mobility is low, a second
language (such as English) can be key to securing government employment, a strong
indication of social mobility and elite status52. Though if equal status is granted to the major
languages in a state, a language (like English) can become a neutral factor in social
mobility53. Next I analyse Tables 4, 5 and 6 from the ‘English First 2011’ English proficiency
report and note that generally speaking, richer countries are more likely to speak better
English.
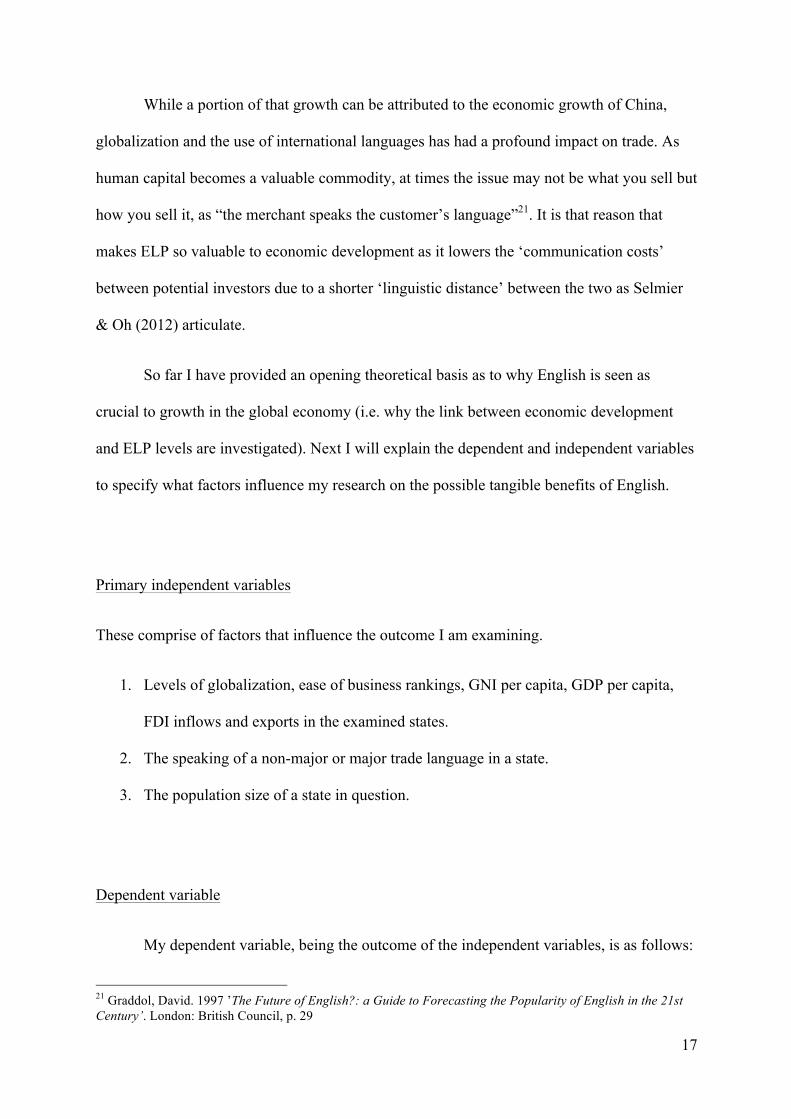
Table 4 EF English Proficiency Index, Score levels and rankings
1 Norway 69.09
23 Italy 49.05
2 Netherlands 67.93 24 Spain 49.01
3 Denmark 66.58
25 Taiwan 48.93
4 Sweden 66.26
26 Saudi Arabia 48.05
5 Finland 61.25 27 Guatemala 47.80
6 Austria 58.58 28 El Salvador 47.65
7 Belgium 57.23
29 China 47.62
8 Germany 56.64 30 India 47.35
9 Malaysia 55.54
31 Brazil 47.27
10 Poland 54.62
32 Russia 45.79 11 Switzerland 54.60
33 Dominican Republic 44.91
12 Hong Kong 54.44
34 Indonesia 44.78 13 South Korea 54.19 35 Peru 44.71 14 Japan 54.17 36 Chile 44.63 15 Portugal 53.62
37 Ecuador 44.54 16 Argentina 53.49 38 Venezuela 44.43 17 France 53.16 39 Vietnam 44.32
18 Mexico 51.48
40 Panama 43.62
51 ibid 52 Woodward, Margaret. Inglehart, Ronald F. October 1967 ‘Language Conflicts and Political Community’. Comparative Studies in Society and History. 10(1): 40 53 ibid p. 45
36
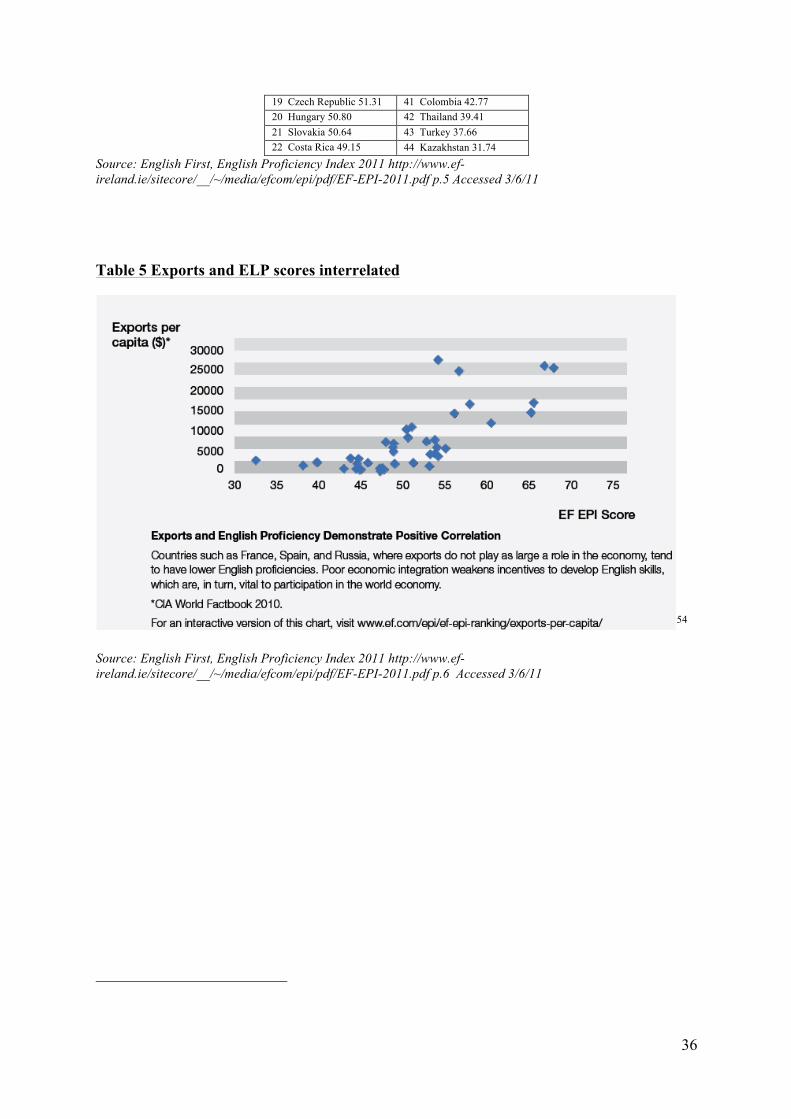
19 Czech Republic 51.31
41 Colombia 42.77 20 Hungary 50.80
42 Thailand 39.41
21 Slovakia 50.64 43 Turkey 37.66
22 Costa Rica 49.15
44 Kazakhstan 31.74 Source: English First, English Proficiency Index 2011 http://www.ef-
ireland.ie/sitecore/__/~/media/efcom/epi/pdf/EF-EPI-2011.pdf p.5 Accessed 3/6/11
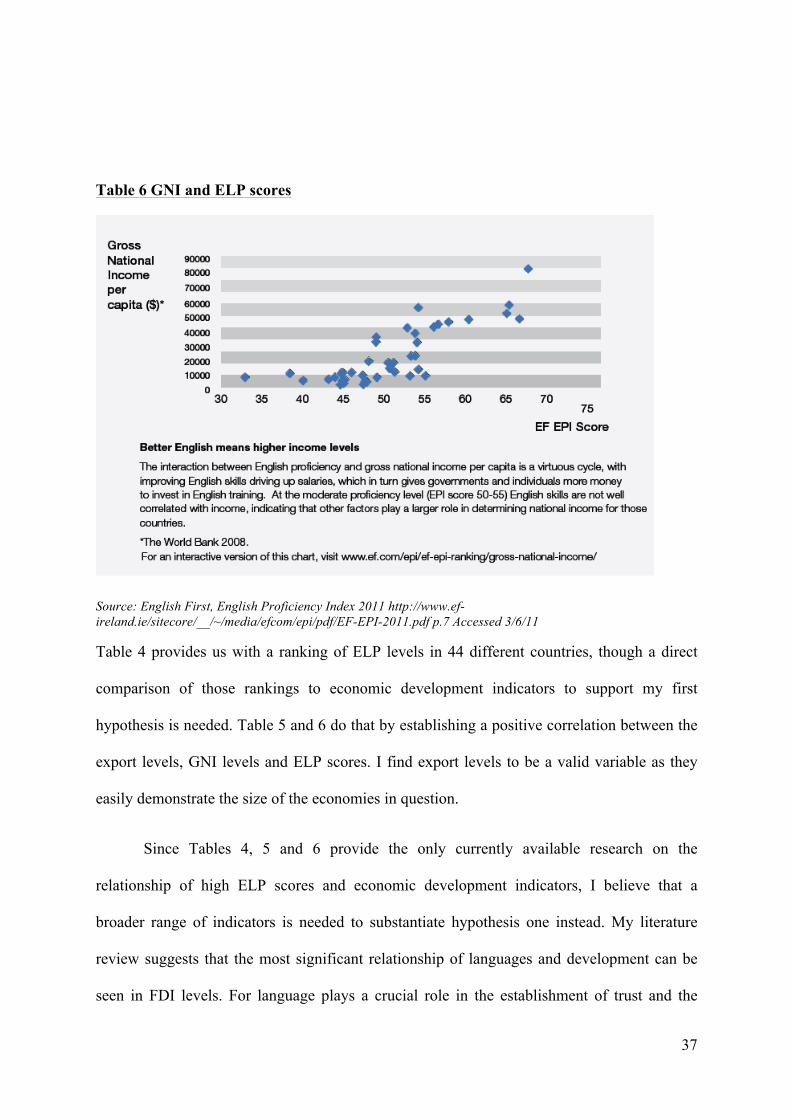
Table 5 Exports and ELP scores interrelated
54
Source: English First, English Proficiency Index 2011 http://www.ef-ireland.ie/sitecore/__/~/media/efcom/epi/pdf/EF-EPI-2011.pdf p.6 Accessed 3/6/11
37
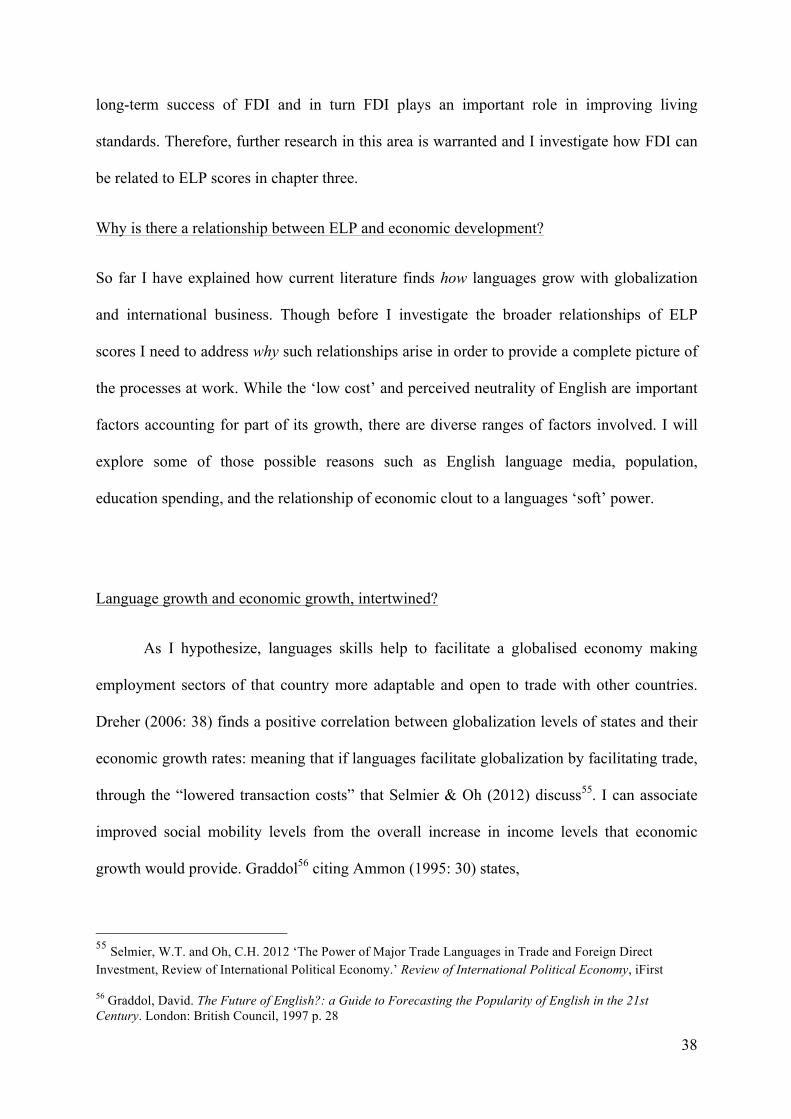
Table 6 GNI and ELP scores
Source: English First, English Proficiency Index 2011 http://www.ef-ireland.ie/sitecore/__/~/media/efcom/epi/pdf/EF-EPI-2011.pdf p.7 Accessed 3/6/11
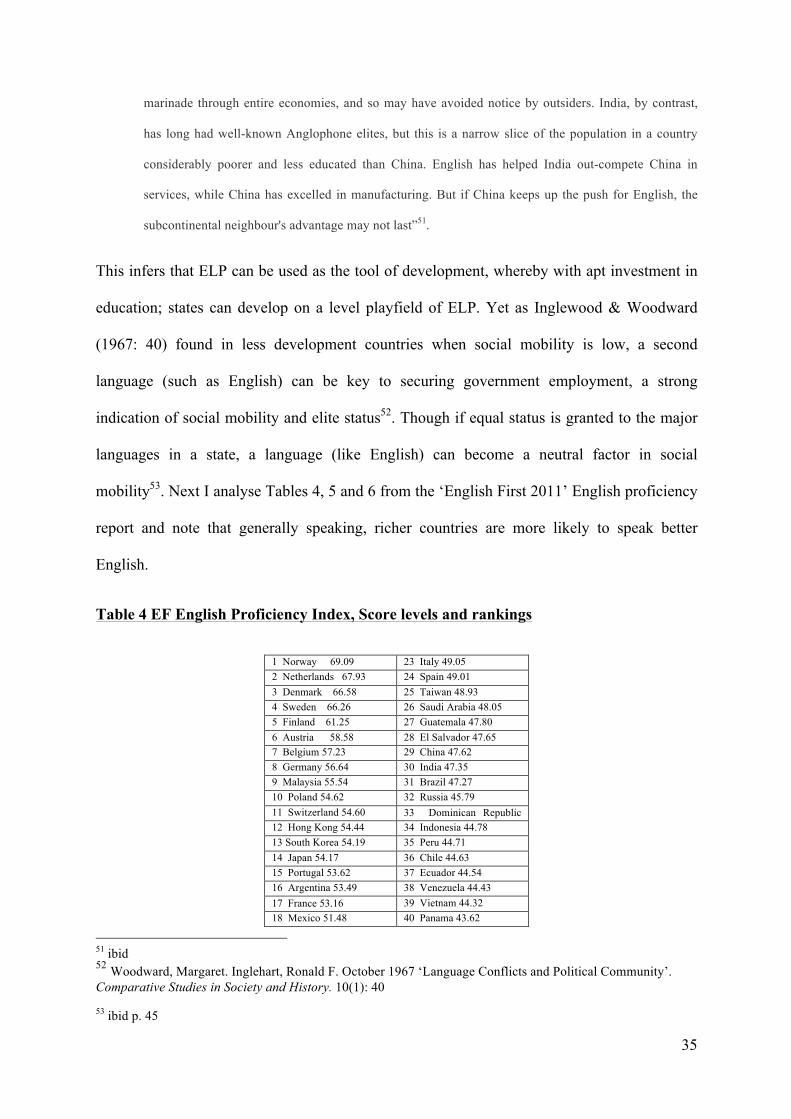
Table 4 provides us with a ranking of ELP levels in 44 different countries, though a direct
comparison of those rankings to economic development indicators to support my first
hypothesis is needed. Table 5 and 6 do that by establishing a positive correlation between the
export levels, GNI levels and ELP scores. I find export levels to be a valid variable as they
easily demonstrate the size of the economies in question.
Since Tables 4, 5 and 6 provide the only currently available research on the
relationship of high ELP scores and economic development indicators, I believe that a
broader range of indicators is needed to substantiate hypothesis one instead. My literature
review suggests that the most significant relationship of languages and development can be
seen in FDI levels. For language plays a crucial role in the establishment of trust and the
38
long-term success of FDI and in turn FDI plays an important role in improving living
standards. Therefore, further research in this area is warranted and I investigate how FDI can
be related to ELP scores in chapter three.
Why is there a relationship between ELP and economic development?
So far I have explained how current literature finds how languages grow with globalization
and international business. Though before I investigate the broader relationships of ELP
scores I need to address why such relationships arise in order to provide a complete picture of
the processes at work. While the ‘low cost’ and perceived neutrality of English are important
factors accounting for part of its growth, there are diverse ranges of factors involved. I will
explore some of those possible reasons such as English language media, population,
education spending, and the relationship of economic clout to a languages ‘soft’ power.
Language growth and economic growth, intertwined?
As I hypothesize, languages skills help to facilitate a globalised economy making
employment sectors of that country more adaptable and open to trade with other countries.
Dreher (2006: 38) finds a positive correlation between globalization levels of states and their
economic growth rates: meaning that if languages facilitate globalization by facilitating trade,
through the “lowered transaction costs” that Selmier & Oh (2012) discuss55. I can associate
improved social mobility levels from the overall increase in income levels that economic
growth would provide. Graddol56 citing Ammon (1995: 30) states,
55 Selmier, W.T. and Oh, C.H. 2012 ‘The Power of Major Trade Languages in Trade and Foreign Direct Investment, Review of International Political Economy.’ Review of International Political Economy, iFirst
56 Graddol, David. The Future of English?: a Guide to Forecasting the Popularity of English in the 21st Century. London: British Council, 1997 p. 28
39
“The language of an economically strong community is attractive to learn because of its business
potential, knowledge of the language potentially opens up the market for producers to penetrate a
market if they know the language of the potential customer.”
Furthermore Fishman (1999: 26) found that English-speaking countries account for
approximately 40% of the world’s gross domestic product.57 Therefore giving a direct
incentive for the rest of the world to adapt itself to such a massive market and learn how to
trade with it. Graddol cites Coulmas (1992), noting that the number of students learning
Japanese as a foreign language closely mirrored a rise in the value of the Japanese yen against
the US dollar58. Such a scenario can be further reflected with a rise in the number of students
of Mandarin, China’s national language after years of economic growth. Yet as The
Economist commented,
“The question remains whether the Mandarin rush will prove a fad. Japanese and Russian also had
“hot” periods, only to recede in popularity”59.
This raises a further question, are the motivations for learning English different to those of
Mandarin, Spanish or French? It is clear that it has had sustained growth for centuries though
one cannot fail to wonder, are its days, numbered with the rise of a rival power?
While Mandarin may be a strong lingua franca regionally for example, it pales in face
of the widespread and swift rise of English that was promoted by a prosperous colonising
state. Crystal (2003: 9) argued while colonial rulers may establish some languages; it takes
the strong economy of the colonising state to maintain and expand its language 60 .
Nevertheless any analysis of this hypothesis must consider the lack of sufficient statistical
57 Fishman, Joshua A. The New Linguistic order. Foreign Policy, 113, Winter 1998-9. P.26 58 Graddol, David. The Future of English?: a Guide to Forecasting the Popularity of English in the 21st Century. London: British Council, 1997 p. 28 59 "Mandarin's Great Leap Forward." The Economist 18 Nov. 2010 60 Crystal, David. English as a Global Language. 2nd ed. Cambridge, UK: Cambridge UP, 2003 p. 9
40
data on the amount of English language learners61, which I will attempt to address in chapter
three. In the case of English, I could account for its rise not just from colonisation, but also
from the colonised states themselves, like America for example. Thus for a language to grow
in strength, it may require adopter countries to use that language before it can reach the higher
status of a ‘global language’ above a major trade language or lingua franca. For the economic
attractiveness of a language to act on a global level, it must transcend mere regional usage to
become part of globalization.
Regional languages
Not all authors agree with my idea that ‘global languages’ help international business
and economic development, some argue that regional languages have a bigger impact over
peoples’ lives. Fishman (1999: 29) argues that they should on the basis that regional lingua
francas are central to promoting social mobility within the developing world62. He argues
that the only things that make a real, lasting difference on people’s lives are the growth in
regional interactions such as trade, travel, the spread of religions, interethnic marriages, as
they affect the widest variety of people. They do so by facilitating agricultural and
commercial expansion across local boundaries and foster literacy and education in highly
multilingual areas63. He argues that the spread of English is forever etched along social class
lines, age, gender and profession64. Thus English wouldn’t have the same impact on as many
people as a regional lingua franca would, according to him. That kind of analysis ignores the
wider system at work of inter-regional and global trade that has defined the twentieth century.
61 Graddol, David. The Future of English?: a Guide to Forecasting the Popularity of English in the 21st Century. London: British Council, 1997 p. 17 62 Fishman, Joshua A. The New Linguistic order. Foreign Policy, 113, Winter 1998-9. P.28-29 63 ibid P.31 64 ibid p. 28
41
For instance, within Europe German and French are confined to trade primarily within
Europe itself, but to trade outside of the EU companies often use English65. Clearly regional
languages play an important part of trade due to shorter socio-linguistic distance between
them. Yet English (within the EU) is the most studied language at every level of education66.
Clearly regional economic dominance is not a central tenant of a language’s growth globally
but a part thereof. If economic power determined the lingua franca of a region German or
French would be the language of Europe. Yet they are not, (French is the second most learned
foreign language across Europe)67. The immense scope of opportunities that English provides
globally over other European languages is a stronger carrot to most. Meaning that there are
limitations on my hypothesis four.
An increase in the economic strength or GPD growth of a country can lead to an
increase in the number of learners of that country’s national language.
Regional languages do play a role in development, though the carrot of global opportunities
has placed English above the normal circumstances that would support my fourth hypothesis,
since it is so widespread and grows from the numerous economies.
Cultural effects of English media
Globalization is arguably as much a change in global trade dynamics as it is a cultural
shift. So far in answering ‘why’ some countries appear to speak better English and are richer
than others. I discussed the concept of shared ideas through languages and the economic draw
of English. Though the effect of shared culture through mass media deserves consideration.
65 Ibid p. 29 66 Mejer, Lene. Boateng, Sadiq Kwesi. Turchetti, Paolo. Eurostat: Population and Social Conditions 49/2010 http://epp.eurostat.ec.europa.eu/cache/ITY_OFFPUB/KS-SF-10-049/EN/KS-SF-10-049-EN.PDF Accessed 10/7/11 p.5 67 ibid
42
Tracey (1985: 22) found that most imported television programs around the world
originate from the United States68 and are therefore arguably are more likely to increase the
proliferation of English. Danan (2004: 73) notes its influence in The Netherlands through the
use of subtitling foreign media.
“Dutch children devote half of their television viewing time on average to subtitled programs (Koostra
& Benntjes, 1999: 59). In Belgium also, many children can speak and understand some English even
before they start learning English at school, presumably because of their frequent exposure to English-
language subtitled television programs (d’Ydewelle & Pavakanum, 1997: 146). As for adults, they
often view subtitling as a perk allowing them to learn or maintain their knowledge of a foreign
language, especially English, thanks to preference for subtitled programs in many countries. For
example, a 1977 survey conducted by the Dutch Broadcasting Service (NOS) revealed that 70% of their
spectators favoured subtitling, most often because it allowed them to increase their language
proficiency (De Bot et al., 1986:74)”69.
Such research suggests a link between cultural globalization and ELP. A further reason for
The Netherland’s high ELP rating could be its geographical position within Europe and its
history of international trading that has kept its economy ‘open’ to investments. Indeed due its
central position in continental trade routes and history of international trading it has in effect
advanced the case for multilingualism. Shorter linguistic distance between French, Dutch,
German and English makes it easier to learn each other according to Selmier & Oh’s findings
(2012). Increased exposure to English through subtitling of television facilitates a strong link
with globalization and higher ELP levels.
68 Tracey, Micheal. (1985) “The Poisoned Chalice? International Television and the Idea of Dominance”. Daedalus. 114: 4, 17-56 69 Danan, Martine. 2004 ‘Captioning and Subtitling: Undervalued Language Learning Strategies’. Translators’ Journal. 49 (1): 73
43
Social mobility from education, criticisms
So far I have posited that linguistic education is a good thing that leads to greater
socio-economic opportunities. Though some critique this view (concerning education in
general realist terms), Pennycock (1994: 48) states:
“The assumed causal link between education and development was rejected not because a critical
analysis of the role of education in capitalist societies suggested that it was a crucial factor in
reproducing social and cultural inequalities”70.
He further cites Bowles and Gintis (1976) and Bourdieu (1973) 71, who argue that education
has increased inequalities and that the developed world can’t gain any kind of economic,
social or political upper hand when investing in education. Secondly, those educational
systems in former colonies consolidate the culture and language of their former masters. I
reject those ideas. For in recent years the developing world is on average, growing
substantially, particularly due to the growth of China. The ‘Asia-tigers’ such as Taiwan and
South Korea lead the world in numerous industries, such as software development and
electronic manufacturing. Yet as I have already countered: languages like cultures are never
static and may take on new forms of identities. It is erroneous to suggest that learning less or
speaking more languages is a bad thing. Now that I have introduced some ‘whys’ English is
central to debates on globalization, economic development and human capital led growth, I
shall demonstrate some of the ‘hows’ in chapter three as the available literature has
insufficiently addresses the questions I raise.
70 Pennycook, Alastair. The Cultural Politics of English as an International Language. London: Longman, 1994. P. 48
71 ibid
44
Population
A final variable to account for higher ELP scores in some countries over others may
be population, my third independent variable and fourth hypothesis.
A small population can encourage higher ELP usage while a larger population can
often mean a lower level of ELP.
I draw that hypothesis after encountering research by Ginsburgh et al (2005).
“The larger the native population who speaks the language, the less speakers are prone to learn another
language; the more the foreign language is spoken, the more it attracts others to learn it; the larger the
distance between two languages, the smaller the proportion of people who will learn it.” 72
English has grown exponentially on account of its ubiquity, which gives it an unparalleled
economic draw. This idea can be understood in terms of markets: the larger the domestic
market in a country, the less people are drawn to learn a foreign language as they have
enough of a market (people) to let their business grow domestically without needing to
expand abroad. Whereas in a small country, it can be reasoned that since there is less of a
draw for FDI if they only speak their native language. The small state will accordingly be
drawn to learn the major language of the nearest and biggest markets, often the lingua franca.
In Chapter three I analyse population figures in my empirical analysis to provide further
investigation on this variable in Table 12.
72 Ginsburgh, Victor. Ortuno-Ortín, Ignacio. Weber, Shlomo. ‘Learning Foreign Languages. Theorectical and empirical implications of the Selten and Pool model’. Center for Economic Policy Research. Discussion paper No. 4942 March 2005 p.11
45
Conclusion
This chapter has given an outline of debates concerning why the English language has
grown and why it is related to globalization and international trade. I have touched on the
empirical research as to how some languages will prosper before others on account of
international trade and investment. This being due to the ‘lower cost’ of lingua francas in
trade and why the growth of languages is often tied to the economic clout of its speakers.
Central idea reasoning is that, “the merchant speaks the customer’s language”73 and
the need for trust to build relationships between potential investors is paramount. I raised the
connection of languages and ideas as much of the literature cites the growth of global English
as cultural death. I then countered by citing historical precedents of cultural and linguistic
changes. Since languages are often tied to economic fortunes, I raised hypothesis four and
discussed the effects of colonialism and global trade.
I then touched on the idea that languages grow with respect to the economic clout of
their speakers. Then I raised the concern that regional languages, have a greater effect on
development. I countered that ‘regionalism not globalization’ idea by noting how English is
the most popular language in the EU instead of French or German. Which demonstrate the
draw of a global language over regional languages. I considered the effect of English
language media aid English’s growth. Then I countered the assertion education enforces
inequalities and finally, I raised the population variable in language growth.
73 Graddol, David. The Future of English?: a Guide to Forecasting the Popularity of English in the 21st Century. London: British Council, 1997 p. 29
46
This chapter concludes that many authors consider English as a language of power and
progress74. Some oppose it on anti-imperialist grounds, while many view it as a practical
asset. An idea based on a substantial relationship between globalised growth and the increase
in English language. Next I will demonstrate further research of my own on those
relationships to consolidate this thesis.
74 Pennycook, Alastair. The Cultural Politics of English as an International Language. London: Longman, 1994. p. 13

47
Chapter three Empirical findings and analysis
48
Introduction
As I have demonstrated in my literature review there is a lack of in depth investigation
on the effect of ELP scores to economic development indicators. Thus I provide a greater
degree of indicators than the English First report in chapter two provides. This will allow a
more convincing picture of the strong relationship of ELP to economic development.
Methodology
As aforementioned in chapter one, I build my case by demonstrating how highly
proficient non-native English speaking countries are often highly globalised and
economically developed. I do this through a ranking scheme in Table 7 that has removed the
native English speaking countries of the TOEFL ELP scores so that one can observe the
relationship effectively.
Due to incomplete data, not all countries were chosen for correlation coefficient
analysis. I needed to do this due to the limited range of consistent data on all countries. I
provide IELTS ELP scores and economic indicators in Table 9. Then, I selected 36 countries
that have all of available economic development indicators that I use. I also selected the
closest available time series (2011 and 2010) so that one can compare as many states’ ELP
scores as possible. Afterward I exported that data to Microsoft Excel so that I could calculate
a correlation coefficient. I also provide evidence for those calculations with Table 8 that
shows the full data sets.
In Table 11, I employed the same methodology with TOEFL scores so that I could
account for an equal picture of states’ ELP scores with the indicators available from the
World Bank. However, I used the 2010 time series for the economic indicators, as more
statistics were available from that year than from 2011.
49
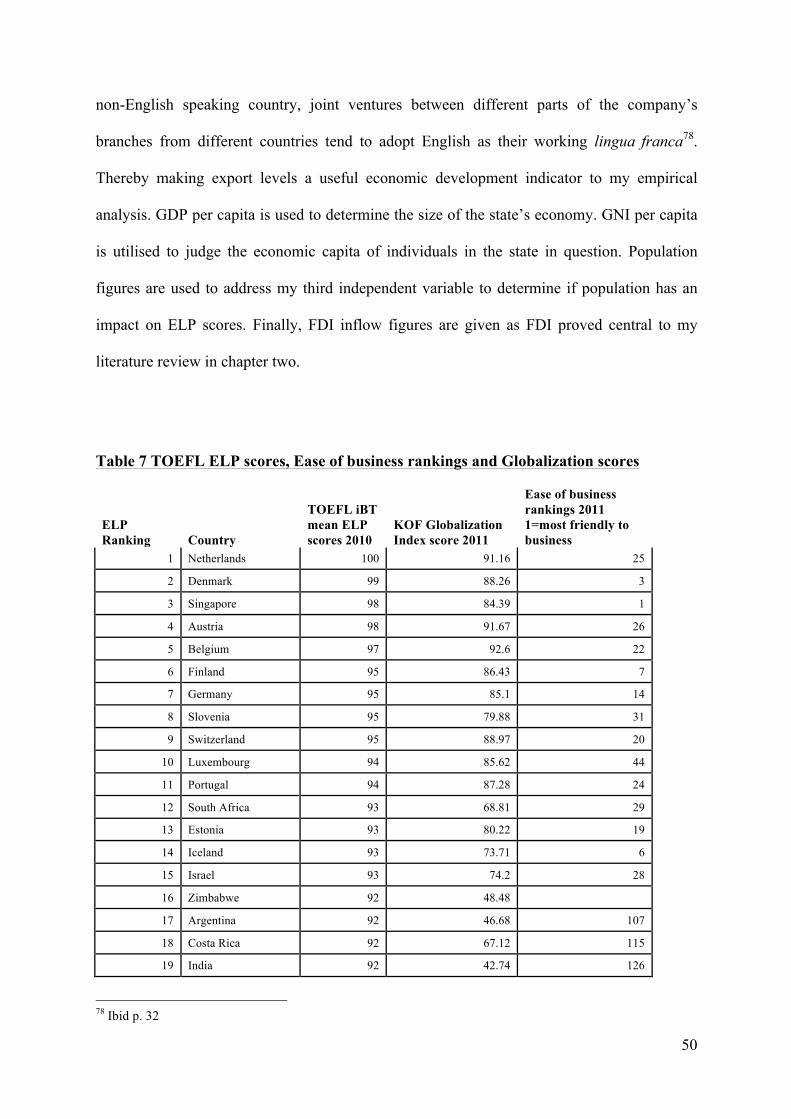
I selected IELTS as a testing system of ELP as it has the largest international usage,
over one million test takers in 200875. Furthermore, the testing system comprises of speaking,
writing, reading and listening abilities: a wide range criteria to determine ELP. They also
found that a slight majority, 51% undertake the test in order to study in a foreign university76.
However, for the purpose of my statistical analysis, the IELTS data is limited. First, the test
ranges from a band of 1 as the lowest to 9 as the highest possible score. Making the accuracy
range of IELTS scores limited. Secondly, there is a smaller range of countries available for
analysis from their aggregate database. To address this problem, I constructed Table 7 and 10
that use the more extensive TOEFL ELP scores to demonstrate the relationship of
globalization to economic development. I include it so that one may view the significant
relationship of globalization to ELP scores and trade. I also include the available economic
globalization rankings so that I may provide further material to address my two main
hypotheses.
1. Foreign direct investment, international trade and globalization levels are higher in
states with higher levels of English Language proficiency (ELP).
2. Higher FDI levels are often linked with higher globalization figures.
Indicators used
I add export levels as most states aim for a level of import-export balance in their
trade levels, in order to tip trade exchanges in their favour. They aim to make the language
effect reciprocal leading to a greater reliance on lingua fracas for promoting multi-lateral
trade due to its lower costs77. Furthermore when a transnational corporation is located in a
75 IELTs press release 4/6/08 www.ielts.org accessed on 27/8/12 www.ielts.org/Docs/press_release_London_27_nov_2008.doc 76 ibid 77 Graddol, David. The Future of English?: a Guide to Forecasting the Popularity of English in the 21st Century. London: British Council, 1997 p. 29
50
non-English speaking country, joint ventures between different parts of the company’s
branches from different countries tend to adopt English as their working lingua franca78.
Thereby making export levels a useful economic development indicator to my empirical
analysis. GDP per capita is used to determine the size of the state’s economy. GNI per capita
is utilised to judge the economic capita of individuals in the state in question. Population
figures are used to address my third independent variable to determine if population has an
impact on ELP scores. Finally, FDI inflow figures are given as FDI proved central to my
literature review in chapter two.
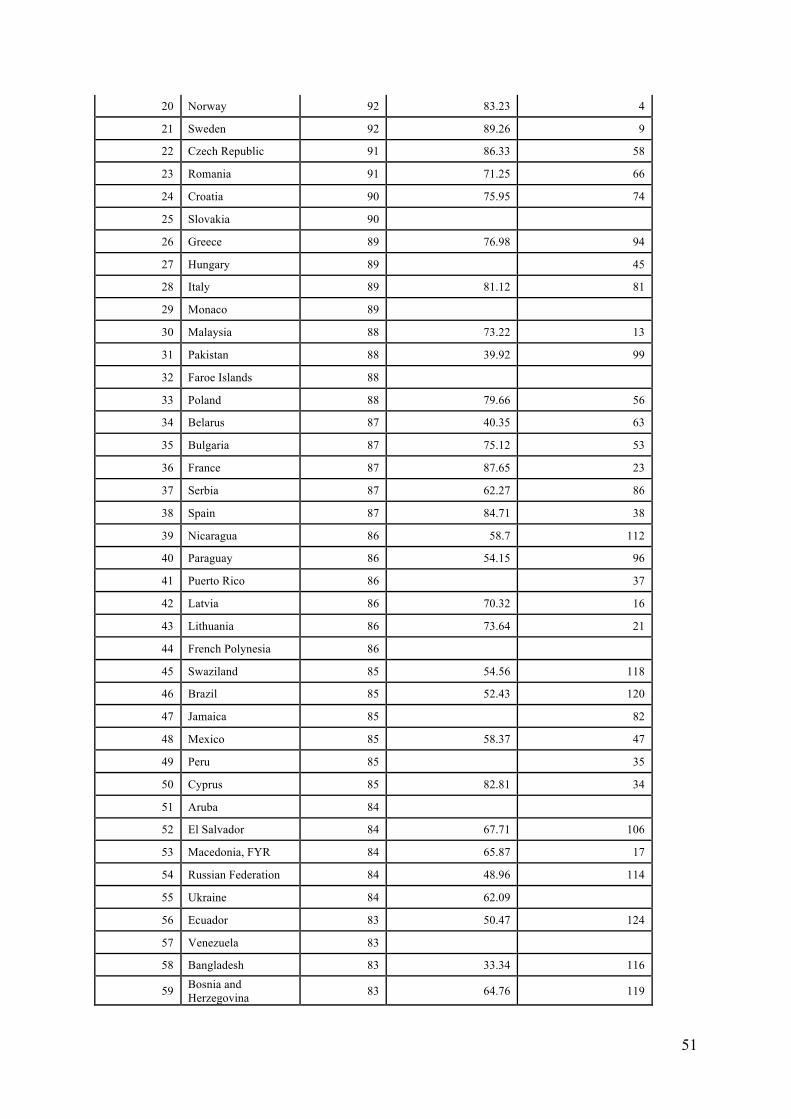
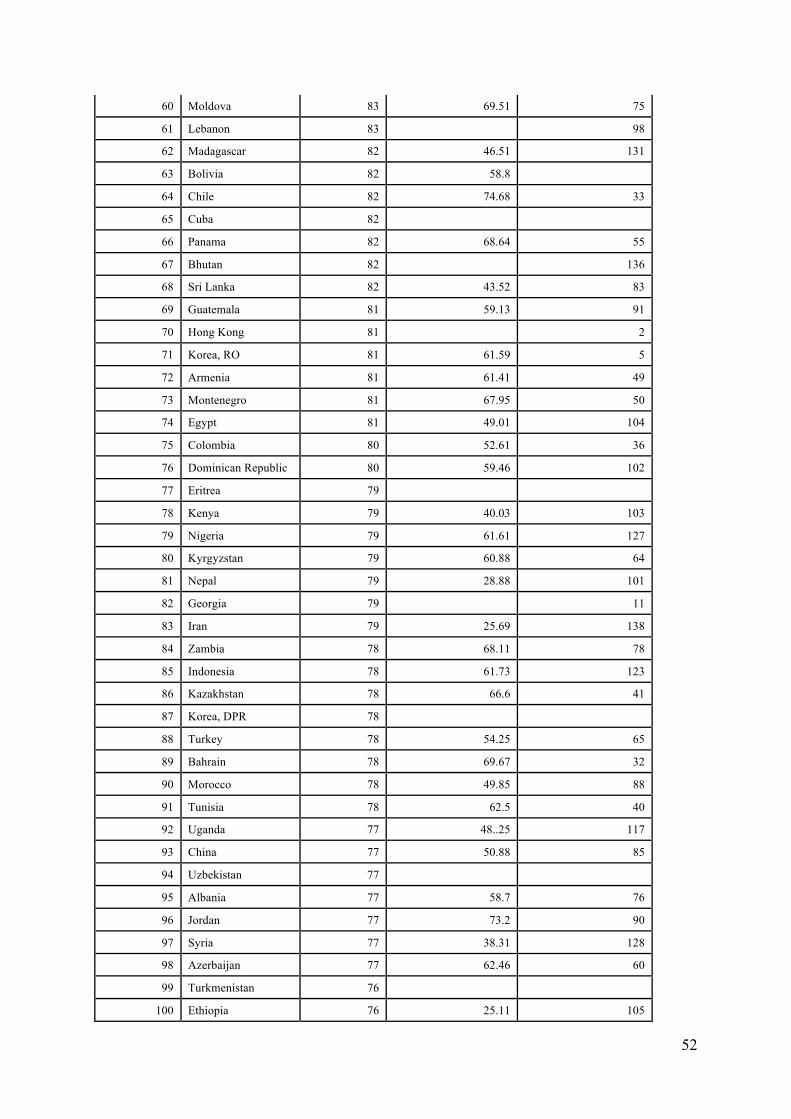
Table 7 TOEFL ELP scores, Ease of business rankings and Globalization scores
ELP Ranking Country
TOEFL iBT mean ELP scores 2010
KOF Globalization Index score 2011
Ease of business rankings 2011 1=most friendly to business
1 Netherlands 100 91.16 25
2 Denmark 99 88.26 3
3 Singapore 98 84.39 1
4 Austria 98 91.67 26
5 Belgium 97 92.6 22
6 Finland 95 86.43 7
7 Germany 95 85.1 14
8 Slovenia 95 79.88 31
9 Switzerland 95 88.97 20
10 Luxembourg 94 85.62 44
11 Portugal 94 87.28 24
12 South Africa 93 68.81 29
13 Estonia 93 80.22 19
14 Iceland 93 73.71 6
15 Israel 93 74.2 28
16 Zimbabwe 92 48.48
17 Argentina 92 46.68 107
18 Costa Rica 92 67.12 115
19 India 92 42.74 126
78 Ibid p. 32
51
20 Norway 92 83.23 4
21 Sweden 92 89.26 9
22 Czech Republic 91 86.33 58
23 Romania 91 71.25 66
24 Croatia 90 75.95 74
25 Slovakia 90
26 Greece 89 76.98 94
27 Hungary 89 45
28 Italy 89 81.12 81
29 Monaco 89
30 Malaysia 88 73.22 13
31 Pakistan 88 39.92 99
32 Faroe Islands 88
33 Poland 88 79.66 56
34 Belarus 87 40.35 63
35 Bulgaria 87 75.12 53
36 France 87 87.65 23
37 Serbia 87 62.27 86
38 Spain 87 84.71 38
39 Nicaragua 86 58.7 112
40 Paraguay 86 54.15 96
41 Puerto Rico 86 37
42 Latvia 86 70.32 16
43 Lithuania 86 73.64 21
44 French Polynesia 86
45 Swaziland 85 54.56 118
46 Brazil 85 52.43 120
47 Jamaica 85 82
48 Mexico 85 58.37 47
49 Peru 85 35
50 Cyprus 85 82.81 34
51 Aruba 84
52 El Salvador 84 67.71 106
53 Macedonia, FYR 84 65.87 17
54 Russian Federation 84 48.96 114
55 Ukraine 84 62.09
56 Ecuador 83 50.47 124
57 Venezuela 83
58 Bangladesh 83 33.34 116
59 Bosnia and Herzegovina 83 64.76 119
52
60 Moldova 83 69.51 75
61 Lebanon 83 98
62 Madagascar 82 46.51 131
63 Bolivia 82 58.8
64 Chile 82 74.68 33
65 Cuba 82
66 Panama 82 68.64 55
67 Bhutan 82 136
68 Sri Lanka 82 43.52 83
69 Guatemala 81 59.13 91
70 Hong Kong 81 2
71 Korea, RO 81 61.59 5
72 Armenia 81 61.41 49
73 Montenegro 81 67.95 50
74 Egypt 81 49.01 104
75 Colombia 80 52.61 36
76 Dominican Republic 80 59.46 102
77 Eritrea 79
78 Kenya 79 40.03 103
79 Nigeria 79 61.61 127
80 Kyrgyzstan 79 60.88 64
81 Nepal 79 28.88 101
82 Georgia 79 11
83 Iran 79 25.69 138
84 Zambia 78 68.11 78
85 Indonesia 78 61.73 123
86 Kazakhstan 78 66.6 41
87 Korea, DPR 78
88 Turkey 78 54.25 65
89 Bahrain 78 69.67 32
90 Morocco 78 49.85 88
91 Tunisia 78 62.5 40
92 Uganda 77 48..25 117
93 China 77 50.88 85
94 Uzbekistan 77
95 Albania 77 58.7 76
96 Jordan 77 73.2 90
97 Syria 77 38.31 128
98 Azerbaijan 77 62.46 60
99 Turkmenistan 76
100 Ethiopia 76 25.11 105
53
101 Thailand 75 67.05 12
102 Algeria 75 49.16
103 Macao 75
104 Myanmar 74
105 Oman 74
106 Afghanistan 74
107 Mongolia 73 63.18 80
108 Vietnam 73 59.28 92
109 United Arab Emirates 73 70.99 27
110 Mozambique 73 57.9 133
111 Iraq 72
112 Sudan 72 129
113 Yemen 72 54.05 93
114 Congo, DRC 72
115 Kosovo 71 111
116 Qatar 71 69.57 30
117 Cameroon 71 40.81
118 Togo 71 51.68
119 Japan 70 69.13 15
120 Kuwait 70 64.6 61
121 Guinea 70 50.07
122 Sierra Leone 70 37.28 135
123 Gabon 69 48.21
124 Rwanda 69 29.61 39
125 Tanzania 68 35.28 121
126 Libya 68
127 Angola 68 71.39
128 Liberia 68
129 Niger 67 27.23
130 Lao, PDR 67
131 Burundi 67 28.22
132 Cape Verde 67 56.23 113
133 Cote D'Ivoire 66 51.4
134 Tajikistan 66 141
135 Burkina Faso 66 37.74
136 Congo 66 58.59
137 Saudi Arabia 65 8
138 Benin 65 37.1
139 Senegal 65 42.54
140 Chad 64 40.7
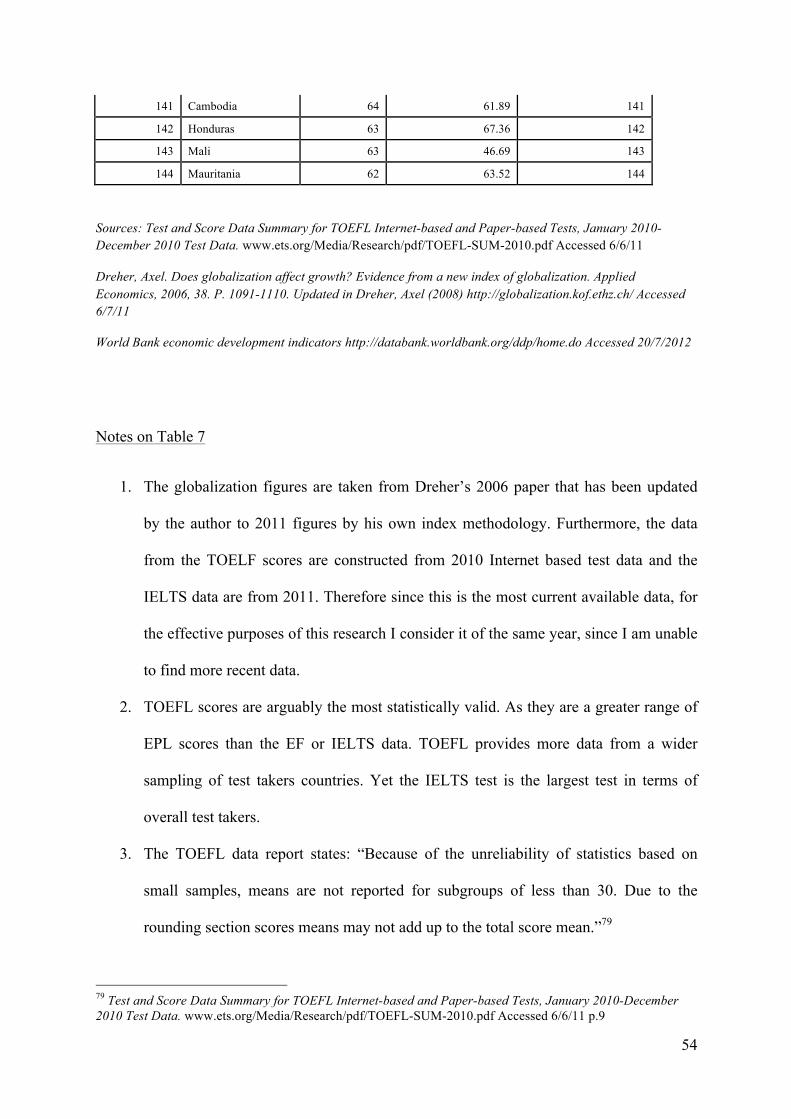
54
141 Cambodia 64 61.89 141
142 Honduras 63 67.36 142
143 Mali 63 46.69 143
144 Mauritania 62 63.52 144
Sources: Test and Score Data Summary for TOEFL Internet-based and Paper-based Tests, January 2010-December 2010 Test Data. www.ets.org/Media/Research/pdf/TOEFL-SUM-2010.pdf Accessed 6/6/11
Dreher, Axel. Does globalization affect growth? Evidence from a new index of globalization. Applied Economics, 2006, 38. P. 1091-1110. Updated in Dreher, Axel (2008) http://globalization.kof.ethz.ch/ Accessed 6/7/11
World Bank economic development indicators http://databank.worldbank.org/ddp/home.do Accessed 20/7/2012
Notes on Table 7
1. The globalization figures are taken from Dreher’s 2006 paper that has been updated
by the author to 2011 figures by his own index methodology. Furthermore, the data
from the TOELF scores are constructed from 2010 Internet based test data and the
IELTS data are from 2011. Therefore since this is the most current available data, for
the effective purposes of this research I consider it of the same year, since I am unable
to find more recent data.
2. TOEFL scores are arguably the most statistically valid. As they are a greater range of
EPL scores than the EF or IELTS data. TOEFL provides more data from a wider
sampling of test takers countries. Yet the IELTS test is the largest test in terms of
overall test takers.
3. The TOEFL data report states: “Because of the unreliability of statistics based on
small samples, means are not reported for subgroups of less than 30. Due to the
rounding section scores means may not add up to the total score mean.”79
79 Test and Score Data Summary for TOEFL Internet-based and Paper-based Tests, January 2010-December 2010 Test Data. www.ets.org/Media/Research/pdf/TOEFL-SUM-2010.pdf Accessed 6/6/11 p.9
55
4. The states in the tables include only those that are comparable with one another. For
example, a state that is included in the TOEFL scores but not in the other tables of
globalization or ease of business rankings, has been left in to aid comparison.
Conversely states that are not included in the TOEFL scores but that are mentioned in
the other rankings are omitted. This is because I view the TOEFL scores to be the base
of my empirical analysis.
5. Native English speaking states of: Ireland, Canada, USA, UK, Australia and New
Zealand have been omitted. Other English speaking states such as Singapore, South
Africa and Jamaica were also considered though due to their multi lingual make up
they were included in the indexes.
6. As the TOEFL data states in reference to its current publication, “because of changes
in region and/or country boundaries, certain countries may have been added or deleted
since the previous table was published”80.
7. The ease of business rankings are also modified by excluding the native English
speaking countries.
Table 7 data analysis
Table 7 provides a compelling case for hypotheses one and two81 as numerous
developed states match high scores on the globalization index and ease of business rankings.
In Table 7 I can see that The Netherlands is highest in the TOEFL scores table with an
average 100% ELP score. Furthermore it has a score of 67.93 and places second on Table 4 in
the English First rankings. In Table 7 it is third on the globalization index with a rating of
91.16. Denmark provides another strong example of hypotheses one and two, from Table 7. It
80 ibid 81 1. International trade, investment and globalization levels are higher in states with higher levels of English language proficiency (ELP). 2. Higher FDI levels are often linked with higher globalization figures.
56
is also 6th on globalization index with a score of 88.96 and ranks an impressive 3rd on the
World Bank’s ease of business rankings. Furthermore when one observes the relationship
with the first twenty-four countries’ globalisation scores and their TOEFL EPL scores; a
correlation coefficient of 0.541590993 can be calculated, a considerable relationship.
A number of states on Table 7 also suggest that emergent economies are more often
globalised ones that most likely have been aided by higher levels of ELP. For example, I can
see that Costa Rica has a high score on the overall TOEFL score of 92 and an EF score of
49.15 (from Table 4) suggesting that it has a moderately high level of average proficiency. It
also ranks it 49th place on the globalization scale with a 67.12 score, implying that there is a
link between levels of English and globalization. However the ELP score difference indicate
a degree of disparity between the EF and TOEFL testing systems. That is why I also
investigate the IELTS ELP scores on Table 8 and provide my economic comparisons on
Table 10 with the TOEFL data.
In Table 7 I have provided further evidence for my research question and hypothesis one.
“Do economically strong globalized states often speak more English than less strong
ones?”
Foreign direct investment, international trade and globalization levels are higher in
states with higher levels of English Language proficiency (ELP).
The test takers of EF, TOEFL and IELTS are not a neutral statistical sampling; therefore they
do not provide a complete picture of national ELP levels. For example the test takers may
have had access to the Internet and the resources to fund their testing and test preparation. For
example the TOEFL data report states:
“This is not a conclusive study of English learning levels, as there isn’t perfect statistical validity to
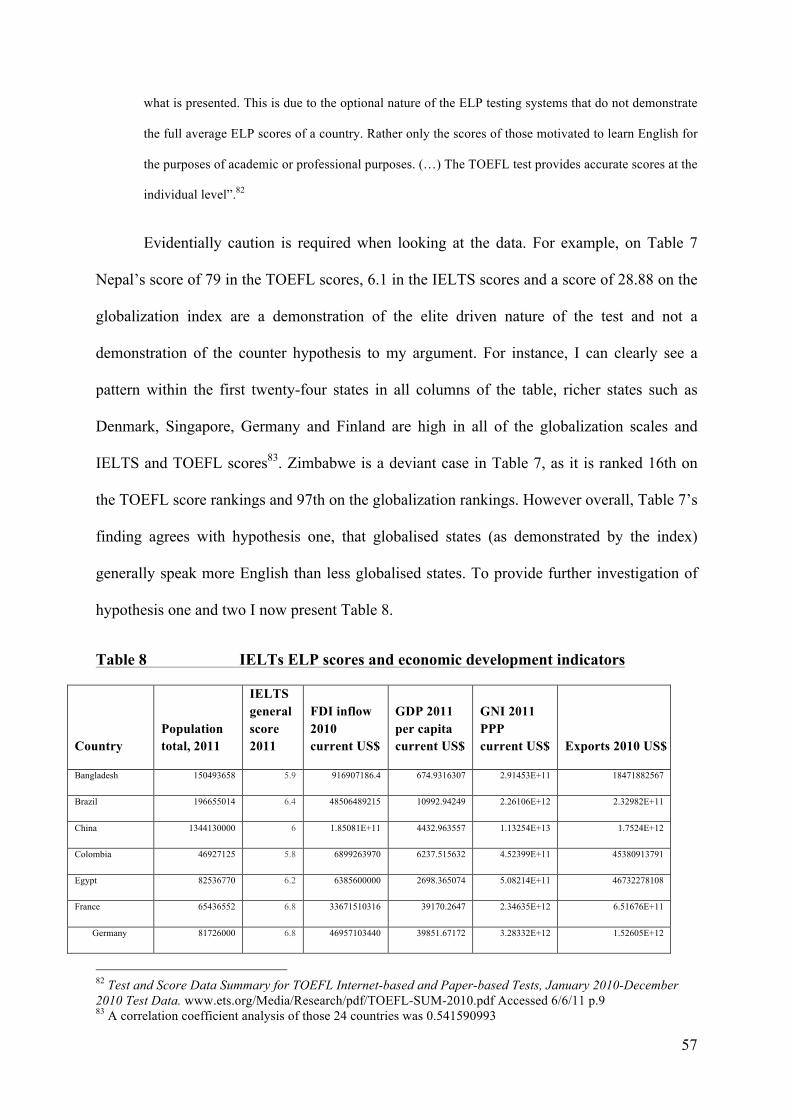
57
what is presented. This is due to the optional nature of the ELP testing systems that do not demonstrate
the full average ELP scores of a country. Rather only the scores of those motivated to learn English for
the purposes of academic or professional purposes. (…) The TOEFL test provides accurate scores at the
individual level”.82
Evidentially caution is required when looking at the data. For example, on Table 7
Nepal’s score of 79 in the TOEFL scores, 6.1 in the IELTS scores and a score of 28.88 on the
globalization index are a demonstration of the elite driven nature of the test and not a
demonstration of the counter hypothesis to my argument. For instance, I can clearly see a
pattern within the first twenty-four states in all columns of the table, richer states such as
Denmark, Singapore, Germany and Finland are high in all of the globalization scales and
IELTS and TOEFL scores83. Zimbabwe is a deviant case in Table 7, as it is ranked 16th on
the TOEFL score rankings and 97th on the globalization rankings. However overall, Table 7’s
finding agrees with hypothesis one, that globalised states (as demonstrated by the index)
generally speak more English than less globalised states. To provide further investigation of
hypothesis one and two I now present Table 8.
Table 8 IELTs ELP scores and economic development indicators
Country Population total, 2011
IELTS general score 2011
FDI inflow 2010 current US$
GDP 2011 per capita current US$
GNI 2011 PPP current US$ Exports 2010 US$
Bangladesh 150493658 5.9 916907186.4 674.9316307 2.91453E+11 18471882567
Brazil 196655014 6.4 48506489215 10992.94249 2.26106E+12 2.32982E+11
China 1344130000 6 1.85081E+11 4432.963557 1.13254E+13 1.7524E+12
Colombia 46927125 5.8 6899263970 6237.515632 4.52399E+11 45380913791
Egypt 82536770 6.2 6385600000 2698.365074 5.08214E+11 46732278108
France 65436552 6.8 33671510316 39170.2647 2.34635E+12 6.51676E+11
Germany 81726000 6.8 46957103440 39851.67172 3.28332E+12 1.52605E+12
82 Test and Score Data Summary for TOEFL Internet-based and Paper-based Tests, January 2010-December 2010 Test Data. www.ets.org/Media/Research/pdf/TOEFL-SUM-2010.pdf Accessed 6/6/11 p.9 83 A correlation coefficient analysis of those 24 countries was 0.541590993
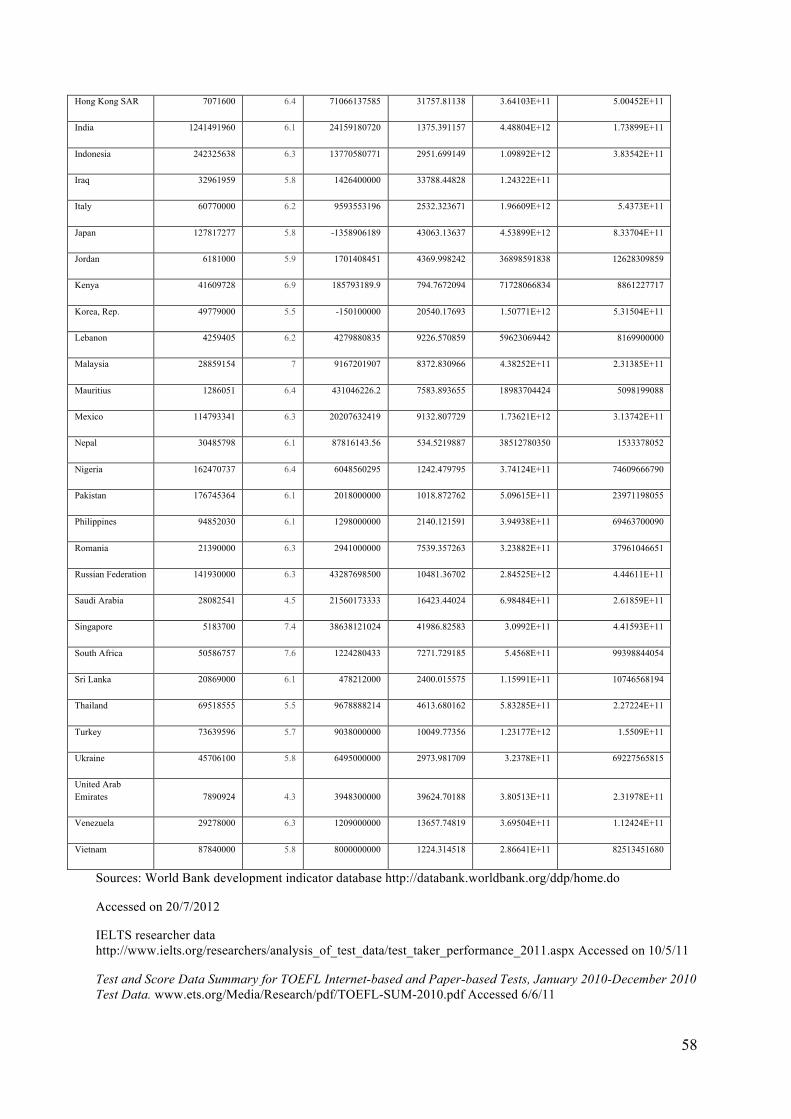
58
Hong Kong SAR 7071600 6.4 71066137585 31757.81138 3.64103E+11 5.00452E+11
India 1241491960 6.1 24159180720 1375.391157 4.48804E+12 1.73899E+11
Indonesia 242325638 6.3 13770580771 2951.699149 1.09892E+12 3.83542E+11
Iraq 32961959 5.8 1426400000 33788.44828 1.24322E+11
Italy 60770000 6.2 9593553196 2532.323671 1.96609E+12 5.4373E+11
Japan 127817277 5.8 -1358906189 43063.13637 4.53899E+12 8.33704E+11
Jordan 6181000 5.9 1701408451 4369.998242 36898591838 12628309859
Kenya 41609728 6.9 185793189.9 794.7672094 71728066834 8861227717
Korea, Rep. 49779000 5.5 -150100000 20540.17693 1.50771E+12 5.31504E+11
Lebanon 4259405 6.2 4279880835 9226.570859 59623069442 8169900000
Malaysia 28859154 7 9167201907 8372.830966 4.38252E+11 2.31385E+11
Mauritius 1286051 6.4 431046226.2 7583.893655 18983704424 5098199088
Mexico 114793341 6.3 20207632419 9132.807729 1.73621E+12 3.13742E+11
Nepal 30485798 6.1 87816143.56 534.5219887 38512780350 1533378052
Nigeria 162470737 6.4 6048560295 1242.479795 3.74124E+11 74609666790
Pakistan 176745364 6.1 2018000000 1018.872762 5.09615E+11 23971198055
Philippines 94852030 6.1 1298000000 2140.121591 3.94938E+11 69463700090
Romania 21390000 6.3 2941000000 7539.357263 3.23882E+11 37961046651
Russian Federation 141930000 6.3 43287698500 10481.36702 2.84525E+12 4.44611E+11
Saudi Arabia 28082541 4.5 21560173333 16423.44024 6.98484E+11 2.61859E+11
Singapore 5183700 7.4 38638121024 41986.82583 3.0992E+11 4.41593E+11
South Africa 50586757 7.6 1224280433 7271.729185 5.4568E+11 99398844054
Sri Lanka 20869000 6.1 478212000 2400.015575 1.15991E+11 10746568194
Thailand 69518555 5.5 9678888214 4613.680162 5.83285E+11 2.27224E+11
Turkey 73639596 5.7 9038000000 10049.77356 1.23177E+12 1.5509E+11
Ukraine 45706100 5.8 6495000000 2973.981709 3.2378E+11 69227565815
United Arab Emirates 7890924 4.3 3948300000 39624.70188 3.80513E+11 2.31978E+11
Venezuela 29278000 6.3 1209000000 13657.74819 3.69504E+11 1.12424E+11
Vietnam 87840000 5.8 8000000000 1224.314518 2.86641E+11 82513451680
Sources: World Bank development indicator database http://databank.worldbank.org/ddp/home.do
Accessed on 20/7/2012
IELTS researcher data http://www.ielts.org/researchers/analysis_of_test_data/test_taker_performance_2011.aspx Accessed on 10/5/11
Test and Score Data Summary for TOEFL Internet-based and Paper-based Tests, January 2010-December 2010 Test Data. www.ets.org/Media/Research/pdf/TOEFL-SUM-2010.pdf Accessed 6/6/11
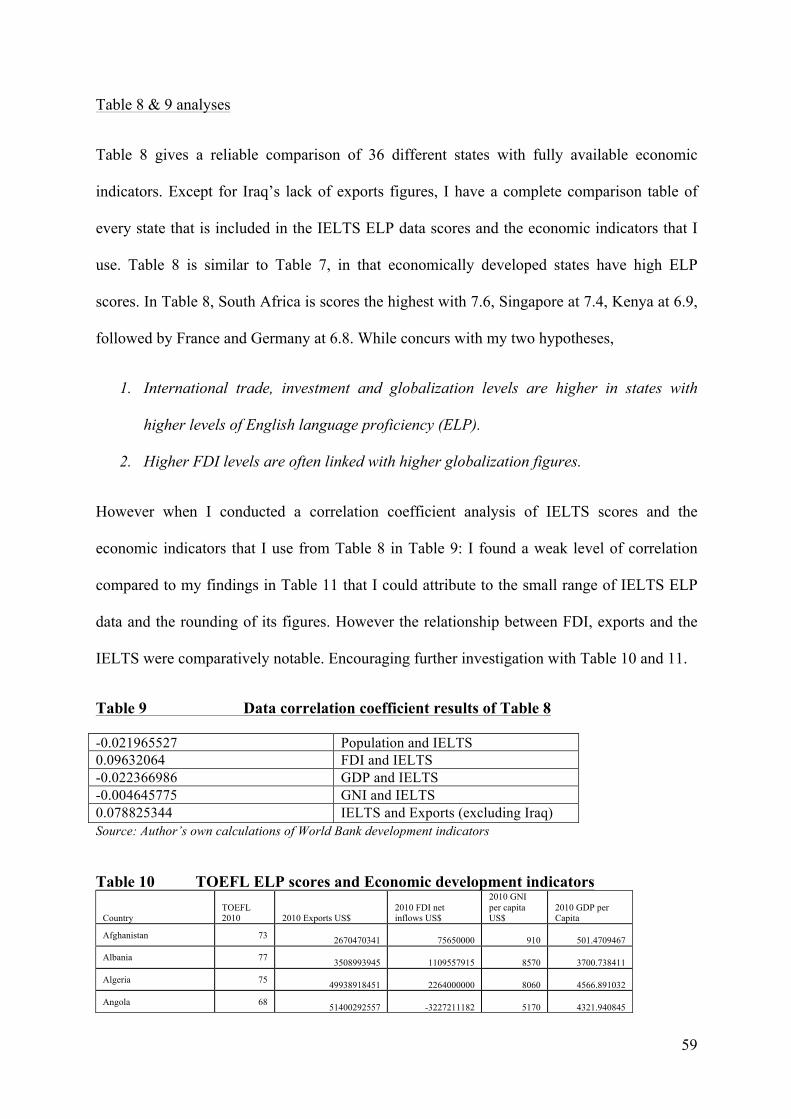
59
Table 8 & 9 analyses
Table 8 gives a reliable comparison of 36 different states with fully available economic
indicators. Except for Iraq’s lack of exports figures, I have a complete comparison table of
every state that is included in the IELTS ELP data scores and the economic indicators that I
use. Table 8 is similar to Table 7, in that economically developed states have high ELP
scores. In Table 8, South Africa is scores the highest with 7.6, Singapore at 7.4, Kenya at 6.9,
followed by France and Germany at 6.8. While concurs with my two hypotheses,
1. International trade, investment and globalization levels are higher in states with
higher levels of English language proficiency (ELP).
2. Higher FDI levels are often linked with higher globalization figures.
However when I conducted a correlation coefficient analysis of IELTS scores and the
economic indicators that I use from Table 8 in Table 9: I found a weak level of correlation
compared to my findings in Table 11 that I could attribute to the small range of IELTS ELP
data and the rounding of its figures. However the relationship between FDI, exports and the
IELTS were comparatively notable. Encouraging further investigation with Table 10 and 11.
Table 9 Data correlation coefficient results of Table 8
Source: Author’s own calculations of World Bank development indicators Table 10 TOEFL ELP scores and Economic development indicators
Country TOEFL 2010 2010 Exports US$
2010 FDI net inflows US$
2010 GNI per capita US$
2010 GDP per Capita
Afghanistan 73 2670470341 75650000 910 501.4709467
Albania 77 3508993945 1109557915 8570 3700.738411
Algeria 75 49938918451 2264000000 8060 4566.891032
Angola 68 51400292557 -3227211182 5170 4321.940845
-0.021965527 Population and IELTS 0.09632064 FDI and IELTS -0.022366986 GDP and IELTS -0.004645775 GNI and IELTS 0.078825344 IELTS and Exports (excluding Iraq)
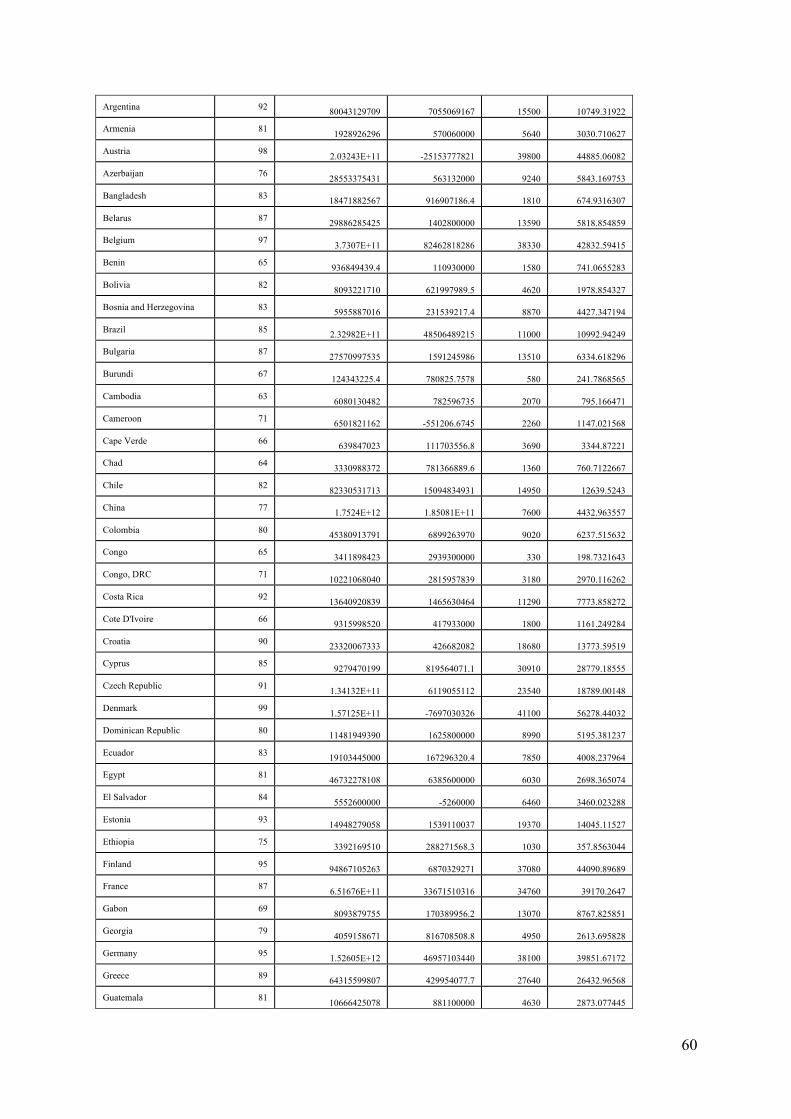
60
Argentina 92 80043129709 7055069167 15500 10749.31922
Armenia 81 1928926296 570060000 5640 3030.710627
Austria 98 2.03243E+11 -25153777821 39800 44885.06082
Azerbaijan 76 28553375431 563132000 9240 5843.169753
Bangladesh 83 18471882567 916907186.4 1810 674.9316307
Belarus 87 29886285425 1402800000 13590 5818.854859
Belgium 97 3.7307E+11 82462818286 38330 42832.59415
Benin 65 936849439.4 110930000 1580 741.0655283
Bolivia 82 8093221710 621997989.5 4620 1978.854327
Bosnia and Herzegovina 83 5955887016 231539217.4 8870 4427.347194
Brazil 85 2.32982E+11 48506489215 11000 10992.94249
Bulgaria 87 27570997535 1591245986 13510 6334.618296
Burundi 67 124343225.4 780825.7578 580 241.7868565
Cambodia 63 6080130482 782596735 2070 795.166471
Cameroon 71 6501821162 -551206.6745 2260 1147.021568
Cape Verde 66 639847023 111703556.8 3690 3344.87221
Chad 64 3330988372 781366889.6 1360 760.7122667
Chile 82 82330531713 15094834931 14950 12639.5243
China 77 1.7524E+12 1.85081E+11 7600 4432.963557
Colombia 80 45380913791 6899263970 9020 6237.515632
Congo 65 3411898423 2939300000 330 198.7321643
Congo, DRC 71 10221068040 2815957839 3180 2970.116262
Costa Rica 92 13640920839 1465630464 11290 7773.858272
Cote D'Ivoire 66 9315998520 417933000 1800 1161.249284
Croatia 90 23320067333 426682082 18680 13773.59519
Cyprus 85 9279470199 819564071.1 30910 28779.18555
Czech Republic 91 1.34132E+11 6119055112 23540 18789.00148
Denmark 99 1.57125E+11 -7697030326 41100 56278.44032
Dominican Republic 80 11481949390 1625800000 8990 5195.381237
Ecuador 83 19103445000 167296320.4 7850 4008.237964
Egypt 81 46732278108 6385600000 6030 2698.365074
El Salvador 84 5552600000 -5260000 6460 3460.023288
Estonia 93 14948279058 1539110037 19370 14045.11527
Ethiopia 75 3392169510 288271568.3 1030 357.8563044
Finland 95 94867105263 6870329271 37080 44090.89689
France 87 6.51676E+11 33671510316 34760 39170.2647
Gabon 69 8093879755 170389956.2 13070 8767.825851
Georgia 79 4059158671 816708508.8 4950 2613.695828
Germany 95 1.52605E+12 46957103440 38100 39851.67172
Greece 89 64315599807 429954077.7 27640 26432.96568
Guatemala 81 10666425078 881100000 4630 2873.077445
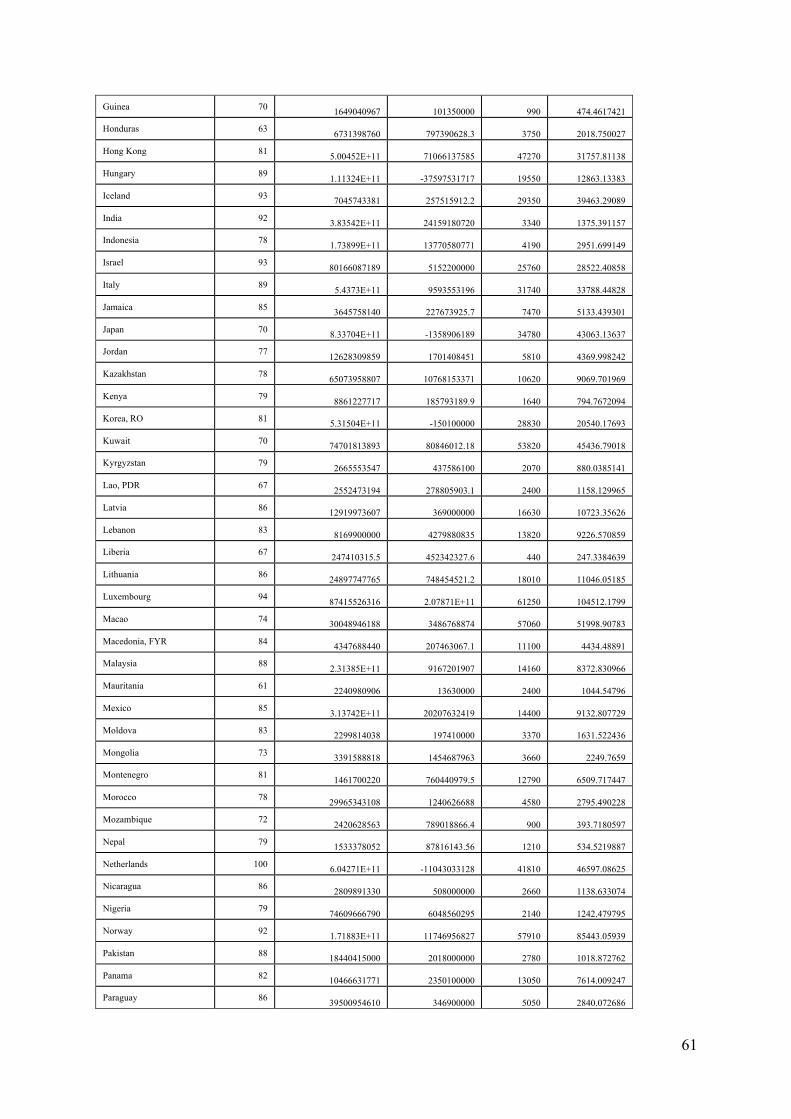
61
Guinea 70 1649040967 101350000 990 474.4617421
Honduras 63 6731398760 797390628.3 3750 2018.750027
Hong Kong 81 5.00452E+11 71066137585 47270 31757.81138
Hungary 89 1.11324E+11 -37597531717 19550 12863.13383
Iceland 93 7045743381 257515912.2 29350 39463.29089
India 92 3.83542E+11 24159180720 3340 1375.391157
Indonesia 78 1.73899E+11 13770580771 4190 2951.699149
Israel 93 80166087189 5152200000 25760 28522.40858
Italy 89 5.4373E+11 9593553196 31740 33788.44828
Jamaica 85 3645758140 227673925.7 7470 5133.439301
Japan 70 8.33704E+11 -1358906189 34780 43063.13637
Jordan 77 12628309859 1701408451 5810 4369.998242
Kazakhstan 78 65073958807 10768153371 10620 9069.701969
Kenya 79 8861227717 185793189.9 1640 794.7672094
Korea, RO 81 5.31504E+11 -150100000 28830 20540.17693
Kuwait 70 74701813893 80846012.18 53820 45436.79018
Kyrgyzstan 79 2665553547 437586100 2070 880.0385141
Lao, PDR 67 2552473194 278805903.1 2400 1158.129965
Latvia 86 12919973607 369000000 16630 10723.35626
Lebanon 83 8169900000 4279880835 13820 9226.570859
Liberia 67 247410315.5 452342327.6 440 247.3384639
Lithuania 86 24897747765 748454521.2 18010 11046.05185
Luxembourg 94 87415526316 2.07871E+11 61250 104512.1799
Macao 74 30048946188 3486768874 57060 51998.90783
Macedonia, FYR 84 4347688440 207463067.1 11100 4434.48891
Malaysia 88 2.31385E+11 9167201907 14160 8372.830966
Mauritania 61 2240980906 13630000 2400 1044.54796
Mexico 85 3.13742E+11 20207632419 14400 9132.807729
Moldova 83 2299814038 197410000 3370 1631.522436
Mongolia 73 3391588818 1454687963 3660 2249.7659
Montenegro 81 1461700220 760440979.5 12790 6509.717447
Morocco 78 29965343108 1240626688 4580 2795.490228
Mozambique 72 2420628563 789018866.4 900 393.7180597
Nepal 79 1533378052 87816143.56 1210 534.5219887
Netherlands 100 6.04271E+11 -11043033128 41810 46597.08625
Nicaragua 86 2809891330 508000000 2660 1138.633074
Nigeria 79 74609666790 6048560295 2140 1242.479795
Norway 92 1.71883E+11 11746956827 57910 85443.05939
Pakistan 88 18440415000 2018000000 2780 1018.872762
Panama 82 10466631771 2350100000 13050 7614.009247
Paraguay 86 39500954610 346900000 5050 2840.072686
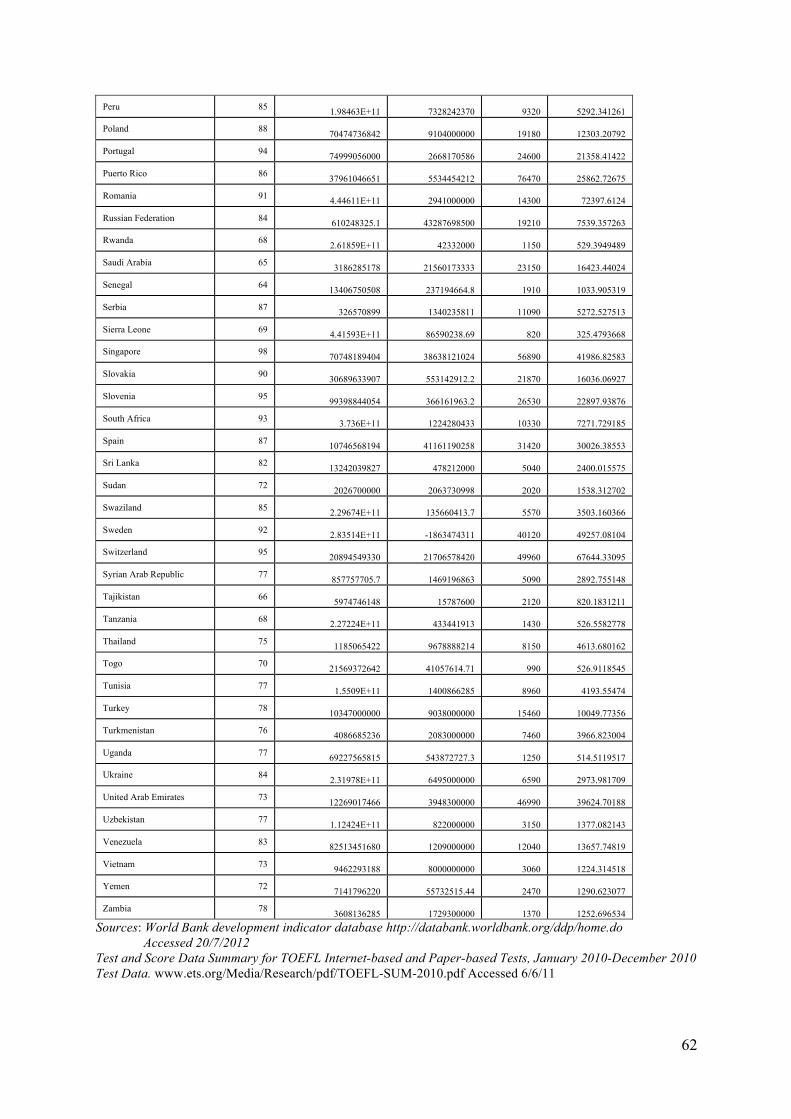
62
Peru 85 1.98463E+11 7328242370 9320 5292.341261
Poland 88 70474736842 9104000000 19180 12303.20792
Portugal 94 74999056000 2668170586 24600 21358.41422
Puerto Rico 86 37961046651 5534454212 76470 25862.72675
Romania 91 4.44611E+11 2941000000 14300 72397.6124
Russian Federation 84 610248325.1 43287698500 19210 7539.357263
Rwanda 68 2.61859E+11 42332000 1150 529.3949489
Saudi Arabia 65 3186285178 21560173333 23150 16423.44024
Senegal 64 13406750508 237194664.8 1910 1033.905319
Serbia 87 326570899 1340235811 11090 5272.527513
Sierra Leone 69 4.41593E+11 86590238.69 820 325.4793668
Singapore 98 70748189404 38638121024 56890 41986.82583
Slovakia 90 30689633907 553142912.2 21870 16036.06927
Slovenia 95 99398844054 366161963.2 26530 22897.93876
South Africa 93 3.736E+11 1224280433 10330 7271.729185
Spain 87 10746568194 41161190258 31420 30026.38553
Sri Lanka 82 13242039827 478212000 5040 2400.015575
Sudan 72 2026700000 2063730998 2020 1538.312702
Swaziland 85 2.29674E+11 135660413.7 5570 3503.160366
Sweden 92 2.83514E+11 -1863474311 40120 49257.08104
Switzerland 95 20894549330 21706578420 49960 67644.33095
Syrian Arab Republic 77 857757705.7 1469196863 5090 2892.755148
Tajikistan 66 5974746148 15787600 2120 820.1831211
Tanzania 68 2.27224E+11 433441913 1430 526.5582778
Thailand 75 1185065422 9678888214 8150 4613.680162
Togo 70 21569372642 41057614.71 990 526.9118545
Tunisia 77 1.5509E+11 1400866285 8960 4193.55474
Turkey 78 10347000000 9038000000 15460 10049.77356
Turkmenistan 76 4086685236 2083000000 7460 3966.823004
Uganda 77 69227565815 543872727.3 1250 514.5119517
Ukraine 84 2.31978E+11 6495000000 6590 2973.981709
United Arab Emirates 73 12269017466 3948300000 46990 39624.70188
Uzbekistan 77 1.12424E+11 822000000 3150 1377.082143
Venezuela 83 82513451680 1209000000 12040 13657.74819
Vietnam 73 9462293188 8000000000 3060 1224.314518
Yemen 72 7141796220 55732515.44 2470 1290.623077
Zambia 78 3608136285 1729300000 1370 1252.696534 Sources: World Bank development indicator database http://databank.worldbank.org/ddp/home.do Accessed 20/7/2012 Test and Score Data Summary for TOEFL Internet-based and Paper-based Tests, January 2010-December 2010 Test Data. www.ets.org/Media/Research/pdf/TOEFL-SUM-2010.pdf Accessed 6/6/11
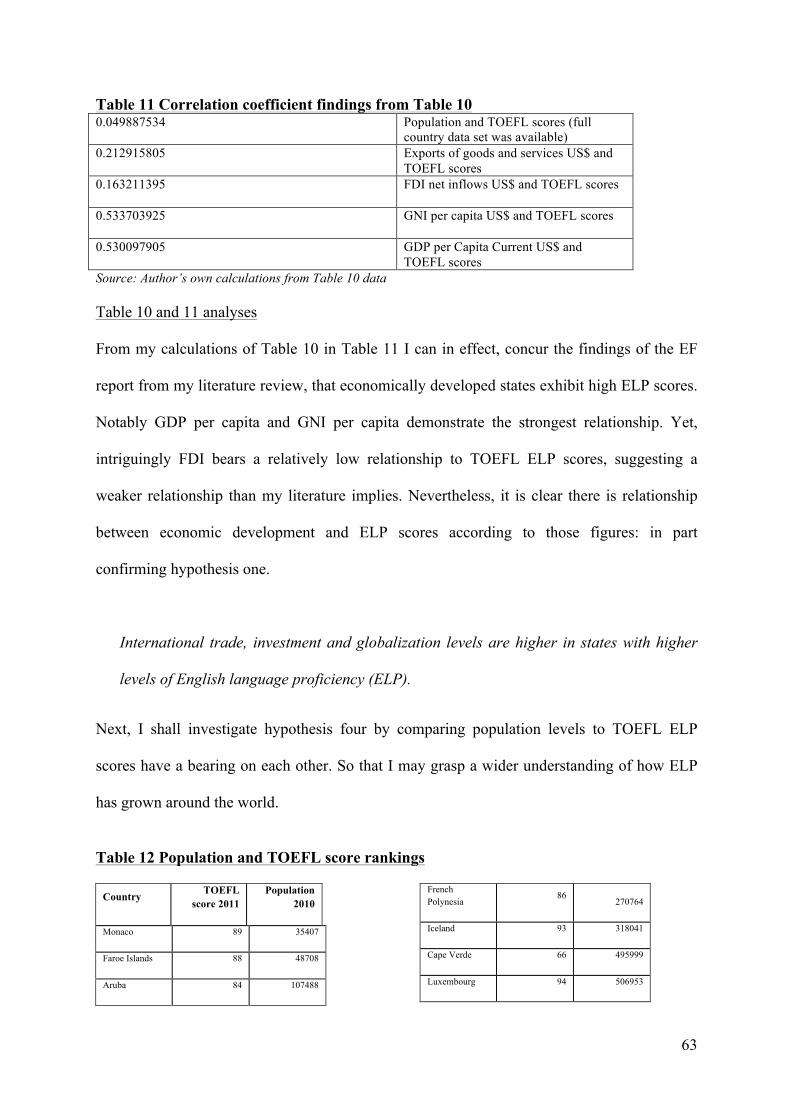
63
Table 11 Correlation coefficient findings from Table 10 0.049887534
Population and TOEFL scores (full country data set was available)
0.212915805
Exports of goods and services US$ and TOEFL scores
0.163211395
FDI net inflows US$ and TOEFL scores
0.533703925
GNI per capita US$ and TOEFL scores
0.530097905
GDP per Capita Current US$ and TOEFL scores
Source: Author’s own calculations from Table 10 data Table 10 and 11 analyses
From my calculations of Table 10 in Table 11 I can in effect, concur the findings of the EF
report from my literature review, that economically developed states exhibit high ELP scores.
Notably GDP per capita and GNI per capita demonstrate the strongest relationship. Yet,
intriguingly FDI bears a relatively low relationship to TOEFL ELP scores, suggesting a
weaker relationship than my literature implies. Nevertheless, it is clear there is relationship
between economic development and ELP scores according to those figures: in part
confirming hypothesis one.
International trade, investment and globalization levels are higher in states with higher
levels of English language proficiency (ELP).
Next, I shall investigate hypothesis four by comparing population levels to TOEFL ELP
scores have a bearing on each other. So that I may grasp a wider understanding of how ELP
has grown around the world.
Table 12 Population and TOEFL score rankings
Country TOEFL score 2011
Population 2010
Monaco 89 35407
Faroe Islands 88 48708
Aruba 84 107488
French Polynesia
86 270764
Iceland 93 318041
Cape Verde 66 495999
Luxembourg 94 506953
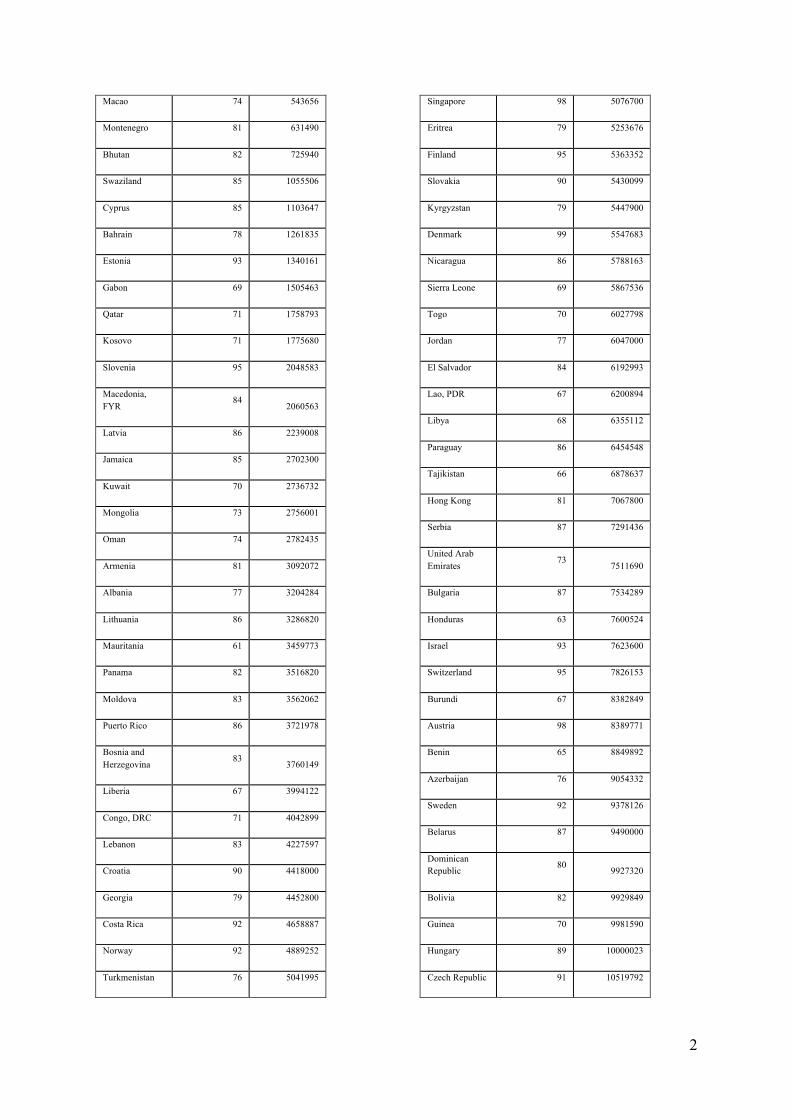
2
Macao 74 543656
Montenegro 81 631490
Bhutan 82 725940
Swaziland 85 1055506
Cyprus 85 1103647
Bahrain 78 1261835
Estonia 93 1340161
Gabon 69 1505463
Qatar 71 1758793
Kosovo 71 1775680
Slovenia 95 2048583
Macedonia, FYR
84 2060563
Latvia 86 2239008
Jamaica 85 2702300
Kuwait 70 2736732
Mongolia 73 2756001
Oman 74 2782435
Armenia 81 3092072
Albania 77 3204284
Lithuania 86 3286820
Mauritania 61 3459773
Panama 82 3516820
Moldova 83 3562062
Puerto Rico 86 3721978
Bosnia and Herzegovina 83 3760149
Liberia 67 3994122
Congo, DRC 71 4042899
Lebanon 83 4227597
Croatia 90 4418000
Georgia 79 4452800
Costa Rica 92 4658887
Norway 92 4889252
Turkmenistan 76 5041995
Singapore 98 5076700
Eritrea 79 5253676
Finland 95 5363352
Slovakia 90 5430099
Kyrgyzstan 79 5447900
Denmark 99 5547683
Nicaragua 86 5788163
Sierra Leone 69 5867536
Togo 70 6027798
Jordan 77 6047000
El Salvador 84 6192993
Lao, PDR 67 6200894
Libya 68 6355112
Paraguay 86 6454548
Tajikistan 66 6878637
Hong Kong 81 7067800
Serbia 87 7291436
United Arab Emirates 73 7511690
Bulgaria 87 7534289
Honduras 63 7600524
Israel 93 7623600
Switzerland 95 7826153
Burundi 67 8382849
Austria 98 8389771
Benin 65 8849892
Azerbaijan 76 9054332
Sweden 92 9378126
Belarus 87 9490000
Dominican Republic 80 9927320
Bolivia 82 9929849
Guinea 70 9981590
Hungary 89 10000023
Czech Republic 91 10519792
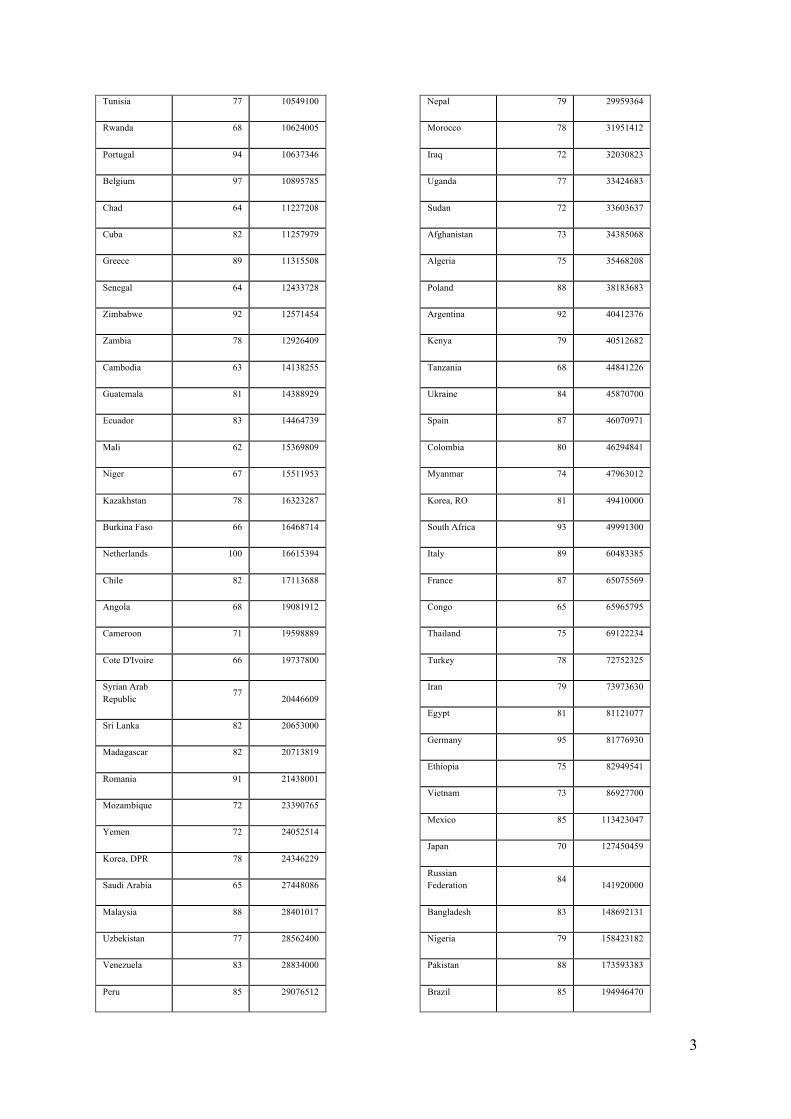
3
Tunisia 77 10549100
Rwanda 68 10624005
Portugal 94 10637346
Belgium 97 10895785
Chad 64 11227208
Cuba 82 11257979
Greece 89 11315508
Senegal 64 12433728
Zimbabwe 92 12571454
Zambia 78 12926409
Cambodia 63 14138255
Guatemala 81 14388929
Ecuador 83 14464739
Mali 62 15369809
Niger 67 15511953
Kazakhstan 78 16323287
Burkina Faso 66 16468714
Netherlands 100 16615394
Chile 82 17113688
Angola 68 19081912
Cameroon 71 19598889
Cote D'Ivoire 66 19737800
Syrian Arab Republic
77 20446609
Sri Lanka 82 20653000
Madagascar 82 20713819
Romania 91 21438001
Mozambique 72 23390765
Yemen 72 24052514
Korea, DPR 78 24346229
Saudi Arabia 65 27448086
Malaysia 88 28401017
Uzbekistan 77 28562400
Venezuela 83 28834000
Peru 85 29076512
Nepal 79 29959364
Morocco 78 31951412
Iraq 72 32030823
Uganda 77 33424683
Sudan 72 33603637
Afghanistan 73 34385068
Algeria 75 35468208
Poland 88 38183683
Argentina 92 40412376
Kenya 79 40512682
Tanzania 68 44841226
Ukraine 84 45870700
Spain 87 46070971
Colombia 80 46294841
Myanmar 74 47963012
Korea, RO 81 49410000
South Africa 93 49991300
Italy 89 60483385
France 87 65075569
Congo 65 65965795
Thailand 75 69122234
Turkey 78 72752325
Iran 79 73973630
Egypt 81 81121077
Germany 95 81776930
Ethiopia 75 82949541
Vietnam 73 86927700
Mexico 85 113423047
Japan 70 127450459
Russian Federation 84 141920000
Bangladesh 83 148692131
Nigeria 79 158423182
Pakistan 88 173593383
Brazil 85 194946470
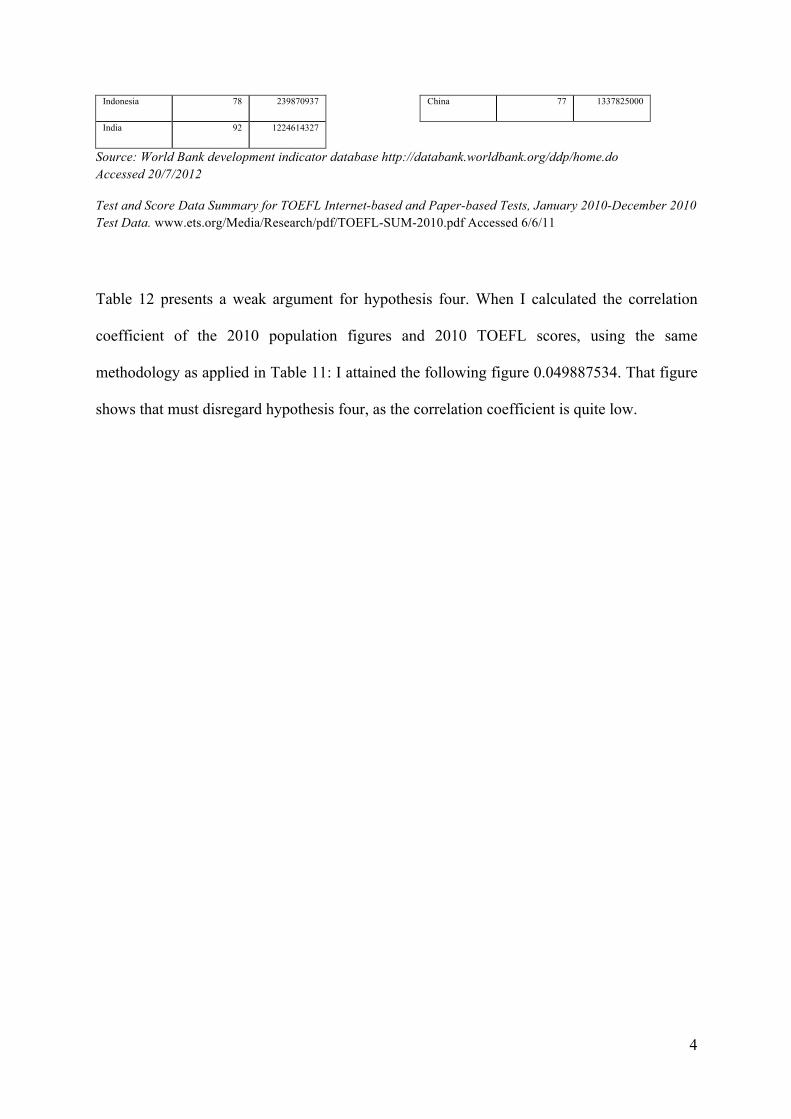
4
Indonesia 78 239870937
India 92 1224614327
China 77 1337825000
Source: World Bank development indicator database http://databank.worldbank.org/ddp/home.do Accessed 20/7/2012
Test and Score Data Summary for TOEFL Internet-based and Paper-based Tests, January 2010-December 2010 Test Data. www.ets.org/Media/Research/pdf/TOEFL-SUM-2010.pdf Accessed 6/6/11
Table 12 presents a weak argument for hypothesis four. When I calculated the correlation
coefficient of the 2010 population figures and 2010 TOEFL scores, using the same
methodology as applied in Table 11: I attained the following figure 0.049887534. That figure
shows that must disregard hypothesis four, as the correlation coefficient is quite low.
2
Conclusion
The low variance levels and rounding of averages in the ELP scoring systems don’t
allow for controlled analysis, yet they are the best available samplings of ELP scores
currently available. In contrast, the economic development indicators show wide degrees of
variance between different countries’ levels of economic development. Until a more
comprehensive selection of international ELP scores are available, this is best available
method of finding out how well do people in some countries speak English on average.
Despite the limitations of the data, they demonstrate that for some countries ELP on average
is more difficult to obtain.
Chapter three has provided some evidence to support my hypothesis one:
1. Foreign direct investment, international trade, and globalization levels are higher in
states with higher levels of English language proficiency (ELP).
The parallels between high globalization rankings and ELP scores on Table 7 suggest a
significant relationship between trading openness and the use of English. However not all
aspects of this hypothesis were supported by my research, for instance on Table 9 the
correlation coefficient analysis of IELTS ELP scores and my selection of economic
development indicators, showed a weak relationship. Which could be accounted for with the
low (1-9) range of IELTS scores compared to the extensive (1-100) range of the TOEFL
scores. Nevertheless Table 11 supports hypothesis one by demonstrating notable coefficient
relationships between GDP per capita and GNI per capita matching TOEFL ELP scores. In
effect supporting the findings of Selmier & Oh (2012) of trade being ‘cheaper’ with certain
languages. However Tables 11 and 9 did not provide overwhelming evidence to support the
FDI and ELP relationship in hypothesis one.

3
Chapter 4
4
Thesis conclusions
In this thesis I have questioned whether economic development has a relationship on
ELP. I asked:
“Do economically strong, globalized states often speak more English than less strong
ones?”
The primary focus of this thesis has been to ascertain if economically developed
countries often have high ELP levels, to the best of the international data available. I found
that there is a degree of linkage that supports that proposition. As I addressed that proposition
and question of this thesis, I recognised ELP as a skill that creates the space for economic
growth and development through lowered communication costs. Furthermore, I found that
globalisation plays a role in the growth of English. Aside from the statistics I have presented
in this thesis, I have given you an extensive impression of how and why ELP matters has such
a central relationship with economic development. In this thesis I have also argued that by
and large, the growth of English is a positive thing for economic development.
No substantial previous study has attempted to link proficiency levels of a global
language to globalization, population, ease of business rankings, FDI, GDP per capita, GNI
per capita and export levels. Previous literature on this area has demonstrated that there is a
significant relationship between languages and FDI (such as Selmier & Oh 2012). Though
none have attempted to draw a wide representation of the impact of degrees of ELP on
economic development. It is interesting to note that Selmier & Oh’s (2012) research found a
stronger relationship between FDI and major trade languages in general: whereas my own
research did not find a substantial link between of ELP and FDI.
5
Globalisation and economic development utilize numerous languages. Debate rages
over whether you could call English the global language or not. Yet the facts remain. English
is more influential and widespread than any other language, as my literature review has
demonstrated. One could argue that this thesis has merely examined the ELP scores of elite
sections of various countries and not the general population at large. To address my research
question I utilized all available ELP data and addressed numerous variables.
For example: the exposure of the population to English media, geographical and
linguistic distance between the non-English speaking country and an English speaking
country. I was able to draw a clear relationship between economic development and ELP
scores from my own research on Table 11 by demonstrating significant relationships between
GDP per capita and GNI per capita matching TOEFL ELP scores.
While some may still consider English a worthless endeavour or imperialist, the
popular perception exists that learning English is worth its salt. As if the average ELP scores
were completely meaningless statistically each ELP testing system would have little relation
to each other. However they do: when I calculated the correlation coefficient of the thirty-four
countries that match each other’s IELTS and TOEFL scores I obtained a score of
0.736502368 which indicates a strong relationship between them: which can mean that both
TOEFL and IELTS scoring systems illustrate national ELP levels not just individual scores.
While the variable of ELP may well perform different roles within economic
development, my research indicates the following: highly proficient non-native English
speaking countries are likely to be highly economically developed ones, that are globalised
and supportive of business.
6
Suggestions for future study
Further study on this subject would warrant an independent survey of ELP levels
within non-English speaking states. That could assess the average proficiency of a state with
greater statistical accuracy. It would calculate the mean scores of 1000 students of English
from controlled groups of professions, education and income in order to give a complete
demonstration of ELP scores. The averages of those figures would allow for a greater
accuracy in understanding the effects of English on globalization and international
development. However, since in all three ELP testing systems that I research, a slight
majority of the test takers do so for higher education entrance84. Therefore it is clear that these
scores I research cover a particular demographic already. Yet statistical accuracy could be
best provided through controlled demographic sampling. The ages at which different
countries begin learning English should be examined extensively with respect to the ELP
scores from the controlled ELP testing system that I propose.
The value of English
Despite the problems it may raise, I value the possibilities that English can grant us.
Why? Because it has become an economic necessity, a part of basic education like literacy
and arithmetic. As in a global economy, there is a global language. To have an open economy
is to accept the merits of the ‘open’ global language, English.
Globalization has arisen from many sources though above all, communication. The
debate around the relationship between languages and globalization has led us to wonder if
languages are intrinsically tied to the power of economies or states. It is a difficult question to
quantify. The ‘language variable’ plays different roles by being an essential part of
globalization for the reasons I have discussed and discovered.
84 Ibid (78.3% of test takers did the 2011 IELTS academic test)
7
Throughout the processes of development and change in the world today, English is
arguably a major factor. My objective has been to point out the effects and dominance of
English in economic development and how both globalization and economic development are
affected by the ease of exchange and communication. The existence of a global unity through
language I argue is a good thing, not without its setbacks, but a means of making
globalization occur with a seductive promise, a level playing field for the world when all
speak the same tongue.
In the words of Jay Walker:
“English has become the international language of problem solving, not because America is pushing it
but because the world is pulling it. English mania is a turning point, like the harnessing of electricity in
our cities or the fall of the Berlin wall. English represents hope, for a better future, a future where the
world has a common language to solve its common problems”85.
85 Jay Walker on the world’s English Mania” http://www.ted.com/talks/jay_walker_on_the_world_s_english_mania.html Accessed on 20/07/2011
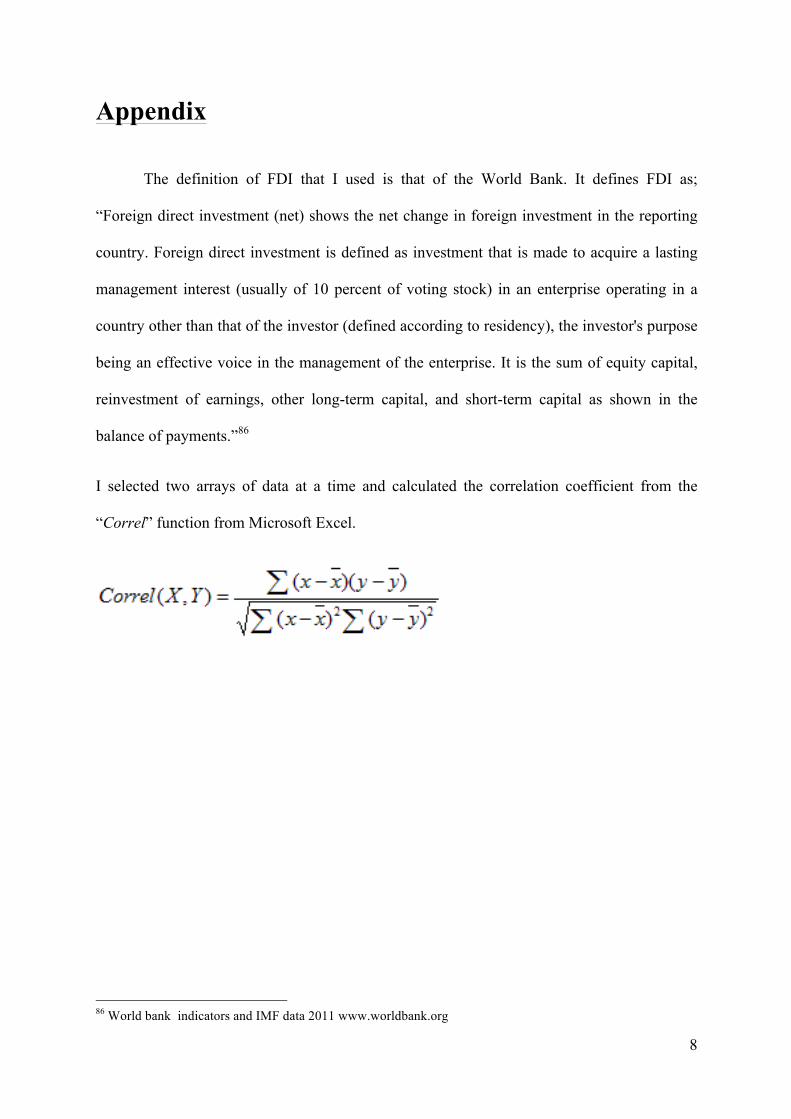
8
Appendix
The definition of FDI that I used is that of the World Bank. It defines FDI as;
“Foreign direct investment (net) shows the net change in foreign investment in the reporting
country. Foreign direct investment is defined as investment that is made to acquire a lasting
management interest (usually of 10 percent of voting stock) in an enterprise operating in a
country other than that of the investor (defined according to residency), the investor's purpose
being an effective voice in the management of the enterprise. It is the sum of equity capital,
reinvestment of earnings, other long-term capital, and short-term capital as shown in the
balance of payments.”86
I selected two arrays of data at a time and calculated the correlation coefficient from the
“Correl” function from Microsoft Excel.
86 World bank indicators and IMF data 2011 www.worldbank.org
9
Bibliography Frequently asked Questions, The English language. http://www.britishcouncil.org/learning-
faq-the-english-language.htm Accessed 29/7/2012
Test and Score Data Summary for TOEFL Internet-based and Paper-based Tests, January 2010-December 2010 Test Data. www.ets.org/Media/Research/pdf/TOEFL-SUM-2010.pdf Accessed 6/6/11
IELTs press release 4/6/08 www.ielts.org accessed on 27/8/12
www.ielts.org/Docs/press_release_London_27_nov_2008.doc
IELTS test taker data accessed on 10/5/11
http://www.ielts.org/researchers/analysis_of_test_data/test_taker_performance_2011.aspx
Emerging vs developed economies, Power shift. Economist, The. 4th August 2011
English First, English Proficiency Index 2011 http://www.ef-
ireland.ie/sitecore/__/~/media/efcom/epi/pdf/EF-EPI-2011.pdf Accessed 3/6/11
"Mandarin's Great Leap Forward." Economist, The 18 Nov. 2010.
Adler, Paul S. Mar – Apr 2001’ Market, Hierarchy, and Trust: The Knowledge Economy and
the Future of Capitalism’. Organization Science. 12 (2): 215- 234
Block, David. Cameron, Deborah. Globalization and Language Teaching. Taylor & Francis
e-Library, 2001
Borensztein, E. De Gregorio, J. Lee, J-W. 1998 ‘How does foreign direct investment affect
economic growth?’ Journal of International Economics. 45. 115-135
Boyle, Joseph. 1997 ‘Imperialism and the English Language in Hong Kong’. Journal of
Multilingual and Multicultural Development. 18 (3): 169-181
10
Bruthiaux, Paul. Autumn, 2002 ‘Hold Your Courses: Language Education, Language Choice,
and Economic Development’. TESOL Quarterly, Language in Development 36 (3) :275-296
Coulmas, Florian. 1992 ‘Language and languages; Sociolinguistics; Economic aspects’.
Oxford UK. Blackwell
Crystal, David. 2003 ‘English as a Global Language’. 2nd ed. Cambridge, UK: Cambridge
UP
D’Ydewalle, G. Pavakanum, U. 1997 ‘Could enjoying a movie lead to language acquisition?’
In P. Winterhoff-Spurk & T. Van Der Voort (Eds.), New Horizons in Media Psychology,
Opladen, Germany: Westdeutscher Verlag GmbH, p. 145-155
Danan, Martine. 2004 ‘Captioning and Subtitling: Undervalued Language Learning
Strategies’. Translators’ Journal. 49 (1): 67-77
De Bot, K. J. Jagt. H. Janssen. E. Kessels. E. Schils 1986 ‘Foreign television and language
maintenance’. Second Language Research 2-1: 72-82
Dollar, D. 1992 ‘Outward-orientated developing economies really do grow more rapidly:
evidence from 95 LDCs, 1976-85’, Economic Development and Cultural Change. (40): 523-
44
Dreher, Axel; Noel Gaston and Pim Martens, 2008, ‘Measuring Globalisation – Gauging its Consequences’, New York: Singer (updated also at http://globalization.kof.ethz.ch/ ) Accessed 6/7/11
Dreher, Axel. 2006 ‘Does globalization affect growth? Evidence from a new index of
globalization’. Applied Economics. 38. 1091-1110
Dyer, Gwynne. “The worldwide triumph of English”. 23/05/2012 The Japan Times Online
Economist, The. Democracy V China. What China challenges. July 11 2011
11
Fishman, Joshua A. Winter 1998-9 ‘The New Linguistic order’. Foreign Policy, 113: 26-32 +
34- 40
Gartzke, Erik. (January 2007) ‘The Capitalist Peace’. American Journal of Political Science.
Ginsburgh, Victor. Ortuno-Ortín, Ignacio. Weber, Shlomo. ‘Learning Foreign Languages.
Theorectical and empirical implications of the Selten and Pool model’. Center for Economic
Policy Research. Discussion paper No. 4942 March 2005
Graddol, David. 1997 ‘The Future of English?: a Guide to Forecasting the Popularity of
English in the 21st Century’. London: British Council,
Guillén, Mauro F. 2001 ‘Is Globalization Civilizing, Destructive or Feeble? A Critique of
Five Key Debates in the Social Science Literature’. Annual Sociology Review. 27: 235-260
House, Juliane. 2003 ‘English as a lingua franca: A threat to multilingualism?’ Journal of
Sociolinguistics 7 (4):556-578
Jay Walker on the world’s English Mania”
http://www.ted.com/talks/jay_walker_on_the_world_s_english_mania.html Accessed on
20/07/2011
MacNamara, John. 1971’The Irish Language and Nationalism’. The Crane Bag. 1(2): 40-44
Maurais, Jacquest. Morris, Micheal A. Languages in a Globalising World. Cambridge
University Press 2004
Mejer, Lene. Boateng, Sadiq Kwesi. Turchetti, Paolo. Eurostat: Population and Social
Conditions 49/2010 http://epp.eurostat.ec.europa.eu/cache/ITY_OFFPUB/KS-SF-10-
049/EN/KS-SF-10-049-EN.PDF Accessed 10/7/11
Nederveen Pieterse, Jan, Globalization and Culture: global mélange (Oxford: Rowman &
Littlefield 2004)
12
Nunan, David. 2003 "The Impact of English as a Global Language on Educational Policies
and Practices in the Asia-Pacific Region." TESOL Quarterly 37 (4): 589-613
Pennycook, Alastair. 1994 ‘The Cultural Politics of English as an International Language’.
London: Longman.
Phillipson, R. 1992 Linguistic Imperialism. Oxford: Oxford University Press.
Phillipson, Robert. 2007 ‘Linguistic imperialism: a conspiracy, or a conspiracy of silence?’
Language Policy 6: 377-383
Phillipson, Robert. Jul, 2001 ‘English for Globalisation or for the world’s people?’
International Review of Education. 47: ¾ Globalisation Language and Education p.185-200
Quirk, R. Widdowson, H.G. 1985 ‘English in the World’. Cambridge: Cambridge University
Press.
R.L.G. Who Speaks English? Economist, The. 5th April 2011
Selmier, W.T. and Oh, C.H. 2012 ‘The Power of Major Trade Languages in Trade and
Foreign Direct Investment, Review of International Political Economy.’ Review of
International Political Economy, iFirst 1-29
Sen, Amartya. ‘Development as Freedom’. 1999 Oxford University Press
Smith, V. 1998. ‘The two faces of Adam Smith’. Southern Economic Journal 65(1): 1-19.
Spence, Micheal. July/August 2011 ‘The Impact of Globalization on income and
employment’. Foreign Affairs.90 (4): 28-41
Tracey, Micheal. 1985 “The Poisoned Chalice? International Television and the Idea of
Dominance”. Daedalus. 114 (4): 17-5
13
Weber, George. January 1999 ‘The World’s 10 most Influential Languages’. AATF National
Bulletin. 24 (3):22-26
Woodward, Margaret. Inglehart, Ronald F. October 1967 ‘Language Conflicts and Political
Community’. Comparative Studies in Society and History. 10(1): 27-45