Embed Size (px)
Citation preview
219Bulletin of the American Meteorological Society
1. Background
Significant changes in precipitation, evaporation,and snow cover extent have occurred over the conter-minous United States during the past 50 years(Groisman and Easterling 1994; Karl and Knight 1998;Kunkel et al. 1999a,b; Peterson et al. 1995; Brownand Braaten 1998; Changnon 1998; Frei et al. 1999;Easterling et al. 2000; Groisman et al. 1994, 1999a,c;Cayan et al. 2001). Precipitation has increased, theprobability of a day with heavy precipitation has in-creased, spring snow cover has retreated, and panevaporation has decreased.1 Section 2 describes ter-
minology and definitions of heavy and very heavy pre-cipitation and high streamflow used throughout thispaper. Sections 3 and 4 of this paper outline thechanges in precipitation and snow cover over theUnited states. Could these changes be large enough toaffect the surface component of the hydrological cycle,streamflow? Apparently so, as the first assessmentsof the streamflow changes over the United States(Lettenmaier et al. 1994; Lins and Michaels 1994)identified significant trends in the time series of natu-ral (i.e., undisturbed by human activity) streamflowover the United States. Most of these trends were posi-tive indicating an increase in mean annual streamflow,but analyses were not attempted to determine how theincrease was distributed over various streamflow rates.Recently, however, Lins and Slack (1999) analyzed anetwork of streamflow stations and found that mostof the statistically significant positive trends at indi-
Heavy Precipitation and HighStreamflow in the Contiguous
United States: Trends in theTwentieth Century
Pavel Ya. Groisman,* Richard W. Knight,+ and Thomas R. Karl+
ABSTRACT
Changes in several components of the hydrological cycle over the contiguous United States have been docu-mented during the twentieth century: an increase of precipitation, especially heavy and very heavy precipitation,and a significant retreat in spring snow cover extent over western regions during the last few decades.
These changes have affected streamflow, including the probability of high flow.In the eastern half of the United States a significant relationship is found between the frequency of heavy pre-
cipitation and high streamflow events both annually and during the months of maximum streamflow. Two factorscontributed to finding such a relation: 1) the relatively small contribution of snowmelt to heavy runoff in the easternUnited States (compared to the west), and 2) the presence of a sufficiently dense network of streamflow and precipi-tation gauges available for analysis. An increase of spring heavy precipitation events over the eastern United Statesindicates with high probability that during the twentieth century an increase of high streamflow conditions has alsooccurred. In the West, a statistically significant reduction of snow cover extent has complicated the relation betweenheavy precipitation and streamflow. Increases in peak stream flow have not been observed here, despite increases inheavy precipitation events, and less extensive snow cover is the likely cause.
*UCAR Project Scientist, National Climatic Data Center,Asheville, North Carolina.+National Climatic Data Center, Asheville, North Carolina.Corresponding author address: Pavel Ya. Groisman, UCARProject Scientist, National Climatic Data Center, 151 PattonAve., Asheville, NC 28801.E-mail: [email protected] final form 28 July 2000.2001 American Meteorological Society
1This decrease in pan evaporation cannot be translated into adecrease of actual evaporation (Brutsaert and Parlange 1998;Golubev et al. 2000.
220 Vol. 82, No. 2, February 2001
vidual gauging stations have been confined to lowand moderate streamflows. This finding is extremelyimportant, because during periods of high streamflow,additional runoff increases the danger of river-relatedflooding, while during the period of low streamflow,additional water can be used for irrigation. The addi-tional flow may also enhance river navigation andhydropower production. Lins and Slack (1999) did notrelate changes in streamflow to precipitation, so it isimportant to understand how changes in precipitationrelate to streamflow. Also, since Lins and Slack (1999)assess individual stations for statistically significantchanges only, the question arises whether other typesof analyses would show more statistically significantresults if the noise in the time series was minimized.
If S is the trend at a specific site, i, i = 1, 2, . . . n,where n is the number of sites in a region, and S de-scribes a small portion of the total variance, σ 2, thena point by point search for statistically significant sig-nals requires a very long record at each site. But, ifthe number of spatial degrees of freedom, (ν, whereν < n) for a region like the United States is sufficientlyhigh and S is mostly of the same sign within a region,then we can expect that the area averaging will re-duce the variance of the variable in question to σ 2/ν,while preserving the sign and magnitude of S, mak-ing the signal detectable. For annual temperatures overthe conterminous United States, σ is a one-digit valueand the gain from area averaging for signal detectionmay be relatively small compared to daily heavy(high)–very heavy (very high) precipitation (streamflow), where ν is probably two orders of magnitudelarger and the effect of area averaging on reducingσ 2 can be substantial. On the other hand, if S variesstrongly across the region, then area averaging canbe counterproductive as S approaches zero. Given dif-ferences in the hydrologic cycle across the UnitedStates, high streamflow changes over the contiguousUnited States are likely to be heterogeneous so a singlecountrywide assessment may be inadequate. For ex-ample, although heavy precipitation is responsible forflooding over most of the country and is likely to bethe single source of high flow in the South and South-west, snowmelt is the most probable cause of highflow in the mountains and the northern regions. Thereare also regions where both of these factors can oper-ate and affect high streamflows.
The first concerns about the ongoing changes inthe hydrological cycle were assessed by Budyko andDrozdov (1976), Wigley et al. (1980), Manabe et al.(1981), and recently by Houghton et al. (1996).
Observational analyses have been made by Bradleyet al. (1987), Groisman and Legates (1995), Iwashimaand Yamamoto (1993), and Karl and Knight (1998).Model projections of a greenhouse-enriched atmo-sphere (Houghton et al. 1996) and the empirical evi-dence from the period of instrumental observations(Easterling et al. 2000) indicate an increasing prob-ability of heavy precipitation events for many extrat-ropical regions including the United States as globaltemperature increases. These projections and the ob-served increase of heavy precipitation raise the possi-bility of increased flooding, but snow cover changesinduced by increasing temperature tend to smooth theseasonal cycle of streamflow, especially in high lati-tudes and elevations, thus reducing the intensity ofspring snowmelt (Arnell et al. 1996; Georgievsky et al.1996). Other important factors leading to highstreamflow include hurricane landfalls along theAtlantic and Gulf coasts.2 Contemporary global cli-mate models do not yet reliably reproduce hurricaneactivity and, thus, their behavior in climate change sce-narios. Last, atmospheric circulation changes (e.g.,related to the North Atlantic oscillation and/or South-ern Oscillation) introduce specific large-scale patternson each climatic signal over the United States, includ-ing that on streamflow.
The objective of this study is to determine wheninformation about changes in mean and heavy precipi-tation, particularly during the months of highstreamflow, can be expected to be reflected in changesof high streamflow.3 We note that mean runoff hasbeen shown to be highly sensitive to changes in pre-cipitation on an annual basis (Karl and Riebsame1989), but it has never been analyzed for highstreamflow rates. To this end, we selected the bestpossible network of collocated rain and streamflowgauges having more than 60 years of synchronous dailyobservations. With this network we assess the rela-
2Hurricanes strike the Atlantic coast of the southeastern UnitedStates in the autumn months (usually characterized by lowstreamflow) and some of the most devastating floods of thetwentieth century have been related to hurricane landfall.3This study was also motivated by a recommendation of ananonymous reviewer to Pielke and Downton (1999) to analyzethe two datasets (streamflow and precipitation over the UnitedStates) in a similar manner to resolve the potential contradic-tions and dissimilarities. We specifically excluded the large riverbasins (with areas above 25 900 km2 or 10 000 mi2) from theconsideration. The assessment of interaction of large-scalemultiday heavy precipitation and high streamflow events oversuch basins is beyond the scope of this paper.

221Bulletin of the American Meteorological Society
FIG. 1. (a) Examples of heavy and very heavy precipitation climatologies based on the number of days with precipitation abovefixed thresholds. Values are mean annual number of days with 24-h daily precipitation above 50.8 mm (heavy) and 101.6 mm(very heavy).
(b) Examples of heavy and very heavy precipitation climatology based on frequency of precipitation events of various inten-sities. Values are maximum 24-h daily precipitation (mm) associated with 90th (heavy) and 99th (very heavy) percentiles ofJanuary and July precipitation in days with precipitation.
(c) Examples of heavy and very heavy precipitation climatologies based on average return period of the event. Values aremaximum 24-h daily precipitation (mm) associated with 1- (heavy) and 20-yr (very heavy) return periods.
222 Vol. 82, No. 2, February 2001
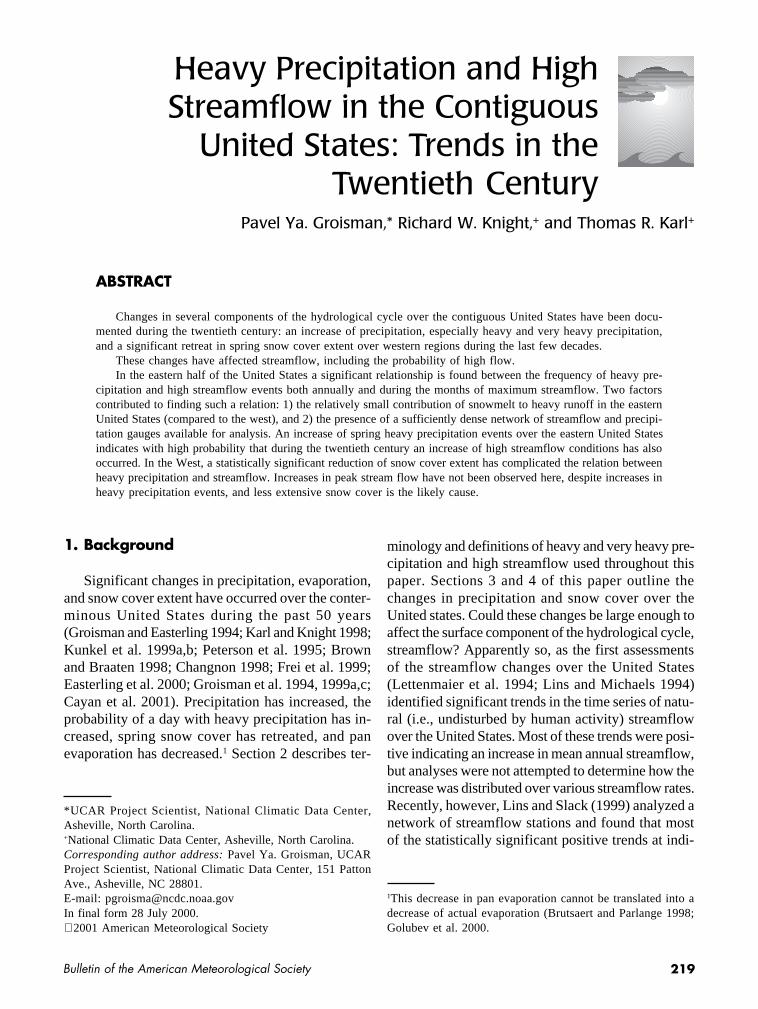
FIG. 2. Available stations with digitized daily precipitation data over the contiguous United States. (a) Stations with at least25 yr of valid data points (9125 daily values or 83%) during the 1961–90 period, (b) stations with at least 83% of valid data pointsduring the 1921–30 period, and (c) graph of the daily precipitation data availability by year since 1891.
tionship of regional and national changes (as opposedto individual sites) of the probability of heavy precipi-tation and high streamflow. The results are summa-rized within nine large regions over the contiguousUnited States. Sections 5 and 6 describe the streamflowand precipitation datasets and our results.
2. Heavy precipitation events: Definitionsand climatology
Karl et al. (1996) and Groisman et al. (1999c) de-fined “heavy” daily precipitation as an event with pre-cipitation above 50.8 mm (2 in.). More than 15% ofdaily summer precipitation totals in Louisiana makeup these events, while during the cold season (Oct–Apr) in Bismarck, North Dakota, such an event has
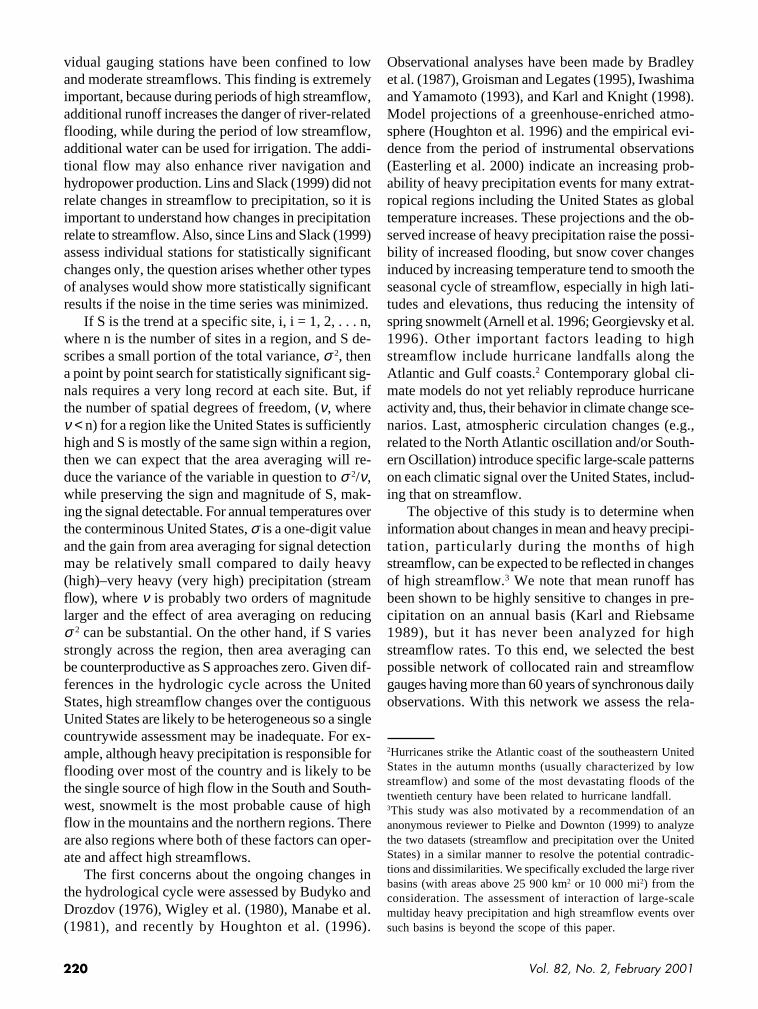
FIG. 3. Linear trends (%/100 yr) of annual precipitation(1900–98) over the contiguous United States (updated from Karland Knight 1998). Individual trends from 1221 Historical Cli-matology Network stations (Easterling et al. 1996) have beenarea averaged inside the U.S. climatic divisions (Guttman andQuayle 1996). Green dots indicate increasing and brown dotsdecreasing trends.

223Bulletin of the American Meteorological Society
never occurred in the twentieth century. An alterna-tive way to define heavy precipitation at a given siteand season/month is to use the actual frequency dis-tribution of precipitation.4 One can define the days withheavy precipitation as those days that have daily to-tals above specific percentiles of the distribution, forexample, 90th, 95th, 99th, etc.; or those that occur oncein X yr, for example, 1, 10, 20, or 50 yr, etc. Usingthis definition, heavy events can be simultaneouslyfound at various thresholds depending on location andtime of the year. Figure 1 shows examples ofclimatologies based on three alternative definitions ofheavy and very heavy daily precipitation for the con-tiguous United States. The first definition is based onabsolute threshold values (here we selected thresholdsof 50.8 and 101.6 mm for heavy and very heavy dailyprecipitation, respectively). The second definition is
Season Winter Spring Summer Autumn
Linear trend (%/100 yr) 0 10 7 15
TABLE 1. Linear trends in mean seasonal precipitation area weighted overthe contiguous United States for the period 1910–96. Trends are statisticallysignificant (at the 0.01 level) except during winter.
FIG. 4. National variations of the area-averaged annual fre-quency of the sequence (precipitation, precipitation, and heavyprecipitation), where heavy precipitation is daily precipitationtotal above 50.8 mm (2 in.). A national trend of roughly32%/100 yr is statistically significant at the 0.01 level.
FIG. 5. Regions used throughout this study and regionallyaveraged linear trends (1901–96) in the annual frequency ofheavy precipitation events above 50.8 mm (2 in.) on the thirdconsecutive day with measurable precipitation on each of theprior two days. Both the national trend and the trend in the Southare statistically significant at the 0.01 level, the trend in the Westis significant at the 0.05 level, and in the Midwest the trend issignificant at the 0.10 level.
based on the 90th and 99th percentilesof precipitation days throughout the year,and the third, on return periods of 1and 20 yr. These climatologies were es-timated from the daily precipitation dataof 5873 stations over the contiguousUnited States for the past 50 yr with atleast 25 yr of data during the period from1961 to 1990 (Fig. 2).
The frequency and intensity of cata-strophic events with loss of property, crops, or evenhuman lives are the most important aspects of con-temporary climate change, but events at the highestend of the precipitation/streamflow distribution can beshort lived (hours to days)5 and quite localized. There-fore, precipitation/streamflow data from a spatiallydense network with at least daily time resolution arerequired to understand the changes of these events.Homogeneous, long-term time series of these data areessential. Historically, climate change studies havebeen based on rather sparse networks. Up until re-cently, the only dataset of century-long daily U.S. pre-cipitation time series from high quality data was fromthe U.S. Historical Climatology Network (Hughes et al.
4Estimation of the percentiles within the precipitation distribu-tion is based on days with precipitation excluding days withoutprecipitation as calculated by Karl and Knight (1998) and rec-ommended by Nicholls and Murray (1999).
5For streamflow from large river basins this time frame is some-times a week or more.
224 Vol. 82, No. 2, February 2001
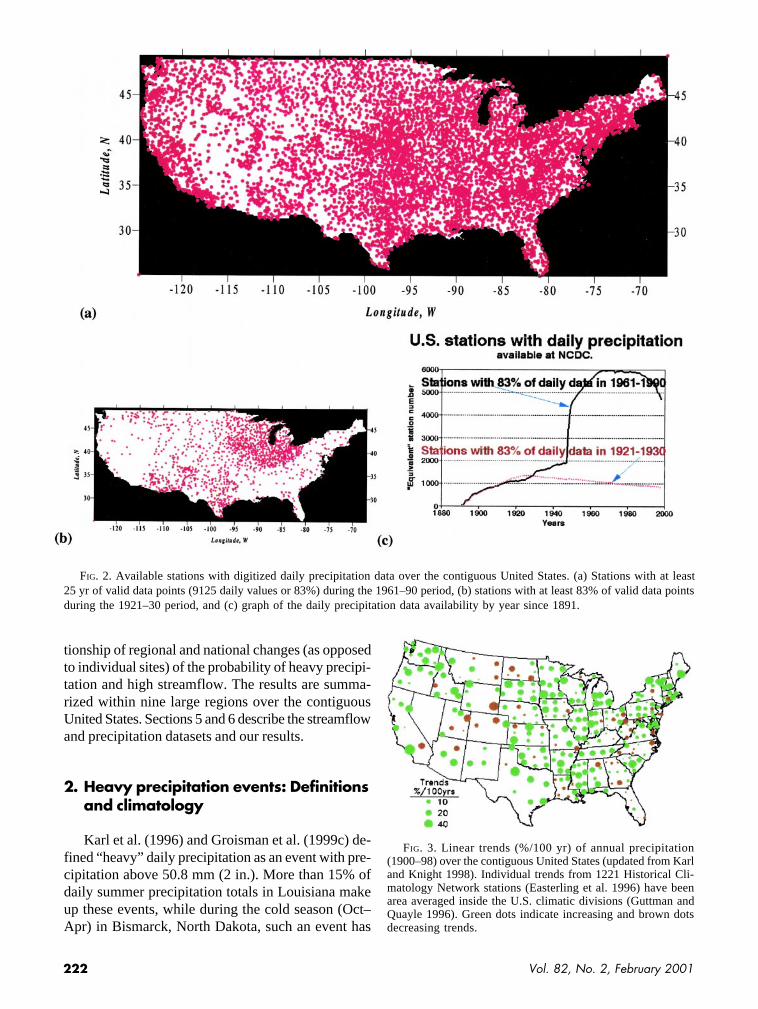
FIG. 6. Annual number of days with very heavy precipita-tion (above 101.6 mm) over the (a.) Northwest and (b.) UpperMississippi regions. Estimates are based on the network shownin Fig. 2. Results based on the subsets of stations that reporteddaily precipitation since the 1920s and (for the Upper Mississippi)since the 1900s are also shown. Stations with at least 50% of validdata in the 1920s (1900s) were included into these two subsets.
1992) which contained only 187 stations. This networkappears to be sufficient for countrywide (large regions)generalizations used in analyses of heavy precipita-tion events (Karl and Knight 1998) or the days withprecipitation above 50.8 mm (Groisman et al.1999b,c), but to assess changes in daily precipitationabove 100 mm, such a network is inadequate. Veryrare events sometimes occur in the vicinity of a sta-tion and may go unreported. In order to address thisproblem and analyze the changes in the frequency ofvery heavy precipitation events, accumulated daily datawere used from several thousand stations (Fig. 2). Thisenabled us to assess century-long trends in frequen-cies of very heavy daily precipitation events (thoseabove 101.6 mm or 4 in.) over the contiguous UnitedStates as related to events above the 99th percentilefor monthly and annual thresholds of streamflow eventsfor river basins of various size.
Data holdings currently available at the U.S.National Climatic Data Center included Hughes et al.(1992), Kunkel et al. (1999a), Frei et al. (1999), andFrance (1998). Figure 2 shows that prior to 1948 (theyear when routine digital archiving of meteorologicalinformation started in the United States) much lessdaily precipitation data are available for our analysis.Efforts to digitize more U.S. daily meteorological datafor the pre-1948 period are currently under way at theNational Climatic Data Center.
3. Precipitation changes
a. Seasonal and annual precipitation changesPrecipitation changes over the United States have
not been linear over the twentieth century and therewere decades (most noteworthy is the “dust bowl” ofthe 1930s), when significant large-scale anomaliesoccurred. However, when a linear approximation isused, precipitation totals during the twentieth centuryhave increased significantly over most of the contigu-ous United States in all seasons except winter (Fig. 3,Table 1). The trends range from 7% to 15% per centuryduring the summer and transition seasons (Table 1).
b. One-day heavy precipitation eventsAn early report about an increase of precipitation
extremes in Japan and for a limited set of stations inthe United States was provided by Iwashima andYamamoto (1993). Based on daily data, trends in 1-dayextreme precipitation events in the United States indi-cated more days with extreme daily precipitation to-tals. In particular, the number of days per yearexceeding the 90th and 95th percentiles and 1-yr an-nual maximum daily precipitation amount have beenincreasing (Karl et al. 1996; Karl and Knight 1998).The increase in heavy and extreme events is ampli-fied compared to the change in the mean, and this isconsistent with worldwide analyses (Groisman et al.1999b,c). Increases are largest for the southwest,midwest, and Great Lakes regions of the United States.The area of the United States experiencing excessivewetness appears to be increasing, particularly since the1970s (Karl and Knight 1998; Kunkel et al. 1999a).This is consistent with long-term increases in precipi-tation totals over the contiguous United States.
c. Multiday heavy precipitation eventsThe frequencies of 2–7-day precipitation totals
exceeding station-specific thresholds for one in 1-yr
225Bulletin of the American Meteorological Society
Northwest 0.072 14 Unknown
Missouri River Basin 0.024 41 Unknown
Upper Mississippi 0.067 15 10 0
Northeast 0.079 13 69# 3
California and Nevada 0.209 5 Unknown
Southwest 0.009 114 Unknown
South 0.336 3 36** 7
Midwest 0.121 8 33# 3
Southeast 0.327 3 15 1
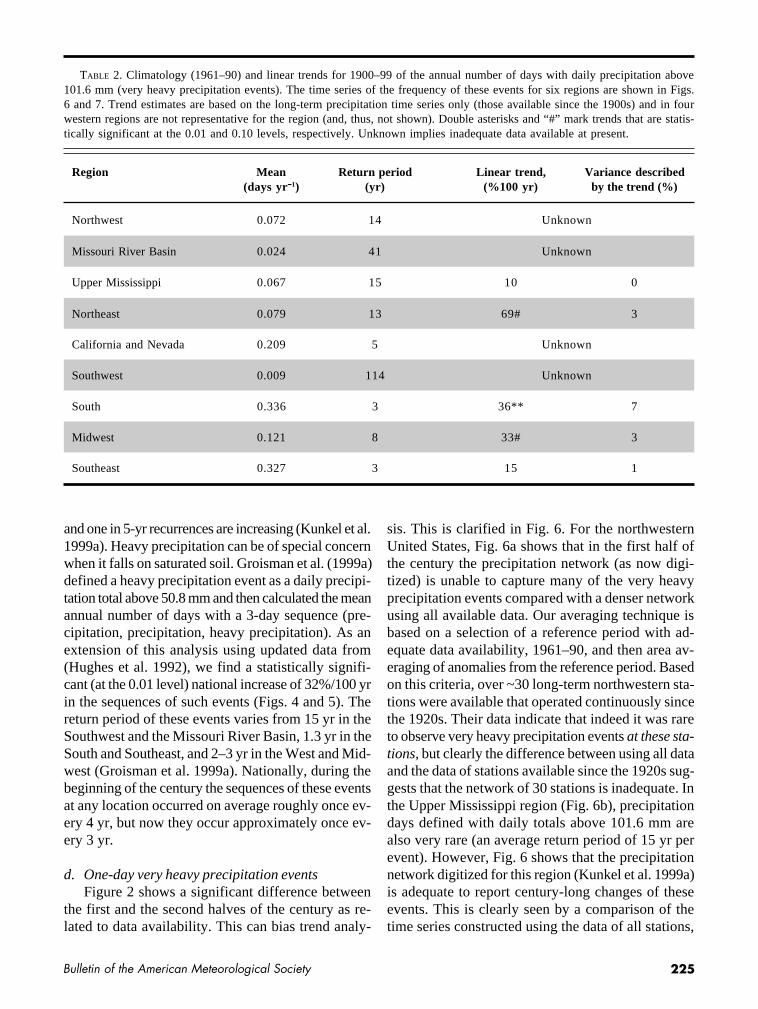
TABLE 2. Climatology (1961–90) and linear trends for 1900–99 of the annual number of days with daily precipitation above101.6 mm (very heavy precipitation events). The time series of the frequency of these events for six regions are shown in Figs.6 and 7. Trend estimates are based on the long-term precipitation time series only (those available since the 1900s) and in fourwestern regions are not representative for the region (and, thus, not shown). Double asterisks and “#” mark trends that are statis-tically significant at the 0.01 and 0.10 levels, respectively. Unknown implies inadequate data available at present.
Region Mean Return period Linear trend, Variance described(days yr−−−−−1) (yr) (%100 yr) by the trend (%)
and one in 5-yr recurrences are increasing (Kunkel et al.1999a). Heavy precipitation can be of special concernwhen it falls on saturated soil. Groisman et al. (1999a)defined a heavy precipitation event as a daily precipi-tation total above 50.8 mm and then calculated the meanannual number of days with a 3-day sequence (pre-cipitation, precipitation, heavy precipitation). As anextension of this analysis using updated data from(Hughes et al. 1992), we find a statistically signifi-cant (at the 0.01 level) national increase of 32%/100 yrin the sequences of such events (Figs. 4 and 5). Thereturn period of these events varies from 15 yr in theSouthwest and the Missouri River Basin, 1.3 yr in theSouth and Southeast, and 2–3 yr in the West and Mid-west (Groisman et al. 1999a). Nationally, during thebeginning of the century the sequences of these eventsat any location occurred on average roughly once ev-ery 4 yr, but now they occur approximately once ev-ery 3 yr.
d. One-day very heavy precipitation eventsFigure 2 shows a significant difference between
the first and the second halves of the century as re-lated to data availability. This can bias trend analy-
sis. This is clarified in Fig. 6. For the northwesternUnited States, Fig. 6a shows that in the first half ofthe century the precipitation network (as now digi-tized) is unable to capture many of the very heavyprecipitation events compared with a denser networkusing all available data. Our averaging technique isbased on a selection of a reference period with ad-equate data availability, 1961–90, and then area av-eraging of anomalies from the reference period. Basedon this criteria, over ~30 long-term northwestern sta-tions were available that operated continuously sincethe 1920s. Their data indicate that indeed it was rareto observe very heavy precipitation events at these sta-tions, but clearly the difference between using all dataand the data of stations available since the 1920s sug-gests that the network of 30 stations is inadequate. Inthe Upper Mississippi region (Fig. 6b), precipitationdays defined with daily totals above 101.6 mm arealso very rare (an average return period of 15 yr perevent). However, Fig. 6 shows that the precipitationnetwork digitized for this region (Kunkel et al. 1999a)is adequate to report century-long changes of theseevents. This is clearly seen by a comparison of thetime series constructed using the data of all stations,
226 Vol. 82, No. 2, February 2001
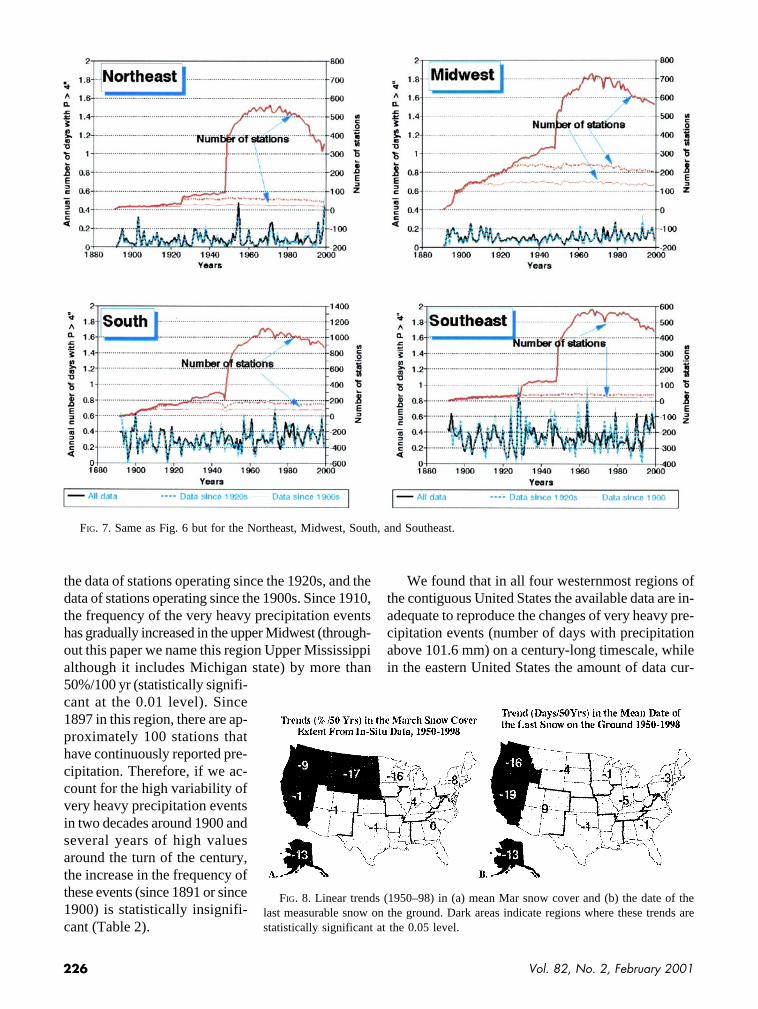
FIG. 7. Same as Fig. 6 but for the Northeast, Midwest, South, and Southeast.
FIG. 8. Linear trends (1950–98) in (a) mean Mar snow cover and (b) the date of thelast measurable snow on the ground. Dark areas indicate regions where these trends arestatistically significant at the 0.05 level.
the data of stations operating since the 1920s, and thedata of stations operating since the 1900s. Since 1910,the frequency of the very heavy precipitation eventshas gradually increased in the upper Midwest (through-out this paper we name this region Upper Mississippialthough it includes Michigan state) by more than50%/100 yr (statistically signifi-cant at the 0.01 level). Since1897 in this region, there are ap-proximately 100 stations thathave continuously reported pre-cipitation. Therefore, if we ac-count for the high variability ofvery heavy precipitation eventsin two decades around 1900 andseveral years of high valuesaround the turn of the century,the increase in the frequency ofthese events (since 1891 or since1900) is statistically insignifi-cant (Table 2).
We found that in all four westernmost regions ofthe contiguous United States the available data are in-adequate to reproduce the changes of very heavy pre-cipitation events (number of days with precipitationabove 101.6 mm) on a century-long timescale, whilein the eastern United States the amount of data cur-
227Bulletin of the American Meteorological Society
Northwest 2.5 3.1 7.5 3.3 3.8
Missouri River Basin 4.2 4.3 4.6 4.4 4.9
Upper Mississippi 2.7 3.5 5.8 2.8 6.6
Northeast 3.3 3.5 8.1 3.7 5.2
California and Nevada 3.1 2.9 3.0 2.3 3.2
Southwest 2.8 4.0 7.2 3.2 3.5
South 6.4 5.8 8.0 5.2 11.1
Midwest 2.8 3.0 5.0 4.5 11.1
Southeast 2.3 2.7 6.0 1.8 4.6
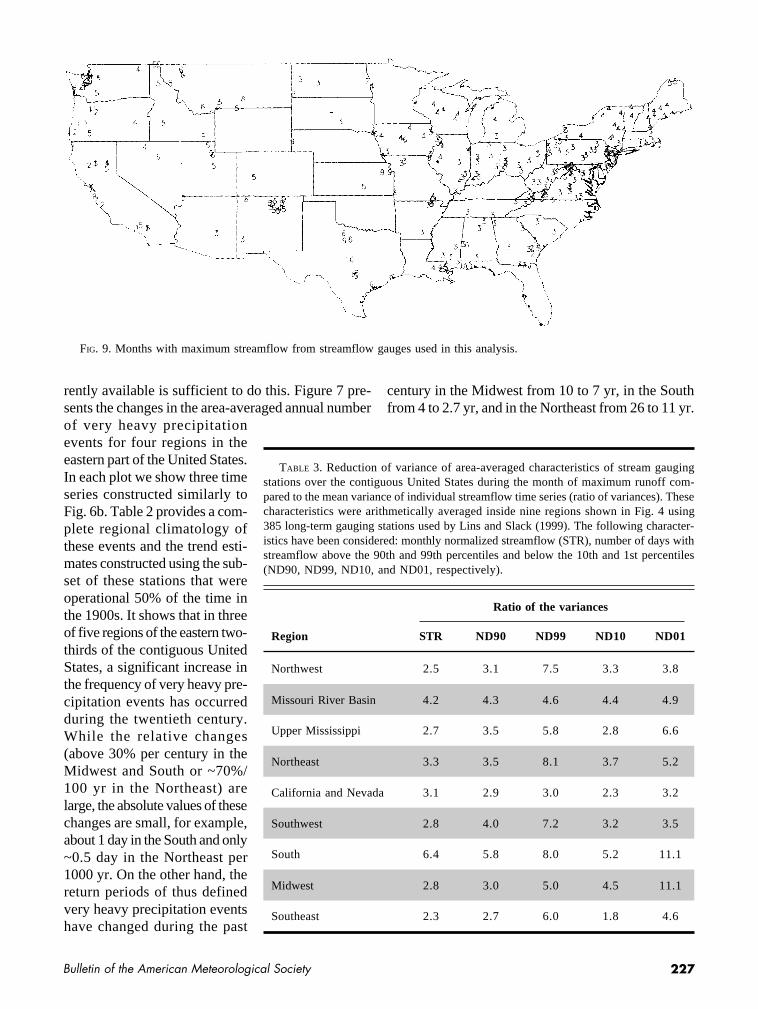
TABLE 3. Reduction of variance of area-averaged characteristics of stream gaugingstations over the contiguous United States during the month of maximum runoff com-pared to the mean variance of individual streamflow time series (ratio of variances). Thesecharacteristics were arithmetically averaged inside nine regions shown in Fig. 4 using385 long-term gauging stations used by Lins and Slack (1999). The following character-istics have been considered: monthly normalized streamflow (STR), number of days withstreamflow above the 90th and 99th percentiles and below the 10th and 1st percentiles(ND90, ND99, ND10, and ND01, respectively).
Ratio of the variances
Region STR ND90 ND99 ND10 ND01
FIG. 9. Months with maximum streamflow from streamflow gauges used in this analysis.
rently available is sufficient to do this. Figure 7 pre-sents the changes in the area-averaged annual numberof very heavy precipitationevents for four regions in theeastern part of the United States.In each plot we show three timeseries constructed similarly toFig. 6b. Table 2 provides a com-plete regional climatology ofthese events and the trend esti-mates constructed using the sub-set of these stations that wereoperational 50% of the time inthe 1900s. It shows that in threeof five regions of the eastern two-thirds of the contiguous UnitedStates, a significant increase inthe frequency of very heavy pre-cipitation events has occurredduring the twentieth century.While the relative changes(above 30% per century in theMidwest and South or ~70%/100 yr in the Northeast) arelarge, the absolute values of thesechanges are small, for example,about 1 day in the South and only~0.5 day in the Northeast per1000 yr. On the other hand, thereturn periods of thus definedvery heavy precipitation eventshave changed during the past
century in the Midwest from 10 to 7 yr, in the Southfrom 4 to 2.7 yr, and in the Northeast from 26 to 11 yr.
228 Vol. 82, No. 2, February 2001
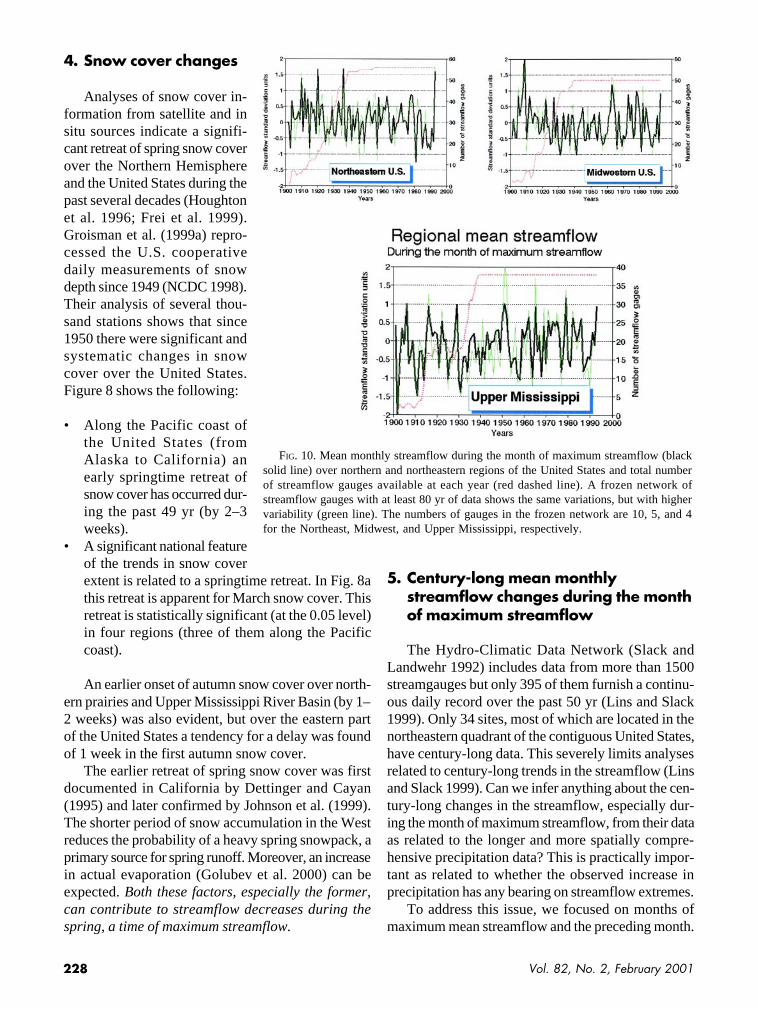
FIG. 10. Mean monthly streamflow during the month of maximum streamflow (blacksolid line) over northern and northeastern regions of the United States and total numberof streamflow gauges available at each year (red dashed line). A frozen network ofstreamflow gauges with at least 80 yr of data shows the same variations, but with highervariability (green line). The numbers of gauges in the frozen network are 10, 5, and 4for the Northeast, Midwest, and Upper Mississippi, respectively.
4. Snow cover changes
Analyses of snow cover in-formation from satellite and insitu sources indicate a signifi-cant retreat of spring snow coverover the Northern Hemisphereand the United States during thepast several decades (Houghtonet al. 1996; Frei et al. 1999).Groisman et al. (1999a) repro-cessed the U.S. cooperativedaily measurements of snowdepth since 1949 (NCDC 1998).Their analysis of several thou-sand stations shows that since1950 there were significant andsystematic changes in snowcover over the United States.Figure 8 shows the following:
• Along the Pacific coast ofthe United States (fromAlaska to California) anearly springtime retreat ofsnow cover has occurred dur-ing the past 49 yr (by 2–3weeks).
• A significant national featureof the trends in snow coverextent is related to a springtime retreat. In Fig. 8athis retreat is apparent for March snow cover. Thisretreat is statistically significant (at the 0.05 level)in four regions (three of them along the Pacificcoast).
An earlier onset of autumn snow cover over north-ern prairies and Upper Mississippi River Basin (by 1–2 weeks) was also evident, but over the eastern partof the United States a tendency for a delay was foundof 1 week in the first autumn snow cover.
The earlier retreat of spring snow cover was firstdocumented in California by Dettinger and Cayan(1995) and later confirmed by Johnson et al. (1999).The shorter period of snow accumulation in the Westreduces the probability of a heavy spring snowpack, aprimary source for spring runoff. Moreover, an increasein actual evaporation (Golubev et al. 2000) can beexpected. Both these factors, especially the former,can contribute to streamflow decreases during thespring, a time of maximum streamflow.
5. Century-long mean monthlystreamflow changes during the monthof maximum streamflow
The Hydro-Climatic Data Network (Slack andLandwehr 1992) includes data from more than 1500streamgauges but only 395 of them furnish a continu-ous daily record over the past 50 yr (Lins and Slack1999). Only 34 sites, most of which are located in thenortheastern quadrant of the contiguous United States,have century-long data. This severely limits analysesrelated to century-long trends in the streamflow (Linsand Slack 1999). Can we infer anything about the cen-tury-long changes in the streamflow, especially dur-ing the month of maximum streamflow, from their dataas related to the longer and more spatially compre-hensive precipitation data? This is practically impor-tant as related to whether the observed increase inprecipitation has any bearing on streamflow extremes.
To address this issue, we focused on months ofmaximum mean streamflow and the preceding month.

229Bulletin of the American Meteorological Society
FIG. 11. Mean monthly streamflow during the month of maximum streamflow (blacksolid line) and the preceding month (green line) over the northern and western regionsof the United States. The total number of streamflow gauges available at each year isalso shown (red dashed line).
6Standardization allows us to treat the streamflow time seriesequally for streams with relatively high and low flows.Otherwise, a large stream with a higher absolute variability willdominate in the area-averaged values.
Early spring (Mar–Apr) is theseason with maximum streamflowin the eastern half of the coun-try (Fig. 9). In the Upper Mis-sissippi River Basin, Midwest,and Northwest these two monthscoincide with the snowmelt pe-riod. Over the Great Plains abroad (and not well defined)maximum streamflow is appar-ent in the warm season (Jun–Sep).Over the mountainous westernhalf of the country the monthsof maximum streamflow coin-cide or directly follow the timeof maximum snowmelt (fromMar in the South through Jun inthe North). Along the westerncoast maximum streamflow oc-curs during the winter rainy sea-son (Jan–Feb).
We calculated the mean andstandard deviations of monthlymean streamflow for the period1961–90 and standardized meandaily streamflow values (meanswere subtracted and the differ-ences were divided by standarddeviations).6 The standardizedtime series were area averagedwithin nine large regions of thecontiguous United States (shownin Figs. 5 and 8). Spatial aver-aging across nine large regionsreduces the variance of the streamflow data, therebyeliminating unwanted spatial noise (Table 3). Table 3shows the effect of arithmetical averaging of the dataof 385 long-term gauging stations used by Lins andSlack (1999) inside these nine regions for the monthof maximum streamflow. The noise reduction (some-times by an order of magnitude) increases our abilityto detect climatic signals (S), if they are present. Ofcourse, only large-scale regionwide signals are iden-tifiable through the area-averaging process. The en-tire concept of this study is based on the search of the
large-scale changes (if they exist), thus justifying theuse of regional and national spatial averaging.
Figure 10 shows the results of a “frozen network”experiment when the area-averaged monthly meanstreamflow time series are compared with the sametime series estimated strictly from the data of siteshaving at least 80 yr of observations. The analysis ofthe frozen network shows that only in the Northeast,Midwest, and the Upper Mississippi regions are weable to construct representative century-longstreamflow time series. The streamflow time series inFig. 10 demonstrate high interannual and interdecadalvariability without a significant century-long system-atic component. Only in the Upper Mississippi regionis there a slight positive trend (1901–93) statisticallysignificant at the 0.1 level. The trend describes only3% of the time series variance. Streamflow in the

230 Vol. 82, No. 2, February 2001
FIG. 12. Streamflow during the month of maximumstreamflow and spring snow cover indicators over two north-western regions of the contiguous United States.
FIG. 13. Streamflow variations during the month of maximumstreamflow (solid line) over the southern and southeastern re-gions of the United States and total number of streamflow gaugesavailable at each year (dashed line).
month of maximum streamflow (early spring monthsin the above-mentioned three regions) is usually in theupper 90th percentile of the annual discharge distri-bution. Figure 10 shows that the monthly totals didnot change (or slightly increased) during the past cen-tury over the three regions where a direct assessmentis possible.7 This is, however, less than a quarter ofthe entire country. The number of streamflow gaugesavailable for our analyses during the first 25 yr of the
century is too small for inferring regional streamflowvariations over other U.S. regions.
Figure 11 depicts the streamflow time series forsix northern and western regions of the country wheresnowmelt constitutes a significant part to the runoff.In the two northwestern regions (Northwest and Mis-souri River Basin), where during the past 50 yr a sig-nificant retreat of snow cover has occurred (Fig. 8), asteady runoff increase during the month of maximumstreamflow is evident from 1930 to 1970, but sharplyreverses thereafter. This decrease, however, is not sup-ported by similar changes in monthly streamflow inthe preceding month as occurred before the 1970s orin other regions of the country. A gradual shift of therunoff of snowmelt to earlier dates may explain thisphenomenon. Indeed, Fig. 12 shows a statistically sig-
7Karl and Knight (1998) found insignificant changes in winterprecipitation over the Upper Mississippi and Midwest and anincrease over the Northeast during the 1910–96 period. Duringthe past 50 yr, we observed only insignificant changes in snowcover (Fig. 8) over these three regions. This implies that earlyspring streamflow over these three regions, a large portion ofwhich is derived from snowmelt and winter precipitation, is notlikely to appreciably change.
231Bulletin of the American Meteorological Society
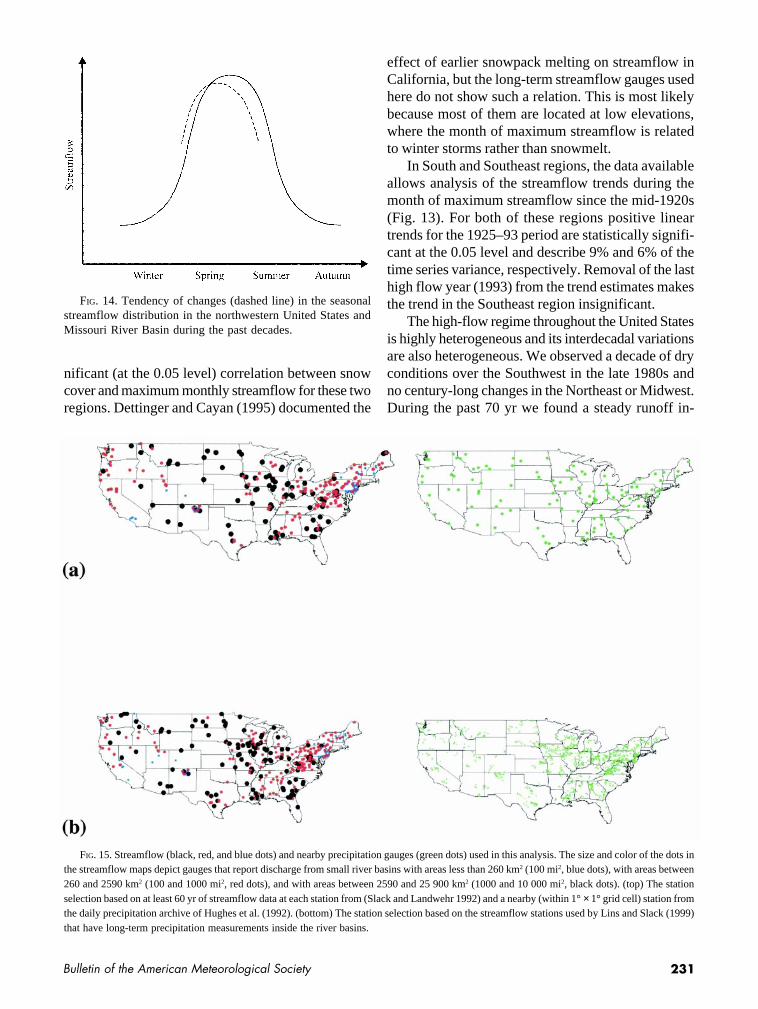
FIG. 15. Streamflow (black, red, and blue dots) and nearby precipitation gauges (green dots) used in this analysis. The size and color of the dots inthe streamflow maps depict gauges that report discharge from small river basins with areas less than 260 km2 (100 mi2, blue dots), with areas between260 and 2590 km2 (100 and 1000 mi2, red dots), and with areas between 2590 and 25 900 km2 (1000 and 10 000 mi2, black dots). (top) The stationselection based on at least 60 yr of streamflow data at each station from (Slack and Landwehr 1992) and a nearby (within 1° × 1° grid cell) station fromthe daily precipitation archive of Hughes et al. (1992). (bottom) The station selection based on the streamflow stations used by Lins and Slack (1999)that have long-term precipitation measurements inside the river basins.
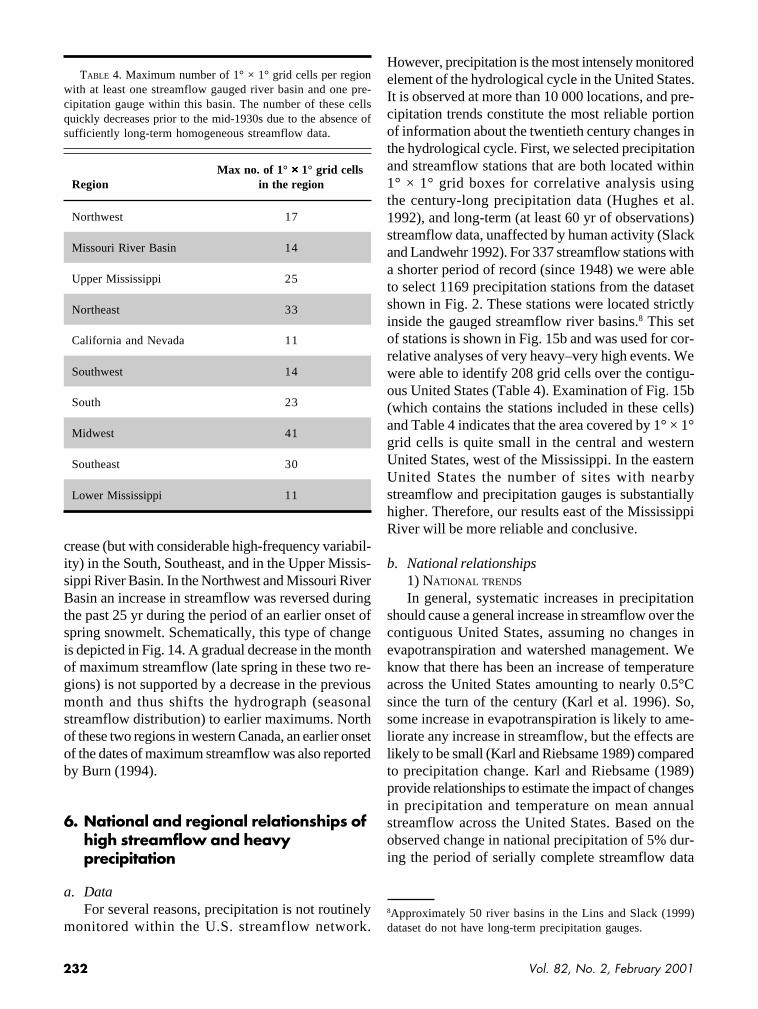
FIG. 14. Tendency of changes (dashed line) in the seasonalstreamflow distribution in the northwestern United States andMissouri River Basin during the past decades.
nificant (at the 0.05 level) correlation between snowcover and maximum monthly streamflow for these tworegions. Dettinger and Cayan (1995) documented the
effect of earlier snowpack melting on streamflow inCalifornia, but the long-term streamflow gauges usedhere do not show such a relation. This is most likelybecause most of them are located at low elevations,where the month of maximum streamflow is relatedto winter storms rather than snowmelt.
In South and Southeast regions, the data availableallows analysis of the streamflow trends during themonth of maximum streamflow since the mid-1920s(Fig. 13). For both of these regions positive lineartrends for the 1925–93 period are statistically signifi-cant at the 0.05 level and describe 9% and 6% of thetime series variance, respectively. Removal of the lasthigh flow year (1993) from the trend estimates makesthe trend in the Southeast region insignificant.
The high-flow regime throughout the United Statesis highly heterogeneous and its interdecadal variationsare also heterogeneous. We observed a decade of dryconditions over the Southwest in the late 1980s andno century-long changes in the Northeast or Midwest.During the past 70 yr we found a steady runoff in-
232 Vol. 82, No. 2, February 2001
Northwest 17
Missouri River Basin 14
Upper Mississippi 25
Northeast 33
California and Nevada 11
Southwest 14
South 23
Midwest 41
Southeast 30
Lower Mississippi 11
TABLE 4. Maximum number of 1° × 1° grid cells per regionwith at least one streamflow gauged river basin and one pre-cipitation gauge within this basin. The number of these cellsquickly decreases prior to the mid-1930s due to the absence ofsufficiently long-term homogeneous streamflow data.
Max no. of 1° ××××× 1° grid cellsRegion in the region
8Approximately 50 river basins in the Lins and Slack (1999)dataset do not have long-term precipitation gauges.
crease (but with considerable high-frequency variabil-ity) in the South, Southeast, and in the Upper Missis-sippi River Basin. In the Northwest and Missouri RiverBasin an increase in streamflow was reversed duringthe past 25 yr during the period of an earlier onset ofspring snowmelt. Schematically, this type of changeis depicted in Fig. 14. A gradual decrease in the monthof maximum streamflow (late spring in these two re-gions) is not supported by a decrease in the previousmonth and thus shifts the hydrograph (seasonalstreamflow distribution) to earlier maximums. Northof these two regions in western Canada, an earlier onsetof the dates of maximum streamflow was also reportedby Burn (1994).
6. National and regional relationships ofhigh streamflow and heavyprecipitation
a. DataFor several reasons, precipitation is not routinely
monitored within the U.S. streamflow network.
However, precipitation is the most intensely monitoredelement of the hydrological cycle in the United States.It is observed at more than 10 000 locations, and pre-cipitation trends constitute the most reliable portionof information about the twentieth century changes inthe hydrological cycle. First, we selected precipitationand streamflow stations that are both located within1° × 1° grid boxes for correlative analysis usingthe century-long precipitation data (Hughes et al.1992), and long-term (at least 60 yr of observations)streamflow data, unaffected by human activity (Slackand Landwehr 1992). For 337 streamflow stations witha shorter period of record (since 1948) we were ableto select 1169 precipitation stations from the datasetshown in Fig. 2. These stations were located strictlyinside the gauged streamflow river basins.8 This setof stations is shown in Fig. 15b and was used for cor-relative analyses of very heavy–very high events. Wewere able to identify 208 grid cells over the contigu-ous United States (Table 4). Examination of Fig. 15b(which contains the stations included in these cells)and Table 4 indicates that the area covered by 1° × 1°grid cells is quite small in the central and westernUnited States, west of the Mississippi. In the easternUnited States the number of sites with nearbystreamflow and precipitation gauges is substantiallyhigher. Therefore, our results east of the MississippiRiver will be more reliable and conclusive.
b. National relationships1) NATIONAL TRENDS
In general, systematic increases in precipitationshould cause a general increase in streamflow over thecontiguous United States, assuming no changes inevapotranspiration and watershed management. Weknow that there has been an increase of temperatureacross the United States amounting to nearly 0.5°Csince the turn of the century (Karl et al. 1996). So,some increase in evapotranspiration is likely to ame-liorate any increase in streamflow, but the effects arelikely to be small (Karl and Riebsame 1989) comparedto precipitation change. Karl and Riebsame (1989)provide relationships to estimate the impact of changesin precipitation and temperature on mean annualstreamflow across the United States. Based on theobserved change in national precipitation of 5% dur-ing the period of serially complete streamflow data
233Bulletin of the American Meteorological Society
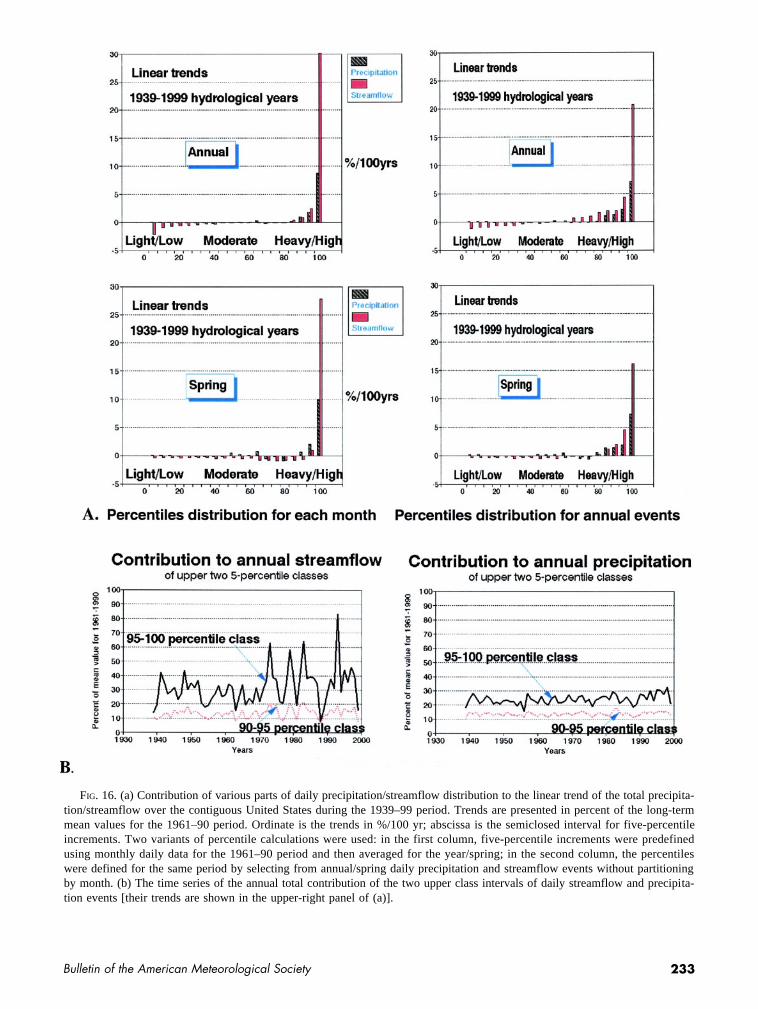
FIG. 16. (a) Contribution of various parts of daily precipitation/streamflow distribution to the linear trend of the total precipita-tion/streamflow over the contiguous United States during the 1939–99 period. Trends are presented in percent of the long-termmean values for the 1961–90 period. Ordinate is the trends in %/100 yr; abscissa is the semiclosed interval for five-percentileincrements. Two variants of percentile calculations were used: in the first column, five-percentile increments were predefinedusing monthly daily data for the 1961–90 period and then averaged for the year/spring; in the second column, the percentileswere defined for the same period by selecting from annual/spring daily precipitation and streamflow events without partitioningby month. (b) The time series of the annual total contribution of the two upper class intervals of daily streamflow and precipita-tion events [their trends are shown in the upper-right panel of (a)].

234 Vol. 82, No. 2, February 2001
FIG. 17. Variations of the annual number of days with high (very high) streamflow (red lines) and heavy (very heavy) precipi-tation (black lines) for gauges collocated in 1° × 1° grid cells. Results of national averaging for the streamflow gauges that rep-resent small river basins with areas less than 260 km2 (or 100 mi2), medium river basins with areas between 260 and 2590 km2
(100 and 1000 mi2), and large river basins with areas between 2590 and 25 900 km2 (1000 and 10 000 mi2) and collocated raingauges shown in Fig. 15a. The 90th and 99th monthly percentiles of daily precipitation (during the days with precipitation) andstreamflow were used to define heavy/high and very heavy/high events. Here, N is the number of 1° × 1° grid cells used in thenational averaging; R (correlation coefficient) between streamflow and precipitation is statistically significant at the 0.01 level inall cases except for very heavy/high precipitation and streamflow in the small river basins.
235Bulletin of the American Meteorological Society
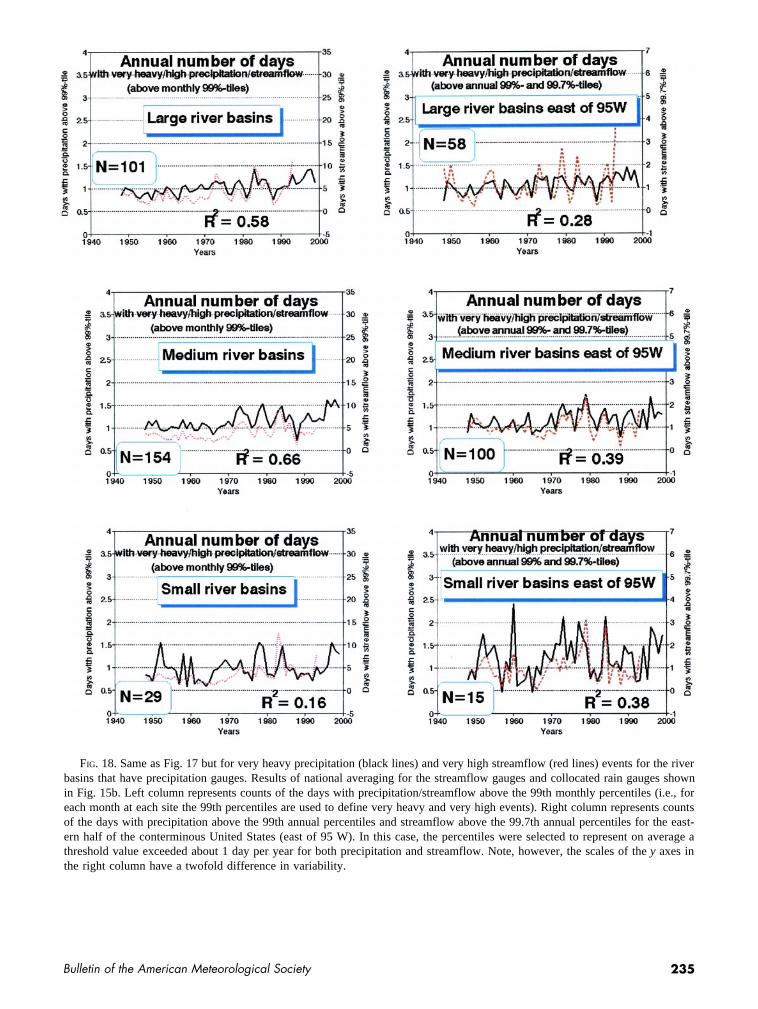
FIG. 18. Same as Fig. 17 but for very heavy precipitation (black lines) and very high streamflow (red lines) events for the riverbasins that have precipitation gauges. Results of national averaging for the streamflow gauges and collocated rain gauges shownin Fig. 15b. Left column represents counts of the days with precipitation/streamflow above the 99th monthly percentiles (i.e., foreach month at each site the 99th percentiles are used to define very heavy and very high events). Right column represents countsof the days with precipitation above the 99th annual percentiles and streamflow above the 99.7th annual percentiles for the east-ern half of the conterminous United States (east of 95 W). In this case, the percentiles were selected to represent on average athreshold value exceeded about 1 day per year for both precipitation and streamflow. Note, however, the scales of the y axes inthe right column have a twofold difference in variability.
236 Vol. 82, No. 2, February 2001
Northwest 0.29 0.31
Missouri River Basin 0.22 0.24
Upper Mississippi 0.25 0.27
Northeast 0.34 0.36
California and Nevada 0.15 0.18
Southwest 0.17 0.15
South 0.22 0.24
Midwest 0.29 0.33
Southeast 0.28 0.30
Lower Mississippi 0.26 0.28
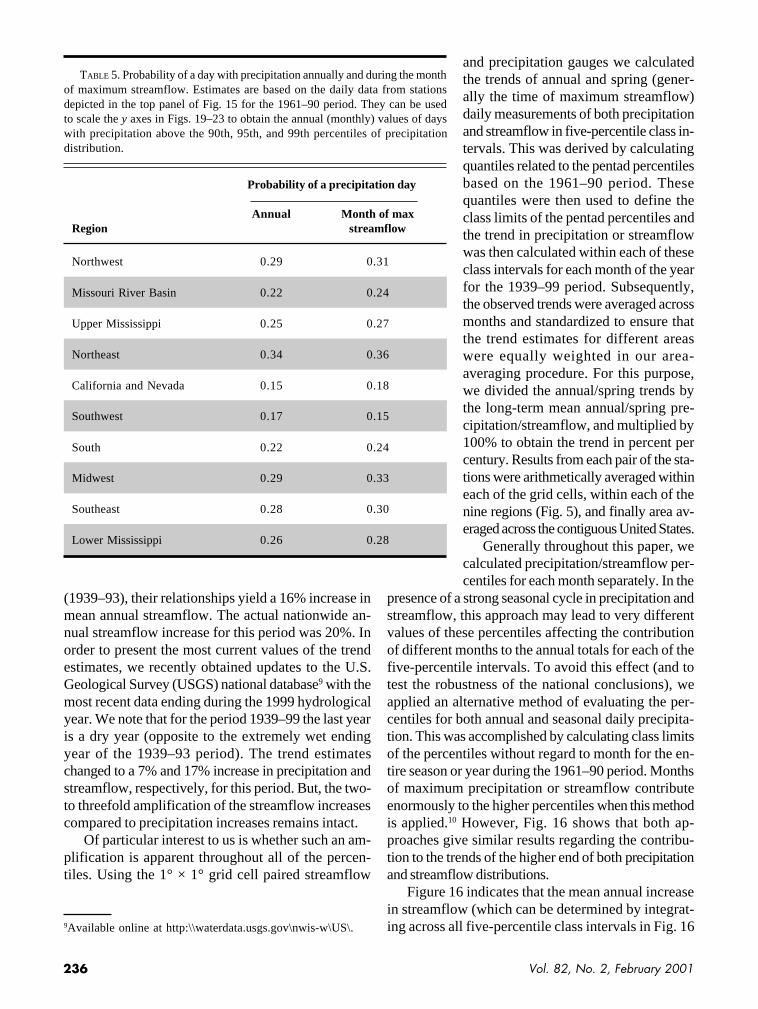
TABLE 5. Probability of a day with precipitation annually and during the monthof maximum streamflow. Estimates are based on the daily data from stationsdepicted in the top panel of Fig. 15 for the 1961–90 period. They can be usedto scale the y axes in Figs. 19–23 to obtain the annual (monthly) values of dayswith precipitation above the 90th, 95th, and 99th percentiles of precipitationdistribution.
Probability of a precipitation day
Annual Month of maxRegion streamflow
(1939–93), their relationships yield a 16% increase inmean annual streamflow. The actual nationwide an-nual streamflow increase for this period was 20%. Inorder to present the most current values of the trendestimates, we recently obtained updates to the U.S.Geological Survey (USGS) national database9 with themost recent data ending during the 1999 hydrologicalyear. We note that for the period 1939–99 the last yearis a dry year (opposite to the extremely wet endingyear of the 1939–93 period). The trend estimateschanged to a 7% and 17% increase in precipitation andstreamflow, respectively, for this period. But, the two-to threefold amplification of the streamflow increasescompared to precipitation increases remains intact.
Of particular interest to us is whether such an am-plification is apparent throughout all of the percen-tiles. Using the 1° × 1° grid cell paired streamflow
and precipitation gauges we calculatedthe trends of annual and spring (gener-ally the time of maximum streamflow)daily measurements of both precipitationand streamflow in five-percentile class in-tervals. This was derived by calculatingquantiles related to the pentad percentilesbased on the 1961–90 period. Thesequantiles were then used to define theclass limits of the pentad percentiles andthe trend in precipitation or streamflowwas then calculated within each of theseclass intervals for each month of the yearfor the 1939–99 period. Subsequently,the observed trends were averaged acrossmonths and standardized to ensure thatthe trend estimates for different areaswere equally weighted in our area-averaging procedure. For this purpose,we divided the annual/spring trends bythe long-term mean annual/spring pre-cipitation/streamflow, and multiplied by100% to obtain the trend in percent percentury. Results from each pair of the sta-tions were arithmetically averaged withineach of the grid cells, within each of thenine regions (Fig. 5), and finally area av-eraged across the contiguous United States.
Generally throughout this paper, wecalculated precipitation/streamflow per-centiles for each month separately. In the
presence of a strong seasonal cycle in precipitation andstreamflow, this approach may lead to very differentvalues of these percentiles affecting the contributionof different months to the annual totals for each of thefive-percentile intervals. To avoid this effect (and totest the robustness of the national conclusions), weapplied an alternative method of evaluating the per-centiles for both annual and seasonal daily precipita-tion. This was accomplished by calculating class limitsof the percentiles without regard to month for the en-tire season or year during the 1961–90 period. Monthsof maximum precipitation or streamflow contributeenormously to the higher percentiles when this methodis applied.10 However, Fig. 16 shows that both ap-proaches give similar results regarding the contribu-tion to the trends of the higher end of both precipitationand streamflow distributions.
Figure 16 indicates that the mean annual increasein streamflow (which can be determined by integrat-ing across all five-percentile class intervals in Fig. 169Available online at http:\\waterdata.usgs.gov\nwis-w\US\.
237Bulletin of the American Meteorological Society
10There are different ideologies behind this and our approach.It is possible to define heavy/high values climatologically foreach month or using the approach based on the annual quantiles.The latter approach is more practical from a flood-risk point ofview in that it is not important to consider high flows of rela-tively low seasonal streamflow when they do not contribute toriver flood stage.
Northwest 0.7* 0.3
Missouri River Basin 0.3* 0.2
Upper Mississippi 0.7* 0.3
Northeast 0.6* 0.6*
California and Nevada 0.6* 0.2
Southwest 0.6* 0.3
South 0.6* 0.1
Midwest 0.6* 0.2
Southeast 0.6* 0.5*
Lower Mississippi 0.7* 0.5*
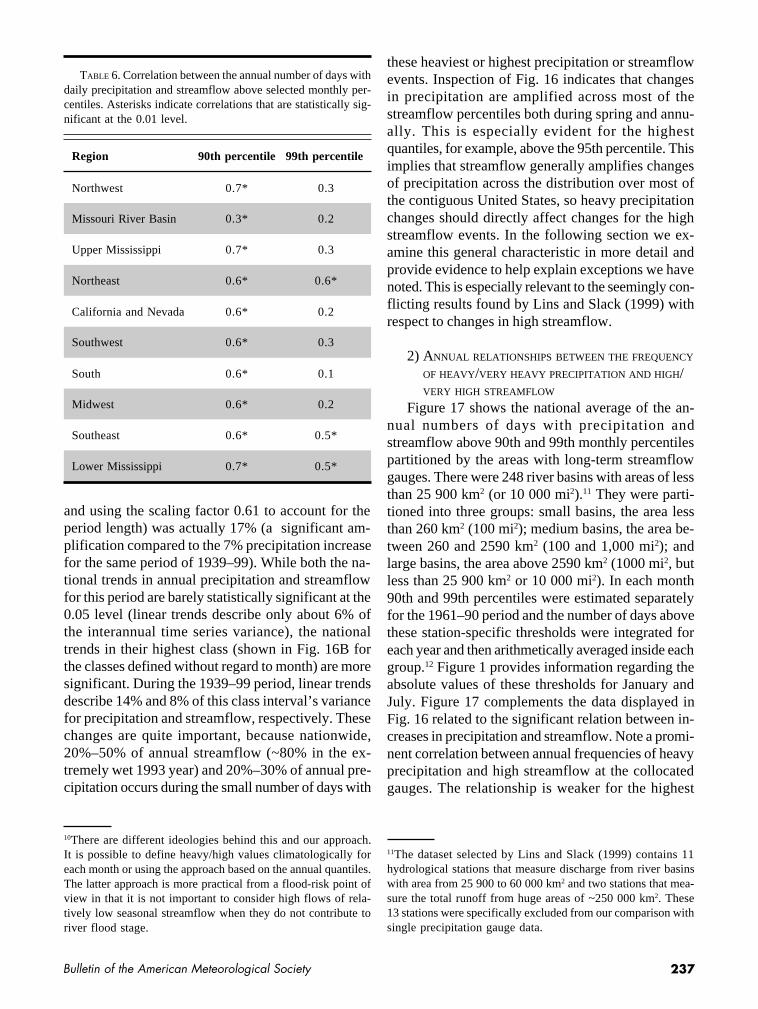
TABLE 6. Correlation between the annual number of days withdaily precipitation and streamflow above selected monthly per-centiles. Asterisks indicate correlations that are statistically sig-nificant at the 0.01 level.
Region 90th percentile 99th percentile
and using the scaling factor 0.61 to account for theperiod length) was actually 17% (a significant am-plification compared to the 7% precipitation increasefor the same period of 1939–99). While both the na-tional trends in annual precipitation and streamflowfor this period are barely statistically significant at the0.05 level (linear trends describe only about 6% ofthe interannual time series variance), the nationaltrends in their highest class (shown in Fig. 16B forthe classes defined without regard to month) are moresignificant. During the 1939–99 period, linear trendsdescribe 14% and 8% of this class interval’s variancefor precipitation and streamflow, respectively. Thesechanges are quite important, because nationwide,20%–50% of annual streamflow (~80% in the ex-tremely wet 1993 year) and 20%–30% of annual pre-cipitation occurs during the small number of days with
these heaviest or highest precipitation or streamflowevents. Inspection of Fig. 16 indicates that changesin precipitation are amplified across most of thestreamflow percentiles both during spring and annu-ally. This is especially evident for the highestquantiles, for example, above the 95th percentile. Thisimplies that streamflow generally amplifies changesof precipitation across the distribution over most ofthe contiguous United States, so heavy precipitationchanges should directly affect changes for the highstreamflow events. In the following section we ex-amine this general characteristic in more detail andprovide evidence to help explain exceptions we havenoted. This is especially relevant to the seemingly con-flicting results found by Lins and Slack (1999) withrespect to changes in high streamflow.
2) ANNUAL RELATIONSHIPS BETWEEN THE FREQUENCY
OF HEAVY/VERY HEAVY PRECIPITATION AND HIGH/VERY HIGH STREAMFLOW
Figure 17 shows the national average of the an-nual numbers of days with precipitation andstreamflow above 90th and 99th monthly percentilespartitioned by the areas with long-term streamflowgauges. There were 248 river basins with areas of lessthan 25 900 km2 (or 10 000 mi2).11 They were parti-tioned into three groups: small basins, the area lessthan 260 km2 (100 mi2); medium basins, the area be-tween 260 and 2590 km2 (100 and 1,000 mi2); andlarge basins, the area above 2590 km2 (1000 mi2, butless than 25 900 km2 or 10 000 mi2). In each month90th and 99th percentiles were estimated separatelyfor the 1961–90 period and the number of days abovethese station-specific thresholds were integrated foreach year and then arithmetically averaged inside eachgroup.12 Figure 1 provides information regarding theabsolute values of these thresholds for January andJuly. Figure 17 complements the data displayed inFig. 16 related to the significant relation between in-creases in precipitation and streamflow. Note a promi-nent correlation between annual frequencies of heavyprecipitation and high streamflow at the collocatedgauges. The relationship is weaker for the highest
11The dataset selected by Lins and Slack (1999) contains 11hydrological stations that measure discharge from river basinswith area from 25 900 to 60 000 km2 and two stations that mea-sure the total runoff from huge areas of ~250 000 km2. These13 stations were specifically excluded from our comparison withsingle precipitation gauge data.

238 Vol. 82, No. 2, February 2001
FIG. 19. Mean number of days with precipitation and streamflow exceeding the 90th percentile of daily total precipitation andmean daily streamflow each month during the year. In order to convert the number of days with precipitation to mean annualnumbers of days with precipitation (since precipitation does not occur every day), they should be scaled using the regional esti-mates of mean annual probability of days with precipitation (Table 5).
percentile and decreases for small river basins to a mar-ginal 11% of common variance. This is not surpris-
ing, because for these small river basins with an areaconsidered to be less than 260 km2 the nearby pre-
12For the annual number of days with heavy precipitation, an additional “standardization” step was performed prior to area averaging. Percentilesof precipitation were estimated only for days with precipitation. Therefore, the number of days above these percentiles are very different for wetand dry areas within each group (or region). This spatial heterogeneity forces the stations in the wet subregions to dominate in the area-averagedcounts of days with heavy precipitation. To properly weight these stations inside each group/region, each annual value at a station, i, was scaledby the factor f(i) = 365.25/NRD(i), where NRD(i), i = 1, 2, . . . n is the long-term mean annual number of rainy days at station i, during the referenceperiod of 1961–90. These rescaled values were area averaged (in this case arithmetically) and the regional mean value was then rescaled with thefactor [NRD(group/region)]−1, where NRD = Σf(i)/n.
239Bulletin of the American Meteorological Society
cipitation station within a 1° × 1° grid cell can be welloutside the basin. Very heavy rainfall (often from astrong local convective cloud system) having a typi-cal radii of correlation of several kilometers may dif-ferentially affect the weather station or the creek basin.This is less probable when we increase the area of thebasin in our correlative assessment and for “large” riverbasins where frequencies of very heavy precipitationand very high streamflow are well correlated(R2 = 0.40). Furthermore, Fig. 15 contains a substan-tial portion of small river basins in mountainous re-gions in the West, where the highest streamflow canbe of snowmelt origin.
The correlation between the very high streamflowand very heavy precipitation increases significantly,when precipitation stations are selected strictly insidethe appropriate river basins. Using the dense coopera-tive network (Fig. 15b), we found a significant increasein common variance at the national scale for each typeof river basin (Fig. 18). The results in Fig. 18 alsoshow the similarity between high and very highstreamflow and heavy and very heavy precipitation,for the eastern half of the United States. An examina-tion of Fig. 15 clearly indicates the boundaries of thisanalysis: some eastern states, for example, Minnesota,Florida, North Carolina, and Massachusetts, areunderrepresented due to the absence of long-term timeseries with daily streamflow measurements. In orderto test the robustness of the relationship in Figs. 16–18 (left-hand column), thresholds and methods of ac-counting were varied for very heavy precipitation andvery high streamflow. We selected the annual 99thpercentiles of precipitation and streamflow at each sta-tion without partitioning them into the monthly per-centiles,13 varied the upper thresholds, considered theeastern United States separately (one of these tests isshown in the right column of Fig. 18), and averagedthe maximum annual values of precipitation/streamflow over the large, medium, and small riverbasins. After these tests it became apparent that overthe contiguous United States representatively coveredwith long-term streamflow observations, that is, overthe eastern half, high and very high streamflow andheavy and very heavy precipitation covary and therelative variations in streamflow tend to be higher thanprecipitation.
c. Regional relationships1) METHOD
The quantity of century-long homogeneous dailyprecipitation time series used in this study (Fig. 15a)
does not allow selection of the neighboring precipita-tion gauges within the same streamflow catchments.Therefore, instead of a point by point intercompari-son,14 the intercomparison of regionally averaged pre-cipitation and streamflow characteristics wasimplemented. Regionally, we focused on the relation-ship between frequencies of daily heavy precipitationand daily high streamflow. The terms heavy and highat each location and month were based on a percentileapproach (e.g., Fig. 1b). We calculated the number ofdays with precipitation/streamflow above the 90th,95th, and 99th daily percentiles15 for each month andthen averaged the number of days above these per-centiles annually. The 90th percentile in streamflowoccurs on average about three times each month. The99th percentile threshold in our data implies that theregionally averaged monthly number of days withstreamflow above this threshold can be reached ap-proximately once per 3–4 yr each month. For precipi-tation, the frequency of occurrence of heavy (abovethe 90th percentile) and very heavy (above the 99thpercentile) is much less and depends upon the prob-
13The use of annual percentiles biases the assessment of heavyprecipitation toward the warm season months over most of thecontiguous United States (cf. Fig. 1b). But, in these months therunoff coefficient (ratio of runoff to precipitation) is the small-est due to high evaporation. Thus, an extraordinary winter stormmay deliver less rain (or snow water equivalent) but contrib-utes more efficiently to runoff than an average summer rain-fall. That is why the correlation between very heavy–very highstreamflow and precipitation days in Fig. 18 is stronger whenwe use monthly (instead of annual) percentiles for our intercom-parison. On the other hand, an extraordinary high streamflowanomaly during the month of low flow that is less than that or-dinary streamflow in the high flow season, while being impor-tant for ecology of the basin, may be less likely to result inflooding conditions.14This intercomparison can be actually counterproductive, be-cause the 1° vicinity does not necessarily occur in the same riverbasin.15All percentiles were calculated for the same reference periodof 1961–90. The number of days with precipitation above the90th, 95th, and 99th percentiles was scaled as it is described infootnote 11 but was not scaled back in order to preserve thesame scale in the y axes for different regions in the followingFigs. 19–23. In these figures the right y axes identify the an-nual (or monthly) number of days with streamflow above theselected thresholds, while the left axes identify the number of365 (or 28/30/31) rainy days that are above the selected thresh-olds. To calculate the annual (monthly) numbers of days withheavy (very heavy) precipitation, the values presented in thesefigures should be multiplied by the probability of rainy dayspresented in Table 5.
240 Vol. 82, No. 2, February 2001
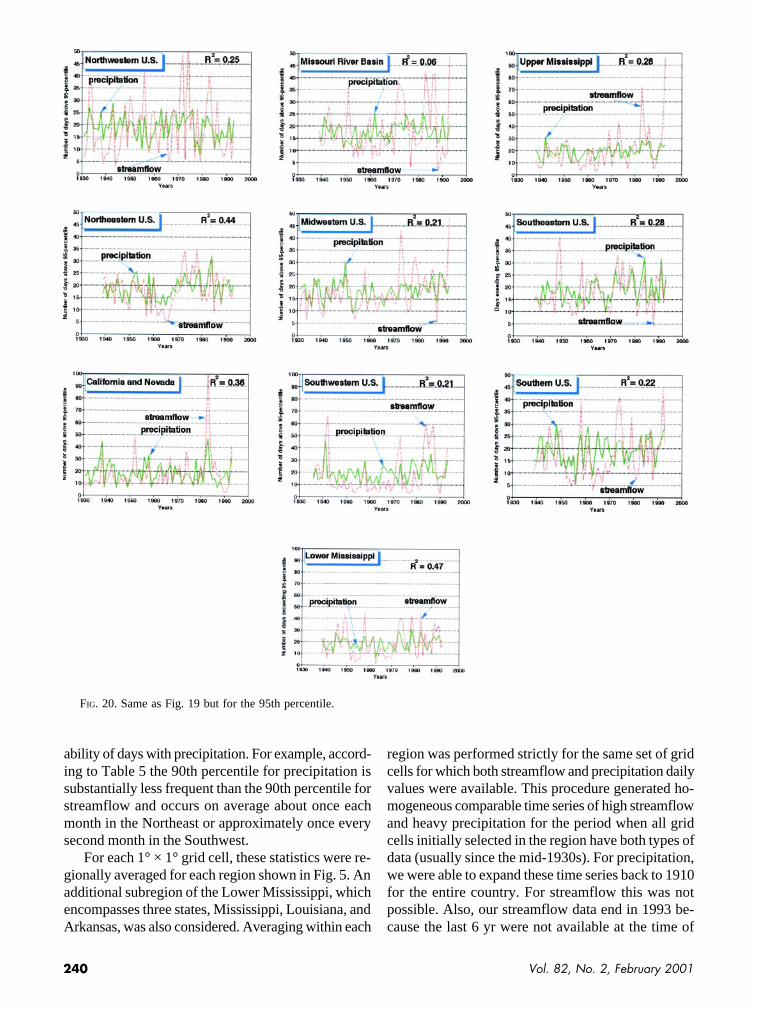
FIG. 20. Same as Fig. 19 but for the 95th percentile.
ability of days with precipitation. For example, accord-ing to Table 5 the 90th percentile for precipitation issubstantially less frequent than the 90th percentile forstreamflow and occurs on average about once eachmonth in the Northeast or approximately once everysecond month in the Southwest.
For each 1° × 1° grid cell, these statistics were re-gionally averaged for each region shown in Fig. 5. Anadditional subregion of the Lower Mississippi, whichencompasses three states, Mississippi, Louisiana, andArkansas, was also considered. Averaging within each
region was performed strictly for the same set of gridcells for which both streamflow and precipitation dailyvalues were available. This procedure generated ho-mogeneous comparable time series of high streamflowand heavy precipitation for the period when all gridcells initially selected in the region have both types ofdata (usually since the mid-1930s). For precipitation,we were able to expand these time series back to 1910for the entire country. For streamflow this was notpossible. Also, our streamflow data end in 1993 be-cause the last 6 yr were not available at the time of
241Bulletin of the American Meteorological Society
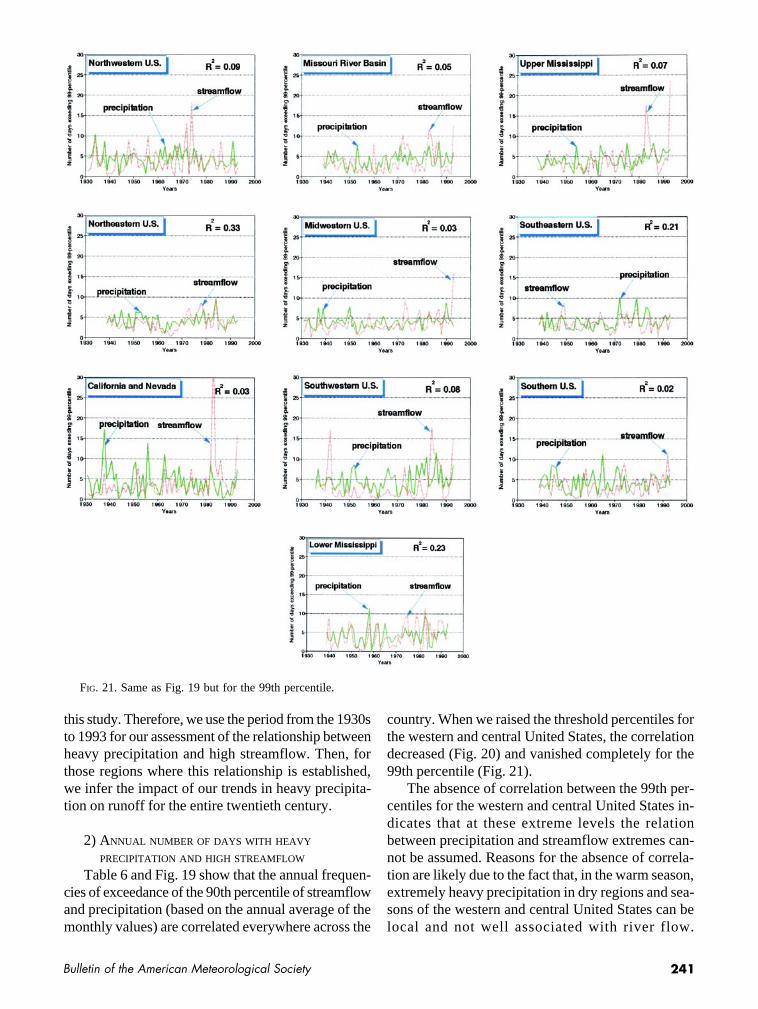
FIG. 21. Same as Fig. 19 but for the 99th percentile.
this study. Therefore, we use the period from the 1930sto 1993 for our assessment of the relationship betweenheavy precipitation and high streamflow. Then, forthose regions where this relationship is established,we infer the impact of our trends in heavy precipita-tion on runoff for the entire twentieth century.
2) ANNUAL NUMBER OF DAYS WITH HEAVY
PRECIPITATION AND HIGH STREAMFLOW
Table 6 and Fig. 19 show that the annual frequen-cies of exceedance of the 90th percentile of streamflowand precipitation (based on the annual average of themonthly values) are correlated everywhere across the
country. When we raised the threshold percentiles forthe western and central United States, the correlationdecreased (Fig. 20) and vanished completely for the99th percentile (Fig. 21).
The absence of correlation between the 99th per-centiles for the western and central United States in-dicates that at these extreme levels the relationbetween precipitation and streamflow extremes can-not be assumed. Reasons for the absence of correla-tion are likely due to the fact that, in the warm season,extremely heavy precipitation in dry regions and sea-sons of the western and central United States can belocal and not well associated with river flow.

242 Vol. 82, No. 2, February 2001
Northwest 0.13 0.10
Missouri River Basin 0.05 0.12
Upper Mississippi 0.09 0.14
Northeast 0.37* 0.58*
California and Nevada 0.35* 0.16
Southwest 0.44* 0.12
South 0.00 0.12
Midwest 0.56* 0.48*
Southeast 0.77* 0.48*
Lower Mississippi 0.68* 0.16
(0.64* for the 95th percentile)
TABLE 7. Correlation between the number of days with daily precipitationand streamflow above the 90th and 99th percentiles during the month with maxi-mum runoff. Asterisks reflect statistical significance at the 0.01 level.
Region 90th percentiles 99th percentiles
Additionally, the small amount of streamflow data andsmall radii of correlation for convective heavy pre-cipitation make one or both of our time series unrep-resentative for area-averaged precipitation/streamflowfrequency in some of the regions. Also, a significantportion of extreme streamflow in the western and cen-tral United States is related to snowmelt. Trends insnowmelt are not necessarily related to heavy/extremeprecipitation changes. These explanations are not ap-plicable to the northeast and southeast United Statesand Lower Mississippi Valley where there are moreextensive data and snowmelt trends are small. As aresult, over the eastern regions the correlation betweenannual frequency of very heavy precipitation and veryhigh streamflow is significant. The same is true forthe Lower Mississippi region. So, for the eastern thirdof the United States, we can demonstrate that theinterannual/interdecadal variability of mean annualheavy events of streamflow and precipitation is rea-sonably well correlated. Without more data it is notpossible to show this for the central United States.
3) NUMBER OF DAYS WITH DAILY HEAVY
PRECIPITATION AND HIGH STREAMFLOW
DURING THE MONTH OF MAXIMUM
STREAMFLOW
It is unlikely that there would be astrong correlation between concomitantmonthly anomalies of total precipitationand streamflow in regions where a sig-nificant proportion of runoff occurs fromsnowmelt during the month of maximumstreamflow. Neither should we expect ahigh correlation between frequencies ofdaily heavy precipitation and highstreamflow events. Table 7 supports thisnotion. Among six regions of the north-ern and western United States, in thethree most northwestern regions, theNorthwest, the Missouri River Basin, andthe Upper Mississippi, even the correla-tion between the number of days withprecipitation and streamflow above the90th percentile during the month of maxi-mum streamflow is not significant. In thethree other regions, the Northeast, West,and Southwest, 12%–19% of joint vari-ance is explained during the month ofmaximum streamflow (Table 7).
Only in one of these six regions, theNortheast, is the correlation for the 99th
percentile threshold statistically significant at the 0.01level. Three features distinguished this region fromthe others. First, the period of maximum streamflow(Mar–Apr) is uniform for the entire region (except thenorthernmost part of Maine where maximum stream-flow is observed in May). Second, the date of snowcover disappearance was not appreciably changed.Most importantly, frozen precipitation does not remainon the ground continuously through the cold season,and snow is not a large part of the cold season pre-cipitation over the southern half of this region wheremost of our streamflow gauge sites are located. There-fore, we can expect that in this time of the year a largerportion (compared to other northern and western re-gions) of heavy and very heavy precipitation eventsare immediately available to contribute to the high flowevents. Finally, the Northeast is well covered by ourdata (Fig. 15).
In two other regions, the Midwest and Southeast,a strong correlation at the 90th percentile and signifi-cant correlations at the 99th percentile during themonth of maximum streamflow were found (Figs. 22
243Bulletin of the American Meteorological Society
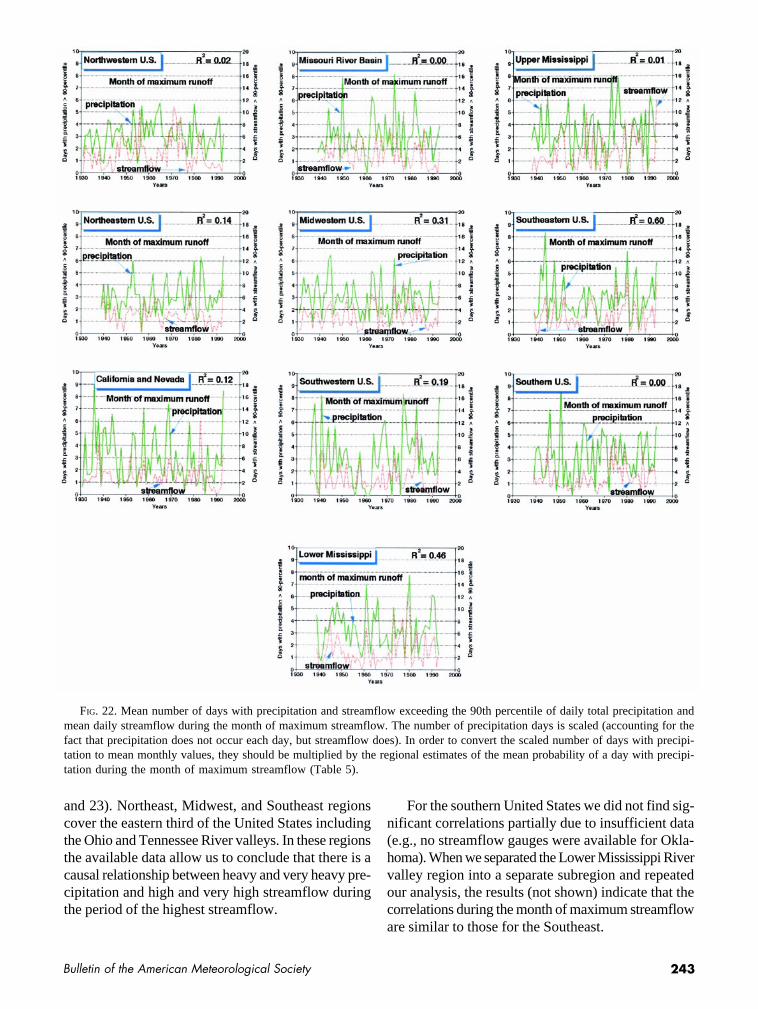
FIG. 22. Mean number of days with precipitation and streamflow exceeding the 90th percentile of daily total precipitation andmean daily streamflow during the month of maximum streamflow. The number of precipitation days is scaled (accounting for thefact that precipitation does not occur each day, but streamflow does). In order to convert the scaled number of days with precipi-tation to mean monthly values, they should be multiplied by the regional estimates of the mean probability of a day with precipi-tation during the month of maximum streamflow (Table 5).
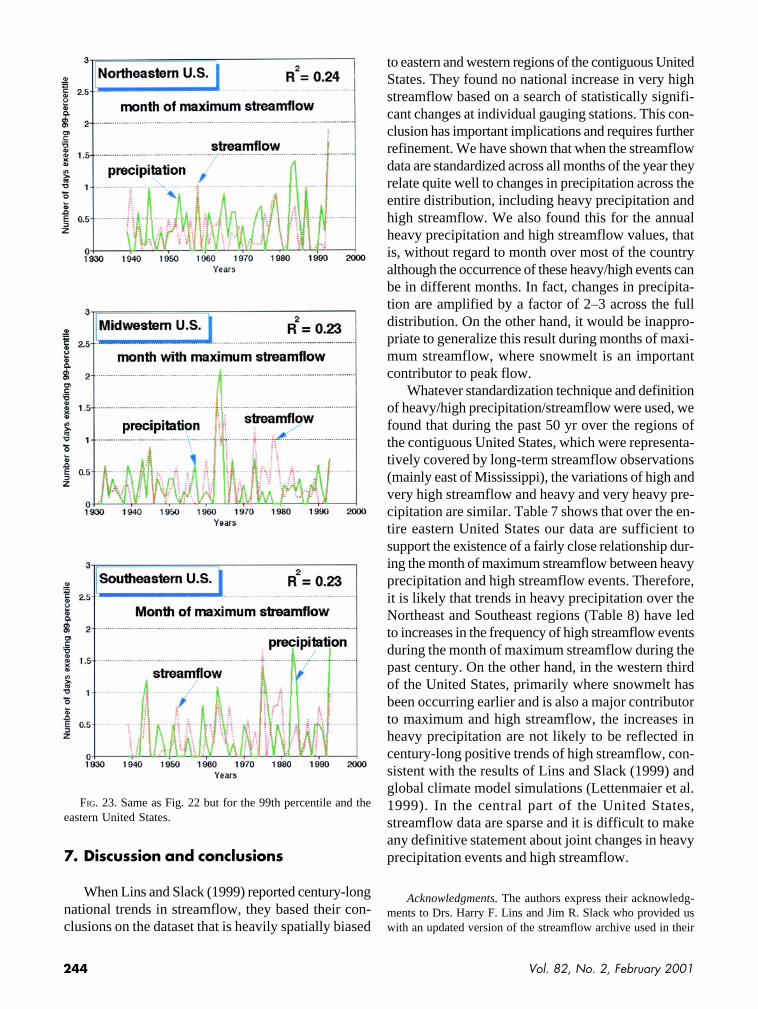
and 23). Northeast, Midwest, and Southeast regionscover the eastern third of the United States includingthe Ohio and Tennessee River valleys. In these regionsthe available data allow us to conclude that there is acausal relationship between heavy and very heavy pre-cipitation and high and very high streamflow duringthe period of the highest streamflow.
For the southern United States we did not find sig-nificant correlations partially due to insufficient data(e.g., no streamflow gauges were available for Okla-homa). When we separated the Lower Mississippi Rivervalley region into a separate subregion and repeatedour analysis, the results (not shown) indicate that thecorrelations during the month of maximum streamfloware similar to those for the Southeast.
244 Vol. 82, No. 2, February 2001
7. Discussion and conclusions
When Lins and Slack (1999) reported century-longnational trends in streamflow, they based their con-clusions on the dataset that is heavily spatially biased
to eastern and western regions of the contiguous UnitedStates. They found no national increase in very highstreamflow based on a search of statistically signifi-cant changes at individual gauging stations. This con-clusion has important implications and requires furtherrefinement. We have shown that when the streamflowdata are standardized across all months of the year theyrelate quite well to changes in precipitation across theentire distribution, including heavy precipitation andhigh streamflow. We also found this for the annualheavy precipitation and high streamflow values, thatis, without regard to month over most of the countryalthough the occurrence of these heavy/high events canbe in different months. In fact, changes in precipita-tion are amplified by a factor of 2–3 across the fulldistribution. On the other hand, it would be inappro-priate to generalize this result during months of maxi-mum streamflow, where snowmelt is an importantcontributor to peak flow.
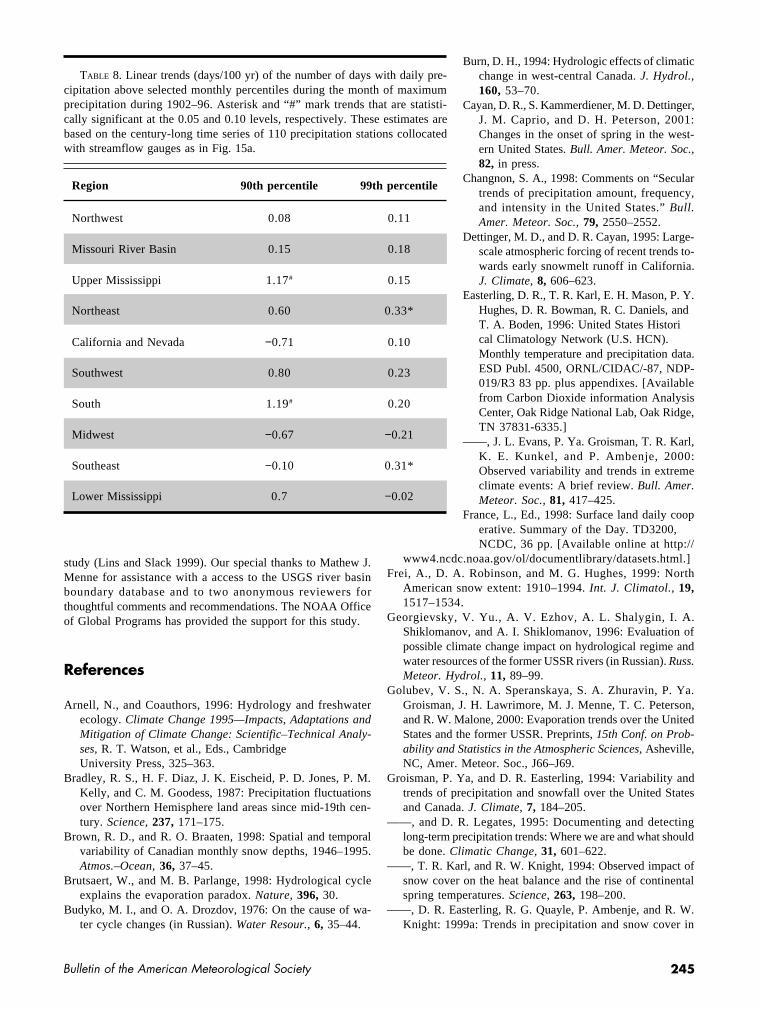
Whatever standardization technique and definitionof heavy/high precipitation/streamflow were used, wefound that during the past 50 yr over the regions ofthe contiguous United States, which were representa-tively covered by long-term streamflow observations(mainly east of Mississippi), the variations of high andvery high streamflow and heavy and very heavy pre-cipitation are similar. Table 7 shows that over the en-tire eastern United States our data are sufficient tosupport the existence of a fairly close relationship dur-ing the month of maximum streamflow between heavyprecipitation and high streamflow events. Therefore,it is likely that trends in heavy precipitation over theNortheast and Southeast regions (Table 8) have ledto increases in the frequency of high streamflow eventsduring the month of maximum streamflow during thepast century. On the other hand, in the western thirdof the United States, primarily where snowmelt hasbeen occurring earlier and is also a major contributorto maximum and high streamflow, the increases inheavy precipitation are not likely to be reflected incentury-long positive trends of high streamflow, con-sistent with the results of Lins and Slack (1999) andglobal climate model simulations (Lettenmaier et al.1999). In the central part of the United States,streamflow data are sparse and it is difficult to makeany definitive statement about joint changes in heavyprecipitation events and high streamflow.
Acknowledgments. The authors express their acknowledg-ments to Drs. Harry F. Lins and Jim R. Slack who provided uswith an updated version of the streamflow archive used in their
FIG. 23. Same as Fig. 22 but for the 99th percentile and theeastern United States.
245Bulletin of the American Meteorological Society
study (Lins and Slack 1999). Our special thanks to Mathew J.Menne for assistance with a access to the USGS river basinboundary database and to two anonymous reviewers forthoughtful comments and recommendations. The NOAA Officeof Global Programs has provided the support for this study.
References
Arnell, N., and Coauthors, 1996: Hydrology and freshwaterecology. Climate Change 1995—Impacts, Adaptations andMitigation of Climate Change: Scientific–Technical Analy-ses, R. T. Watson, et al., Eds., CambridgeUniversity Press, 325–363.
Bradley, R. S., H. F. Diaz, J. K. Eischeid, P. D. Jones, P. M.Kelly, and C. M. Goodess, 1987: Precipitation fluctuationsover Northern Hemisphere land areas since mid-19th cen-tury. Science, 237, 171–175.
Brown, R. D., and R. O. Braaten, 1998: Spatial and temporalvariability of Canadian monthly snow depths, 1946–1995.Atmos.–Ocean, 36, 37–45.
Brutsaert, W., and M. B. Parlange, 1998: Hydrological cycleexplains the evaporation paradox. Nature, 396, 30.
Budyko, M. I., and O. A. Drozdov, 1976: On the cause of wa-ter cycle changes (in Russian). Water Resour., 6, 35–44.
Burn, D. H., 1994: Hydrologic effects of climaticchange in west-central Canada. J. Hydrol.,160, 53–70.
Cayan, D. R., S. Kammerdiener, M. D. Dettinger,J. M. Caprio, and D. H. Peterson, 2001:Changes in the onset of spring in the west-ern United States. Bull. Amer. Meteor. Soc.,82, in press.
Changnon, S. A., 1998: Comments on “Seculartrends of precipitation amount, frequency,and intensity in the United States.” Bull.Amer. Meteor. Soc., 79, 2550–2552.
Dettinger, M. D., and D. R. Cayan, 1995: Large-scale atmospheric forcing of recent trends to-wards early snowmelt runoff in California.J. Climate, 8, 606–623.
Easterling, D. R., T. R. Karl, E. H. Mason, P. Y.Hughes, D. R. Bowman, R. C. Daniels, andT. A. Boden, 1996: United States Historical Climatology Network (U.S. HCN).Monthly temperature and precipitation data.ESD Publ. 4500, ORNL/CIDAC/-87, NDP-019/R3 83 pp. plus appendixes. [Availablefrom Carbon Dioxide information AnalysisCenter, Oak Ridge National Lab, Oak Ridge,TN 37831-6335.]
——, J. L. Evans, P. Ya. Groisman, T. R. Karl,K. E. Kunkel, and P. Ambenje, 2000:Observed variability and trends in extremeclimate events: A brief review. Bull. Amer.Meteor. Soc., 81, 417–425.
France, L., Ed., 1998: Surface land daily cooperative. Summary of the Day. TD3200,NCDC, 36 pp. [Available online at http://
www4.ncdc.noaa.gov/ol/documentlibrary/datasets.html.]Frei, A., D. A. Robinson, and M. G. Hughes, 1999: North
American snow extent: 1910–1994. Int. J. Climatol., 19,1517–1534.
Georgievsky, V. Yu., A. V. Ezhov, A. L. Shalygin, I. A.Shiklomanov, and A. I. Shiklomanov, 1996: Evaluation ofpossible climate change impact on hydrological regime andwater resources of the former USSR rivers (in Russian). Russ.Meteor. Hydrol., 11, 89–99.
Golubev, V. S., N. A. Speranskaya, S. A. Zhuravin, P. Ya.Groisman, J. H. Lawrimore, M. J. Menne, T. C. Peterson,and R. W. Malone, 2000: Evaporation trends over the UnitedStates and the former USSR. Preprints, 15th Conf. on Prob-ability and Statistics in the Atmospheric Sciences, Asheville,NC, Amer. Meteor. Soc., J66–J69.
Groisman, P. Ya, and D. R. Easterling, 1994: Variability andtrends of precipitation and snowfall over the United Statesand Canada. J. Climate, 7, 184–205.
——, and D. R. Legates, 1995: Documenting and detectinglong-term precipitation trends: Where we are and what shouldbe done. Climatic Change, 31, 601–622.
——, T. R. Karl, and R. W. Knight, 1994: Observed impact ofsnow cover on the heat balance and the rise of continentalspring temperatures. Science, 263, 198–200.
——, D. R. Easterling, R. G. Quayle, P. Ambenje, and R. W.Knight: 1999a: Trends in precipitation and snow cover in
Northwest 0.08 0.11
Missouri River Basin 0.15 0.18
Upper Mississippi 1.17# 0.15
Northeast 0.60 0.33*
California and Nevada −0.71 0.10
Southwest 0.80 0.23
South 1.19# 0.20
Midwest −0.67 −0.21
Southeast −0.10 0.31*
Lower Mississippi 0.7 −0.02
TABLE 8. Linear trends (days/100 yr) of the number of days with daily pre-cipitation above selected monthly percentiles during the month of maximumprecipitation during 1902–96. Asterisk and “#” mark trends that are statisti-cally significant at the 0.05 and 0.10 levels, respectively. These estimates arebased on the century-long time series of 110 precipitation stations collocatedwith streamflow gauges as in Fig. 15a.
Region 90th percentile 99th percentile

246 Vol. 82, No. 2, February 2001
the United States. Potential Consequences of Climate Vari-ability and Change to Water Resources of the United States,D. B. Adams, Ed., Amer. Water Resourc. Assoc., 89–92.
——, P. Ambenje, T. R. Karl, D. R. Easterling, R. W. Knight,P. F. Jamason, K. J. Hennessy, R. Suppiah, C. M. Page, J.Wibig, K. Fortuniak, V. N. Razuvaev, A. Douglas, E.Førland, and P.-M. Zhai, 1999b: Changes in the probabilityof heavy precipitation. Preprints, 10th Symp. on GlobalChange Studies, Dallas, TX, Amer. Meteor. Soc., 131–134.
——, T. R. Karl, D. R. Easterling, R. W. Knight, P. F. Jamason,K. J. Hennessy, R. Suppiah, C. M. Page, J. Wibig, K.Fortuniak, V. N. Razuvaev, A. Douglas, E. Førland, and P.-M. Zhai, 1999c: Changes in the probability of heavy pre-cipitation: Important indicators of climatic change. ClimaticChange, 42, 243–283.
Guttman, N. B., and R. G. Quayle, 1996: A historical perspec-tive of U.S. climate divisions. Bull. Amer. Meteor. Soc., 77,293–303.
Houghton, J. T., L. G. Meira Filho, B. A. Callendar, N. Harris,A. Kattenberg, and K. Maskell, Eds., 1996: ClimateChange 1995: The Science of Climate Change. The Sec-ond IPCC Scientific Assessment. Cambridge UniversityPress, 572 pp.
Hughes, P. Y., E. H. Mason, T. R. Karl, and W. A. Brower, 1992:United States Historical Climatology Network Daily Tem-perature and Precipitation Data. ESD Publ. 3778, ORNL/CDIAC-50, NDP-042, 54 pp. plus appendixes. [Availablefrom Carbon Dioxide Information Data Center, Oak RidgeNational Lab, Oak Ridge, TN 37831–6335.]
Iwashima, T., and R. Yamamoto, 1993: A statistical analysis ofthe extreme events: Long-term trend of heavy daily precipi-tation. J. Meteor. Soc. Japan, 71, 637–640.
Johnson, T., J. Dozier, and J. Michaelsen, 1999: Climate changeand Sierra Nevada snowpack. IAHS Publ., 256, 63–70.
Karl, T. R., and W. E. Riebsame, 1989: The impact of decadalfluctuations in mean precipitation and temperature on run-off: A sensitivity study over the United States. ClimaticChange, 15, 423–447.
——, and R. W. Knight, 1998: Secular trends of precipitationamount, frequency, and intensity in the USA. Bull. Amer.Meteor. Soc., 79, 231–241.
——, ——, D. R. Easterling, and R. G. Quayle, 1996: Indicesof climatic change for the United States. Bull. Amer. Meteor.Soc., 77, 279–292.
Kunkel, K., K. Andsager, and D. R. Easterling, 1999a: Trendsin heavy precipitation events over the continental UnitedStates. J. Climate, 12, 2515–2527.
Kunkel, K., R. A. Pielke Jr., and S. A. Changnon, 1999b:Temporal fluctuations in weather and climate extremes thatcause economic and human health impact: A review. Bull.Amer. Meteor. Soc., 80, 1077–1098.
Lettenmaier, D. P., E. F. Wood, and J. R. Wallis, 1994:Hydroclimatological trends in the continental United States,1948–88. J. Climate, 7, 586–607.
——, A. W. Wood, R. N. Palmer, E. F. Wood, and E. Z.Stakhiv, 1999: Water resources implications of globalwarming: A U.S. regional perspective. Climatic Change,43, 537–579.
Lins, H. F., and P. J. Michaels, 1994: Increasing U.S. streamflowlinked to greenhouse forcing. Eos, Trans. Amer. Geophys.Union, 75, 284–285.
——, and J. R. Slack, 1999: Streamflow trends in the UnitedStates. Geophys. Res. Lett., 26, 227–230.
Manabe, S., R. T. Wetherald, and R. J. Stouffer, 1981: Summerdryness due to increase of atmospheric CO
2 concentration.
Climatic Change, 3, 347–386.NCDC, 1998: Snow Cover Climatology. CD ROM. [Available
from National Climatic Data Center, 151 Patton Ave.,Asheville, NC 28801.]
Nicholls, N., and W. Murray, 1999: Workshop on indices andindicators for climatic extremes: Asheville, NC, USA, 3–6June 1997—Breakout group B; precipitation. ClimateChange, 42, 23–29.
Peterson, T. C., V. S. Golubev, and P. Ya. Groisman, 1995:Evaporation losing its strength. Nature, 377, 687–688.
Pielke, R. A., Jr., and M. W. Downton, 1999: U.S. trends instreamflow and precipitation: Using societal impact data toaddress an apparent paradox. Bull. Amer. Meteor. Soc., 80,1435–1436.
Slack, J. R., and J. M. Landwehr, 1992: Hydro-climatic datanetwork: A U.S. Geological Survey streamflow data set forthe United States for the study of climate variations, 1874–1988. U.S. Geological Survey Open-file Rep. 92-129, CDROM. [Available from U. S. Geological Survey, 415 NationalCenter, Reston, VA 20192.]
Wigley T. M. L., P. D. Jones, and P. M. Kelly, 1980: Scenariofor a warm high-CO
2 world. Nature, 283, 17–21.