Embed Size (px)
Citation preview
1
Heavy Oil
Gems
TSX:PXX; OMX:PXXS
November 2010
www.blackpearlresources.ca
2
Introduction
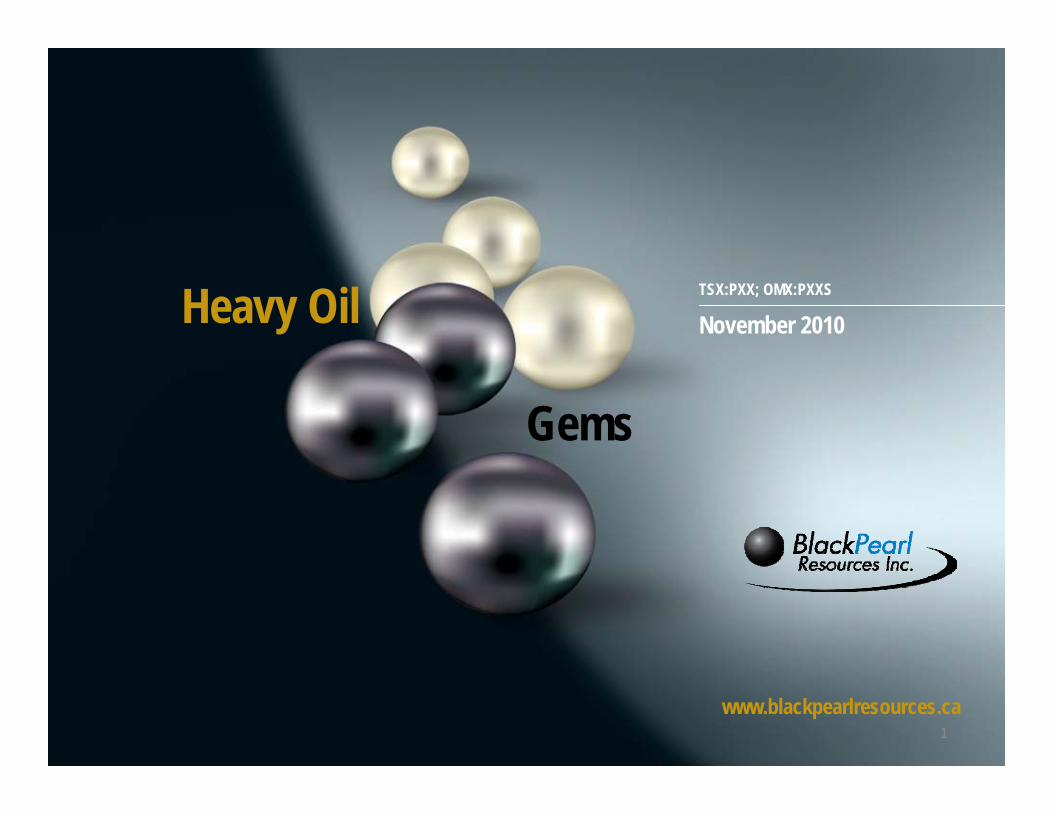
Corporate:Symbol: PXX, PXXSExchanges: TSX, OMXShares Outstanding (MM): Basic (1) 282.9 Fully Diluted(options & warrants) (1) 308.1Current Share Price ($/share):* 5.05Market Capitalization ($MM) (1): 1,429Management ownership (1) 7%/11%Financial:Working Capital ($MM):** (1) 140Debt ($MM):** 0.0Operational:Current Production (boe/day) 6,800 2P Reserves (mm) *** 23.62C Resource (mm) **** 749.0Trading Volumes (3 mon daily Avg)Canada (TSX) 883,000Sweden (OMX) 510,000Total 1,393,000
* as at November 18, 2010; **as at September 30, 2010 *** as at Dec 31, 2009; **** as at Sept 30, 2010
Focus is heavy oil
Exposure to long life oil reserves
Conservative financial structure
Significant management ownership
Independent reserve and resource assessments support 80,000 Bbl/d
Overview
(1) Assumes closing of recent financing
33
Why Heavy Oil?
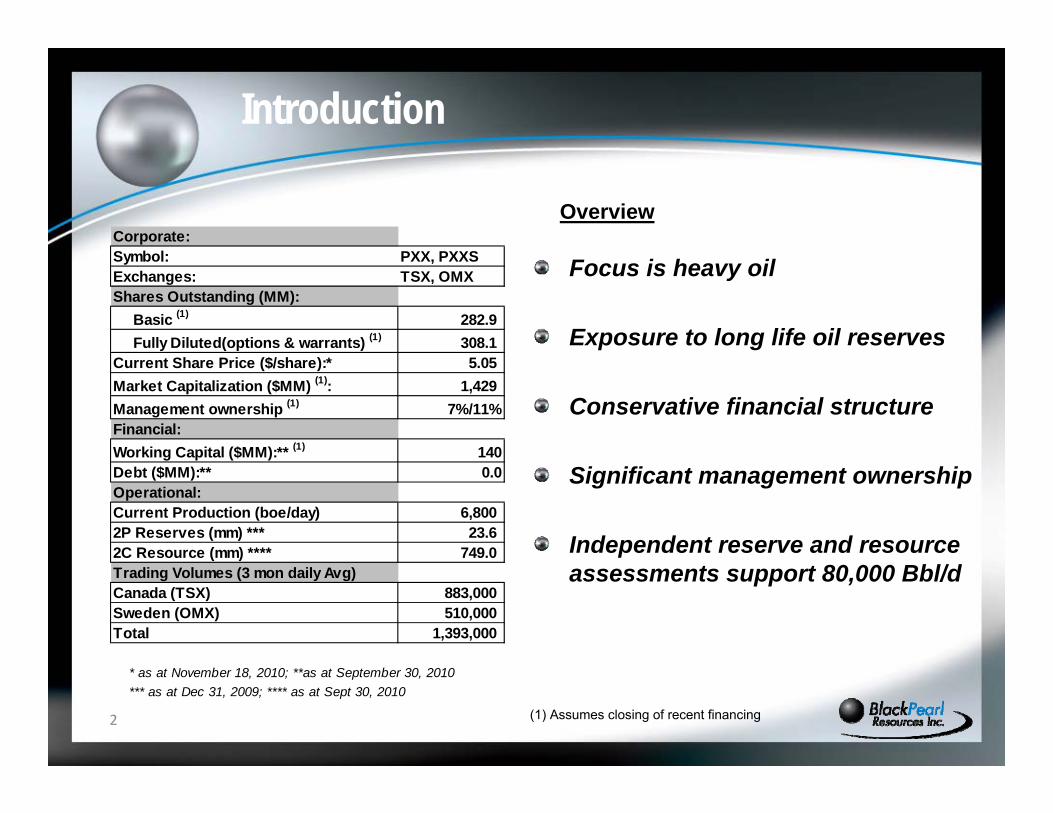
Heavy oil is a high cost barrel due to the energy and equipment needs for extraction
Heavy oil trades at a discount to light oil
High cost and lower price creates a margin squeeze. Our strategy is to be a low cost operator with a conservative financial plan
The upside is that there are vast amounts of heavy oil and oil sands with long life reserves
The key is to understand what can be extracted economically with current technology and current pricing
Understanding the resource subtleties and the right extraction technology are keys to success
EDMONTON
CALGARY
4
Recent developments
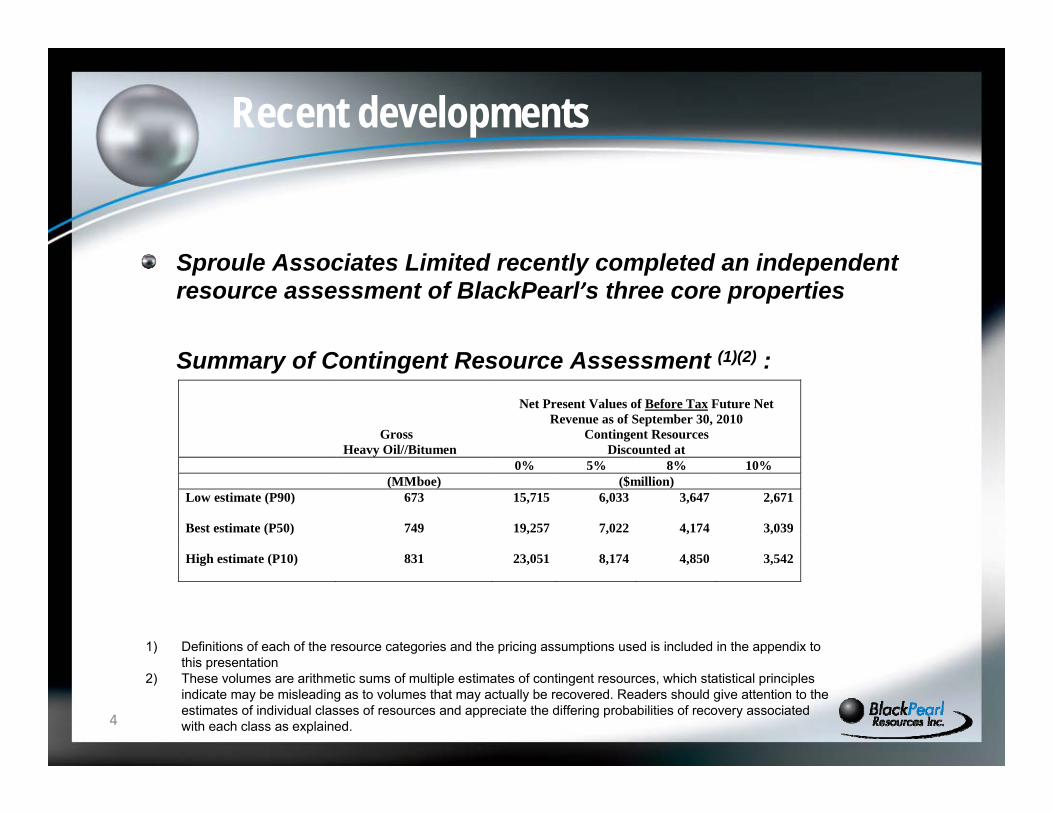
Gross Heavy Oil//Bitumen
Net Present Values of Before Tax Future Net
Revenue as of September 30, 2010 Contingent Resources
Discounted at 0% 5% 8% 10% (MMboe) ($million) Low estimate (P90) 673 15,715 6,033 3,647 2,671 Best estimate (P50) 749 19,257 7,022 4,174 3,039 High estimate (P10) 831 23,051 8,174 4,850 3,542
Sproule Associates Limited recently completed an independent resource assessment of BlackPearl’s three core properties
Summary of Contingent Resource Assessment (1)(2) :
1) Definitions of each of the resource categories and the pricing assumptions used is included in the appendix to this presentation
2) These volumes are arithmetic sums of multiple estimates of contingent resources, which statistical principles indicate may be misleading as to volumes that may actually be recovered. Readers should give attention to the estimates of individual classes of resources and appreciate the differing probabilities of recovery associated with each class as explained.
5
Core Areas
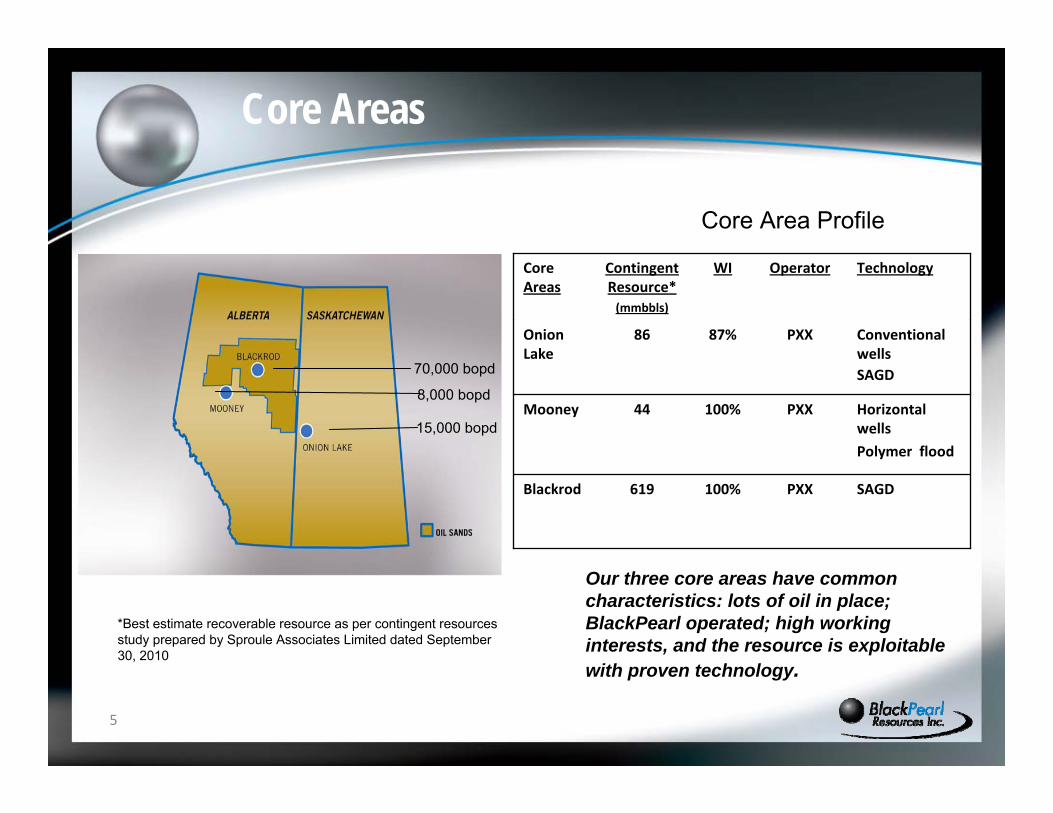
8,000 bopd
15,000 bopd
70,000 bopd
SAGDPXX100%619Blackrod
Horizontal wells
Polymer flood
PXX100%44Mooney
Conventional wellsSAGD
PXX87%86Onion Lake
TechnologyOperatorWIContingentResource*(mmbbls)
Core Areas
Our three core areas have common characteristics: lots of oil in place; BlackPearl operated; high working interests, and the resource is exploitable with proven technology.
Core Area Profile
*Best estimate recoverable resource as per contingent resources study prepared by Sproule Associates Limited dated September 30, 2010
66
Onion Lake
ALBERTA SASKATCHEWAN
ONION LAKE
OIL SANDS
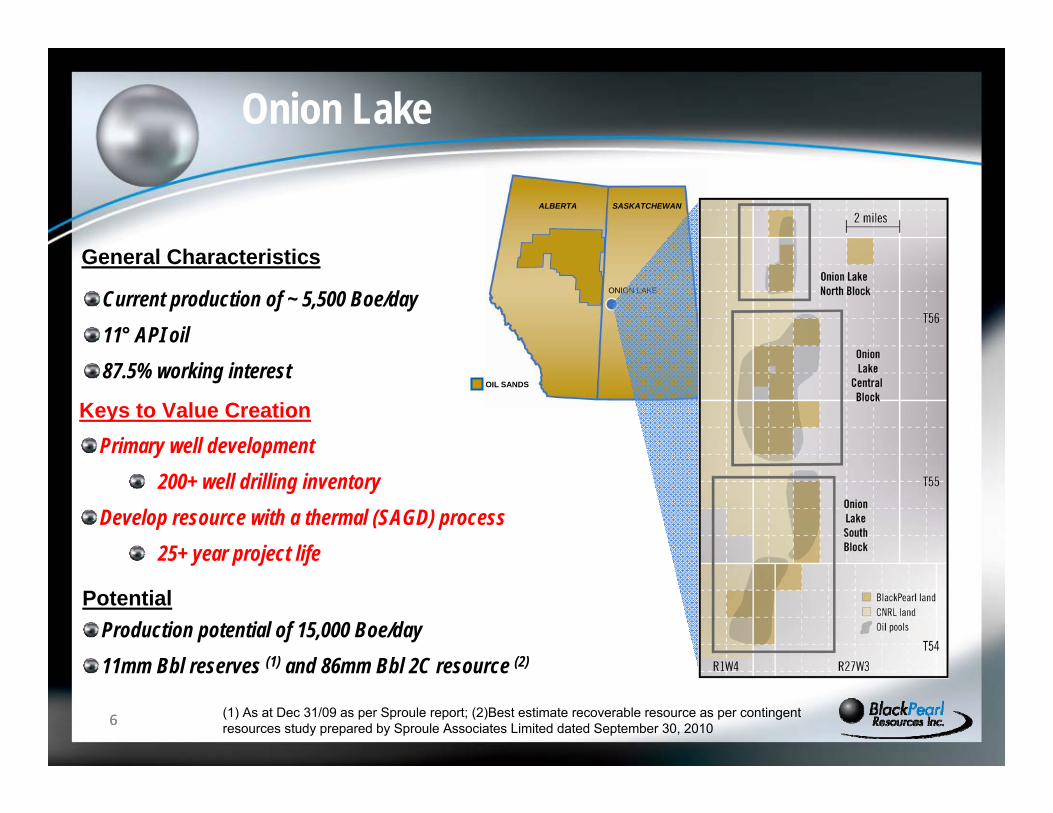
General Characteristics
Current production of ~ 5,500 Boe/day11° API oil87.5% working interest
Production potential of 15,000 Boe/day11mm Bbl reserves (1) and 86mm Bbl 2C resource (2)
Primary well development200+ well drilling inventory
Develop resource with a thermal (SAGD) process25+ year project life
Keys to Value Creation
Potential
(1) As at Dec 31/09 as per Sproule report; (2)Best estimate recoverable resource as per contingent resources study prepared by Sproule Associates Limited dated September 30, 2010
7
Onion Lake
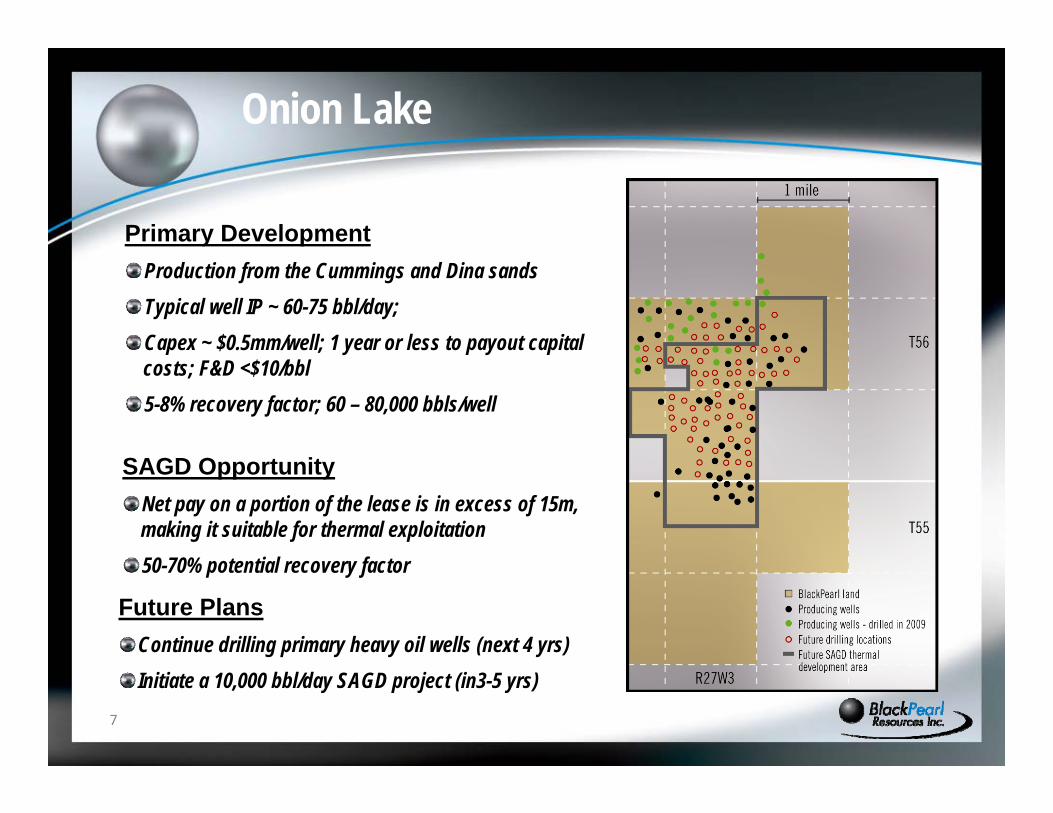
Primary DevelopmentProduction from the Cummings and Dina sandsTypical well IP ~ 60-75 bbl/day;Capex ~ $0.5mm/well; 1 year or less to payout capital costs; F&D <$10/bbl5-8% recovery factor; 60 – 80,000 bbls/well
SAGD OpportunityNet pay on a portion of the lease is in excess of 15m, making it suitable for thermal exploitation 50-70% potential recovery factor
Future PlansContinue drilling primary heavy oil wells (next 4 yrs)Initiate a 10,000 bbl/day SAGD project (in3-5 yrs)
88
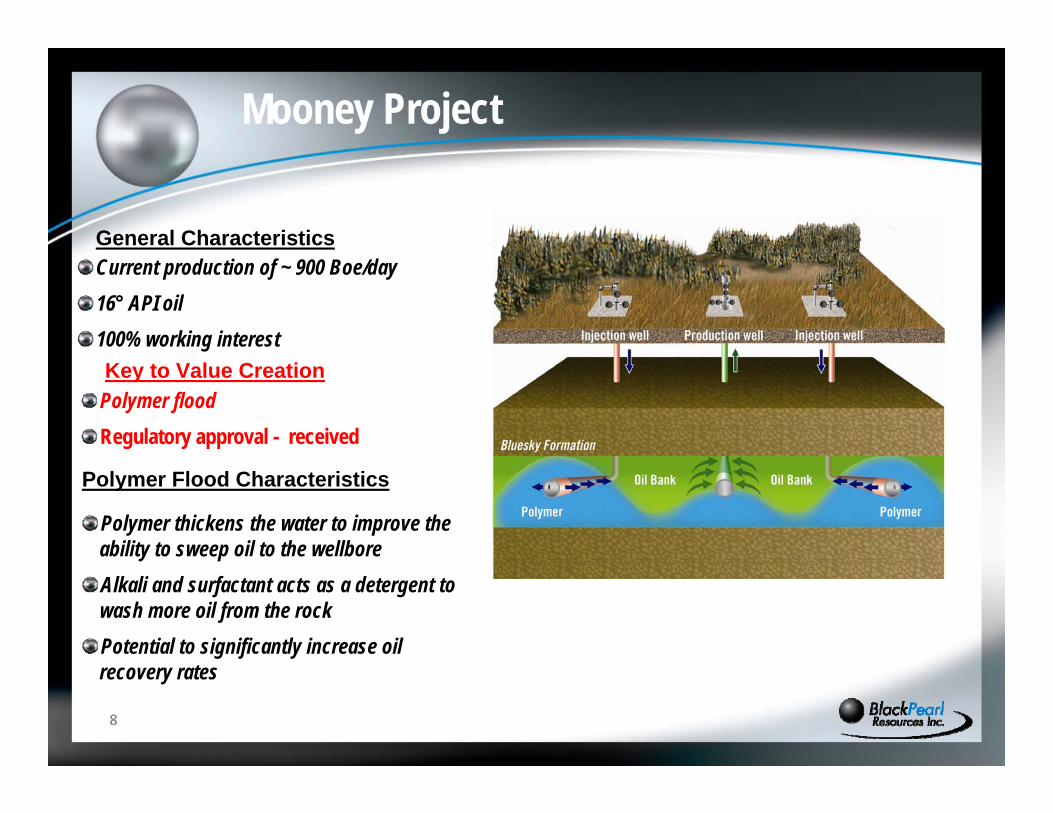
Mooney Project
General CharacteristicsCurrent production of ~ 900 Boe/day16° API oil100% working interestKey to Value Creation
Polymer floodRegulatory approval - received
Polymer Flood Characteristics
Polymer thickens the water to improve the ability to sweep oil to the wellboreAlkali and surfactant acts as a detergent to wash more oil from the rockPotential to significantly increase oil recovery rates
99
Mooney Project
ALBERTA SASKATCHEWAN
MOONEY
OIL SANDS
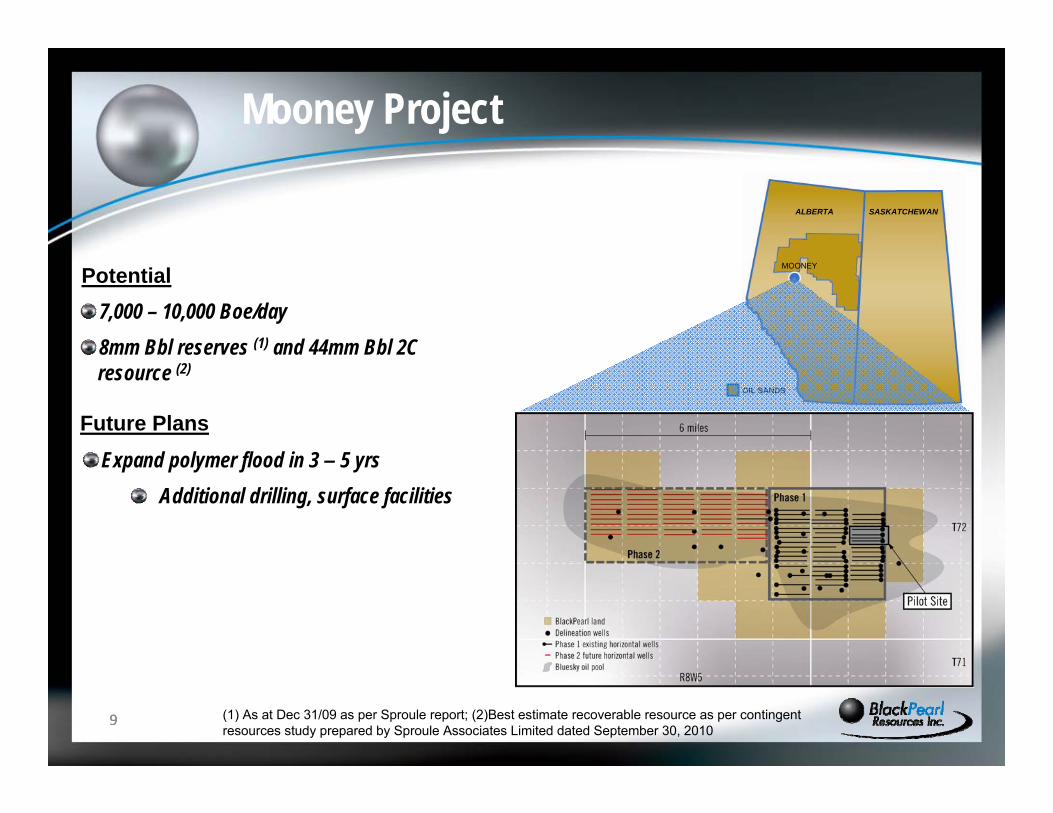
Potential7,000 – 10,000 Boe/day8mm Bbl reserves (1) and 44mm Bbl 2C resource (2)
Future Plans
Expand polymer flood in 3 – 5 yrsAdditional drilling, surface facilities
(1) As at Dec 31/09 as per Sproule report; (2)Best estimate recoverable resource as per contingent resources study prepared by Sproule Associates Limited dated September 30, 2010
1010
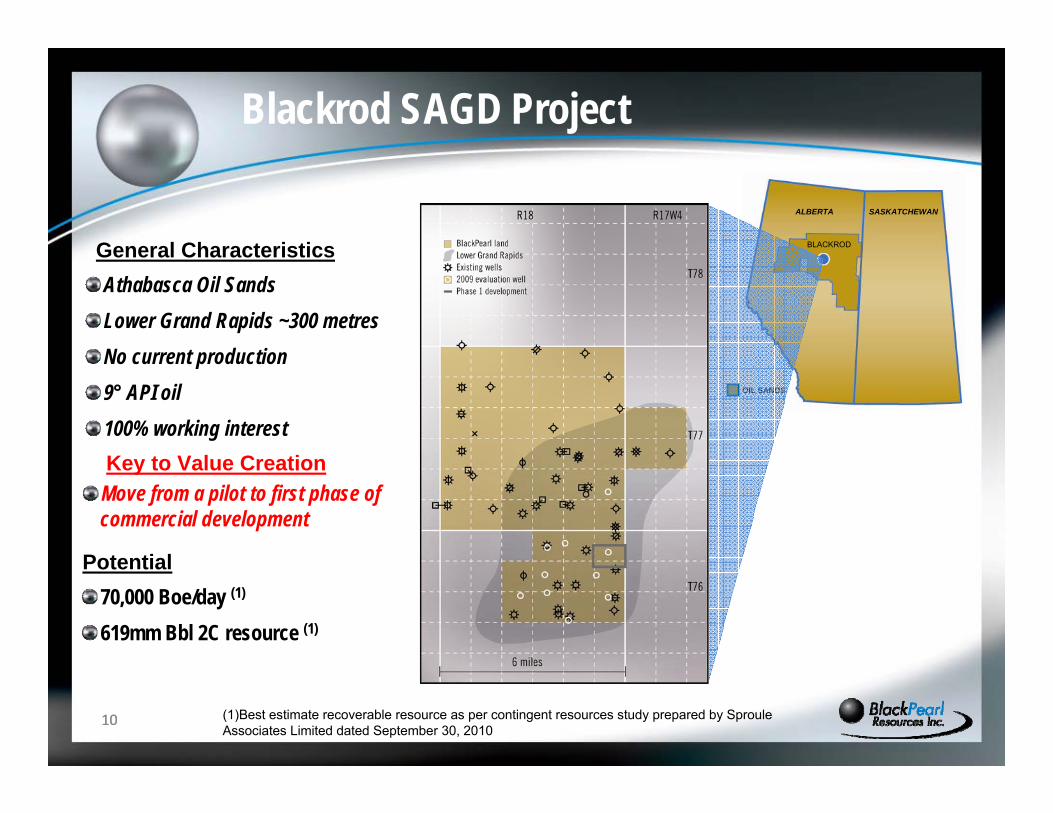
Blackrod SAGD Project
ALBERTA SASKATCHEWAN
BLACKROD
OIL SANDS
General CharacteristicsAthabasca Oil SandsLower Grand Rapids ~300 metresNo current production9° API oil100% working interest
Potential70,000 Boe/day (1)
619mm Bbl 2C resource (1)
Key to Value CreationMove from a pilot to first phase of commercial development
(1)Best estimate recoverable resource as per contingent resources study prepared by Sproule Associates Limited dated September 30, 2010
11
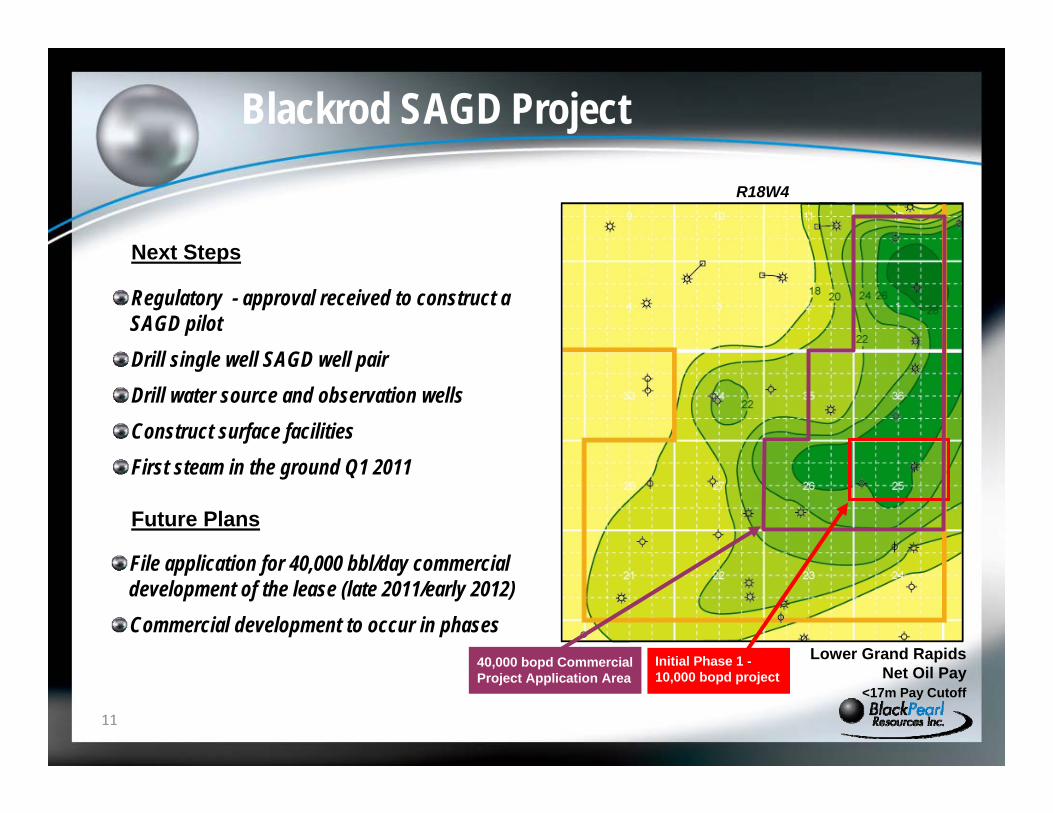
Blackrod SAGD Project
Regulatory - approval received to construct a SAGD pilot Drill single well SAGD well pairDrill water source and observation wellsConstruct surface facilitiesFirst steam in the ground Q1 2011
Next Steps
File application for 40,000 bbl/day commercial development of the lease (late 2011/early 2012)Commercial development to occur in phases
Future Plans
<17m Pay Cutoff
R18W4
Lower Grand RapidsNet Oil Pay
Initial Phase 1 -10,000 bopd project
40,000 bopd Commercial Project Application Area
12
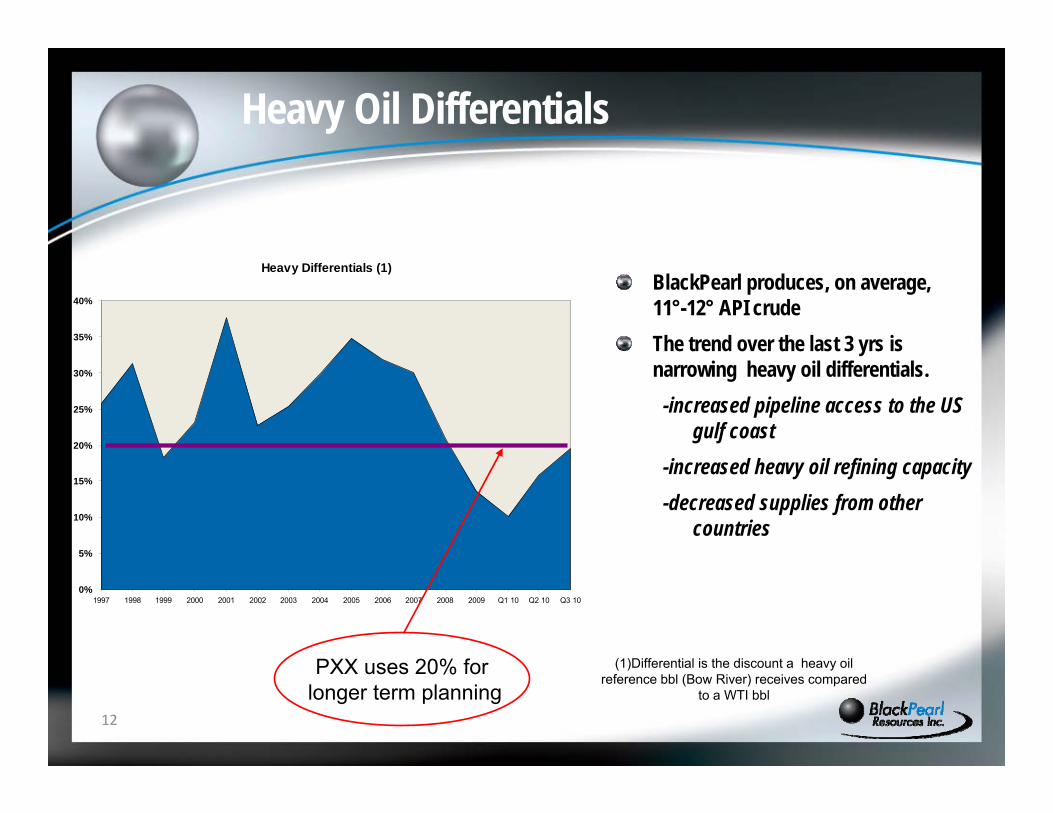
Heavy Oil Differentials
Heavy Differentials (1)
0%
5%
10%
15%
20%
25%
30%
35%
40%
1997 1998 1999 2000 2001 2002 2003 2004 2005 2006 2007 2008 2009 Q1 10 Q2 10 Q3 10
BlackPearl produces, on average, 11°-12° API crudeThe trend over the last 3 yrs is narrowing heavy oil differentials.
-increased pipeline access to the US gulf coast
-increased heavy oil refining capacity-decreased supplies from other
countries
PXX uses 20% forlonger term planning
(1)Differential is the discount a heavy oil reference bbl (Bow River) receives compared
to a WTI bbl
13
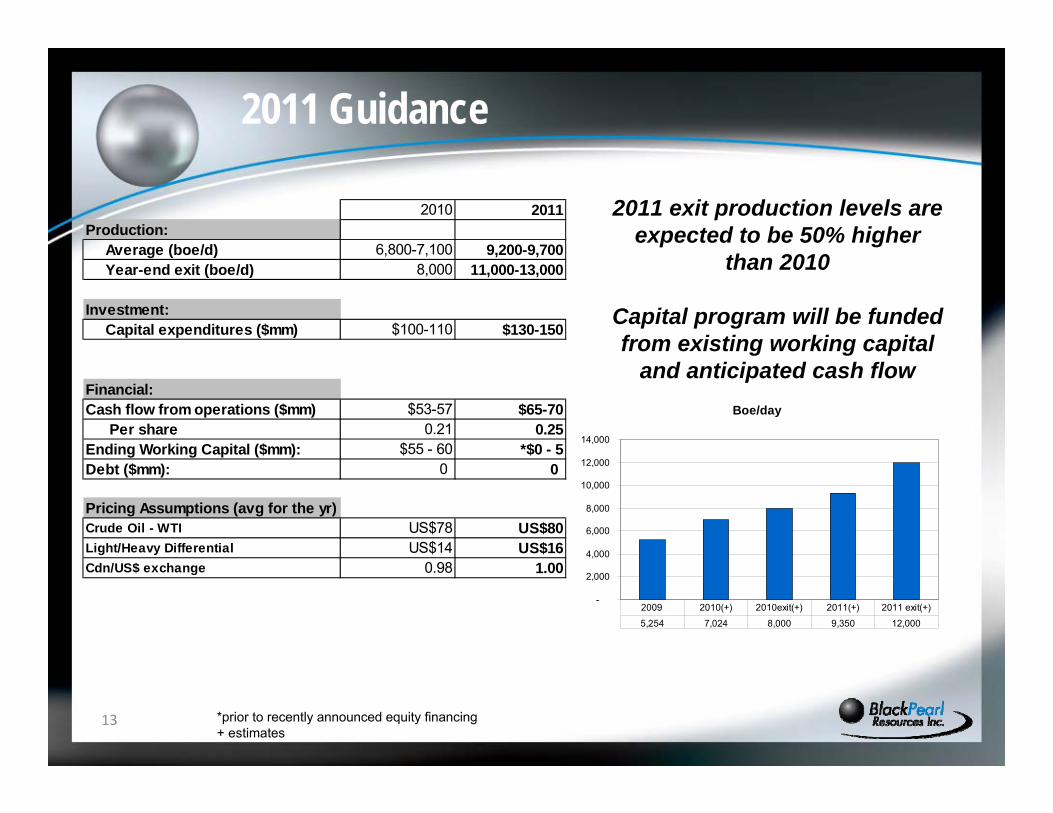
2010 2011Production: Average (boe/d) 6,800-7,100 9,200-9,700 Year-end exit (boe/d) 8,000 11,000-13,000
Investment: Capital expenditures ($mm) $100-110 $130-150
Financial:Cash flow from operations ($mm) $53-57 $65-70 Per share 0.21 0.25Ending Working Capital ($mm): $55 - 60 *$0 - 5Debt ($mm): 0 0
Pricing Assumptions (avg for the yr)Crude Oil - WTI US$78 US$80Light/Heavy Differential US$14 US$16Cdn/US$ exchange 0.98 1.00
2011 Guidance
2011 exit production levels are expected to be 50% higher
than 2010
Capital program will be funded from existing working capital
and anticipated cash flowBoe/day
-
2,000
4,000
6,000
8,000
10,000
12,000
14,000
5,254 7,024 8,000 9,350 12,000
2009 2010(+) 2010exit(+) 2011(+) 2011 exit(+)
*prior to recently announced equity financing+ estimates
14
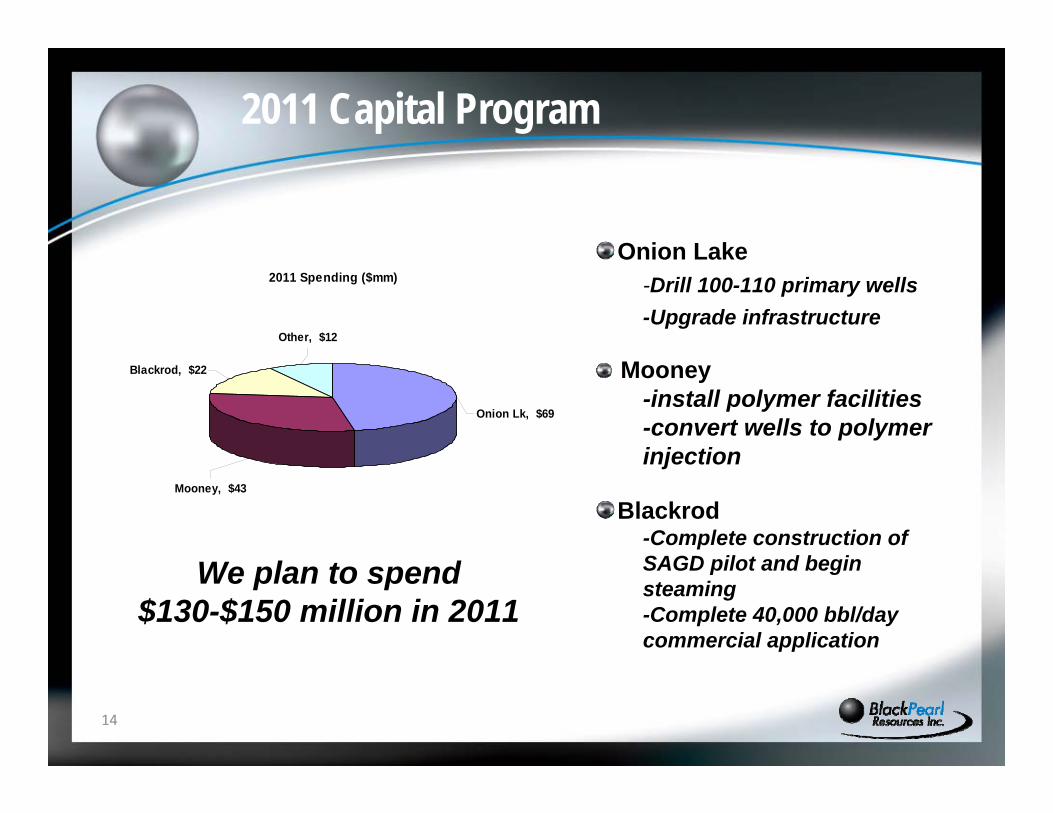
Onion Lake-Drill 100-110 primary wells-Upgrade infrastructure
Mooney-install polymer facilities-convert wells to polymer injection
Blackrod-Complete construction of SAGD pilot and begin steaming-Complete 40,000 bbl/day commercial application
2011 Capital Program
2011 Spending ($mm)
Other, $12
Blackrod, $22
Onion Lk, $69
Mooney, $43
We plan to spend $130-$150 million in 2011
1515
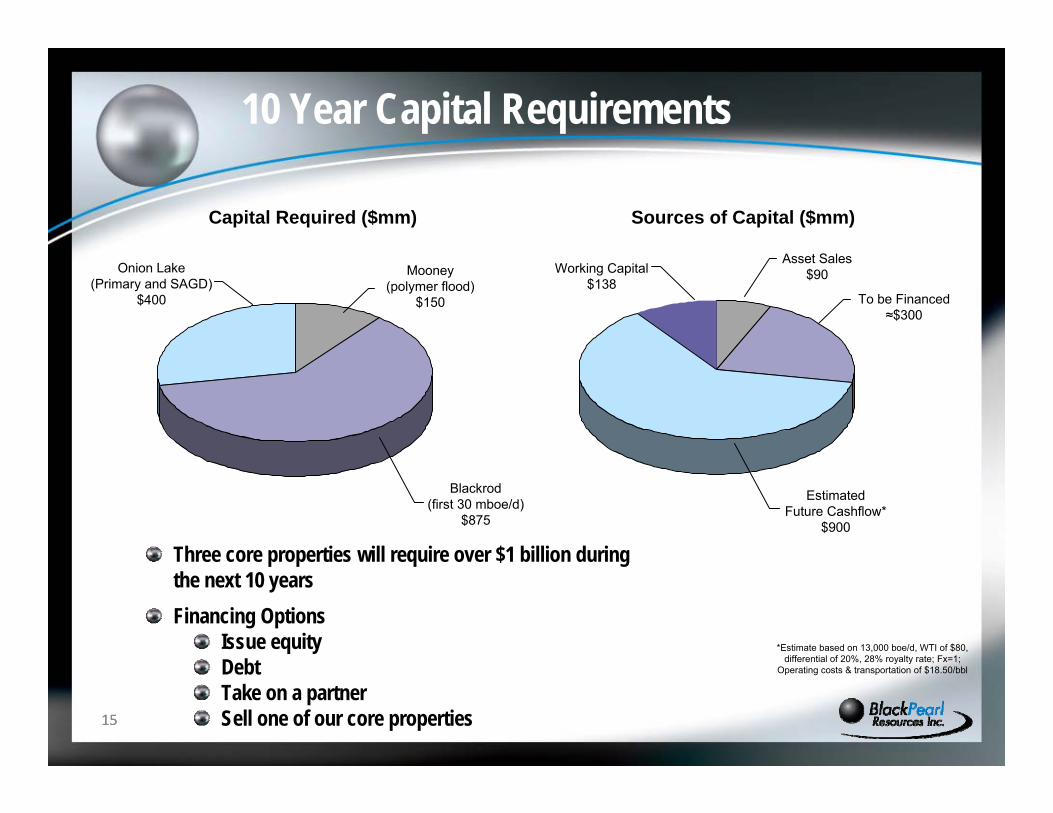
10 Year Capital Requirements
Onion Lake (Primary and SAGD)
$400
Blackrod(first 30 mboe/d)
$875
Mooney(polymer flood)
$150 To be Financed≈$300
Asset Sales$90Working Capital
$138
Estimated Future Cashflow*
$900
Capital Required ($mm) Sources of Capital ($mm)
*Estimate based on 13,000 boe/d, WTI of $80, differential of 20%, 28% royalty rate; Fx=1;
Operating costs & transportation of $18.50/bbl
Three core properties will require over $1 billion during the next 10 yearsFinancing Options
Issue equityDebtTake on a partnerSell one of our core properties
16
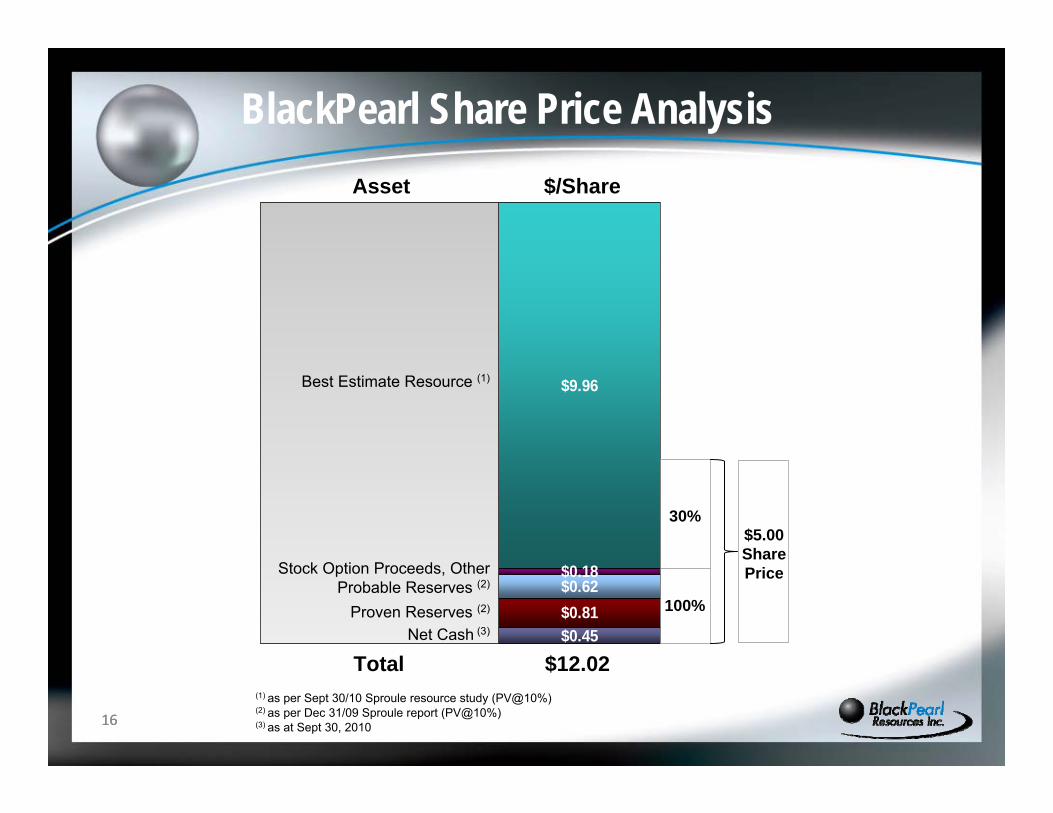
$0.45$0.81$0.62$0.18
$9.96
100%
30%$5.00 Share Price
16
BlackPearl Share Price Analysis
Best Estimate Resource (1)
Stock Option Proceeds, OtherProbable Reserves (2)
Proven Reserves (2)
Net Cash (3)
Asset $/Share
Total $12.02(1) as per Sept 30/10 Sproule resource study (PV@10%)(2) as per Dec 31/09 Sproule report (PV@10%)(3) as at Sept 30, 2010
17
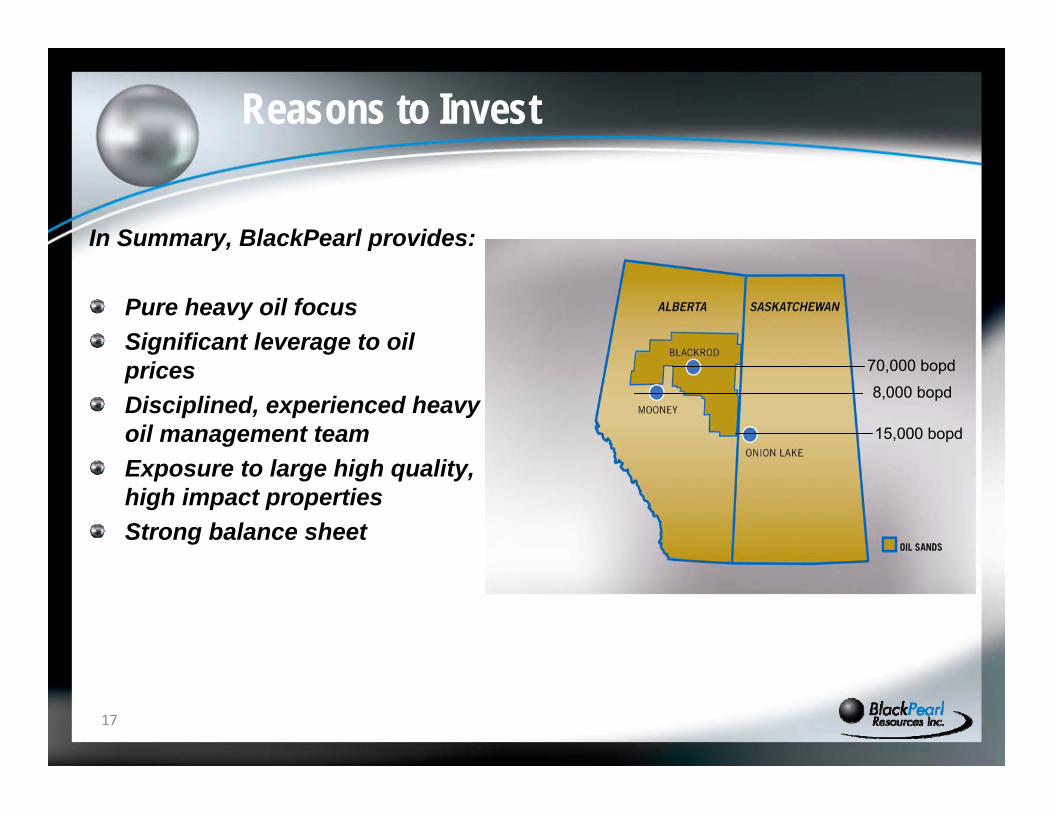
Reasons to Invest
8,000 bopd
15,000 bopd
70,000 bopd
In Summary, BlackPearl provides:
Pure heavy oil focusSignificant leverage to oil pricesDisciplined, experienced heavy oil management teamExposure to large high quality, high impact propertiesStrong balance sheet
18
Cautionary Statements
FORWARD-LOOKING STATEMENTS This presentation contains certain forward-looking statements and forward-looking information within the meaning of applicable Canadian securities legislation (collectively referred to as “forward-looking statements”). All statements other than statements of historical fact may be forward-looking statements. Forward-looking statements are often, but not always, identified by the use of words such as "anticipate", "believe", "plan", "continuous", "estimate", "expect", "may", "will", "project", "should", “predict”, “targeting”, “seek”, “intend”, “could”, “potential” or similar words. In particular, this presentation contains forward looking statements pertaining to the following: the Company’s capital expenditure programs, the estimated quantity of the Company’s Proven and Probable Reserves (2P) and Contingent Resources (2C); the Company’s drilling plans and its exploration and development activities; the net present value of future net revenues from contingent resources of bitumen and heavy oil; forecasted production levels; estimated cash flow from operations; forecast working capital and debt levels; funding for the Company’s current and future capital programs and estimated proceeds form asset dispositions.
Statements relating to "reserves“, “resources”; ”oil initially in place” or “contingent resources” are deemed to be forward-looking statements as they involve the implied assessment, based on certain estimates and assumptions that the reserves described exist in the quantities predicted or estimated and can profitably be produced in the future.
Undue reliance should not be placed on forward-looking statements, which are inherently uncertain, are based on estimates and assumptions, and are subject to known and unknown risks and uncertainties (both general and specific) that contribute to the possibility that the future events or circumstances contemplated by the forward-looking statements will not occur. There can be no assurance that the plans, intentions or expectations upon which forward-looking statements are based will in fact be realized. Actual results will differ, and the difference may be material and adverse to the Company and its shareholders.
Forward-looking statements are based on the Corporation's current beliefs as well as assumptions made by, and information currently available to, the Corporation concerning anticipated financial performance, business prospects, strategies, regulatory developments, future commodity prices, future production levels, the ability to obtain equipment in a timely manner to carry out development activities, the ability to market oil and natural gas successfully to current and new customers, the impact of increasing competition, the ability to obtain financing on acceptable terms, and the ability to add production, reserves and resources through development and exploration activities. Although management considers these assumptions to be reasonable based on information currently available to it, they may prove to be incorrect.
By their very nature, forward-looking statements involve inherent risks and uncertainties (both general and specific) and risks that forward-looking statements will not be achieved. These factors include, but are not limited to, risks associated with oil and gas exploration, financial risks, substantial capital requirements, bank financing, government regulation, aboriginal claims, environmental matters, prices, markets and marketing, dependence on key personnel, availability of drilling equipment and access, uninsurable risks, management of growth, expiration of licenses and leases, reserves estimates, seasonality, competition, conflicts of interest, issuance of debt, title to properties, variations in exchange rates and hedging and uncertainty in global financial markets. Readers are cautioned that these factors and risks are difficult to predict and that the assumptions used in the preparation of such information, although considered reasonably accurate at the time of preparation, may prove to be incorrect. Accordingly, readers are cautioned that the actual results achieved will vary from the information provided herein and the variations may be material. Readers are also cautioned that the foregoing list of factors is not exhaustive. Consequently, there is no representation by the Corporation that actual results achieved will be the same in whole or in part as those set out in the forward-looking information. Furthermore, the forward-looking statements contained in this short form prospectus are made as of the date hereof, and neither the Corporation nor the Underwriters undertake any obligation, except as required by applicable securities legislation, to update publicly or to revise any of the included forward-looking statements, whether as a result of new information, future events or otherwise. The forward-looking statements contained herein are expressly qualified by this cautionary statement.
19
Cautionary Statements cont’d
RESOURCES: There are significant differences in the criteria associated with the classification of reserves and contingent resources. Contingent resource estimates involve additional risk, specifically the risk of not achieving commerciality, not apllicable to reserves estimates. There is no certainty that it will be commercially viable to produce any portion of the resources. No adjustments for these risks have been made in the groupings of reserves and recoverable resources. The estimates of reserves and future net revenue from individual properties may not reflect the same confidence level as estimates of reserves and future net revenues for all properties, due to the effects of aggregation.
BOE’s: All references to BOEs are based on a 6 to 1 conversion ratio. BOEs may be misleading, particularly if used in isolation. A BOE conversion of 6 Mcf: 1 bbl is based on an energy equivalency conversion method primarily applicable at the burner tip and does not represent a value equivalency at the wellhead.
NON-GAAP MEASURES: This presentation uses the terms “Cash flow from operations” and “cash flow” which represent cash flow from operating activities before working capital adjustments.

20
Appendix
21
Contingent Resource Definitions
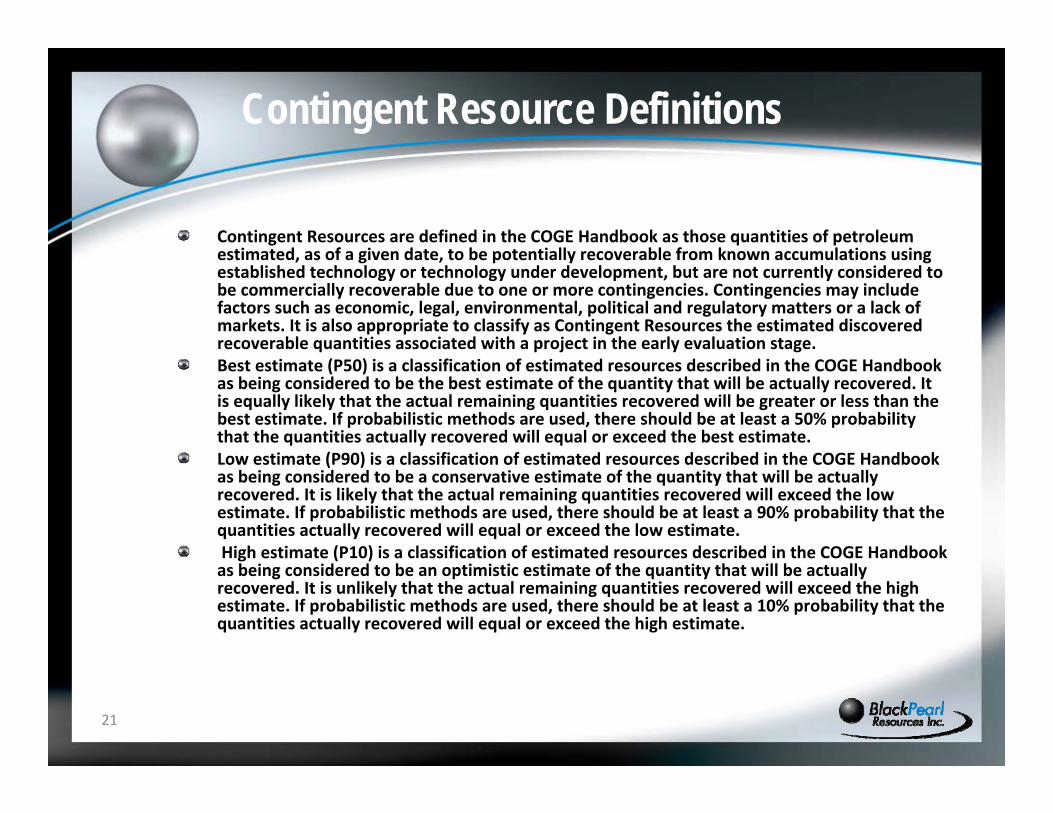
Contingent Resources are defined in the COGE Handbook as those quantities of petroleum estimated, as of a given date, to be potentially recoverable from known accumulations using established technology or technology under development, but are not currently considered to be commercially recoverable due to one or more contingencies. Contingencies may include factors such as economic, legal, environmental, political and regulatory matters or a lack of markets. It is also appropriate to classify as Contingent Resources the estimated discovered recoverable quantities associated with a project in the early evaluation stage.Best estimate (P50) is a classification of estimated resources described in the COGE Handbook as being considered to be the best estimate of the quantity that will be actually recovered. It is equally likely that the actual remaining quantities recovered will be greater or less than the best estimate. If probabilistic methods are used, there should be at least a 50% probability that the quantities actually recovered will equal or exceed the best estimate.Low estimate (P90) is a classification of estimated resources described in the COGE Handbook as being considered to be a conservative estimate of the quantity that will be actually recovered. It is likely that the actual remaining quantities recovered will exceed the low estimate. If probabilistic methods are used, there should be at least a 90% probability that the quantities actually recovered will equal or exceed the low estimate.High estimate (P10) is a classification of estimated resources described in the COGE Handbook as being considered to be an optimistic estimate of the quantity that will be actually recovered. It is unlikely that the actual remaining quantities recovered will exceed the high estimate. If probabilistic methods are used, there should be at least a 10% probability that the quantities actually recovered will equal or exceed the high estimate.
22
Sproule Resource Assessment -Oil Price Assumptions
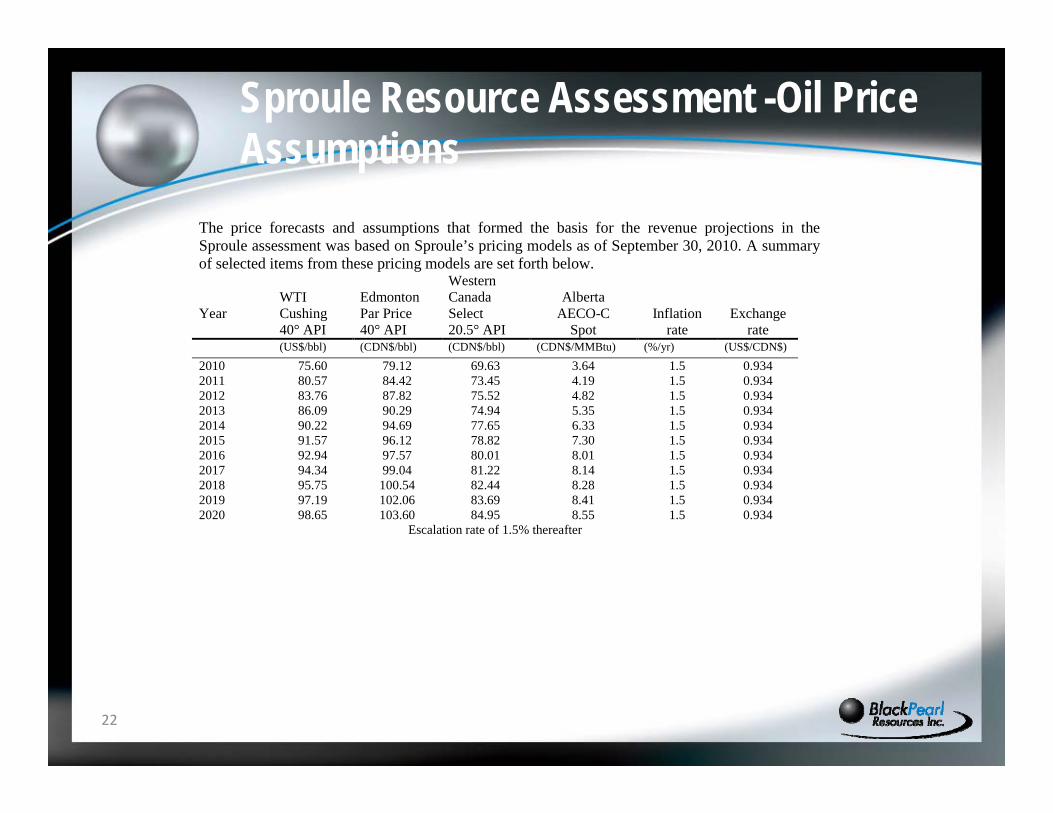
The price forecasts and assumptions that formed the basis for the revenue projections in the Sproule assessment was based on Sproule’s pricing models as of September 30, 2010. A summary of selected items from these pricing models are set forth below. Year
WTI Cushing 40° API
Edmonton Par Price 40° API
Western Canada Select 20.5° API
Alberta
AECO-C Spot
Inflation rate
Exchange rate
(US$/bbl) (CDN$/bbl) (CDN$/bbl) (CDN$/MMBtu) (%/yr) (US$/CDN$)
2010 75.60 79.12 69.63 3.64 1.5 0.934 2011 80.57 84.42 73.45 4.19 1.5 0.934 2012 83.76 87.82 75.52 4.82 1.5 0.934 2013 86.09 90.29 74.94 5.35 1.5 0.934 2014 90.22 94.69 77.65 6.33 1.5 0.934 2015 91.57 96.12 78.82 7.30 1.5 0.934 2016 92.94 97.57 80.01 8.01 1.5 0.934 2017 94.34 99.04 81.22 8.14 1.5 0.934 2018 95.75 100.54 82.44 8.28 1.5 0.934 2019 97.19 102.06 83.69 8.41 1.5 0.934 2020 98.65 103.60 84.95 8.55 1.5 0.934
Escalation rate of 1.5% thereafter