Embed Size (px)
Citation preview
Vol.:(0123456789)
Discover Water (2021) 1:3 | https://doi.org/10.1007/s43832-021-00003-5
1 3
Discover Water
Research
Heavy metals risk assessment of water and sediments collected from selected river tributaries of the Mara River in Tanzania
Mihayo Sahani Nkinda1,2 · Mwemezi Johaiven Rwiza2 · Jasper Nathan Ijumba2 · Karoli Nicholas Njau2
Received: 13 April 2021 / Accepted: 15 June 2021© The Author(s) 2021 OPEN
AbstractThis study investigated the levels of Pb, Hg, Cr, Cd, and As in water and sediments from the tributaries of the Mara River, Tanzania. Pollution risk of water and sediments was investigated using seven indices and five metals. During the dry period, the highest concentration of Pb, Hg, Cr, Cd, and As in sediments was 17.45 ± 1.22, 0.01, 1.56 ± 0.5, 1.3 ± 0.09, and 30.81 ± 0.02 mg/kg, respectively. During the wet period, the highest concentration of Pb, Hg, Cr, Cd, and As in sediments was 4.37 ± 0.28, 0.012, 2.58 ± 0.57, 2.25 ± 0.35, and 53 ± 0.02 mg/kg, respectively. For surface water, the respective high-est concentrations of Pb, Hg, Cr, Cd, and As were 0.76 ± 0.09, 0.04, 0.68 ± 0.09, 0.74 ± 0.1, and 0.47 ± 0.06 mg/L for the dry period. The wet period max concentrations for Pb, Hg, Cr, Cd, and As in surface water were 0.56, 0.03, 0.55 ± 0.03, 0.48 ± 0.03, and 0.4 ± 0.03 mg/L, respectively. Principal component analysis results indicated dominant loadings for Pb and As in sediments during the dry period. Comparison of sediment concentrations with sediment quality guidelines revealed that As and Cd were enriched. Correlation coefficient results indicated that As had a strong negative correlation with the rest of the elements in sediments during the dry period. In the wet period, As had a significant correlation with Cd (r = 0.92, p < 0.01) in sediments. The analysis of environmental risks indicated significant enrichment of sediments with As and Cd. It is important to put in place relevant control mechanisms targeting metals in the studied tributaries, with a focus on As and Cd.
Keywords Heavy metals risk assessment · Mara River tributaries · Wet period concentrations · Water and sediment quality guidelines
1 Introduction
In environmental studies, the phrase heavy metals is used to imply metals and metalloids with high atomic weight and whose specific gravity is five times the specific gravity of water at 4 °C [1]. Heavy metals in the aquatic environment may have their source in either natural or anthropogenic activities. Human activities that may contribute to environmental heavy metals include but are not limited to the generation of domestic waste, mining operations, industrial activities, agricultural expansion, and fossil fuel applications. Natural processes such as volcanic activity and the weathering of rocks may contribute significant levels of heavy metals in the environment [2]. Heavy metals may occur in the environ-ment in both elemental and compound forms. Some heavy metals may be found attached to fine particles, while others may exist in a labile form. Heavy metals are persistent and toxic to ecosystems, making their assessment and subsequent
* Mwemezi Johaiven Rwiza, [email protected]; Mihayo Sahani Nkinda, [email protected]; Jasper Nathan Ijumba, [email protected]; Karoli Nicholas Njau, [email protected] | 1Department of Water Resources, Water Institute, P. O. BOX 35059, Dar es Salaam, Tanzania. 2 School of Materials, Energy, Water and Environmental Science (MEWES), The Nelson Mandela African Institution of Science and Technology, P. O. BOX 447, Arusha, Tanzania.
Vol:.(1234567890)
Research Discover Water (2021) 1:3 | https://doi.org/10.1007/s43832-021-00003-5
1 3
control important. The most toxic heavy metals to organisms and environments include As, Cd, Cr, Pb, and Hg [3]. For the present study, the heavy metals were selected based on their toxicity.
Exposure to high levels of heavy metals (e.g., As, Cd, Cr, Pb, and Hg) may cause disease, disability, and even death. In the recent past, heavy metals pollution in sediments and surface waters has been a global environmental concern. For instance, according to [4], Pb pollution from battery recycling in the Dominican Republic has been a significant public health problem. Moreover [5], reported that 45% of the streams assessed in the United States were classified as polluted. Likewise, 43% of the monitored rivers in China were found to be polluted and unsuitable for domestic use in 2011.
The Mara River, shared by Tanzania and Kenya, is a river of ecological, social, and economic importance for East Africa. Ecologically, the Mara River ecosystem is home to multitudes of diversity including migrating herbivores and associated wild canines of East Africa [6]. Furthermore, the Serengeti-Mara ecosystem is highly dependent on the health and flow of the Mara River [6]. Economically, the Mara River is known to serve communities in both Tanzania and Kenya in terms of fishing, irrigation, forestry, and as a means of transport howbeit at high environmental cost [7]. The environmental damage caused by human activities in the Mara River basin has been reported [8]. The Mara River collects its water from many tributaries, some of which pass through areas of intense human activities such as farming, logging, and mines. Natural runoff and soil erosion from tributaries are likely to collect heavy metals that may impact the river’s ecological system. Pollution caused by heavy metals in streams is undesirable and has health implications for human and aquatic life. The present work assessed the contamination levels of As, Cd, Cr, Hg, and Pb in the Mara River tributaries using pol-lution indices, sediment quality guidelines (SQGs), and principal component analysis (PCA). These heavy metals were selected to be studied due to their toxicity in the environment [9].
Despite the ecological, social, and economic importance of the Mara River to more than 5 million people, its tributaries have rarely been studied to investigate the influence of human activities on heavy metal loading. The previous concentra-tion of heavy metals in sediments and surface water in the study area was within the permissible limit [10]. Two earlier studies [11, 12] did not show clearly whether the heavy metals present in surface water and sediments originated from anthropogenic or natural sources. Furthermore, none of the previous studies reported a comparison between the cur-rent concentrations of heavy metals with preindustrial levels. The emphasis of some of the previous evaluations of heavy metals in the Mara River system e.g., [8, 13–15] focused on cumulative pollution on Lake Victoria. Analysis of multiple (seven) pollution indices was used in the present study to address the gaps that exist in literature. The seven indices used in the present study were: (1) geo-accumulation index (Igeo), (2) enrichment factor (EF), (3) contamination degree (mCd), (4) contamination factor (CF), (5) pollution load index (PLI), (6) ecological risk (Er
i), and potential ecological risk (RI) [16]. Pollution indices are an efficient and rapid tool for producing a single value, the indicator, emanating from different parameters. Most of the indices have been employed globally to study the contamination of toxic heavy metals in river sediments [17, 18]. Pollution indices are powerful tools for evaluating, developing, and conveying raw environmental data into more meaningful information for politicians and decision-makers [19]. In addition, in the present study, SQG values and PCA outputs were used to compare and elucidate possible elemental sources. The thresholds of SQGs were applied to indicate how varying levels of elemental sediment contamination could potentially cause harmful effects on the studied ecological system.
The objective of the present study was two-fold: (1) to investigate the levels and evaluate the possible risk associated with Pb, Hg, Cr, Cd, and As in surface water and samples of sediments from river tributaries and (2) to hypothetically associate the levels of pollutants to their possible primary sources in the studied area.
2 Location of the sampling areas
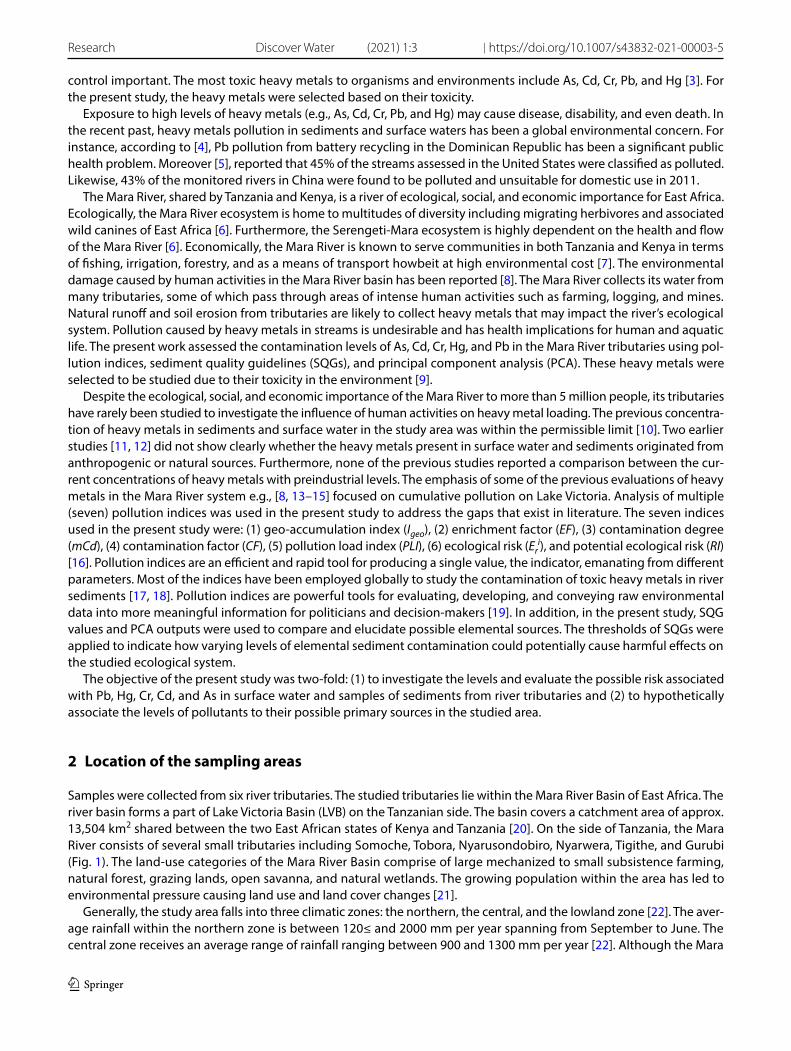
Samples were collected from six river tributaries. The studied tributaries lie within the Mara River Basin of East Africa. The river basin forms a part of Lake Victoria Basin (LVB) on the Tanzanian side. The basin covers a catchment area of approx. 13,504 km2 shared between the two East African states of Kenya and Tanzania [20]. On the side of Tanzania, the Mara River consists of several small tributaries including Somoche, Tobora, Nyarusondobiro, Nyarwera, Tigithe, and Gurubi (Fig. 1). The land-use categories of the Mara River Basin comprise of large mechanized to small subsistence farming, natural forest, grazing lands, open savanna, and natural wetlands. The growing population within the area has led to environmental pressure causing land use and land cover changes [21].
Generally, the study area falls into three climatic zones: the northern, the central, and the lowland zone [22]. The aver-age rainfall within the northern zone is between 120≤ and 2000 mm per year spanning from September to June. The central zone receives an average range of rainfall ranging between 900 and 1300 mm per year [22]. Although the Mara
Vol.:(0123456789)
Discover Water (2021) 1:3 | https://doi.org/10.1007/s43832-021-00003-5 Research
1 3
River Basin is known to experience long rains alias “Masika” (in Swahili) in the months of February to May, the basin has recently been experiencing erratic weather and climatic changes [23]. In 2019, May was the driest month in the Tanzania part of the basin, whereas October was the rainiest. The basin is home to more than 1 million people, sustained by the Masai Mara Reserve (Kenya), the Serengeti National Park (Tanzania), and the high biodiversity wetlands bordering Lake Victoria. The socio-economic importance of the Mara River Basin includes smallholder farming that supports local liveli-hoods; tea and wheat production, safari tourism, fishing, and mining activities [24].
3 Materials and methods
3.1 Sample collection, digestion, and analyses
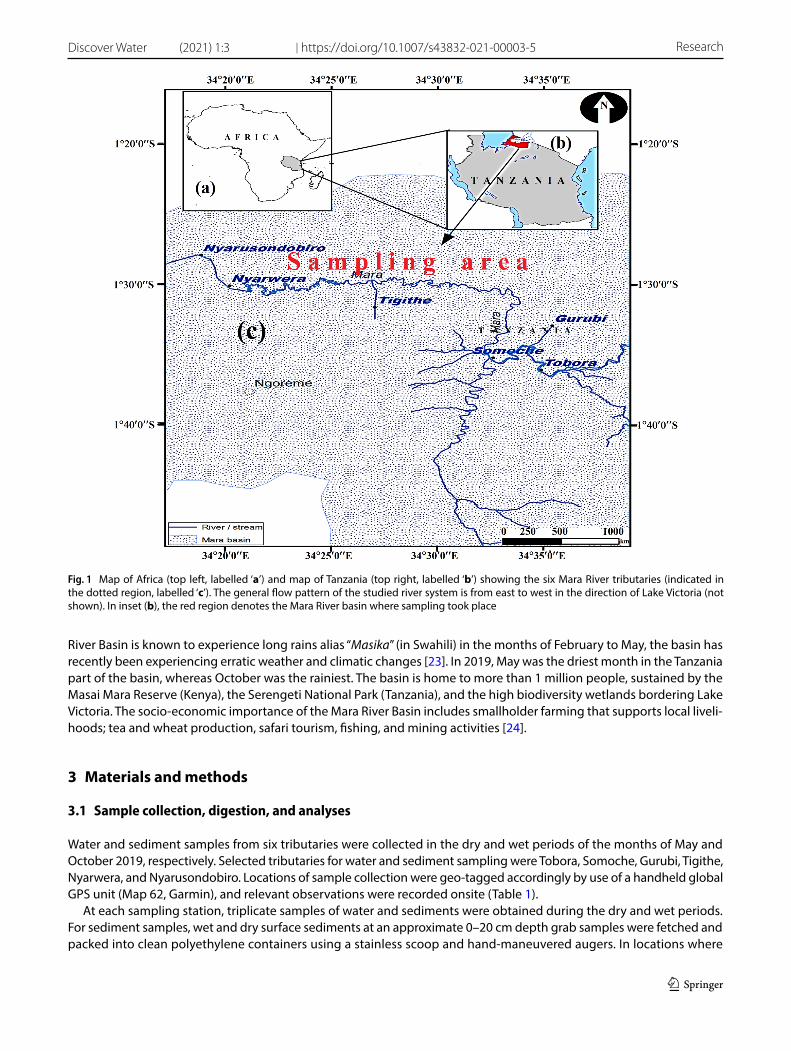
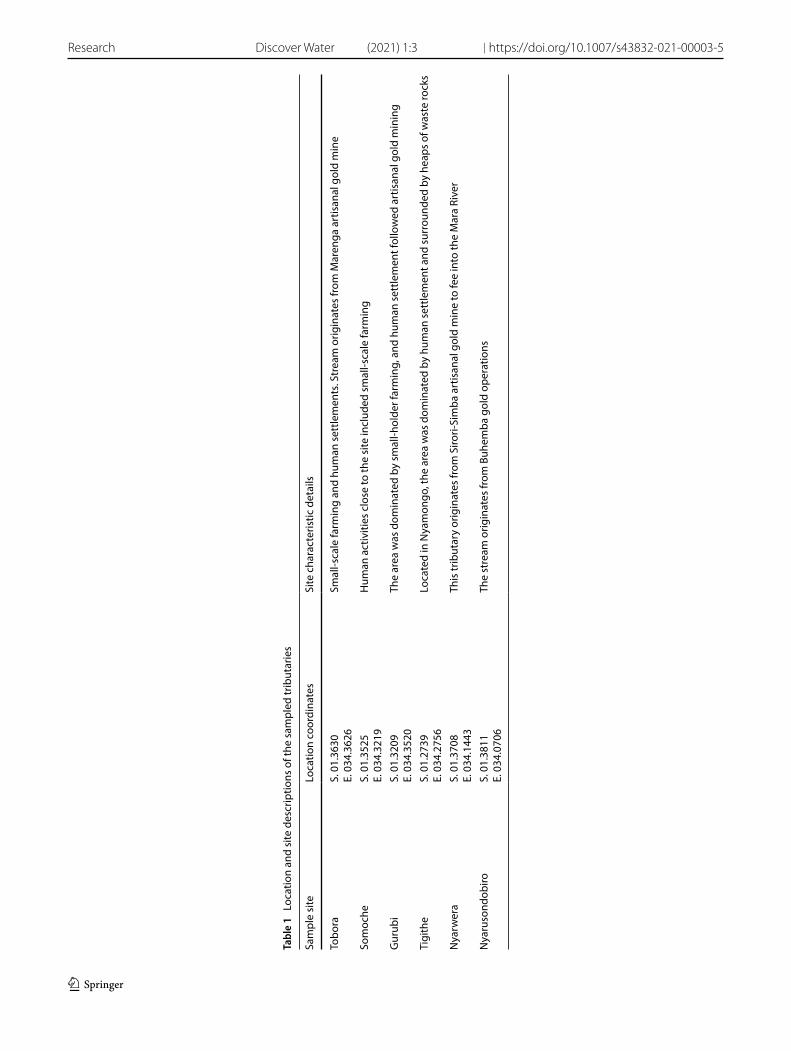
Water and sediment samples from six tributaries were collected in the dry and wet periods of the months of May and October 2019, respectively. Selected tributaries for water and sediment sampling were Tobora, Somoche, Gurubi, Tigithe, Nyarwera, and Nyarusondobiro. Locations of sample collection were geo-tagged accordingly by use of a handheld global GPS unit (Map 62, Garmin), and relevant observations were recorded onsite (Table 1).
At each sampling station, triplicate samples of water and sediments were obtained during the dry and wet periods. For sediment samples, wet and dry surface sediments at an approximate 0–20 cm depth grab samples were fetched and packed into clean polyethylene containers using a stainless scoop and hand-maneuvered augers. In locations where
Fig. 1 Map of Africa (top left, labelled ‘a’) and map of Tanzania (top right, labelled ‘b’) showing the six Mara River tributaries (indicated in the dotted region, labelled ‘c’). The general flow pattern of the studied river system is from east to west in the direction of Lake Victoria (not shown). In inset (b), the red region denotes the Mara River basin where sampling took place
Vol:.(1234567890)
Research Discover Water (2021) 1:3 | https://doi.org/10.1007/s43832-021-00003-5
1 3
Tabl
e 1
Loca
tion
and
site
des
crip
tions
of t
he s
ampl
ed tr
ibut
arie
s
Sam
ple
site
Loca
tion
coor
dina
tes
Site
cha
ract
eris
tic d
etai
ls
Tobo
raS.
01.
3630
E. 0
34.3
626
Smal
l-sca
le fa
rmin
g an
d hu
man
set
tlem
ents
. Str
eam
orig
inat
es fr
om M
aren
ga a
rtis
anal
gol
d m
ine
Som
oche
S. 0
1.35
25E.
034
.321
9H
uman
act
iviti
es c
lose
to th
e si
te in
clud
ed s
mal
l-sca
le fa
rmin
g
Gur
ubi
S. 0
1.32
09E.
034
.352
0Th
e ar
ea w
as d
omin
ated
by
smal
l-hol
der f
arm
ing,
and
hum
an s
ettle
men
t fol
low
ed a
rtis
anal
gol
d m
inin
g
Tigi
the
S. 0
1.27
39E.
034
.275
6Lo
cate
d in
Nya
mon
go, t
he a
rea
was
dom
inat
ed b
y hu
man
set
tlem
ent a
nd s
urro
unde
d by
hea
ps o
f was
te ro
cks
Nya
rwer
aS.
01.
3708
E. 0
34.1
443
This
trib
utar
y or
igin
ates
from
Siro
ri-Si
mba
art
isan
al g
old
min
e to
fee
into
the
Mar
a Ri
ver
Nya
ruso
ndob
iroS.
01.
3811
E. 0
34.0
706
The
stre
am o
rigin
ates
from
Buh
emba
gol
d op
erat
ions
Vol.:(0123456789)
Discover Water (2021) 1:3 | https://doi.org/10.1007/s43832-021-00003-5 Research
1 3
the water was deep, sampling was supported by the aid of a small fishing motorboat. After collection, the samples were labelled and packed in an ice-cooled container without any chemical pretreatment. At the end of the sampling session, samples were transported to the Musoma Water Quality Laboratory for refrigeration at 1 °C to 4 °C and temporary stor-age. The samples were later transported by bus to Arusha Technical College—Arusha, Tanzania, for laboratory analyses. Sampling procedures, pretreatment, storage, and transportation protocols were followed as per standard guidelines [25].
Likewise, water samples were collected using high-density polyethylene (HDPE) bottles of 1 L each, prewashed using 10% v/v HNO3, and rinsed several times with distilled water. During sampling, each prewashed sampling bottle was rinsed three to four times with stream water fetched at each corresponding site. Samples were collected at varying depths from 0 to 15 cm below the water surface by submerging uncapped sampling bottles upside down into the water stream. A calibrated portable waterproof multimeter (Hanna HI98129 pH/EC/TDS/Temperature, Hanna Instruments, Italy) was used to record the readings of pH, electrical conductivity (EC), total dissolved solids (TDS) and sample temperature. Immediately after the samples were collected, they were acidified to pH < 2 by two drops of HNO3 and capped before being stored in an ice-cooled container. The sampling procedures, pretreatment, storage, and transportation protocols were followed as per standard guidelines [26].
Digestion of sediment samples was carried out using the Kjeldahl equipment (Avishkar International PVT LTD, Mum-bai). Standard digestion protocols (Method 3050B-SW-846, Method 245.5, and Method 7062) were used for sediment digestion, whereas method 245.1 was used to digest water samples. A specialized standard protocol (Method 3050 B) was applied for the determination of Cd, Cr, and Pb. Moreover, Methods 245.5 and 7062 were used for As and Hg analy-ses, respectively. As and Hg determination and their instrumentation protocols were applied as per standard guidelines [26]. Hydride-generated atomic absorption spectrophotometer (HG-AAS) Model WFX 210 was used to determine heavy metals from the digested water and sediment samples. During sediment digestion, representative dry weight sediment samples of 1 g were digested with repeated additions of HNO3 and H2O2. The digested samples were filtered using a filter paper (Whatman, No. 41). Residues were rinsed first with hot HCI and then hot reagent water. The filter paper and residues were then returned to the digestion flask, refluxed with additional HCI, and refiltered. Digested samples were diluted to a final volume of 100 mL, ready for HG-AAS analysis.
Moreover, water samples were digested by heating with HNO3. The digested water samples were filtered and adjusted to a final volume of 100 mL for AAS analysis. For individual metal concentration determinations, the respective hollow cathode lamp was applied accordingly. An incision width of 0.4 nm was used with corresponding wavelengths of ele-ments of 248.3, 283.3, 357.9, 253.7, 228.8, and 193.7 nm for Fe, Pb, Hg, Cr, Cd, and As, respectively. Laboratory blanks, distilled water, field duplicates, and standard air-acetylene analytical grade reagents were used to ensure the quality of sample analyses. A 1000 mg/dm3 stock solution was used to prepare a working standard solution.
During the experiment, the relative standard deviation (RSD) was used to obtain repeatability and reproducibility as described in the literature [27]. The reproducibility (showing variability between the results from different laboratories) was assessed in a similar way as previously reported [27]. The detection limits were 0.2 mg/kg for Cd, Cr, and Pb, 0.05 mg/kg for As, and 0.02 mg/kg for Hg. Three replicates assessed the analysis efficiency. The relative standard deviations varied from 6 to 110% and were considered satisfactory, provided the complex nature and the differences between the sedi-ment matrix samples.
3.2 Statistical analyses
Data were statistically analyzed using statistical packages (Origin 9 and IBM SPSS 21.0, IBM Corporation, Armonk, NY, USA). The SQGs were used in comparison with the statistical results. The PCA was used to reduce the dimension of the data and extract highly correlated variables into independent factors. A Pearson correlation matrix was used to measure the strength of the linear association relationship between variables in water and sediments. In addition, Microsoft Excel Version 2016 was used for the computation of the geochemical pollution indices.
3.3 Sediment and water quality assessment
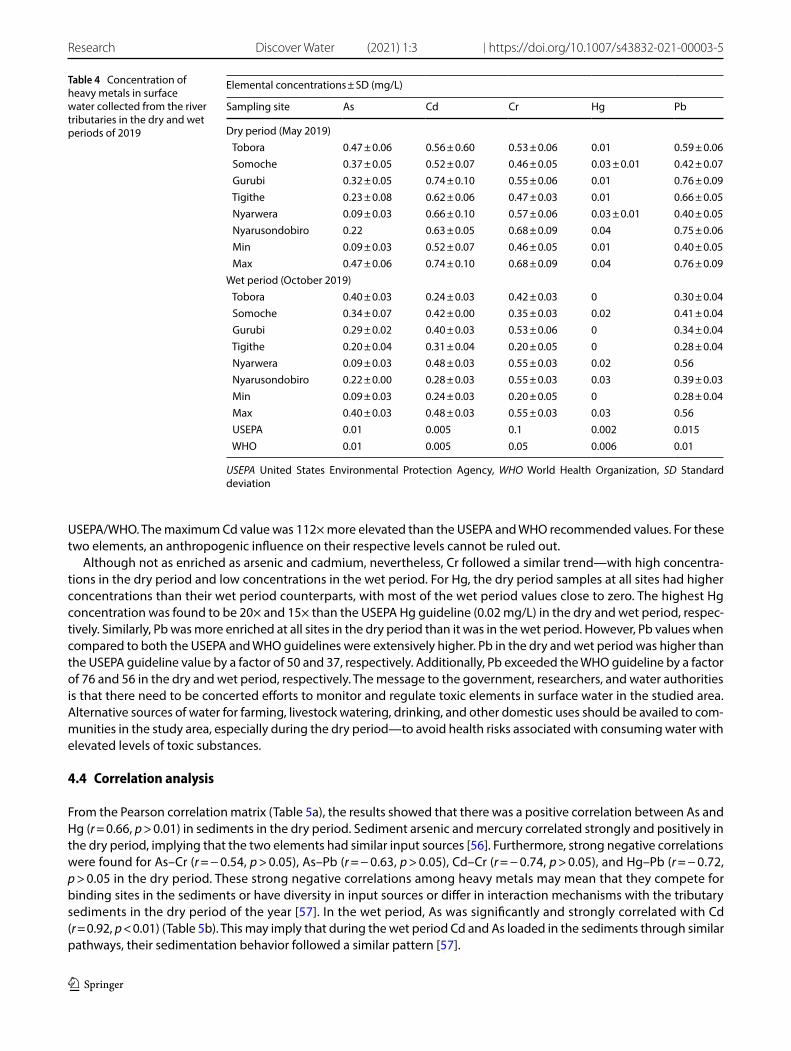
The SQGs were used to compare Pb, Hg, Cr, Cd, and As from the investigated samples of sediments in tributaries with respect to their impact on sediment quality and life of aquatic organisms. The SQGs used were as follows: (1) effects range low (ERL); (2) minimal effect threshold (MET); (3) lowest effect level (LEL); and (4) threshold effect level (TEL) Table 3 [28]. Moreover, the concentration of heavy metals determined from samples of surface water was compared to WHO and EPA guidelines (Table 4).
Vol:.(1234567890)
Research Discover Water (2021) 1:3 | https://doi.org/10.1007/s43832-021-00003-5
1 3
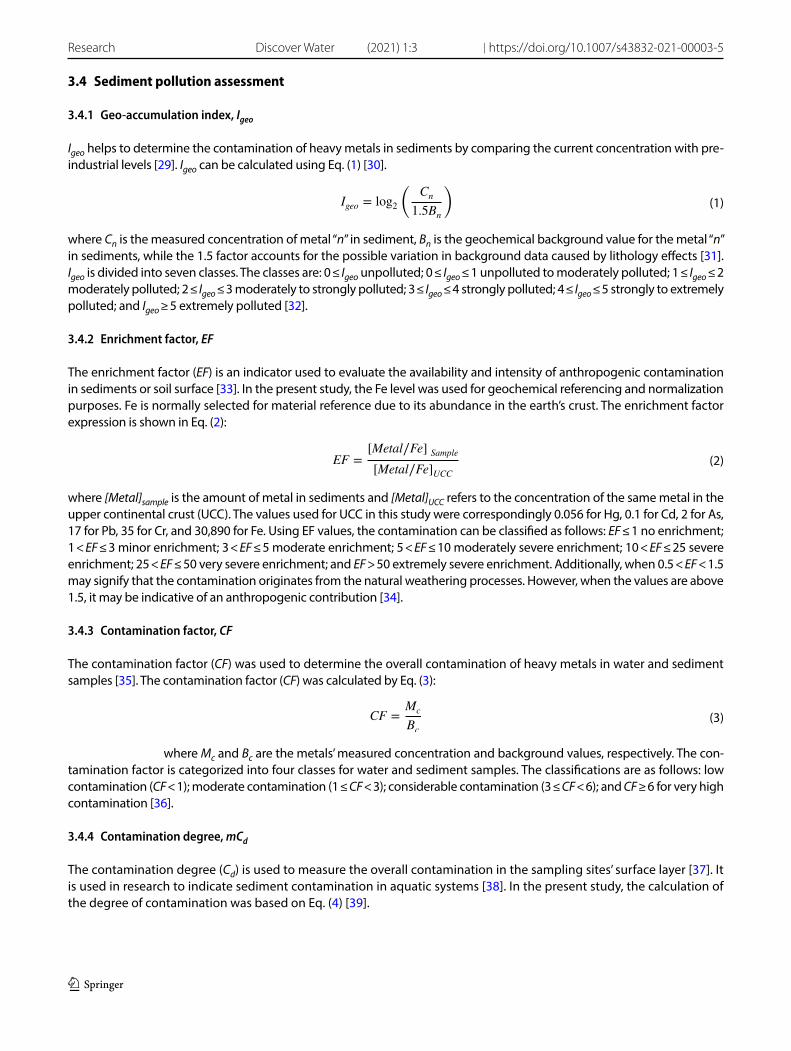
3.4 Sediment pollution assessment
3.4.1 Geo‑accumulation index, Igeo
Igeo helps to determine the contamination of heavy metals in sediments by comparing the current concentration with pre-industrial levels [29]. Igeo can be calculated using Eq. (1) [30].
where Cn is the measured concentration of metal “n” in sediment, Bn is the geochemical background value for the metal “n” in sediments, while the 1.5 factor accounts for the possible variation in background data caused by lithology effects [31]. Igeo is divided into seven classes. The classes are: 0 ≤ Igeo unpolluted; 0 ≤ Igeo ≤ 1 unpolluted to moderately polluted; 1 ≤ Igeo ≤ 2 moderately polluted; 2 ≤ Igeo ≤ 3 moderately to strongly polluted; 3 ≤ Igeo ≤ 4 strongly polluted; 4 ≤ Igeo ≤ 5 strongly to extremely polluted; and Igeo ≥ 5 extremely polluted [32].
3.4.2 Enrichment factor, EF
The enrichment factor (EF) is an indicator used to evaluate the availability and intensity of anthropogenic contamination in sediments or soil surface [33]. In the present study, the Fe level was used for geochemical referencing and normalization purposes. Fe is normally selected for material reference due to its abundance in the earth’s crust. The enrichment factor expression is shown in Eq. (2):
where [Metal]sample is the amount of metal in sediments and [Metal]UCC refers to the concentration of the same metal in the upper continental crust (UCC). The values used for UCC in this study were correspondingly 0.056 for Hg, 0.1 for Cd, 2 for As, 17 for Pb, 35 for Cr, and 30,890 for Fe. Using EF values, the contamination can be classified as follows: EF ≤ 1 no enrichment; 1 < EF ≤ 3 minor enrichment; 3 < EF ≤ 5 moderate enrichment; 5 < EF ≤ 10 moderately severe enrichment; 10 < EF ≤ 25 severe enrichment; 25 < EF ≤ 50 very severe enrichment; and EF > 50 extremely severe enrichment. Additionally, when 0.5 < EF < 1.5 may signify that the contamination originates from the natural weathering processes. However, when the values are above 1.5, it may be indicative of an anthropogenic contribution [34].
3.4.3 Contamination factor, CF
The contamination factor (CF) was used to determine the overall contamination of heavy metals in water and sediment samples [35]. The contamination factor (CF) was calculated by Eq. (3):
where Mc and Bc are the metals’ measured concentration and background values, respectively. The con-tamination factor is categorized into four classes for water and sediment samples. The classifications are as follows: low contamination (CF < 1); moderate contamination (1 ≤ CF < 3); considerable contamination (3 ≤ CF < 6); and CF ≥ 6 for very high contamination [36].
3.4.4 Contamination degree, mCd
The contamination degree (Cd) is used to measure the overall contamination in the sampling sites’ surface layer [37]. It is used in research to indicate sediment contamination in aquatic systems [38]. In the present study, the calculation of the degree of contamination was based on Eq. (4) [39].
(1)Igeo = log2
(
Cn
1.5Bn
)
(2)EF =[Metal∕Fe] Sample
[Metal∕Fe]UCC
(3)CF =Mc
Bc
Vol.:(0123456789)
Discover Water (2021) 1:3 | https://doi.org/10.1007/s43832-021-00003-5 Research
1 3
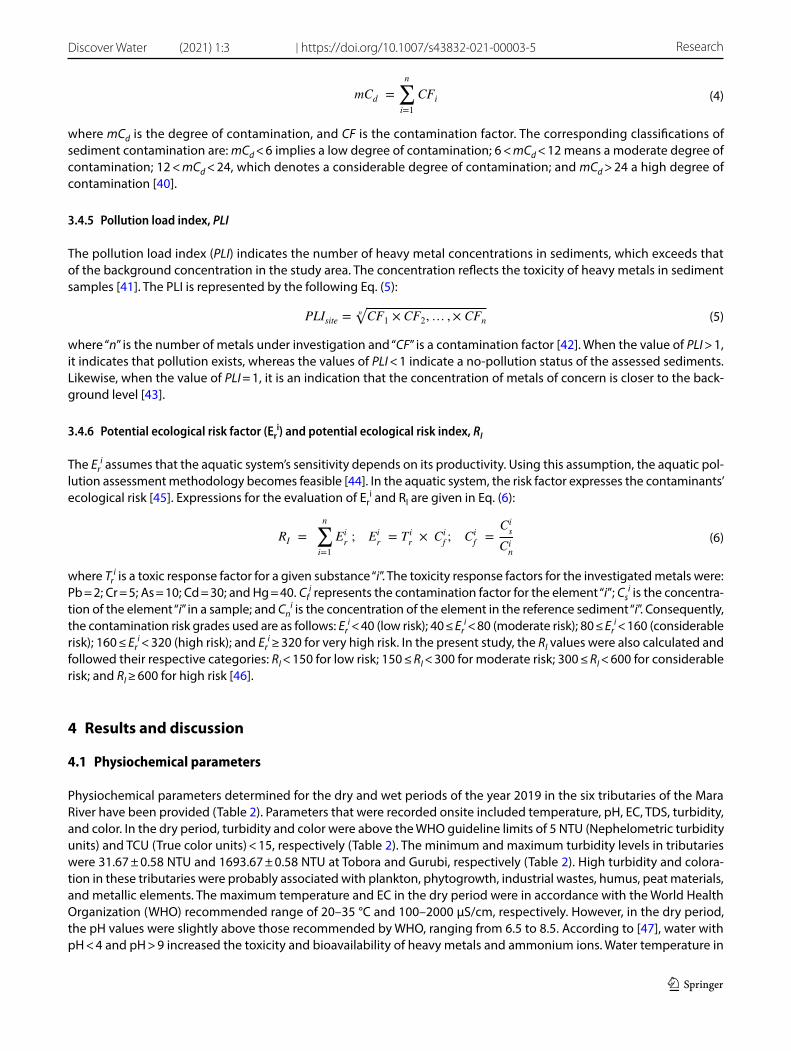
where mCd is the degree of contamination, and CF is the contamination factor. The corresponding classifications of sediment contamination are: mCd < 6 implies a low degree of contamination; 6 < mCd < 12 means a moderate degree of contamination; 12 < mCd < 24, which denotes a considerable degree of contamination; and mCd > 24 a high degree of contamination [40].
3.4.5 Pollution load index, PLI
The pollution load index (PLI) indicates the number of heavy metal concentrations in sediments, which exceeds that of the background concentration in the study area. The concentration reflects the toxicity of heavy metals in sediment samples [41]. The PLI is represented by the following Eq. (5):
where “n” is the number of metals under investigation and “CF” is a contamination factor [42]. When the value of PLI > 1, it indicates that pollution exists, whereas the values of PLI < 1 indicate a no-pollution status of the assessed sediments. Likewise, when the value of PLI = 1, it is an indication that the concentration of metals of concern is closer to the back-ground level [43].
3.4.6 Potential ecological risk factor (Eri) and potential ecological risk index, RI
The Eri assumes that the aquatic system’s sensitivity depends on its productivity. Using this assumption, the aquatic pol-
lution assessment methodology becomes feasible [44]. In the aquatic system, the risk factor expresses the contaminants’ ecological risk [45]. Expressions for the evaluation of Er
i and RI are given in Eq. (6):
where Tri is a toxic response factor for a given substance “i”. The toxicity response factors for the investigated metals were:
Pb = 2; Cr = 5; As = 10; Cd = 30; and Hg = 40. Cfi represents the contamination factor for the element “i”; Cs
i is the concentra-tion of the element ‘‘i’’ in a sample; and Cn
i is the concentration of the element in the reference sediment “i”. Consequently, the contamination risk grades used are as follows: Er
i < 40 (low risk); 40 ≤ Eri < 80 (moderate risk); 80 ≤ Er
i < 160 (considerable risk); 160 ≤ Er
i < 320 (high risk); and Eri ≥ 320 for very high risk. In the present study, the RI values were also calculated and
followed their respective categories: RI < 150 for low risk; 150 ≤ RI < 300 for moderate risk; 300 ≤ RI < 600 for considerable risk; and RI ≥ 600 for high risk [46].
4 Results and discussion
4.1 Physiochemical parameters
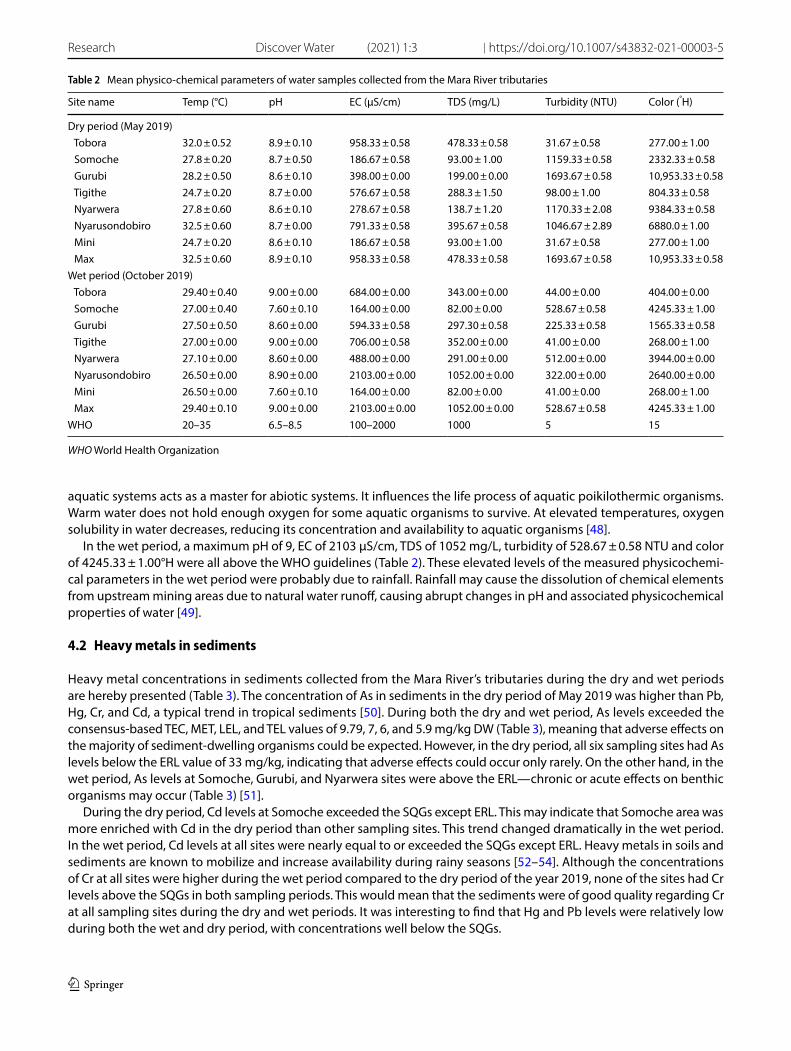
Physiochemical parameters determined for the dry and wet periods of the year 2019 in the six tributaries of the Mara River have been provided (Table 2). Parameters that were recorded onsite included temperature, pH, EC, TDS, turbidity, and color. In the dry period, turbidity and color were above the WHO guideline limits of 5 NTU (Nephelometric turbidity units) and TCU (True color units) < 15, respectively (Table 2). The minimum and maximum turbidity levels in tributaries were 31.67 ± 0.58 NTU and 1693.67 ± 0.58 NTU at Tobora and Gurubi, respectively (Table 2). High turbidity and colora-tion in these tributaries were probably associated with plankton, phytogrowth, industrial wastes, humus, peat materials, and metallic elements. The maximum temperature and EC in the dry period were in accordance with the World Health Organization (WHO) recommended range of 20–35 °C and 100–2000 μS/cm, respectively. However, in the dry period, the pH values were slightly above those recommended by WHO, ranging from 6.5 to 8.5. According to [47], water with pH < 4 and pH > 9 increased the toxicity and bioavailability of heavy metals and ammonium ions. Water temperature in
(4)mCd =
n∑
i=1
CFi
(5)PLIsite =n√
CF1 × CF2,… ,× CFn
(6)RI =
n∑
i=1
Eir; Ei
r= Ti
r× Ci
f; Ci
f=
Cis
Cin
Vol:.(1234567890)
Research Discover Water (2021) 1:3 | https://doi.org/10.1007/s43832-021-00003-5
1 3
aquatic systems acts as a master for abiotic systems. It influences the life process of aquatic poikilothermic organisms. Warm water does not hold enough oxygen for some aquatic organisms to survive. At elevated temperatures, oxygen solubility in water decreases, reducing its concentration and availability to aquatic organisms [48].
In the wet period, a maximum pH of 9, EC of 2103 μS/cm, TDS of 1052 mg/L, turbidity of 528.67 ± 0.58 NTU and color of 4245.33 ± 1.00°H were all above the WHO guidelines (Table 2). These elevated levels of the measured physicochemi-cal parameters in the wet period were probably due to rainfall. Rainfall may cause the dissolution of chemical elements from upstream mining areas due to natural water runoff, causing abrupt changes in pH and associated physicochemical properties of water [49].
4.2 Heavy metals in sediments
Heavy metal concentrations in sediments collected from the Mara River’s tributaries during the dry and wet periods are hereby presented (Table 3). The concentration of As in sediments in the dry period of May 2019 was higher than Pb, Hg, Cr, and Cd, a typical trend in tropical sediments [50]. During both the dry and wet period, As levels exceeded the consensus-based TEC, MET, LEL, and TEL values of 9.79, 7, 6, and 5.9 mg/kg DW (Table 3), meaning that adverse effects on the majority of sediment-dwelling organisms could be expected. However, in the dry period, all six sampling sites had As levels below the ERL value of 33 mg/kg, indicating that adverse effects could occur only rarely. On the other hand, in the wet period, As levels at Somoche, Gurubi, and Nyarwera sites were above the ERL—chronic or acute effects on benthic organisms may occur (Table 3) [51].
During the dry period, Cd levels at Somoche exceeded the SQGs except ERL. This may indicate that Somoche area was more enriched with Cd in the dry period than other sampling sites. This trend changed dramatically in the wet period. In the wet period, Cd levels at all sites were nearly equal to or exceeded the SQGs except ERL. Heavy metals in soils and sediments are known to mobilize and increase availability during rainy seasons [52–54]. Although the concentrations of Cr at all sites were higher during the wet period compared to the dry period of the year 2019, none of the sites had Cr levels above the SQGs in both sampling periods. This would mean that the sediments were of good quality regarding Cr at all sampling sites during the dry and wet periods. It was interesting to find that Hg and Pb levels were relatively low during both the wet and dry period, with concentrations well below the SQGs.
Table 2 Mean physico-chemical parameters of water samples collected from the Mara River tributaries
WHO World Health Organization
Site name Temp (°C) pH EC (μS/cm) TDS (mg/L) Turbidity (NTU) Color (°H)
Dry period (May 2019) Tobora 32.0 ± 0.52 8.9 ± 0.10 958.33 ± 0.58 478.33 ± 0.58 31.67 ± 0.58 277.00 ± 1.00 Somoche 27.8 ± 0.20 8.7 ± 0.50 186.67 ± 0.58 93.00 ± 1.00 1159.33 ± 0.58 2332.33 ± 0.58 Gurubi 28.2 ± 0.50 8.6 ± 0.10 398.00 ± 0.00 199.00 ± 0.00 1693.67 ± 0.58 10,953.33 ± 0.58 Tigithe 24.7 ± 0.20 8.7 ± 0.00 576.67 ± 0.58 288.3 ± 1.50 98.00 ± 1.00 804.33 ± 0.58 Nyarwera 27.8 ± 0.60 8.6 ± 0.10 278.67 ± 0.58 138.7 ± 1.20 1170.33 ± 2.08 9384.33 ± 0.58 Nyarusondobiro 32.5 ± 0.60 8.7 ± 0.00 791.33 ± 0.58 395.67 ± 0.58 1046.67 ± 2.89 6880.0 ± 1.00 Mini 24.7 ± 0.20 8.6 ± 0.10 186.67 ± 0.58 93.00 ± 1.00 31.67 ± 0.58 277.00 ± 1.00 Max 32.5 ± 0.60 8.9 ± 0.10 958.33 ± 0.58 478.33 ± 0.58 1693.67 ± 0.58 10,953.33 ± 0.58
Wet period (October 2019) Tobora 29.40 ± 0.40 9.00 ± 0.00 684.00 ± 0.00 343.00 ± 0.00 44.00 ± 0.00 404.00 ± 0.00 Somoche 27.00 ± 0.40 7.60 ± 0.10 164.00 ± 0.00 82.00 ± 0.00 528.67 ± 0.58 4245.33 ± 1.00 Gurubi 27.50 ± 0.50 8.60 ± 0.00 594.33 ± 0.58 297.30 ± 0.58 225.33 ± 0.58 1565.33 ± 0.58 Tigithe 27.00 ± 0.00 9.00 ± 0.00 706.00 ± 0.58 352.00 ± 0.00 41.00 ± 0.00 268.00 ± 1.00 Nyarwera 27.10 ± 0.00 8.60 ± 0.00 488.00 ± 0.00 291.00 ± 0.00 512.00 ± 0.00 3944.00 ± 0.00 Nyarusondobiro 26.50 ± 0.00 8.90 ± 0.00 2103.00 ± 0.00 1052.00 ± 0.00 322.00 ± 0.00 2640.00 ± 0.00 Mini 26.50 ± 0.00 7.60 ± 0.10 164.00 ± 0.00 82.00 ± 0.00 41.00 ± 0.00 268.00 ± 1.00 Max 29.40 ± 0.10 9.00 ± 0.00 2103.00 ± 0.00 1052.00 ± 0.00 528.67 ± 0.58 4245.33 ± 1.00
WHO 20–35 6.5–8.5 100–2000 1000 5 15
Vol.:(0123456789)
Discover Water (2021) 1:3 | https://doi.org/10.1007/s43832-021-00003-5 Research
1 3
In this study, elemental concentrations were also compared to background values (Table 3). The results revealed that the levels of As and Cd exceeded the background values in both sampling periods, suggesting that there was probably some anthropogenic input for the aforementioned two elements. Previous sedimentological research has associated high levels of heavy metals e.g., Cd, Pb, and Cr in sediment samples to anthropogenic sources such as landfills [55]. However, in the current study the Cr, Hg, and Pb concentrations were less than the background values at all sites, meaning that they were probably originated from natural sources.
4.3 Heavy metals in surface water
Water samples from the Mara River’s tributaries were analyzed for As, Cd, Cr, Hg, and Pb, and the results were tabulated accordingly (Table 4). Levels of arsenic in the dry period samples were higher than their wet period counterparts. This was the case for all sampling sites. Probably during the dry period, there was an evaporation effect, making As concentrated. In contrast, in the wet period, a dilution effect came into play, making the water less concentrated with As. Although As ranged only from 0.09 to 0.47 mg/L, when these values are compared to the USEPA and WHO guidelines (0.01 mg/L), the surface water in the study area was highly enriched with As in both periods. For example, at Tobora site, As was 47× and 40× higher than the WHO guideline in the dry and wet period, respectively. Therefore, the water at all sampling sites was not suitable for human consumption. For cadmium, similar trends as those of arsenic were observed. The dry period samples were more enriched than the wet ones. A comparison with the USEPA and WHO guidelines (0.005 mg/L) revealed that the minimum Cd concentration at Somoche site was 48× higher than the value recommended by the
Table 3 Concentrations of heavy metals in samples of sediments collected from the tributaries of the Mara River accounting for periods of drought and rains of 2019
SD Standard deviation, DW dry weight, Bckgr. background levelsa Respecive definitions of the abbreviated terms were given under Sect. 3.3
Sampling site Concentrations ± SD (mg/kg DW)
As Cd Cr Hg Pb
Dry period (May 2019) Tobora 14.51 ± 0.18 0.18 ± 0.70 1.18 ± 0.70 0 17.45 ± 1.22 Somoche 19.63 ± 0.20 1.30 ± 0.90 0.97 ± 0.49 0 12.82 ± 0.89 Gurubi 29.99 ± 0.02 0.27 ± 0.05 1.25 ± 0.44 0 14.09 ± 0.65 Tigithe 17.97 ± 0.11 0.23 ± 0.02 1.36 ± 0.37 0 14.35 ± 0.28 Nyarwera 30.81 ± 0.02 0.32 ± 0.05 1.18 ± 0.18 0.011 8.36 ± 0.51 Nyarusondobiro 11.77 ± 0.02 0.17 ± 0.02 1.56 ± 0.50 0 10.92 ± 0.31 Mean 20.78 ± 0.15 0.41 ± 0.29 1.25 ± 0.45 0 13.00 ± 0.64 Mini 11.77 ± 0.02 0.17 ± 0.02 0.97 ± 0.49 0 8.36 ± 0.51 Max 30.81 ± 0.02 1.30 ± 0.09 1.56 ± 0.50 0.01 17.45 ± 1.22
Wet period (October 2019) Tobora 27.20 ± 0.18 0.95 ± 0.20 1.54 ± 0.40 0.004 2.45 ± 0.05 Somoche 40.52 ± 0.20 1.53 ± 0.56 1.21 ± 0.55 0 4.37 ± 0.28 Gurubi 41.44 ± 0.02 1.45 ± 0.22 1.78 ± 0.20 0.004 2.64 ± 0.17 Tigithe 32.19 ± 0.11 1.34 ± 0.22 1.21 ± 0.46 0 2.65 ± 0.10 Nyarwera 53.11 ± 0.02 2.25 ± 0.35 1.94 ± 0.35 0.012 2.98 ± 0.26 Nyarusondobiro 24.25 ± 0.02 1.21 ± 0.06 2.58 ± 0.57 0.007 2.81 ± 0.13 Mean 36.45 ± 0.09 1.46 ± 0.27 1.71 ± 0.42 0.01 2.98 ± 0.17 Min 24.25 ± 0.02 0.95 ± 0.20 1.21 ± 0.46 0 2.45 ± 0.05 Max 53.11 ± 0.02 2.25 ± 0.35 2.58 ± 0.57 0.012 4.37 ± 0.28 TELa 5.9 0.6 37.3 0.174 35 LELa 6 0.6 26 0.2 31 METa 7 0.9 55 0.2 42 ERLa 33 5 80 0.15 46.7 Consensus-based TECa 9.79 0.99 43.5 0.18 35.8 Bckgr. 0.08 0.186 18.79 39.8 53.71
Vol:.(1234567890)
Research Discover Water (2021) 1:3 | https://doi.org/10.1007/s43832-021-00003-5
1 3
USEPA/WHO. The maximum Cd value was 112× more elevated than the USEPA and WHO recommended values. For these two elements, an anthropogenic influence on their respective levels cannot be ruled out.
Although not as enriched as arsenic and cadmium, nevertheless, Cr followed a similar trend—with high concentra-tions in the dry period and low concentrations in the wet period. For Hg, the dry period samples at all sites had higher concentrations than their wet period counterparts, with most of the wet period values close to zero. The highest Hg concentration was found to be 20× and 15× than the USEPA Hg guideline (0.02 mg/L) in the dry and wet period, respec-tively. Similarly, Pb was more enriched at all sites in the dry period than it was in the wet period. However, Pb values when compared to both the USEPA and WHO guidelines were extensively higher. Pb in the dry and wet period was higher than the USEPA guideline value by a factor of 50 and 37, respectively. Additionally, Pb exceeded the WHO guideline by a factor of 76 and 56 in the dry and wet period, respectively. The message to the government, researchers, and water authorities is that there need to be concerted efforts to monitor and regulate toxic elements in surface water in the studied area. Alternative sources of water for farming, livestock watering, drinking, and other domestic uses should be availed to com-munities in the study area, especially during the dry period—to avoid health risks associated with consuming water with elevated levels of toxic substances.
4.4 Correlation analysis
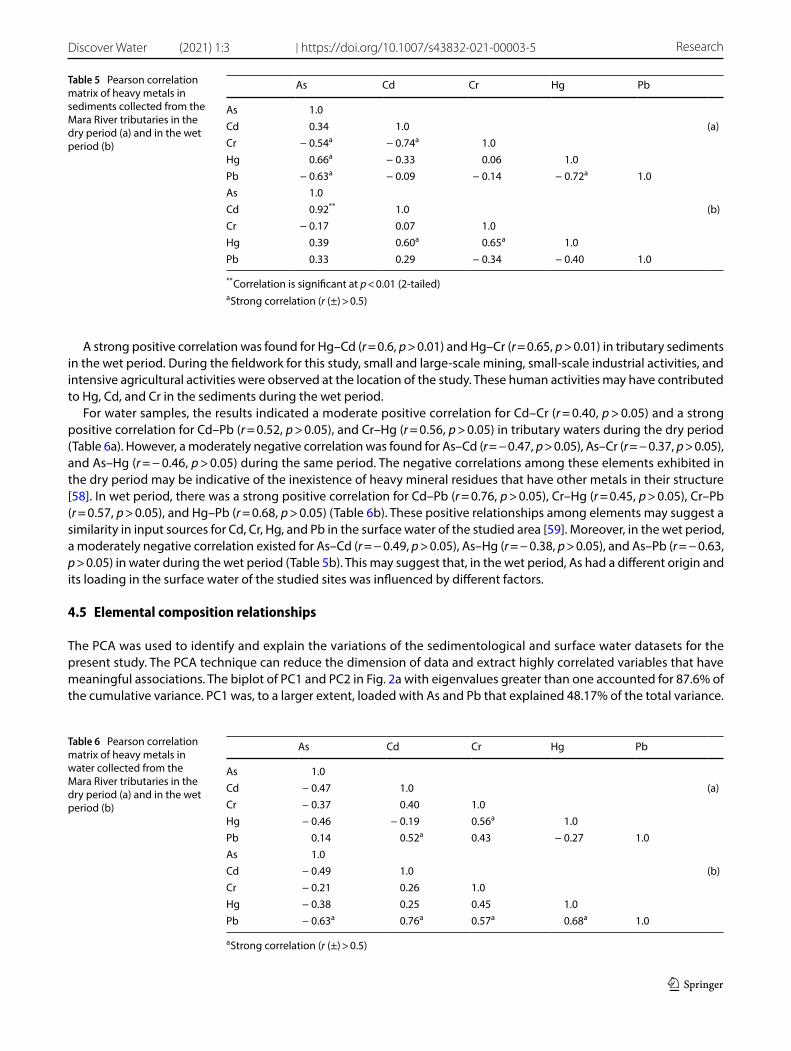
From the Pearson correlation matrix (Table 5a), the results showed that there was a positive correlation between As and Hg (r = 0.66, p > 0.01) in sediments in the dry period. Sediment arsenic and mercury correlated strongly and positively in the dry period, implying that the two elements had similar input sources [56]. Furthermore, strong negative correlations were found for As–Cr (r = − 0.54, p > 0.05), As–Pb (r = − 0.63, p > 0.05), Cd–Cr (r = − 0.74, p > 0.05), and Hg–Pb (r = − 0.72, p > 0.05 in the dry period. These strong negative correlations among heavy metals may mean that they compete for binding sites in the sediments or have diversity in input sources or differ in interaction mechanisms with the tributary sediments in the dry period of the year [57]. In the wet period, As was significantly and strongly correlated with Cd (r = 0.92, p < 0.01) (Table 5b). This may imply that during the wet period Cd and As loaded in the sediments through similar pathways, their sedimentation behavior followed a similar pattern [57].
Table 4 Concentration of heavy metals in surface water collected from the river tributaries in the dry and wet periods of 2019
USEPA United States Environmental Protection Agency, WHO World Health Organization, SD Standard deviation
Elemental concentrations ± SD (mg/L)
Sampling site As Cd Cr Hg Pb
Dry period (May 2019) Tobora 0.47 ± 0.06 0.56 ± 0.60 0.53 ± 0.06 0.01 0.59 ± 0.06 Somoche 0.37 ± 0.05 0.52 ± 0.07 0.46 ± 0.05 0.03 ± 0.01 0.42 ± 0.07 Gurubi 0.32 ± 0.05 0.74 ± 0.10 0.55 ± 0.06 0.01 0.76 ± 0.09 Tigithe 0.23 ± 0.08 0.62 ± 0.06 0.47 ± 0.03 0.01 0.66 ± 0.05 Nyarwera 0.09 ± 0.03 0.66 ± 0.10 0.57 ± 0.06 0.03 ± 0.01 0.40 ± 0.05 Nyarusondobiro 0.22 0.63 ± 0.05 0.68 ± 0.09 0.04 0.75 ± 0.06 Min 0.09 ± 0.03 0.52 ± 0.07 0.46 ± 0.05 0.01 0.40 ± 0.05 Max 0.47 ± 0.06 0.74 ± 0.10 0.68 ± 0.09 0.04 0.76 ± 0.09
Wet period (October 2019) Tobora 0.40 ± 0.03 0.24 ± 0.03 0.42 ± 0.03 0 0.30 ± 0.04 Somoche 0.34 ± 0.07 0.42 ± 0.00 0.35 ± 0.03 0.02 0.41 ± 0.04 Gurubi 0.29 ± 0.02 0.40 ± 0.03 0.53 ± 0.06 0 0.34 ± 0.04 Tigithe 0.20 ± 0.04 0.31 ± 0.04 0.20 ± 0.05 0 0.28 ± 0.04 Nyarwera 0.09 ± 0.03 0.48 ± 0.03 0.55 ± 0.03 0.02 0.56 Nyarusondobiro 0.22 ± 0.00 0.28 ± 0.03 0.55 ± 0.03 0.03 0.39 ± 0.03 Min 0.09 ± 0.03 0.24 ± 0.03 0.20 ± 0.05 0 0.28 ± 0.04 Max 0.40 ± 0.03 0.48 ± 0.03 0.55 ± 0.03 0.03 0.56 USEPA 0.01 0.005 0.1 0.002 0.015 WHO 0.01 0.005 0.05 0.006 0.01
Vol.:(0123456789)
Discover Water (2021) 1:3 | https://doi.org/10.1007/s43832-021-00003-5 Research
1 3
A strong positive correlation was found for Hg–Cd (r = 0.6, p > 0.01) and Hg–Cr (r = 0.65, p > 0.01) in tributary sediments in the wet period. During the fieldwork for this study, small and large-scale mining, small-scale industrial activities, and intensive agricultural activities were observed at the location of the study. These human activities may have contributed to Hg, Cd, and Cr in the sediments during the wet period.
For water samples, the results indicated a moderate positive correlation for Cd–Cr (r = 0.40, p > 0.05) and a strong positive correlation for Cd–Pb (r = 0.52, p > 0.05), and Cr–Hg (r = 0.56, p > 0.05) in tributary waters during the dry period (Table 6a). However, a moderately negative correlation was found for As–Cd (r = − 0.47, p > 0.05), As–Cr (r = − 0.37, p > 0.05), and As–Hg (r = − 0.46, p > 0.05) during the same period. The negative correlations among these elements exhibited in the dry period may be indicative of the inexistence of heavy mineral residues that have other metals in their structure [58]. In wet period, there was a strong positive correlation for Cd–Pb (r = 0.76, p > 0.05), Cr–Hg (r = 0.45, p > 0.05), Cr–Pb (r = 0.57, p > 0.05), and Hg–Pb (r = 0.68, p > 0.05) (Table 6b). These positive relationships among elements may suggest a similarity in input sources for Cd, Cr, Hg, and Pb in the surface water of the studied area [59]. Moreover, in the wet period, a moderately negative correlation existed for As–Cd (r = − 0.49, p > 0.05), As–Hg (r = − 0.38, p > 0.05), and As–Pb (r = − 0.63, p > 0.05) in water during the wet period (Table 5b). This may suggest that, in the wet period, As had a different origin and its loading in the surface water of the studied sites was influenced by different factors.
4.5 Elemental composition relationships
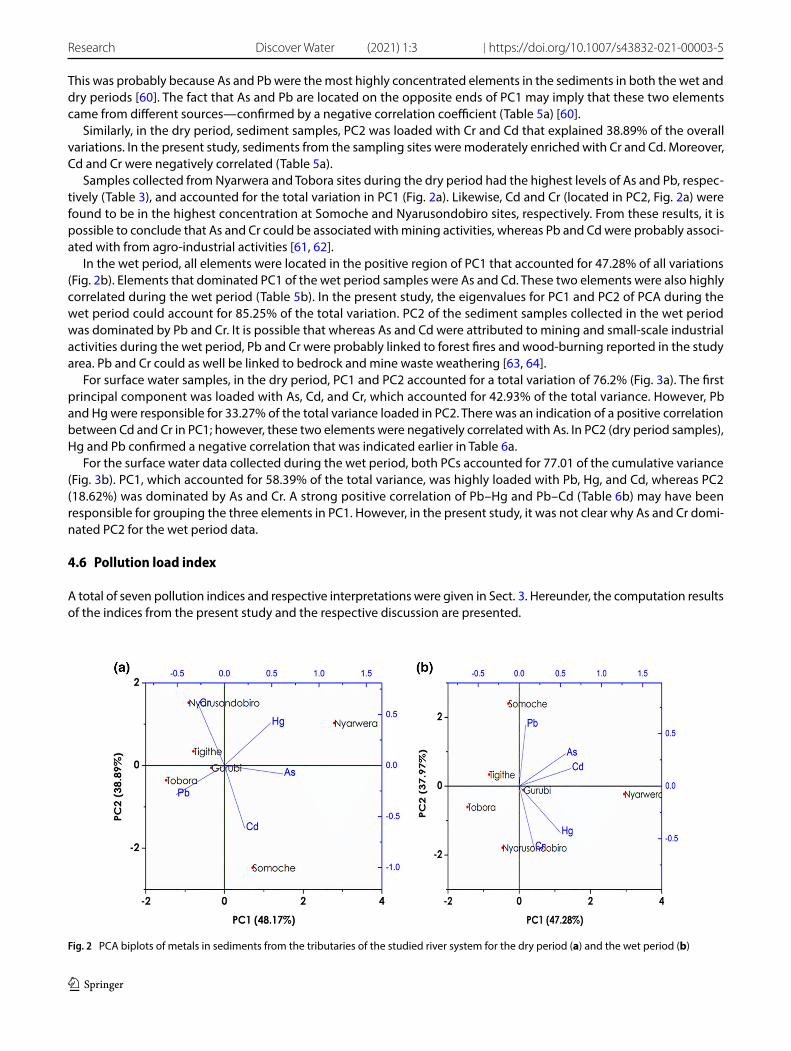
The PCA was used to identify and explain the variations of the sedimentological and surface water datasets for the present study. The PCA technique can reduce the dimension of data and extract highly correlated variables that have meaningful associations. The biplot of PC1 and PC2 in Fig. 2a with eigenvalues greater than one accounted for 87.6% of the cumulative variance. PC1 was, to a larger extent, loaded with As and Pb that explained 48.17% of the total variance.
Table 5 Pearson correlation matrix of heavy metals in sediments collected from the Mara River tributaries in the dry period (a) and in the wet period (b)
** Correlation is significant at p < 0.01 (2-tailed)a Strong correlation (r (±) > 0.5)
As Cd Cr Hg Pb
As 1.0Cd 0.34 1.0 (a)Cr − 0.54a − 0.74a 1.0Hg 0.66a − 0.33 0.06 1.0Pb − 0.63a − 0.09 − 0.14 − 0.72a 1.0As 1.0Cd 0.92** 1.0 (b)Cr − 0.17 0.07 1.0Hg 0.39 0.60a 0.65a 1.0Pb 0.33 0.29 − 0.34 − 0.40 1.0
Table 6 Pearson correlation matrix of heavy metals in water collected from the Mara River tributaries in the dry period (a) and in the wet period (b)
a Strong correlation (r (±) > 0.5)
As Cd Cr Hg Pb
As 1.0Cd − 0.47 1.0 (a)Cr − 0.37 0.40 1.0Hg − 0.46 − 0.19 0.56a 1.0Pb 0.14 0.52a 0.43 − 0.27 1.0As 1.0Cd − 0.49 1.0 (b)Cr − 0.21 0.26 1.0Hg − 0.38 0.25 0.45 1.0Pb − 0.63a 0.76a 0.57a 0.68a 1.0
Vol:.(1234567890)
Research Discover Water (2021) 1:3 | https://doi.org/10.1007/s43832-021-00003-5
1 3
This was probably because As and Pb were the most highly concentrated elements in the sediments in both the wet and dry periods [60]. The fact that As and Pb are located on the opposite ends of PC1 may imply that these two elements came from different sources—confirmed by a negative correlation coefficient (Table 5a) [60].
Similarly, in the dry period, sediment samples, PC2 was loaded with Cr and Cd that explained 38.89% of the overall variations. In the present study, sediments from the sampling sites were moderately enriched with Cr and Cd. Moreover, Cd and Cr were negatively correlated (Table 5a).
Samples collected from Nyarwera and Tobora sites during the dry period had the highest levels of As and Pb, respec-tively (Table 3), and accounted for the total variation in PC1 (Fig. 2a). Likewise, Cd and Cr (located in PC2, Fig. 2a) were found to be in the highest concentration at Somoche and Nyarusondobiro sites, respectively. From these results, it is possible to conclude that As and Cr could be associated with mining activities, whereas Pb and Cd were probably associ-ated with from agro-industrial activities [61, 62].
In the wet period, all elements were located in the positive region of PC1 that accounted for 47.28% of all variations (Fig. 2b). Elements that dominated PC1 of the wet period samples were As and Cd. These two elements were also highly correlated during the wet period (Table 5b). In the present study, the eigenvalues for PC1 and PC2 of PCA during the wet period could account for 85.25% of the total variation. PC2 of the sediment samples collected in the wet period was dominated by Pb and Cr. It is possible that whereas As and Cd were attributed to mining and small-scale industrial activities during the wet period, Pb and Cr were probably linked to forest fires and wood-burning reported in the study area. Pb and Cr could as well be linked to bedrock and mine waste weathering [63, 64].
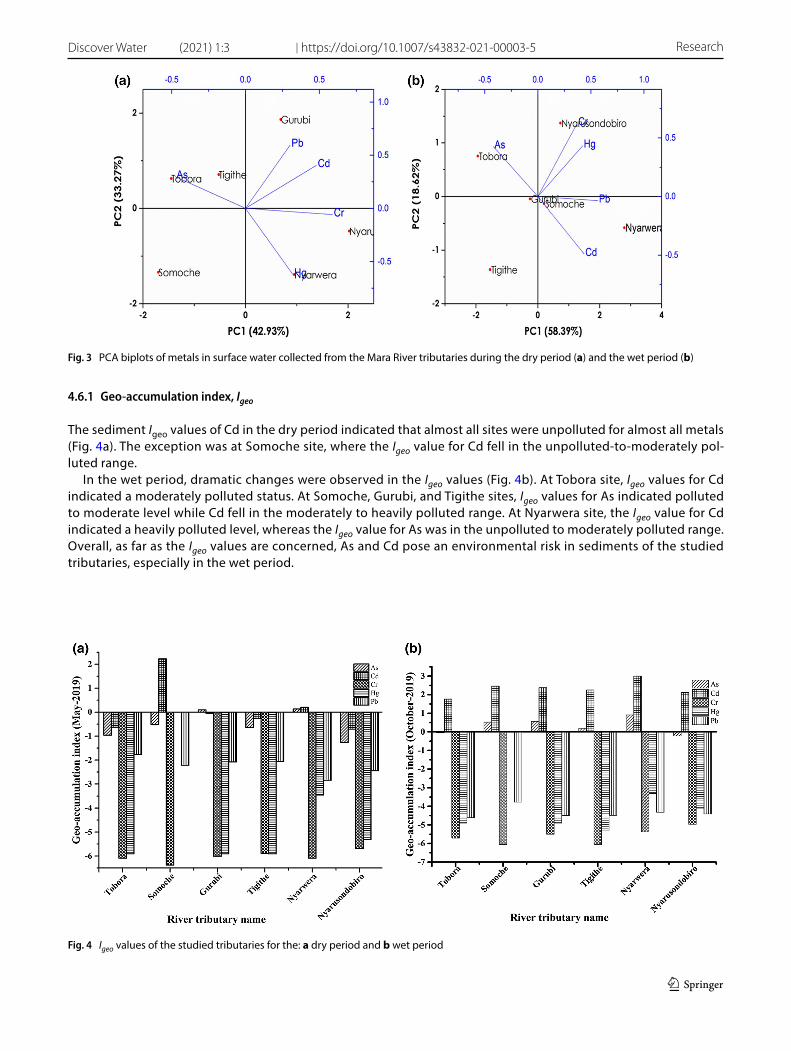
For surface water samples, in the dry period, PC1 and PC2 accounted for a total variation of 76.2% (Fig. 3a). The first principal component was loaded with As, Cd, and Cr, which accounted for 42.93% of the total variance. However, Pb and Hg were responsible for 33.27% of the total variance loaded in PC2. There was an indication of a positive correlation between Cd and Cr in PC1; however, these two elements were negatively correlated with As. In PC2 (dry period samples), Hg and Pb confirmed a negative correlation that was indicated earlier in Table 6a.
For the surface water data collected during the wet period, both PCs accounted for 77.01 of the cumulative variance (Fig. 3b). PC1, which accounted for 58.39% of the total variance, was highly loaded with Pb, Hg, and Cd, whereas PC2 (18.62%) was dominated by As and Cr. A strong positive correlation of Pb–Hg and Pb–Cd (Table 6b) may have been responsible for grouping the three elements in PC1. However, in the present study, it was not clear why As and Cr domi-nated PC2 for the wet period data.
4.6 Pollution load index
A total of seven pollution indices and respective interpretations were given in Sect. 3. Hereunder, the computation results of the indices from the present study and the respective discussion are presented.
Fig. 2 PCA biplots of metals in sediments from the tributaries of the studied river system for the dry period (a) and the wet period (b)
Vol.:(0123456789)
Discover Water (2021) 1:3 | https://doi.org/10.1007/s43832-021-00003-5 Research
1 3
4.6.1 Geo‑accumulation index, Igeo
The sediment Igeo values of Cd in the dry period indicated that almost all sites were unpolluted for almost all metals (Fig. 4a). The exception was at Somoche site, where the Igeo value for Cd fell in the unpolluted-to-moderately pol-luted range.
In the wet period, dramatic changes were observed in the Igeo values (Fig. 4b). At Tobora site, Igeo values for Cd indicated a moderately polluted status. At Somoche, Gurubi, and Tigithe sites, Igeo values for As indicated polluted to moderate level while Cd fell in the moderately to heavily polluted range. At Nyarwera site, the Igeo value for Cd indicated a heavily polluted level, whereas the Igeo value for As was in the unpolluted to moderately polluted range. Overall, as far as the Igeo values are concerned, As and Cd pose an environmental risk in sediments of the studied tributaries, especially in the wet period.
Fig. 3 PCA biplots of metals in surface water collected from the Mara River tributaries during the dry period (a) and the wet period (b)
Fig. 4 Igeo values of the studied tributaries for the: a dry period and b wet period
Vol:.(1234567890)
Research Discover Water (2021) 1:3 | https://doi.org/10.1007/s43832-021-00003-5
1 3
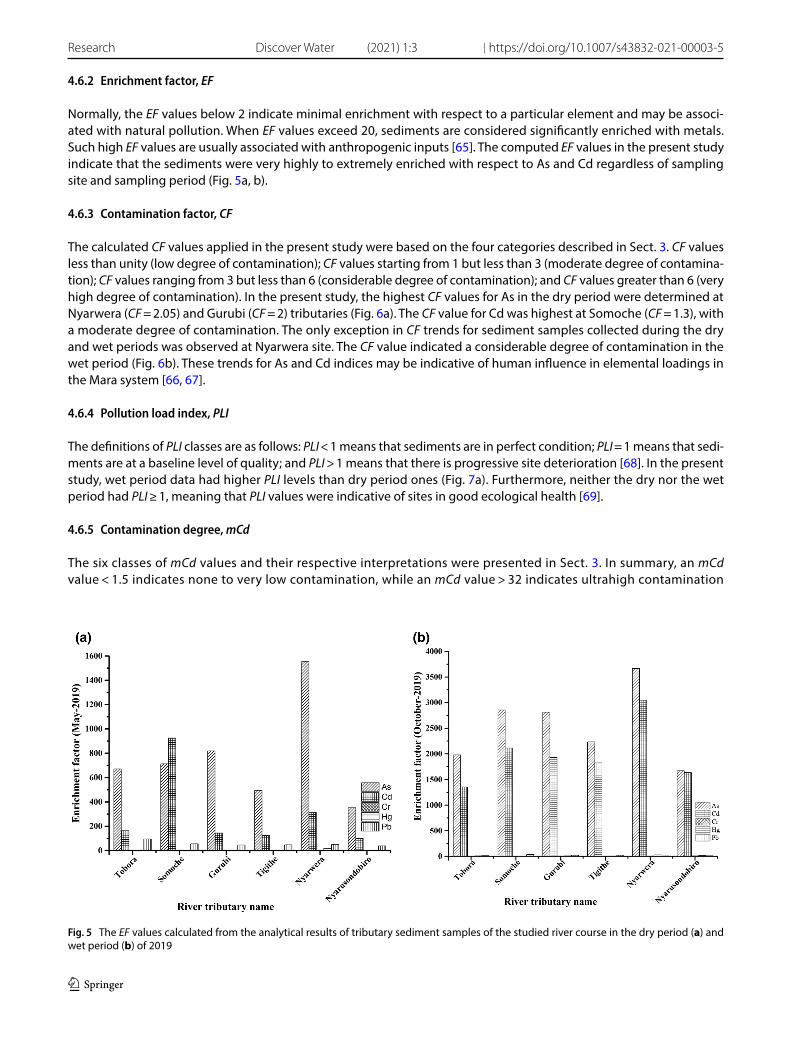
4.6.2 Enrichment factor, EF
Normally, the EF values below 2 indicate minimal enrichment with respect to a particular element and may be associ-ated with natural pollution. When EF values exceed 20, sediments are considered significantly enriched with metals. Such high EF values are usually associated with anthropogenic inputs [65]. The computed EF values in the present study indicate that the sediments were very highly to extremely enriched with respect to As and Cd regardless of sampling site and sampling period (Fig. 5a, b).
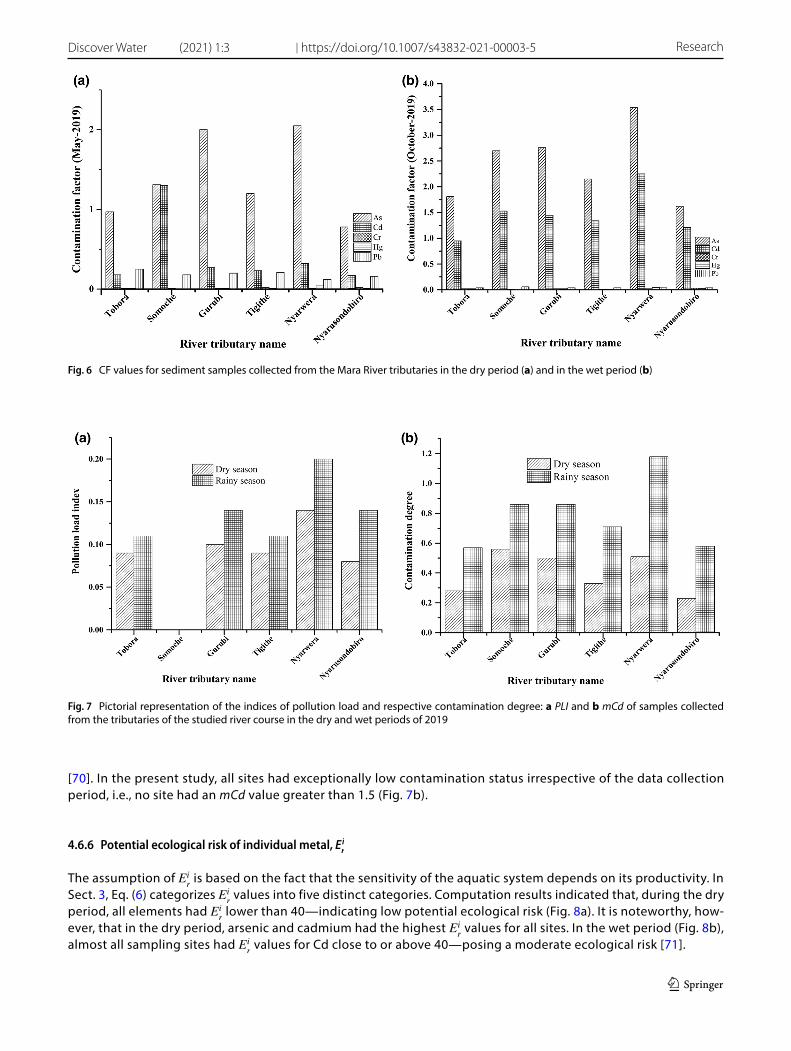
4.6.3 Contamination factor, CF
The calculated CF values applied in the present study were based on the four categories described in Sect. 3. CF values less than unity (low degree of contamination); CF values starting from 1 but less than 3 (moderate degree of contamina-tion); CF values ranging from 3 but less than 6 (considerable degree of contamination); and CF values greater than 6 (very high degree of contamination). In the present study, the highest CF values for As in the dry period were determined at Nyarwera (CF = 2.05) and Gurubi (CF = 2) tributaries (Fig. 6a). The CF value for Cd was highest at Somoche (CF = 1.3), with a moderate degree of contamination. The only exception in CF trends for sediment samples collected during the dry and wet periods was observed at Nyarwera site. The CF value indicated a considerable degree of contamination in the wet period (Fig. 6b). These trends for As and Cd indices may be indicative of human influence in elemental loadings in the Mara system [66, 67].
4.6.4 Pollution load index, PLI
The definitions of PLI classes are as follows: PLI < 1 means that sediments are in perfect condition; PLI = 1 means that sedi-ments are at a baseline level of quality; and PLI > 1 means that there is progressive site deterioration [68]. In the present study, wet period data had higher PLI levels than dry period ones (Fig. 7a). Furthermore, neither the dry nor the wet period had PLI ≥ 1, meaning that PLI values were indicative of sites in good ecological health [69].
4.6.5 Contamination degree, mCd
The six classes of mCd values and their respective interpretations were presented in Sect. 3. In summary, an mCd value < 1.5 indicates none to very low contamination, while an mCd value > 32 indicates ultrahigh contamination
Fig. 5 The EF values calculated from the analytical results of tributary sediment samples of the studied river course in the dry period (a) and wet period (b) of 2019
Vol.:(0123456789)
Discover Water (2021) 1:3 | https://doi.org/10.1007/s43832-021-00003-5 Research
1 3
[70]. In the present study, all sites had exceptionally low contamination status irrespective of the data collection period, i.e., no site had an mCd value greater than 1.5 (Fig. 7b).
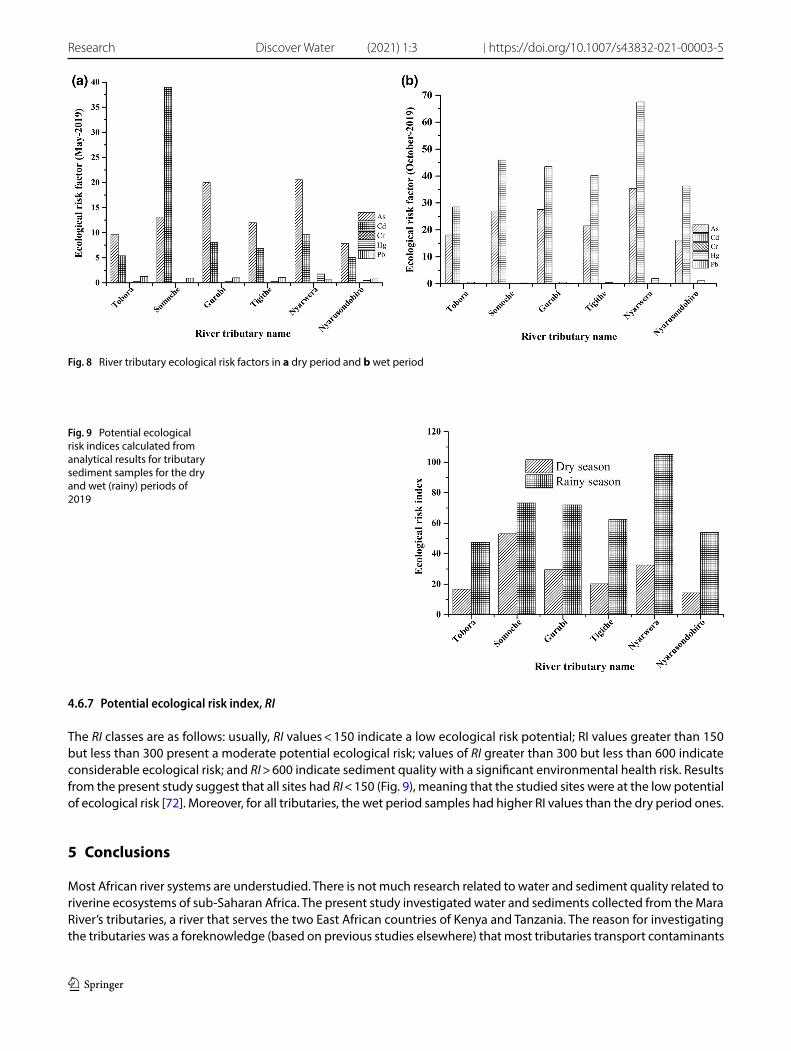
4.6.6 Potential ecological risk of individual metal, Eir
The assumption of Eir is based on the fact that the sensitivity of the aquatic system depends on its productivity. In
Sect. 3, Eq. (6) categorizes Eir values into five distinct categories. Computation results indicated that, during the dry
period, all elements had Eir lower than 40—indicating low potential ecological risk (Fig. 8a). It is noteworthy, how-
ever, that in the dry period, arsenic and cadmium had the highest Eir values for all sites. In the wet period (Fig. 8b),
almost all sampling sites had Eir values for Cd close to or above 40—posing a moderate ecological risk [71].
Fig. 6 CF values for sediment samples collected from the Mara River tributaries in the dry period (a) and in the wet period (b)
Fig. 7 Pictorial representation of the indices of pollution load and respective contamination degree: a PLI and b mCd of samples collected from the tributaries of the studied river course in the dry and wet periods of 2019
Vol:.(1234567890)
Research Discover Water (2021) 1:3 | https://doi.org/10.1007/s43832-021-00003-5
1 3
4.6.7 Potential ecological risk index, RI
The RI classes are as follows: usually, RI values < 150 indicate a low ecological risk potential; RI values greater than 150 but less than 300 present a moderate potential ecological risk; values of RI greater than 300 but less than 600 indicate considerable ecological risk; and RI > 600 indicate sediment quality with a significant environmental health risk. Results from the present study suggest that all sites had RI < 150 (Fig. 9), meaning that the studied sites were at the low potential of ecological risk [72]. Moreover, for all tributaries, the wet period samples had higher RI values than the dry period ones.
5 Conclusions
Most African river systems are understudied. There is not much research related to water and sediment quality related to riverine ecosystems of sub-Saharan Africa. The present study investigated water and sediments collected from the Mara River’s tributaries, a river that serves the two East African countries of Kenya and Tanzania. The reason for investigating the tributaries was a foreknowledge (based on previous studies elsewhere) that most tributaries transport contaminants
Fig. 8 River tributary ecological risk factors in a dry period and b wet period
Fig. 9 Potential ecological risk indices calculated from analytical results for tributary sediment samples for the dry and wet (rainy) periods of 2019
Vol.:(0123456789)
Discover Water (2021) 1:3 | https://doi.org/10.1007/s43832-021-00003-5 Research
1 3
into rivers. By assessing the sediment and water quality in tributaries, meaningful assertations can be deduced about the river’s condition.
The present study gauged the influence of rain and drought on the geochemistry, levels of heavy metals and envi-ronmental pollution risks in sediments and surface water. Dry weather conditions resulted in high turbidity, high sedi-ment Pb, and high content of heavy metals in surface water. Levels of heavy metals in surface water were far above the stipulated USEPA and WHO guidelines. Comparing the present study results with the SQGs, it was found that As and Cd levels in sediments exceeded most of the SQGs regardless of the sampling period. Likewise, As and Cd were found to pose the highest environmental risk in the dry and wet periods. Furthermore, As and Pb loading occupied PC1 of the PCA, implying their high contribution to sediment pollution in the dry period. From the Pearson correlation, PCA, and pollution indices, the present study concludes that elemental loadings in sediments and surface water with respect to As, Cd, and Pb were probably associated with anthropogenic inputs.
Acknowledgements The authors wish to acknowledge the Water Infrastructure and Sustainable Energy Futures (WISE-Futures) for providing support for the present study. The authors wish to thank the WISE-Futures staff and leaders for enhancing and promoting the learning and research environment in Tanzania. Sincere thanks are extended to Mr. Nestory Manyanza (Head of Water Quality Laboratory Department—Musoma, Tanzania), Mr. Shabani Nyamsalikah, Allein Saria, Makunja Kikyo and Tueni Hega, who provided field assistance and technical sup-port during sampling.
Authors’ contributions MSN was responsible for the initial conceptualization of research and led the data acquisition efforts. MJR refined the original research concept and aided in data collection and laboratory supervision. MSN and JNI performed the analysis and prepared the first draft of the manuscript. KNN revised the manuscript and improved the English language of the manuscript drafts. All authors reviewed and refined the final manuscript before submission. All authors read and approved the final manuscript.
Funding Not applicable.
Availability of data and materials All data generated or analysed during this study are included in this published article.
Declarations
Ethics approval Not applicable.
Consent to participate Not applicable.
Consent to publish Not applicable.
Competing interests The authors declare no competing interests.
Open Access This article is licensed under a Creative Commons Attribution 4.0 International License, which permits use, sharing, adapta-tion, distribution and reproduction in any medium or format, as long as you give appropriate credit to the original author(s) and the source, provide a link to the Creative Commons licence, and indicate if changes were made. The images or other third party material in this article are included in the article’s Creative Commons licence, unless indicated otherwise in a credit line to the material. If material is not included in the article’s Creative Commons licence and your intended use is not permitted by statutory regulation or exceeds the permitted use, you will need to obtain permission directly from the copyright holder. To view a copy of this licence, visit http://creativecommons.org/licenses/by/4.0/.
References
1. Oves M, et al. Heavy metals: biological importance and detoxification strategies. J Bioremed Biodegrad. 2016. https:// doi. org/ 10. 4172/ 2155- 6199. 10003 34.
2. Sankhla MS, et al. Heavy metals contamination in water and their hazardous effect on human health. Int J Curr Microbiol App Sci. 2016. https:// doi. org/ 10. 20546/ ijcmas. 2016. 510. 082.
3. Jaishankar M, et al. Toxicity, mechanism and health effects of some heavy metals. Interdiscip Toxicol. 2014. https:// doi. org/ 10. 2478/ intox- 2014- 0009.
4. Shakoor MB, et al. Heavy metal pollution, a global problem and its remediation by chemically enhanced phytoremediation. J Biol Environ Sci. 2013;3(3):12–20.
5. Abah J, Mashebe P, Onjefu SA. Preliminary assessment of some heavy metals pollution status of Lisikili River Water in Zambezi region, Namibia. IJEPR. 2016;4(2):13–30.
Vol:.(1234567890)
Research Discover Water (2021) 1:3 | https://doi.org/10.1007/s43832-021-00003-5
1 3
6. Kihwele ES, et al. Upstream land-use negatively affects river flow dynamics in the Serengeti National Park. Ecohydrol Hydrobiol. 2021;21(1):1–12.
7. Dutton CL, et al. A 2000-year sediment record reveals rapidly changing sedimentation and land use since the 1960s in the Upper Mara-Serengeti Ecosystem. Sci Total Environ. 2019;664:148–60.
8. Mayo AW, Marwa M, Norbert J. The role of Mara River basin wetland in reduction of nitrogen load to Lake Victoria. Int J Water Res Environ Eng. 2013. https:// doi. org/ 10. 5897/ ijwre e2013. 0444.
9. Selvi A, et al. Integrated remediation processes toward heavy metal removal/recovery from various environments. Front Environ Sci. 2019. https:// doi. org/ 10. 3389/ fenvs. 2019. 00066.
10. Kisamo DS. Environmental hazards associated with heavy metals in Lake Victoria Basin (East Africa), Tanzania. African Newsletter on Occu-pational Health and Safety 2003. https:// cites eerx. ist. psu. edu/ viewd oc/ downl oad? doi= 10.1. 1. 964. 8077& rep= rep1& type= pdf. Accessed 05 Apr 2021.
11. Makundi IN. A study of heavy metal pollution in Lake Victoria sediments by energy dispersive x-ray fluorescence. J Environ Sci Health A. 2001. https:// doi. org/ 10. 1081/ ese- 10010 4120.
12. Henry L, Mamboya F. Distribution of metals along Simiyu Wetland of Lake Victoria basin and its impact on agriculture. J Wet Ecol. 2012;6:31–43.
13. Mayo AW, Muraza M, Norbert J. Modelling nitrogen transformation and removal in mara river basin wetlands upstream of lake Victoria. Phys Chem Earth Parts A/B/C. 2018;105:136–46.
14. Mng’ong’o M, et al. Toxic metals in East African agro-ecosystems: key risks for sustainable food production. J Environ Manag. 2021;294:112973.
15. Oyoo-Okoth E, et al. Monitoring exposure to heavy metals among children in Lake Victoria, Kenya: environmental and fish matrix. Eco-toxicol Environ Saf. 2010;73(7):1797–803.
16. Qingjie G, et al. Calculating pollution indices by heavy metals in ecological geochemistry assessment and a case study in Parks of Beijing. J China Univ Geosci. 2008. https:// doi. org/ 10. 1016/ s1002- 0705(08) 60042-4.
17. Liu Y, et al. Novel assessment method of heavy metal pollution in surface water: a case study of Yangping River in Lingbao City, China. Environ Eng Res. 2016. https:// doi. org/ 10. 4491/ eer. 2016. 015.
18. Ali BN, et al. Assessment of heavy metals contamination in Mamut River sediments using sediment quality guidelines and geochemical indices. Environ Monit Assess. 2015. https:// doi. org/ 10. 1007/ s10661- 014- 4190-y.
19. Harikumar PS, Prajitha K, Silpa S. Assessment of heavy metal contamination in the sediments of a river draining into a Ramsar site in the Indian Subcontinent. J Adv Lab Res Biol. 2010;1(2):1–10.
20. Anyona DN, et al. Influence of anthropogenic activities on microbial and nutrient levels along the Mara River tributaries, Kenya. Eurasia J Biosci. 2014;8:1–11.
21. Bich TN, Dhungana S, Nimnee B. A case study on water quality and ecosystem management in Mara River basin—Kenya and Tanzania. 2017. https:// doi. org/ 10. 13140/ rg.2. 2. 17241. 06249.
22. Majule AE. Towards sustainable management of natural resources in the Mara River basin in Northeast Tanzania. J Ecol Nat Environ. 2010;2(10):213–24.
23. Mwangi HM, et al. Relative contribution of land use change and climate variability on discharge of upper Mara River, Kenya. J Hydrol Reg Stud. 2016;2016(5):244–60.
24. Sayer CA, Máiz-Tomé L, Darwall WRT. Freshwater biodiversity in the Lake Victoria basin. In: Guidance for species conservation, site protec-tion, climate resilience and sustainable livelihoods. 2018, Switzerland: IUCN. 1–244.
25. EPA. Methods for collection, storage and manipulation of sediments for chemical and toxicological analyses. Technical manual 2001. p. 1–208. https:// www. epa. gov/ ocean- dumpi ng/ metho ds- colle ction- stora ge- and- manip ulati on- sedim ents- chemi cal- and- toxic ologi cal. Accessed 05 Apr 2021.
26. APHA. Standard methods for the examination of water and wastewater. 23rd ed. Washington DC: American Public Health Association; 2017. p. 1–1546.
27. Kurihara M, et al. Repeatability and reproducibility of measurements of low dissolved radiocesium concentrations in freshwater using different pre-concentration methods. J Radioanal Nucl Chem. 2019;322(2):477–85.
28. Luo W, et al. Ecological risk assessment of arsenic and metals in sediments of coastal areas of Northern Bohai and Yellow Seas, China. Ambio. 2010. https:// doi. org/ 10. 1007/ s13280- 010- 0077-5.
29. Banu Z, et al. Contamination and ecological risk assessment of heavy metal in the sediment of Turag River, Bangladesh: an index analysis approach. JWARP. 2013;5:239–48.
30. Grba N, et al. Heavy metals in neogene sedimentary rocks as a potential geogenic hazard for sediment, soil, surface and groundwater contamination (Eastern Posavina and Lopare Basin, Bosnia and Herzegovina). J Serb Chem Soc. 2015. https:// doi. org/ 10. 2298/ jsc14 03170 47g.
31. Odukoya AM, Olobaniyi SB, Abdussalam M. Metal pollution and health risk assessment of soil within an urban industrial estate, Southwest Nigeria. IJS. 2016;18(2):573–83.
32. Al-Hejuje M, Al-Saad H, Hussain N. Application of geo-accumulation index (I-geo) for assessment the sediments contamination with heavy metals at Shatt Al-Arab River-Iraq. J Sci Eng Res. 2018;5(2):342–51.
33. Zhao D, et al. Distribution, enrichment and sources of heavy metals in surface sediments of Hainan Island rivers, China. Environ Earth Sci. 2015. https:// doi. org/ 10. 1007/ s12665- 015- 4522-4.
34. Guilherme M, et al. Enrichment factor and geoaccumulation index applied to sediment samples from the Guarapiranga Reservoir, Brazil, for metal and trace element assessment. In: International nuclear Atlantic conference 2011. Brazil: Belo Horizonte, MG.
35. Zemełka G. Contamination and environmental risk assessment of heavy metals in sediments of Dobczyce Reservoir and its tributaries. Geomat Environ Eng. 2019. https:// doi. org/ 10. 7494/ geom. 2019. 13.1. 63.
36. Shen F, et al. Contamination evaluation and source identification of heavy metals in the sediments from the Lishui River watershed, Southern China. Int J Environ Res Public Health. 2019. https:// doi. org/ 10. 3390/ ijerp h1603 0336.
Vol.:(0123456789)
Discover Water (2021) 1:3 | https://doi.org/10.1007/s43832-021-00003-5 Research
1 3
37. Rezaee K, et al. Vertical distribution of heavy metals and enrichment in the South China Sea sediment cores. Int J Environ Res. 2010;4(4):877–86.
38. Javed T, Ahmad N, Mashiatullah A. Heavy metals contamination and ecological risk assessment in surface sediments of Namal Lake, Pakistan. Pol J Environ Stud. 2018. https:// doi. org/ 10. 15244/ pjoes/ 75815.
39. Ozkan EY. A new assessment of heavy metal contaminations in an eutrophicated Bay (Inner Izmir Bay, Turkey). Turk J Fish Aquat Sci. 2012;12(1):135–47.
40. Ahdy HH, Khaled A. Heavy metals contamination in sediments of the western part of Egyptian Mediterranean Sea. Aust J Basic Appl Sci. 2009;3(4):3330–6.
41. Shirani M, et al. Pollution and contamination assessment of heavy metals in the sediments of Jazmurian Playa in Southeast Iran. Sci Rep. 2020. https:// doi. org/ 10. 1038/ s41598- 020- 61838-x.
42. Krzysztof L, Danuta W, Irena K. Metal contamination of farming soils affected by industry. Environ Int. 2004. https:// doi. org/ 10. 1016/ s0160- 4120(03) 00157-0.
43. El-Anwar EA, Samy YM, Salman SA. Heavy metals hazard in Rosetta Branch sediments, Egypt. J Mater Environ Sci. 2018;9(7):2142–52. 44. Krupadam RJ, Smita P, Wate SR. Geochemical fractionation of heavy metals in sediments of the Tapi estuary. Geochem J. 2006;40:513–22. 45. Zarezadeh R, et al. Distribution and accumulation of heavy metals in sediments of the northern part of mangrove in Hara Biosphere
Reserve, Qeshm Island (Persian Gulf ). Soil Water Res. 2017. https:// doi. org/ 10. 17221/ 16/ 2016- swr. 46. Roozbahani MM, et al. Natural and anthropogenic source of heavy metals pollution in the soil samples of an industrial complex; a case
study. IJT. 2015;9(29):1336–41. 47. Edokpayi JN, et al. Evaluation of temporary seasonal variation of heavy metals and their potential ecological risk in Nzhelele River, South
Africa. Open Chem. 2017. https:// doi. org/ 10. 1515/ chem- 2017- 0033. 48. Wałkuska G, Wilczek A. Influence of discharged heated water on aquatic ecosystem fauna. Pol J Environ Stud. 2010;19(3):547–52. 49. Rajaee M, et al. Integrated assessment of artisanal and small-scale gold mining in Ghana. Int J Environ Res Public Health. 2015. https://
doi. org/ 10. 3390/ ijerp h1208 08971. 50. Baeyens W, et al. Arsenic enrichment in sediments and beaches of Brazilian coastal waters. Sci Total Environ. 2019. https:// doi. org/ 10.
1016/j. scito tenv. 2019. 05. 126. 51. Zhang H, et al. Ecological risk assessment of metals in small craft harbour sediments in Nova Scotia, Canada. Mar Pollut Bull. 2019. https://
doi. org/ 10. 1016/j. marpo lbul. 2019. 06. 068. 52. Luo C, et al. Distribution and mobilization of heavy metals at an acid mine drainage affected region in South China, a post-remediation
study. Sci Total Environ. 2020. https:// doi. org/ 10. 1016/j. scito tenv. 2020. 138122. 53. Shankar S, Shanker U, Shikha. Arsenic contamination of groundwater: a review of sources, prevalence, health risks, and strategies for
mitigation. Sci World J. 2014. https:// doi. org/ 10. 1155/ 2014/ 304524. 54. Sayadi MH, Rezaei MR, Rezaei A. Sediment toxicity and ecological risk of trace metals from streams surrounding a municipal solid waste
landfill. Bull Environ Contam Toxicol. 2015;94(5):559–63. 55. Sayadi MH, Rezaei MR, Rezaei A. Fraction distribution and bioavailability of sediment heavy metals in the environment surrounding MSW
landfill: a case study. Environ Monit Assess. 2014;187(1):4110. 56. Pal R, et al. Assessment of heavy metal pollution through index analysis for Yamuna water in Agra Region, India. Int J Curr Microbiol App
Sci. 2017. https:// doi. org/ 10. 20546/ ijcmas. 2017. 612. 166. 57. Ahmed F, et al. Geochemical study of arsenic and other trace elements in groundwater and sediments of the Old Brahmaputra River Plain,
Bangladesh. Environ Earth Sci. 2009. https:// doi. org/ 10. 1007/ s12665- 009- 0270-7. 58. Souza AM, et al. Seasonal study of concentration of heavy metals in waters from lower Sao Francisco River basin, Brazil. Braz J Biol.
2016;76(4):967–74. 59. Bhuyan S, et al. Monitoring and assessment of heavy metal contamination in surface water and sediment of the Old Brahmaputra River,
Bangladesh. Appl Water Sci. 2019. https:// doi. org/ 10. 1007/ s13201- 019- 1004-y. 60. Rezaei A, Sayadi MH. Long-term evolution of the composition of surface water from the River Gharasoo, Iran: a case study using multivari-
ate statistical techniques. Environ Geochem Health. 2015;37(2):251–61. 61. Yi L, et al. Characteristics and assessment of toxic metal contamination in surface water and sediments near a uranium mining area. Int
J Environ Res Public Health. 2020. https:// doi. org/ 10. 3390/ ijerp h1702 0548. 62. Nagaraju A, et al. Water quality analysis of the Rapur area, Andhra Pradesh, South India using multivariate techniques. Appl Water Sci.
2017;7(6):2767–77. 63. Zhou Q, et al. Total concentrations and sources of heavy metal pollution in global river and lake water bodies from 1972 to 2017. Glob
Ecol Conserv. 2020. https:// doi. org/ 10. 1016/j. gecco. 2020. e00925. 64. Commission, L.V.B. Mara River basin natural resources management institutional capacity needs assessment. 2011. http:// repos itory. eac.
int/ handle/ 11671/ 705. Accessed 05 Apr 2021. 65. Silva YJ, et al. Heavy metal concentrations and ecological risk assessment of the suspended sediments of a multi-contaminated Brazilian
watershed. Acta Sci Agron. 2018;41:1–11. 66. Álvarez AG, et al. Chemical partitioning of sediment contamination by heavy metals in the San Pedro River, Sonora, Mexico. Chem Speciat
Bioavail. 2015. https:// doi. org/ 10. 3184/ 09542 2907x 198013. 67. Gajere JN, Okegye JI. Assessment of heavy metal contamination in surface and ground water resources around Udege Mbeki mining
district, North-Central Nigeria. J Geol Geophys. 2015. https:// doi. org/ 10. 4172/ 2329- 6755. 10002 03. 68. Naggar YA, Ghorab MA, Khalil MK. Environmental pollution by heavy metals in the aquatic ecosystems of Egypt. Open Acc J Toxicol. 2018.
https:// doi. org/ 10. 19080/ oajt. 2018. 03. 555603. 69. Effendi H, et al. Ecological risk assessment of heavy metal pollution in surface sediment of Mahakam Delta, East Kalimantan. Procedia
Environ Sci. 2016. https:// doi. org/ 10. 1016/j. proenv. 2016. 03. 110. 70. Ghadimi F. Prediction of degree of soil contamination based on support vector machine and k nearest neighbor methods: a case study
in Arak, Iran. Iran J Energy Environ. 2014. https:// doi. org/ 10. 5829/ idosi. ijee. 2014. 05. 04. 02.
Vol:.(1234567890)
Research Discover Water (2021) 1:3 | https://doi.org/10.1007/s43832-021-00003-5
1 3
71. Vu CT, et al. Contamination, ecological risk and source apportionment of heavy metals in sediments and water of a contaminated river in Taiwan. Ecol Indic. 2017. https:// doi. org/ 10. 1016/j. ecoli nd. 2017. 06. 008.
72. Khodami S, et al. Assessment of heavy metal pollution in surface sediments of the Bayan Lepas area, Penang, Malaysia. Mar Pollut Bull. 2017. https:// doi. org/ 10. 1016/j. marpo lbul. 2016. 09. 038.
Publisher’s Note Springer Nature remains neutral with regard to jurisdictional claims in published maps and institutional affiliations.


![Ecological Risk Assessment of Heavy Metals in Coastal ...the highest concentrations of toxic heavy metals in marine environment are found in sediments [1,6,7]. Coastal sediments are](https://img.pdfslide.us/doc/110x75/60777613a46f6a043806f637/ecological-risk-assessment-of-heavy-metals-in-coastal-the-highest-concentrations.jpg)