Embed Size (px)
Citation preview
International Journal of Environmental Science and Development, Vol.2, No.1, February 2011 ISSN: 2010-0264
27
Abstract— Present study was focused on the assessment of
water of various water bodies in and around Bhopal. In this study water quality of Upper Lake, Kolar reservoir, Lower Lake, Shahpura Lake and Halali dam was assessed for a period of two years. Heavy metals i.e. copper and lead were studied during the study.
Index Terms—Copper, Lead, Pollution.
I. INTRODUCTION Our environment has witnessed a continuous and rapid
deterioration which cause pollution in all its abiotic and biotic components. Nowadays, water pollution is burning issue all over the world. Like other developing countries water pollution in India also reaches in alarming situation. Lakes and rivers are deed and dying in India with no plan for recovery and revival. Although the government has not sat idle, all its money seems to be lost in technical solutions that fail. Bhopal is situated in the heart of India felicitated with large numbers of water bodies in and around it. But most of the water bodies are subjected to severe pollution due to stagnant nature and numerous anthropogenic activities around them. In Bhopal, where population is approximately 18 lakhs, total waste supply is 417.94 MLD per day and total sewage is 334.5 MLD per day. Sewage from approximately 27 nallahs around the city is released into water bodies, results in deterioration of water quality of these water bodies.
Efforts to manage the lake have been implemented since long time. State government initiated many programs and projects for conservation and management of lakes in and around the city such as “Sarovar Hamari Dharohar” program (Public awareness generation program of manual weed removal) and Bhoj wetland project (A project sponsored by Japanese Bank of international cooperation, JBIC, Japan, to restrict the flow of waste directly into Lakes). Even though the situation is not too worst but it is alarming. Bhopal and its surrounding areas are facing the problem of decline of water bodies and water crisis, so there is need of a serious thought to this issue.
Due to pollution the quality and quantity of utilizable lake water decreases which ultimately results in water crisis. So there is need for continuous evaluation of water quality and pollution level in order to promote better living condition around the reservoirs and to save the reservoirs before there extreme worst condition of eutrophication. Many research
1. P.G. Department of Chemistry, S.S.L Jain College Vidisha (M.P) 2*. Makhanlal Chaturvedi University Bhopal, M.P. Pin-462011
workers carried out a similar type of studies on different reservoirs of Bhopal and surrounding area in order to formulate strategies for conservation and management of various water resources.
Present study is focused on assessment and comparison of water quality. Five water bodies (Kolar Reservoir, Halali Dam, Upper Lake, Lower Lake and Shahpura Lake) were selected on the basis of there different locations and different uses. Upper Lake, Lower Lake and Shahpura Lake are located in urban area whereas Kolar Reservoir and Halali Dam are located in rural area so there catchment area is different. Upper Lake and Kolar Reservoir are the main source of potable water in Bhopal city while the Lower Lake, Shahpura Lake and Halali Dam are mainly used for recreational and secondary purposes. All these five water resources are used for different purposes, so water pollution in these water bodies are caused by different sources.
II. MATERIAL AND METHODS The sampling stations were chosen at different places of
the area. The present study is focused on water and soil quality assessment for period of one year i.e Feb 2008 to Jan 2010. Season wise sampling is done i.e. pre- monsoon (March to June), during monsoon (July to October) and post monsoon (November to February). For testing the water samples were collected in different sterile glass bottles and Jerry cans from each station. After collection of the samples the bottles were tightly capped and were immediately transported to the laboratory to avoid any unpredictable changes in the physic-chemical characteristics. Suitable preservation techniques were adopted as per the standard methods, APHA (1995).
Selective heavy metals like Pb, Cu, etc. are determined by Atomic Absorption Spectrophotometer (Parkin Elmer Analyst 100).
III. DESCRIPTION OF SAMPLING SITE Sampling Stations U1(S & B) :
This sampling station is situated near Prempuraghat .Bathing and religious avtivities (Idol immersion) are major source of pollution. S1 is surface layer and B1 is bottom layer of this station. Sampling Station U2 (S & B) :
This sampling station is situated near Kamla Park. S2 is surface layer and B2 is bottom layer of this station. Sampling Station L1 (S & B) :
Anu1, Upadhyaya S.K 1, Bajpai Avinash
Heavy Metal Analysis of Various Water Bodies Located in and around Bhopal, M.P.(India)
International Journal of Environmental Science and Development, Vol.2, No.1, February 2011 ISSN: 2010-0264
28
This sampling station is situated near Kali Mandir .At this station lake has maximum depth of near about 10-11 meters. Main sources of pollution here are sewage and solid waste from surrounding area. S1 is surface layer and B1 is bottom layer of this station.(Photo) Sampling Stations L2 (S & B):
This sampling station is situated near Khatlapura .These sampling stations posses ozonizer type of aeration unit. Religious activity is main source of pollution here.S2 is surface layer and B2 is bottom layer of this station.(Photo). Sampling Station S1(S & B) :
This sampling station is centre of the Shahpura Lake. S1 is surface layer and B1 is bottom layer of this station. Sampling station S2(S&B)
This sampling station is point of Shahpura lake where Nalla joining from Punchsheel Nagar. From this Nalla , Lake receives domestic raw sewage from surrounding habitation.S2 is surface layer and B2 is bottom layer of this station. Sampling Station K1(S & B) :
This sampling station is located in the centre of Kolar dam. Kolar dam is located about 35 km away from Bhopal. The water in these part are almost unaffected by anthropogenic activities.S1 is surface layer and B1 is bottom layer of this station. Sampling Station K2(S & B) :
This sampling station is intake point from where water is taken for further treatment to make it suitable for drinking purposes. S2 is surface layer and B2 is bottom layer of this station. Sampling Station H1(S & B) :
These sampling stations are located in the centre of Halali dam. The dam site is located both in the Raisen and Vidisha districts of Madhya Pradesh, 40 km away from Bhopal. HS1 is surface layer and HB1 is bottom layer of this station. Sampling Station H2(S & B ) :
The drainage water of old city including wastewater of straw products and cotton Mills is carried away by a Nallah, which joins river Halali, which at last enters into Halali Dam. S2 is surface layer and B2 is bottom layer of this station.
IV. RESULT AND DISCUSSION A. Lead (Pb):
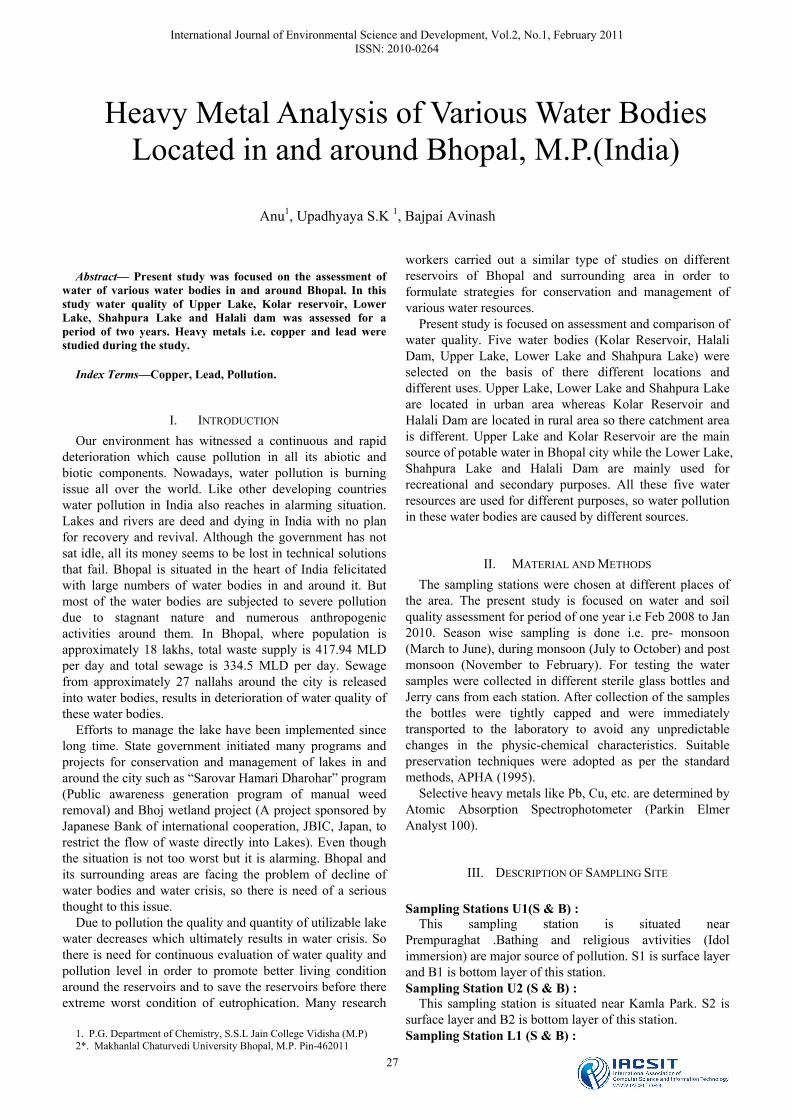
Lead is a soft metal that has known many applications over the years. Lead metal ranged from nil to 0.001 mg/l on surface while nil to 0.001 mg/l at bottom water layer in the year 2008 (fig 1) and it ranges from nil to 0.001 mg/l on surface while nil to 0.001 mg/l at bottom water layer in the year 2009 (fig 2) in Kolar Reservoir. Maximum lead metal was observed as 0.001 mg/l at KB2 during monsoon whereas minimum was noted as nil at KS1, KS2, KB1, KB2 during pre monsoon in the year 2008-09.
In present study lead metal ranged from nil to 0.0031 mg/l on surface while nil to 0.0033 mg/l at bottom water layer in the year 2008(fig 1) and it ranges from nil to 0.003 mg/l on surface while nil to 0.0034 mg/l at bottom water layer in the year 2009 (fig 2) in Halali Dam. Maximum lead metal was observed as 0.0034 mg/l at HB2 during monsoon whereas minimum was noted as nil at HS1, HS2, HB1, HB2
during pre monsoon in the year 2008-09. During present study lead metal content ranged from
0.001 to 0.010 mg/l on surface while 0.001 to 0.039 mg/l at bottom water layer in the year 2008 (fig 1) and it ranges from 0.001 to 0.011 mg/l on surface while 0.002 to 0.034 mg/l at bottom water layer in the year 2009 (fig 2) in Upper Lake. Maximum lead metal was observed as 0.039 mg/l at UB1 during monsoon whereas minimum was noted as 0.001 mg/l at US1 during pre monsoon in the year 2008-09.
In Lower Lake during the present investigation lead metal ranged from 0.009 to 0.1 mg/l on surface while 0.010 to 0.11 mg/l at bottom water layer in the year 2008 (fig 1) and it ranges from 0.008 to 0.11 mg/l on surface while 0.003 to 0.12 mg/l at bottom water layer in the year 2009 (fig 2). Maximum lead metal was observed as 0.12 mg/l at LB1 during monsoon whereas minimum was noted as 0.009 mg/l at LS2 during pre monsoon in the year 2008-09.
Lead metal ranged from 0.006 to 0.069 mg/l on surface while 0.007 to 0.07 mg/l at bottom water layer in the year 2008 (fig 1) and it ranges from 0.007 to 0.07 mg/l on surface while 0.008 to 0.08 mg/l at bottom water layer in the year 2009 (fig 2) in Shahpura Lake. Maximum lead metal was observed as 0.08 mg/l at SB2 during monsoon whereas minimum was noted as 0.006 mg/l at SS1 during pre monsoon in the year 2008-09.
Comparing Kolar Reservoir, Halali Dam and Upper Lake, maximum value of lead metal was noted as 0.039 mg/l at UB2 during monsoon and minimum nil value at KS1, KS2 during pre monsoon while comparing Lower Lake and Shahpura Lake, maximum value 0.12 mg/l was observed at LB1 in monsoon season and minimum 0.006 mg/l at SS1 during pre monsoon.Bajpai, et. al., (2009) and Anu, et. al., (2010) studied the impact of idol immersion on Lakes of Bhopal and found higher value of lead after idol immersion activity which held in winter season. B. Copper (Cu):
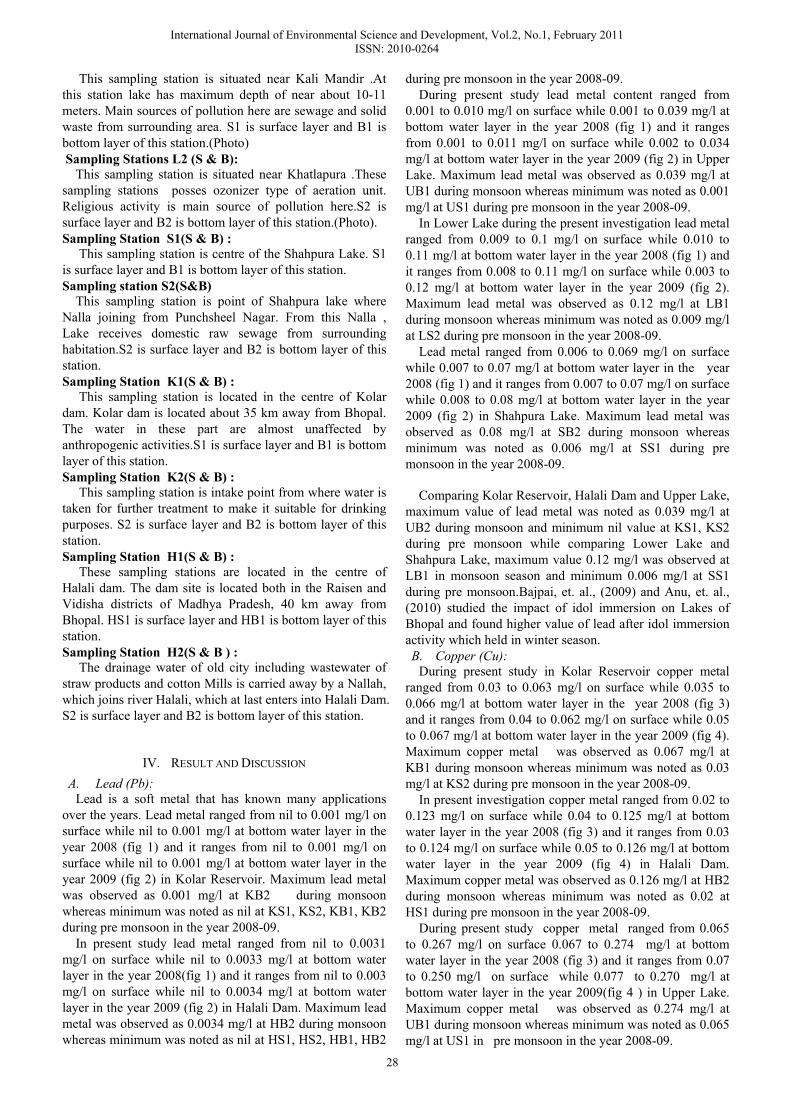
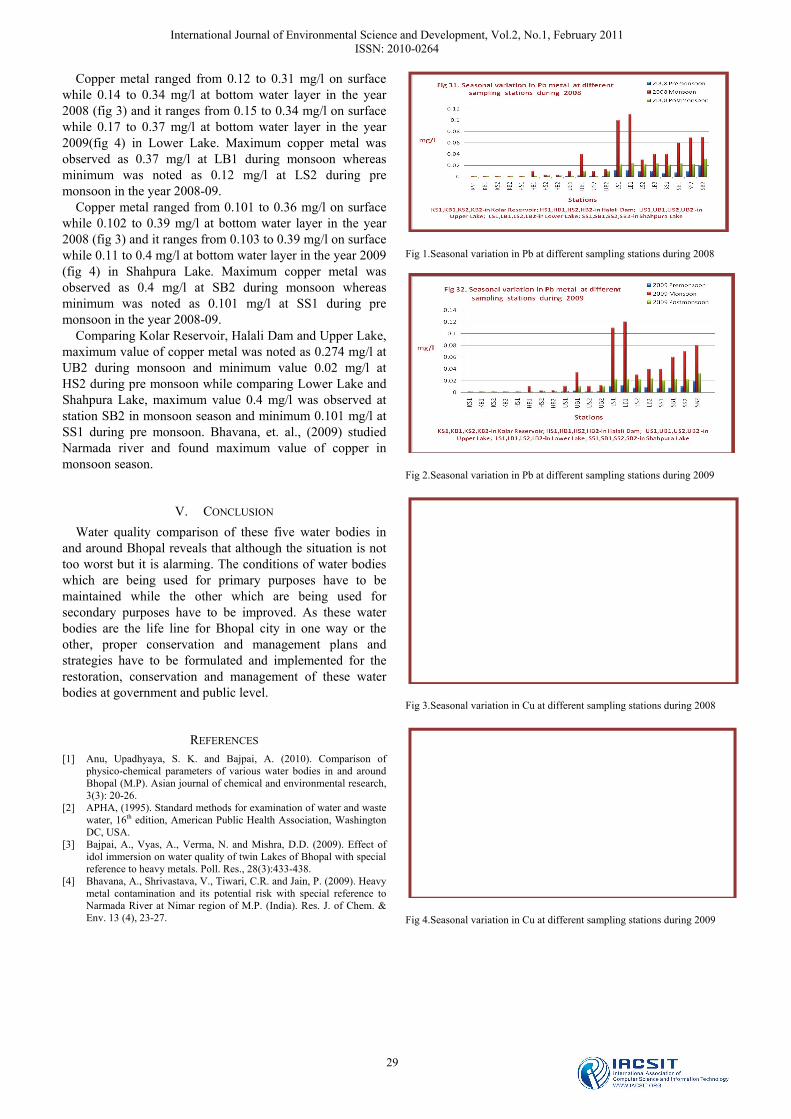
During present study in Kolar Reservoir copper metal ranged from 0.03 to 0.063 mg/l on surface while 0.035 to 0.066 mg/l at bottom water layer in the year 2008 (fig 3) and it ranges from 0.04 to 0.062 mg/l on surface while 0.05 to 0.067 mg/l at bottom water layer in the year 2009 (fig 4). Maximum copper metal was observed as 0.067 mg/l at KB1 during monsoon whereas minimum was noted as 0.03 mg/l at KS2 during pre monsoon in the year 2008-09.
In present investigation copper metal ranged from 0.02 to 0.123 mg/l on surface while 0.04 to 0.125 mg/l at bottom water layer in the year 2008 (fig 3) and it ranges from 0.03 to 0.124 mg/l on surface while 0.05 to 0.126 mg/l at bottom water layer in the year 2009 (fig 4) in Halali Dam. Maximum copper metal was observed as 0.126 mg/l at HB2 during monsoon whereas minimum was noted as 0.02 at HS1 during pre monsoon in the year 2008-09.
During present study copper metal ranged from 0.065 to 0.267 mg/l on surface 0.067 to 0.274 mg/l at bottom water layer in the year 2008 (fig 3) and it ranges from 0.07 to 0.250 mg/l on surface while 0.077 to 0.270 mg/l at bottom water layer in the year 2009(fig 4 ) in Upper Lake. Maximum copper metal was observed as 0.274 mg/l at UB1 during monsoon whereas minimum was noted as 0.065 mg/l at US1 in pre monsoon in the year 2008-09.
International Journal of Environmental Science and Development, Vol.2, No.1, February 2011 ISSN: 2010-0264
29
Copper metal ranged from 0.12 to 0.31 mg/l on surface while 0.14 to 0.34 mg/l at bottom water layer in the year 2008 (fig 3) and it ranges from 0.15 to 0.34 mg/l on surface while 0.17 to 0.37 mg/l at bottom water layer in the year 2009(fig 4) in Lower Lake. Maximum copper metal was observed as 0.37 mg/l at LB1 during monsoon whereas minimum was noted as 0.12 mg/l at LS2 during pre monsoon in the year 2008-09.
Copper metal ranged from 0.101 to 0.36 mg/l on surface while 0.102 to 0.39 mg/l at bottom water layer in the year 2008 (fig 3) and it ranges from 0.103 to 0.39 mg/l on surface while 0.11 to 0.4 mg/l at bottom water layer in the year 2009 (fig 4) in Shahpura Lake. Maximum copper metal was observed as 0.4 mg/l at SB2 during monsoon whereas minimum was noted as 0.101 mg/l at SS1 during pre monsoon in the year 2008-09.
Comparing Kolar Reservoir, Halali Dam and Upper Lake, maximum value of copper metal was noted as 0.274 mg/l at UB2 during monsoon and minimum value 0.02 mg/l at HS2 during pre monsoon while comparing Lower Lake and Shahpura Lake, maximum value 0.4 mg/l was observed at station SB2 in monsoon season and minimum 0.101 mg/l at SS1 during pre monsoon. Bhavana, et. al., (2009) studied Narmada river and found maximum value of copper in monsoon season.
V. CONCLUSION Water quality comparison of these five water bodies in
and around Bhopal reveals that although the situation is not too worst but it is alarming. The conditions of water bodies which are being used for primary purposes have to be maintained while the other which are being used for secondary purposes have to be improved. As these water bodies are the life line for Bhopal city in one way or the other, proper conservation and management plans and strategies have to be formulated and implemented for the restoration, conservation and management of these water bodies at government and public level.
REFERENCES [1] Anu, Upadhyaya, S. K. and Bajpai, A. (2010). Comparison of
physico-chemical parameters of various water bodies in and around Bhopal (M.P). Asian journal of chemical and environmental research, 3(3): 20-26.
[2] APHA, (1995). Standard methods for examination of water and waste water, 16th edition, American Public Health Association, Washington DC, USA.
[3] Bajpai, A., Vyas, A., Verma, N. and Mishra, D.D. (2009). Effect of idol immersion on water quality of twin Lakes of Bhopal with special reference to heavy metals. Poll. Res., 28(3):433-438.
[4] Bhavana, A., Shrivastava, V., Tiwari, C.R. and Jain, P. (2009). Heavy metal contamination and its potential risk with special reference to Narmada River at Nimar region of M.P. (India). Res. J. of Chem. & Env. 13 (4), 23-27.
Fig 1.Seasonal variation in Pb at different sampling stations during 2008
Fig 2.Seasonal variation in Pb at different sampling stations during 2009
Fig 3.Seasonal variation in Cu at different sampling stations during 2008
Fig 4.Seasonal variation in Cu at different sampling stations during 2009