Embed Size (px)
Citation preview
Traffic Safety Basic Facts 2013 - Main Figures
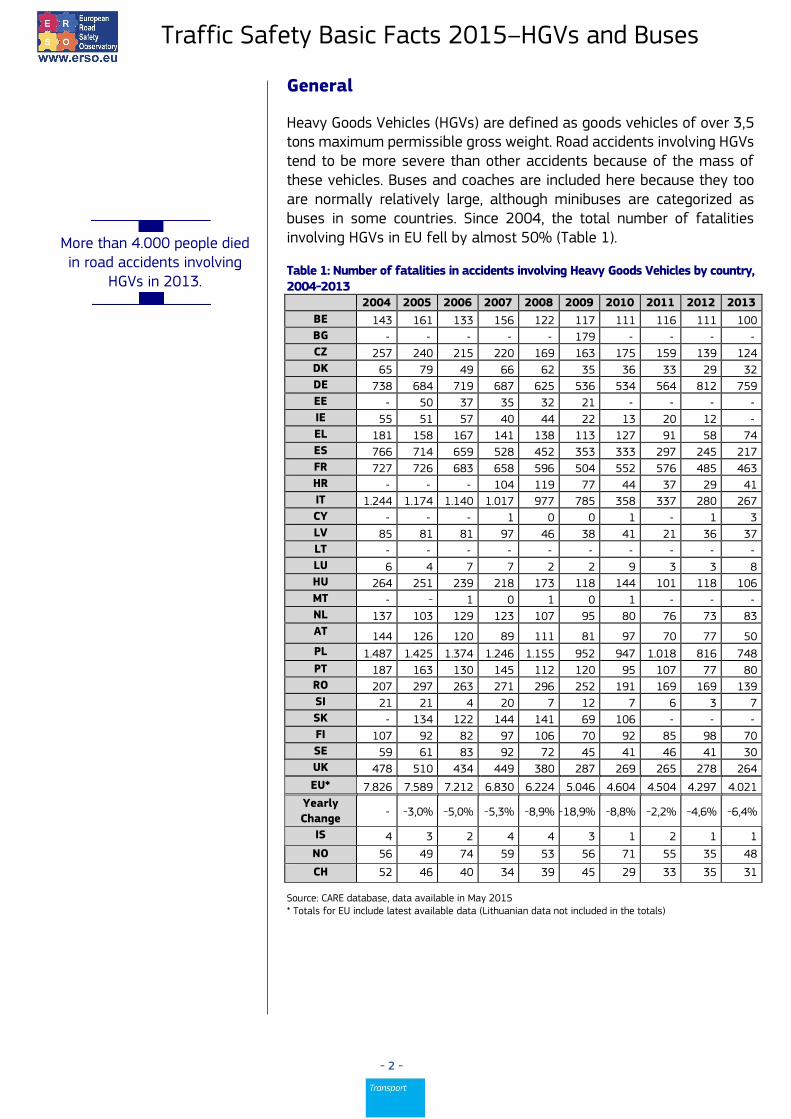
Traffic Safety Basic Facts 2015
Heavy Goods Vehicles and Buses
Traffic Safety Basic Facts 2015–HGVs and Buses
- 2 -
General
Heavy Goods Vehicles (HGVs) are defined as goods vehicles of over 3,5 tons maximum permissible gross weight. Road accidents involving HGVs tend to be more severe than other accidents because of the mass of these vehicles. Buses and coaches are included here because they too are normally relatively large, although minibuses are categorized as buses in some countries. Since 2004, the total number of fatalities involving HGVs in EU fell by almost 50% (Table 1).
Table 1: Number of fatalities in accidents involving Heavy Goods Vehicles by country, 2004-2013
2004 2005 2006 2007 2008 2009 2010 2011 2012 2013
BE 143 161 133 156 122 117 111 116 111 100
BG - - - - - 179 - - - -
CZ 257 240 215 220 169 163 175 159 139 124 DK 65 79 49 66 62 35 36 33 29 32 DE 738 684 719 687 625 536 534 564 812 759 EE - 50 37 35 32 21 - - - -
IE 55 51 57 40 44 22 13 20 12 -
EL 181 158 167 141 138 113 127 91 58 74 ES 766 714 659 528 452 353 333 297 245 217 FR 727 726 683 658 596 504 552 576 485 463 HR - - - 104 119 77 44 37 29 41 IT 1.244 1.174 1.140 1.017 977 785 358 337 280 267
CY - - - 1 0 0 1 - 1 3
LV 85 81 81 97 46 38 41 21 36 37
LT - - - - - - - - - -
LU 6 4 7 7 2 2 9 3 3 8 HU 264 251 239 218 173 118 144 101 118 106 MT - - 1 0 1 0 1 - - -
NL 137 103 129 123 107 95 80 76 73 83 AT 144 126 120 89 111 81 97 70 77 50 PL 1.487 1.425 1.374 1.246 1.155 952 947 1.018 816 748
PT 187 163 130 145 112 120 95 107 77 80 RO 207 297 263 271 296 252 191 169 169 139 SI 21 21 4 20 7 12 7 6 3 7 SK - 134 122 144 141 69 106 - - -
FI 107 92 82 97 106 70 92 85 98 70 SE 59 61 83 92 72 45 41 46 41 30 UK 478 510 434 449 380 287 269 265 278 264
EU* 7.826 7.589 7.212 6.830 6.224 5.046 4.604 4.504 4.297 4.021
Yearly
Change - -3,0% -5,0% -5,3% -8,9% -18,9% -8,8% -2,2% -4,6% -6,4%
IS 4 3 2 4 4 3 1 2 1 1
NO 56 49 74 59 53 56 71 55 35 48
CH 52 46 40 34 39 45 29 33 35 31
Source: CARE database, data available in May 2015 * Totals for EU include latest available data (Lithuanian data not included in the totals)
More than 4.000 people died in road accidents involving
HGVs in 2013.

Traffic Safety Basic Facts 2015–HGVs and Buses
- 3 -
Table 2 presents the number of people killed over the last ten years in accidents involving buses and coaches. The number of people killed in these accidents in EU fell from over 1.400 in 2004 to 736 in 2013, a fall of almost 50%. The totals from this and the previous table are presented in Figure 1. They have fallen in parallel, with approximately five times as many people killed per year in accidents involving HGVs as in accidents involving buses or coaches.
Table 2: Number of fatalities in accidents involving buses or coaches by country, 2004-2013
2004 2005 2006 2007 2008 2009 2010 2011 2012 2013
BE 31 19 31 30 23 22 17 23 31 23
BG - - - - - 58 - - - -
CZ 49 31 34 35 27 28 20 26 21 21
DK 15 11 14 20 10 9 13 3 11 3
DE 105 108 86 94 75 66 91 64 66 82
EE - 7 13 7 4 4 - - - -
IE 17 11 11 7 10 7 7 2 10 10
EL 48 53 36 35 33 33 31 29 23 22
ES 80 108 102 73 81 69 51 48 40 37
FR 99 91 76 110 80 66 60 49 61 45
HR 20 20 20 20 38 11 6 8 16 12
IT 136 108 116 91 102 71 79 75 79 88
CY - - - 0 0 0 0 0 1 0
LV 36 33 16 16 10 14 15 15 15 6
LT - - - - - - - - - -
LU 2 2 0 0 1 2 1 0 1 2
HU 58 62 64 48 33 39 41 50 26 26
MT - 1 0 1 3 0 1 - - -
NL 15 18 14 15 14 14 11 11 7 10
AT 24 10 19 17 9 15 17 1 12 8
PL 247 252 174 148 142 128 119 97 107 88
PT 41 23 13 33 21 15 21 20 18 16
RO 102 120 117 132 100 123 89 77 73 48
SI 12 8 2 2 4 8 3 3 2 4
SK - 35 35 39 15 35 18 - - -
FI 29 13 19 13 13 8 9 10 13 9
SE 16 13 36 15 13 17 16 16 18 11
UK 154 140 164 151 121 102 83 95 85 84
EU* 1.437 1.355 1.270 1.210 1.040 964 881 803 817 736
Yearly
Change -5,7% -6,3% -4,7% -14,0% -7,3% -8,6% -8,9% 1,7% -9,9%
IS 0 1 1 1 0 0 0 2 1 1
NO 24 7 7 22 11 8 10 11 10 9
CH 10 20 22 9 15 5 7 11 39 4
Source: CARE database, data available in May 2015 * Totals for EU include latest available data (Lithuanian data not included in the totals)
More than 700 people died in road accidents involving
buses or coaches in 2013.

Traffic Safety Basic Facts 2015–HGVs and Buses
- 4 -
Figure 1 shows that the number of deaths in accidents involving HGVs and in accidents involving buses or coaches fell between 2004 and 2013, but the EU total number of deaths also fell over this period.
Figure 1: Number of fatalities in accidents involving Heavy Goods Vehicles and buses or coaches, EU, 2004-2013
Source: CARE database, data available in May 2015
The risk of being killed in such an accident can be compared for each Member State using the rate of deaths per million population. These rates are shown in Table 3 and Figure 2.
The annual number of people killed in road accidents
involving HGVs, buses or coaches fell by nearly 50% between 2004 and 2013 in
EU.

Traffic Safety Basic Facts 2015–HGVs and Buses
- 5 -
Table 3: Fatality rates per million population in accidents involving HGVs and buses or coaches by country, 2013 or latest available year
HGVs accidents Bus or Coach accidents
BE 9,0 2,1
BG 24,6 8,0
CZ 11,8 2,0
DK 5,7 0,5
DE 9,3 1,0
EE 15,9 3,0
IE 2,6 2,2
EL 6,7 2,0
ES 4,6 0,8
FR 7,1 0,7
HR 9,6 2,8
IT 4,5 1,5
CY 3,5 0,0
LV 18,3 3,0
LT - -
LU 14,9 3,7
HU 10,7 2,6
MT 2,4 2,4
NL 4,9 0,6
AT 5,9 0,9
PL 19,4 2,3
PT 7,6 1,5
RO 6,9 2,4
SI 3,4 1,9
SK 19,6 3,3
FI 12,9 1,7
SE 3,1 1,2
UK 4,2 1,3
EU 7,9 1,5
IS 3,1 3,1
NO 9,3 1,8
CH 3,9 0,5
Sources: CARE database (EUROSTAT for population data), data available in May 2015
The risk of being killed in a road accident involving a
HGV is highest in Bulgaria.
Traffic Safety Basic Facts 2015–HGVs and Buses
- 6 -
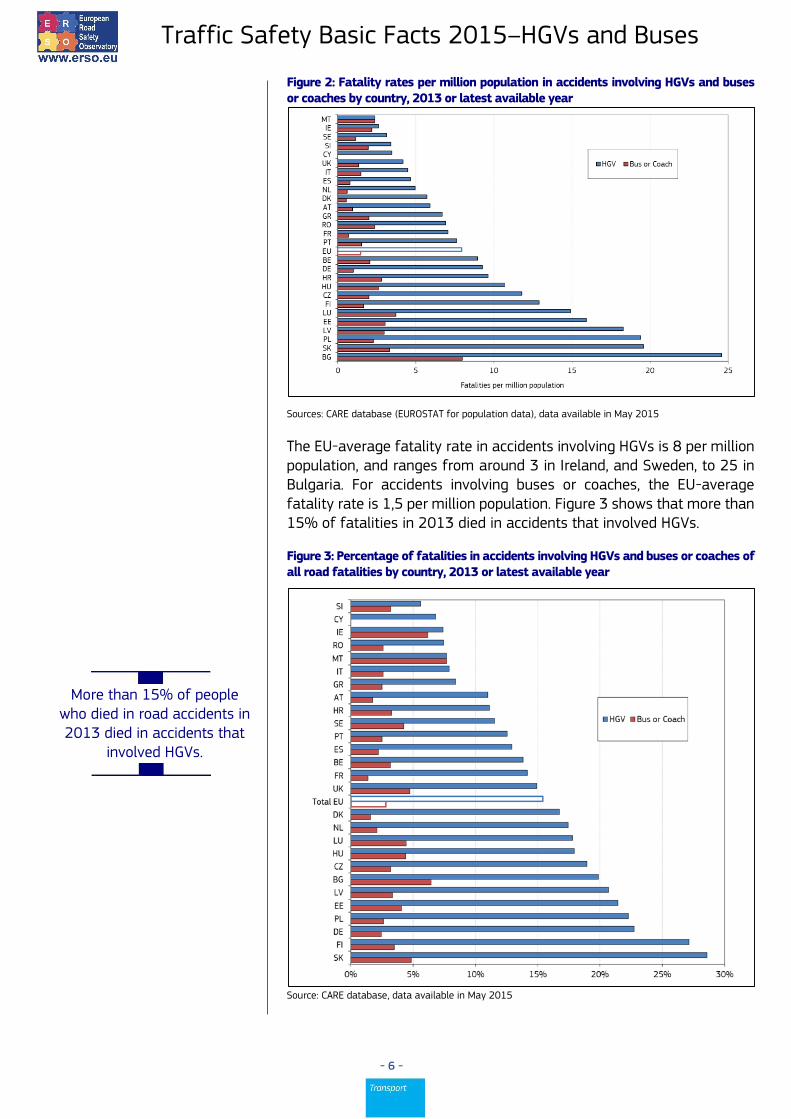
Figure 2: Fatality rates per million population in accidents involving HGVs and buses or coaches by country, 2013 or latest available year
Sources: CARE database (EUROSTAT for population data), data available in May 2015
The EU-average fatality rate in accidents involving HGVs is 8 per million population, and ranges from around 3 in Ireland, and Sweden, to 25 in Bulgaria. For accidents involving buses or coaches, the EU-average fatality rate is 1,5 per million population. Figure 3 shows that more than 15% of fatalities in 2013 died in accidents that involved HGVs.
Figure 3: Percentage of fatalities in accidents involving HGVs and buses or coaches of all road fatalities by country, 2013 or latest available year
Source: CARE database, data available in May 2015
More than 15% of people who died in road accidents in 2013 died in accidents that
involved HGVs
More than 15% of people who died in road accidents in 2013 died in accidents that
involved HGVs.
Traffic Safety Basic Facts 2015–HGVs and Buses
- 7 -
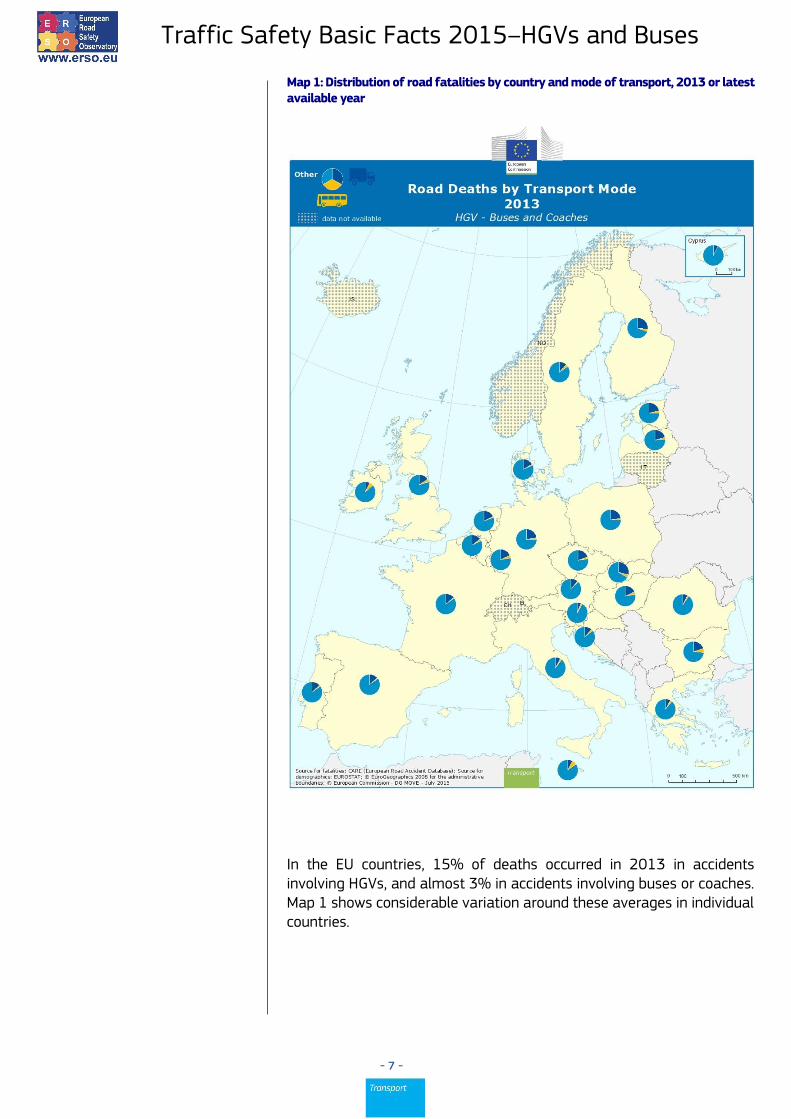
Map 1: Distribution of road fatalities by country and mode of transport, 2013 or latest available year
In the EU countries, 15% of deaths occurred in 2013 in accidents involving HGVs, and almost 3% in accidents involving buses or coaches. Map 1 shows considerable variation around these averages in individual countries.

Traffic Safety Basic Facts 2015–HGVs and Buses
- 8 -
Figure 4: Percentage of fatalities in accidents involving HGVs and buses or coaches of all road fatalities, EU, 2004-2013
Source: CARE database, data available in May 2015
Figure 4 shows the proportion of fatalities in accidents involving HGVs and buses or coaches.
The decreasing trend of fatalities involving HGVs during the last years has been inverted in 2009 –
continuing.
Traffic Safety Basic Facts 2015–HGVs and Buses
- 9 -
Type of casualties
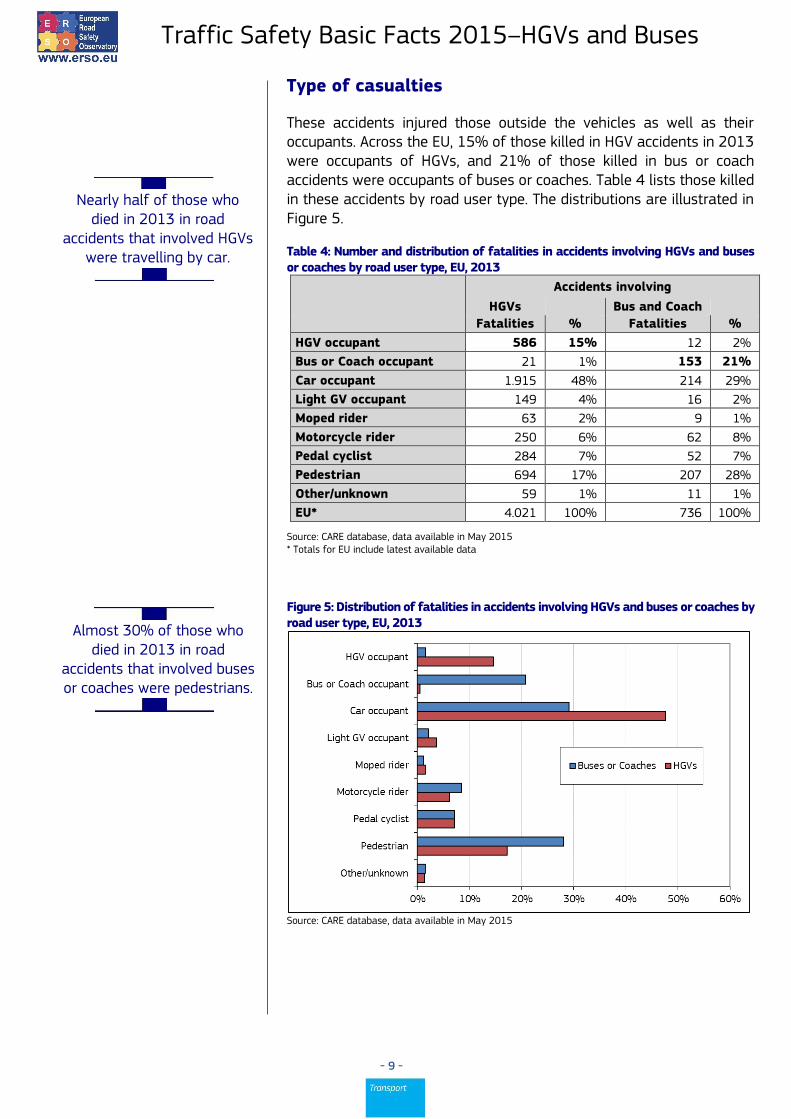
These accidents injured those outside the vehicles as well as their occupants. Across the EU, 15% of those killed in HGV accidents in 2013 were occupants of HGVs, and 21% of those killed in bus or coach accidents were occupants of buses or coaches. Table 4 lists those killed in these accidents by road user type. The distributions are illustrated in Figure 5.
Table 4: Number and distribution of fatalities in accidents involving HGVs and buses or coaches by road user type, EU, 2013
Accidents involving
HGVs Bus and Coach
Fatalities % Fatalities %
HGV occupant 586 15% 12 2%
Bus or Coach occupant 21 1% 153 21%
Car occupant 1.915 48% 214 29%
Light GV occupant 149 4% 16 2%
Moped rider 63 2% 9 1%
Motorcycle rider 250 6% 62 8%
Pedal cyclist 284 7% 52 7%
Pedestrian 694 17% 207 28%
Other/unknown 59 1% 11 1%
EU* 4.021 100% 736 100%
Source: CARE database, data available in May 2015 * Totals for EU include latest available data
Figure 5: Distribution of fatalities in accidents involving HGVs and buses or coaches by road user type, EU, 2013
Source: CARE database, data available in May 2015
Nearly half of those who died in 2013 in road
accidents that involved HGVs were travelling by car.
Almost 30% of those who died in 2013 in road
accidents that involved buses or coaches were pedestrians.

Traffic Safety Basic Facts 2015–HGVs and Buses
- 10 -
Type of road
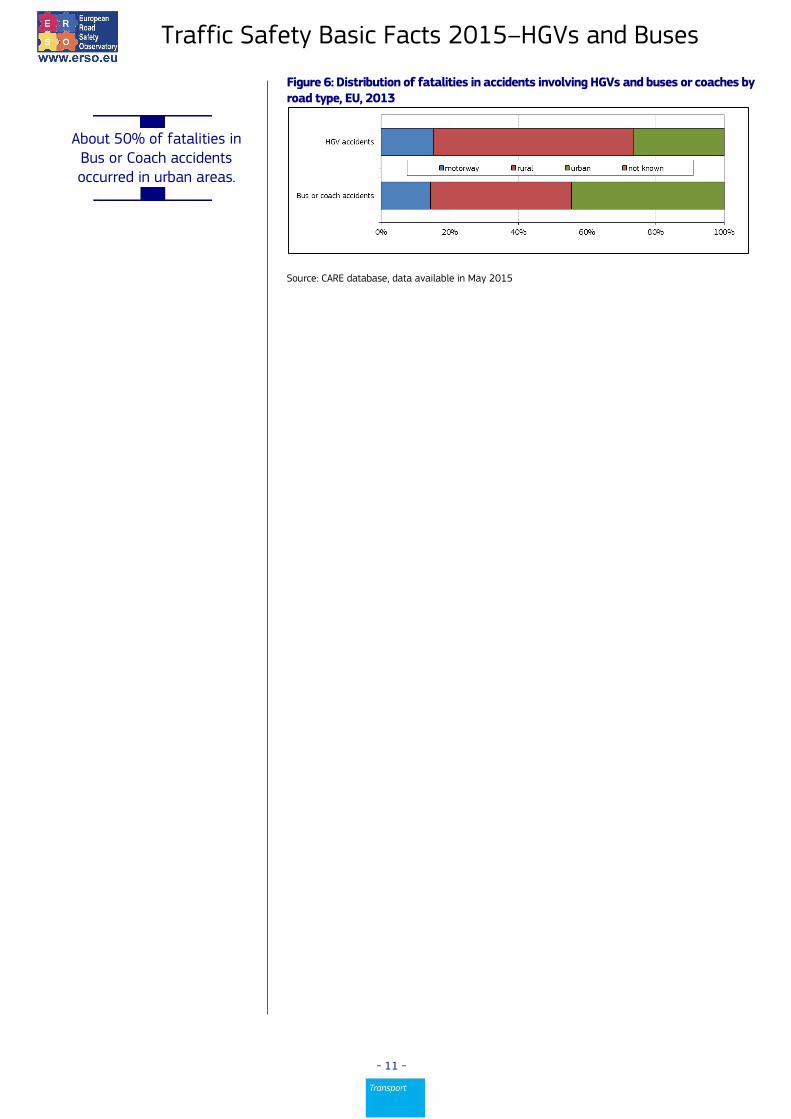
The CARE data show whether accidents occurred on motorways and, for non-motorway accidents, whether on urban or rural roads. Table 5 shows the distribution of fatalities in accidents involving HGVs. The results for the EU countries are illustrated in Figure 6 for HGV accidents and for Bus or Coach accidents.
Table 5: Distribution of fatalities in accidents involving HGVs by country and road type, 2013 or latest available year
HGV Motorway Rural* Urban* not
known Total
BE 36% 42% 22% 100
BG 3% 72% 25% 179
CZ 7% 66% 27% 124
DK 19% 44% 38% 32
DE 28% 49% 24% 759
EE 0% 95% 5% 21
IE 8% 67% 25% 12
EL 18% 43% 39% 74
ES 31% 62% 7% 217
FR 17% 64% 19% 463
HR 24% 39% 37% 41
IT 24% 56% 19% 267
CY 0% 33% 67% 3
LV 0% 73% 27% 35
LT - - - -
LU 13% 38% 50% 8
HU 11% 62% 26% 106
MT 0% 0% 100% 1
NL 25% 43% 30% 1% 83
AT 20% 60% 20% 50
PL 2% 62% 36% 748
PT 9% 49% 43% 80
RO 1% 51% 48% 139
SI 29% 43% 29% 7
SK 8% 56% 36% 106
FI 3% 87% 10% 70
SE 10% 77% 13% 30
UK 11% 65% 24% 264
EU 15% 58% 26% 0% 4.019
NO 0% 87% 13% 0% 48
CH 10% 35% 55% 0% 31 Source: CARE database, data available in May 2015 * Rural and urban roads do not include motorways.
58% of fatalities in HGV accidents in 2013 occurred in
rural areas; in Estonia and Finland, this percentage is
higher than 85%.
Traffic Safety Basic Facts 2015–HGVs and Buses
- 11 -
Figure 6: Distribution of fatalities in accidents involving HGVs and buses or coaches by road type, EU, 2013
Source: CARE database, data available in May 2015
About 50% of fatalities in Bus or Coach accidents occurred in urban areas.
Traffic Safety Basic Facts 2015–HGVs and Buses
- 12 -
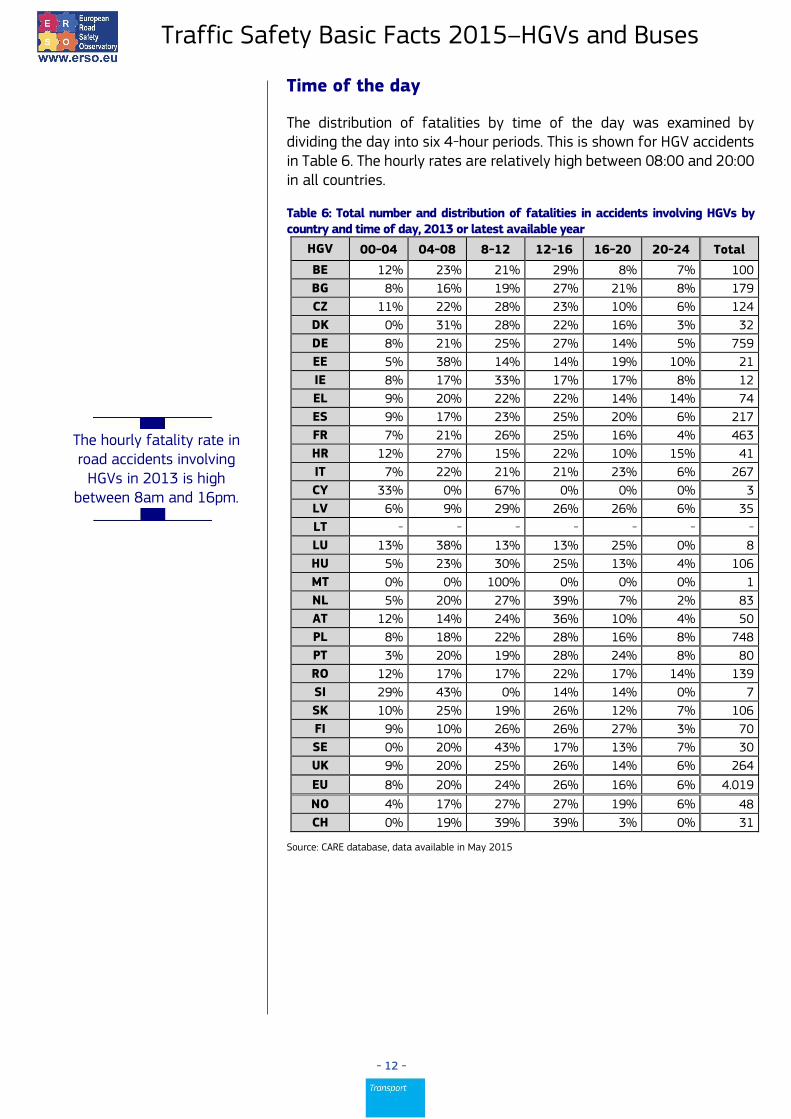
Time of the day
The distribution of fatalities by time of the day was examined by dividing the day into six 4-hour periods. This is shown for HGV accidents in Table 6. The hourly rates are relatively high between 08:00 and 20:00 in all countries.
Table 6: Total number and distribution of fatalities in accidents involving HGVs by country and time of day, 2013 or latest available year
HGV 00-04 04-08 8-12 12-16 16-20 20-24 Total
BE 12% 23% 21% 29% 8% 7% 100
BG 8% 16% 19% 27% 21% 8% 179
CZ 11% 22% 28% 23% 10% 6% 124
DK 0% 31% 28% 22% 16% 3% 32
DE 8% 21% 25% 27% 14% 5% 759
EE 5% 38% 14% 14% 19% 10% 21
IE 8% 17% 33% 17% 17% 8% 12
EL 9% 20% 22% 22% 14% 14% 74
ES 9% 17% 23% 25% 20% 6% 217
FR 7% 21% 26% 25% 16% 4% 463
HR 12% 27% 15% 22% 10% 15% 41
IT 7% 22% 21% 21% 23% 6% 267
CY 33% 0% 67% 0% 0% 0% 3
LV 6% 9% 29% 26% 26% 6% 35
LT - - - - - - -
LU 13% 38% 13% 13% 25% 0% 8
HU 5% 23% 30% 25% 13% 4% 106
MT 0% 0% 100% 0% 0% 0% 1
NL 5% 20% 27% 39% 7% 2% 83
AT 12% 14% 24% 36% 10% 4% 50
PL 8% 18% 22% 28% 16% 8% 748
PT 3% 20% 19% 28% 24% 8% 80
RO 12% 17% 17% 22% 17% 14% 139
SI 29% 43% 0% 14% 14% 0% 7
SK 10% 25% 19% 26% 12% 7% 106
FI 9% 10% 26% 26% 27% 3% 70
SE 0% 20% 43% 17% 13% 7% 30
UK 9% 20% 25% 26% 14% 6% 264
EU 8% 20% 24% 26% 16% 6% 4.019
NO 4% 17% 27% 27% 19% 6% 48
CH 0% 19% 39% 39% 3% 0% 31
Source: CARE database, data available in May 2015
The hourly fatality rate in road accidents involving
HGVs in 2013 is high between 8am and 16pm.

Traffic Safety Basic Facts 2015–HGVs and Buses
- 13 -
Figure 7 illustrates the EU distribution for HGV accidents and for bus or coach accidents by hour of day.
Figure 7: Distribution of fatalities in accidents involving HGVs and buses or coaches by time of the day, EU, 2013
Source: CARE database, data available in May 2015
Day of the week
Figure 8 illustrates the EU distribution for HGV accidents and bus or coach accidents, and shows a relatively high proportion of fatalities in the accidents that occurred from Thursday to Sunday for buses or coaches, and Monday to Friday for HGVs.
Figure 8: Distribution of fatalities in accidents involving HGVs and buses or coaches by day of the week, EU, 2013
Source: CARE database, data available in May 2015
The hourly fatality rate in road accidents involving
HGVs in 2013 peaked at 2 pm; the rate of accidents
involving buses or coaches peaked at 5 pm.
Traffic Safety Basic Facts 2015–HGVs and Buses
- 14 -
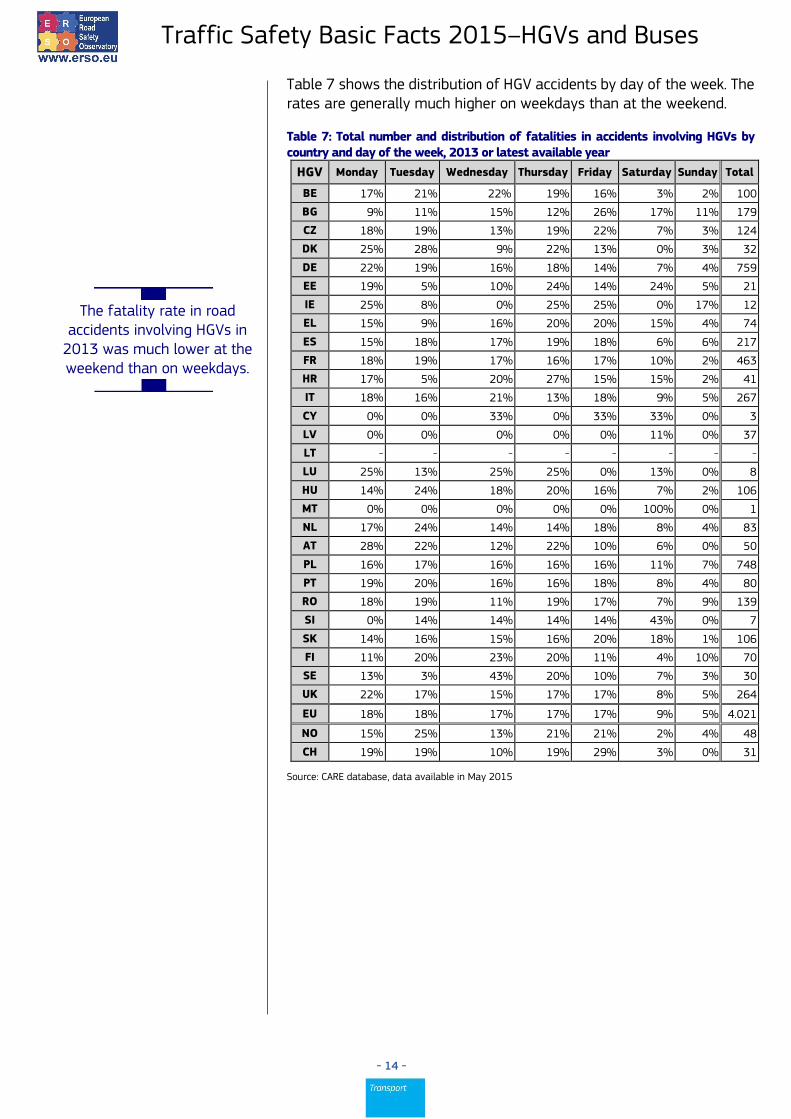
Table 7 shows the distribution of HGV accidents by day of the week. The rates are generally much higher on weekdays than at the weekend.
Table 7: Total number and distribution of fatalities in accidents involving HGVs by country and day of the week, 2013 or latest available year
HGV Monday Tuesday Wednesday Thursday Friday Saturday Sunday Total
BE 17% 21% 22% 19% 16% 3% 2% 100
BG 9% 11% 15% 12% 26% 17% 11% 179
CZ 18% 19% 13% 19% 22% 7% 3% 124
DK 25% 28% 9% 22% 13% 0% 3% 32
DE 22% 19% 16% 18% 14% 7% 4% 759
EE 19% 5% 10% 24% 14% 24% 5% 21
IE 25% 8% 0% 25% 25% 0% 17% 12
EL 15% 9% 16% 20% 20% 15% 4% 74
ES 15% 18% 17% 19% 18% 6% 6% 217
FR 18% 19% 17% 16% 17% 10% 2% 463
HR 17% 5% 20% 27% 15% 15% 2% 41
IT 18% 16% 21% 13% 18% 9% 5% 267
CY 0% 0% 33% 0% 33% 33% 0% 3
LV 0% 0% 0% 0% 0% 11% 0% 37
LT - - - - - - - -
LU 25% 13% 25% 25% 0% 13% 0% 8
HU 14% 24% 18% 20% 16% 7% 2% 106
MT 0% 0% 0% 0% 0% 100% 0% 1
NL 17% 24% 14% 14% 18% 8% 4% 83
AT 28% 22% 12% 22% 10% 6% 0% 50
PL 16% 17% 16% 16% 16% 11% 7% 748
PT 19% 20% 16% 16% 18% 8% 4% 80
RO 18% 19% 11% 19% 17% 7% 9% 139
SI 0% 14% 14% 14% 14% 43% 0% 7
SK 14% 16% 15% 16% 20% 18% 1% 106
FI 11% 20% 23% 20% 11% 4% 10% 70
SE 13% 3% 43% 20% 10% 7% 3% 30
UK 22% 17% 15% 17% 17% 8% 5% 264
EU 18% 18% 17% 17% 17% 9% 5% 4.021
NO 15% 25% 13% 21% 21% 2% 4% 48
CH 19% 19% 10% 19% 29% 3% 0% 31
Source: CARE database, data available in May 2015
The fatality rate in road accidents involving HGVs in
2013 was much lower at the weekend than on weekdays.

Traffic Safety Basic Facts 2015–HGVs and Buses
- 15 -
Seasonality
Table 8 shows the distribution of fatalities in accidents involving HGVs through the year, using pairs of months. The peak period varies between countries, and for the EU it is September-October.
Table 8: Total number and distribution of fatalities in accidents involving HGVs by country and month, 2013 or latest available year
HGV Jan-Feb Mar-Apr May-Jun Jul-Aug Sep-Oct Nov-Dec Total
BE 15% 27% 11% 16% 19% 12% 100
BG 15% 10% 12% 22% 24% 17% 179
CZ 12% 13% 13% 24% 22% 16% 124
DK 19% 25% 19% 6% 16% 16% 32
DE 13% 15% 19% 19% 19% 15% 759
EE 19% 14% 10% 0% 29% 29% 21
IE 25% 33% 17% 8% 8% 8% 12
EL 9% 14% 14% 26% 22% 16% 74
ES 19% 18% 11% 16% 23% 13% 217
FR 12% 13% 14% 20% 22% 19% 463
HR 15% 5% 20% 15% 20% 27% 41
IT 13% 16% 15% 18% 20% 17% 267
CY 0% 0% 33% 0% 67% 0% 3
LV 11% 14% 19% 16% 16% 24% 37
LT - - - - - - -
LU 0% 38% 13% 25% 13% 13% 8
HU 8% 20% 23% 22% 17% 10% 106
MT 0% 0% 0% 100% 0% 0% 1
NL 8% 16% 20% 27% 17% 12% 83
AT 12% 18% 12% 22% 28% 8% 50
PL 11% 14% 16% 18% 24% 17% 748
PT 24% 9% 15% 18% 20% 15% 80
RO 13% 18% 19% 14% 24% 12% 139
SI 14% 43% 14% 14% 14% 0% 7
SK 16% 8% 13% 25% 16% 22% 106
FI 17% 7% 21% 14% 14% 26% 70
SE 23% 13% 20% 27% 10% 7% 30
UK 14% 17% 14% 20% 18% 17% 264
EU 13% 15% 16% 19% 21% 16% 4.021
NO 17% 17% 10% 17% 27% 13% 48
CH 3% 16% 13% 19% 23% 26% 31
Source: CARE database, data available in May 2015
There was little variation through the year in the
fatality rate in road accidents involving HGVs in 2013; the peak months are September
and October.
Traffic Safety Basic Facts 2015–HGVs and Buses
- 16 -
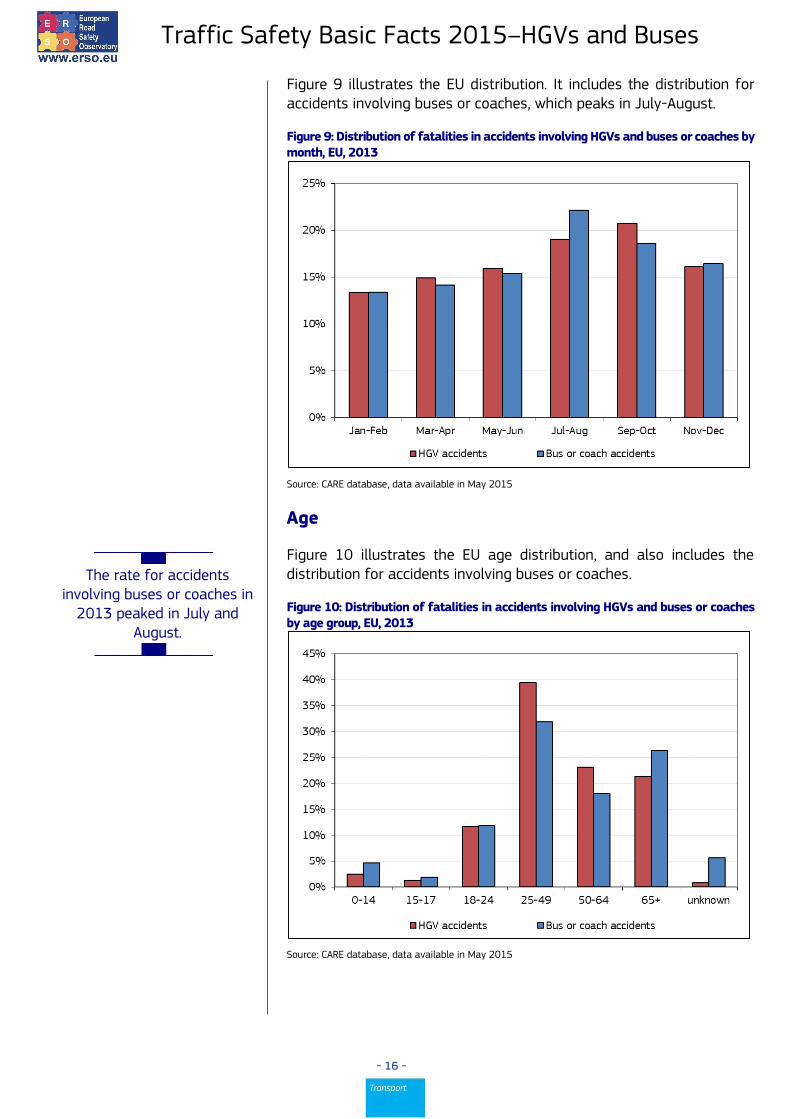
Figure 9 illustrates the EU distribution. It includes the distribution for accidents involving buses or coaches, which peaks in July-August.
Figure 9: Distribution of fatalities in accidents involving HGVs and buses or coaches by month, EU, 2013
Source: CARE database, data available in May 2015
Age
Figure 10 illustrates the EU age distribution, and also includes the distribution for accidents involving buses or coaches.
Figure 10: Distribution of fatalities in accidents involving HGVs and buses or coaches by age group, EU, 2013
Source: CARE database, data available in May 2015
The rate for accidents involving buses or coaches in
2013 peaked in July and August.
Traffic Safety Basic Facts 2015–HGVs and Buses
- 17 -
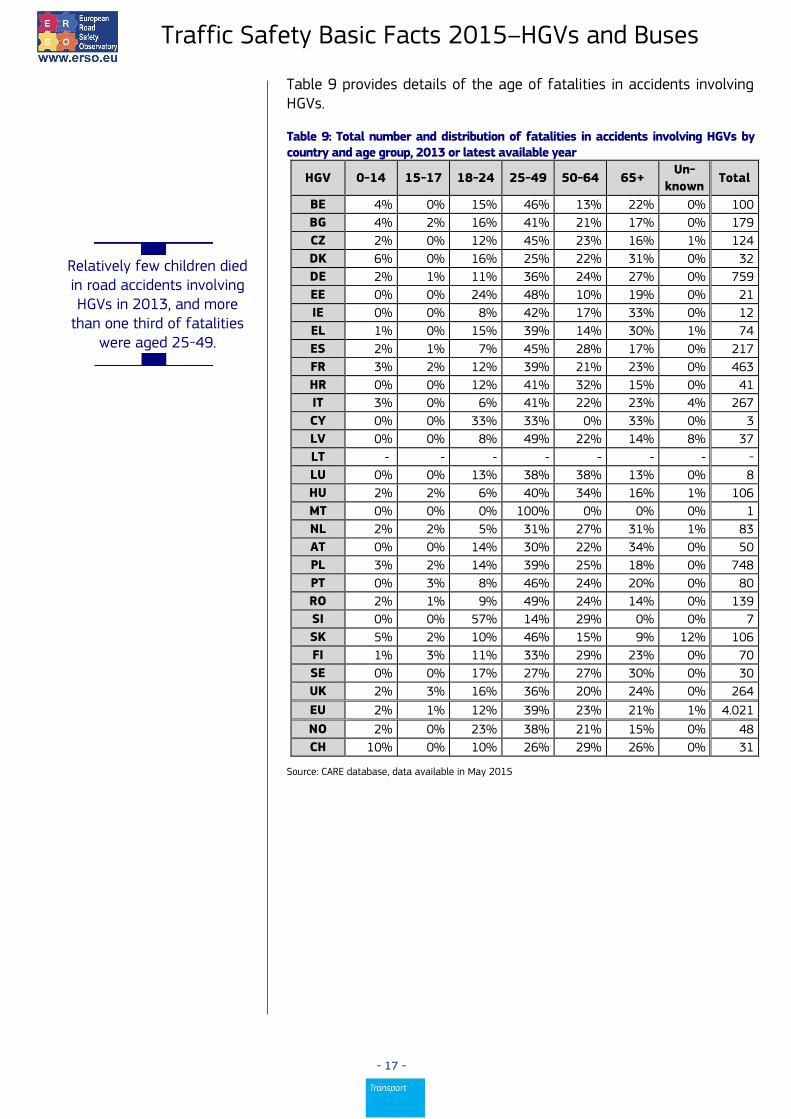
Table 9 provides details of the age of fatalities in accidents involving HGVs.
Table 9: Total number and distribution of fatalities in accidents involving HGVs by country and age group, 2013 or latest available year
HGV 0-14 15-17 18-24 25-49 50-64 65+ Un-
known Total
BE 4% 0% 15% 46% 13% 22% 0% 100
BG 4% 2% 16% 41% 21% 17% 0% 179
CZ 2% 0% 12% 45% 23% 16% 1% 124
DK 6% 0% 16% 25% 22% 31% 0% 32
DE 2% 1% 11% 36% 24% 27% 0% 759
EE 0% 0% 24% 48% 10% 19% 0% 21
IE 0% 0% 8% 42% 17% 33% 0% 12
EL 1% 0% 15% 39% 14% 30% 1% 74
ES 2% 1% 7% 45% 28% 17% 0% 217
FR 3% 2% 12% 39% 21% 23% 0% 463
HR 0% 0% 12% 41% 32% 15% 0% 41
IT 3% 0% 6% 41% 22% 23% 4% 267
CY 0% 0% 33% 33% 0% 33% 0% 3
LV 0% 0% 8% 49% 22% 14% 8% 37
LT - - - - - - - -
LU 0% 0% 13% 38% 38% 13% 0% 8
HU 2% 2% 6% 40% 34% 16% 1% 106
MT 0% 0% 0% 100% 0% 0% 0% 1
NL 2% 2% 5% 31% 27% 31% 1% 83
AT 0% 0% 14% 30% 22% 34% 0% 50
PL 3% 2% 14% 39% 25% 18% 0% 748
PT 0% 3% 8% 46% 24% 20% 0% 80
RO 2% 1% 9% 49% 24% 14% 0% 139
SI 0% 0% 57% 14% 29% 0% 0% 7
SK 5% 2% 10% 46% 15% 9% 12% 106
FI 1% 3% 11% 33% 29% 23% 0% 70
SE 0% 0% 17% 27% 27% 30% 0% 30
UK 2% 3% 16% 36% 20% 24% 0% 264
EU 2% 1% 12% 39% 23% 21% 1% 4.021
NO 2% 0% 23% 38% 21% 15% 0% 48
CH 10% 0% 10% 26% 29% 26% 0% 31
Source: CARE database, data available in May 2015
Relatively few children died in road accidents involving HGVs in 2013, and more
than one third of fatalities were aged 25-49.

Traffic Safety Basic Facts 2015–HGVs and Buses
- 18 -
Gender
Table 10 provides gender details of fatalities in accidents involving HGVs. Figure 11 illustrates the EU distribution, and also includes the distribution for accidents involving buses or coaches. The percentage of female fatalities in the latter accidents is higher than in the HGVs ones.
Table 10: Total number and distribution of fatalities in accidents involving HGVs by country and gender, 2013 or latest available year
HGV Female Male Unknown Total
BE 30% 70% 0% 100
BG 21% 79% 0% 179
CZ 19% 78% 2% 124
DK 50% 50% 0% 32
DE 27% 73% 0% 759
EE 29% 71% 0% 21
IE 33% 67% 0% 12
EL 18% 82% 0% 74
ES 23% 77% 0% 217
FR 27% 73% 0% 463
HR 10% 90% 0% 41
IT 18% 82% 0% 267
CY 0% 100% 0% 3
LV 22% 76% 3% 37
LT - - - -
LU 25% 75% 0% 8
HU 27% 71% 2% 106
MT 0% 100% 0% 1
NL 33% 67% 0% 83
AT 32% 68% 0% 50
PL 23% 77% 0% 748
PT 23% 78% 0% 80
RO 17% 83% 0% 139
SI 43% 57% 0% 7
SK 18% 82% 0% 106
FI 26% 74% 0% 70
SE 37% 63% 0% 30
UK 23% 77% 0% 264
EU 24% 76% 0% 4.021
NO 31% 69% 0% 48
CH 35% 65% 0% 31
Source: CARE database, data available in May 2015
Three quarters of the fatalities in accidents
involving HGVs were male.

Traffic Safety Basic Facts 2015–HGVs and Buses
- 19 -
Figure 11: Distribution of fatalities in accidents involving HGVs and buses or coaches by gender, EU, 2013
Source: CARE database, data available in May 2015
Traffic Safety Basic Facts 2015–HGVs and Buses
- 20 -
Accident Causation
During the EC SafetyNet project, in-depth data were collected using a common methodology for samples of accidents that occurred in Germany, Italy, The Netherlands, Finland, Sweden and the UK12. The SafetyNet Accident Causation Database was formed between 2005 and 2008, and contains details of 1.006 accidents covering all injury severities. A detailed process for recording causation (SafetyNet Accident Causation System – SNACS) attributes one specific critical event to each driver, rider or pedestrian. Links then form chains between the critical event and the causes that led to it. For example, the critical event of late action could be linked to the cause observation missed, which was a consequence of fatigue, itself a consequence of an extensive driving spell.
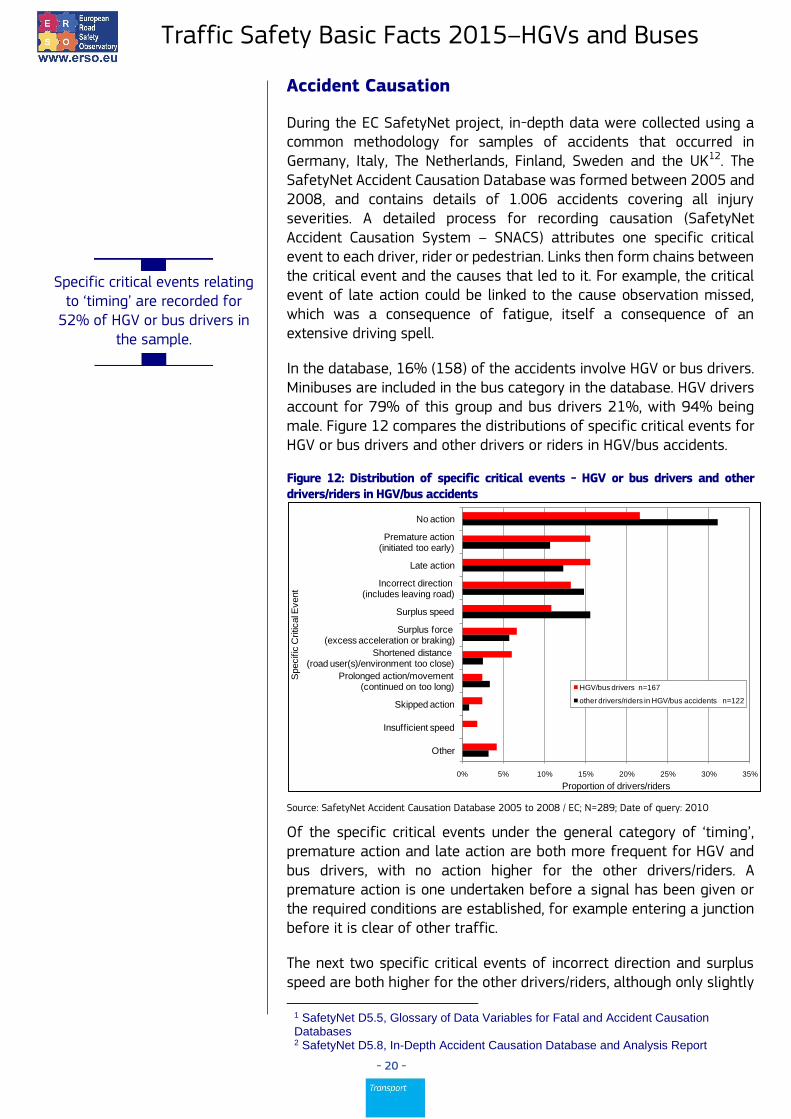
In the database, 16% (158) of the accidents involve HGV or bus drivers. Minibuses are included in the bus category in the database. HGV drivers account for 79% of this group and bus drivers 21%, with 94% being male. Figure 12 compares the distributions of specific critical events for HGV or bus drivers and other drivers or riders in HGV/bus accidents.
Figure 12: Distribution of specific critical events - HGV or bus drivers and other drivers/riders in HGV/bus accidents
Source: SafetyNet Accident Causation Database 2005 to 2008 / EC; N=289; Date of query: 2010
Of the specific critical events under the general category of ‘timing’, premature action and late action are both more frequent for HGV and bus drivers, with no action higher for the other drivers/riders. A premature action is one undertaken before a signal has been given or the required conditions are established, for example entering a junction before it is clear of other traffic.
The next two specific critical events of incorrect direction and surplus speed are both higher for the other drivers/riders, although only slightly
1 SafetyNet D5.5, Glossary of Data Variables for Fatal and Accident Causation Databases 2 SafetyNet D5.8, In-Depth Accident Causation Database and Analysis Report
0% 5% 10% 15% 20% 25% 30% 35%
No action
Premature action(initiated too early)
Late action
Incorrect direction(includes leaving road)
Surplus speed
Surplus force(excess acceleration or braking)
Shortened distance(road user(s)/environment too close)
Prolonged action/movement(continued on too long)
Skipped action
Insufficient speed
Other
Proportion of drivers/riders
Specific
Critical E
vent
HGV/bus drivers n=167
other drivers/riders in HGV/bus accidents n=122
Specific critical events relating
to ‘timing’ are recorded for 52% of HGV or bus drivers in
the sample.

Traffic Safety Basic Facts 2015–HGVs and Buses
- 21 -
more for incorrect direction. Incorrect direction refers to a manoeuvre being carried out in the wrong direction (for example, turning left instead of right) or leaving the road (not following the intended direction of the road). Surplus speed describes speed that is too high for the conditions or manoeuvre being carried out, travelling above the speed limit and also if the driver is travelling at a speed unexpected by other road users.
Table 11 gives the most frequent links between causes for HGV or bus drivers/riders. For this group there are 195 such links in total. Like the car driver group, faulty diagnosis and observation missed are the two dominant causes. Faulty diagnosis is an incorrect or incomplete understanding of road conditions or another road user’s actions. It is linked to both information failure (for example, a driver thinking another vehicle was moving when it was in fact stopped and colliding with it) and communication failure (for example, pulling out in the continuing path of a driver who has indicated for a turn too early). Unlike the car driver group, the most frequent cause leading to observation missed is permanent sight obstruction. This refers to vehicle blind spots on these larger vehicles, where drivers cannot see part of the road infrastructure or other road users. Also observed for these larger vehicles are causes leading to equipment failure, both unpredictable system functions/characteristics (covering problems with vehicle load) and poor maintenance.
Table 11: Ten most frequent links between causes – HGV or bus drivers
Links between causes Frequency
Faulty diagnosis - Information failure (between driver and
traffic environment or driver and vehicle) 43
Observation missed - Permanent sight obstruction 23
Observation missed - Distraction 13
Equipment failure - Unpredictable system
functions/characteristics 10
Observation missed - Faulty diagnosis 8
Observation missed - Permanent obstruction to view 7
Observation missed - Inadequate plan 6
Equipment failure - Maintance failure – condition of vehicle 6
Observation missed - Inattention 5
Observation missed - Temporary obstruction to view 5
Others 69
Total 195
Source: SafetyNet Accident Causation Database 2005 to 2008 / EC; Date of query: 2010
22% of the links between causes are observed to be between ‘faulty diagnosis’ and ‘information failure’.
Traffic Safety Basic Facts 2015–HGVs and Buses
- 22 -
Notes
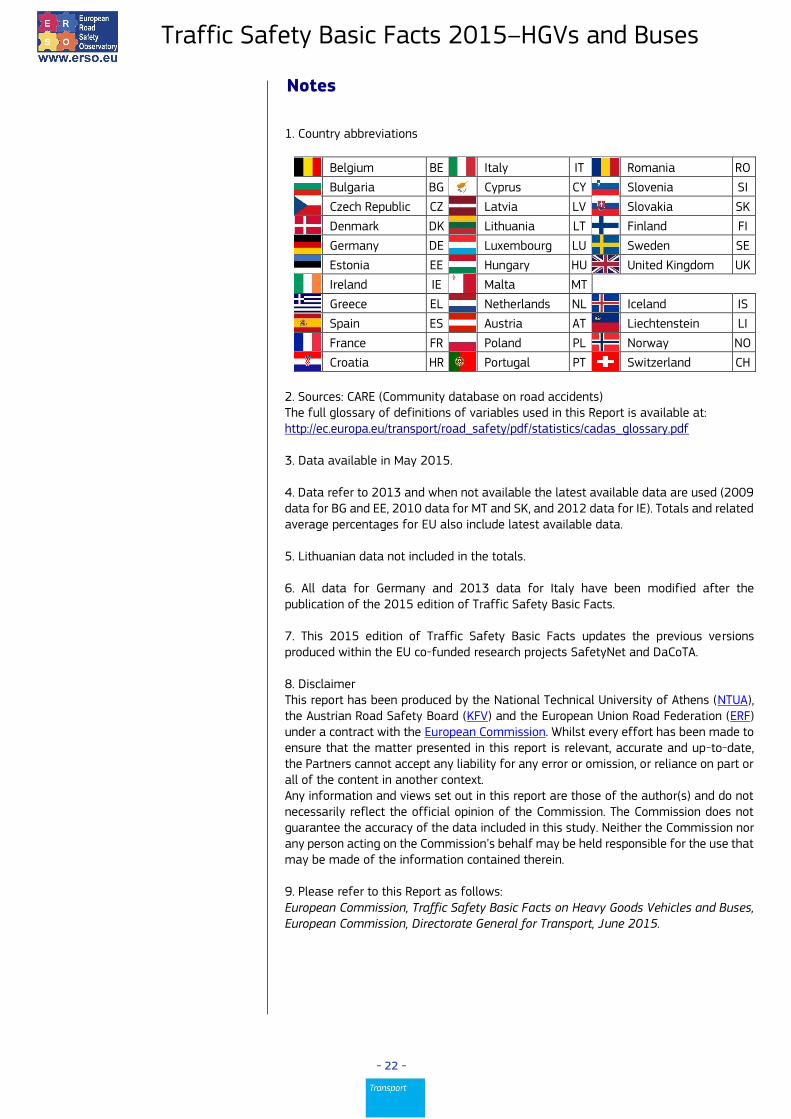
1. Country abbreviations
Belgium BE Italy IT Romania RO
Bulgaria BG Cyprus CY Slovenia SI
Czech Republic CZ Latvia LV Slovakia SK
Denmark DK Lithuania LT Finland FI
Germany DE Luxembourg LU Sweden SE
Estonia EE Hungary HU United Kingdom UK
Ireland IE Malta MT
Greece EL Netherlands NL Iceland IS
Spain ES Austria AT Liechtenstein LI
France FR Poland PL Norway NO
Croatia HR Portugal PT Switzerland CH
2. Sources: CARE (Community database on road accidents) The full glossary of definitions of variables used in this Report is available at: http://ec.europa.eu/transport/road_safety/pdf/statistics/cadas_glossary.pdf 3. Data available in May 2015. 4. Data refer to 2013 and when not available the latest available data are used (2009 data for BG and EE, 2010 data for MT and SK, and 2012 data for IE). Totals and related average percentages for EU also include latest available data. 5. Lithuanian data not included in the totals. 6. All data for Germany and 2013 data for Italy have been modified after the publication of the 2015 edition of Traffic Safety Basic Facts. 7. This 2015 edition of Traffic Safety Basic Facts updates the previous versions produced within the EU co-funded research projects SafetyNet and DaCoTA. 8. Disclaimer This report has been produced by the National Technical University of Athens (NTUA), the Austrian Road Safety Board (KFV) and the European Union Road Federation (ERF) under a contract with the European Commission. Whilst every effort has been made to ensure that the matter presented in this report is relevant, accurate and up-to-date, the Partners cannot accept any liability for any error or omission, or reliance on part or all of the content in another context. Any information and views set out in this report are those of the author(s) and do not necessarily reflect the official opinion of the Commission. The Commission does not guarantee the accuracy of the data included in this study. Neither the Commission nor any person acting on the Commission’s behalf may be held responsible for the use that may be made of the information contained therein. 9. Please refer to this Report as follows: European Commission, Traffic Safety Basic Facts on Heavy Goods Vehicles and Buses, European Commission, Directorate General for Transport, June 2015.