Embed Size (px)
Citation preview
1
Heating Earth’s Surfaces: Albedo
Lab Instructions
Objective Students will develop and test a hypothesis about how the reflection from surfaces of different colors affects temperature.
Materials thermometers (2) construction paper (dark and light) stopwatch lamp with heat bulb and stand large cups or other containers (2) foam lids/caps Procedure
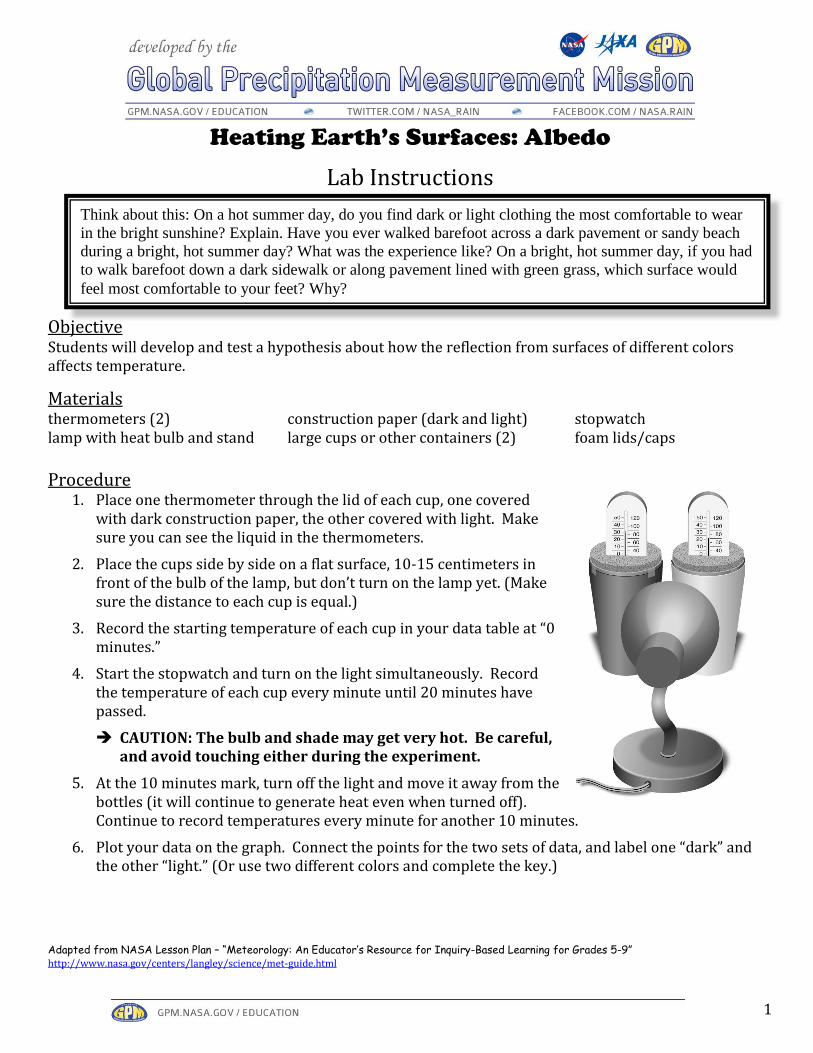
1. Place one thermometer through the lid of each cup, one covered with dark construction paper, the other covered with light. Make sure you can see the liquid in the thermometers.
2. Place the cups side by side on a flat surface, 10-15 centimeters in front of the bulb of the lamp, but don’t turn on the lamp yet. (Make sure the distance to each cup is equal.)
3. Record the starting temperature of each cup in your data table at “0 minutes.”
4. Start the stopwatch and turn on the light simultaneously. Record the temperature of each cup every minute until 20 minutes have passed.
CAUTION: The bulb and shade may get very hot. Be careful, and avoid touching either during the experiment.
5. At the 10 minutes mark, turn off the light and move it away from the bottles (it will continue to generate heat even when turned off). Continue to record temperatures every minute for another 10 minutes.
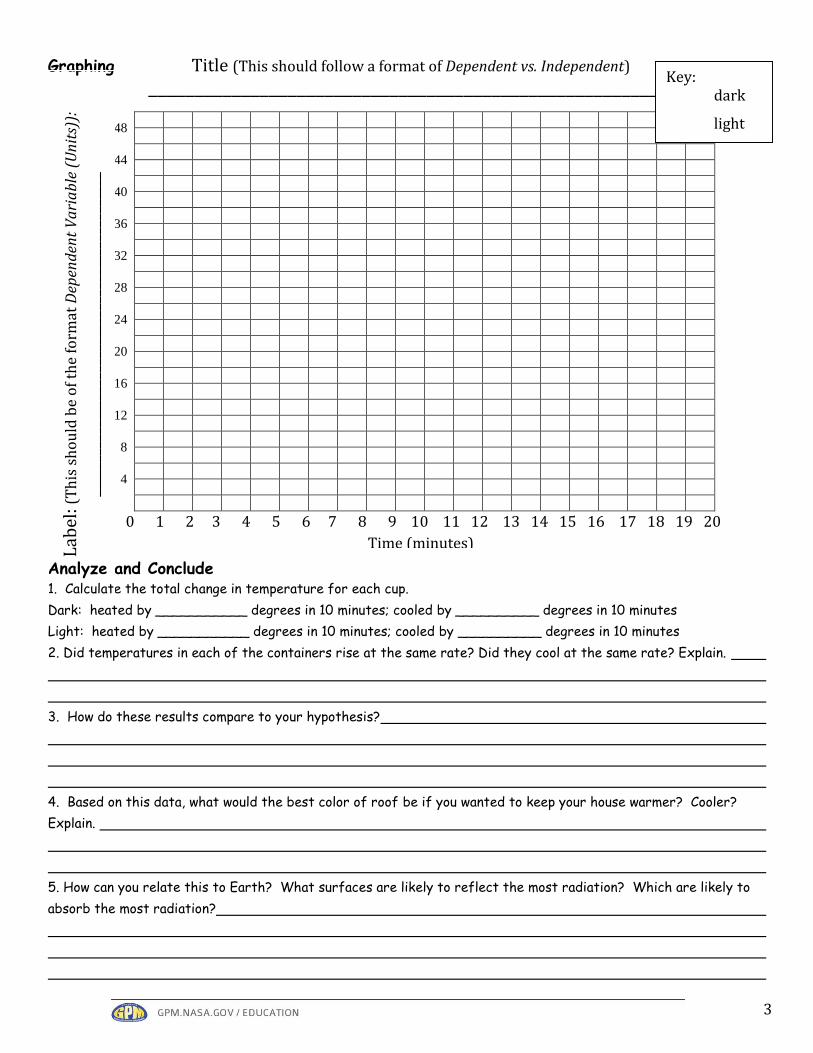
6. Plot your data on the graph. Connect the points for the two sets of data, and label one “dark” and the other “light.” (Or use two different colors and complete the key.)
Adapted from NASA Lesson Plan – “Meteorology: An Educator’s Resource for Inquiry-Based Learning for Grades 5-9” http://www.nasa.gov/centers/langley/science/met-guide.html
Think about this: On a hot summer day, do you find dark or light clothing the most comfortable to wear
in the bright sunshine? Explain. Have you ever walked barefoot across a dark pavement or sandy beach
during a bright, hot summer day? What was the experience like? On a bright, hot summer day, if you had
to walk barefoot down a dark sidewalk or along pavement lined with green grass, which surface would
feel most comfortable to your feet? Why?

2
Heating Earth’s Surfaces: Albedo
Objective Students will develop and test a hypothesis about how the reflection from surfaces of different colors affects temperature.
Problem (written as a question that will be answered by completing the investigation)
How will temperature change in the containers with different colored surfaces?
Independent Variable (the factor that is intentionally changed in an investigation)
This investigation is designed to see if surface color (albedo), the independent variable, will have any impact on the heat absorbed from radiation.
Dependent Variable (the factor that changes as a result of the independent variable; it is what is measured to determine if the
independent variable has the expected effect)
The dependent variable, temperature, is measured in degrees Celsius (˚C) and may change as a result of the energy absorbed by different colored surfaces.
Hypothesis (should be written in If [independent variable], then [dependent variable] format and should answer the question
posed as the problem)
If cups with ______________________________________ are heated by radiation from a light
bulb, then the _________________________ of the air in the dark cup will increase
________________________ the temperature of the air in the light cup. After the radiation is
turned off, the temperature of the air in the dark cup will decrease ____________________ the
temperature of the air in the light cup.
Data Light Bulb On (radiation simulating daylight hours) Time (Minute) 0 1 2 3 4 5 6 7 8 9 10
Dark (˚C)
Light (˚C)
Light Bulb Off (radiation simulating nighttime hours) Time (Minute) 11 12 13 14 15 16 17 18 19 20
Dark (˚C)
Light (˚C)
independent variable
dependent variable
faster than/ slower than /at the same rate as
faster than/ slower than /at the same rate as
Image Source: http://www.energyeducation.tx.gov/environment/section_3/topics/predicting_change/e.html
3
Graphing Title (This should follow a format of Dependent vs. Independent) ___________________________________________________________
48
44
40
36
32
28
24
20
16
12
8
4
Analyze and Conclude 1. Calculate the total change in temperature for each cup.
Dark: heated by ___________ degrees in 10 minutes; cooled by __________ degrees in 10 minutes
Light: heated by ___________ degrees in 10 minutes; cooled by __________ degrees in 10 minutes
2. Did temperatures in each of the containers rise at the same rate? Did they cool at the same rate? Explain.
3. How do these results compare to your hypothesis?
4. Based on this data, what would the best color of roof be if you wanted to keep your house warmer? Cooler?
Explain.
5. How can you relate this to Earth? What surfaces are likely to reflect the most radiation? Which are likely to
absorb the most radiation?
Lab
el: (
Th
is s
ho
uld
be
of
the
form
at D
epen
den
t V
ari
ab
le (
Un
its)
):
____
____
____
____
____
____
____
____
____
____
____
___
0 1 2 3 4 5 6 7 8 9 10 11 12 13 14 15 16 17 18 19 20
Time (minutes)
Key: dark
light