Embed Size (px)
Citation preview
The Open Thermodynamics Journal, 2010, 4, 13-26 13
1874-396X/10 2010 Bentham Open
Open Access
Heat Transfer and Fluid Flows in Gas Springs
U. Leki * and J.B.W. Kok
University of Twente, Enschede, The Netherlands
Abstract: Thermodynamical processes and fluid mechanics phenomena occurring in an unlubricated piston-cylinder
gas spring are investigated. Existing instantaneous heat transfer correlations are not applicable to the piston-cylinder
compressed volumes. Accurate prediction of the transient thermal properties, heat transfer and fluid flows for the
high performance, tight tolerance and lubricant-free gas compressors (e.g. cryo-cooling industry) is of high industrial
importance.
Research is here done with the use of ANSYS CFX finite-volume numerical package, modelling the closed fluid domain
in a valveless non-lubricated one-piston-cylinder gas spring. Obtained numerically simulated values are compared to
experimentally measured pressure and heat-flux data; very good agreement is observed. Broad discussion and conclusions
with regard to thermodynamic and fluid-flow phenomena occurring are presented.
Keywords: Thermodynamics in gas springs, CFD modelling, heat transfer and fluid flows.
INTRODUCTION
Piston-cylinder based machinery is in use in a very broad range of industrial applications. Examples are internal com-
bustion engines in the automotive, marine and aerospace
applications, compressors in the cooling devices for domes-tic and commercial applications, for the gas liquefaction,
medical purposes and superconductivity technology in elec-
tronics. All of them are characterized by the moving pistons inside cylindrical volumes compressing the enclosed operat-
ing fluid. These parts are conventionally lubricated to reduce
the frictional forces and wear, and cool the contact surfaces. Unfortunately, lubricants inevitably pollute the working me-
dium. In the open-cycle internal combustion engines this is
acceptable to reasonable limits (the lubricant vapour or drop-lets can be combusted and removed), but when it comes to
closed cooling-cycle systems, any presence of impurities in
the thermal carrier is highly undesirable, and efforts are put into avoiding it. Ways to achieve this are thorough filtering
of the operating medium, careful sealing, and shortening of
the maintenance intervals. The other direction, leading the course of the project the work presented here is part of, is to
omit the lubrication itself, and thus eliminate the related de-
crease of operational performance and increase in the con-structional and consequential operating costs.
Accurate thermal analyses are crucial in this line of con-siderations. Thermal expansion, internal stresses and distor-tion of the projected geometric relations can lead to adverse frictional stresses, delamination and destruction of the exposed and interacting parts, wear and fatigue. The oil- free constructions investigated here demand extremely narrow tolerances of the functional parts ( 20 m), which
*Address correspondence to this author at the University of Twente,
Enschede, The Netherlands; Tel: +31534893661; Fax: +31534892507;
E-mail: [email protected]
and description of the heat transfer phenomena occurring between the gas and enclosing solid parts. Processes occur-ring in a piston gas spring represent qualitatively the ther-modynamic processes occurring in reciprocating piston compressors, eliminating the effects of inflow and discharge streams. For these reasons, here presented research concen-trates on better understanding and improved modelling of the heat transfer mechanisms and fluid-flow phenomena occur-ring in piston gas springs.
In the past century extensive work was done and pub-
lished on the understanding of steady-state convective heat
transfer. This resulted in the Nusselt-Reynolds (Nu-Re) heat-
transfer analogy and all its successor relations, boundary
layer theory, and the turbulence closure models for the near-
wall region fluid flows. Generally accepted conventional Nu-
Re correlations were derived for the steady state developed
boundary layer flows, and are generally applicable to a num-
ber of specific fluid-flow types (in-pipe, around the cylinder,
over the flat plate), and can be expanded to a certain extent
to the similarly characterized flows. Nevertheless these are
not applicable to the transient heat transfer from rapidly
compressed and expanded gas to the surrounding walls. In
piston-cylinder constructions, phase shift has been observed
between the peak instantaneous heat flux at the gas spring
walls and the peak bulk gas temperature.
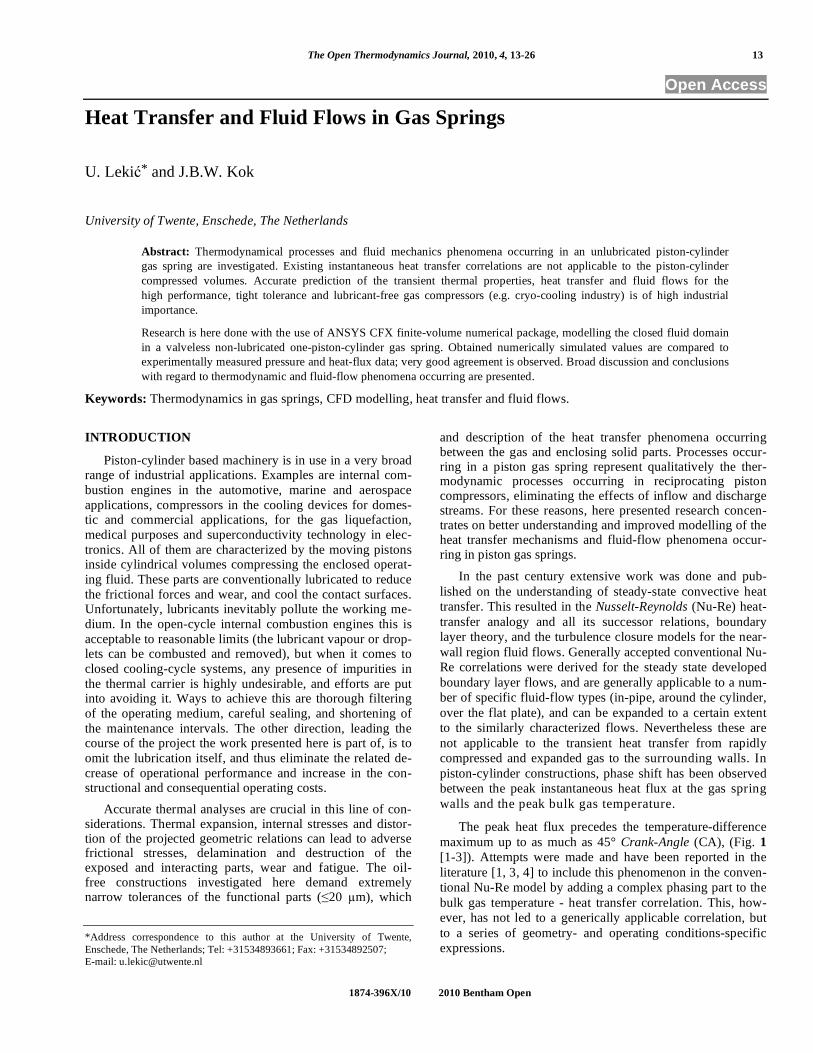
The peak heat flux precedes the temperature-difference
maximum up to as much as 45° Crank-Angle (CA), (Fig. 1
[1-3]). Attempts were made and have been reported in the
literature [1, 3, 4] to include this phenomenon in the conven-
tional Nu-Re model by adding a complex phasing part to the
bulk gas temperature - heat transfer correlation. This, how-
ever, has not led to a generically applicable correlation, but
to a series of geometry- and operating conditions-specific
expressions.
14 The Open Thermodynamics Journal, 2010, Volume 4 Leki and Kok
Fig. (1). Temperature and heat flux phase shift.
In the presented work, a numerical approach to this prob-lem is explored. Heat transfer between the compressed gas and the surrounding walls is modelled with Computational Fluid Dynamics (CFD), applied on the flow in a closed do-main with transiently changing volume. Commercially available, finite-volume code ANSYS CFX11.0 is used for the numerical discretization and calculation of the gas flow field, wall heat flux and heat conduction in the solid wall. Underlying governing equations are the standard unsteady compressible Navier-Stokes equations set up in ANSYS CFX [5]. A Direct Numerical Simulation (DNS) approach is adopted; no approximating turbulence models are being used.
METHODOLOGY
Presented numerical work is formatted to, and validated on the data generated at Massachusetts Institute of Technol-ogy (MIT) as part of a PhD project. Measurements have been performed on the experimental setup built and operated by professor A.A.Kornhauser, who made the measurement da-tabase and his doctoral thesis available to the authors. MIT gas spring setup description, together with the instrumenta-tion specifics, was reported in [3]. Geometry of the numeri-
cal model, appropriate boundary conditions and initial condi-tions for simulations are taken according to experiments, to which the simulation results are compared to in the follow-ing chapters.
Using ANSYS Design Modeller, geometry design module in ANSYS, three-dimensional models are created according to the dimensions of the two base-line case MIT setups: two gas-springs with compression ratios 2 and 8, with constant diameter D=50.8mm and stroke S=76.2mm; volume of the compressed gas is then varied with the height of the For rea-son of reduction in the computational time, and having in mind the fact that these gas springs are axi-symmetric, only 5° cuts of the compressed volumes are modelled. Virtual geometries are then spatially discretized using CFX Mesh to a resolution sufficient to provide grid-independent numerical solutions. In this way created finite volume model is then exported to the CFX Pre module, where the solution param-eterization is specified: the initial and boundary conditions for the computational model, temporal discretization parameters and selection of the relevant physical models to be numerically solved. Task is then forwarded to CFX Solver where the ac-tual mathematical operations take place and the solutions are provided. Results are visualized using CFX Post.
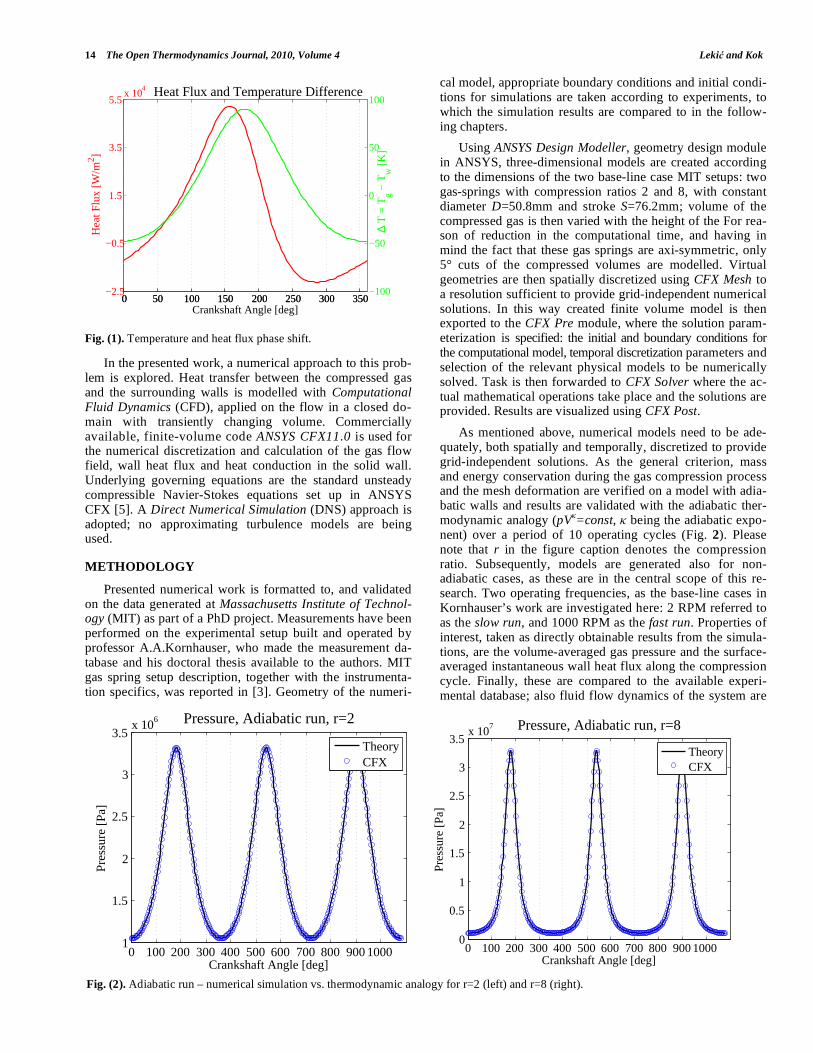
As mentioned above, numerical models need to be ade-quately, both spatially and temporally, discretized to provide grid-independent solutions. As the general criterion, mass and energy conservation during the gas compression process and the mesh deformation are verified on a model with adia-batic walls and results are validated with the adiabatic ther-modynamic analogy (pV =const, being the adiabatic expo-nent) over a period of 10 operating cycles (Fig. 2). Please note that r in the figure caption denotes the compression ratio. Subsequently, models are generated also for non-adiabatic cases, as these are in the central scope of this re-search. Two operating frequencies, as the base-line cases in Kornhauser’s work are investigated here: 2 RPM referred to as the slow run, and 1000 RPM as the fast run. Properties of interest, taken as directly obtainable results from the simula-tions, are the volume-averaged gas pressure and the surface-averaged instantaneous wall heat flux along the compression cycle. Finally, these are compared to the available experi-mental database; also fluid flow dynamics of the system are
Fig. (2). Adiabatic run – numerical simulation vs. thermodynamic analogy for r=2 (left) and r=8 (right).
0 50 100 150 200 250 300 350−2.5
−0.5
1.5
3.5
5.5x 10
4 Heat Flux and Temperature Difference
Crankshaft Angle [deg]
Hea
t Flu
x [W
/m2 ]
0 50 100 150 200 250 300 350−100
−50
0
50
100
∆ T
= T
g − T
w [K
]
0 100 200 300 400 500 600 700 800 900 10001
1.5
2
2.5
3
3.5x 10⁶ Pressure, Adiabatic run, r=2
Crankshaft Angle [deg]
Pres
sure
[Pa
]
TheoryCFX
0 100 200 300 400 500 600 700 800 900 10000
0.5
1
1.5
2
2.5
3
3.5x 10⁷ Pressure, Adiabatic run, r=8
Crankshaft Angle [deg]
Pres
sure
[Pa
]
TheoryCFX
Heat Transfer and Fluid Flows in Gas Springs The Open Thermodynamics Journal, 2010, Volume 4 15
examined and their influence to the heat transfer is dis-cussed. Overview of the investigated dimensions and the operating conditions is given in Table 1. Dead space height in the table denotes the distance from the piston top to the flat cylinder top at the Top Dead Centre (TDC) piston posi-tion.
For all simulations, as mentioned in the introduction, a DNS approach is adopted. In previous work, [6], authors explored k- , SAS - Scale Adaptive Simulation and LES - Large Eddy Simulation models, but this was abandoned for the apparent absence of actual developed turbulence in the compressed fluid, and the capability of the numerical code to solve the fluid flows without the use of approximat-ing near-wall models. This is also discussed in the following chapters.
NUMERICAL MODELLING
As stated in Table 1, the diameter and stroke of the piston in the experimental machine for both compression ratios is DxS=50.2x76 mm, operating on 2 and 1000 RPM. Simula-tion setup, meshing specifics, initial and boundary condi-
tions, and finally the results of the simulations, are presented in the following pages.
Geometry and Mesh
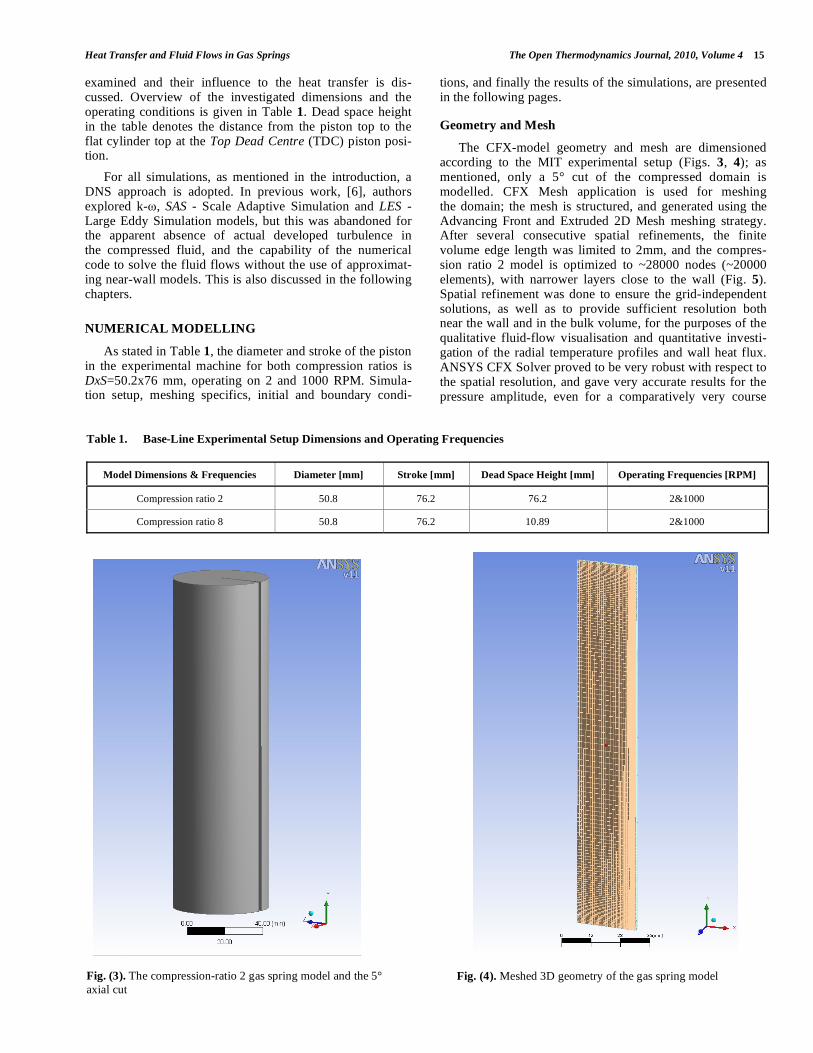
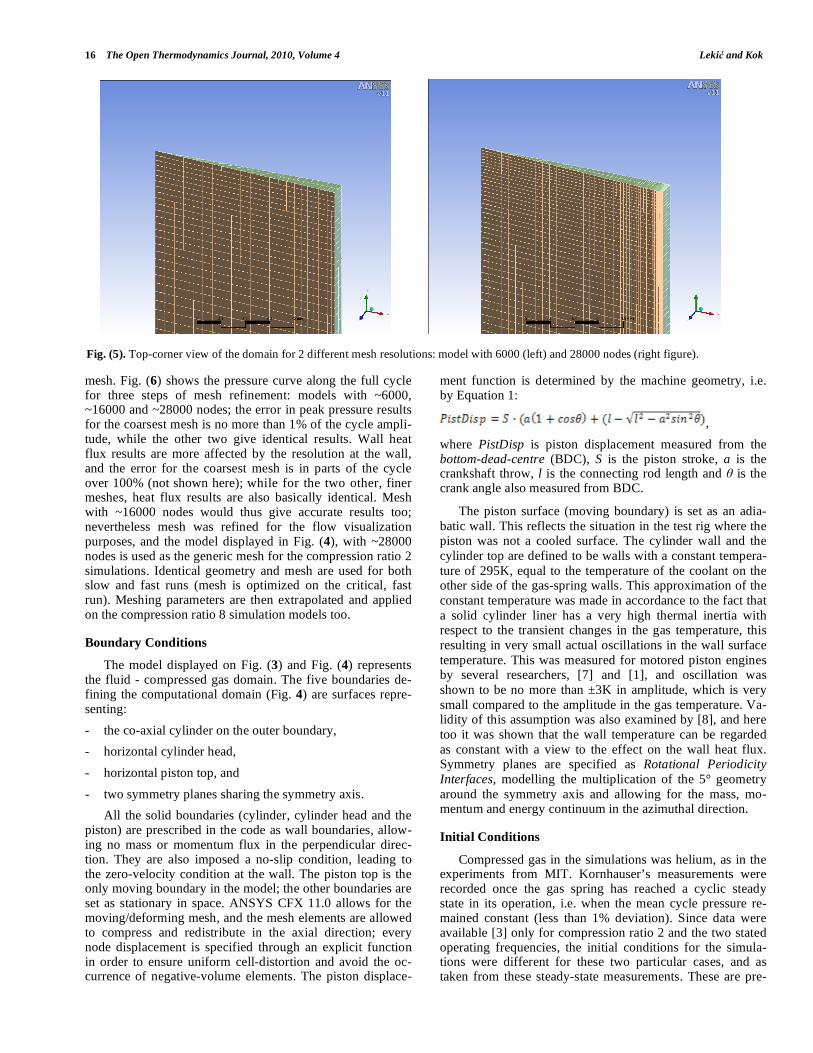
The CFX-model geometry and mesh are dimensioned according to the MIT experimental setup (Figs. 3, 4); as mentioned, only a 5° cut of the compressed domain is modelled. CFX Mesh application is used for meshing the domain; the mesh is structured, and generated using the Advancing Front and Extruded 2D Mesh meshing strategy. After several consecutive spatial refinements, the finite volume edge length was limited to 2mm, and the compres-sion ratio 2 model is optimized to ~28000 nodes (~20000 elements), with narrower layers close to the wall (Fig. 5). Spatial refinement was done to ensure the grid-independent solutions, as well as to provide sufficient resolution both near the wall and in the bulk volume, for the purposes of the qualitative fluid-flow visualisation and quantitative investi-gation of the radial temperature profiles and wall heat flux. ANSYS CFX Solver proved to be very robust with respect to the spatial resolution, and gave very accurate results for the pressure amplitude, even for a comparatively very course
Table 1. Base-Line Experimental Setup Dimensions and Operating Frequencies
Model Dimensions & Frequencies Diameter [mm] Stroke [mm] Dead Space Height [mm] Operating Frequencies [RPM]
Compression ratio 2 50.8 76.2 76.2 2&1000
Compression ratio 8 50.8 76.2 10.89 2&1000
Fig. (3). The compression-ratio 2 gas spring model and the 5°
axial cut
Fig. (4). Meshed 3D geometry of the gas spring model
16 The Open Thermodynamics Journal, 2010, Volume 4 Leki and Kok
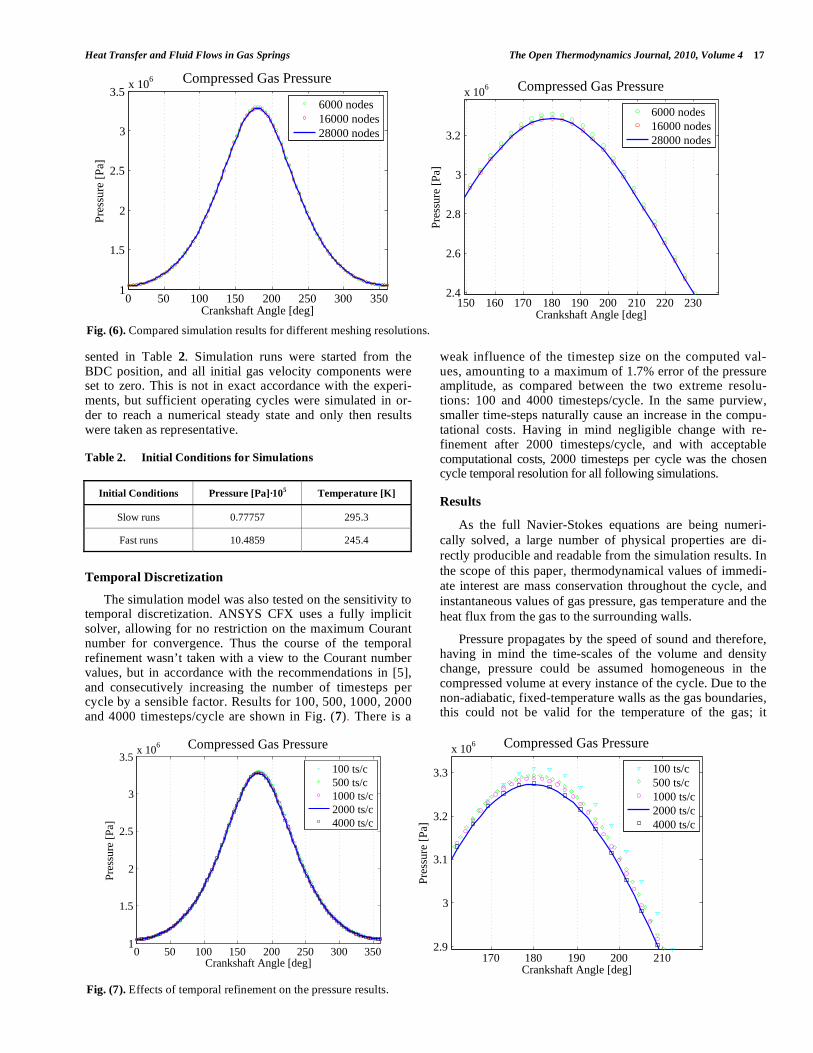
mesh. Fig. (6) shows the pressure curve along the full cycle for three steps of mesh refinement: models with ~6000, ~16000 and ~28000 nodes; the error in peak pressure results for the coarsest mesh is no more than 1% of the cycle ampli-tude, while the other two give identical results. Wall heat flux results are more affected by the resolution at the wall, and the error for the coarsest mesh is in parts of the cycle over 100% (not shown here); while for the two other, finer meshes, heat flux results are also basically identical. Mesh with ~16000 nodes would thus give accurate results too; nevertheless mesh was refined for the flow visualization purposes, and the model displayed in Fig. (4), with ~28000 nodes is used as the generic mesh for the compression ratio 2 simulations. Identical geometry and mesh are used for both slow and fast runs (mesh is optimized on the critical, fast run). Meshing parameters are then extrapolated and applied on the compression ratio 8 simulation models too.
Boundary Conditions
The model displayed on Fig. (3) and Fig. (4) represents the fluid - compressed gas domain. The five boundaries de-fining the computational domain (Fig. 4) are surfaces repre-senting:
- the co-axial cylinder on the outer boundary,
- horizontal cylinder head,
- horizontal piston top, and
- two symmetry planes sharing the symmetry axis.
All the solid boundaries (cylinder, cylinder head and the piston) are prescribed in the code as wall boundaries, allow-ing no mass or momentum flux in the perpendicular direc-tion. They are also imposed a no-slip condition, leading to the zero-velocity condition at the wall. The piston top is the only moving boundary in the model; the other boundaries are set as stationary in space. ANSYS CFX 11.0 allows for the moving/deforming mesh, and the mesh elements are allowed to compress and redistribute in the axial direction; every node displacement is specified through an explicit function in order to ensure uniform cell-distortion and avoid the oc-currence of negative-volume elements. The piston displace-
ment function is determined by the machine geometry, i.e. by Equation 1:
,
where PistDisp is piston displacement measured from the bottom-dead-centre (BDC), S is the piston stroke, a is the crankshaft throw, l is the connecting rod length and is the crank angle also measured from BDC.
The piston surface (moving boundary) is set as an adia-
batic wall. This reflects the situation in the test rig where the piston was not a cooled surface. The cylinder wall and the
cylinder top are defined to be walls with a constant tempera-
ture of 295K, equal to the temperature of the coolant on the other side of the gas-spring walls. This approximation of the
constant temperature was made in accordance to the fact that
a solid cylinder liner has a very high thermal inertia with respect to the transient changes in the gas temperature, this
resulting in very small actual oscillations in the wall surface
temperature. This was measured for motored piston engines by several researchers, [7] and [1], and oscillation was
shown to be no more than ±3K in amplitude, which is very
small compared to the amplitude in the gas temperature. Va-lidity of this assumption was also examined by [8], and here
too it was shown that the wall temperature can be regarded
as constant with a view to the effect on the wall heat flux. Symmetry planes are specified as Rotational Periodicity
Interfaces, modelling the multiplication of the 5° geometry
around the symmetry axis and allowing for the mass, mo-mentum and energy continuum in the azimuthal direction.
Initial Conditions
Compressed gas in the simulations was helium, as in the experiments from MIT. Kornhauser’s measurements were recorded once the gas spring has reached a cyclic steady state in its operation, i.e. when the mean cycle pressure re-mained constant (less than 1% deviation). Since data were available [3] only for compression ratio 2 and the two stated operating frequencies, the initial conditions for the simula-tions were different for these two particular cases, and as taken from these steady-state measurements. These are pre-
Fig. (5). Top-corner view of the domain for 2 different mesh resolutions: model with 6000 (left) and 28000 nodes (right figure).
Heat Transfer and Fluid Flows in Gas Springs The Open Thermodynamics Journal, 2010, Volume 4 17
sented in Table 2. Simulation runs were started from the BDC position, and all initial gas velocity components were set to zero. This is not in exact accordance with the experi-ments, but sufficient operating cycles were simulated in or-der to reach a numerical steady state and only then results were taken as representative.
Table 2. Initial Conditions for Simulations
Initial Conditions Pressure [Pa]·105 Temperature [K]
Slow runs 0.77757 295.3
Fast runs 10.4859 245.4
Temporal Discretization
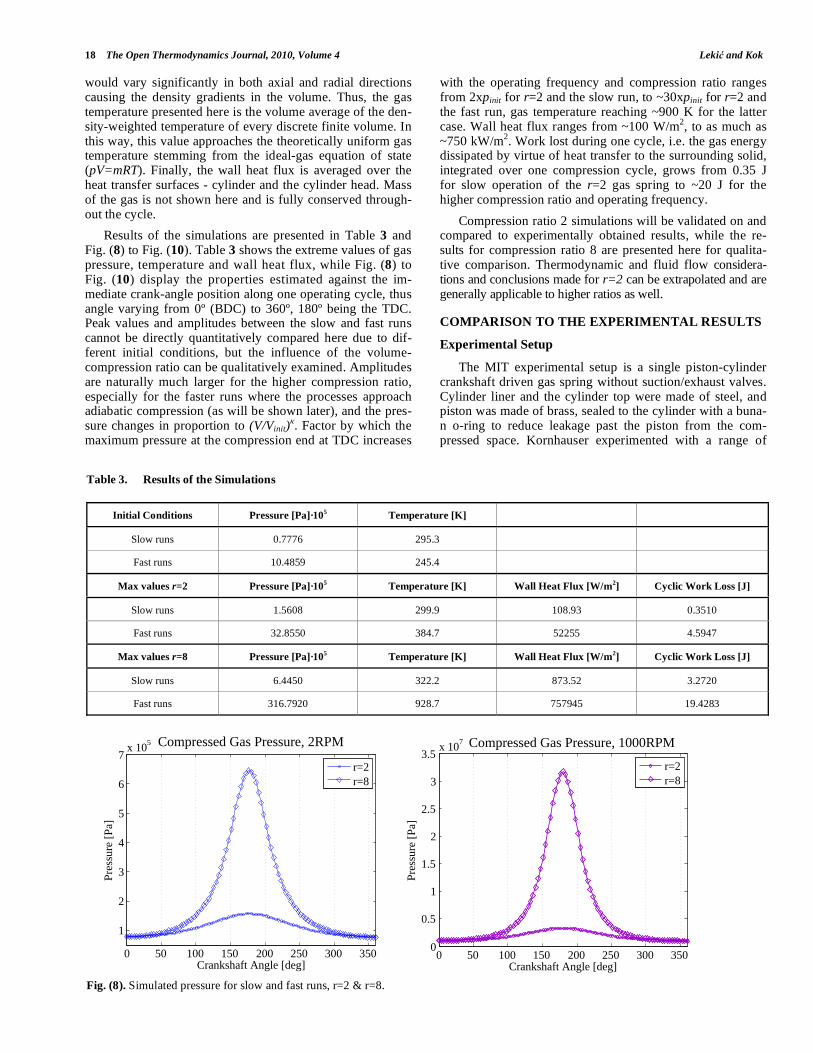
The simulation model was also tested on the sensitivity to temporal discretization. ANSYS CFX uses a fully implicit solver, allowing for no restriction on the maximum Courant number for convergence. Thus the course of the temporal refinement wasn’t taken with a view to the Courant number values, but in accordance with the recommendations in [5], and consecutively increasing the number of timesteps per cycle by a sensible factor. Results for 100, 500, 1000, 2000 and 4000 timesteps/cycle are shown in Fig. (7). There is a
weak influence of the timestep size on the computed val-ues, amounting to a maximum of 1.7% error of the pressure amplitude, as compared between the two extreme resolu-tions: 100 and 4000 timesteps/cycle. In the same purview, smaller time-steps naturally cause an increase in the compu-tational costs. Having in mind negligible change with re-finement after 2000 timesteps/cycle, and with acceptable computational costs, 2000 timesteps per cycle was the chosen cycle temporal resolution for all following simulations.
Results
As the full Navier-Stokes equations are being numeri-
cally solved, a large number of physical properties are di-
rectly producible and readable from the simulation results. In
the scope of this paper, thermodynamical values of immedi-
ate interest are mass conservation throughout the cycle, and
instantaneous values of gas pressure, gas temperature and the
heat flux from the gas to the surrounding walls.
Pressure propagates by the speed of sound and therefore, having in mind the time-scales of the volume and density change, pressure could be assumed homogeneous in the compressed volume at every instance of the cycle. Due to the non-adiabatic, fixed-temperature walls as the gas boundaries, this could not be valid for the temperature of the gas; it
Fig. (6). Compared simulation results for different meshing resolutions.
Fig. (7). Effects of temporal refinement on the pressure results.
0 50 100 150 200 250 300 3501
1.5
2
2.5
3
3.5x 10⁶ Compressed Gas Pressure
Crankshaft Angle [deg]
Pres
sure
[Pa
]
6000 nodes16000 nodes28000 nodes
150 160 170 180 190 200 210 220 2302.4
2.6
2.8
3
3.2
x 106 Compressed Gas Pressure
Crankshaft Angle [deg]
Pres
sure
[Pa
]
6000 nodes16000 nodes28000 nodes
0 50 100 150 200 250 300 3501
1.5
2
2.5
3
3.5x 10⁶ Compressed Gas Pressure
Crankshaft Angle [deg]
Pres
sure
[Pa
]
100 ts/c500 ts/c1000 ts/c2000 ts/c4000 ts/c
170 180 190 200 2102.9
3
3.1
3.2
3.3
x 106 Compressed Gas Pressure
Crankshaft Angle [deg]
Pres
sure
[Pa
]
100 ts/c500 ts/c1000 ts/c2000 ts/c4000 ts/c
18 The Open Thermodynamics Journal, 2010, Volume 4 Leki and Kok
would vary significantly in both axial and radial directions causing the density gradients in the volume. Thus, the gas temperature presented here is the volume average of the den-sity-weighted temperature of every discrete finite volume. In this way, this value approaches the theoretically uniform gas temperature stemming from the ideal-gas equation of state (pV=mRT). Finally, the wall heat flux is averaged over the heat transfer surfaces - cylinder and the cylinder head. Mass of the gas is not shown here and is fully conserved through-out the cycle.
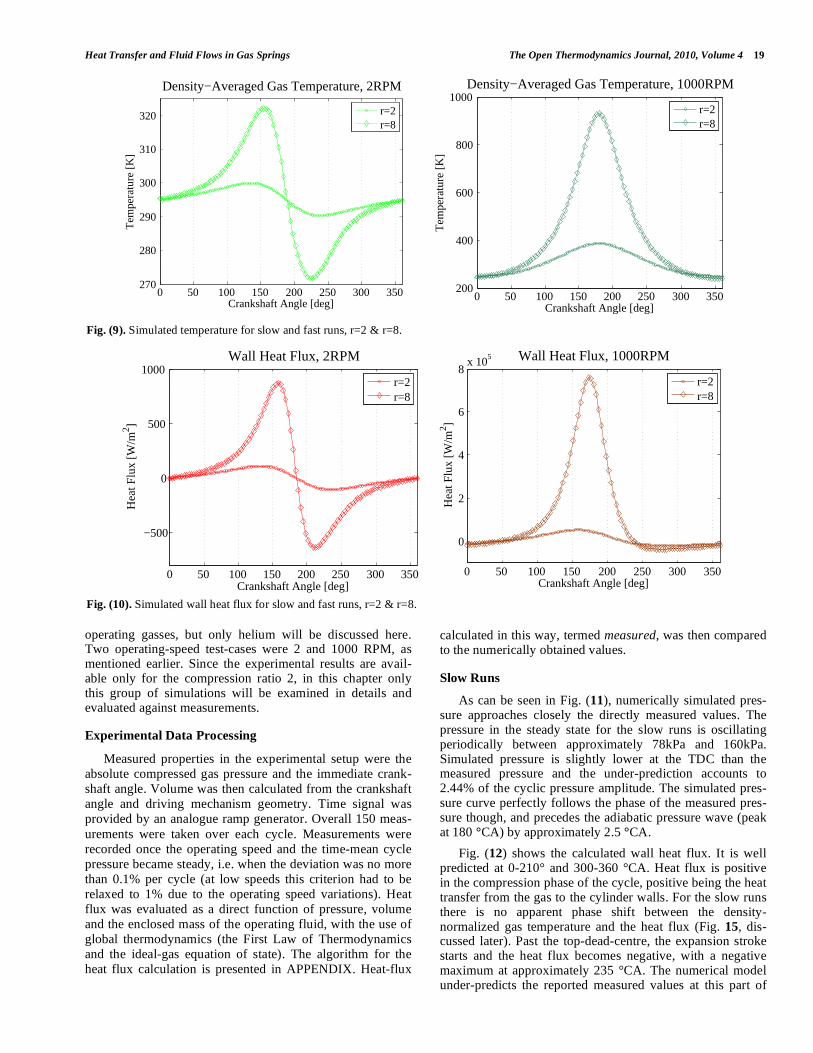
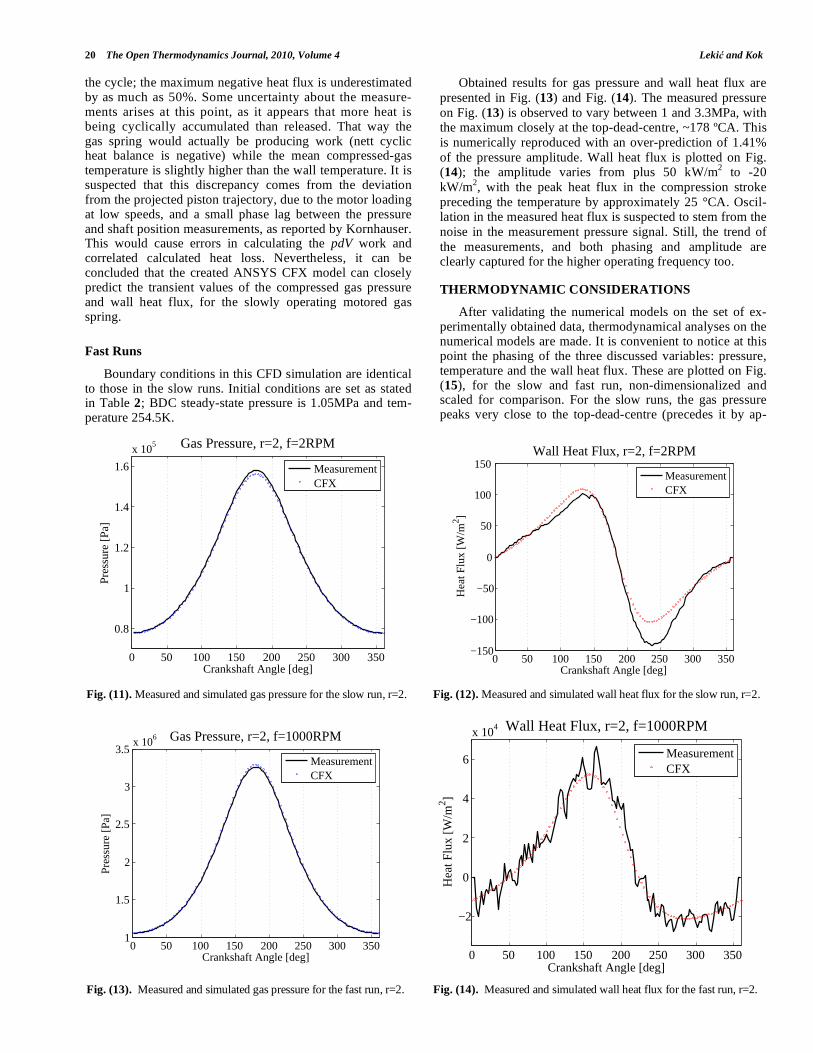
Results of the simulations are presented in Table 3 and Fig. (8) to Fig. (10). Table 3 shows the extreme values of gas pressure, temperature and wall heat flux, while Fig. (8) to Fig. (10) display the properties estimated against the im-mediate crank-angle position along one operating cycle, thus angle varying from 0º (BDC) to 360º, 180º being the TDC. Peak values and amplitudes between the slow and fast runs cannot be directly quantitatively compared here due to dif-ferent initial conditions, but the influence of the volume-compression ratio can be qualitatively examined. Amplitudes are naturally much larger for the higher compression ratio, especially for the faster runs where the processes approach adiabatic compression (as will be shown later), and the pres-sure changes in proportion to (V/Vinit) . Factor by which the maximum pressure at the compression end at TDC increases
with the operating frequency and compression ratio ranges from 2xpinit for r=2 and the slow run, to ~30xpinit for r=2 and the fast run, gas temperature reaching ~900 K for the latter case. Wall heat flux ranges from ~100 W/m
2, to as much as
~750 kW/m2. Work lost during one cycle, i.e. the gas energy
dissipated by virtue of heat transfer to the surrounding solid, integrated over one compression cycle, grows from 0.35 J for slow operation of the r=2 gas spring to ~20 J for the higher compression ratio and operating frequency.
Compression ratio 2 simulations will be validated on and compared to experimentally obtained results, while the re-sults for compression ratio 8 are presented here for qualita-tive comparison. Thermodynamic and fluid flow considera-tions and conclusions made for r=2 can be extrapolated and are generally applicable to higher ratios as well.
COMPARISON TO THE EXPERIMENTAL RESULTS
Experimental Setup
The MIT experimental setup is a single piston-cylinder crankshaft driven gas spring without suction/exhaust valves. Cylinder liner and the cylinder top were made of steel, and piston was made of brass, sealed to the cylinder with a buna-n o-ring to reduce leakage past the piston from the com-pressed space. Kornhauser experimented with a range of
Table 3. Results of the Simulations
Initial Conditions Pressure [Pa]·105 Temperature [K]
Slow runs 0.7776 295.3
Fast runs 10.4859 245.4
Max values r=2 Pressure [Pa]·105 Temperature [K] Wall Heat Flux [W/m
2] Cyclic Work Loss [J]
Slow runs 1.5608 299.9 108.93 0.3510
Fast runs 32.8550 384.7 52255 4.5947
Max values r=8 Pressure [Pa]·105 Temperature [K] Wall Heat Flux [W/m
2] Cyclic Work Loss [J]
Slow runs 6.4450 322.2 873.52 3.2720
Fast runs 316.7920 928.7 757945 19.4283
Fig. (8). Simulated pressure for slow and fast runs, r=2 & r=8.
0 50 100 150 200 250 300 350
1
2
3
4
5
6
7x 10⁵ Compressed Gas Pressure, 2RPM
Crankshaft Angle [deg]
Pres
sure
[Pa
]
r=2r=8
0 50 100 150 200 250 300 3500
0.5
1
1.5
2
2.5
3
3.5x 10⁷ Compressed Gas Pressure, 1000RPM
Crankshaft Angle [deg]
Pres
sure
[Pa
]
r=2r=8
Heat Transfer and Fluid Flows in Gas Springs The Open Thermodynamics Journal, 2010, Volume 4 19
operating gasses, but only helium will be discussed here. Two operating-speed test-cases were 2 and 1000 RPM, as mentioned earlier. Since the experimental results are avail-able only for the compression ratio 2, in this chapter only this group of simulations will be examined in details and evaluated against measurements.
Experimental Data Processing
Measured properties in the experimental setup were the
absolute compressed gas pressure and the immediate crank-
shaft angle. Volume was then calculated from the crankshaft
angle and driving mechanism geometry. Time signal was
provided by an analogue ramp generator. Overall 150 meas-
urements were taken over each cycle. Measurements were
recorded once the operating speed and the time-mean cycle
pressure became steady, i.e. when the deviation was no more
than 0.1% per cycle (at low speeds this criterion had to be
relaxed to 1% due to the operating speed variations). Heat
flux was evaluated as a direct function of pressure, volume
and the enclosed mass of the operating fluid, with the use of
global thermodynamics (the First Law of Thermodynamics
and the ideal-gas equation of state). The algorithm for the
heat flux calculation is presented in APPENDIX. Heat-flux
calculated in this way, termed measured, was then compared to the numerically obtained values.
Slow Runs
As can be seen in Fig. (11), numerically simulated pres-sure approaches closely the directly measured values. The pressure in the steady state for the slow runs is oscillating periodically between approximately 78kPa and 160kPa. Simulated pressure is slightly lower at the TDC than the measured pressure and the under-prediction accounts to 2.44% of the cyclic pressure amplitude. The simulated pres-sure curve perfectly follows the phase of the measured pres-sure though, and precedes the adiabatic pressure wave (peak at 180 °CA) by approximately 2.5 °CA.
Fig. (12) shows the calculated wall heat flux. It is well predicted at 0-210° and 300-360 °CA. Heat flux is positive in the compression phase of the cycle, positive being the heat transfer from the gas to the cylinder walls. For the slow runs there is no apparent phase shift between the density-normalized gas temperature and the heat flux (Fig. 15, dis-cussed later). Past the top-dead-centre, the expansion stroke starts and the heat flux becomes negative, with a negative maximum at approximately 235 °CA. The numerical model under-predicts the reported measured values at this part of
Fig. (9). Simulated temperature for slow and fast runs, r=2 & r=8.
Fig. (10). Simulated wall heat flux for slow and fast runs, r=2 & r=8.
0 50 100 150 200 250 300 350270
280
290
300
310
320
Density−Averaged Gas Temperature, 2RPM
Crankshaft Angle [deg]
Tem
pera
ture
[K]
r=2r=8
0 50 100 150 200 250 300 350200
400
600
800
1000Density−Averaged Gas Temperature, 1000RPM
Crankshaft Angle [deg]
Tem
pera
ture
[K]
r=2r=8
0 50 100 150 200 250 300 350
−500
0
500
1000Wall Heat Flux, 2RPM
Crankshaft Angle [deg]
Hea
t Flu
x [W
/m2 ]
r=2r=8
0 50 100 150 200 250 300 350
0
2
4
6
8x 10⁵ Wall Heat Flux, 1000RPM
Crankshaft Angle [deg]
Hea
t Flu
x [W
/m2 ]
r=2r=8
20 The Open Thermodynamics Journal, 2010, Volume 4 Leki and Kok
the cycle; the maximum negative heat flux is underestimated by as much as 50%. Some uncertainty about the measure-ments arises at this point, as it appears that more heat is being cyclically accumulated than released. That way the gas spring would actually be producing work (nett cyclic heat balance is negative) while the mean compressed-gas temperature is slightly higher than the wall temperature. It is suspected that this discrepancy comes from the deviation from the projected piston trajectory, due to the motor loading at low speeds, and a small phase lag between the pressure and shaft position measurements, as reported by Kornhauser. This would cause errors in calculating the pdV work and correlated calculated heat loss. Nevertheless, it can be concluded that the created ANSYS CFX model can closely predict the transient values of the compressed gas pressure and wall heat flux, for the slowly operating motored gas spring.
Fast Runs
Boundary conditions in this CFD simulation are identical to those in the slow runs. Initial conditions are set as stated in Table 2; BDC steady-state pressure is 1.05MPa and tem-perature 254.5K.
Obtained results for gas pressure and wall heat flux are
presented in Fig. (13) and Fig. (14). The measured pressure
on Fig. (13) is observed to vary between 1 and 3.3MPa, with the maximum closely at the top-dead-centre, ~178 ºCA. This
is numerically reproduced with an over-prediction of 1.41%
of the pressure amplitude. Wall heat flux is plotted on Fig. (14); the amplitude varies from plus 50 kW/m
2 to -20
kW/m2, with the peak heat flux in the compression stroke
preceding the temperature by approximately 25 °CA. Oscil-lation in the measured heat flux is suspected to stem from the
noise in the measurement pressure signal. Still, the trend of
the measurements, and both phasing and amplitude are clearly captured for the higher operating frequency too.
THERMODYNAMIC CONSIDERATIONS
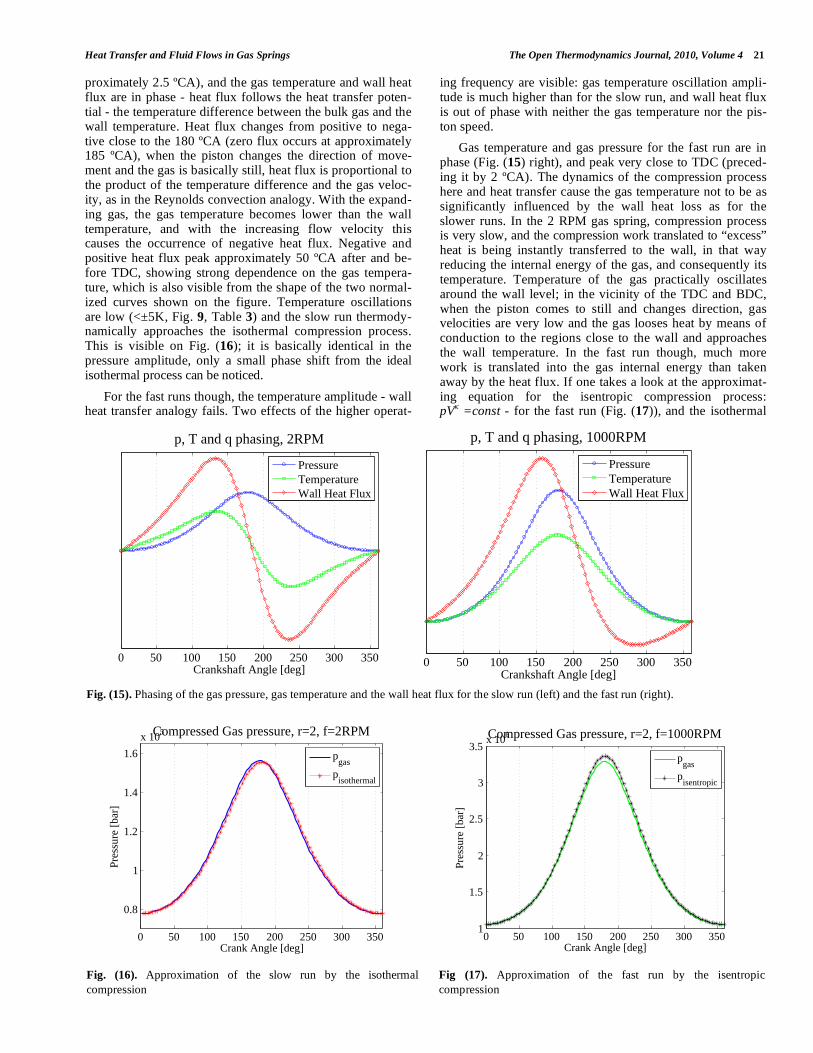
After validating the numerical models on the set of ex-perimentally obtained data, thermodynamical analyses on the numerical models are made. It is convenient to notice at this point the phasing of the three discussed variables: pressure, temperature and the wall heat flux. These are plotted on Fig. (15), for the slow and fast run, non-dimensionalized and scaled for comparison. For the slow runs, the gas pressure peaks very close to the top-dead-centre (precedes it by ap-
Fig. (11). Measured and simulated gas pressure for the slow run, r=2.
Fig. (12). Measured and simulated wall heat flux for the slow run, r=2.
Fig. (13). Measured and simulated gas pressure for the fast run, r=2.
Fig. (14). Measured and simulated wall heat flux for the fast run, r=2.
0 50 100 150 200 250 300 350
0.8
1
1.2
1.4
1.6
x 105 Gas Pressure, r=2, f=2RPM
Crankshaft Angle [deg]
Pres
sure
[Pa
]
MeasurementCFX
0 50 100 150 200 250 300 350−150
−100
−50
0
50
100
150Wall Heat Flux, r=2, f=2RPM
Crankshaft Angle [deg]
Hea
t Flu
x [W
/m2 ]
MeasurementCFX
0 50 100 150 200 250 300 3501
1.5
2
2.5
3
3.5x 10⁶ Gas Pressure, r=2, f=1000RPM
Crankshaft Angle [deg]
Pres
sure
[Pa
]
MeasurementCFX
0 50 100 150 200 250 300 350
−2
0
2
4
6
x 104 Wall Heat Flux, r=2, f=1000RPM
Crankshaft Angle [deg]
Hea
t Flu
x [W
/m2 ]
MeasurementCFX
Heat Transfer and Fluid Flows in Gas Springs The Open Thermodynamics Journal, 2010, Volume 4 21
proximately 2.5 ºCA), and the gas temperature and wall heat flux are in phase - heat flux follows the heat transfer poten-tial - the temperature difference between the bulk gas and the wall temperature. Heat flux changes from positive to nega-tive close to the 180 ºCA (zero flux occurs at approximately 185 ºCA), when the piston changes the direction of move-ment and the gas is basically still, heat flux is proportional to the product of the temperature difference and the gas veloc-ity, as in the Reynolds convection analogy. With the expand-ing gas, the gas temperature becomes lower than the wall temperature, and with the increasing flow velocity this causes the occurrence of negative heat flux. Negative and positive heat flux peak approximately 50 ºCA after and be-fore TDC, showing strong dependence on the gas tempera-ture, which is also visible from the shape of the two normal-ized curves shown on the figure. Temperature oscillations are low (<±5K, Fig. 9, Table 3) and the slow run thermody-namically approaches the isothermal compression process. This is visible on Fig. (16); it is basically identical in the pressure amplitude, only a small phase shift from the ideal isothermal process can be noticed.
For the fast runs though, the temperature amplitude - wall heat transfer analogy fails. Two effects of the higher operat-
ing frequency are visible: gas temperature oscillation ampli-tude is much higher than for the slow run, and wall heat flux is out of phase with neither the gas temperature nor the pis-ton speed.
Gas temperature and gas pressure for the fast run are in phase (Fig. (15) right), and peak very close to TDC (preced-ing it by 2 ºCA). The dynamics of the compression process here and heat transfer cause the gas temperature not to be as significantly influenced by the wall heat loss as for the slower runs. In the 2 RPM gas spring, compression process is very slow, and the compression work translated to “excess” heat is being instantly transferred to the wall, in that way reducing the internal energy of the gas, and consequently its temperature. Temperature of the gas practically oscillates around the wall level; in the vicinity of the TDC and BDC, when the piston comes to still and changes direction, gas velocities are very low and the gas looses heat by means of conduction to the regions close to the wall and approaches the wall temperature. In the fast run though, much more work is translated into the gas internal energy than taken away by the heat flux. If one takes a look at the approximat-ing equation for the isentropic compression process: pV =const - for the fast run (Fig. (17)), and the isothermal
Fig. (15). Phasing of the gas pressure, gas temperature and the wall heat flux for the slow run (left) and the fast run (right).
Fig. (16). Approximation of the slow run by the isothermal
compression
Fig (17). Approximation of the fast run by the isentropic
compression
0 50 100 150 200 250 300 350
0.8
1
1.2
1.4
1.6
x 105Compressed Gas pressure, r=2, f=2RPM
Crank Angle [deg]
Pres
sure
[ba
r]
pgas
pisothermal
0 50 100 150 200 250 300 3501
1.5
2
2.5
3
3.5x 10⁶Compressed Gas pressure, r=2, f=1000RPM
Crank Angle [deg]
Pres
sure
[ba
r]
pgas
pisentropic
0 50 100 150 200 250 300 350
p, T and q phasing, 2RPM
Crankshaft Angle [deg]
PressureTemperatureWall Heat Flux
0 50 100 150 200 250 300 350
p, T and q phasing, 1000RPM
Crankshaft Angle [deg]
PressureTemperatureWall Heat Flux
22 The Open Thermodynamics Journal, 2010, Volume 4 Leki and Kok
process: pV=const - for the slow run (Fig. (16)); (where is the adiabatic compression exponent and =1.67 for helium), it is visible that for the same change in volume V, change in pressure p will be higher for the higher operating frequen-cies, since >1. Through the ideal-gas equation of state, pV=mRT, this also translates to gas temperatures and con-firms the much higher temperature amplitude in the fast run.
Heat flux in the fast runs is shifted “to the right” com-pared to the slow run; peak heat flux occurs at approximately 155 ºCA, thus approximately 65 ºCA later than the maxi-mum piston velocity moment, and 25 ºCA earlier than the maximum temperature difference between the gas and the wall (for the slow run, heat flux was directly proportional to the temperature potential). Zero heat flux also occurs later in the cycle, approximately at 220 ºCA. Phenomena related to this will be discussed in the following paragraphs.
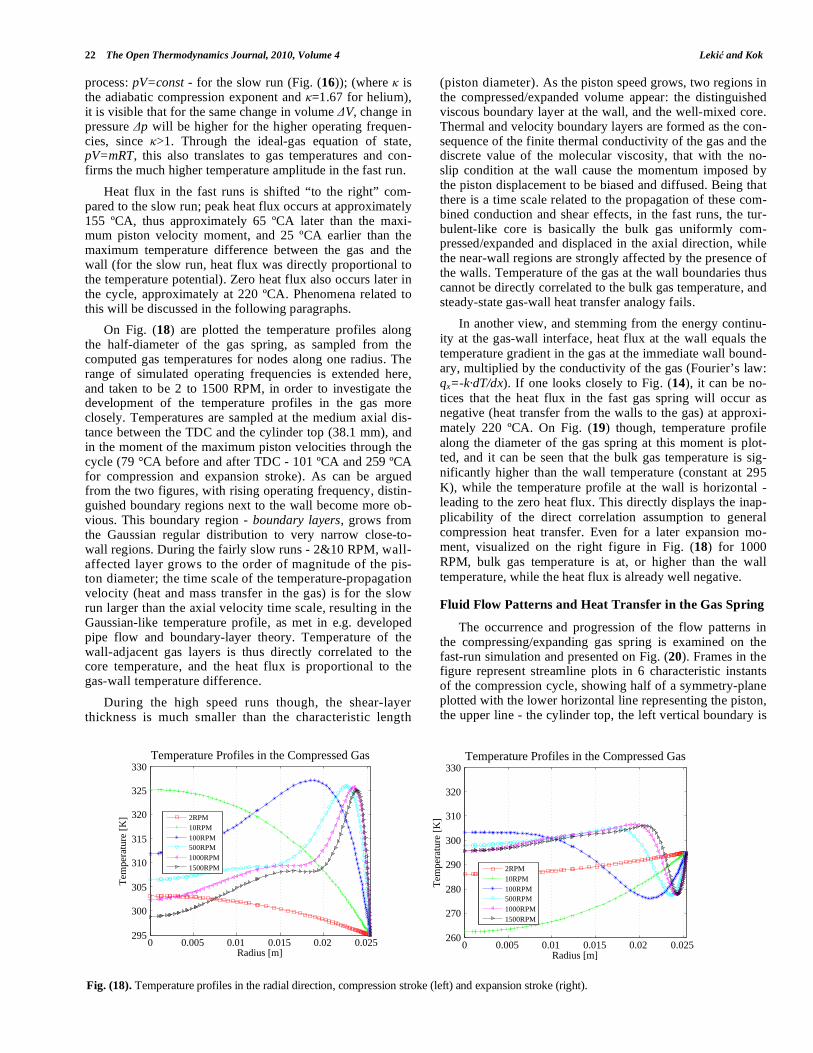
On Fig. (18) are plotted the temperature profiles along the half-diameter of the gas spring, as sampled from the computed gas temperatures for nodes along one radius. The range of simulated operating frequencies is extended here, and taken to be 2 to 1500 RPM, in order to investigate the development of the temperature profiles in the gas more closely. Temperatures are sampled at the medium axial dis-tance between the TDC and the cylinder top (38.1 mm), and in the moment of the maximum piston velocities through the cycle (79 °CA before and after TDC - 101 ºCA and 259 ºCA for compression and expansion stroke). As can be argued from the two figures, with rising operating frequency, distin-guished boundary regions next to the wall become more ob-vious. This boundary region - boundary layers, grows from the Gaussian regular distribution to very narrow close-to-wall regions. During the fairly slow runs - 2&10 RPM, wall-affected layer grows to the order of magnitude of the pis-ton diameter; the time scale of the temperature-propagation velocity (heat and mass transfer in the gas) is for the slow run larger than the axial velocity time scale, resulting in the Gaussian-like temperature profile, as met in e.g. developed pipe flow and boundary-layer theory. Temperature of the wall-adjacent gas layers is thus directly correlated to the core temperature, and the heat flux is proportional to the gas-wall temperature difference.
During the high speed runs though, the shear-layer thickness is much smaller than the characteristic length
(piston diameter). As the piston speed grows, two regions in the compressed/expanded volume appear: the distinguished viscous boundary layer at the wall, and the well-mixed core. Thermal and velocity boundary layers are formed as the con-sequence of the finite thermal conductivity of the gas and the discrete value of the molecular viscosity, that with the no- slip condition at the wall cause the momentum imposed by the piston displacement to be biased and diffused. Being that there is a time scale related to the propagation of these com-bined conduction and shear effects, in the fast runs, the tur-bulent-like core is basically the bulk gas uniformly com-pressed/expanded and displaced in the axial direction, while the near-wall regions are strongly affected by the presence of the walls. Temperature of the gas at the wall boundaries thus cannot be directly correlated to the bulk gas temperature, and steady-state gas-wall heat transfer analogy fails.
In another view, and stemming from the energy continu-
ity at the gas-wall interface, heat flux at the wall equals the
temperature gradient in the gas at the immediate wall bound-ary, multiplied by the conductivity of the gas (Fourier’s law:
qx=-k·dT/dx). If one looks closely to Fig. (14), it can be no-
tices that the heat flux in the fast gas spring will occur as negative (heat transfer from the walls to the gas) at approxi-
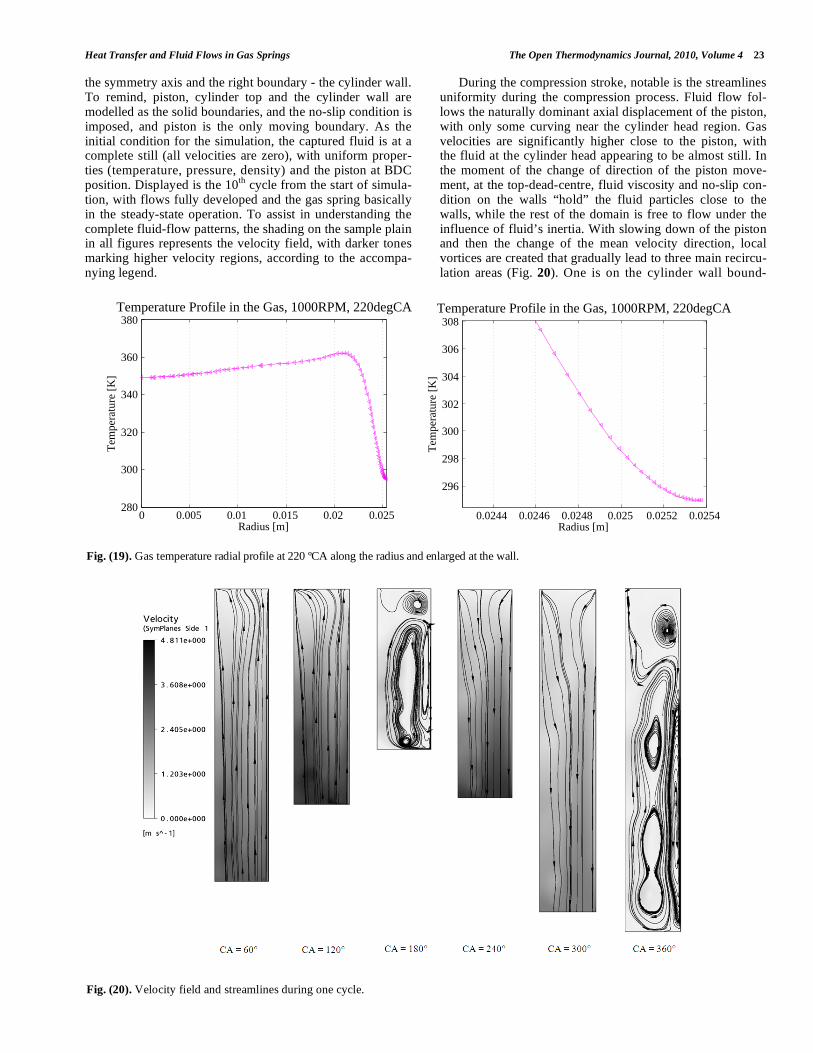
mately 220 ºCA. On Fig. (19) though, temperature profile
along the diameter of the gas spring at this moment is plot-ted, and it can be seen that the bulk gas temperature is sig-
nificantly higher than the wall temperature (constant at 295
K), while the temperature profile at the wall is horizontal - leading to the zero heat flux. This directly displays the inap-
plicability of the direct correlation assumption to general
compression heat transfer. Even for a later expansion mo-ment, visualized on the right figure in Fig. (18) for 1000
RPM, bulk gas temperature is at, or higher than the wall
temperature, while the heat flux is already well negative.
Fluid Flow Patterns and Heat Transfer in the Gas Spring
The occurrence and progression of the flow patterns in the compressing/expanding gas spring is examined on the fast-run simulation and presented on Fig. (20). Frames in the figure represent streamline plots in 6 characteristic instants of the compression cycle, showing half of a symmetry-plane plotted with the lower horizontal line representing the piston, the upper line - the cylinder top, the left vertical boundary is
Fig. (18). Temperature profiles in the radial direction, compression stroke (left) and expansion stroke (right).
0 0.005 0.01 0.015 0.02 0.025295
300
305
310
315
320
325
330Temperature Profiles in the Compressed Gas
Radius [m]
Tem
pera
ture
[K
]
2RPM10RPM100RPM500RPM1000RPM1500RPM
0 0.005 0.01 0.015 0.02 0.025260
270
280
290
300
310
320
330Temperature Profiles in the Compressed Gas
Radius [m]
Tem
pera
ture
[K
]
2RPM10RPM100RPM500RPM1000RPM1500RPM
Heat Transfer and Fluid Flows in Gas Springs The Open Thermodynamics Journal, 2010, Volume 4 23
the symmetry axis and the right boundary - the cylinder wall. To remind, piston, cylinder top and the cylinder wall are modelled as the solid boundaries, and the no-slip condition is imposed, and piston is the only moving boundary. As the initial condition for the simulation, the captured fluid is at a complete still (all velocities are zero), with uniform proper-ties (temperature, pressure, density) and the piston at BDC position. Displayed is the 10
th cycle from the start of simula-
tion, with flows fully developed and the gas spring basically in the steady-state operation. To assist in understanding the complete fluid-flow patterns, the shading on the sample plain in all figures represents the velocity field, with darker tones marking higher velocity regions, according to the accompa-nying legend.
During the compression stroke, notable is the streamlines uniformity during the compression process. Fluid flow fol-lows the naturally dominant axial displacement of the piston, with only some curving near the cylinder head region. Gas velocities are significantly higher close to the piston, with the fluid at the cylinder head appearing to be almost still. In the moment of the change of direction of the piston move-ment, at the top-dead-centre, fluid viscosity and no-slip con-dition on the walls “hold” the fluid particles close to the walls, while the rest of the domain is free to flow under the influence of fluid’s inertia. With slowing down of the piston and then the change of the mean velocity direction, local vortices are created that gradually lead to three main recircu-lation areas (Fig. 20). One is on the cylinder wall bound-
Fig. (19). Gas temperature radial profile at 220 ºCA along the radius and enlarged at the wall.
Fig. (20). Velocity field and streamlines during one cycle.
0 0.005 0.01 0.015 0.02 0.025280
300
320
340
360
380Temperature Profile in the Gas, 1000RPM, 220degCA
Radius [m]
Tem
pera
ture
[K
]
0.0244 0.0246 0.0248 0.025 0.0252 0.0254
296
298
300
302
304
306
308Temperature Profile in the Gas, 1000RPM, 220degCA
Radius [m]
Tem
pera
ture
[K
]
24 The Open Thermodynamics Journal, 2010, Volume 4 Leki and Kok
ary, one is in the “dead” corner of cylinder and head, and the third is in the bulk gas area. It should be noticed, though, that the velocities of the fluid particles are very low in this part of the cycle. With expansion and piston moving in the other direction, flow again takes the nearly uniform vertical order, up to the BDC moment, when vorticing and recircula-tion areas appear again.
Flow patterns mentioned above govern the heat transfer process during the compression/expansion cycle. During the upward and downward strokes, while the piston is moving with a significant velocity, flow inside the gas spring is very stratified, and the dominating heat transfer mechanism in the fluid is conduction. There is no gas inflow or domain geome-try to increase the mixing or stimulate the radial velocity component (the vorticing is caused only by viscosity-driven shearing effects in layers close to the wall), and the re-distribution of gas temperature in the radial direction is very limited. With the low thermal conductivity of the gas, for the fast run conduction is a much slower process than the instant warming-up and cooling of the axial layers in the gas, im-posed by the piston movement and compression. This causes the specific temperature profiles shown typically in Fig. (18). Fluid in the vicinity of the surrounding walls is affected by the thermal mass of the solid and forms thermal boundary layers. These boundary layers can carry a significant part of the volume-enclosed gas mass (up to 30-40%, [9]) due to high density gradients and act as buffers - high density insulating layers that actively interact in the energy exchange with the core only in the moments of changing piston motion direction, i.e. at TDC and BDC. The flow structure is then disturbed and the warm/cold core gas recirculates to the wall, only then forc-ing the actual convective heat transfer. In this way the instan-taneous wall heat flux is not directly dependent on the tem-perature of the gas-spring core, but rather on the dynamics of the compression process, extent of mixing of the fluid flows and the interaction between the core and the wall, through the bounding gas layers.
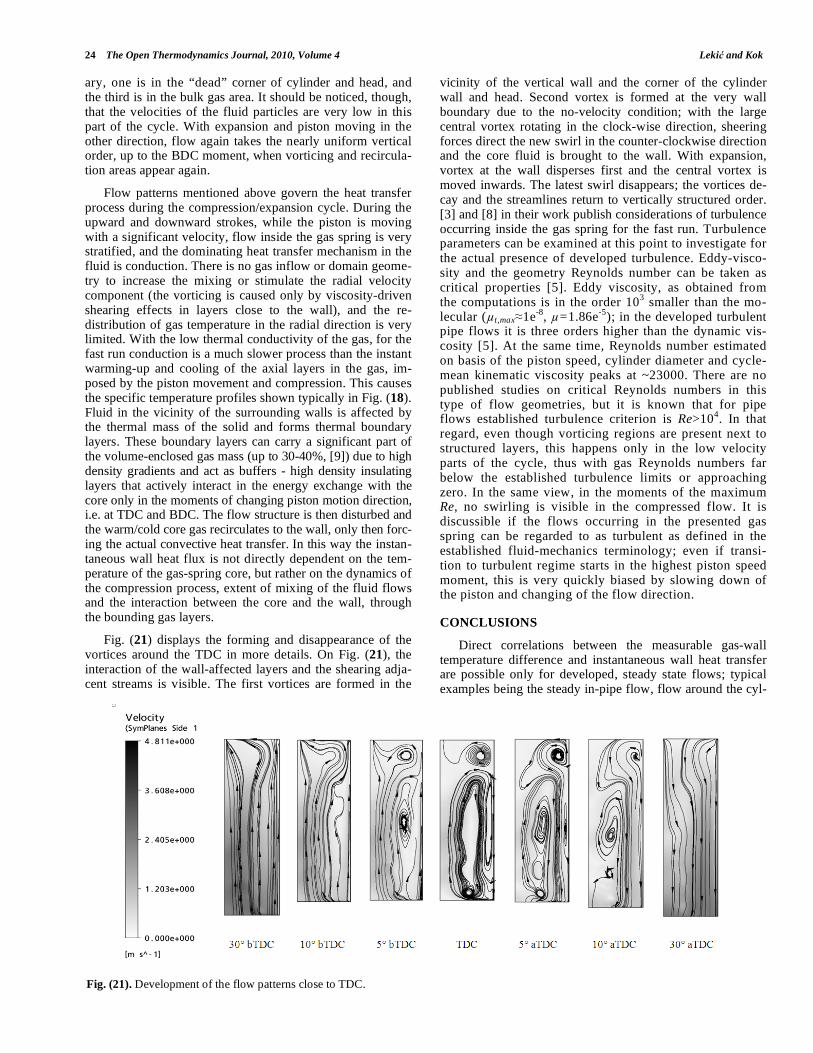
Fig. (21) displays the forming and disappearance of the vortices around the TDC in more details. On Fig. (21), the interaction of the wall-affected layers and the shearing adja-cent streams is visible. The first vortices are formed in the
vicinity of the vertical wall and the corner of the cylinder wall and head. Second vortex is formed at the very wall boundary due to the no-velocity condition; with the large central vortex rotating in the clock-wise direction, sheering forces direct the new swirl in the counter-clockwise direction and the core fluid is brought to the wall. With expansion, vortex at the wall disperses first and the central vortex is moved inwards. The latest swirl disappears; the vortices de-cay and the streamlines return to vertically structured order. [3] and [8] in their work publish considerations of turbulence occurring inside the gas spring for the fast run. Turbulence parameters can be examined at this point to investigate for the actual presence of developed turbulence. Eddy-visco-sity and the geometry Reynolds number can be taken as critical properties [5]. Eddy viscosity, as obtained from the computations is in the order 10
3 smaller than the mo-
lecular ( t,max 1e-8
, =1.86e-5
); in the developed turbulent pipe flows it is three orders higher than the dynamic vis-cosity [5]. At the same time, Reynolds number estimated on basis of the piston speed, cylinder diameter and cycle-mean kinematic viscosity peaks at ~23000. There are no published studies on critical Reynolds numbers in this type of flow geometries, but it is known that for pipe flows established turbulence criterion is Re>10
4. In that
regard, even though vorticing regions are present next to structured layers, this happens only in the low velocity parts of the cycle, thus with gas Reynolds numbers far below the established turbulence limits or approaching zero. In the same view, in the moments of the maximum Re, no swirling is visible in the compressed flow. It is discussible if the flows occurring in the presented gas spring can be regarded to as turbulent as defined in the established fluid-mechanics terminology; even if transi-tion to turbulent regime starts in the highest piston speed moment, this is very quickly biased by slowing down of the piston and changing of the flow direction.
CONCLUSIONS
Direct correlations between the measurable gas-wall temperature difference and instantaneous wall heat transfer are possible only for developed, steady state flows; typical examples being the steady in-pipe flow, flow around the cyl-
Fig. (21). Development of the flow patterns close to TDC.
Heat Transfer and Fluid Flows in Gas Springs The Open Thermodynamics Journal, 2010, Volume 4 25
inder or over a plate. These correlations fail for closed recip-rocating piston-cylinder geometries. To date there are no analytical models to quantitatively, or qualitatively pre-dict the instantaneous wall heat flux. Numerical models are developed and presented here with the use of the finite-volume numerical package ANSYS CFX11.0, to simulate
the occurring thermodynamic phenomena.
Characteristic properties such as the compressed gas pressure and heat transfer from the gas to the surrounding solid are examined. For typically slow runs, wall heat flux is in phase and proportional to the gas-wall temperature differ-ence. For the typically fast runs, gas temperature and pres-sure are in phase, while the peak heat transfer precedes the maximum gas-wall temperature difference by 25 ºCA and occurs approximately 65 ºCA later than the maximum piston velocity moment. Simulated results are compared to the ex-perimental database obtained at MIT. Numerical models very successfully predict the measured values, with very little error introduced and prove to be a powerful tool for
CFD design.
In view of the relevance to the convective heat transfer, fluid-flow patterns occurring in the gas springs are analysed. Timescale of propagation and the shape of thermal boundary layers are discussed. During the compression and expan-sion strokes flow inside the gas spring is very stratified, and the dominating heat transfer mechanism is conduc-tion. The flow structure is only disturbed at the dead centre positions of the piston, when the core gas recirculates to the wall and forces the actual convective heat transfer. In this way the instantaneous wall heat flux is not directly dependent on the temperature of the gas-spring core, but rather on the dynamics of the compression process and existence of
the boundary layers in the compressed gas.
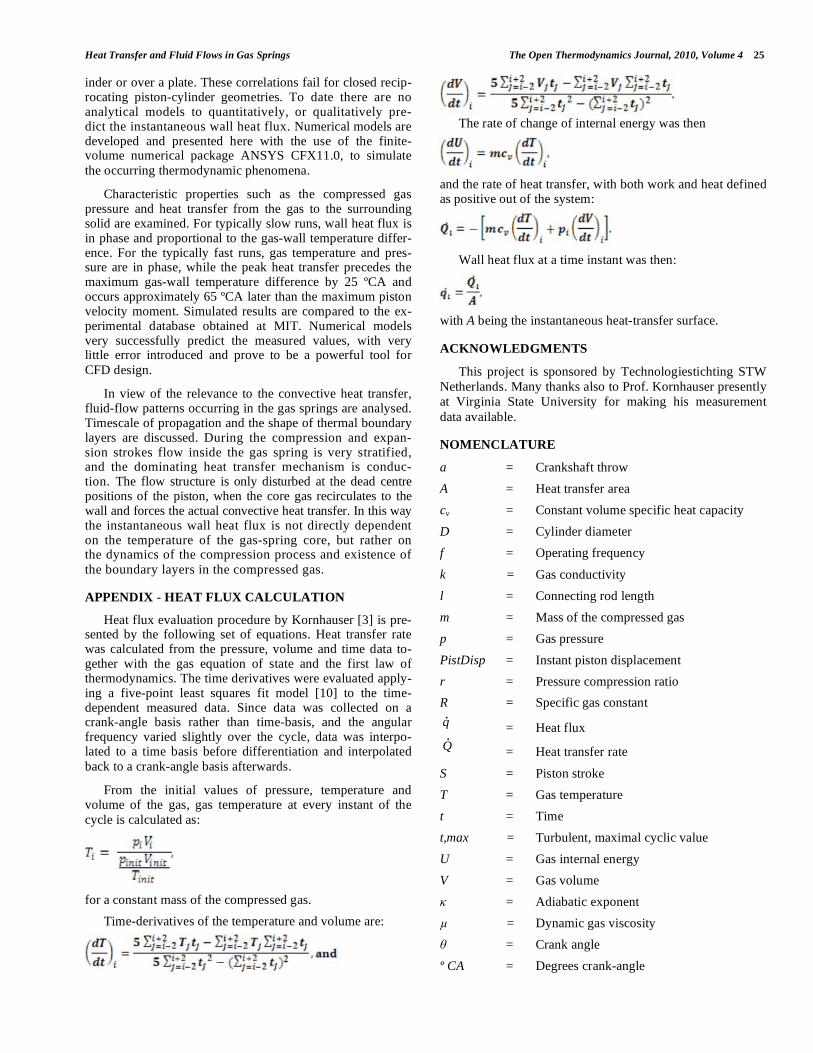
APPENDIX - HEAT FLUX CALCULATION
Heat flux evaluation procedure by Kornhauser [3] is pre-sented by the following set of equations. Heat transfer rate was calculated from the pressure, volume and time data to-gether with the gas equation of state and the first law of thermodynamics. The time derivatives were evaluated apply-ing a five-point least squares fit model [10] to the time-dependent measured data. Since data was collected on a crank-angle basis rather than time-basis, and the angular frequency varied slightly over the cycle, data was interpo-lated to a time basis before differentiation and interpolated
back to a crank-angle basis afterwards.
From the initial values of pressure, temperature and volume of the gas, gas temperature at every instant of the
cycle is calculated as:
for a constant mass of the compressed gas.
Time-derivatives of the temperature and volume are:
The rate of change of internal energy was then
and the rate of heat transfer, with both work and heat defined as positive out of the system:
Wall heat flux at a time instant was then:
with A being the instantaneous heat-transfer surface.
ACKNOWLEDGMENTS
This project is sponsored by Technologiestichting STW
Netherlands. Many thanks also to Prof. Kornhauser presently
at Virginia State University for making his measurement
data available.
NOMENCLATURE
a = Crankshaft throw
A = Heat transfer area
cv = Constant volume specific heat capacity
D = Cylinder diameter
f = Operating frequency
k = Gas conductivity
l = Connecting rod length
m = Mass of the compressed gas
p = Gas pressure
PistDisp = Instant piston displacement
r = Pressure compression ratio
R = Specific gas constant
q.
= Heat flux
Q.
= Heat transfer rate
S = Piston stroke
T = Gas temperature
t = Time
t,max = Turbulent, maximal cyclic value
U = Gas internal energy
V = Gas volume
= Adiabatic exponent
= Dynamic gas viscosity
= Crank angle
º CA = Degrees crank-angle
26 The Open Thermodynamics Journal, 2010, Volume 4 Leki and Kok
Subscripts
i, j = Integers
init = Initial
REFERENCES
[1] W.J.D. Annand and D. Pinfold, “Heat Transfer in the Cylinder of a
Motored Reciprocating Engine,” Society of Automotive Engineers, SAE Paper 800457, 1980.
[2] B Lawton, “Effect of compression and expansion on instantaneous heat transfer in reciprocating internal combustion engines,”
MIMechE Paper, vol. 201, no. A3, 1987. [3] A.A. Kornhauser, “Gas-Wall Heat Transfer During Compression
and Expansion,” Massachusetts Institute of Technology, PhD Thesis 1989.
[4] K.P. Lee, “A Simplistic Model of Cyclic Heat Transfer Phenomena
in Closed Spaces,” in 18th IECEC, 1983, pp. 720-730. [5] ANSYS Inc, ANSYS CFX Release 10.0: Instalation and Overview
Notes, 2005. [6] U. Leki and J.B.W Kok, “Heat Flows in Piston Compressors,” in
5th EUROTHERM, 2008, FCV_4. [7] R.P. Adair, E.B. Qvale, J.P. Pearson, “Instantaneous heat transfer
to the cylinder wall in reciprocating compressors,” in 1972 Purdue Compressor Technology Conference, USA, 1972.
[8] H.G. Jak, “Heat Transfer in a Gas Spring,” University of Twente, M.Sc.Thesis 2001.
[9] E.J. Heywood and J.B. Lyford-Pike, “Thermal boundary layer thickness in the cylinder pf a spark-ignition engine,” International
Journal of Heat and Mass Transfer, vol. 27, pp. 1873-1878, 1984. [10] D.H. Menzel, Fundamental Formulas of Physics, England: Dover,
1960, vol. 1.
Received: September 1, 2009 Revised: October 13, 2009 Accepted: October 13, 2009
© Leki and Kok; Licensee Bentham Open.
This is an open access article licensed under the terms of the Creative Commons Attribution Non-Commercial License
(http://creativecommons.org/licenses/by-nc/3.0/) which permits unrestricted, non-commercial use, distribution and reproduction in any medium, provided the work is properly cited.


![Numerical Heat Transfer and Fluid FLow [Patankar]](https://img.pdfslide.us/doc/110x75/55cf8fea550346703ba13647/numerical-heat-transfer-and-fluid-flow-patankar-569a3a8a8d259.jpg)