Embed Size (px)
Citation preview
Heat Stress in USANow & in the Future
Extended version
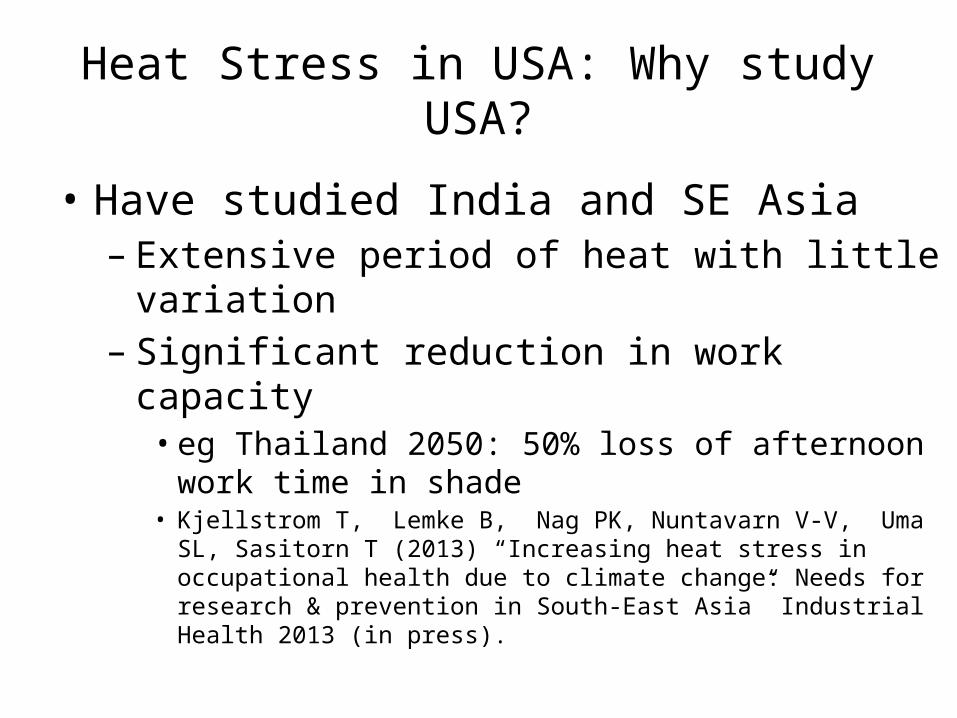
Heat Stress in USA: Why study USA?
• Have studied India and SE Asia– Extensive period of heat with little variation– Significant reduction in work capacity• eg Thailand 2050: 50% loss of afternoon work time in
shade• Kjellstrom T, Lemke B, Nag PK, Nuntavarn V-V, Uma SL, Sasitorn T (2013)
“Increasing heat stress in occupational health due to climate change: Needs for research & prevention in South-East Asia” Industrial Health 2013 (in press).
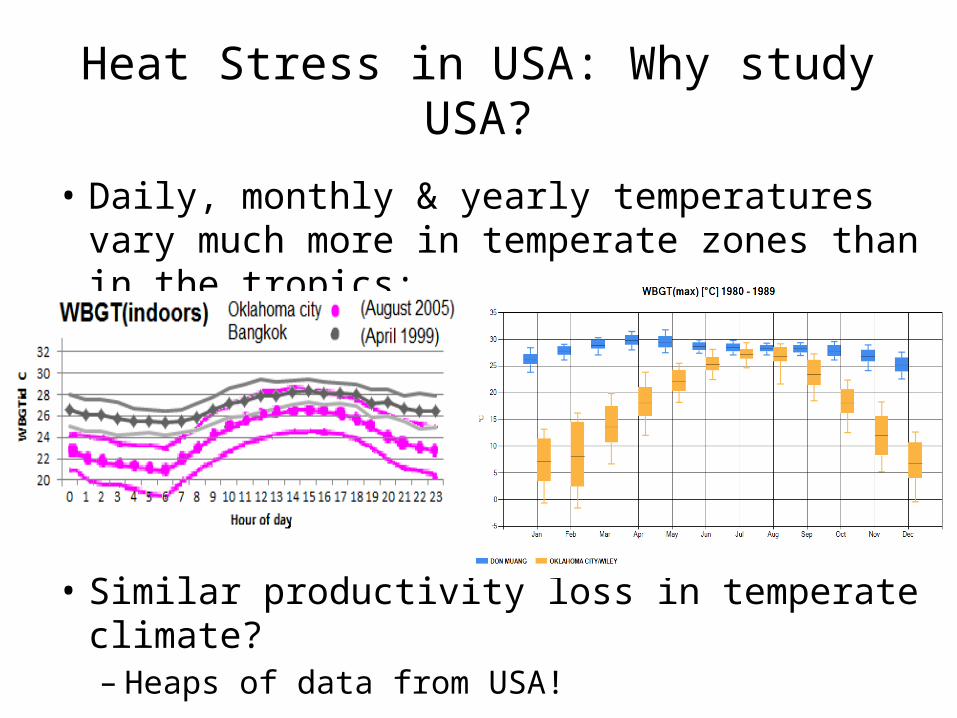
Heat Stress in USA: Why study USA?
• Daily, monthly & yearly temperatures vary much more in temperate zones than in the tropics:
• Similar productivity loss in temperate climate?– Heaps of data from USA!
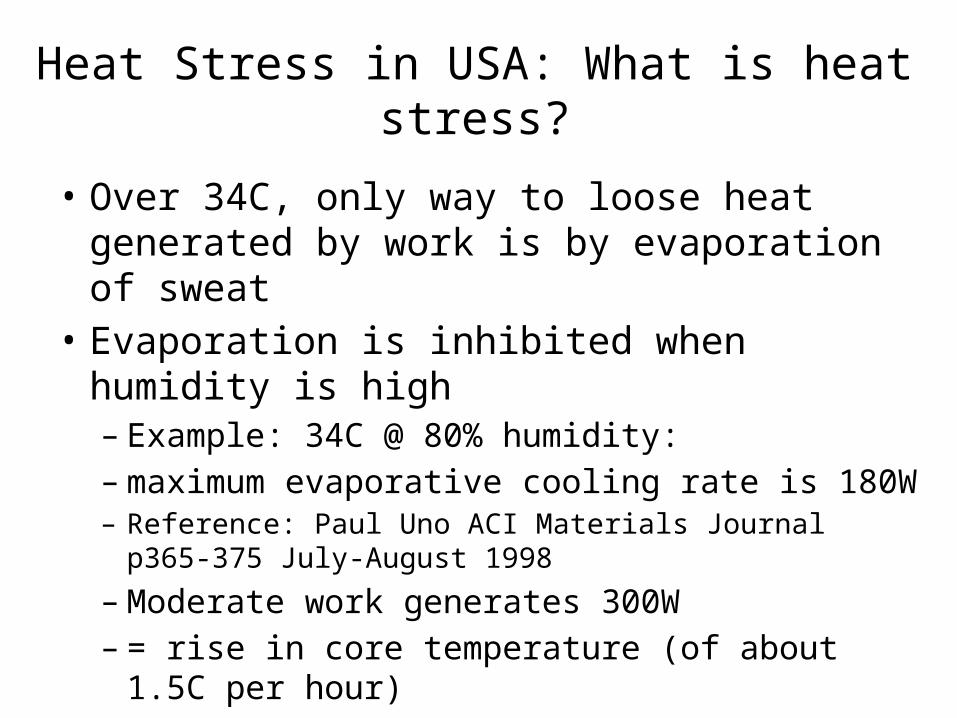
Heat Stress in USA: What is heat stress?
• Over 34C, only way to loose heat generated by work is by evaporation of sweat
• Evaporation is inhibited when humidity is high– Example: 34C @ 80% humidity:– maximum evaporative cooling rate is 180W– Reference: Paul Uno ACI Materials Journal p365-375 July-
August 1998
– Moderate work generates 300W – = rise in core temperature (of about 1.5C per hour)
Measuring heat stress
• To measure heat stress at given work rate: • need temperature, humidity, wind & solar. • Assume minimum clothes worn.
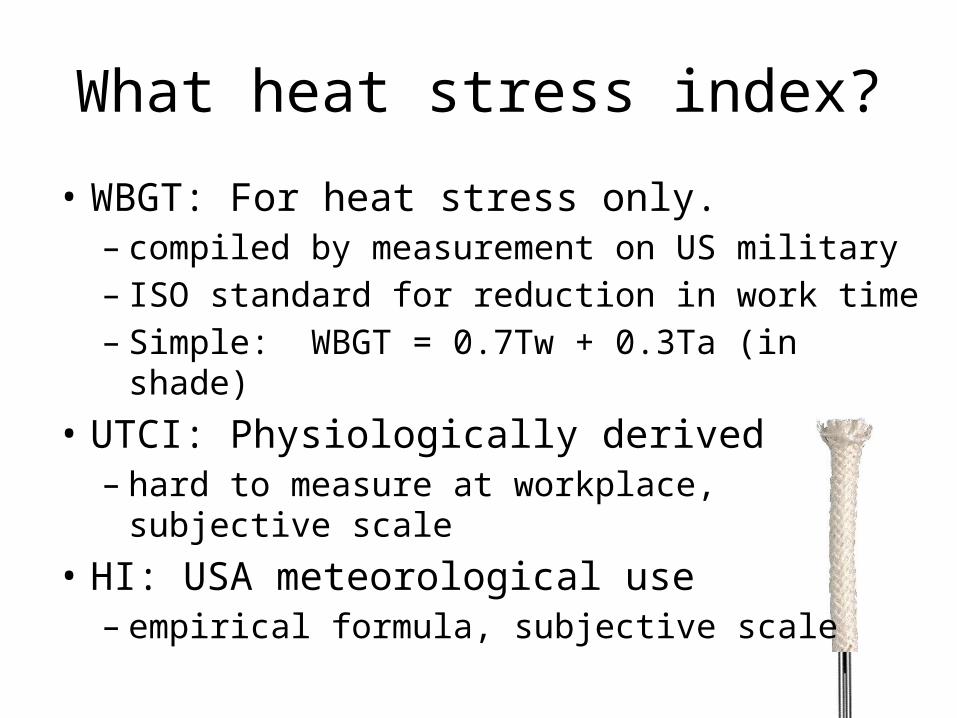
What heat stress index?
• WBGT: For heat stress only.– compiled by measurement on US military– ISO standard for reduction in work time– Simple: WBGT = 0.7Tw + 0.3Ta (in shade)
• UTCI: Physiologically derived– hard to measure at workplace, subjective scale
• HI: USA meteorological use– empirical formula, subjective scale
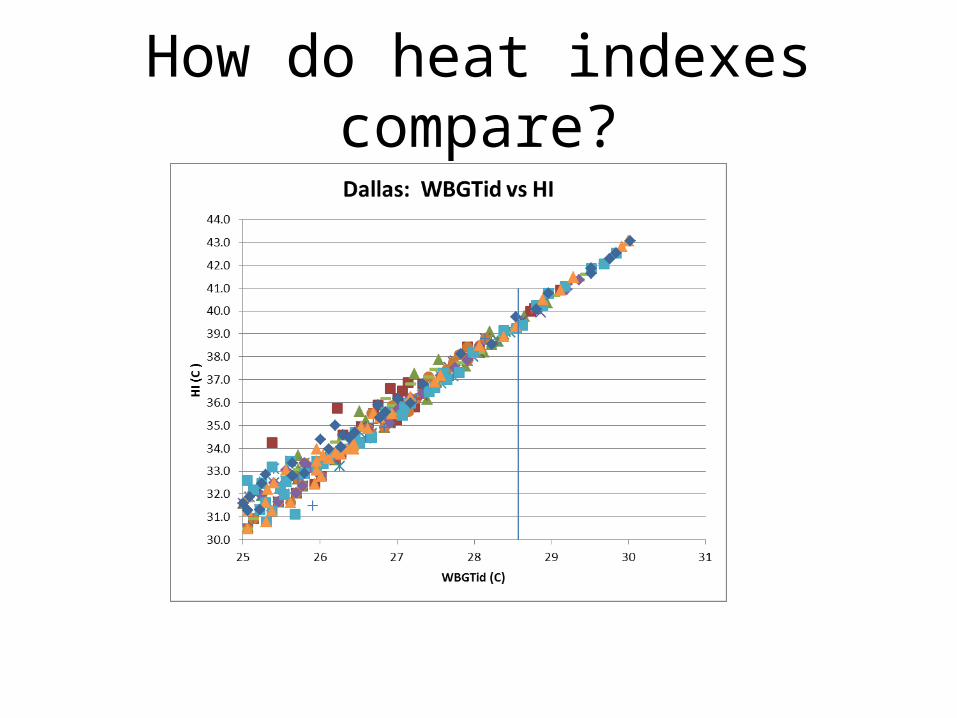
How do heat indexes compare?
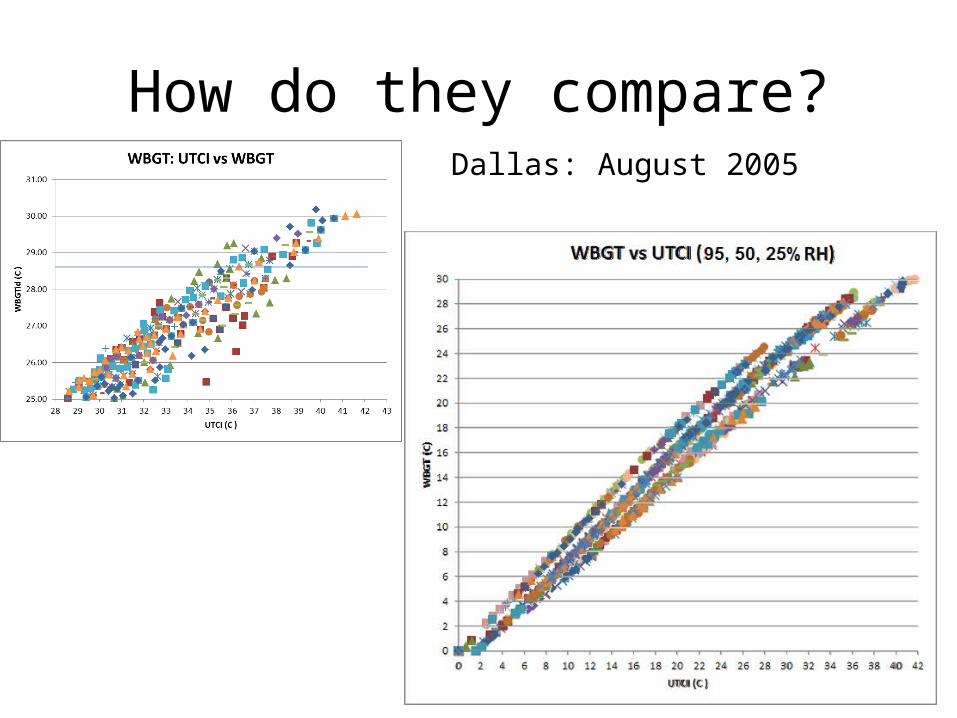
How do they compare?Dallas: August 2005
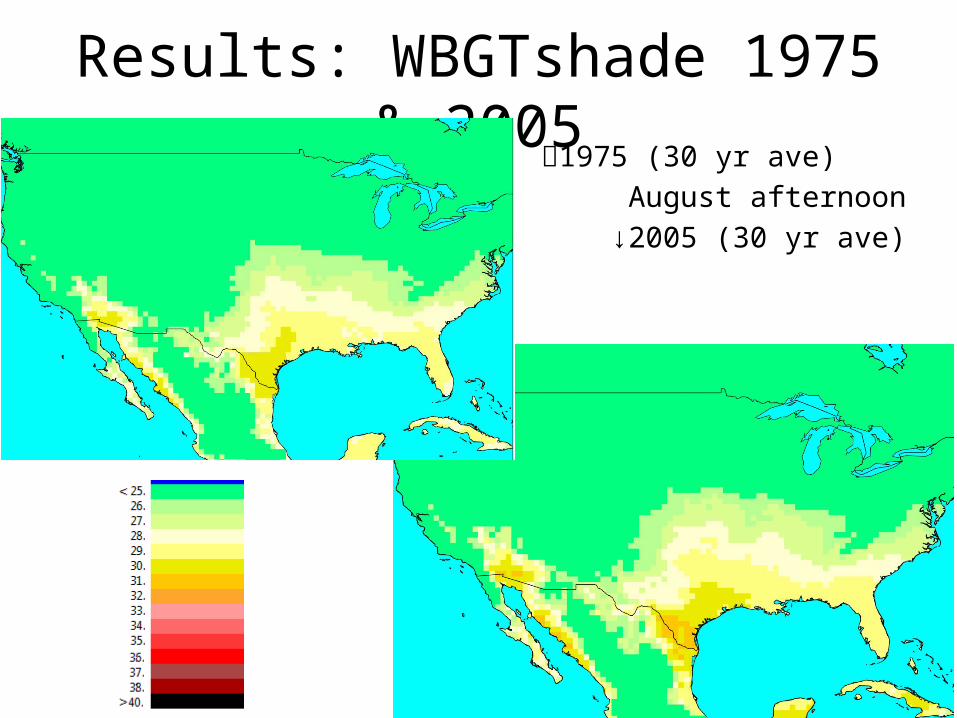
Results: WBGTshade 1975 & 20051975 (30 yr ave) August afternoon ↓2005 (30 yr ave)
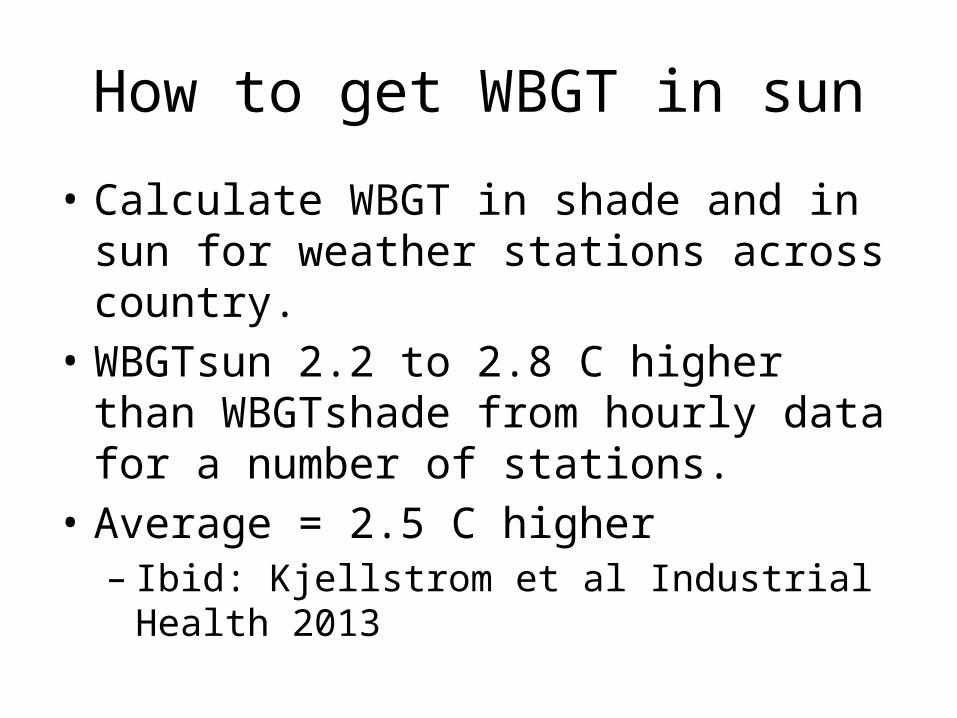
How to get WBGT in sun
• Calculate WBGT in shade and in sun for weather stations across country.
• WBGTsun 2.2 to 2.8 C higher than WBGTshade from hourly data for a number of stations.
• Average = 2.5 C higher– Ibid: Kjellstrom et al Industrial Health 2013
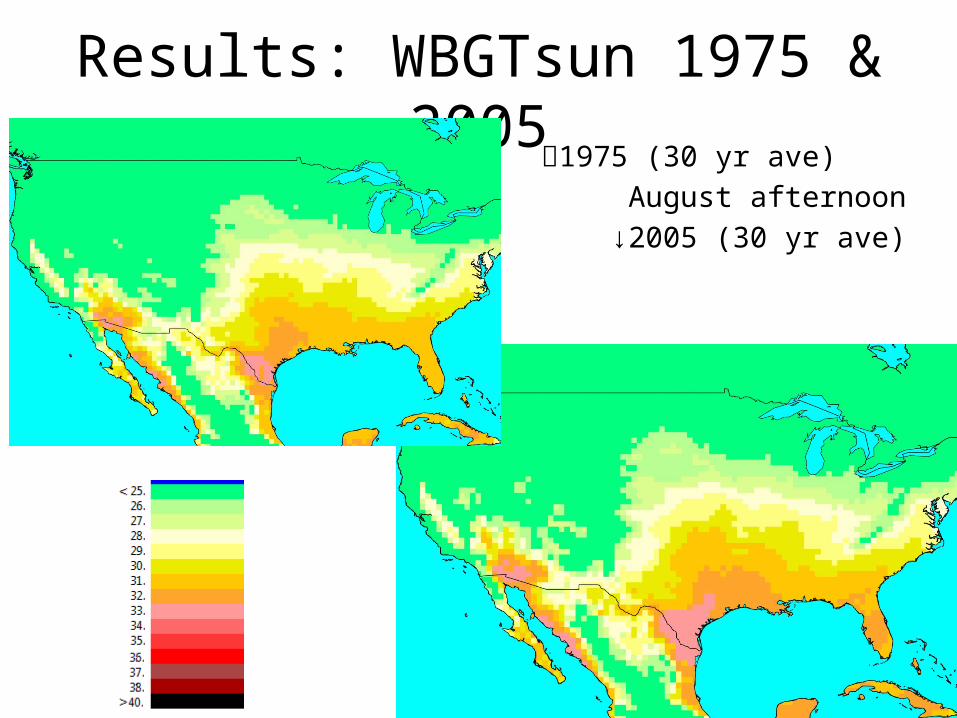
Results: WBGTsun 1975 & 20051975 (30 yr ave) August afternoon ↓2005 (30 yr ave)
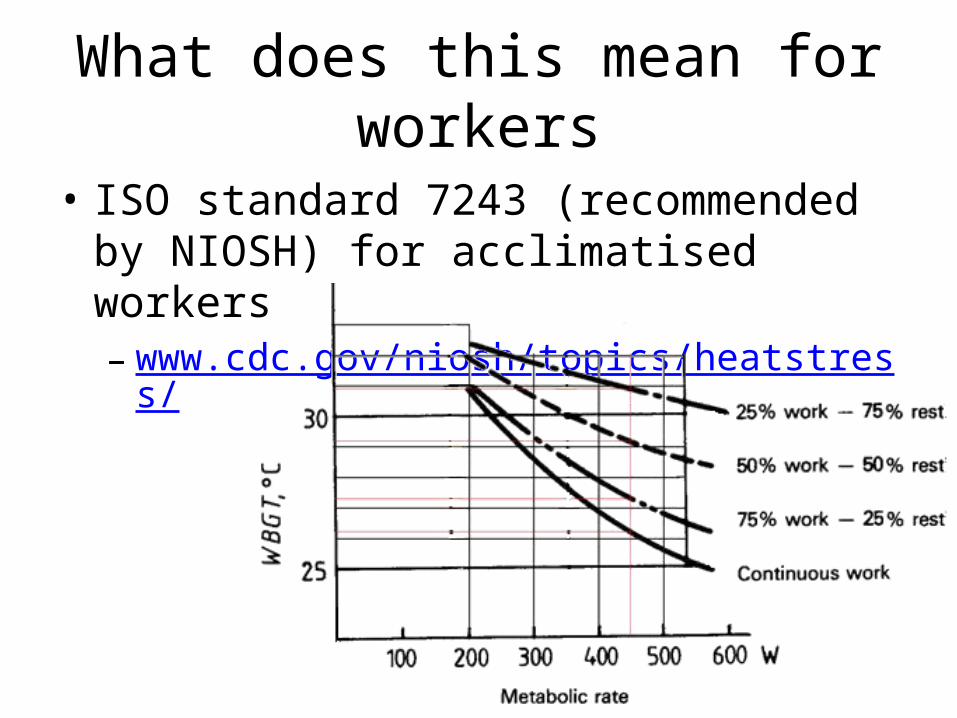
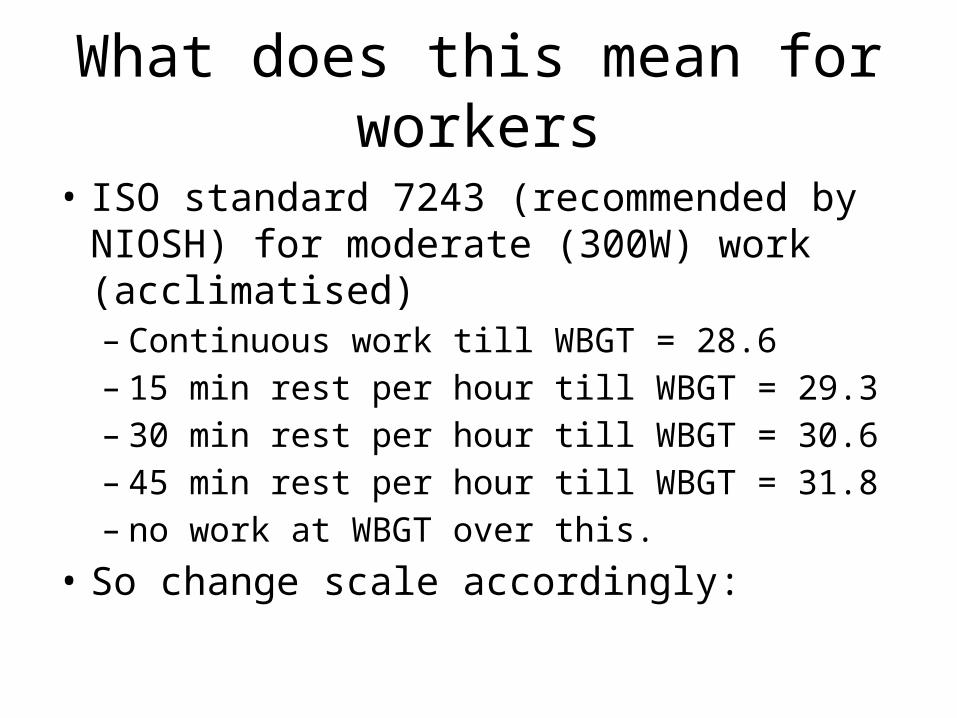
What does this mean for workers
• ISO standard 7243 (recommended by NIOSH) for acclimatised workers– www.cdc.gov/niosh/topics/heatstress/
What does this mean for workers
• ISO standard 7243 (recommended by NIOSH) for moderate (300W) work (acclimatised)– Continuous work till WBGT = 28.6– 15 min rest per hour till WBGT = 29.3 – 30 min rest per hour till WBGT = 30.6– 45 min rest per hour till WBGT = 31.8– no work at WBGT over this.
• So change scale accordingly:
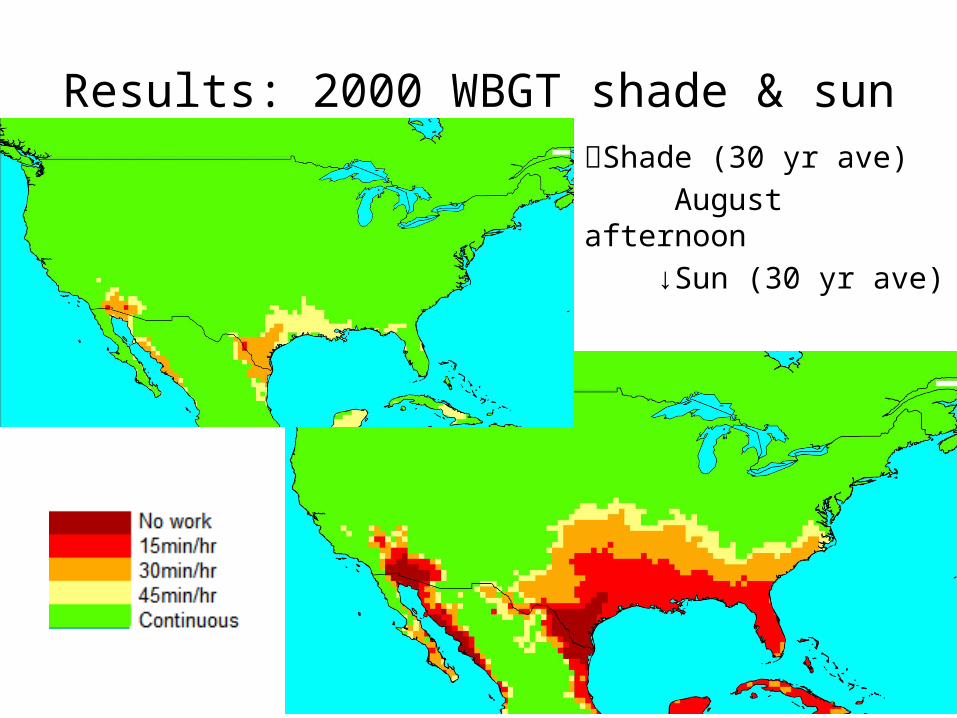
Results: 2000 WBGT shade & sunShade (30 yr ave) August afternoon ↓Sun (30 yr ave)
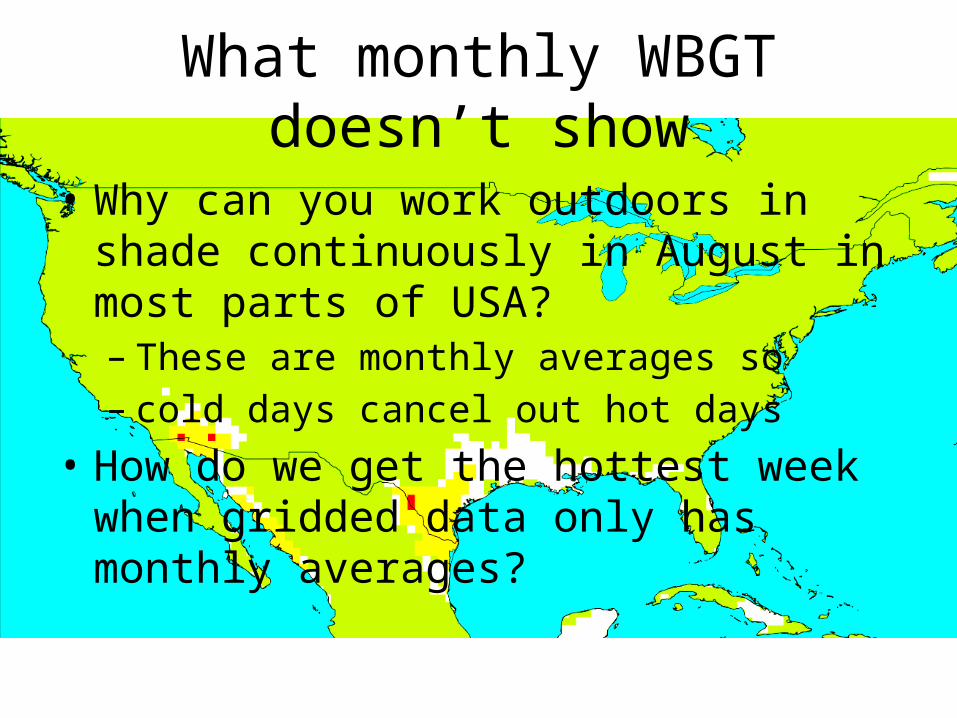
What monthly WBGT doesn’t show
• Why can you work outdoors in shade continuously in August in most parts of USA?– These are monthly averages so– cold days cancel out hot days
• How do we get the hottest week when gridded data only has monthly averages?
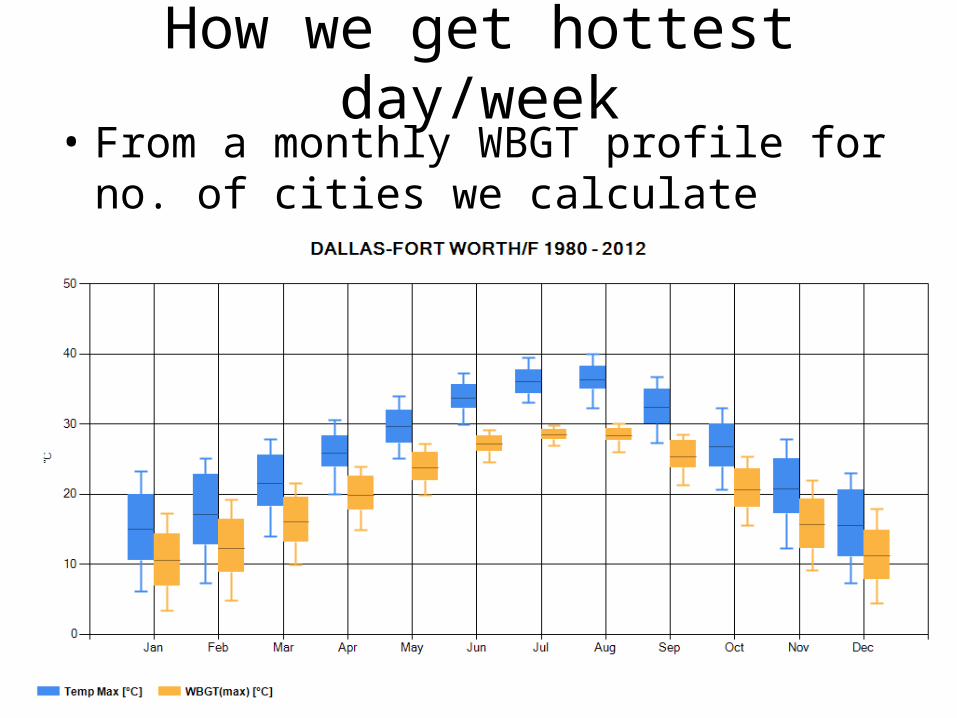
How we get hottest day/week• From a monthly WBGT profile for no. of cities
we calculate WBGT(75%) – WBGT(median).• 75Percentile temperature =hottest week
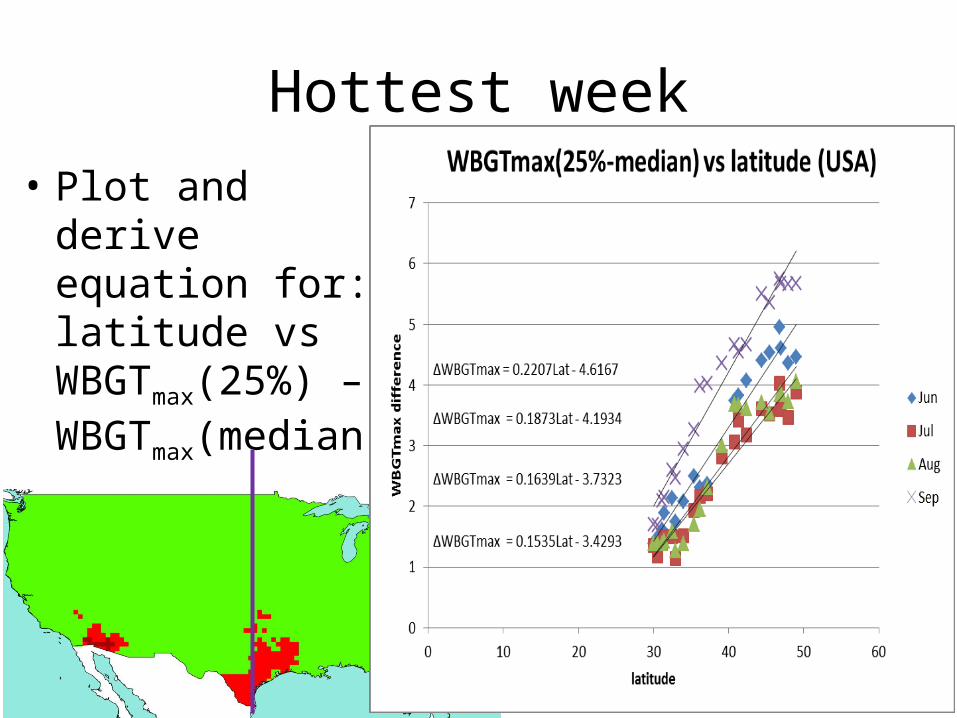
Hottest week• Plot and derive
equation for: latitude vs WBGTmax(25%) – WBGTmax(median)
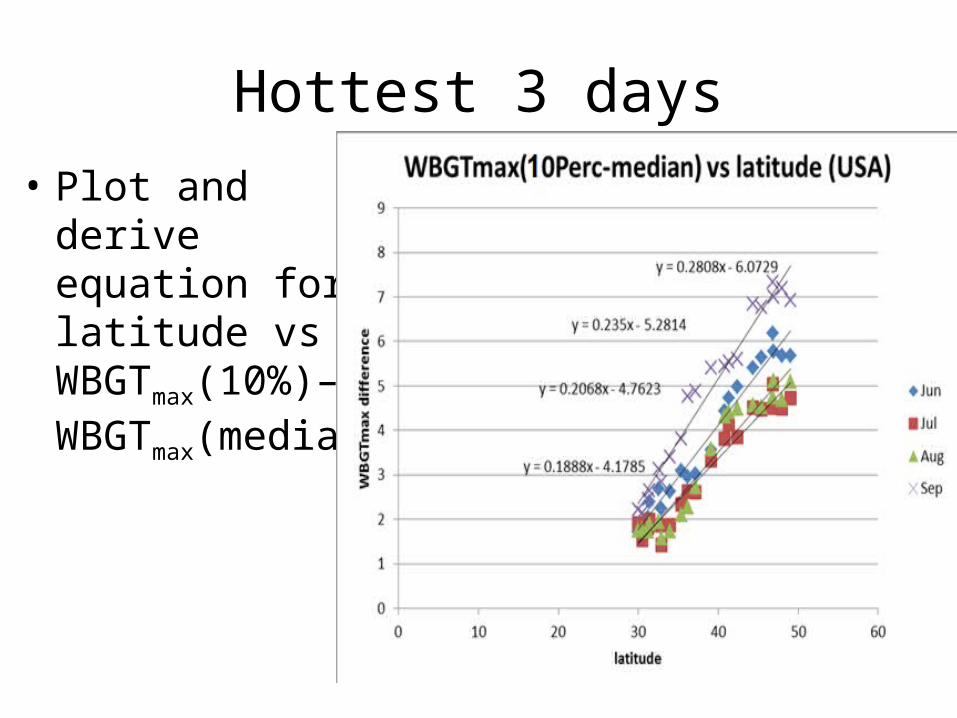
Hottest 3 days• Plot and derive
equation for: latitude vs WBGTmax(10%)– WBGTmax(median)
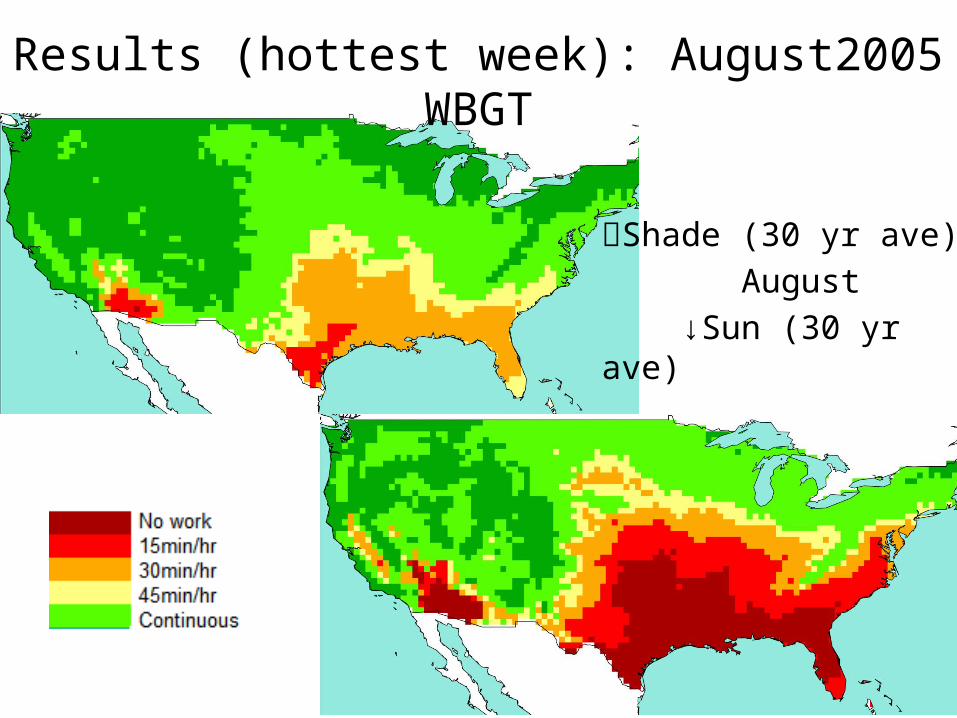
Results (hottest week): August2005 WBGT
Shade (30 yr ave) August ↓Sun (30 yr ave)
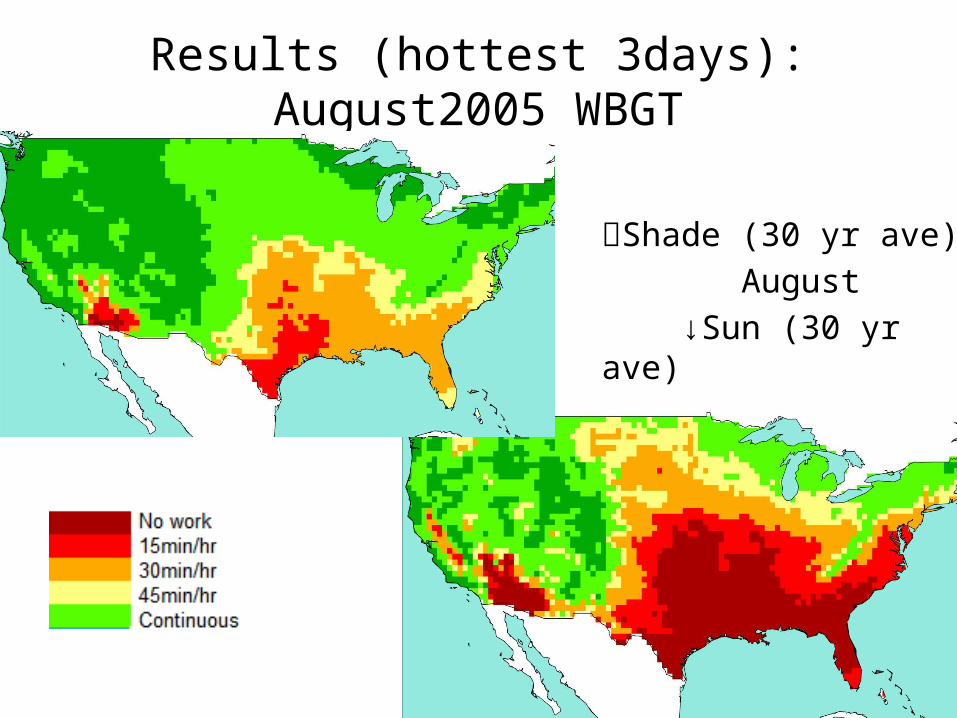
Results (hottest 3days): August2005 WBGT
Shade (30 yr ave) August ↓Sun (30 yr ave)
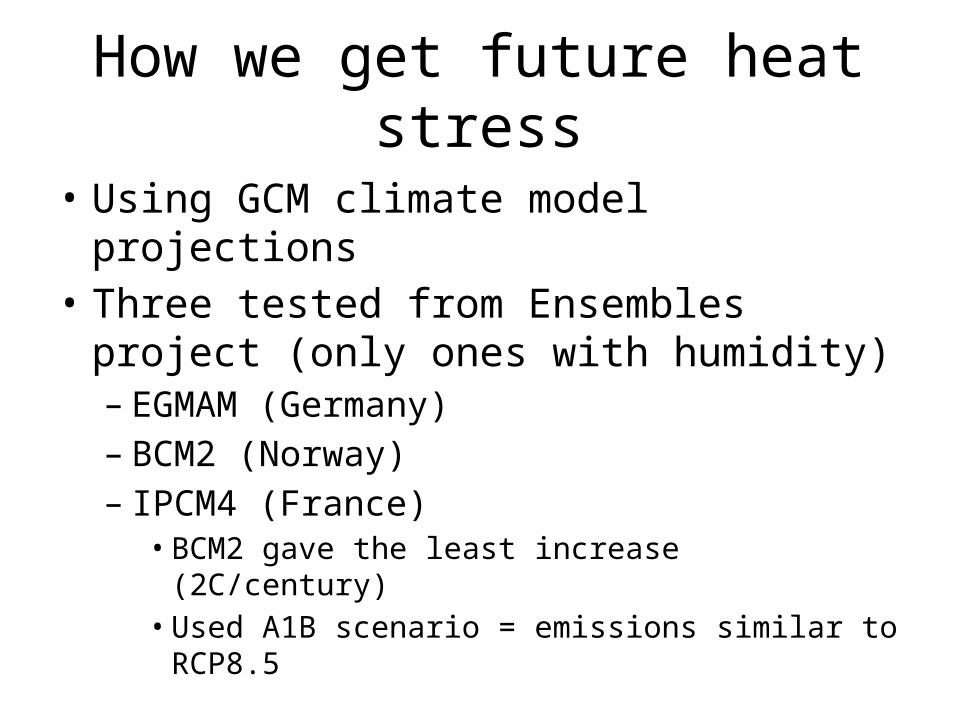
How we get future heat stress
• Using GCM climate model projections• Three tested from Ensembles project (only
ones with humidity)– EGMAM (Germany)– BCM2 (Norway)– IPCM4 (France)• BCM2 gave the least increase (2C/century)• Used A1B scenario = emissions similar to RCP8.5
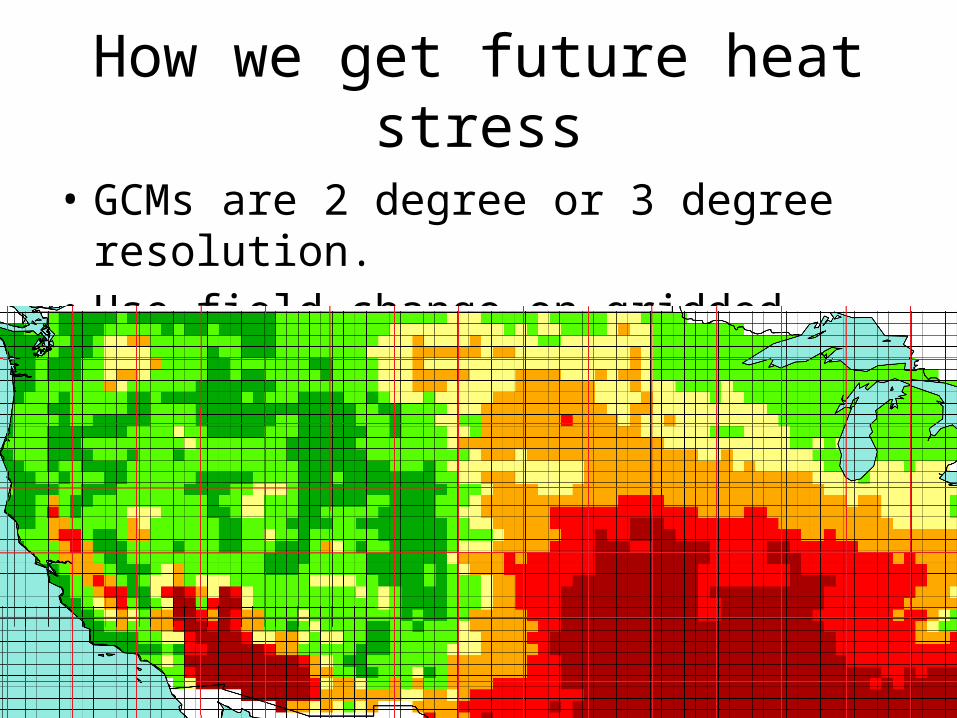
How we get future heat stress
• GCMs are 2 degree or 3 degree resolution.• Use field change on gridded 50kmX50km data.
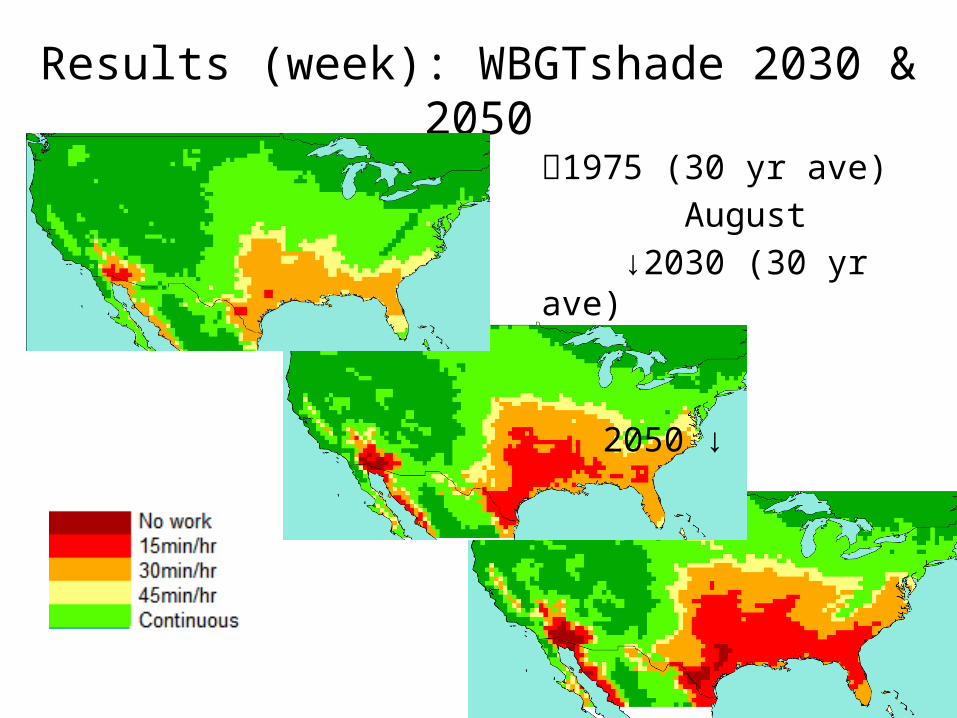
Results (week): WBGTshade 2030 & 20501975 (30 yr ave) August ↓2030 (30 yr ave)
2050 ↓
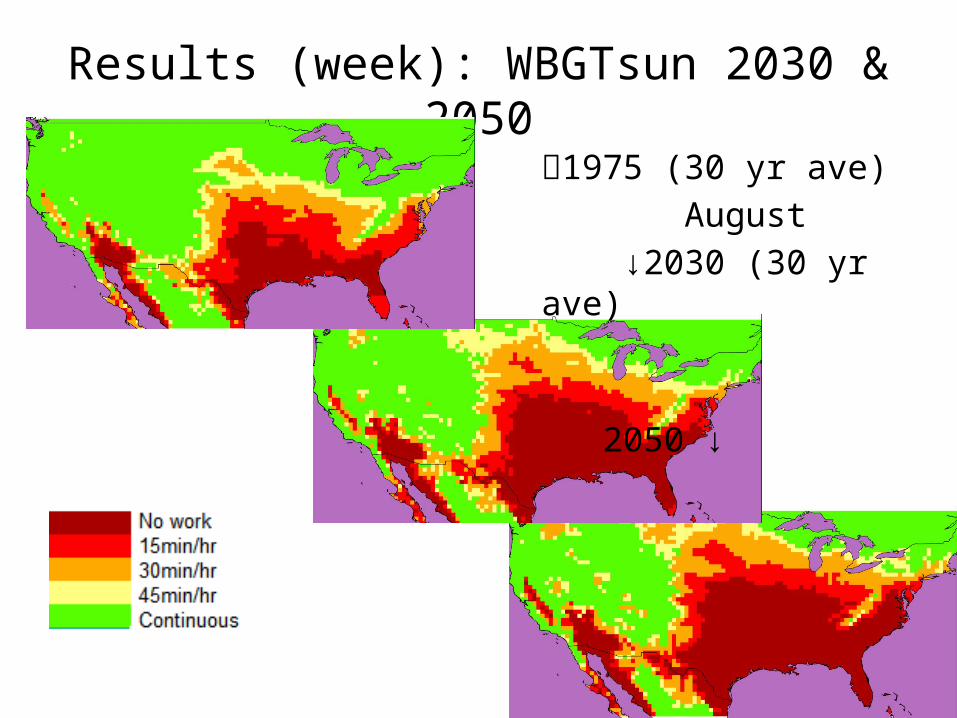
Results (week): WBGTsun 2030 & 20501975 (30 yr ave) August ↓2030 (30 yr ave)
2050 ↓
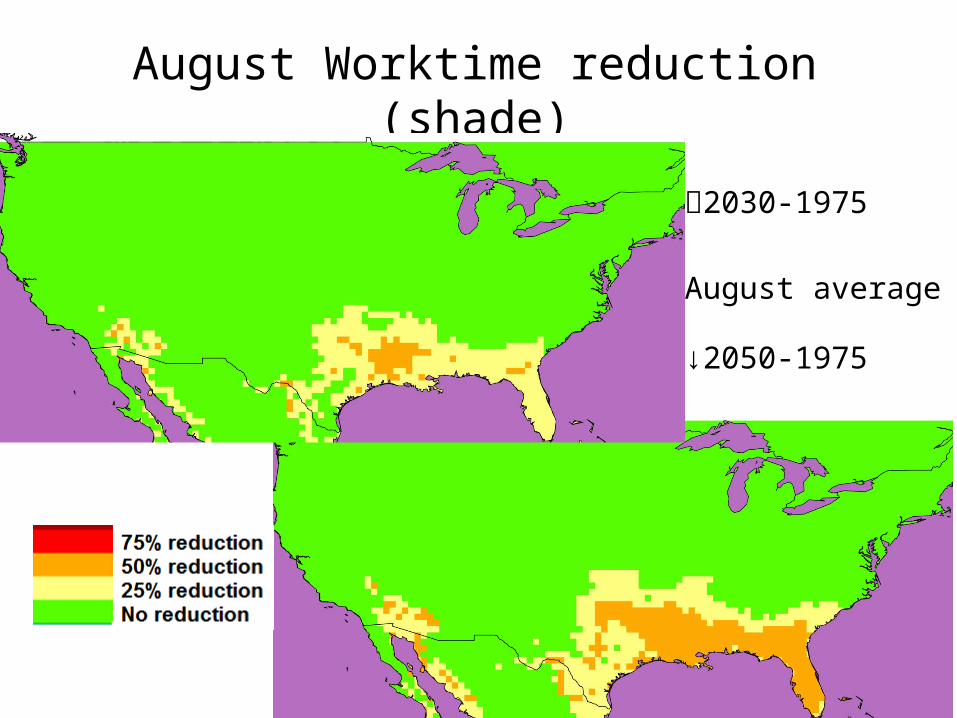
August Worktime reduction (shade)
2030-1975 August average
↓2050-1975
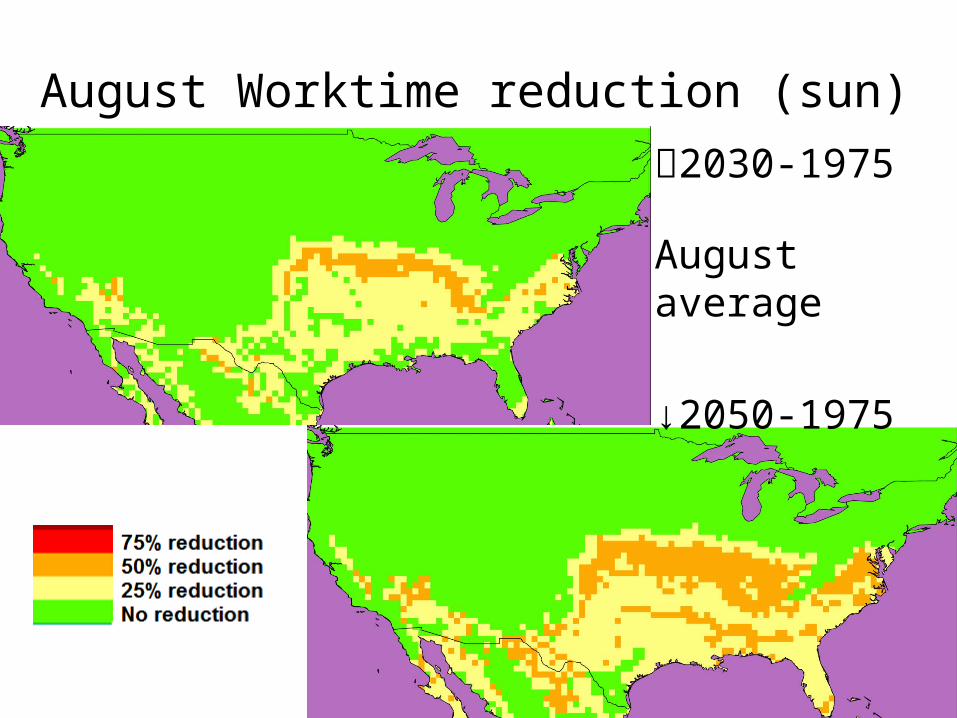
August Worktime reduction (sun)2030-1975
August average
↓2050-1975
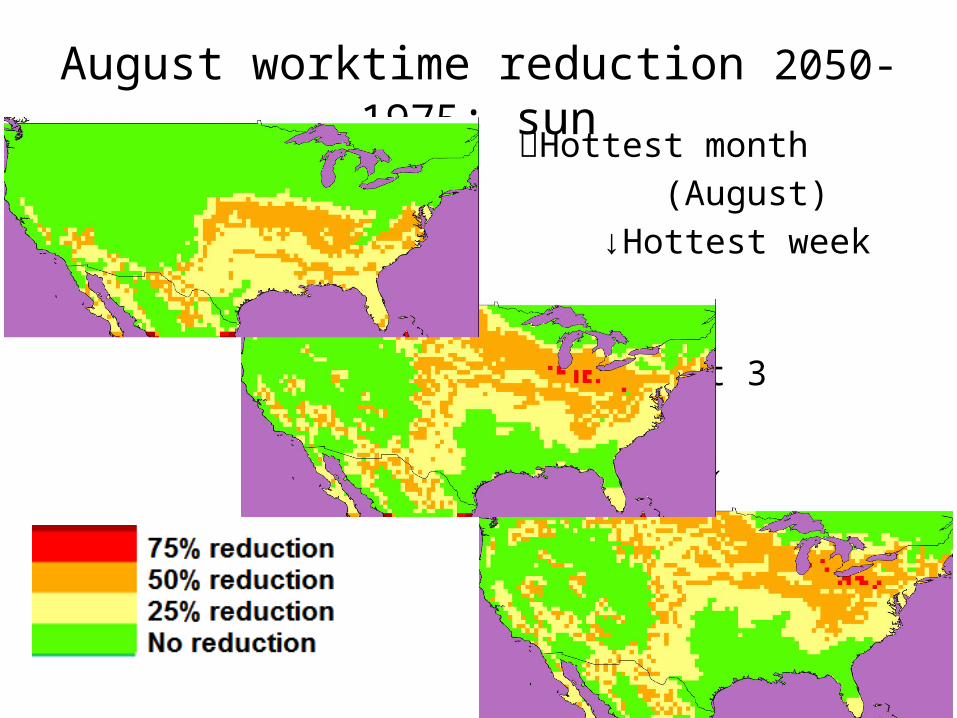
August worktime reduction 2050-1975: sunHottest month (August) ↓Hottest week
Hottest 3 days ↓
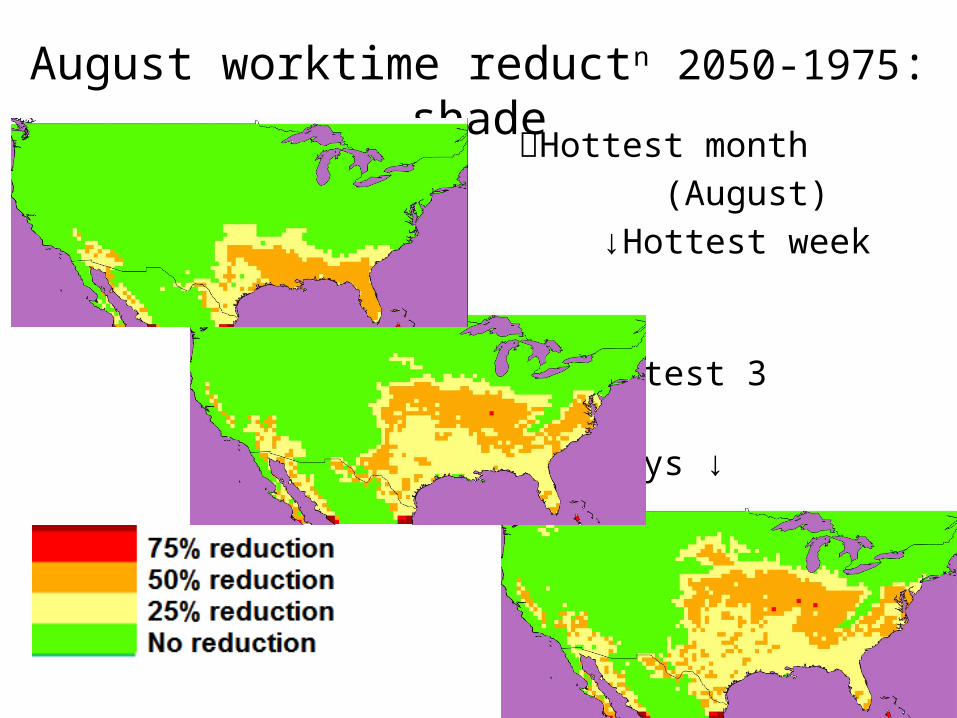
August worktime reductn 2050-1975: shadeHottest month (August) ↓Hottest week
Hottest 3 days ↓
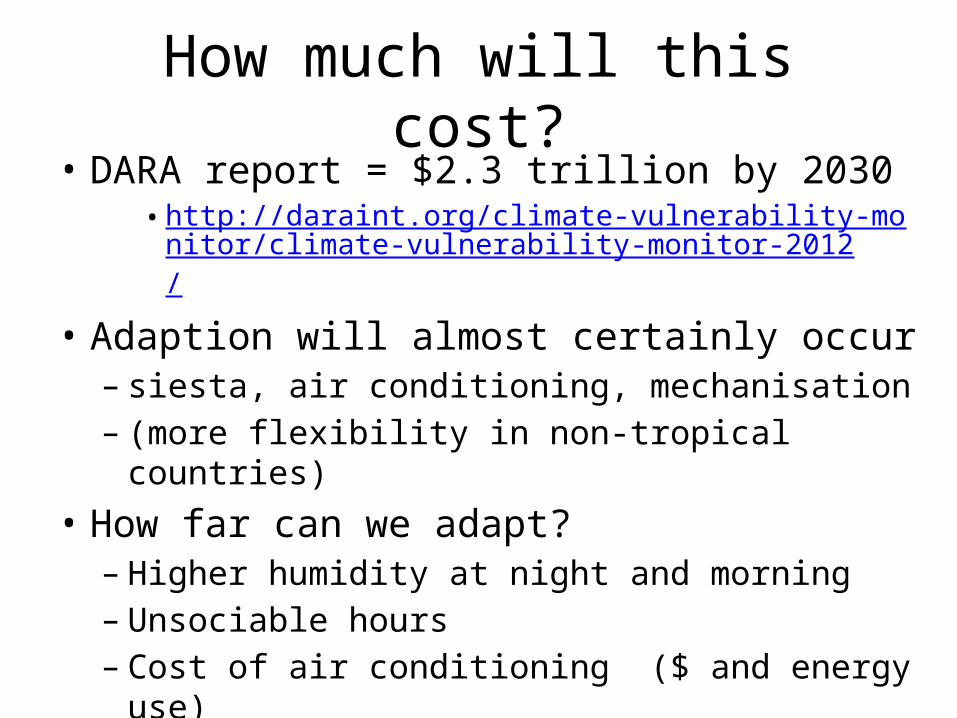
How much will this cost?• DARA report = $2.3 trillion by 2030
• http://daraint.org/climate-vulnerability-monitor/climate-vulnerability-monitor-2012/
• Adaption will almost certainly occur– siesta, air conditioning, mechanisation– (more flexibility in non-tropical countries)
• How far can we adapt?– Higher humidity at night and morning– Unsociable hours– Cost of air conditioning ($ and energy use)
Conclusions
• Method of using grid based monthly average data to estimate the work time loss, works in temperate zone countries as well as tropical countries.
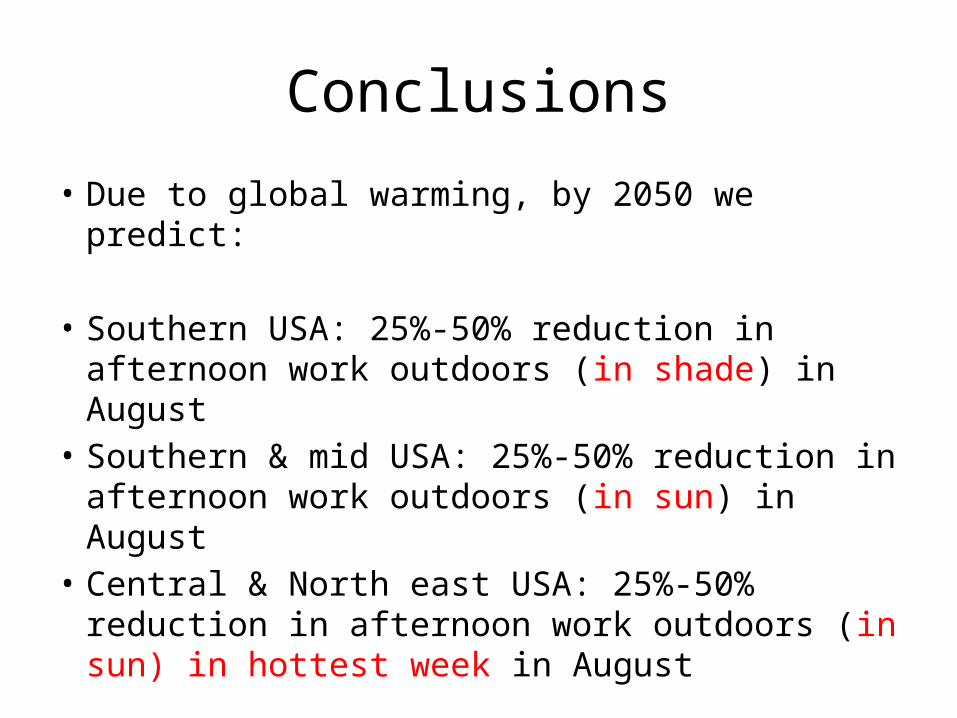
Conclusions
• Due to global warming, by 2050 we predict:
• Southern USA: 25%-50% reduction in afternoon work outdoors (in shade) in August
• Southern & mid USA: 25%-50% reduction in afternoon work outdoors (in sun) in August
• Central & North east USA: 25%-50% reduction in afternoon work outdoors (in sun) in hottest week in August