Embed Size (px)
Citation preview
1
HEAT RELEASE RATEHEAT RELEASE RATE
NATURAL VENTILATIONNATURAL VENTILATION--CONTROLLEDCONTROLLEDROOM FIRESROOM FIRES
Dr Penh LAMUTH (1) and Dr Jean Pierre VANTEDr Penh LAMUTH (1) and Dr Jean Pierre VANTELON (2)LON (2)
(1) Commissariat (1) Commissariat àà ll’’Energie Atomique Energie Atomique -- CEA/DPSN,CEA/DPSN,
1616--18, Route du Panorama, BP 06, 92265 18, Route du Panorama, BP 06, 92265 FontenayFontenay--AuxAux--RosesRoses Cedex, Cedex, FranceFrance
[email protected]@cea.fr 33 (1) 46 54 94 40 33 (1) 46 54 94 40
(2) Laboratoire de Combustion et de D(2) Laboratoire de Combustion et de Déétonique tonique –– CNRS/LCDCNRS/LCD
1, Avenue Cl1, Avenue Cléément Ader, BP 40109 ment Ader, BP 40109 –– 86961 Futuroscope 86961 Futuroscope ChasseneuilChasseneuil Cedex,Cedex,
FranceFrance
GDR GDR IncendieIncendie –– CORIA UME 6614, July 2CORIA UME 6614, July 2 --3, 20093, 2009

2
GDR GDR IncendieIncendie –– CORIA UME 6614, July 2CORIA UME 6614, July 2 --3, 20093, 2009
The study of thermodynamic aggressions of the equipment and structures of the closed rooms needs data concerning HRR
The fire evolution in a room can be affected by:
– Quantity and arrangement of fuel in the fire room
– Oxygen supply
If the ventilation is great enough (sufficiency of oxygen), the fire is said to be fuel-controlled
However, if the ventilation is small, relative to the size of the fire, there is not enough oxygen to combust all the pyrolysis fuel, the fire is said to be ventilation-controlled. The associated HRR depends mainly on the amount of available oxygen (ventilation condition).
3
GDR GDR IncendieIncendie –– CORIA UME 6614, July 2CORIA UME 6614, July 2 --3, 20093, 2009
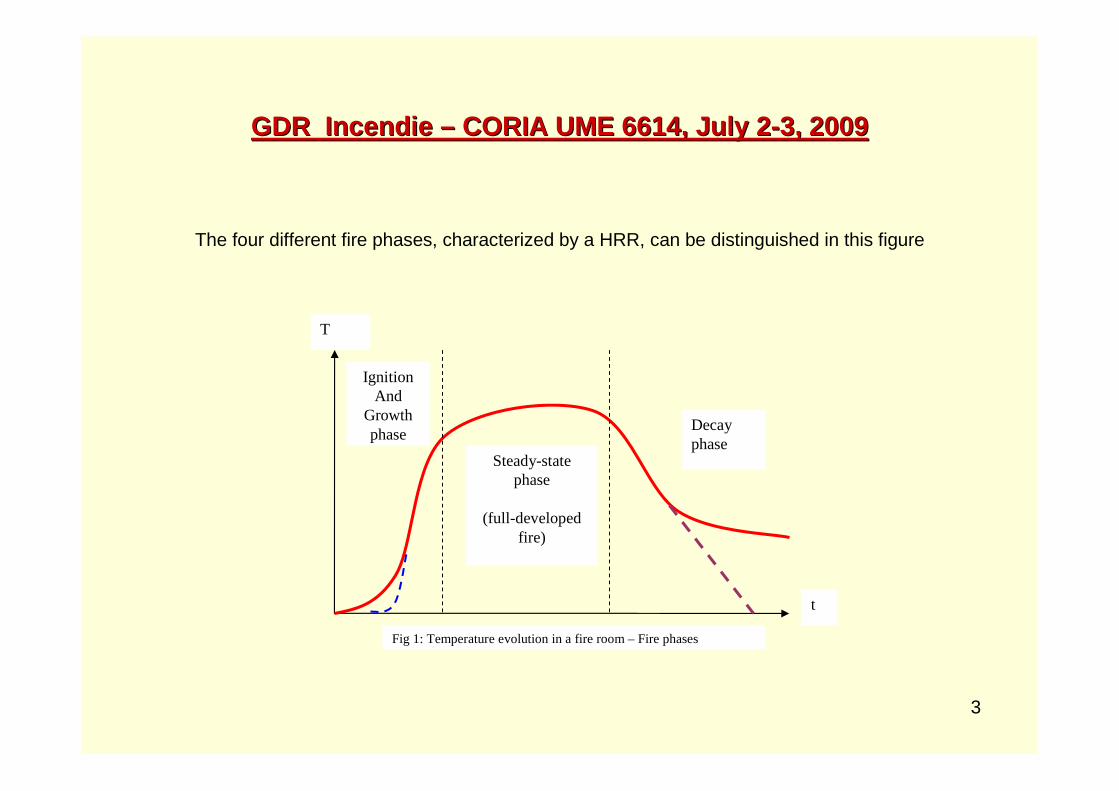
The four different fire phases, characterized by a HRR, can be distinguished in this figure
IgnitionAnd
Growth phase
Steady-state phase
(full-developed fire)
Decay phase
T
t
Fig 1: Temperature evolution in a fire room – Fire phases
4
GDR GDR IncendieIncendie –– CORIA UME 6614, July 2CORIA UME 6614, July 2 --3, 20093, 2009
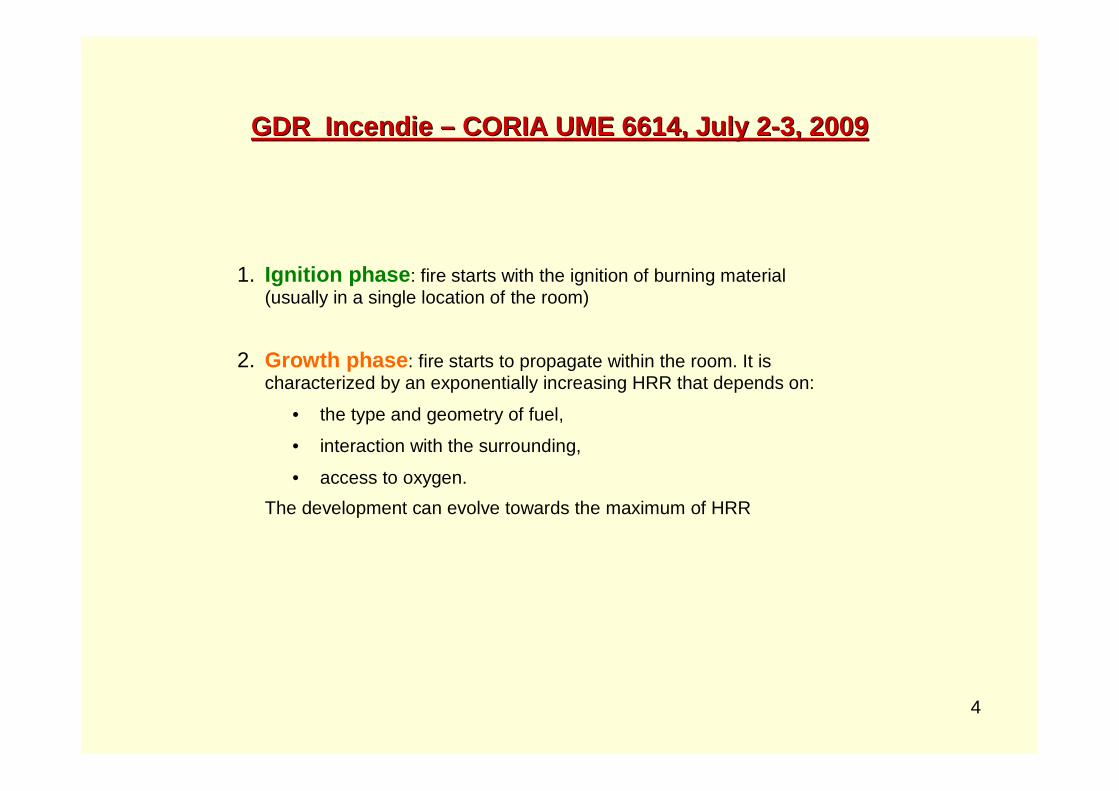
1. Ignition phase: fire starts with the ignition of burning material (usually in a single location of the room)
2. Growth phase: fire starts to propagate within the room. It is characterized by an exponentially increasing HRR that depends on:
• the type and geometry of fuel,
• interaction with the surrounding,
• access to oxygen.
The development can evolve towards the maximum of HRR

5
GDR GDR IncendieIncendie –– CORIA UME 6614, July 2CORIA UME 6614, July 2 --3, 20093, 2009
3. Fully developed phase: the HRR is relatively unchanging and leading to small variations in temperature.
The situation can evolve toward one of the following situation:
• Fuel-controlled situation:
� Spread of the fire to the whole room (flashover phenomenon): the gas temperature, became so elevated, can cause the sudden ignition of “every object” and unburnt gas in the room
� No spread of the fire to the whole room: if the propagation is slow, the gas temperature rise is not sufficient to cause flashover, fire can find no combustible material in its closed vicinity. The fire remains localized and, with time, dies out.
The HRR is related to the pyrolysis rate by equation:
( ) ( ) ( )tm.tHtQ eff,c&& ∆= with ( ) ( ) net,ceff,c H.ttH ∆ξ=∆
• Ventilation-controlled situation: If:
� air is not allowed to enter the room: the fire dies out
� air is not sufficiently allowed to enter the room: the fire development is limited,
� air is sufficiently allowed to enter the room by creating a new opening: the rapid flame can occur such as a backdraft and smoke explosion.

6
GDR GDR IncendieIncendie –– CORIA UME 6614, July 2CORIA UME 6614, July 2 --3, 20093, 2009
4. Decay phase This phase is characterized by a continuous deceleration in HRR. In this period the fire may go to:
• a ventilation-controlled situation
• a fuel-controlled situation
7
GDR GDR IncendieIncendie –– CORIA UME 6614, July 2CORIA UME 6614, July 2 --3, 20093, 2009
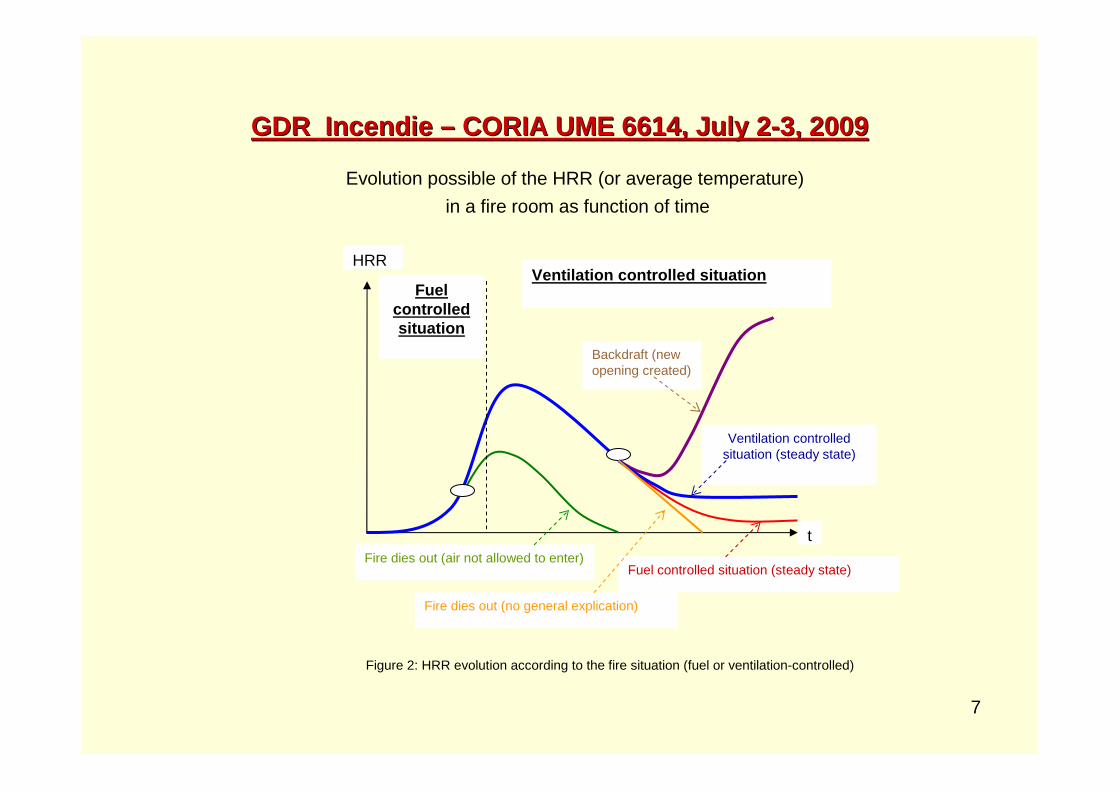
Figure 2: HRR evolution according to the fire situation (fuel or ventilation-controlled)
Evolution possible of the HRR (or average temperature)
in a fire room as function of time
Fire dies out (air not allowed to enter)Fuel controlled situation (steady state)
Fuel controlled situation
Ventilation controlled situation
Backdraft (new opening created)
Ventilation controlled situation (steady state)
HRR
t
Fire dies out (no general explication)
8
GDR GDR IncendieIncendie –– CORIA UME 6614, July 2CORIA UME 6614, July 2 --3, 20093, 2009
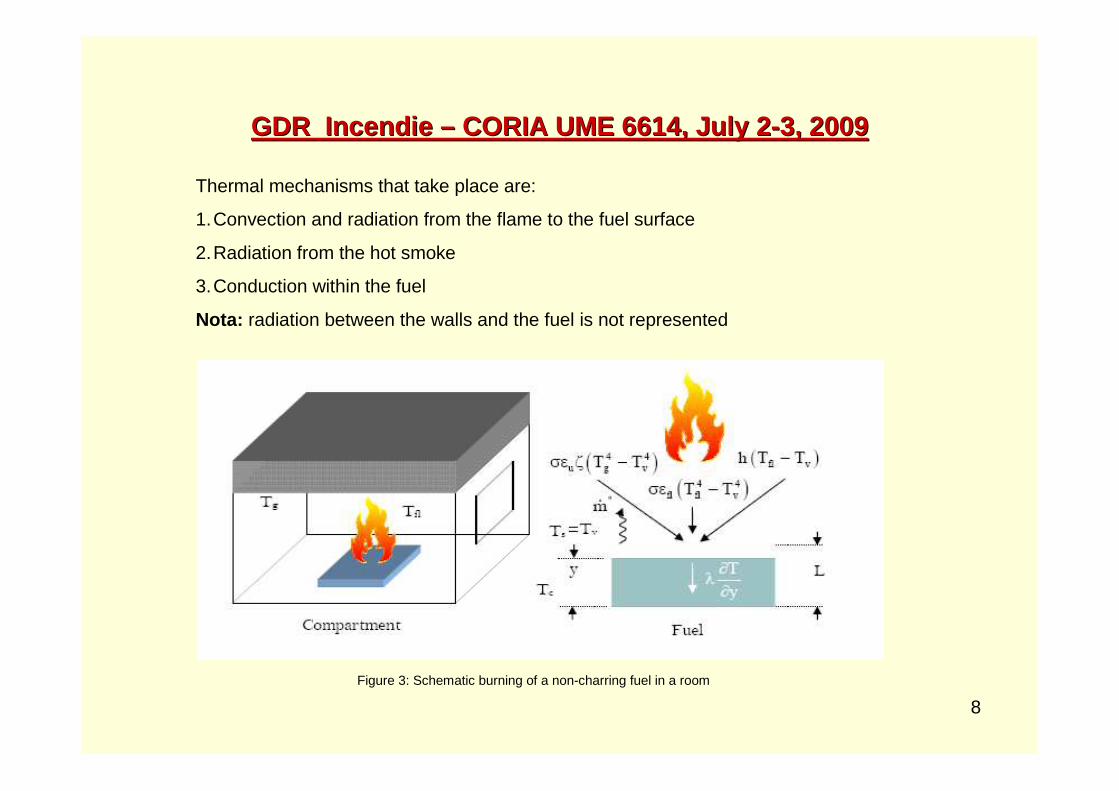
Figure 3: Schematic burning of a non-charring fuel in a room
Thermal mechanisms that take place are:
1.Convection and radiation from the flame to the fuel surface
2.Radiation from the hot smoke
3.Conduction within the fuel
Nota: radiation between the walls and the fuel is not represented

9
GDR GDR IncendieIncendie –– CORIA UME 6614, July 2CORIA UME 6614, July 2 --3, 20093, 2009
t
Free burning
Room burning
m&
Figure 4: Room effect on mass loss rate
Experimental results from free burning can’t be used
to estimate the room burning rate
freeroom mm && ≠
10
GDR GDR IncendieIncendie –– CORIA UME 6614, July 2CORIA UME 6614, July 2 --3, 20093, 2009
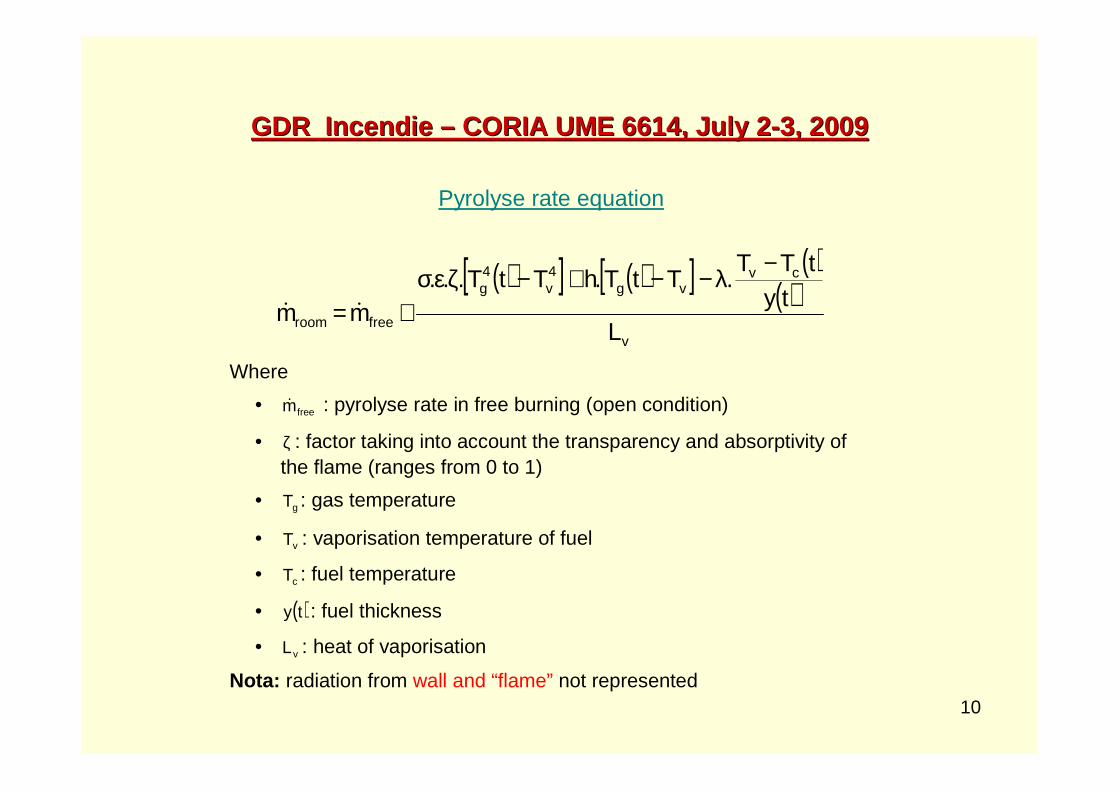
Pyrolyse rate equation
( )[ ] ( )[ ] ( )( )
v
cvvg
4v
4g
freeroom Lty
tTT.TtT.hTtT...
mm
−λ−−+−ζεσ
+= &&
Where
• freem& : pyrolyse rate in free burning (open condition)
• ζ : factor taking into account the transparency and absorptivity of the flame (ranges from 0 to 1)
• gT : gas temperature
• vT : vaporisation temperature of fuel
• cT : fuel temperature
• ( )ty : fuel thickness
• vL : heat of vaporisation
Nota: radiation from wall and “flame” not represented

11
GDR GDR IncendieIncendie –– CORIA UME 6614, July 2CORIA UME 6614, July 2 --3, 20093, 2009
Factors Influencing HRR of fire in a room 1. Fuel
• Size and location of the ignition source
• Fuel package (type, amount, position …)
2. Room • Geometry
• Ventilation condition (openings, forced ventilation …)
• Material properties of partitions (thermal inertia, diffusivity)
Conclusion: In room fire situation, it is NOT POSSIBLE to derive a general theory to predict exactly the HRR
burning rate pyrolyse rate
m& gT Vicious circle:
≠
12
A theoretical model to predict the maximum HRR is developed
to be used, in the field of engineering,
to determine the thermodynamic aggressions
reasonably conservative
GDR GDR IncendieIncendie –– CORIA UME 6614, July 2CORIA UME 6614, July 2 --3, 20093, 2009
13
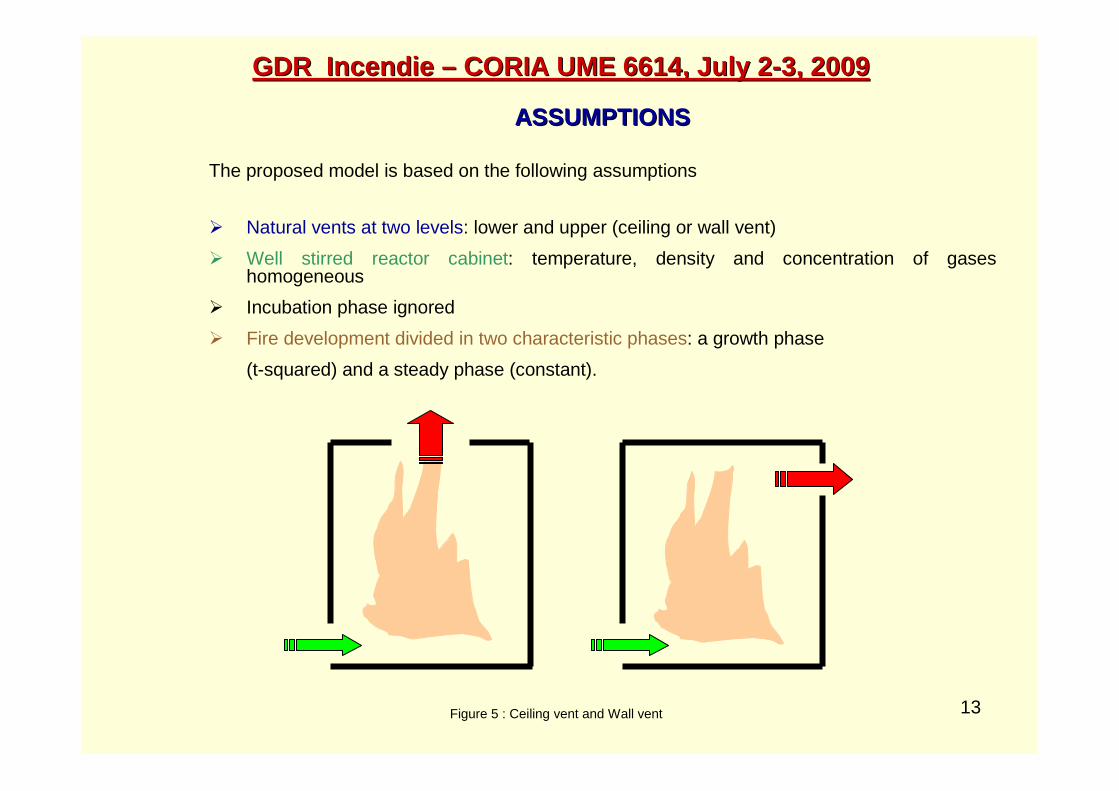
ASSUMPTIONSASSUMPTIONS
The proposed model is based on the following assumptions
� Natural vents at two levels: lower and upper (ceiling or wall vent)
� Well stirred reactor cabinet: temperature, density and concentration of gases homogeneous
� Incubation phase ignored
� Fire development divided in two characteristic phases: a growth phase
(t-squared) and a steady phase (constant).
Figure 5 : Ceiling vent and Wall vent
GDR GDR IncendieIncendie –– CORIA UME 6614, July 2CORIA UME 6614, July 2 --3, 20093, 2009

14
The first relation of (1), t-squared approximation, represents the pre-flashover phase and the second, constant, the post-flashover.
tpeak t
Pre flash over model
Post flash over model
HRR
( )testsQ&
Figure 6: Theoretical and experimental variations of the HRR
( )
>
≤α=
peakmax
peak2
ttifQ
ttifttQ
&
&Eq. (1)
peakQ&
maxQ&
GDR GDR IncendieIncendie –– CORIA UME 6614, July 2CORIA UME 6614, July 2 --3, 20093, 2009
Theoretical model oh HRR
15
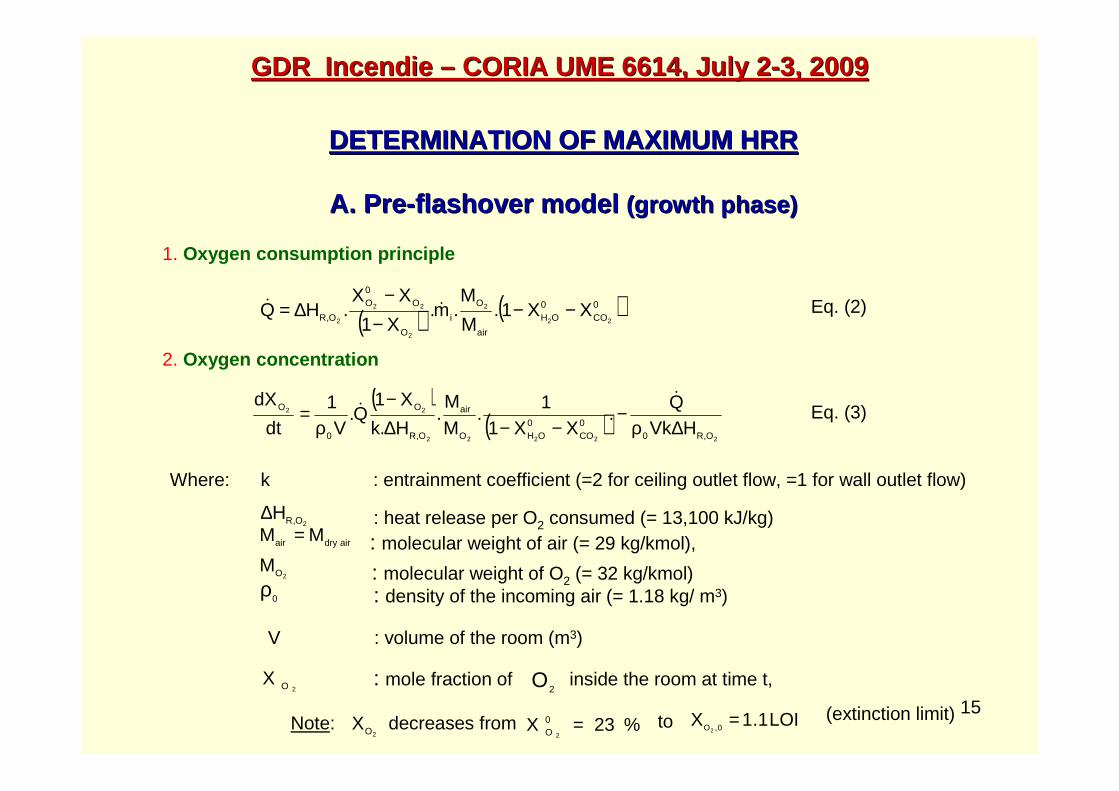
Where: k : entrainment coefficient (=2 for ceiling outlet flow, =1 for wall outlet flow)
2O,RH∆airdryair MM =
2OM
0ρ
( ) ( )0CO
0OH
air
O
i
O
O0O
O,R 22
2
2
22
2XX1.
M
M.m.
X1
XX.HQ −−
−−
∆= && Eq. (2)
2. Oxygen concentration
( )( )
22222
22
O,R00CO
0OHO
air
O,R
O
0
O
HVkQ
.XX1
1.
MM
.H.k
X1Q.
V1
dt
dX
∆ρ−
−−∆−
ρ=
&& Eq. (3)
2OX
LOI1.1X 0,O2=to%23X 0
O 2=decreases from
2OXNote: (extinction limit)
: heat release per O2 consumed (= 13,100 kJ/kg): molecular weight of air (= 29 kg/kmol),
: molecular weight of O2 (= 32 kg/kmol): density of the incoming air (= 1.18 kg/ m3)
V : volume of the room (m3)
: mole fraction of2O inside the room at time t,
DETERMINATION OF MAXIMUM HRRDETERMINATION OF MAXIMUM HRR
A. PreA. Pre--flashover model flashover model (growth phase)(growth phase)
1. Oxygen consumption principle
GDR GDR IncendieIncendie –– CORIA UME 6614, July 2CORIA UME 6614, July 2 --3, 20093, 2009
16
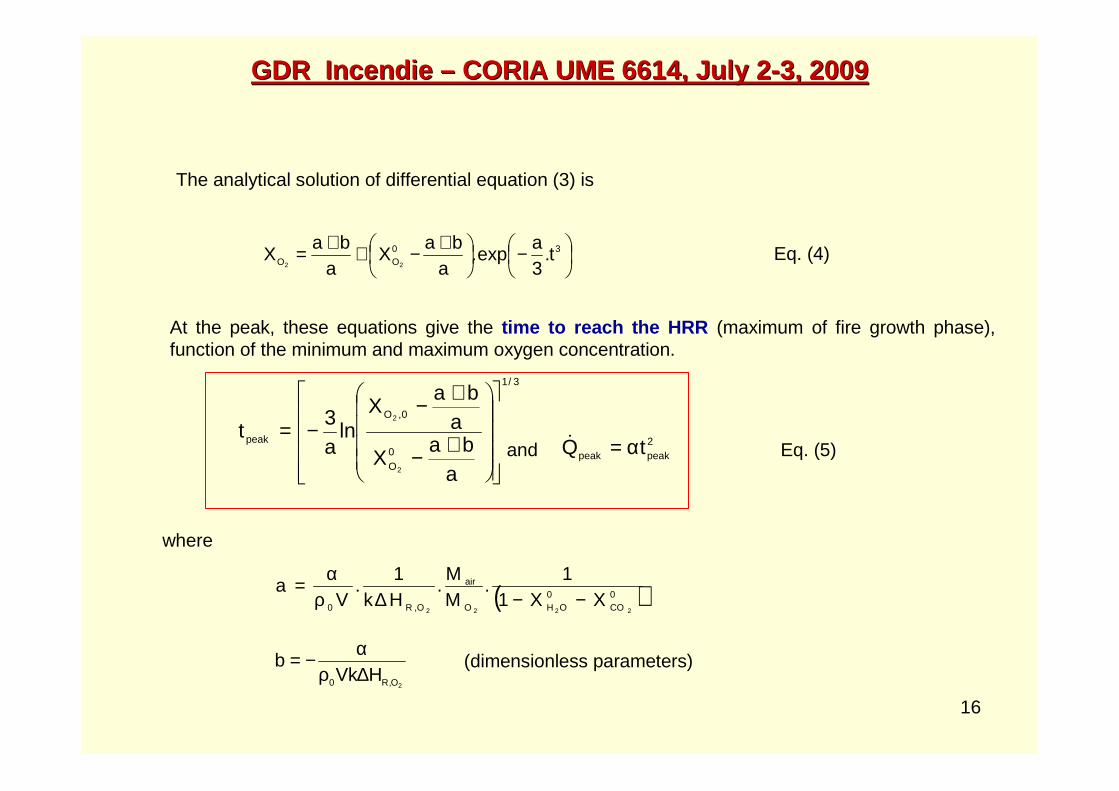
The analytical solution of differential equation (3) is
−
+−++= 30OO t.
3a
exp.a
baX
aba
X22
Eq. (4)
At the peak, these equations give the time to reach the HRR (maximum of fire growth phase), function of the minimum and maximum oxygen concentration.
3/1
0O
0,O
peak
aba
X
aba
Xln
a3
t
2
2
+−
+−−=
and 2peakpeak tQ α=& Eq. (5)
where
( )0CO
0OHO
air
O,R0 2222XX1
1.
MM
.Hk1
.V
a−−∆ρ
α=
2O,R0 HVkb
∆ρα−=
GDR GDR IncendieIncendie –– CORIA UME 6614, July 2CORIA UME 6614, July 2 --3, 20093, 2009
(dimensionless parameters)
17
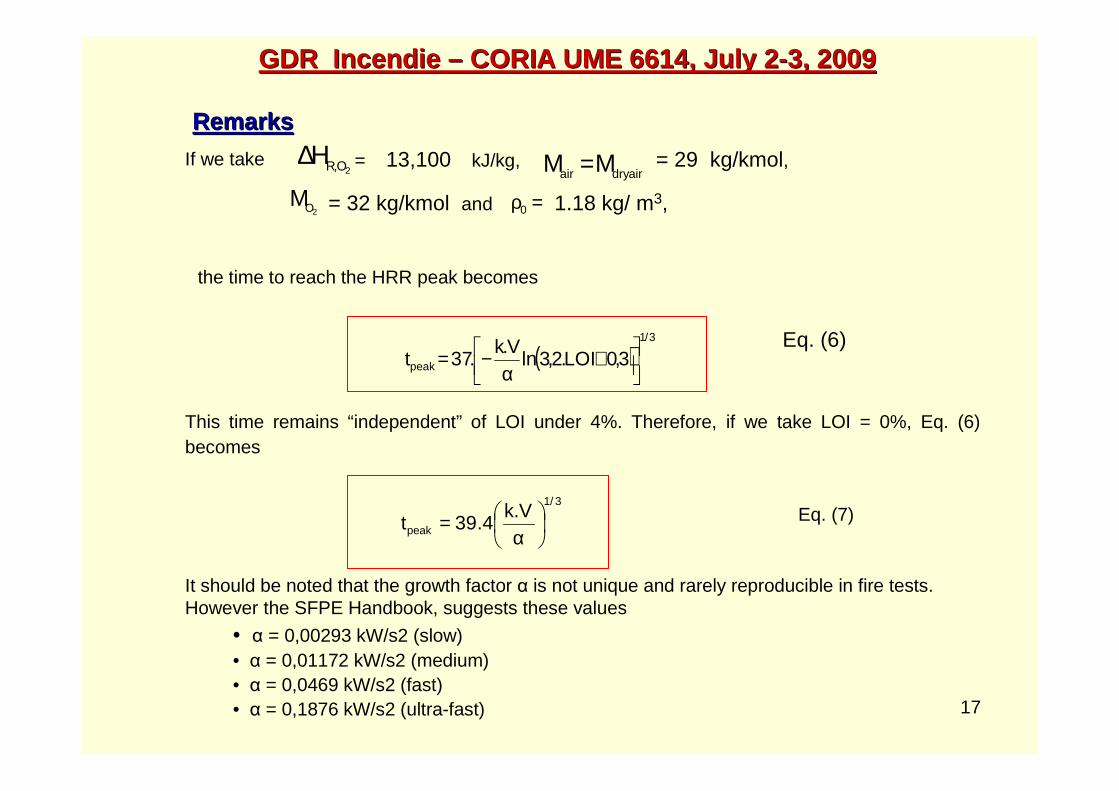
RemarksRemarks
It should be noted that the growth factor α is not unique and rarely reproducible in fire tests. However the SFPE Handbook, suggests these values
• α = 0,00293 kW/s2 (slow)• α = 0,01172 kW/s2 (medium)• α = 0,0469 kW/s2 (fast)• α = 0,1876 kW/s2 (ultra-fast)
GDR GDR IncendieIncendie –– CORIA UME 6614, July 2CORIA UME 6614, July 2 --3, 20093, 2009
2O,RH∆airdryair MM =If we take = 13,100 kJ/kg, = 29 kg/kmol,
2OM =ρ0= 32 kg/kmol and
the time to reach the HRR peak becomes
( )3/1
peak 3,0LOI.2,3lnV.k
.37t
+α
−=Eq. (6)
This time remains “independent” of LOI under 4%. Therefore, if we take LOI = 0%, Eq. (6) becomes
3/1
peak
V.k4.39t
α= Eq. (7)
1.18 kg/ m3,
18
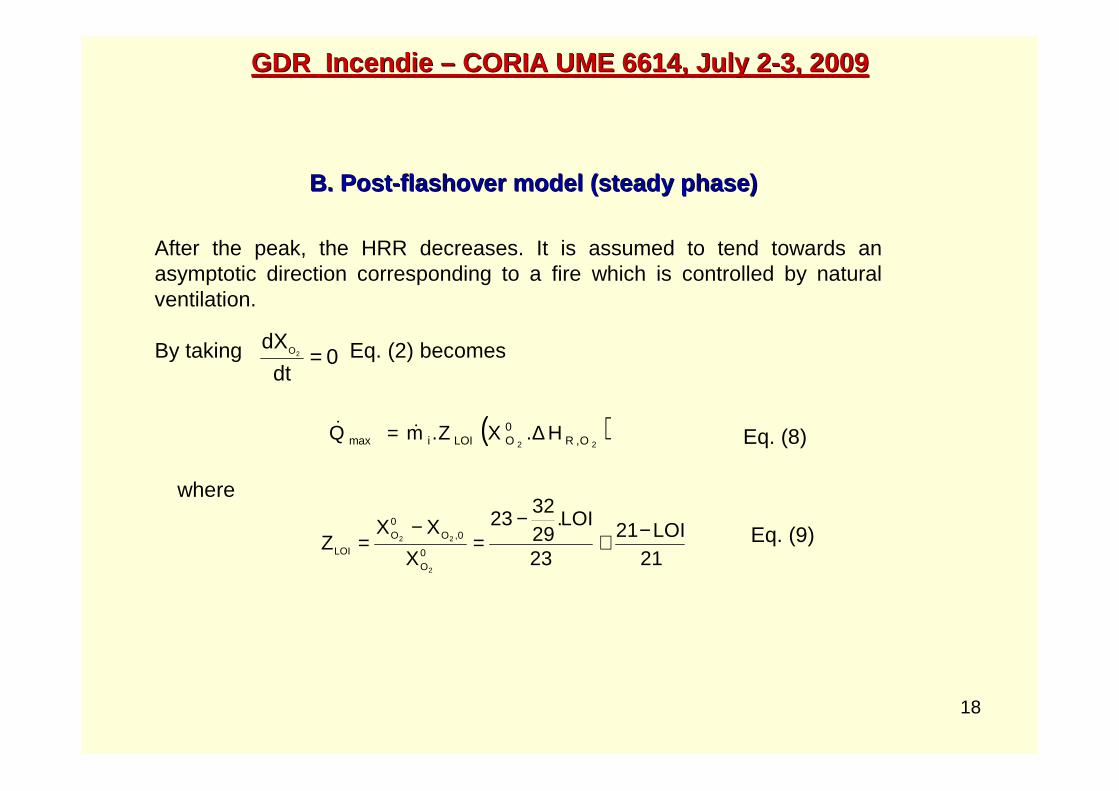
B. PostB. Post--flashover model (steady phase)flashover model (steady phase)
After the peak, the HRR decreases. It is assumed to tend towards an asymptotic direction corresponding to a fire which is controlled by natural ventilation.
By taking Eq. (2) becomes0dt
dX2O =
( )22 O,R
0OLOIimax H.XZ.mQ ∆= && Eq. (8)
where
21LOI21
23
LOI.2932
23
X
XXZ
0O
0,O0O
LOI
2
22−≅
−=
−= Eq. (9)
GDR GDR IncendieIncendie –– CORIA UME 6614, July 2CORIA UME 6614, July 2 --3, 20093, 2009
19
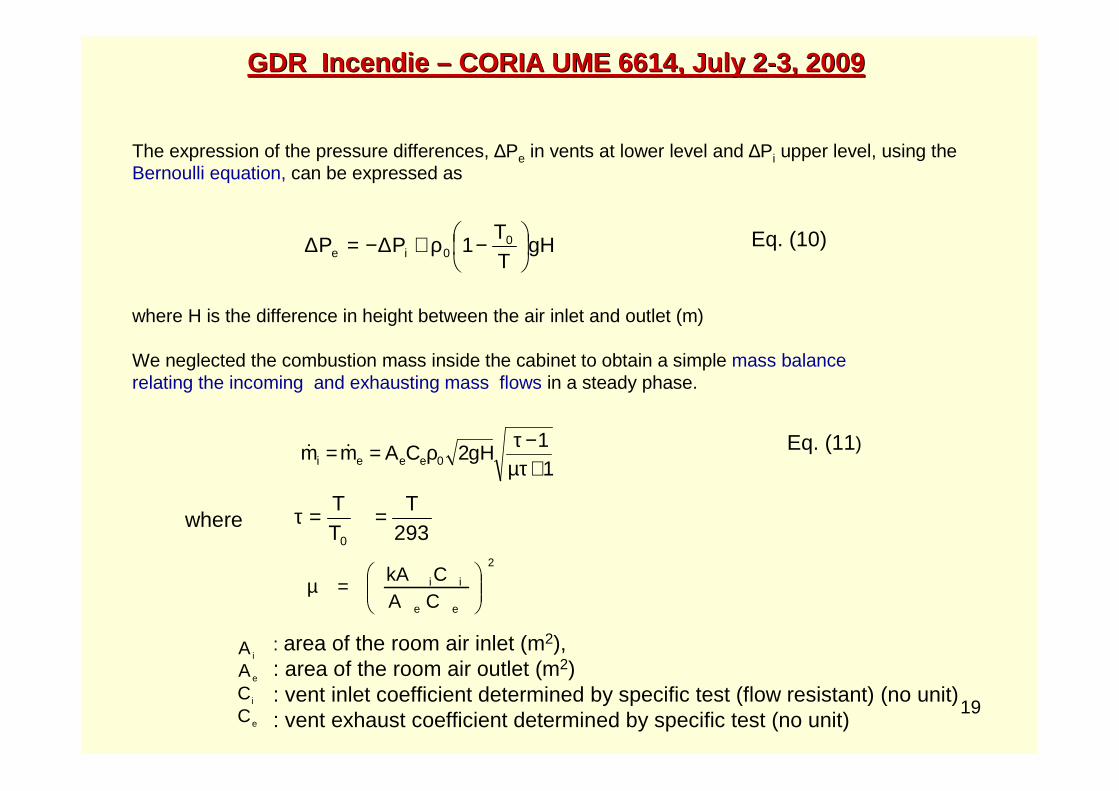
The expression of the pressure differences, ∆Pe in vents at lower level and ∆Pi upper level, using the Bernoulli equation, can be expressed as
gHTT
1PP 00ie
−ρ+∆−=∆ Eq. (10)
where H is the difference in height between the air inlet and outlet (m)
We neglected the combustion mass inside the cabinet to obtain a simple mass balance relating the incoming and exhausting mass flows in a steady phase.
11
gH2CAmm 0eeei +µτ−τρ== &&
Eq. (11)
where293T
TT
0
==τ
2
ee
ii
CACkA
=µ
: area of the room air inlet (m2),: area of the room air outlet (m2): vent inlet coefficient determined by specific test (flow resistant) (no unit): vent exhaust coefficient determined by specific test (no unit)
iA
eA
iC
eC
GDR GDR IncendieIncendie –– CORIA UME 6614, July 2CORIA UME 6614, July 2 --3, 20093, 2009

20
The dimensionless parameter τ increases from T / 293 to reach the maximum value
2
ii
eemax CkA
CA11
++=τ Eq. (12)
The asymptotic HRR becomes
( )
µ++
ρ∆= ∞1
11
1.C.A.H.g.2..H.Y.ZQ ee0O,R,OLOImax 22
&
Eq. (13)
If we take g = 9.81 m/s2 ; kg/kJ000,313100x23.0H.X22 O,R
0O ≅=∆ and
18.10 =ρ kg/m3, Eq. (13) becomes simply
Eq. (14)
GDR GDR IncendieIncendie –– CORIA UME 6614, July 2CORIA UME 6614, July 2 --3, 20093, 2009
( )2
ii
ee
eemax
CkACA
11
HCA.LOI21.747Q
++
−=&

21
GDR GDR IncendieIncendie –– CORIA UME 6614, July 2CORIA UME 6614, July 2 --3, 20093, 2009
The following expression can be used for most of fuels (polymers, etc.)
15CkACA
11.315T01.0LOI2
ii
ee +
++−=+×−=
Figure 3: Laboratoire National d’Essais (LNE) test results: Evolution of LOI as a function of temperature (used by permission)
22
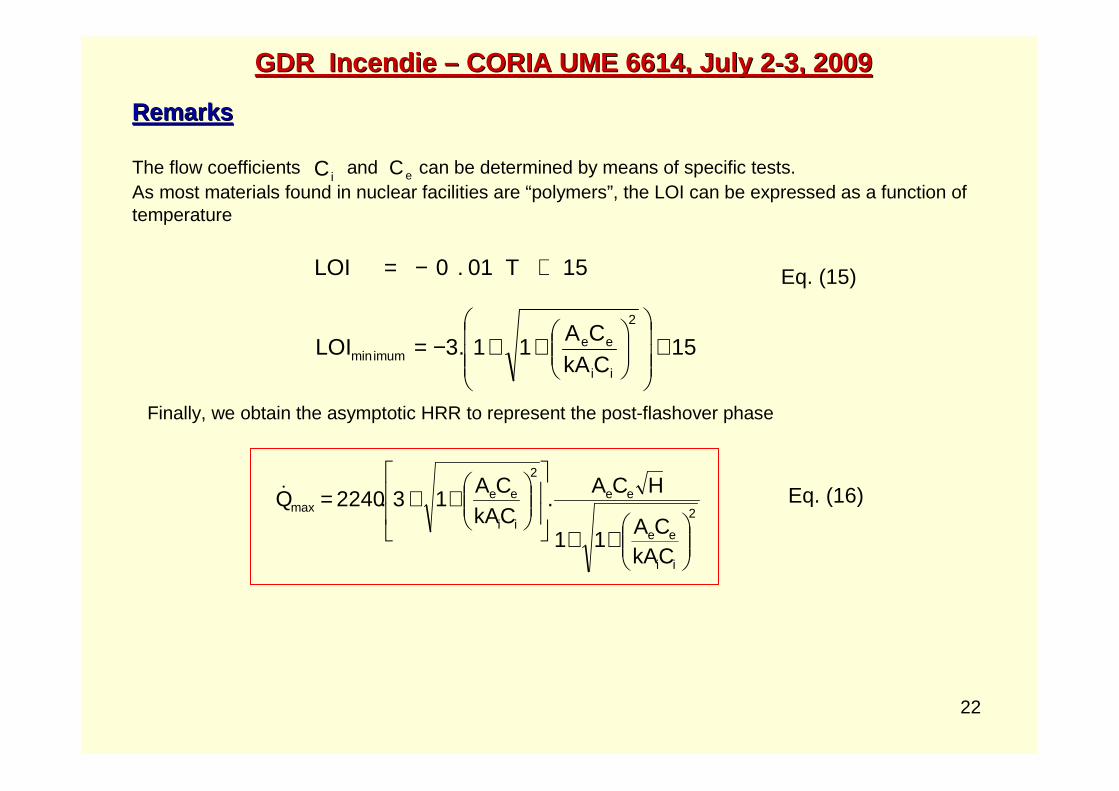
RemarksRemarks
The flow coefficients and can be determined by means of specific tests.As most materials found in nuclear facilities are “polymers”, the LOI can be expressed as a function of temperature
eCiC
Eq. (15)
Finally, we obtain the asymptotic HRR to represent the post-flashover phase
2
ii
ee
ee
2
ii
eemax
CkACA
11
HCA.
CkACA
13.2240Q
++
++=& Eq. (16)
GDR GDR IncendieIncendie –– CORIA UME 6614, July 2CORIA UME 6614, July 2 --3, 20093, 2009
15T01.0LOI +−=
15CkACA
11.3LOI2
ii
eeimummin +
++−=
23
GDR GDR IncendieIncendie –– CORIA UME 6614, July 2CORIA UME 6614, July 2 --3, 20093, 2009
VERIFICATION & VALIDATION OF THE PROPOSED MODELVERIFICATION & VALIDATION OF THE PROPOSED MODEL
Comparison between tests and calculationsComparison between tests and calculations
ObjectiveObjective: : blind calculation of time to reach the peak and asymptotic HRRblind calculation of time to reach the peak and asymptotic HRR
and comparison with test resultsand comparison with test results
Tests selectedTests selected: : 10 IRSN tests in a closed steel box 1m(wide) X 0.6m (deep) X 2m 10 IRSN tests in a closed steel box 1m(wide) X 0.6m (deep) X 2m (height), (height), naturally vented, are usednaturally vented, are used
Initial objective of testsInitial objective of tests: : evolution of mass moss rate considering influence ofevolution of mass moss rate considering influence of
�� Inlet vent area: tests 1Inlet vent area: tests 1--22--33--44
�� Outlet area: tests 3Outlet area: tests 3--5 and 75 and 7--8 8
�� Nature of fuels and configuration: tests 7Nature of fuels and configuration: tests 7--99--1010
The measured mass loss rate is used to estimate the experimentalThe measured mass loss rate is used to estimate the experimental HRRHRR
24
GDR GDR IncendieIncendie –– CORIA UME 6614, July 2CORIA UME 6614, July 2 --3, 20093, 2009
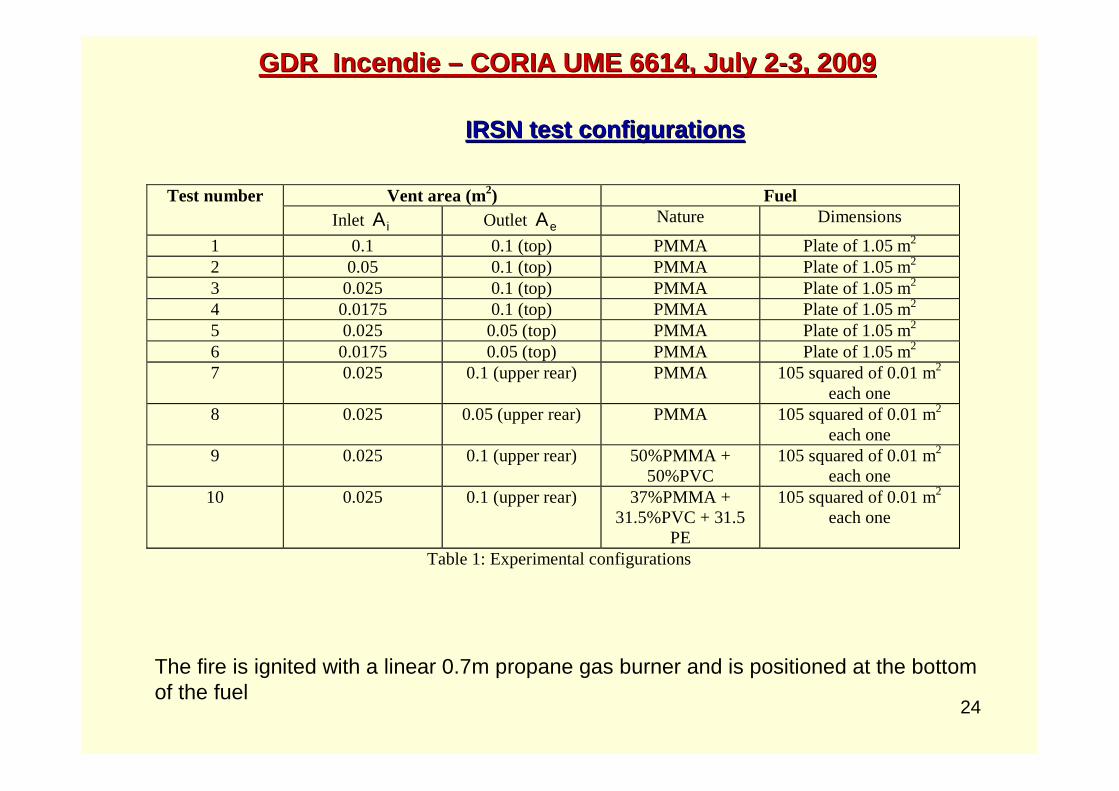
Vent area (m2) Fuel Test number Inlet iA Outlet eA Nature Dimensions
1 0.1 0.1 (top) PMMA Plate of 1.05 m2
2 0.05 0.1 (top) PMMA Plate of 1.05 m2 3 0.025 0.1 (top) PMMA Plate of 1.05 m2 4 0.0175 0.1 (top) PMMA Plate of 1.05 m2
5 0.025 0.05 (top) PMMA Plate of 1.05 m2 6 0.0175 0.05 (top) PMMA Plate of 1.05 m2 7 0.025 0.1 (upper rear) PMMA 105 squared of 0.01 m2
each one 8 0.025 0.05 (upper rear) PMMA 105 squared of 0.01 m2
each one 9 0.025 0.1 (upper rear) 50%PMMA +
50%PVC 105 squared of 0.01 m2
each one 10 0.025 0.1 (upper rear) 37%PMMA +
31.5%PVC + 31.5 PE
105 squared of 0.01 m2 each one
Table 1: Experimental configurations
The fire is ignited with a linear 0.7m propane gas burner and is positioned at the bottom of the fuel
IRSN test configurationsIRSN test configurations

25
GDR GDR IncendieIncendie –– CORIA UME 6614, July 2CORIA UME 6614, July 2 --3, 20093, 2009
Experiment α )s/kW( 2 k H (m)
1
0.0469 (fast) and
0.1876 (ultrafast)
2 (top outlet vent)
1.9
2 0.0469 (fast) 2 1.9 3 0.01172 (medium) 2 1.9 4 0.01172 (medium) 2 1.9 5
0.00293 (slow) and
0.01172 (medium)
2
1.9
7 0.01172 (medium) 1 (wall outlet vent) 1.8 8
0.00293 and
0.01172
1
1.8
9 0.01172 (medium) 1 1.8 10 0.01172 (medium) 1 1.8
Table 2: Standard growth parameter, entrainment coefficient and difference in height between
the air inlet and outlet
No experimental data is used .The zero of the calculation time axis is set at the end of the incubation phase (ignition reference time ignored).

26
GDR GDR IncendieIncendie –– CORIA UME 6614, July 2CORIA UME 6614, July 2 --3, 20093, 2009
Formula and data used for the comparison LOI = 8% and 1CC ie == (default values) are used to calculate
• 3/1
peak
V.kx4.39t
α=
• ( )2peakpeak tQ α=&
• 2
i
e
emax
kAA
11
HA.9700Q
++
=&
The results of the comparison can be presented as follows

27
GDR GDR IncendieIncendie –– CORIA UME 6614, July 2CORIA UME 6614, July 2 --3, 20093, 2009
0,00
200,00
400,00
600,00
800,00
1000,00
1200,00
1400,00
1600,00
1800,00
0 200 400 600 800 1000
test1
calculation 1
calculation 2
Test 1
Influence of fire growth parameter
Data: α = 0.1876 (ultra-fast) and α = 0.0469 (fast) : k = 2 and H = 1.90 m: (top outlet vent)
Remarks
• The early extinction has been observed after reaching the maximum HRR
• The influence of fire growth coefficient appears:
28
GDR GDR IncendieIncendie –– CORIA UME 6614, July 2CORIA UME 6614, July 2 --3, 20093, 2009
0
200
400
600
800
1000
1200
0 200 400 600 800 1000
calculation
test2
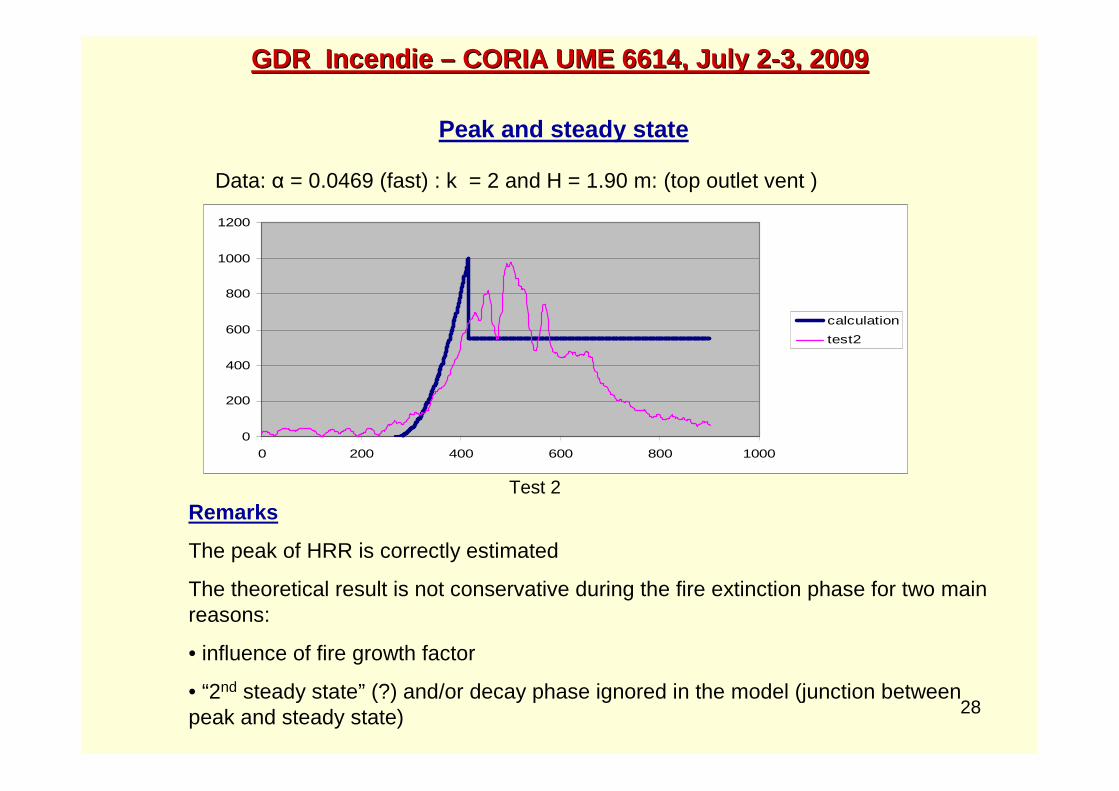
Test 2Remarks
The peak of HRR is correctly estimated
The theoretical result is not conservative during the fire extinction phase for two main reasons:
• influence of fire growth factor
• “2nd steady state” (?) and/or decay phase ignored in the model (junction between peak and steady state)
Peak and steady state
Data: α = 0.0469 (fast) : k = 2 and H = 1.90 m: (top outlet vent )
29
GDR GDR IncendieIncendie –– CORIA UME 6614, July 2CORIA UME 6614, July 2 --3, 20093, 2009
-100
0
100
200
300
400
500
600
700
0 200 400 600 800 1000 1200 1400
calculation
test 3
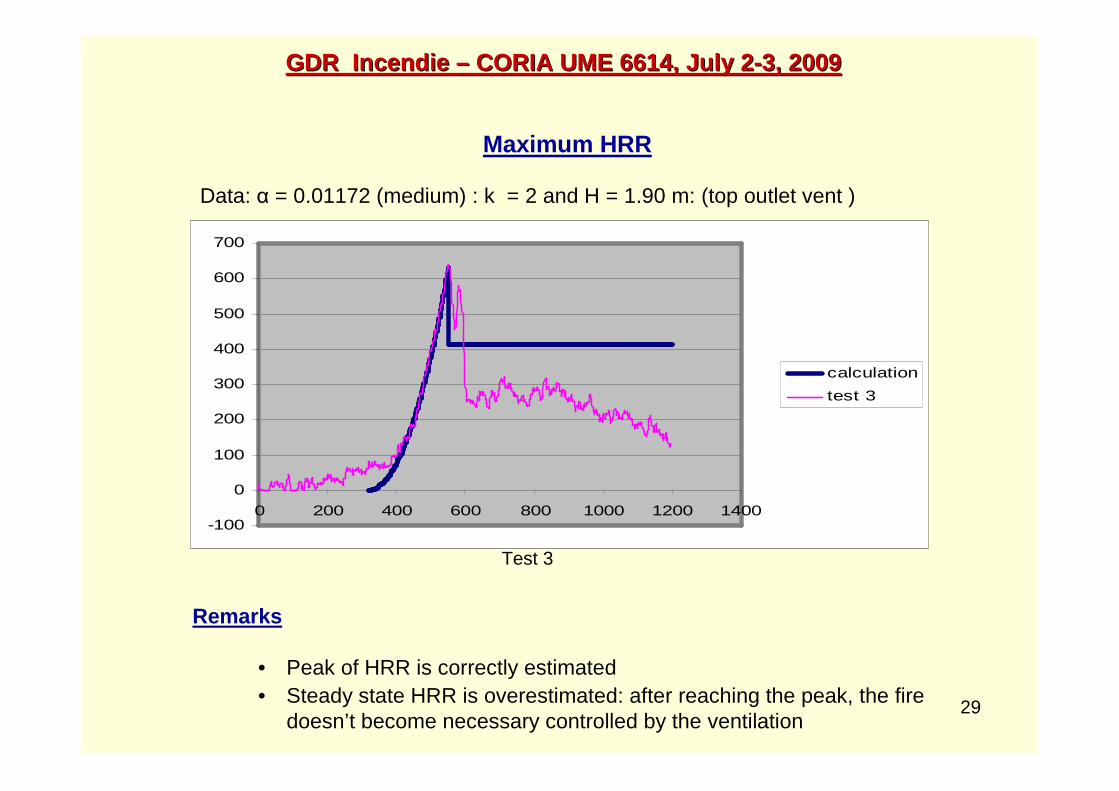
Test 3
Maximum HRR
Data: α = 0.01172 (medium) : k = 2 and H = 1.90 m: (top outlet vent )
Remarks
• Peak of HRR is correctly estimated• Steady state HRR is overestimated: after reaching the peak, the fire
doesn’t become necessary controlled by the ventilation
30
GDR GDR IncendieIncendie –– CORIA UME 6614, July 2CORIA UME 6614, July 2 --3, 20093, 2009
0
50
100
150
200
250
300
350
0 200 400 600 800 1000 1200 1400
calculation
test4
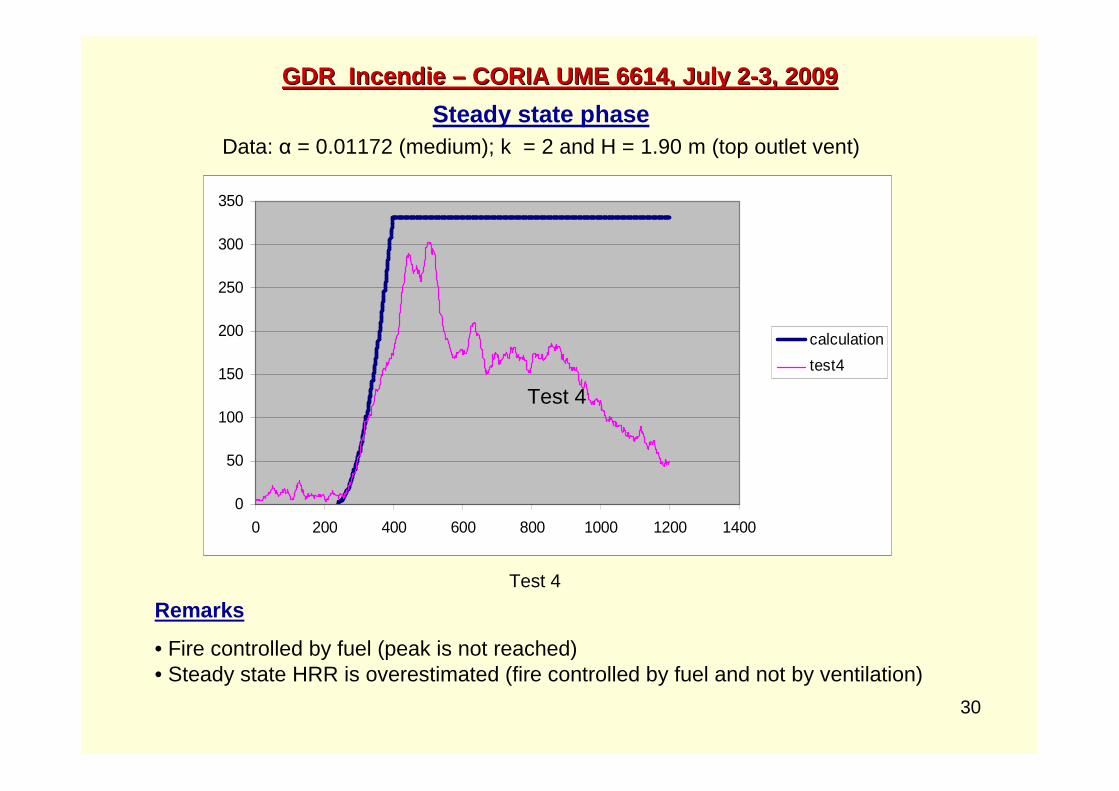
Test 4
Test 4
Steady state phaseData: α = 0.01172 (medium); k = 2 and H = 1.90 m (top outlet vent)
Remarks
• Fire controlled by fuel (peak is not reached)• Steady state HRR is overestimated (fire controlled by fuel and not by ventilation)

31
GDR GDR IncendieIncendie –– CORIA UME 6614, July 2CORIA UME 6614, July 2 --3, 20093, 2009
-100
0
100
200
300
400
500
600
700
0 200 400 600 800 1000 1200 1400
calculation 1
test8
calculation 2
test5
Tests 5 and 8Remarks
• Experiment 5 (top vent area) : early extinction has been observed (plotted as an indication).
• Experiment 8 (wall vent area) : no peak has been observed
• Maximum of HRR : correctly estimated
Influence of outlet vent location
Data test 8: α = 0.01172 (medium) and 0.00293 (slow); k = 1 and H = 1.80 m (wall outlet vent)
32
GDR GDR IncendieIncendie –– CORIA UME 6614, July 2CORIA UME 6614, July 2 --3, 20093, 2009
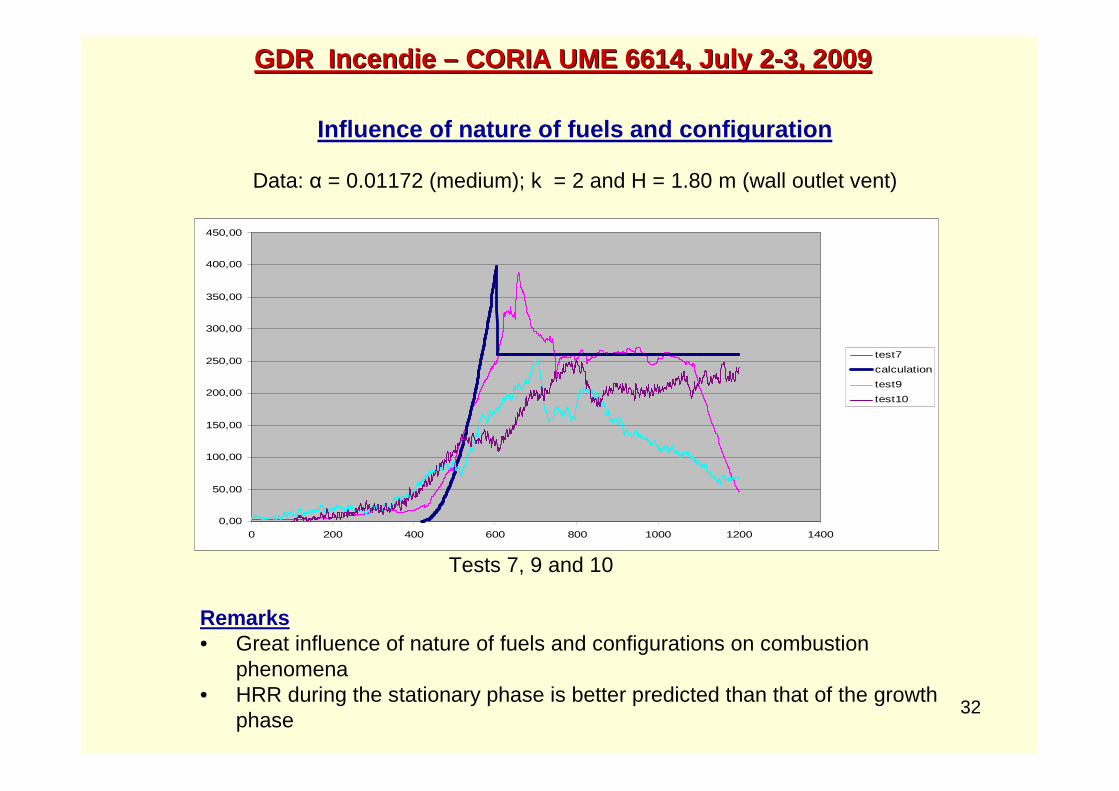
Influence of nature of fuels and configuration
Data: α = 0.01172 (medium); k = 2 and H = 1.80 m (wall outlet vent)
0,00
50,00
100,00
150,00
200,00
250,00
300,00
350,00
400,00
450,00
0 200 400 600 800 1000 1200 1400
test7
calculation
test9
test10
Tests 7, 9 and 10
Remarks• Great influence of nature of fuels and configurations on combustion
phenomena • HRR during the stationary phase is better predicted than that of the growth
phase
33
GDR GDR IncendieIncendie –– CORIA UME 6614, July 2CORIA UME 6614, July 2 --3, 20093, 2009
CONCLUSIONCONCLUSION
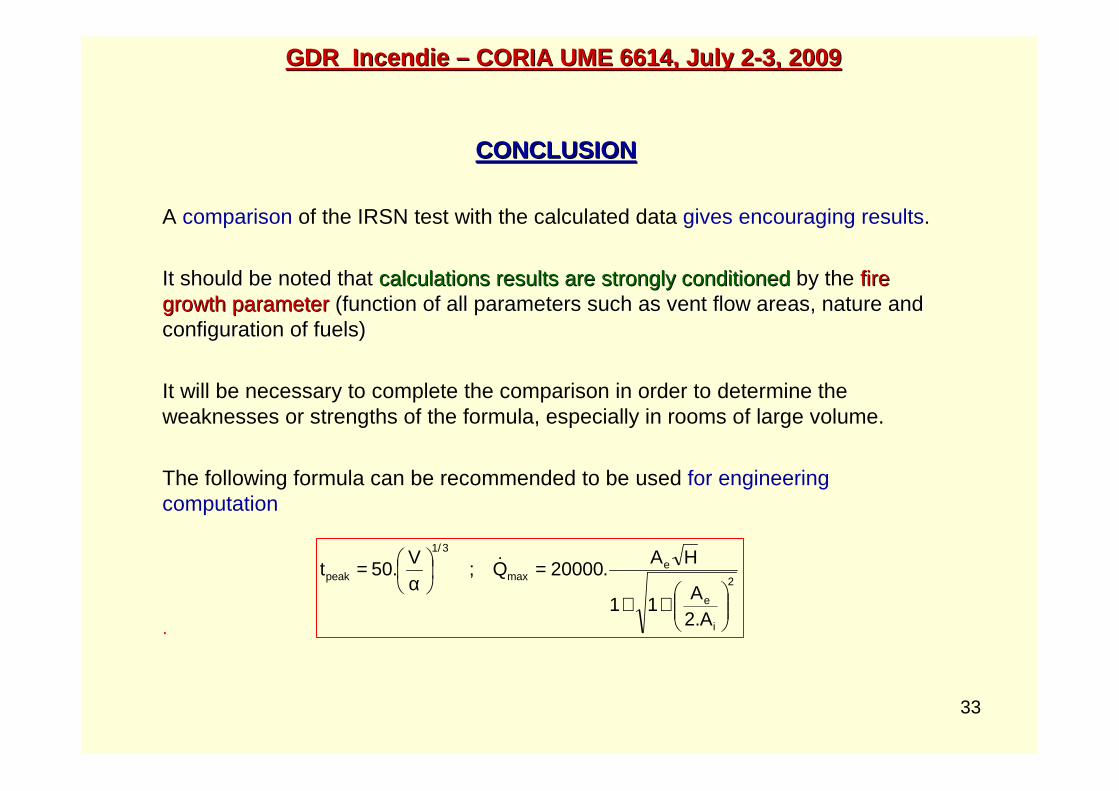
A comparison of the IRSN test with the calculated data gives encouraging results.
It should be noted that It should be noted that calculations results are strongly conditioned calculations results are strongly conditioned byby the fire fire growth parametergrowth parameter (function of all parameters such as vent flow areas, nature and(function of all parameters such as vent flow areas, nature andconfiguration of fuels)configuration of fuels)
It will be necessary to complete the comparison in order to determine the weaknesses or strengths of the formula, especially in rooms of large volume.
The following formula can be recommended to be used for engineering computation
.
2
i
e
emax
3/1
peak
A.2A
11
HA.20000Q;
V.50t
++
=
α= &
34
Thank you for your attention
GDR GDR IncendieIncendie –– CORIA UME 6614, July 2CORIA UME 6614, July 2 --3, 20093, 2009


![Dual controlled modes of mechanical ventilation [onarılmış]](https://img.pdfslide.us/doc/110x75/5871a5ac1a28abda6a8b471f/dual-controlled-modes-of-mechanical-ventilation-onarilmis.jpg)