Embed Size (px)
Citation preview
1 NORTHWEST ENERGY EFFICIENCY ALLIANCE
Heat Pump Water Heater Field Testing and Modeling in the Northwest September 28 2012 Dave Kresta & Ben Larson
2
Agenda
Preliminary Field Testing results HPWH Modeling efforts
3
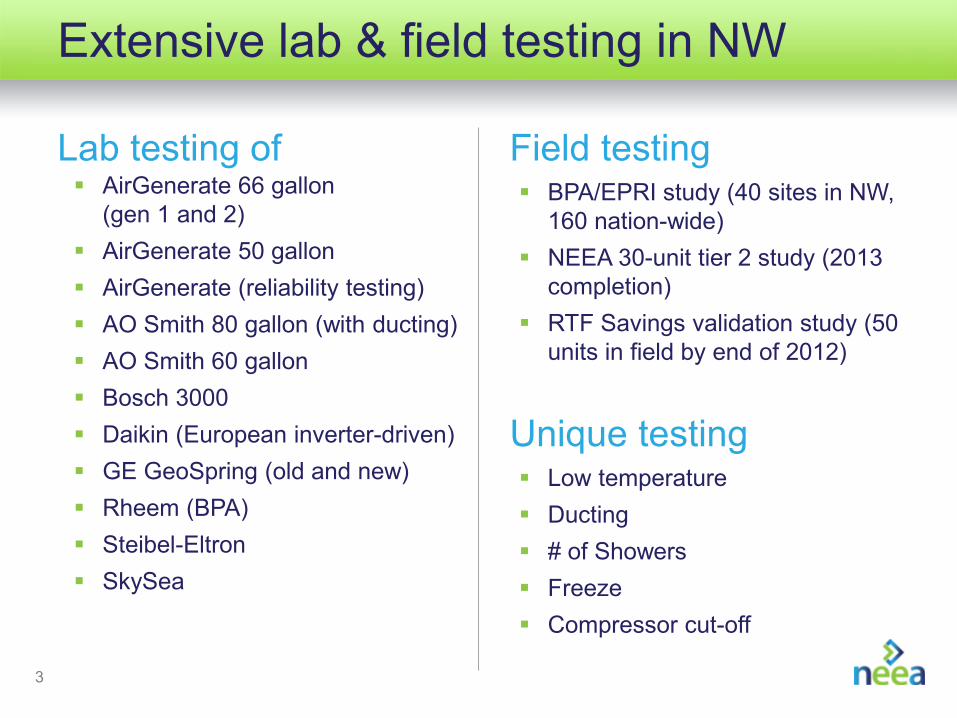
Extensive lab & field testing in NW
Lab testing of AirGenerate 66 gallon
(gen 1 and 2) AirGenerate 50 gallon AirGenerate (reliability testing) AO Smith 80 gallon (with ducting) AO Smith 60 gallon Bosch 3000 Daikin (European inverter-driven) GE GeoSpring (old and new) Rheem (BPA) Steibel-Eltron SkySea
Field testing BPA/EPRI study (40 sites in NW,
160 nation-wide) NEEA 30-unit tier 2 study (2013
completion) RTF Savings validation study (50
units in field by end of 2012)
Unique testing Low temperature Ducting # of Showers Freeze Compressor cut-off
4
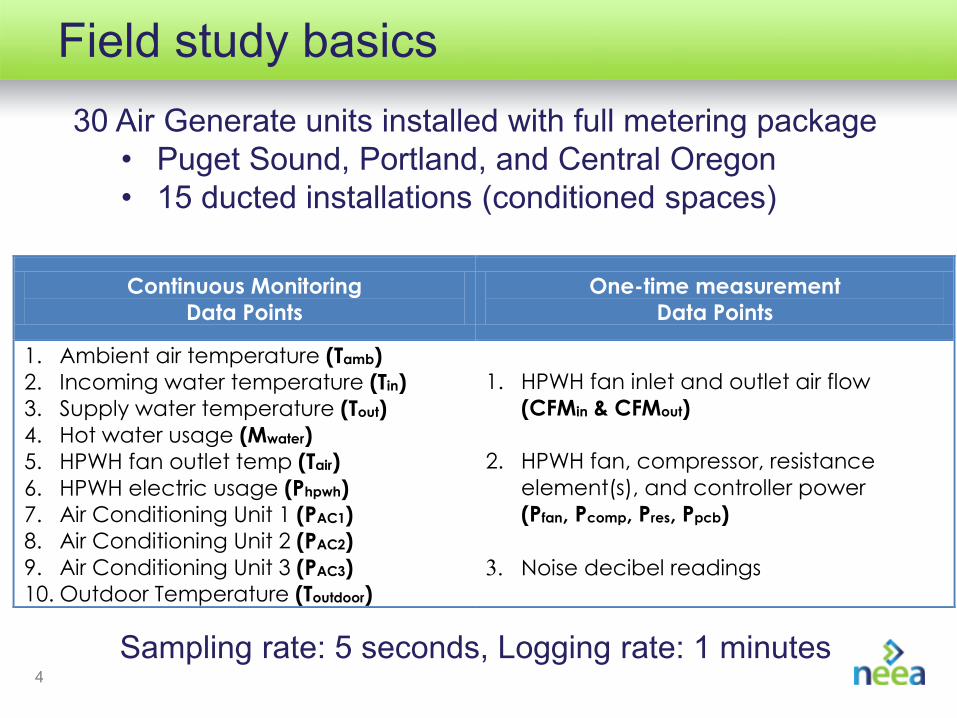
Field study basics
Continuous Monitoring Data Points
One-time measurement Data Points
1. Ambient air temperature (Tamb) 2. Incoming water temperature (Tin) 3. Supply water temperature (Tout) 4. Hot water usage (Mwater) 5. HPWH fan outlet temp (Tair) 6. HPWH electric usage (Phpwh) 7. Air Conditioning Unit 1 (PAC1) 8. Air Conditioning Unit 2 (PAC2) 9. Air Conditioning Unit 3 (PAC3) 10. Outdoor Temperature (Toutdoor)
1. HPWH fan inlet and outlet air flow (CFMin & CFMout)
2. HPWH fan, compressor, resistance element(s), and controller power (Pfan, Pcomp, Pres, Ppcb)
3. Noise decibel readings
30 Air Generate units installed with full metering package • Puget Sound, Portland, and Central Oregon • 15 ducted installations (conditioned spaces)
Sampling rate: 5 seconds, Logging rate: 1 minutes
5
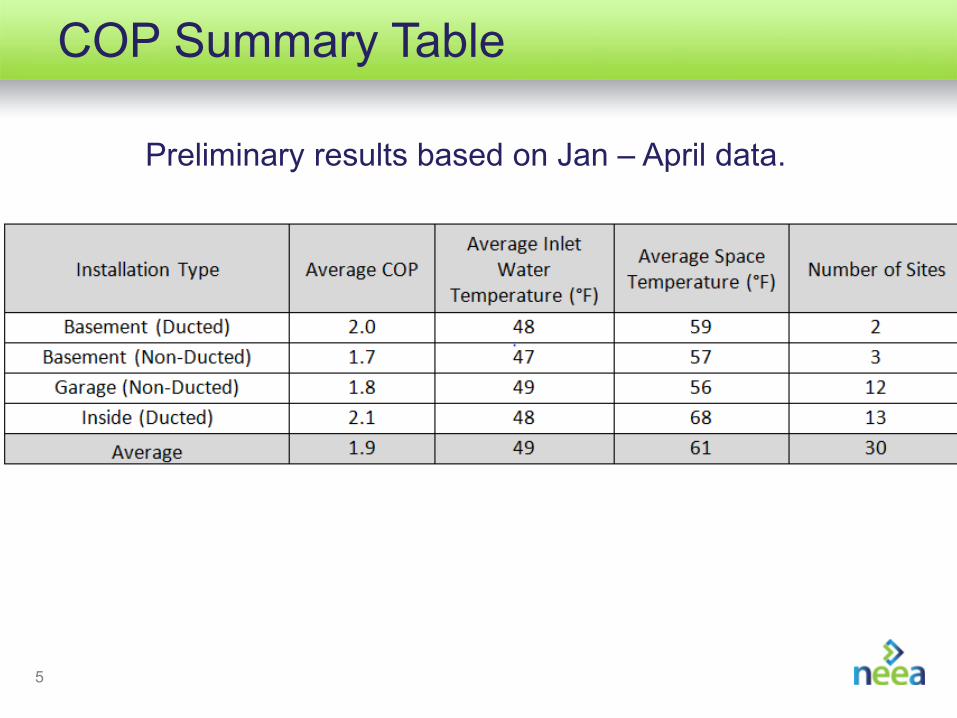
COP Summary Table
Preliminary results based on Jan – April data.
6
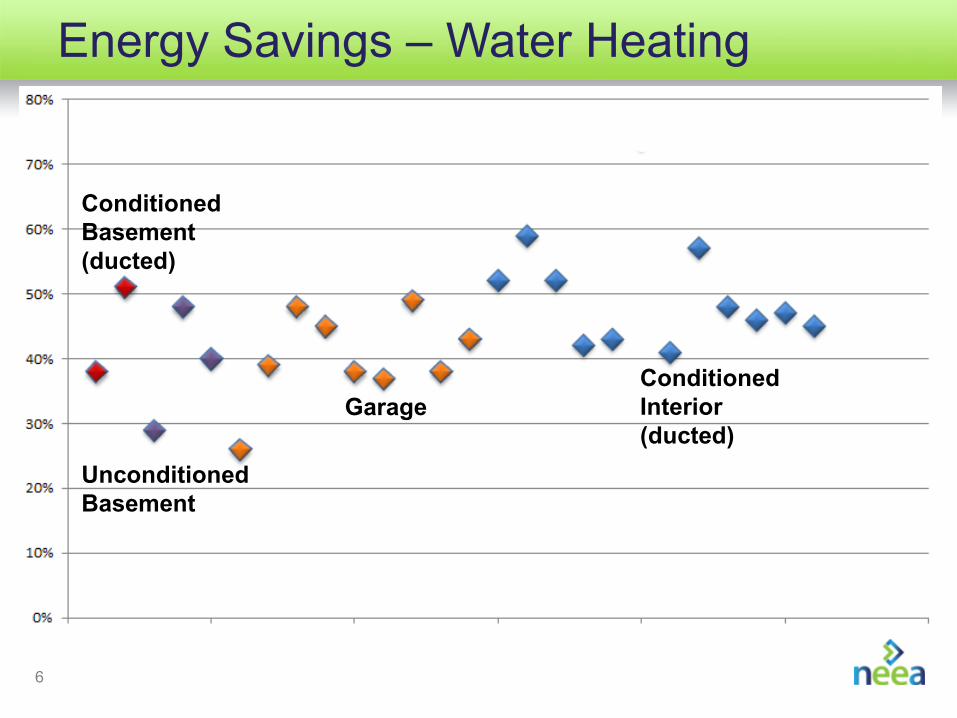
Energy Savings – Water Heating
Conditioned Basement (ducted)
Unconditioned Basement
Garage Conditioned Interior (ducted)
7
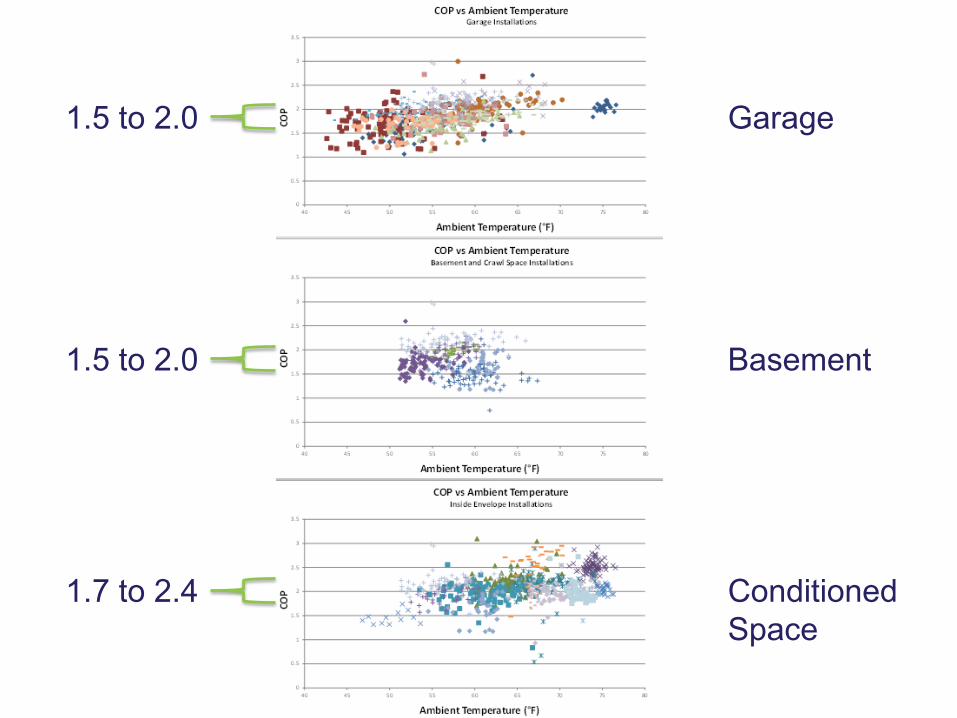
1.5 to 2.0
1.5 to 2.0
1.7 to 2.4
Garage
Basement
Conditioned Space
8
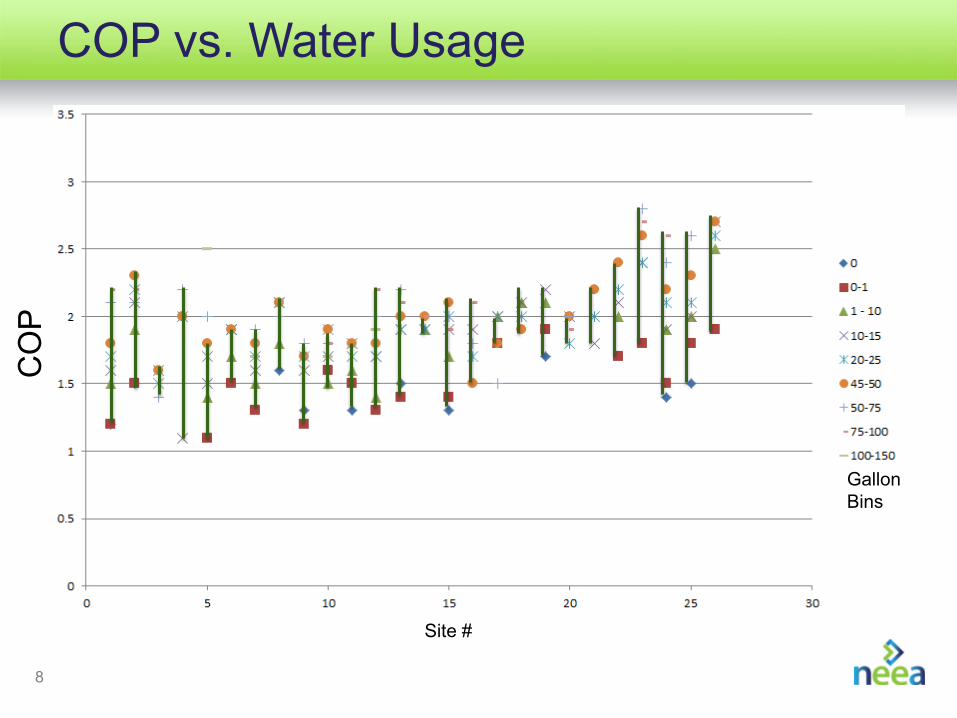
COP vs. Water Usage
Site #
CO
P
Gallon Bins
9
HPWH Modeling: From the Lab to the Field
How does lab-tested HPWH performance relate to field performance? Data and Tools Needed: Lab tests Simulation derived from lab tests Field measurements Calibration Method to adjust lab-based simulation to observed field performance
Goal: general method to predict HPWH field performance based on small set of lab tests w/o detailed field calibration Focus today: ATI 66
10
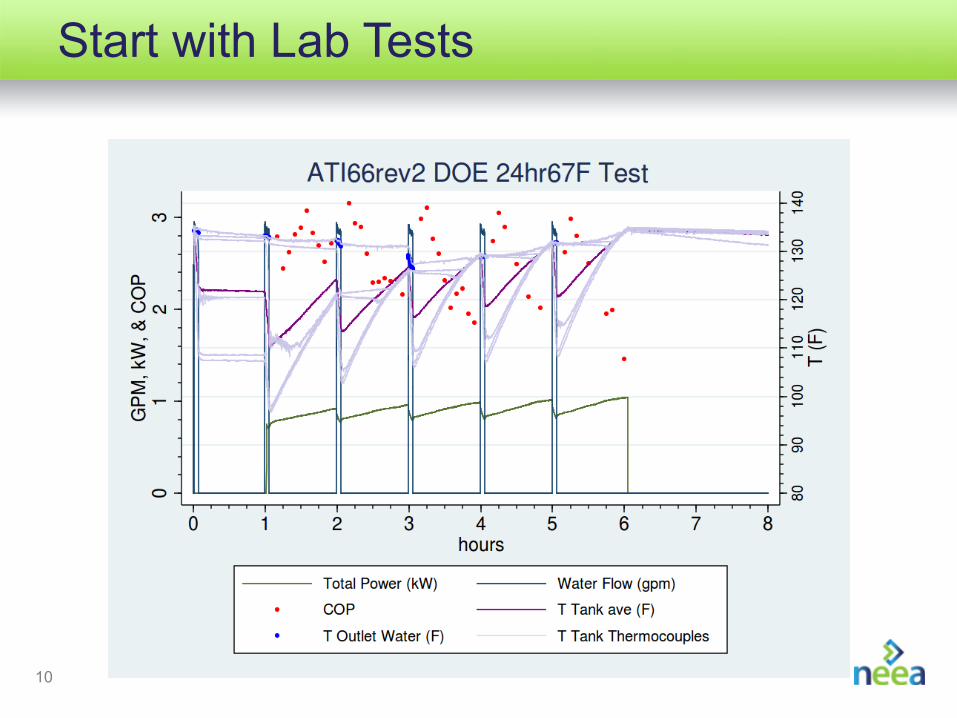
Start with Lab Tests
11
HPWH Simulation Overview
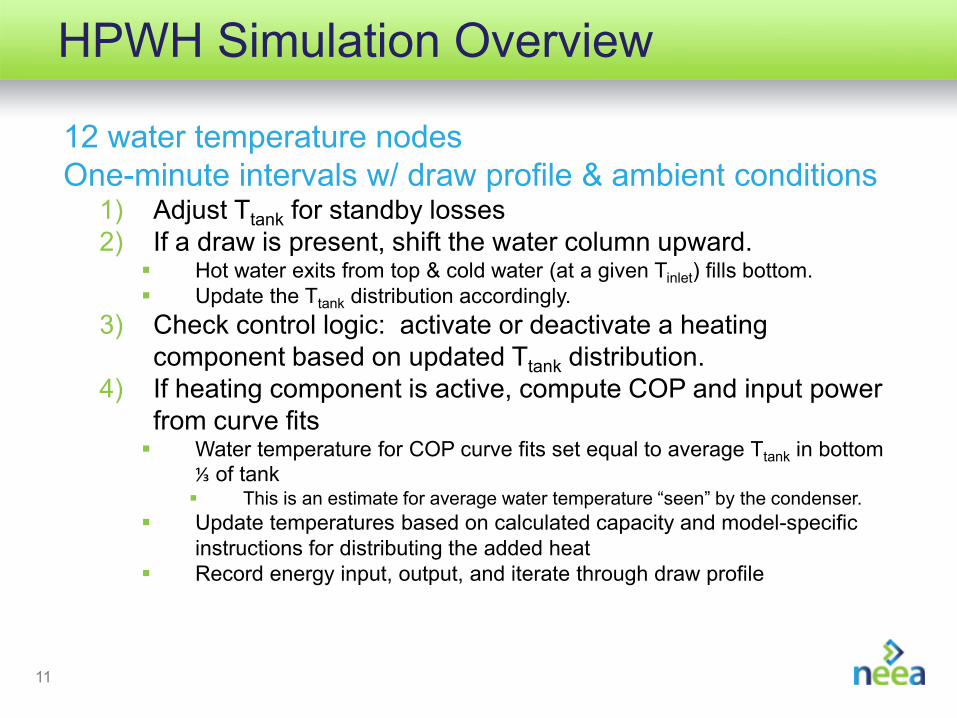
12 water temperature nodes One-minute intervals w/ draw profile & ambient conditions
1) Adjust Ttank for standby losses 2) If a draw is present, shift the water column upward.
Hot water exits from top & cold water (at a given Tinlet) fills bottom. Update the Ttank distribution accordingly.
3) Check control logic: activate or deactivate a heating component based on updated Ttank distribution.
4) If heating component is active, compute COP and input power from curve fits Water temperature for COP curve fits set equal to average Ttank in bottom
⅓ of tank This is an estimate for average water temperature “seen” by the condenser.
Update temperatures based on calculated capacity and model-specific instructions for distributing the added heat
Record energy input, output, and iterate through draw profile
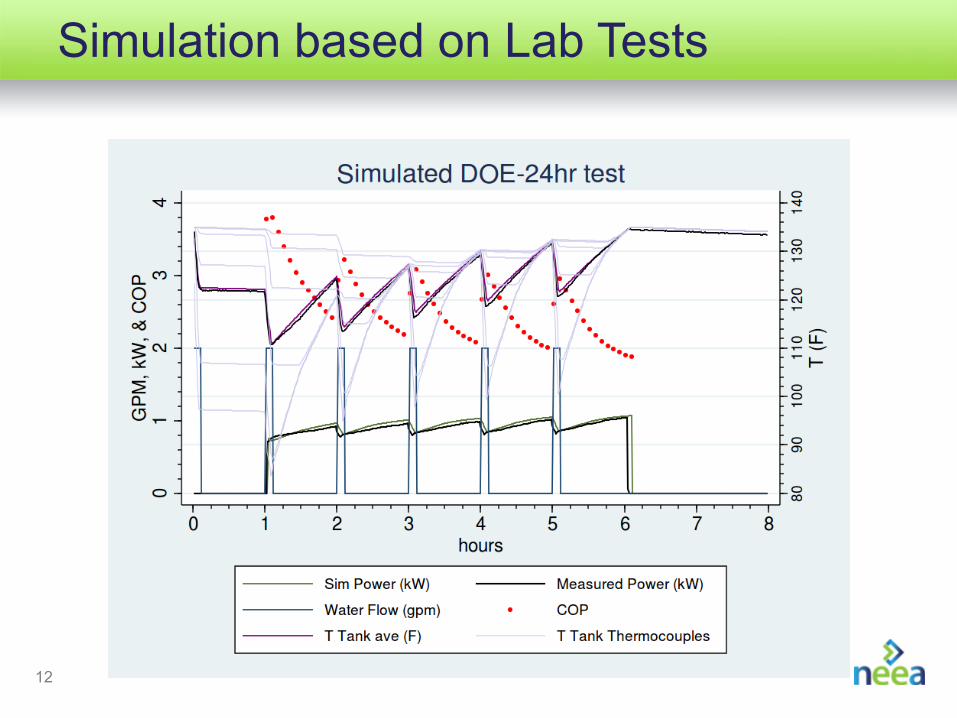
12
Simulation based on Lab Tests
13
Field Measurements
30 sites overall January – April 2012 Installs in garages, unheated basements,
and heated interior spaces Metered data One minute intervals Inlet & Outlet water T Inlet water flow rate Total system power
14
Calibration / Validation
Test lab-based simulation against field data Use measured field data as inputs to simulation
(ambient T, inlet water T, water flow) Markov Chain Monte Carlo random walk Allow simulation parameters to float to find best fit to field data Floating parameters: COP curves at differing temperature conditions Control strategy
Fitting parameters: Total HPWH energy use Coincidental runtime
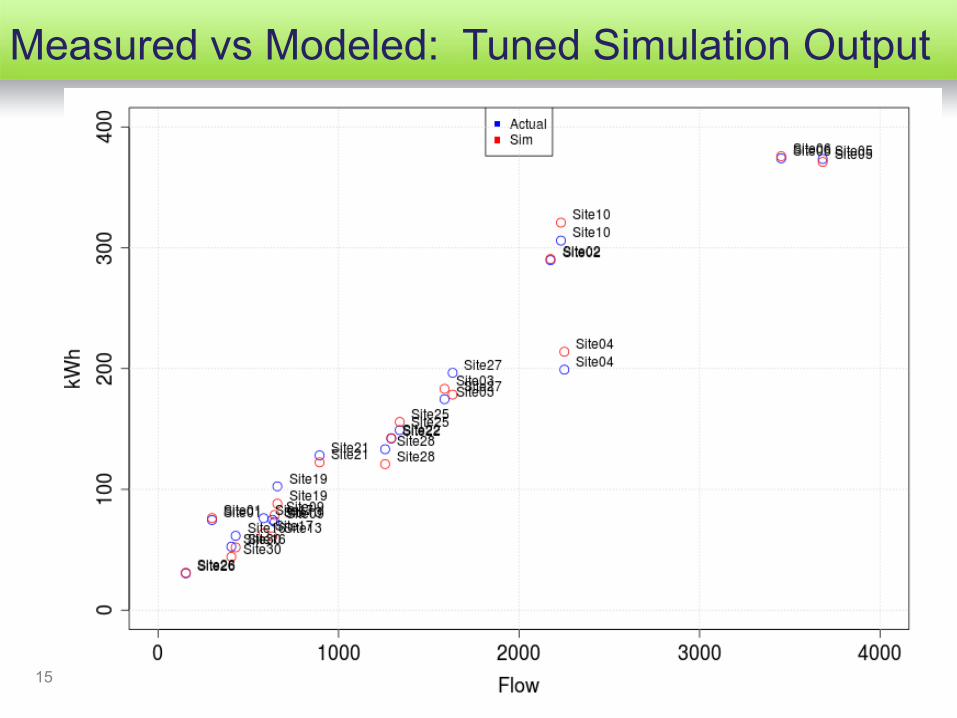
15
Measured vs Modeled: Tuned Simulation Output
16
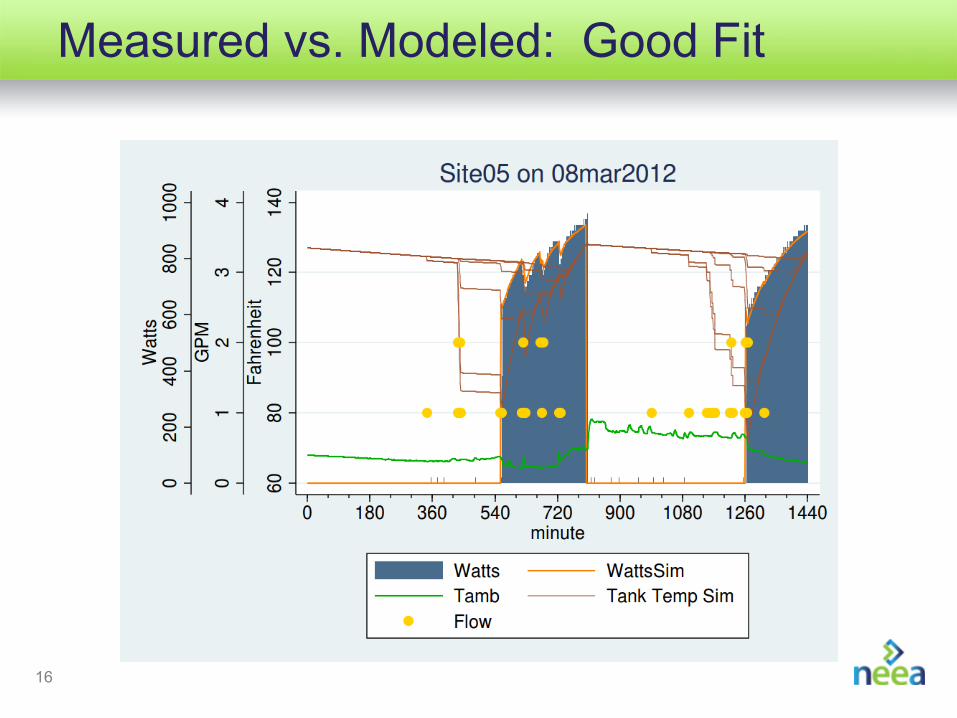
Measured vs. Modeled: Good Fit
17
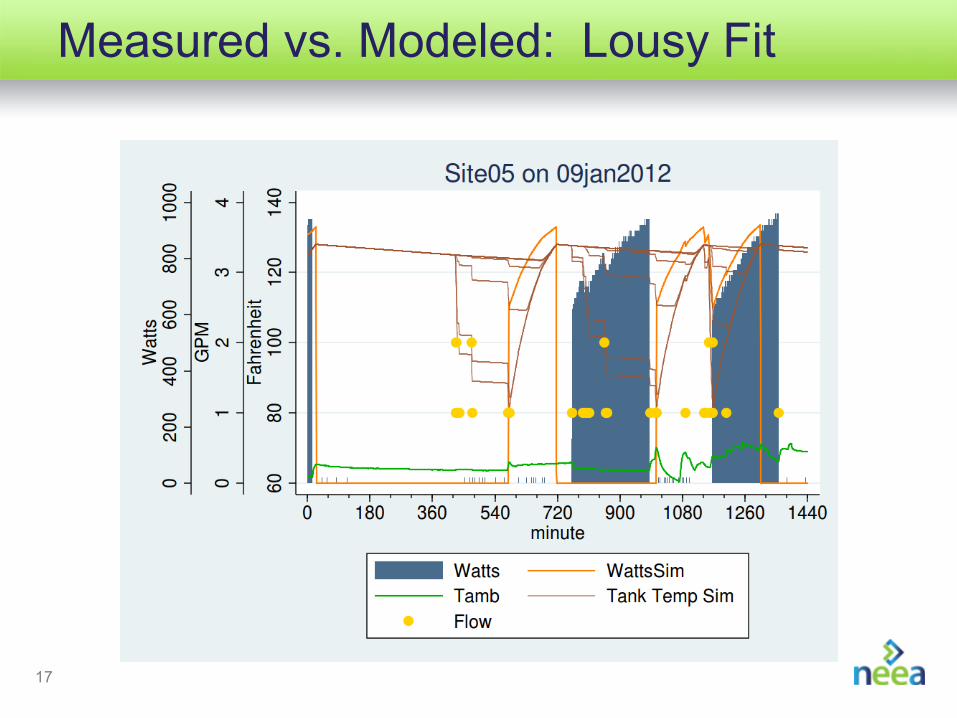
Measured vs. Modeled: Lousy Fit
18
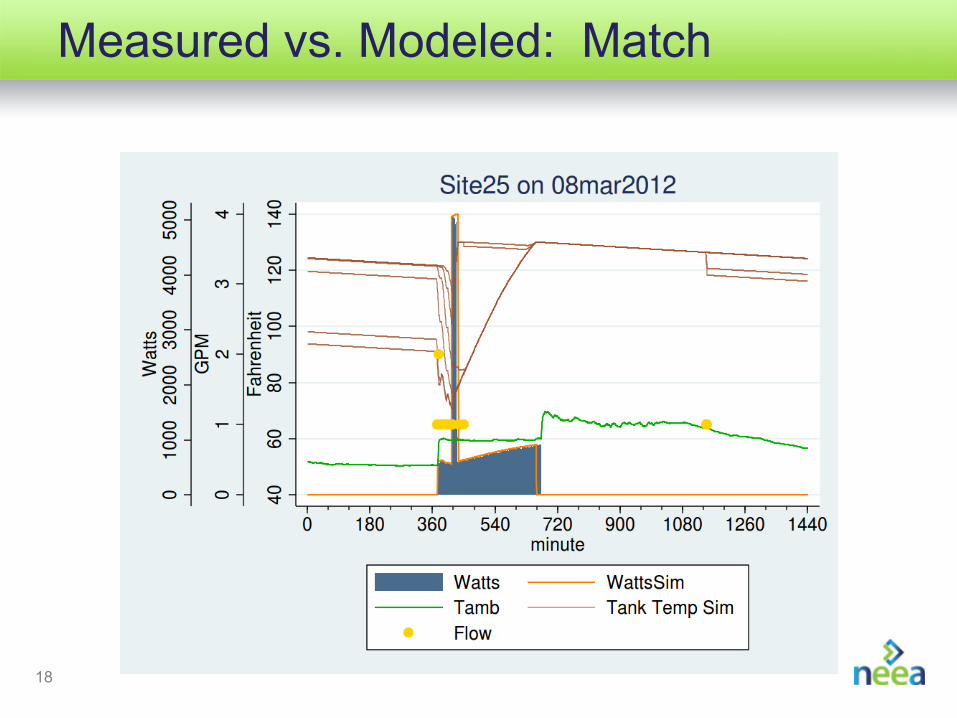
Measured vs. Modeled: Match
19
Conclusions
Lab-based simulation adjustments Decreased COP curves to match field data Resulted in a 10-15% drop Why? - Field data better encapsulates the
complicated temperature stratification and heat transfer from condenser to tank
No change in control strategy
19
20
Next Steps HPWH Equipment Model: Perform calibration and validation with field data
from a number of different HPWH equipment types first up: Voltex and GeoSpring
Look for trends in translating lab-based simulations to field results Develop generalized approach to predict field
performance from small set of lab tests Bypass extensive field studies
Whole-house Interactions: Connect HPWH model to SEEM (a sub-hourly
residential energy and infiltration simulation) Validate both models based with ongoing field
research
20