Embed Size (px)
Citation preview

Purdue University Purdue University
Purdue e-Pubs Purdue e-Pubs
CTRC Research Publications Cooling Technologies Research Center
2020
Heat Pipe Dryout and Temperature Hysteresis in Response to Heat Pipe Dryout and Temperature Hysteresis in Response to
Transient Heat Pulses Exceeding the Capillary Limit Transient Heat Pulses Exceeding the Capillary Limit
K. Baraya Purdue University
J. A. Weibel Purdue University, [email protected]
S V. Garimella University of Vermont, [email protected]
Follow this and additional works at: https://docs.lib.purdue.edu/coolingpubs
Baraya, K.; Weibel, J. A.; and Garimella, S V., "Heat Pipe Dryout and Temperature Hysteresis in Response to Transient Heat Pulses Exceeding the Capillary Limit" (2020). CTRC Research Publications. Paper 353. http://dx.doi.org//10.1016/j.ijheatmasstransfer.2019.119135
This document has been made available through Purdue e-Pubs, a service of the Purdue University Libraries. Please contact [email protected] for additional information.
1
Heat pipe dryout and temperature hysteresis
in response to transient heat pulses exceeding the capillary limit
Kalind Baraya, Justin A. Weibel1, Suresh V. Garimella
School of Mechanical Engineering
Purdue University, 585 Purdue Mall, West Lafayette, IN 47907 USA
Abstract
The balance between the capillary pressure provided by the wick in a heat pipe or vapor chamber and the
flow resistance to liquid resupply at the evaporator determines the maximum heat load that can be sustained
at steady state. This maximum heat load is termed as the capillary limit; operation at steady heat loads
above the capillary limit will result in dryout at the evaporator wick. However, different user needs and
device workloads can lead to highly transient heat loads in applications ranging from consumer electronic
devices to server processors. In these instances, the operation of heat pipes must be assessed in response to
brief transient heat loads which could be higher than the notional capillary limit that governs dryout at
steady state. In the current study, experiments are performed to characterize the transient thermal response
of a heat pipe subjected to heat input pulses of varying duration that exceed the capillary limit. Transient
dryout events due to a wick pressure drop exceeding the maximum available capillary pressure can be
detected from an analysis of the measured temperature signatures. It is demonstrated that under such
transient heating conditions, a heat pipe can sustain heat loads higher than the steady-state capillary limit
for brief periods of time without experiencing dryout. If the heating pulse is sufficiently long as to induce
transient dryout, the heat pipe may experience an elevated steady-state temperature even after the heat load
is reduced back to a level lower than the capillary limit. The steady-state heat load must then be reduced to
a level much below the capillary limit to fully recover the original thermal resistance of the heat pipe. This
characteristic temperature hysteresis following transient dryout has significant implications for the use of
heat pipes for pulsed power dissipation. Further experiments are performed to bound the range of heat loads
over which the temperature hysteresis is present following a transient dryout event.
Keywords: heat pipe, vapor chamber, capillary limit, pulsed input, transient dryout, hysteresis
1 Corresponding author, E-mail address: [email protected].
2
1. Introduction
Heat pipes and vapor chambers utilize the latent heat of phase change of an internal working fluid to
passively transport heat over long distances at a small temperature gradient. Heat pipes find use in thermal
management of electronic devices in both low- and high-power applications owing to their efficient heat
transport [1–3].
The hollow metal case of a heat pipe is lined on the inside by a porous wick that is saturated with liquid;
the interior core of the heat pipe supports vapor flow [4]. A local heat source is applied to the evaporator
region of the heat pipe, and the surface dedicated for heat rejection to the ambient is called the condenser.
Application of a heat input causes the liquid to evaporate at the wick and flow through the vapor core. The
vapor condenses on the wick that lines the condenser surface and is passively drawn back to the evaporator
via capillary forces generated in the wick. An increase in the heat input increases the rate of evaporation
from the wick, and induces a higher fluid flow rate and pressure drop in the heat pipe. The maximum heat
load that a heat pipe can sustain at steady state while maintaining liquid resupply to the evaporator is
governed by the capillary pressure of the wick. Any heat load inducing a fluid pressure drop higher than
the capillary pressure head will result in dryout at the evaporator wick; this threshold heat load is commonly
known as the capillary limit.
The capillary limit, which governs the maximum steady-state heat load, is primarily dependent on the
heat pipe geometry, working fluid properties, and wick properties. Working fluids are typically chosen
based on thermophysical liquid properties that would yield the maximum capillary limit [5, 6]. Recent
studies have explored the use of fluid additives [7, 8] to increase the maximum heat transport rate in heat
pipes. A number of studies have investigated the capillary limit-induced dryout phenomenon in porous wick
structures in heat pipes. Hanlon and Ma [9] characterized the dependence of dryout heat flux in sintered
particle structures on wick thickness, particle size, and porosity. Chun [10] studied the dryout of screen
wicks pumping vertically against gravity, and developed a model to predict the dryout heat load as a
function of the wicking length. For screen mesh wicks, Brautsch and Kew [11] showed that the heat flux
required for dryout increases with an increasing number of mesh layers. A model for steady-state
temperature and pressure drop in a flat heat pipe developed by Lefevere and Lallemand [12] was used to
show that the maximum heat flux of a grooved heat pipe increases with an increase in the groove width
[13].
Rather than considering the individual effects of the working fluid and wick on performance, several
studies have characterized the coupling between the capillary behavior and different governing parameters
of vapor chambers and heat pipes. Rice and Faghri [14] numerically simulated the temperature and pressure

3
fields in sintered wick heat pipes, accounting for changes in meniscus shape due to evaporation as a function
of applied heat load and location of the heat source. The parametric dependence of heat pipe performance
on wick properties (thickness, radius of curvature, porosity) and heater diameter was investigated by Pruzan
et al. [15]; the physical insights from the study were used to design wicks capable of dissipating high heat
loads. Other physical mechanisms, such as the effect of viscous drag along the wick substrate on liquid
flow in a wick [16] and heat spreading in the wall/wick from localized heat sources [17] can also have a
prominent effect on the capillary limit of a heat pipe. Fluid loading in the wick also affects the capillary
limit. Kempers et al. [18] showed that capillary limit was unaffected by over-filling the wick, but greatly
diminished due to under-filling. In another study, Lips et al. [19] showed that a thinner vapor core improves
the thermal resistance but reduces the capillary limit for an over-filled wick, and hence the vapor core
thickness and filling ratio need to be carefully optimized. In our recent work [20], we concluded that the
choice of wick and working fluid should be made simultaneously to obtain the optimal thermal performance
while utilizing the maximum capillary pressure available, as the total thermal resistance is coupled to both
the wick and working fluid properties.
All of the studies reviewed above aimed to characterize or understand dryout mechanisms at steady-
state operating conditions. However, electronic devices are rarely operated in a steady manner in practice,
but rather, the operation is highly transient. For instance, in smartphones, the typical user behavior
consisting of short periods of device interaction is well recognized in the literature [21] and is often referred
to as ‘bursty’ or micro-usage [22, 23]. These micro-usage device interaction patterns are also common in
other applications, such as user activity on the internet [24] or while streaming media content [25]. For both
low- and high-power applications, thermal design and thermally-limited performance throttling is
increasingly dictated by such transient use-cases, often including short power spikes [26, 27]. Hence, it is
important to study the dryout behavior of heat pipes in response to a brief power pulse that exceeds the
conventional capillary limit value at steady state.
A number of studies have investigated the thermal and hydrodynamic response of vapor chambers and
heat pipes under transient operating conditions. A seminal example by Tournier and El-Genk [28] is a two-
dimensional transient model of a heat pipe that predicted the effective radii of curvature of the liquid
menisci along the liquid-vapor interface, in response to step-function heating and cooling. Wang and Vafai
[29] experimentally investigated the thermal performance of a flat-plate heat pipe and proposed a heat pipe
time constant. A model was developed [30] which indicated that the thermal penetration time is dependent
on the effective thermal diffusivity along the heat pipe; the time to steady state is strongly dependent on the
heat transfer coefficient to the ambient. Several studies have also benchmarked the transient performance
of flat heat pipes against solid metal heat spreaders. Harmand et al. [31] compared vapor chambers against
solid heat spreaders in terms of total thermal resistance using a transient numerical model, and found solid
4
heat spreaders to have lower temperature gradients than vapor chambers for short transient thermal cycles.
Recently, Patankar et al. [32] investigated the physical mechanisms governing vapor chamber performance
under transient operating conditions, using an experimentally validated time-stepping analytical model
[33]. The maximum temperature in a solid heat spreader was found to be lower than the vapor chamber for
short periods of time just after start-up owing to the low relative thermal capacity of the vapor chamber. At
later times, the vapor chamber performed better than the solid spreader as the operating temperature and
effective vapor core conductance increased. Other factors such as wick filling ratio, gravity, heat flux, and
convective cooling can also affect the transient performance of a heat pipe [34]. However, these prior
studies have only characterized the transient operating characteristics; to the knowledge of the authors, none
have focused on the transient thermal behavior up to the point of dryout or above the steady-state capillary
limit.
In this paper, we experimentally demonstrate that a heat pipe can briefly operate, without the occurrence
of dryout, at heat loads higher than the value corresponding to the steady-state capillary limit. Furthermore,
the response of the heat pipe to a pulsed heat load above this notional capillary limit is characterized to
assess the thermal signatures of the dryout phenomenon under such transient conditions. A threshold time-
to-dryout corresponding to the applied heating pulse power is identified; pulse durations exceeding time-
to-dryout are shown to cause dryout. Hysteresis in the heat pipe temperature is observed following dryout.
That is, if dryout occurs, the heat load must be reduced to a level significantly lower than the capillary limit
in order to fully recover the original performance.
2. Experimental Setup
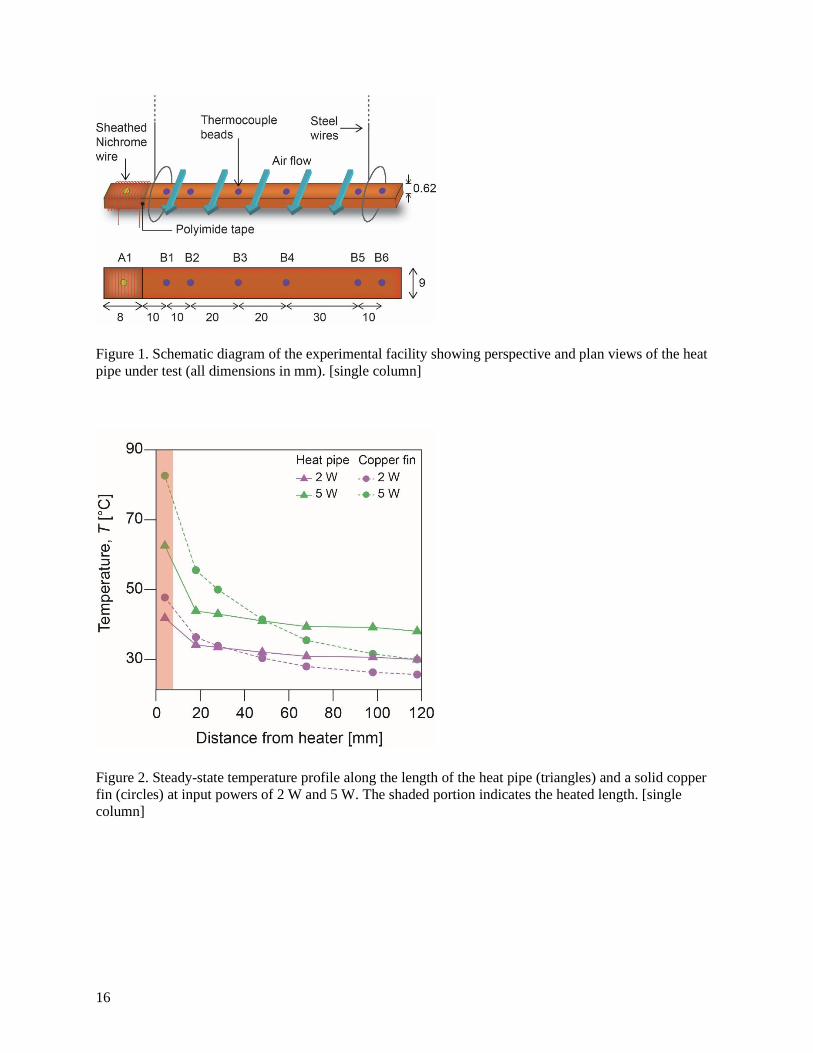
A schematic diagram of the experimental facility used to characterize the heat pipe transient thermal
behavior is shown in Figure 1. The setup was designed to isolate the heat pipe from external components
or materials (such as insulation) that would add thermal capacity and affect the transient thermal response
in an experiment. The heat pipe sample used in this study was 150 mm long, 9 mm wide, and 0.62 mm
thick (Novark Technologies). The two ends of the heat pipe have a solid copper cross section, such that the
effective length of the heat pipe having a vapor core is 120 mm. The heat pipe was suspended in air by
hanging from long, thin steel wires to minimize heat losses through this pathway. The left end of the heat
pipe was covered with a layer of polyimide tape over a length of 8 mm, and a sheathed Nichrome wire
wrapped on top to form a heater. Thermal grease (OMEGATHERM 201) was applied between the heater
wire and polyimide surface. Power input to the heater was controlled using a programmable power supply
(Korad KA3005P) to induce Joule heating. The supply current was calculated by measuring the voltage
drop across a shunt resistor (0.01 ); the voltage drop across the Nichrome wires was measured directly.
5
Temperatures were measured along the length of the heat pipe using T-type thermocouples at the
locations shown in Figure 1. The thermocouple beads labeled B were attached to the outer surface of the
heat pipe using small pieces of copper tape. To measure the temperature at the evaporator, thermocouple
A1 was sandwiched between the polyimide tape and heat pipe surface. The thermocouples were all
calibrated in a dry block calibrator (Jupiter Isotech 4852) using the same procedure that was previously
demonstrated to yield an uncertainty of 0.3 K [35]. The reference temperature for the thermocouples
during the calibration and the experiment was maintained near 0°C using an ice-point reference (OMEGA
CL122). The temperatures of the ice-point junction and the ambient were measured using RTDs.
The temperature measurements were acquired using a data acquisition chassis (National Instruments
(NI) cDAQ–9178) equipped with thermocouple (NI–9214) and RTD (NI–9217) modules. Voltages were
measured using a separate data acquisition unit (NI USB–6255). Data were recorded using a LabVIEW
interface at 4 Hz.
Heat dissipation to the ambient was facilitated by placement of two fans that blow ambient air over the
heat pipe, with the air flow direction as indicated in Figure 1. The heat transfer coefficient via forced
convection cooling was estimated by performing an analogous experiment with a solid copper fin of length
150 mm, width 8.6 mm, and thickness 2.4 mm, and fitting the measured temperature readings to an
analytical solution. The heat transfer coefficient was found to be in the range of 85-110 W/m2-K for input
powers from 1 W to 7 W. This analog experiment also enabled estimation of the net heat input to the fin,
which was found to be in agreement with the measured electrical heat input, showing that the heat loss from
the heater was small. Specifically, the difference between electrical input and measured heat load dissipated
from the fin was ~9% at lower powers (1 W to 2 W), and ~5% at higher powers. Heat losses are therefore
neglected during testing of the heat pipe.
3. Results and Discussion
The following subsections discuss a series of experiments that were performed to identify the response of
a heat pipe subjected to transient heat loads exceeding the capillary limit. Each subsection briefly presents
the experimental test procedure, followed by a detailed discussion of the results.
Prior to investigating the transient thermal response of the heat pipe sample, the steady-state thermal
performance is benchmarked and compared to that of a solid copper fin (150 mm × 8.6 mm × 1.6 mm)
under identical boundary conditions. A given heat load is applied to the sample (heat pipe or copper fin),
and the system is allowed to reach steady state. Steady state is defined as when the standard deviation in
the time-averaged temperature of all thermocouple measurements over 37.5 s is less than ~0.05 °C. Figure
2 shows a comparison of steady-state temperature profiles along the length of the heat pipe and copper fin
6
for two different power levels (2 W and 5 W). The heat source extends from 0 to 8 mm, as indicated by the
shaded region in the figure. The temperatures are obtained from point A1 within the heated region and from
B1 to B6 along the exposed length. At both power levels, the maximum temperature in the heated region
(A1) is lower for the heat pipe as compared to the copper fin, and the temperature profile (B1-B6) is more
uniform. This temperature uniformity over the heat pipe surface is a result of effective heat transport
through the vapor core at a small temperature gradient [36].
The steady-state capillary limit is found by measuring the temperatures along the heat pipe at increasing
heat loads from 1 W to 5.2 W. The heat load is increased in small increments, and the heat pipe is allowed
to reach a steady state at each heat input. When the heat load is increased from 5.1 W to 5.2 W, a sharp
increase in the evaporator temperature and a momentary decrease in condenser temperature is observed,
indicating that a dryout has occurred. Hence, 5.1 W is identified as the maximum heat load that can be
supplied at steady state to the heat pipe sample under the test boundary conditions without the occurrence
of dryout (i.e., it is the steady-state capillary limit of the heat pipe).
3.1 Transient dryout in response to a power pulse exceeding the steady-state capillary limit
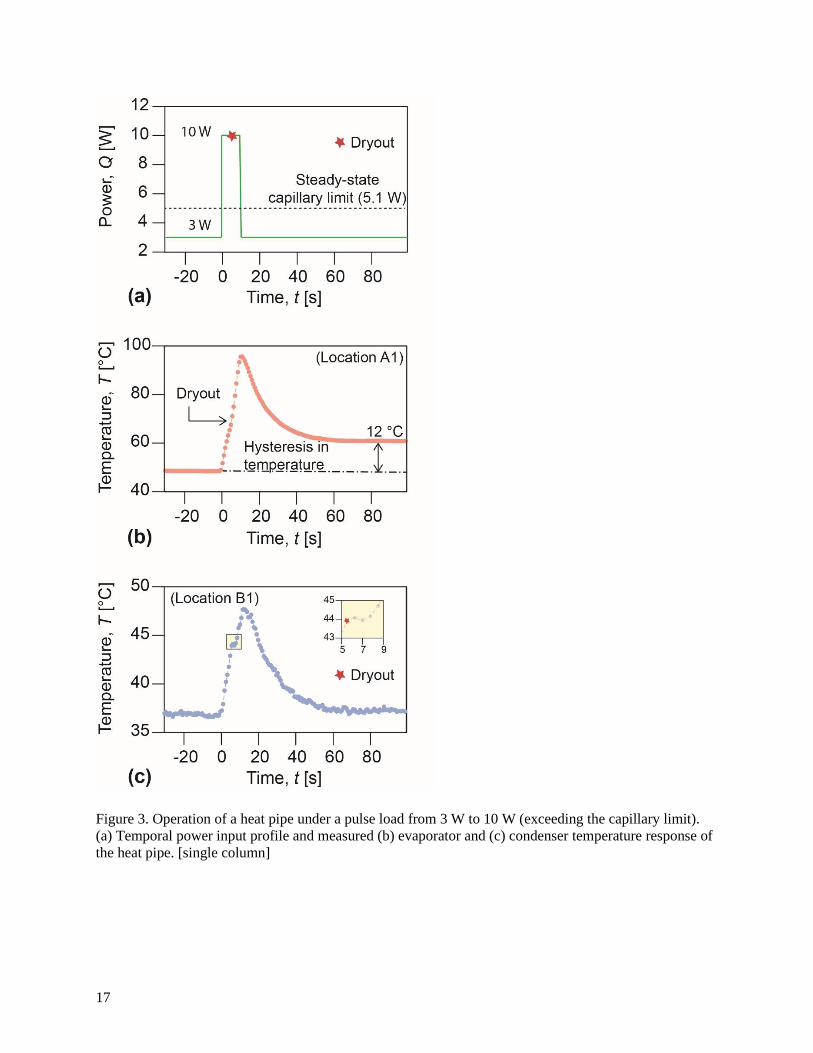
The thermal response of the heat pipe to a power pulse input is shown in Figure 3. The heat pipe is initially
operated at a steady-state power of 3 W, as shown in the temporal heat load profile of Figure 3(a). At t = 0
s, the power input to the heat pipe is suddenly increased to 10 W, which is higher than the measured steady-
state capillary limit (5.1 W). The power input is maintained at 10 W for approximately 10 s, after which it
is reduced to 3 W.
Figure 3(b) shows the corresponding temporal variation in the evaporator temperature at location A1
in response to this transient power pulse. The temperature is initially steady at 48.5 °C when the power
input is 3 W. At t = 0 s, the evaporator experiences a sharp temperature rise due to the increase in power
input to 10 W. The evaporator temperature increases monotonically throughout the 10 s long pulse, during
which an inflection is observed at t = 5.25 s. Appearance of this inflection in the temperature at the
evaporator indicates that a dryout event has occurred due to insufficient liquid supply by capillary action.
A more distinct temperature signature is observed in Figure 3(c), which shows the variation of the condenser
temperature with time. At the start of the power pulse (t = 0 s), the condenser temperature increases
monotonically until t = 5.25 s. At this point in time, the temperature profile begins to flatten out and a
plateau is observed. The temperature dips momentarily, and then starts to increase again. This occurrence
of a plateau in the temperature response at the condenser also indicates the occurrence of dryout. Dryout at
the evaporator is immediately reflected in the condenser temperature response because of the very short
time scales associated with diffusion in the vapor core.
The occurrence of an inflection point in the evaporator temperature at the point of dryout, along with
the plateau in the condenser profile, is attributed to a transition in the primary heat transfer pathway before

7
and after dryout, as discussed further in Ref. [37]. Heat transfer before dryout is primarily due to phase
change at the evaporator, while heat conduction in the wall is the primary heat transfer pathway after dryout.
The time at which dryout occurs, termed here as the time-to-dryout, is 5.25 s from the time the power input
is increased.
At the end of the power pulse, the power input is dropped back to 3 W and the heat pipe is allowed to
reach steady state. The new steady-state evaporator temperature attained by the heat pipe after the power
pulse has ended is a further indication that dryout has occurred during the pulse. It is observed from Figure
3(b) that the steady-state evaporator temperature after the power pulse (t > ~80 s) is ~12 °C higher than the
initial temperature at the same steady power input of 3 W before the pulse input (t < 0 s). We attribute the
presence of this temperature hysteresis to the characteristic hysteresis in the rewetting process of the wick
after a dry patch has formed [38–40]. Thus, we infer that the temperature hysteresis observed before and
after the power pulse (Figure 3(b)) is due to the occurrence of transient dryout of the heat pipe at t = 5.25
s.
3.2 Temperature hysteresis after the occurrence of transient dryout
Hysteresis in the evaporator temperature after a power pulse indicates that a transient dryout event has
occurred in the heat pipe. The dryout occurs due to wick pressure drop exceeding the available capillary
pressure during the power pulse at the time-to-dryout. In this section, the duration of the power pulse is
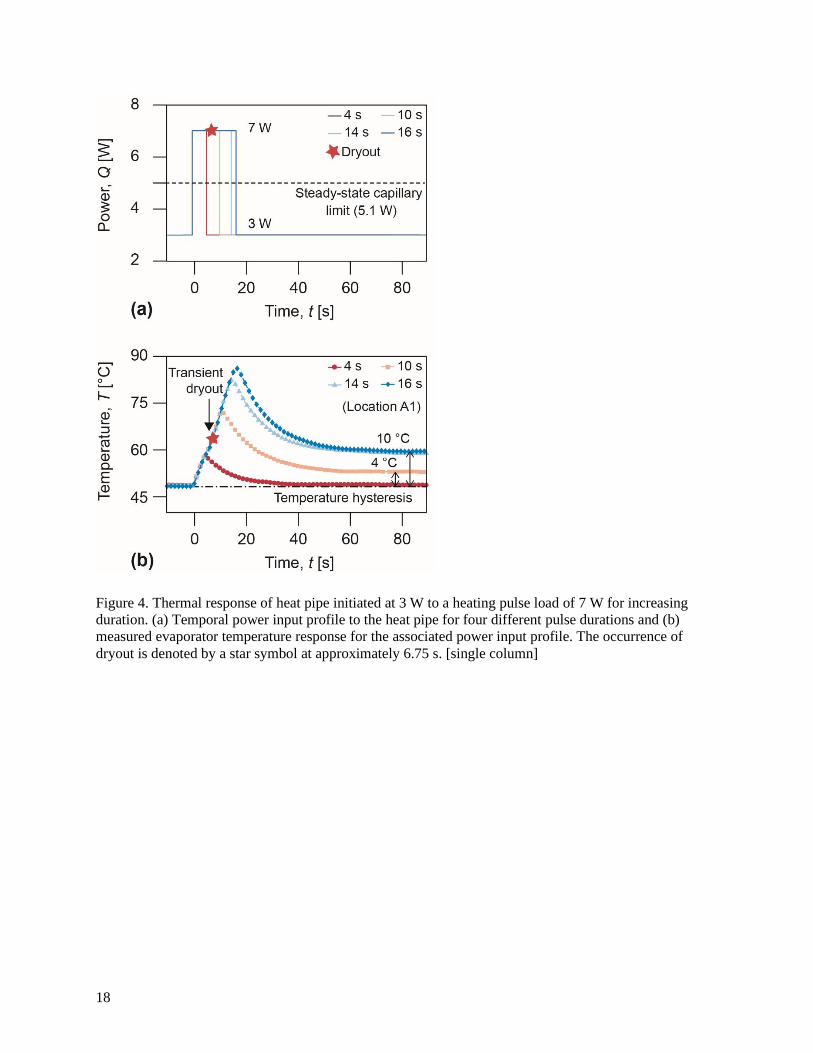
varied to determine its effect on the hysteresis behavior. Figure 4 shows the thermal response of a heat pipe
operated under heating pulse durations of 4 s, 10 s, 14 s, and 16 s. The heat pipe is initialized at a power of
3 W (t < 0), pulsed above the capillary limit to 7 W for the different durations, and reduced back to 3 W, as
shown in the load profiles in Figure 4(a). The evaporator temperature profiles corresponding to each of
these four different pulse durations is plotted in Figure 4(b).
For the shortest 7 W pulse duration of 4 s, no inflection is observed in the evaporator temperature during
the power pulse (blue curve; Figure 4(b)). Moreover, the evaporator temperature does not exhibit any
observable temperature hysteresis after the pulsed loading ends; the steady-state evaporator temperature
measured after the pulse ends and the heat input reverts to 3 W (t > ~40 s) is the same as it was before the
pulse (t < 0). The absence of an inflection in the evaporator temperature during the pulse or of any
temperature hysteresis indicates that the heat pipe did not undergo dryout.
It is noted that the heat pipe operated without the occurrence of dryout or any hysteresis for a brief
period of time at a heat load (7 W) that is higher than the notional steady-state capillary limit (5.1 W). The
ability of the heat pipe to operate above the capillary limit without experiencing dryout results from the lag
between the thermal/hydrodynamic response and the heat increase. Based on the mechanisms governing
transient performance of a heat pipe [32], the effective in-plane diffusivity governs the time required for
the temperature profile to develop at the start of the transient load. A higher in-plane diffusivity would lead

8
to a quicker thermal and hydrodynamic profile development, and thus, a shorter time-to-dryout in response
to a pulse load input.
Whenever the duration of the pulse heat load exceeds the time-to-dryout, the heat pipe undergoes dryout
and exhibits temperature hysteresis at the evaporator upon a return to the lower steady-state heat input.
From Figure 4(b), it is observed that the hysteresis in the evaporator temperature increases in magnitude
with an increase in pulse duration longer than the time-to-dryout. The difference in temperature at the 3 W
input before and after the power pulse is 4 °C for a pulse duration of 10 s, and increases to 10 °C for a pulse
duration of 14 s. However, as the pulse duration further increases, the temperature hysteresis asymptotes
towards a maximum value. With an increase in pulse duration from 14 s and 16 s, the magnitude of
temperature hysteresis remains at ~10 °C, and does not increase any further with longer pulses.
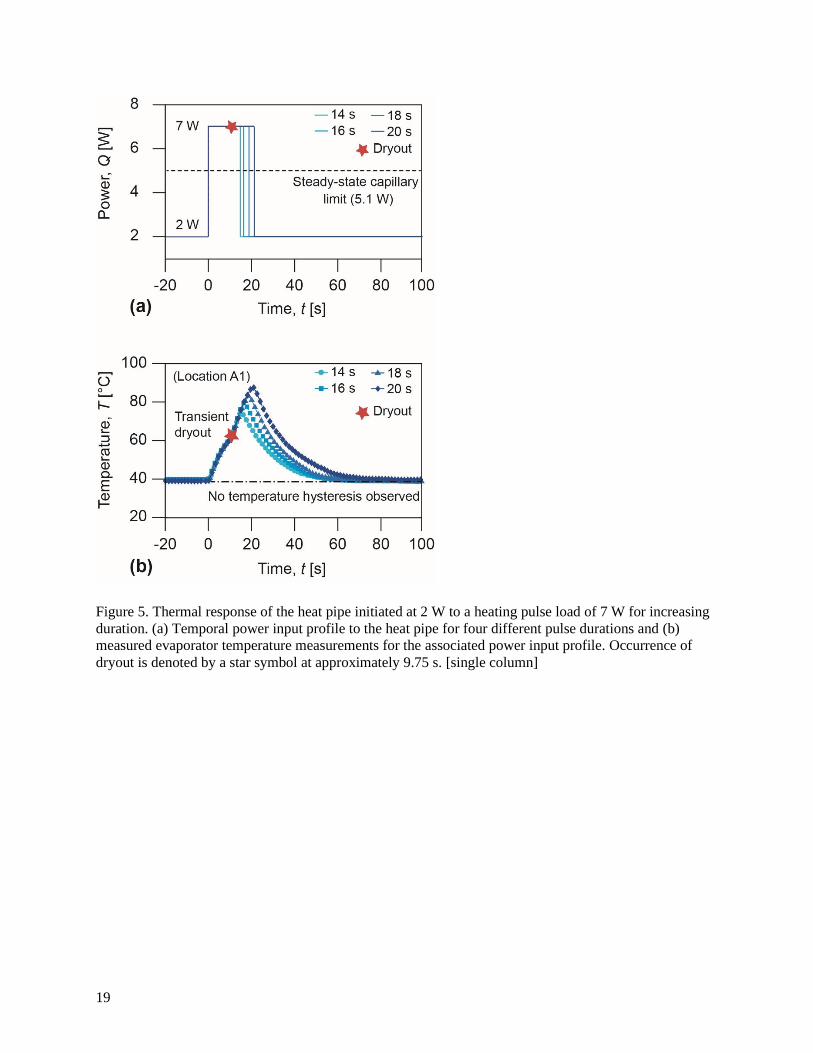
For a heating pulse from a 3 W base to 7 W, evaporator temperature hysteresis was found to occur after
transient dryout. However, the occurrence of a transient dryout is not necessarily accompanied by hysteresis
after the power pulse ends; instead the occurrence of hysteresis depends on the characteristics of the power
pulse. For example, the cases in Figure 5(a) explore a different power pulse profile initialized at a lower
steady-state power input of 2 W (t < 0), and pulsed to the same increased load of 7 W for durations of 14 s,
16 s, 18 s, and 20 s. All of these pulse durations are longer than the time-to-dryout, as Figure 5(b) reveals
an inflection in the evaporator temperature response at t = 9.75 s, the time at which dryout occurs for all
cases. Interestingly, with the lower baseline (steady-state) power of 2 W, the evaporator recovers to the
same temperature after the pulse, without any observable hysteresis in temperature, even though the pulse
duration exceeded the time-to-dryout and transient dryout occurred. The presence of temperature hysteresis
at the baseline load of 3 W, and its absence at 2 W, suggests that the steady-state operating power governs
the recovery of the heat pipe after the dryout. Therefore, the next section investigates the temperature
hysteresis under steady state operation, to probe whether the steady state performance characteristics can
be used to explain the recovery after a transient dryout.
3.3 Post-dryout temperature hysteresis envelope under steady operation
To investigate the steady-state temperature hysteresis behavior of a heat pipe after dryout at the capillary
limit, the heat pipe sample is first subjected to increasing steady power inputs until dryout occurs. During
this powering-up procedure, the heat load is incremented by small, finite amounts; the increment is 0.5 W
at low heat loads (1 W to 4 W) and is reduced to 0.1 W as the heat load approaches the capillary limit of
5.1 W. At each input heat load, the heat pipe is allowed to reach a steady state. After reaching the capillary
limit, the temperature is allowed to reach steady state in the dried-out condition, and the power is further
increased to 5.4 W by a small amount to complete the powering-up procedure. From this dried-out
9
condition above the capillary limit, the heat load to the heat pipe is then decreased from 5.4 W following a
powering-down procedure during which the power is reduced in small decrements back to the initial
condition, again allowing steady state to be reached at each power. Figure 6 traces the variation of the
steady-state evaporator temperature (location A1) with increasing and deceasing input heat load along these
powering-up (black) and powering-down (gray) pathways.
During the powering-up procedure, the evaporator temperature increases with an increase in heat load
(1 W to 5.1 W) as expected. When the heat load is incremented from 5.1 W to 5.2 W, a sharp increase in
evaporator temperature is observed. The steady-state evaporator temperature rises from 58 °C at 5.1 W to
83 °C at 5.2 W. This sharp rise is due to an increase in total thermal resistance of the heat pipe after the
dryout, and indicates that the heat pipe has reached its capillary limit. The hysteresis in the steady-state
evaporator temperature after dryout is clearly evident from Figure 6. During the powering-down trace from
5.4 W, the evaporator has a markedly higher temperature than measured at the same heat loads during the
powering-up trace. This temperature discrepancy (i.e., severity of the temperature hysteresis) gradually
reduces as the heat load is decreased, until there is ultimately no observable temperature difference at a
power of 2 W.
3.4 Discussion
In Section 3.2, we demonstrated that there is significant temperature hysteresis before and after a transient
dryout event when the heat pipe is pulsed from 3 W to a heat load of 7 W (exceeding the capillary limit of
5.1 W), and then returned to 3 W. However, when pulsing to the same 7 W pulse but initialized from a
lower baseline power of 2 W, there is no observable temperature hysteresis after transient dryout. In Section
3.3, the temperature hysteresis after dryout is characterized under steady-state operating conditions by
decreasing the power after the heat pipe has reached its capillary limit. These experiments revealed that the
temperature hysteresis is observed only for heat loads above 2 W. The absence of temperature hysteresis at
2 W – both in cases of dryout caused by a transient power pulse (Figure 5) and when reached by steadily
powering down from above the capillary limit – indicates that the envelope of temperature hysteresis under
steady-state conditions (Figure 6) may serve to bound the input power range in which hysteresis would be
observed after the occurrence of dryout. In addition, the severity of the temperature hysteresis at a given
power appears to be bounded by the steady-state operation of the heat pipe after the capillary limit has been
reached, as illustrated by the magnitude of temperature hysteresis at 3 W. In Figure 6, the magnitude of
temperature difference between the powering-up and powering-down traces at 3 W is ~14 °C. This
temperature difference is comparable to the upper limit of temperature hysteresis (~10 °C) observed after
transient dryout when pulsing from 3 W to a heat load above the capillary limit and returning back to 3 W
(Figure 4).
10
Based on these observations, we speculate that the temperature hysteresis range and severity
(magnitude) in Figure 6, measured at steady-state by incrementally powering down the head load, is a
bounding envelope. Moreover, the maximum heat load for which no hysteresis is observed after steady-
state dryout (~2 W for the present case) represents a critical threshold below which the heat pipe must be
operated in order to recover its original performance, if an unintended transient dryout event were to occur.
4. Conclusions
In this study, we explored the transient response of a heat pipe to pulsed heat load inputs above the notional
capillary limit. From the series of experiments, we conclude that:
1. A heat pipe can operate for brief periods of time at heat loads higher than its capillary limit at steady
state, without the occurrence of dryout.
2. In response to a power pulse exceeding the steady-state capillary limit, we measured a time-to-
dryout at which the heat pipe experiences dryout.
3. Operation longer than the time-to-dryout for a power pulse higher than the capillary limit may lead
to hysteresis in temperature at the evaporator (i.e., the temperature will not recover back to its
original magnitude even after the power is reduced back to the pre-pulse level).
4. The magnitude of temperature hysteresis observed by allowing a heat pipe to reach steady state
after the capillary limit has been exceeded serves as the limiting (maximum) severity for the
temperature hysteresis observed after transient dryout in response to a power pulse.
5. A threshold heat load exists below which the heat pipe does not exhibit any temperature hysteresis
after dryout; this may represent a critical power that the heat pipe must drop below in order to fully
recover performance after a dryout event.
Acknowledgement
Financial support for this work provided by members of the Cooling Technologies Research Center, a
graduated National Science Foundation Industry/University Cooperative Research Center at Purdue
University, is gratefully acknowledged. The heat pipes used for conducting experiments in this work were
supplied by Novark Technologies.
References
11
[1] J.A. Weibel and S.V. Garimella, “Recent Advances in Vapor Chamber Transport Characterization
for High-Heat-Flux Applications,” Advances in Heat Transfer, vol. 45, 2013, pp. 209–301,
DOI:10.1016/B978-0-12-407819-2.00004-9.
[2] X. Chen, H. Ye, X. Fan, T. Ren, and G. Zhang, “A Review of Small Heat Pipes for Electronics,”
Applied Thermal Engineering, vol. 96, 2016, pp. 1–17,
DOI:10.1016/j.applthermaleng.2015.11.048.
[3] H. Tang, Y. Tang, Z. Wan, J. Li, W. Yuan, L. Lu, Y. Li, and K. Tang, “Review of Applications
and Developments of Ultra-Thin Micro Heat Pipes for Electronic Cooling,” Applied Energy, vol.
223, 2018, pp. 383–400, DOI:10.1016/j.apenergy.2018.04.072.
[4] S.W. Chi, Heat pipe theory and practice: a sourcebook, Hemisphere Publishing Corporation,
Washington, DC, 1976.
[5] G. Patankar, J.A. Weibel, and S.V. Garimella, “Working-Fluid Selection for Minimized Thermal
Resistance in Ultra-Thin Vapor Chambers,” International Journal of Heat and Mass Transfer, vol.
106, 2017, pp. 648–654, DOI:10.1016/j.ijheatmasstransfer.2016.09.038.
[6] R. Rullière, F. Lefèvre, and M. Lallemand, “Prediction of the Maximum Heat Transfer Capability
of Two-Phase Heat Spreaders - Experimental validation,” International Journal of Heat and Mass
Transfer, vol. 50, 2007, pp. 1255–1262, DOI:10.1016/j.ijheatmasstransfer.2006.09.015.
[7] R. Savino and D. Paterna, “Marangoni Effect and Heat Pipe Dry-Out,” Physics of Fluids, vol. 18,
2006, p. 118103, DOI:10.1063/1.2397586.
[8] K.H. Do, H.J. Ha, and S.P. Jang, “Thermal Resistance of Screen Mesh Wick Heat Pipes using the
Water-Based Al2O3 Nanofluids,” International Journal of Heat and Mass Transfer, vol. 53, 2010,
pp. 5888–5894, DOI:10.1016/j.ijheatmasstransfer.2010.07.050.
[9] M.A. Hanlon and H.B. Ma, “Evaporation Heat Transfer in Sintered Porous Media,” Journal of
Heat Transfer, vol. 125, 2003, pp. 644–652, DOI:10.1115/1.1560145.
[10] K.R. Chun, “Some Experiments on Screen Wick Dry-Out Limits,” Journal of Heat Transfer, vol.
94, 1972, pp. 46–51, DOI:10.1115/1.3449871.
[11] A. Brautsch and P.A. Kew, “Examination and Visualisation of Heat Transfer Processes during
Evaporation in Capillary Porous Structures,” Applied Thermal Engineering, vol. 22, 2002, pp.
815–824, DOI:10.1016/S1359-4311(02)00027-3.
12
[12] F. Lefèvre and M. Lallemand, “Coupled Thermal and Hydrodynamic Models of Flat Micro Heat
Pipes for the Cooling of Multiple Electronic Components,” International Journal of Heat and
Mass Transfer, vol. 49, 2006, pp. 1375–1383.
[13] R. Revellin, R. Rullière, F. Lefèvre, and J. Bonjour, “Experimental Validation of an Analytical
Model for Predicting the Thermal and Hydrodynamic Capabilities of Flat Micro Heat Pipes,”
Applied Thermal Engineering, vol. 29, 2009, pp. 1114–1122.
[14] J. Rice and A. Faghri, “Analysis of Porous Wick Heat Pipes, Including Capillary Dry-Out
Limitations,” ASME 2005 International Mechanical Engineering Congress and Exposition,
Orlando, Florida, USA: 2005, pp. 595–607.
[15] D.A. Pruzan, L.K. Klingensmith, K.E. Torrance, and C.T. Avedisian, “Design of High-
Performance Sintered-Wick Heat Pipes,” International Journal of Heat and Mass Transfer, vol.
34, 1991, pp. 1417–1427.
[16] N. Zhu and K. Vafai, “Analysis of Cylindrical Heat Pipes Incorporating the Effects of Liquid–
Vapor Coupling and non-Darcian Transport—a Closed Form Solution,” International Journal of
Heat and Mass Transfer, vol. 42, 1999, pp. 3405–3418.
[17] H. Shabgard and A. Faghri, “Performance Characteristics of Cylindrical Heat Pipes with Multiple
Heat Sources,” Applied Thermal Engineering, vol. 31, 2011, pp. 3410–3419.
[18] R. Kempers, D. Ewing, and C.Y. Ching, “Effect of Number of Mesh Layers and Fluid Loading on
the Performance of Screen Mesh Wicked Heat Pipes,” Applied Thermal Engineering, vol. 26,
2006, pp. 589–595, DOI:10.1016/j.applthermaleng.2005.07.004.
[19] S. Lips, F. Lefèvre, and J. Bonjour, “Combined Effects of the Filling Ratio and the Vapour Space
Thickness on the Performance of a Flat Plate Heat Pipe,” International Journal of Heat and Mass
Transfer, vol. 53, 2010, pp. 694–702, DOI:10.1016/j.ijheatmasstransfer.2009.10.022.
[20] K. Baraya, J.A. Weibel, and S.V. Garimella, “Simultaneous Wick and Fluid Selection for the
Design of Minimized- Thermal-Resistance Vapor Chambers under Different Operating
Conditions,” International Journal of Heat and Mass Transfer, vol. 136, 2019, pp. 842–850,
DOI:10.1016/j.ijheatmasstransfer.2019.03.025.
[21] A. Shye, B. Scholbrock, and G. Memik, “Into the Wild : Studying Real User Activity Patterns to
Guide Power Optimizations for Mobile Architectures Categories and Subject Descriptors,” 2009
42nd Annual IEEE/ACM International Symposium on Microarchitecture (MICRO), New York,
13
New York, USA: 2009, pp. 168–178, DOI:10.1145/1669112.1669135.
[22] H. Falaki, D. Lymberopoulos, R. Mahajan, S. Kandula, and D. Estrin, “A First Look at Traffic on
Smartphones,” Proceedings of the 10th ACM SIGCOMM Conference on Internet Measurement,
Melbourne, Australia: ACM, 2010, pp. 281–287.
[23] D. Ferreira, J. Goncalves, V. Kostakos, L. Barkhuus, and A. Dey, “Contextual Experience
Sampling of Mobile Application Micro-Usage,” Proceedings of the 16th International Conference
on Human-Computer Interaction with Mobile Devices & Services, Toronto, Canada: ACM, 2014,
pp. 91–100.
[24] B.J. Jansen, A. Spink, and T. Saracevic, “Real Life, Real Users, and Real Needs: a Study and
Analysis of User Queries on the Web,” Information Processing and Management, vol. 36, 2000,
pp. 207–227.
[25] M. Cha, P. Rodriguez, J. Crowcroft, S. Moon, and X. Amatriain, “Watching Television Over an IP
Network,” Proceedings of the 8th ACM SIGCOMM Conference on Internet Measurement, New
York, New York, USA: ACM, 2008, pp. 71–84.
[26] R. Viswanath, V. Wakharkar, A. Watwe, and V. Lebonheur, “Thermal Performance Challenges
from Silicon to Systems,” Intel Techology Journal Q3, 2000.
[27] T. Yan, D. Chu, D. Ganesan, A. Kansal, and J. Liu, “Fast App Launching for Mobile Devices
using Predictive User Context,” Proceedings of the 10th International Conference on Mobile
Systems, Applications, and Services, Low Wood Bay, Lake District, UK: ACM, 2012, pp. 113–
126.
[28] J.M. Tournier and M.S. El-Genk, “A Heat Pipe Transient Analysis Model,” International Journal
of Heat and Mass Transfer, vol. 37, 1994, pp. 753–762, DOI:10.1016/0017-9310(94)90113-9.
[29] Y. Wang and K. Vafai, “An Experimental Investigation of the Thermal Performance of an
Asymmetrical Flat Plate Heat Pipe,” International Journal of Heat and Mass Transfer, vol. 43,
2000, pp. 2657–2668, DOI:10.1016/S0017-9310(99)00300-2.
[30] Y. Wang and K. Vafai, “Transient Characterization of Flat Plate Heat Pipes During Startup and
Shutdown Operations,” International Journal of Heat and Mass Transfer, vol. 43, 2000, pp. 2641–
2655, DOI:10.1016/S0017-9310(99)00295-1.
[31] S. Harmand, R. Sonan, M. Fakès, and H. Hassan, “Transient Cooling of Electronic Components
by Flat Heat Pipes,” Applied Thermal Engineering, vol. 31, 2011, pp. 1877–1885.
14
[32] G. Patankar, J.A. Weibel, and S.V. Garimella, “On the Transient Thermal Response of Thin Vapor
Chamber Heat Spreaders: Governing Mechanisms and Performance Relative to Metal Spreaders,”
International Journal of Heat and Mass Transfer, vol. 136, 2019, pp. 995–1005.
[33] G. Patankar, J.A. Weibel, and S.V. Garimella, “A Validated Time-Stepping Analytical Model for
3D Transient Vapor Chamber Transport,” International Journal of Heat and Mass Transfer, vol.
119, 2018, pp. 867–879, DOI:10.1016/j.ijheatmasstransfer.2017.11.135.
[34] Y. Xuan, Y. Hong, and Q. Li, “Investigation on Transient Behaviors of Flat Plate Heat Pipes,”
Experimental Thermal and Fluid Science, vol. 28, 2004, pp. 249–255.
[35] G. Patankar, S. Mancin, J.A. Weibel, S.V. Garimella, and M.A. MacDonald, “A Method for
Thermal Performance Characterization of Ultrathin Vapor Chambers Cooled by Natural
Convection,” Journal of Electronic Packaging, vol. 138, 2016, p. 010903,
DOI:10.1115/1.4032345.
[36] I. Sauciuc, G. Chrysler, R. Mahajan, and R. Prasher, “Spreading in the Heat Sink Base: Phase
Change Systems or Solid Metals??,” IEEE Transactions on Components and Packaging
Technologies, vol. 25, 2002, pp. 621–628, DOI:10.1109/TCAPT.2002.807994.
[37] K. Baraya, J.A. Weibel, and S.V. Garimella, “Experimental Demonstration of Heat Pipe Operation
beyond the Capillary Limit during Brief Transient Heat Loads,” Proceedings of the 18th
InterSociety Conference on Thermal and Thermomechanical Phenomena in Electronic Systems,
ITherm 2019, Las Vegas, NV, USA: 2019.
[38] Q. Cai and Y.-C. Chen, “Investigations of Biporous Wick Structure Dryout,” Journal of Heat
Transfer, vol. 134, 2012, p. 021503, DOI:10.1115/1.4005099.
[39] C. Li and G.P. Peterson, “Evaporation/Boiling in Thin Capillary Wicks (II)—Effects of
Volumetric Porosity and Mesh Size,” Journal of Heat Transfer, 2006, DOI:10.1115/1.2349508.
[40] M.P. Mughal and O.A. Plumb, “An Experimental Study of Boiling on a Wicked Surface,”
International Journal of Heat and Mass Transfer, vol. 39, 1996, pp. 771–777.
15
List of figures:
Figure 1. Schematic diagram of the experimental facility showing perspective and plan views of the heat
pipe under test (all dimensions in mm). [single column]
Figure 2. Steady-state temperature profile along the length of the heat pipe (triangles) and a solid copper
fin (circles) at input powers of 2 W and 5 W. The shaded portion indicates the heated length. [single
column]
Figure 3. Operation of a heat pipe under a pulse load from 3 W to 10 W (exceeding the capillary limit).
(a) Temporal power input profile and measured (b) evaporator and (c) condenser temperature response of
the heat pipe. [single column]
Figure 4. Thermal response of heat pipe initiated at 3 W to a heating pulse load of 7 W for increasing
duration. (a) Temporal power input profile to the heat pipe for four different pulse durations and (b)
measured evaporator temperature response for the associated power input profile. The occurrence of
dryout is denoted by a star symbol at approximately 6.75 s. [single column]
Figure 5. Thermal response of the heat pipe initiated at 2 W to a heating pulse load of 7 W for increasing
duration. (a) Temporal power input profile to the heat pipe for four different pulse durations and (b)
measured evaporator temperature measurements for the associated power input profile. Occurrence of
dryout is denoted by a star symbol at approximately 9.75 s. [single column]
Figure 6. Steady-state evaporator temperature measured for different heat loads. The temperature is
plotted for powering up (increasing power) past the capillary limit, and powering down (decreasing
power) after dryout. [single column]
16
Figure 1. Schematic diagram of the experimental facility showing perspective and plan views of the heat
pipe under test (all dimensions in mm). [single column]
Figure 2. Steady-state temperature profile along the length of the heat pipe (triangles) and a solid copper
fin (circles) at input powers of 2 W and 5 W. The shaded portion indicates the heated length. [single
column]
17
Figure 3. Operation of a heat pipe under a pulse load from 3 W to 10 W (exceeding the capillary limit).
(a) Temporal power input profile and measured (b) evaporator and (c) condenser temperature response of
the heat pipe. [single column]
18
Figure 4. Thermal response of heat pipe initiated at 3 W to a heating pulse load of 7 W for increasing
duration. (a) Temporal power input profile to the heat pipe for four different pulse durations and (b)
measured evaporator temperature response for the associated power input profile. The occurrence of
dryout is denoted by a star symbol at approximately 6.75 s. [single column]
19
Figure 5. Thermal response of the heat pipe initiated at 2 W to a heating pulse load of 7 W for increasing
duration. (a) Temporal power input profile to the heat pipe for four different pulse durations and (b)
measured evaporator temperature measurements for the associated power input profile. Occurrence of
dryout is denoted by a star symbol at approximately 9.75 s. [single column]

20
Figure 6. Steady-state evaporator temperature measured for different heat loads. The temperature is
plotted for powering up (increasing power) past the capillary limit, and powering down (decreasing
power) after dryout. [single column]