Embed Size (px)
Citation preview

Ž .Biophysical Chemistry 93 2001 215�230
Heat does not come in different colours:entropy�enthalpy compensation, free energy windows,
quantum confinement, pressure perturbationcalorimetry, solvation and the multiple causes of heat
capacity effects in biomolecular interactions
Alan Coopera,�1, Christopher M. Johnsonb, Jeremy H. Lakey c,Marcelo Nollmanna¨
aDepartment of Chemistry, Joseph Black Building, Uni�ersity of Glasgow, Glasgow G12 8QQ, Scotland, UKbMRC Centre for Protein Engineering, Hills Road, Cambridge, CB2 2QH, UK
cDepartment of Biochemistry and Genetics, The Medical School, Uni�ersity of Newcastle-upon-Tyne, Newcastle-upon-Tyne,NE2 4HH, UK
Received 23 March 2001; accepted 3 May 2001
Abstract
Modern techniques in microcalorimetry allow us to measure directly the heat changes and associated thermody-namics for biomolecular processes in aqueous solution at reasonable concentrations. All these processes involvechanges in solvation�hydration, and it is natural to assume that the heats for these processes should reflect, in someway, such changes in solvation. However, the interpretation of data is still somewhat ambiguous, since differentnon-covalent interactions may have similar thermodynamic signatures, and analysis is frustrated by large entropy�
Ž .enthalpy compensation effects. Changes in heat capacity �C have been related to changes in hydrophobicphydration and non-polar accessible surface areas, but more recent empirical and theoretical work has shown how thisneed not always be the case. Entropy�enthalpy compensation is a natural consequence of finite �C values and,pmore generally, can arise as a result of quantum confinement effects, multiple weak interactions, and limited freeenergy windows, giving rise to thermodynamic homeostasis that may be of evolutionary and functional advantage.
� Corresponding author. Tel.: �44-141-330-5278; fax: �44-141-330-2910.Ž .E-mail address: [email protected] A. Cooper .
1 www: http:��www.chem.gla.ac.uk�staff�alanc�
0301-4622�01�$ - see front matter � 2001 Elsevier Science B.V. All rights reserved.Ž .PII: S 0 3 0 1 - 4 6 2 2 0 1 0 0 2 2 2 - 8
( )A. Cooper et al. � Biophysical Chemistry 93 2001 215�230216
Ž .The new technique of pressure perturbation calorimetry PPC has enormous potential here as a means of probingsolvation-related volumetric changes in biomolecules at modest pressures, as illustrated with preliminary data for asimple protein-inhibitor complex. � 2001 Elsevier Science B.V. All rights reserved.
Keywords: Microcalorimetry; Heat changes; Thermodynamics
1. Introduction
Modern techniques in microcalorimetry allowus to directly measure the heat changes and asso-ciated thermodynamics for biomolecular processesin aqueous solution at reasonable concentrations.
Ž .Using isothermal titration microcalorimetry ITCwe can directly probe the thermodynamics ofprotein�ligand, protein�protein, and protein�DNA interactions for example. Using differential
Ž .scanning calorimetry DSC we can observe theheat energy uptake in processes such as proteinunfolding and helix-coil transitions. All theseprocesses involve changes in solvation�hydration,and it is natural to assume that the heats forthese processes should reflect, in some way, suchchanges in solvation. However, the interpretation
� �of data is still somewhat ambiguous 1,2 . Theproblem arises because there is no characteristicthermal signature of the different kinds of non-covalent interactions and associated solvation ef-fects responsible for biomolecular stability andinteractions. A typical system comprises a multi-tude of weakly interacting groups, involving inter-actions variously described in terms of hydrogenbonding, van der Waals�dispersion forces, hy-drophobic, and other polar and non-polar ther-modynamic interactions in which the dynamics ofsolvent molecules are intimately involved. Dif-ferent contributions may be endothermic or ex-othermic, depending on circumstances, and thereare no straightforward ways of dissecting out theindividual contributions. Moreover, the individual
Ž . Ž .enthalpic � H and entropic �S contributionscan vary enormously, but often in a compensatoryfashion, to give relatively smaller variations in the
Ž .free energy �G that ultimately determines thethermodynamic stability of any process. Such en-tropy�enthalpy compensation is a source of con-siderable frustration in the thermodynamic un-derstanding of macromolecular interactions. Here
we will review briefly the calorimetric backgroundand discuss a number of fundamental reasonswhy such entropy�enthalpy compensation and re-lated thermodynamic properties are inevitable insystems such as these. We shall also present pre-liminary data using the new technique of pressure
Ž .perturbation calorimetry PPC that might helpresolve some of the ambiguities.
2. Microcalorimetry: the thermodynamics ofprotein stability and interaction
Typical experimental data from differentialŽ . Ž .scanning DSC and isothermal titration ITC
calorimetry are given in Figs. 1 and 2, illustratingthe kind of measurements now routinely possiblefor biomolecules in solution. DSC is useful for
� �investigating thermal transitions in solution 3,4and has been widely applied to study the thermo-
� �dynamics of protein folding 5 . In favourablecircumstances, unfolding transitions with proteinconcentrations as low as 0.2 mg�ml may be mea-sured, and for simple cooperative reversibleprocesses the complete thermodynamics of the
Ž .transition may be obtained Fig. 3a . ITC directlymeasures the heats changes upon addition of
Ž .small volumes 5�10 �l of one solution to an-Ž .other in the calorimetric cell 1�2 ml , and is
typically used to study protein�ligand binding or� �protein�protein interactions 6�8 . In dilution
mode it may also be used to determinemonomer�dimer or oligomer�dissociation equi-
� � Ž .librium parameters 9 . Since almost all interac-tion processes involve heat change in one form orother, ITC may be applied simply as a convenient,non-invasive, non-destructive analytical method
Ž .for determining binding stoichiometry n andŽ .affinity K . But in addition, for those interested
in the fundamental thermodynamics of such
( )A. Cooper et al. � Biophysical Chemistry 93 2001 215�230 217
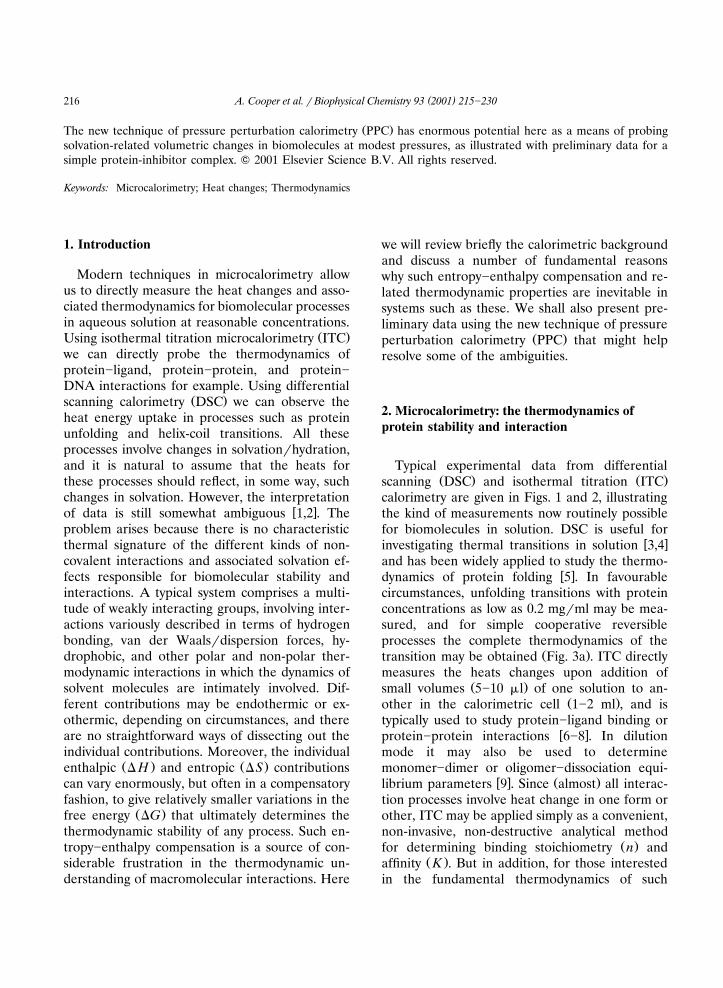
Fig. 1. Typical DSC data for the unfolding of a small globularŽ .protein lysozyme in solution at various pH values. The insert
Ž .shows the variation in mid-point unfolding temperature Tmas a function of pH. The increase in area under each en-dotherm with higher T , and the higher heat capacity base-mlines after the unfolding transitions, are both indications ofthe significant positive �C commonly associated with suchpprocesses.
Ž .processes, it yields enthalpy data � H which,Ž .together with free energy �G���RT ln K , al-Ž .lows calculation of entropy �S� and, given tem-
perature dependent data, the heat capacity changeŽ .�C for the process as well. Typical thermody-pnamic data for a protein�protein interaction are
Ž � �.illustrated in Fig. 3b see, e.g. 10�12 . All theseexamples illustrate the strong temperature depen-dence of both � H and �S, a consequence of thelarge �C effects that are a common feature ofpmany biomolecular and other interactions in solu-tion. Despite such large variations in entropy andenthalpy, the free energy change upon whichequilibrium stability ultimately depends is rela-tively much less affected. This almost ubiquitous
Ž .‘entropy�enthalpy compensation’ see belowleads to considerable difficulty in rationalising thelarge number of quite detailed studies involvingcareful mutagenesis and structural analysis in
� �terms of the underlying thermodynamic forces 2 .
3. The origins of ubiquitous entropy–enthalpycompensation
Entropy�enthalpy compensation effects havebeen noted in many earlier studies, with the par-ticular significance in biomolecular systems high-lighted by the classic work of Lumry and Rajen-
� �der 13 , and the phenomenon has given rise toŽmuch subsequent discussion summarised re-
� �.cently in 14 . This substantial body of workŽ .shows how large changes in enthalpy � H and
Ž .entropy �S with variation of experimental con-Ž .ditions particularly temperature frequently ap-
Fig. 2. Typical ITC data for binding of a trisaccharide inhibi-Ž .tor tri-N-acetyl-glucosamine; tri-NAG to hen egg white
lysozyme, in 0.1 M acetate buffer, pH 5. Each exothermic heatŽ .pulse upper panel corresponds to injection of 10 �l of
Ž . Ž .tri-NAG 0.45 mM into the protein solution 36 �M . Inte-Ž .grated heat data lower panel constitute a differential binding
curve that may be fit to a standard single-site binding model togive, in this instance, the stoichiometry of binding, N�0.99,
5 �1 Ž .binding affinity, K �3.9�10 M K �2.6 �M , andass dissenthalpy of binding, � H��51.7 kJ mol�1.
( )A. Cooper et al. � Biophysical Chemistry 93 2001 215�230218
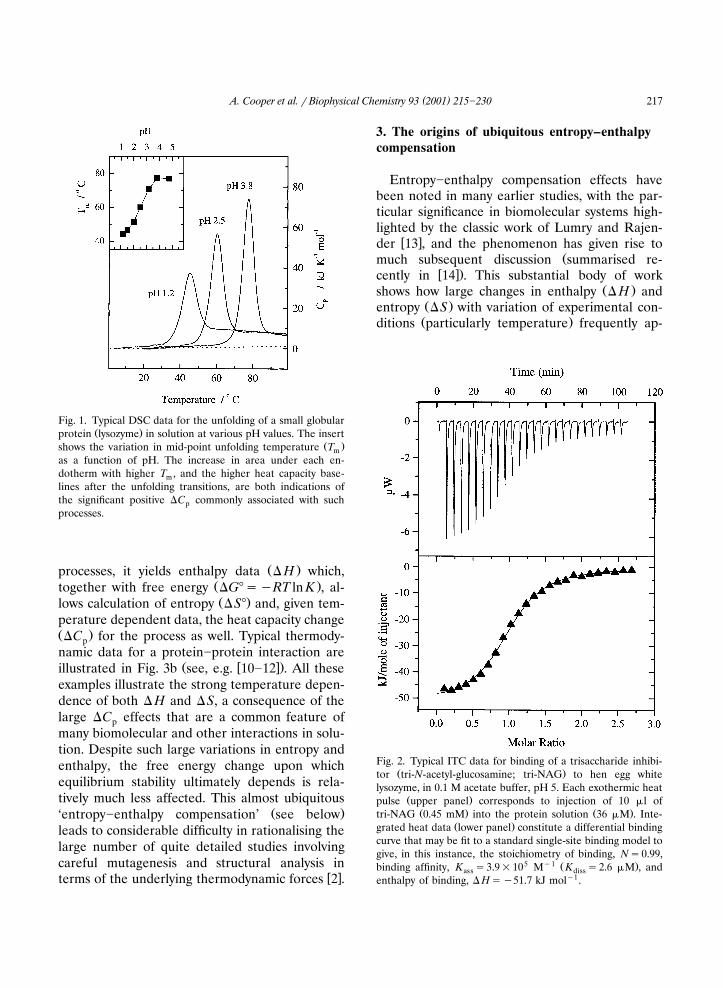
Fig. 3. Typical thermodynamic parameters as a function of temperature for biomolecular processes determined by microcalorime-Ž . Ž . Ž . Ž .try. a Free energy �G� , enthalpy � H and entropy T�S� of unfolding in solution of a typical globular protein, withunf unf unf
heat capacity increment upon infolding, �C �9 kJ K�1 mol�1. The free energy data are also shown expanded in the upper panel,pŽ . Ž . Ž . Ž .for clarity. b Free energy �G� , enthalpy � H and entropy T�S� of association interaction between protein subunits inass ass ass
Ž .solution. In this case the strong temperature dependence of the enthalpy heat of binding corresponds to a �C value of �1.9 kJp�1 �1 � �K mol , typical of many such interactions 10�12 , and shows how the enthalpy may even change sign, being endothermic at low
temperatures but exothermic at higher temperatures.
pear to be correlated in such a manner as tocompensate and give comparatively smaller
Ž .changes in Gibbs free energy �G�� H�T�Sfor the process. The effect is seen in numeroussystems, but is particularly apparent in aqueoussystems where non-covalent interactions domi-nate. Early work suggested that such correlationsmight arise as artefacts of inappropriate analysisof experimental data, particularly when using in-direct methods, such as van’t Hoff analysis of thetemperature dependence of equilibrium con-stants, to determine � H and �S, but more directcalorimetric measurements now possible show the
� �same phenomenon. More recently, Dunitz 15has shown how compensation can be a naturalconsequence of perturbation of any system com-prising a multiplicity of weak non-covalent inter-actions, of which macromolecular systems in wa-ter are just one example. We shall show belowhow this comes about. In this section we examinethis and other quite general sources ofentropy�enthalpy compensation.
3.1. ‘Free energy windows’
Perhaps one of the most surprising aspects ofentropy�enthalpy compensation is the way inwhich it appears even between apparently chemi-cally unrelated species. Our attention was firstdrawn to this when attempting to rationalise thethermodynamic data obtained from calorimetricmeasurements on protein�protein interactions in
� �the colicin�porin system 16�18 . These studiesinvolved numerous site-directed mutants and pro-tein fragments, and gave a wide range of bindingenthalpies and entropies that proved impossibleto rationalise in straightforward structural terms.Despite this, there appeared to be a clear correla-tion between � H and �S of binding obtained for
Ž .the different species Fig. 4 , suggesting someunderlying thermodynamic principle. Even moresurprising was the observation that this apparentcorrelation extended to a much wider range of
Žmolecules and different kinds of interaction Fig.
( )A. Cooper et al. � Biophysical Chemistry 93 2001 215�230 219
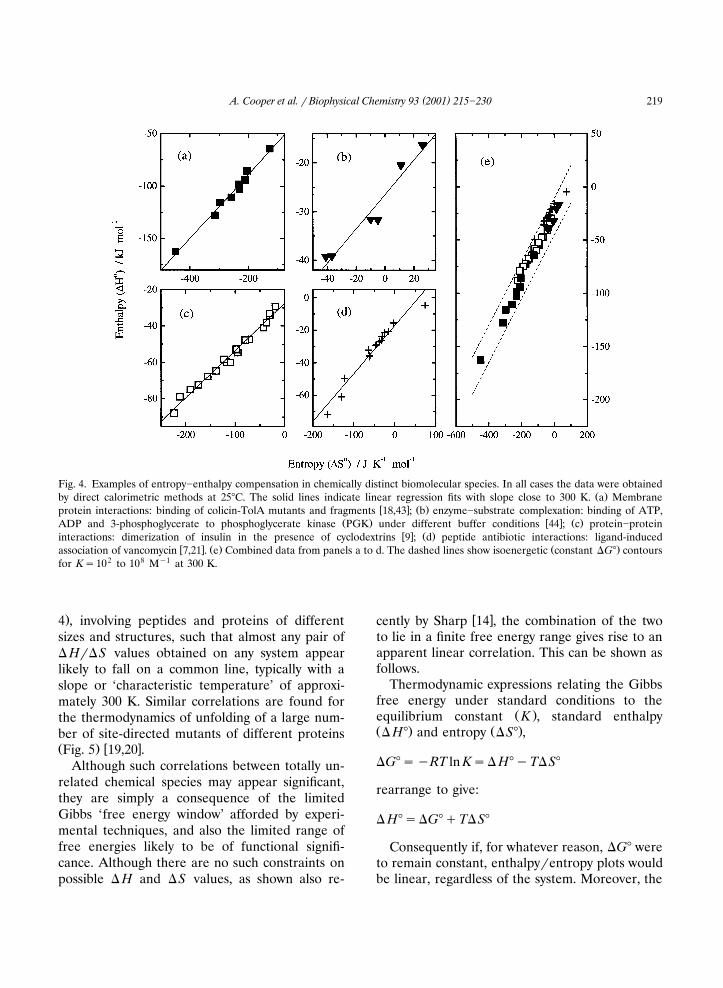
Fig. 4. Examples of entropy�enthalpy compensation in chemically distinct biomolecular species. In all cases the data were obtainedŽ .by direct calorimetric methods at 25�C. The solid lines indicate linear regression fits with slope close to 300 K. a Membrane
� � Ž .protein interactions: binding of colicin-TolA mutants and fragments 18,43 ; b enzyme�substrate complexation: binding of ATP,Ž . � � Ž .ADP and 3-phosphoglycerate to phosphoglycerate kinase PGK under different buffer conditions 44 ; c protein�protein
� � Ž .interactions: dimerization of insulin in the presence of cyclodextrins 9 ; d peptide antibiotic interactions: ligand-induced� � Ž . Ž .association of vancomycin 7,21 . e Combined data from panels a to d. The dashed lines show isoenergetic constant �G� contours
for K�102 to 108 M�1 at 300 K.
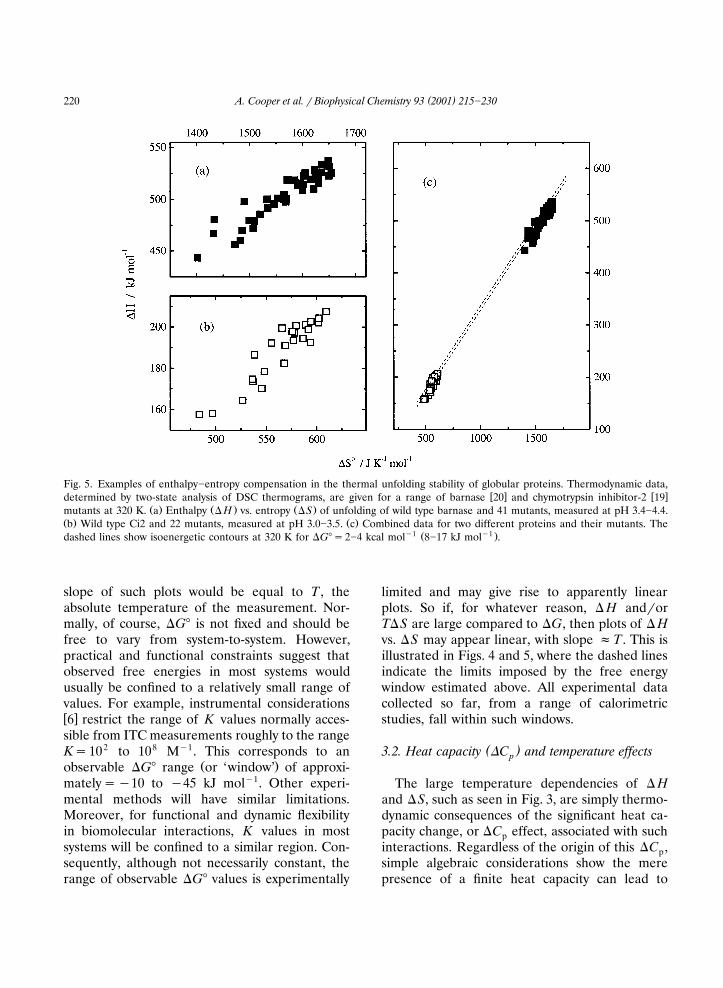
.4 , involving peptides and proteins of differentsizes and structures, such that almost any pair of� H��S values obtained on any system appearlikely to fall on a common line, typically with aslope or ‘characteristic temperature’ of approxi-mately 300 K. Similar correlations are found forthe thermodynamics of unfolding of a large num-ber of site-directed mutants of different proteinsŽ . � �Fig. 5 19,20 .
Although such correlations between totally un-related chemical species may appear significant,they are simply a consequence of the limitedGibbs ‘free energy window’ afforded by experi-mental techniques, and also the limited range offree energies likely to be of functional signifi-cance. Although there are no such constraints onpossible � H and �S values, as shown also re-
� �cently by Sharp 14 , the combination of the twoto lie in a finite free energy range gives rise to anapparent linear correlation. This can be shown asfollows.
Thermodynamic expressions relating the Gibbsfree energy under standard conditions to the
Ž .equilibrium constant K , standard enthalpyŽ . Ž .� H� and entropy �S� ,
�G���RT ln K�� H��T�S�
rearrange to give:
� H���G��T�S�
Consequently if, for whatever reason, �G� wereto remain constant, enthalpy�entropy plots wouldbe linear, regardless of the system. Moreover, the
( )A. Cooper et al. � Biophysical Chemistry 93 2001 215�230220
Fig. 5. Examples of enthalpy�entropy compensation in the thermal unfolding stability of globular proteins. Thermodynamic data,� � � �determined by two-state analysis of DSC thermograms, are given for a range of barnase 20 and chymotrypsin inhibitor-2 19
Ž . Ž . Ž .mutants at 320 K. a Enthalpy � H vs. entropy �S of unfolding of wild type barnase and 41 mutants, measured at pH 3.4�4.4.Ž . Ž .b Wild type Ci2 and 22 mutants, measured at pH 3.0�3.5. c Combined data for two different proteins and their mutants. The
�1 Ž �1 .dashed lines show isoenergetic contours at 320 K for �G��2�4 kcal mol 8�17 kJ mol .
slope of such plots would be equal to T , theabsolute temperature of the measurement. Nor-mally, of course, �G� is not fixed and should befree to vary from system-to-system. However,practical and functional constraints suggest thatobserved free energies in most systems wouldusually be confined to a relatively small range ofvalues. For example, instrumental considerations� �6 restrict the range of K values normally acces-sible from ITC measurements roughly to the rangeK�102 to 108 M�1. This corresponds to an
Ž .observable �G� range or ‘window’ of approxi-mately��10 to �45 kJ mol�1. Other experi-mental methods will have similar limitations.Moreover, for functional and dynamic flexibilityin biomolecular interactions, K values in mostsystems will be confined to a similar region. Con-sequently, although not necessarily constant, therange of observable �G� values is experimentally
limited and may give rise to apparently linearplots. So if, for whatever reason, � H and�orT�S are large compared to �G, then plots of � Hvs. �S may appear linear, with slope �T. This isillustrated in Figs. 4 and 5, where the dashed linesindicate the limits imposed by the free energywindow estimated above. All experimental datacollected so far, from a range of calorimetricstudies, fall within such windows.
( )3.2. Heat capacity �C and temperature effectsp
The large temperature dependencies of � Hand �S, such as seen in Fig. 3, are simply thermo-dynamic consequences of the significant heat ca-pacity change, or �C effect, associated with suchpinteractions. Regardless of the origin of this �C ,psimple algebraic considerations show the merepresence of a finite heat capacity can lead to
( )A. Cooper et al. � Biophysical Chemistry 93 2001 215�230 221
entropy�enthalpy compensation effects with� �change in temperature 21 . Recall that the varia-
tion of � H and �S with respect to some ar-bitrary reference temperature T is given by therefintegral relationships:
TŽ . Ž .� H T �� H T � �C dTHref pTref
TŽ . Ž . Ž .�S T ��S T � �C �T dTHref pTref
If �C is constant, independent of temperaturepŽnot necessarily true, but usually a reasonable
.approximation over a limited temperature range ,then integration gives:
Ž . Ž . Ž .� H T �� H T ��C T�Tref p ref
Ž . Ž . Ž .�S T ��S T ��C ln T�Tref p ref
For small changes in temperature with respectto absolute T , �T�T�T , these become:ref ref
Ž . Ž .� H T �� H T ��C �Tref p
Ž . Ž . Ž .�S T ��S T ��C ln 1��T�Tref p ref
Ž .��S T 1��C �T�Tref p ref
Ž .using the approximation ln 1�x �x, for x�1.Consequently, to the extent that this approxima-tion is valid:
Ž .�G T �� H�T�S
Ž . Ž . 2�� H T �T�S T ��C �T �Tref ref p ref
Ž .��G Tref
to first order in �T. Moreover, over a limitedtemperature range for which this approximationis valid:
Ž . Ž . Ž Ž ..� H T �� H T �T �S��S Tref ref ref
so that a plot of � H vs. �S would appear linearwith slope T .ref
3.3. Cooperati�ity and multiple weak interactions
But this begs the question: why is �C so largepin bio�macromolecular systems? Conventionally,large �C effects are associated with hydrophobicp
� �interactions 22,23 , and the magnitude of �Cpcan be correlated with changes in solvent accessi-
Ž .ble surface areas �ASA in protein folding and� �other interaction processes 24,25 . But the wider
applicability of such �C ��ASA correlations isp� �now being questioned 10,26�28 . Moreover,
� �Dunitz 15 has shown how such effects are ex-pected for any system made up of a multiplicity ofweak interactions, of which hydrophobic interac-tions are just a special case. More recently, wehave shown how similar �C effects may be asso-pciated with cooperative hydrogen-bonded net-
� �works 29 .This can be seen quite generally as follows.
Ž .Any bio macromolecular transition, such as theunfolding of a globular protein or the dissociationof two subunits, will normally involve the break-ing of a cooperative network of interactions thatare then replaced by a much less cooperative setof interactions with solvent molecules. The inter-actions will generally be of a similar type and
Žstrength weak van der Waals, hydrogen bonds,.etc. , the major difference being that they act
cooperatively in one state and less so in the other.This can be treated theoretically using classical
� �lattice theories of statistical thermodynamics 30 ,which are also applicable to protein transitions� �31 .
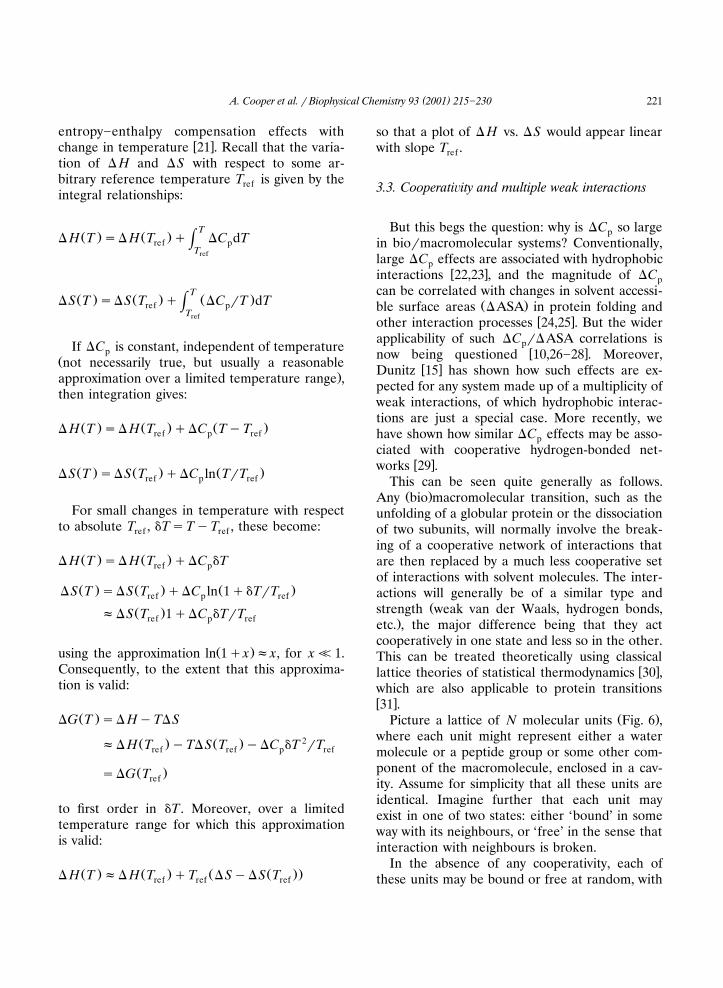
Ž .Picture a lattice of N molecular units Fig. 6 ,where each unit might represent either a watermolecule or a peptide group or some other com-ponent of the macromolecule, enclosed in a cav-ity. Assume for simplicity that all these units areidentical. Imagine further that each unit mayexist in one of two states: either ‘bound’ in someway with its neighbours, or ‘free’ in the sense thatinteraction with neighbours is broken.
In the absence of any cooperativity, each ofthese units may be bound or free at random, with
( )A. Cooper et al. � Biophysical Chemistry 93 2001 215�230222
Fig. 6. Sketch illustrating a simple lattice model for cooperative transitions with multiple weak interactions. Each lattice pointŽrepresents one unit in the system, which may be viewed as either a solvent molecule or a protein group amino acid residue or
. Ž . Ž . Ž .smaller component . Each unit may be ‘bound’ solid squares or ‘free’ open circles . In state ‘X’ an number of these proteinunits are cooperatively constrained to the bound state, but in state ‘Y’ are free to adopt a Boltzmann distribution of bound or freestates, just like surrounding solvent.
a statistical probability given by the Boltzmannfactor:
Ž . Ž .p free �gexp ���RT
where � is the energy difference between ‘free’and ‘bound’ states, and g is the relative degener-acy of the free unit compared to the bound stateŽrepresenting the increased configurational free-dom of the unit when free of directional interac-
.tions with neighbouring groups . R is the gasconstant and T the absolute temperature. Thestatistical mechanical partition function for this
Ž .system Z will be given by summation over allYpossible states, bearing in mind the number ofpermutations of lattice defects:
� Ž . 4 2Z �1�Np� N N�1 �2 p � . . .Y
� Ž . 4 j� N !� N� j ! j! p � . . .N� Ž .4� 1�gexp ���RT
using the standard binomial expansion.Imagine now that, for some reason or other, a
small number n of the total N are not allowed tobe free. This may be because they are all units
within a folded protein, or at the interfacebetween two protein subunits, for example. Inthis case the partition function is given by:
N�n� Ž .4Z � 1�gexp ���RTX
The transition from state X to state Y repre-sents a cooperative transition in which the nunits, held in the bound state and unable to breakfree independently of the others, all break simul-taneously and join the larger ensemble wherethey are free to behave non-cooperatively.
Following statistical thermodynamics, the equi-Ž .librium constant K for X�Y is given by the
ratio of partition functions:
n� Ž .4K�Z �Z � 1�gexp ���RTY X
from which other thermodynamic functions fol-low:Gibbs free energy change:
�G���RT ln K
� Ž .4 Ž .��nRT ln 1�gexp ���RT 1
( )A. Cooper et al. � Biophysical Chemistry 93 2001 215�230 223
Enthalpy change:
2 Ž .� H��RT �ln K��T�ng�exp ���RT
� Ž .4� 1�gexp ���RTŽ .2
Heat capacity change:
�C ��� H���Tp
2 Ž .�ng� exp ���RT22 � Ž .4 Ž .� RT 1�gexp ���RT 3
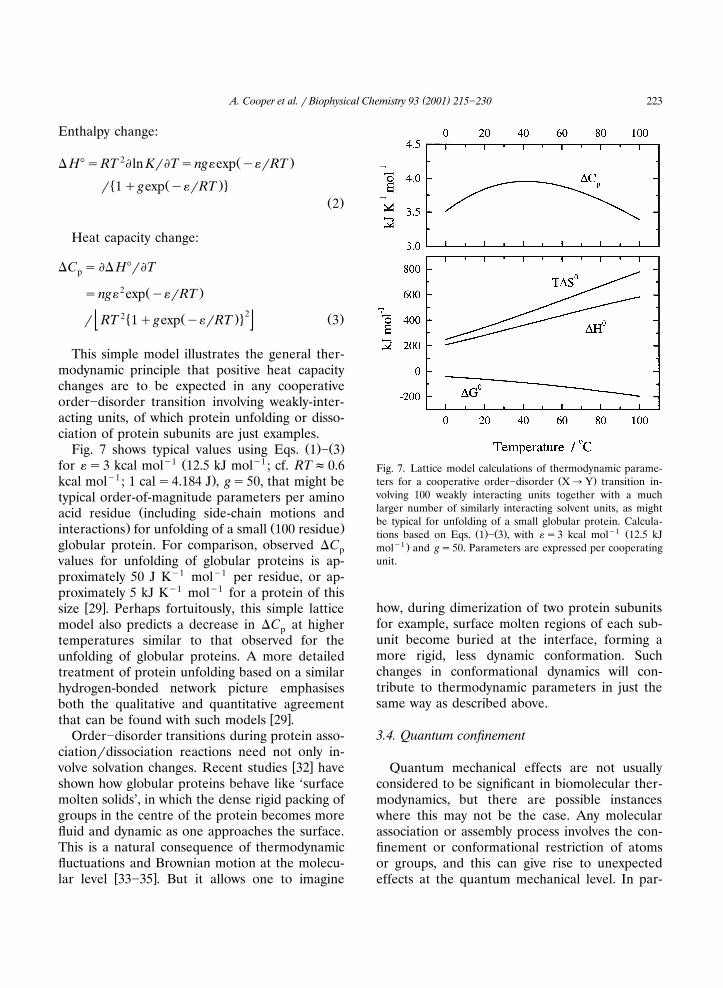
This simple model illustrates the general ther-modynamic principle that positive heat capacitychanges are to be expected in any cooperativeorder�disorder transition involving weakly-inter-acting units, of which protein unfolding or disso-ciation of protein subunits are just examples.
Ž . Ž .Fig. 7 shows typical values using Eqs. 1 � 3�1 Ž �1for ��3 kcal mol 12.5 kJ mol ; cf. RT�0.6
�1 .kcal mol ; 1 cal�4.184 J , g�50, that might betypical order-of-magnitude parameters per amino
Žacid residue including side-chain motions and. Ž .interactions for unfolding of a small 100 residue
globular protein. For comparison, observed �Cpvalues for unfolding of globular proteins is ap-proximately 50 J K�1 mol�1 per residue, or ap-proximately 5 kJ K�1 mol�1 for a protein of this
� �size 29 . Perhaps fortuitously, this simple latticemodel also predicts a decrease in �C at higherptemperatures similar to that observed for theunfolding of globular proteins. A more detailedtreatment of protein unfolding based on a similarhydrogen-bonded network picture emphasisesboth the qualitative and quantitative agreement
� �that can be found with such models 29 .Order�disorder transitions during protein asso-
ciation�dissociation reactions need not only in-� �volve solvation changes. Recent studies 32 have
shown how globular proteins behave like ‘surfacemolten solids’, in which the dense rigid packing ofgroups in the centre of the protein becomes morefluid and dynamic as one approaches the surface.This is a natural consequence of thermodynamicfluctuations and Brownian motion at the molecu-
� �lar level 33�35 . But it allows one to imagine
Fig. 7. Lattice model calculations of thermodynamic parame-Ž .ters for a cooperative order�disorder X�Y transition in-
volving 100 weakly interacting units together with a muchlarger number of similarly interacting solvent units, as mightbe typical for unfolding of a small globular protein. Calcula-
Ž . Ž . �1 Žtions based on Eqs. 1 � 3 , with ��3 kcal mol 12.5 kJ�1 .mol and g�50. Parameters are expressed per cooperating
unit.
how, during dimerization of two protein subunitsfor example, surface molten regions of each sub-unit become buried at the interface, forming amore rigid, less dynamic conformation. Suchchanges in conformational dynamics will con-tribute to thermodynamic parameters in just thesame way as described above.
3.4. Quantum confinement
Quantum mechanical effects are not usuallyconsidered to be significant in biomolecular ther-modynamics, but there are possible instanceswhere this may not be the case. Any molecularassociation or assembly process involves the con-finement or conformational restriction of atomsor groups, and this can give rise to unexpectedeffects at the quantum mechanical level. In par-
( )A. Cooper et al. � Biophysical Chemistry 93 2001 215�230224
ticular, once the confinement falls below certainlevels, the discrete quantisation of available en-ergy levels for the particle or group in the cavitymeans that the usual continuum approximation isno longer valid. Moreover, for tightly confined
Žobjects, the zero-point energy effects a conse-.quence of the Heisenberg uncertainty principle
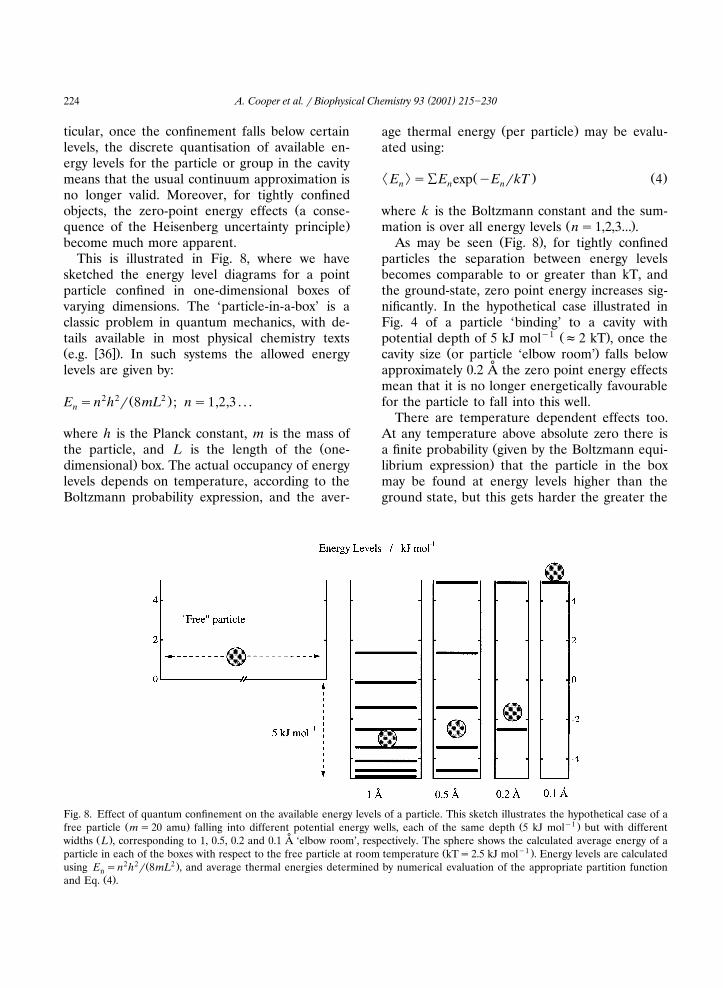
become much more apparent.This is illustrated in Fig. 8, where we have
sketched the energy level diagrams for a pointparticle confined in one-dimensional boxes ofvarying dimensions. The ‘particle-in-a-box’ is aclassic problem in quantum mechanics, with de-tails available in most physical chemistry textsŽ � �.e.g. 36 . In such systems the allowed energylevels are given by:
2 2 Ž 2 .E �n h � 8mL ; n�1,2,3 . . .n
where h is the Planck constant, m is the mass ofŽthe particle, and L is the length of the one-
.dimensional box. The actual occupancy of energylevels depends on temperature, according to theBoltzmann probability expression, and the aver-
Ž .age thermal energy per particle may be evalu-ated using:
² : Ž . Ž .E �ÝE exp �E �kT 4n n n
where k is the Boltzmann constant and the sum-Ž .mation is over all energy levels n�1,2,3... .
Ž .As may be seen Fig. 8 , for tightly confinedparticles the separation between energy levelsbecomes comparable to or greater than kT, andthe ground-state, zero point energy increases sig-nificantly. In the hypothetical case illustrated inFig. 4 of a particle ‘binding’ to a cavity with
�1 Ž .potential depth of 5 kJ mol �2 kT , once theŽ .cavity size or particle ‘elbow room’ falls below
˚approximately 0.2 A the zero point energy effectsmean that it is no longer energetically favourablefor the particle to fall into this well.
There are temperature dependent effects too.At any temperature above absolute zero there is
Ža finite probability given by the Boltzmann equi-.librium expression that the particle in the box
may be found at energy levels higher than theground state, but this gets harder the greater the
Fig. 8. Effect of quantum confinement on the available energy levels of a particle. This sketch illustrates the hypothetical case of aŽ . Ž �1 .free particle m�20 amu falling into different potential energy wells, each of the same depth 5 kJ mol but with different
˚Ž .widths L , corresponding to 1, 0.5, 0.2 and 0.1 A ‘elbow room’, respectively. The sphere shows the calculated average energy of aŽ �1 .particle in each of the boxes with respect to the free particle at room temperature kT�2.5 kJ mol . Energy levels are calculated
2 2 Ž 2 .using E �n h � 8mL , and average thermal energies determined by numerical evaluation of the appropriate partition functionnŽ .and Eq. 4 .
( )A. Cooper et al. � Biophysical Chemistry 93 2001 215�230 225
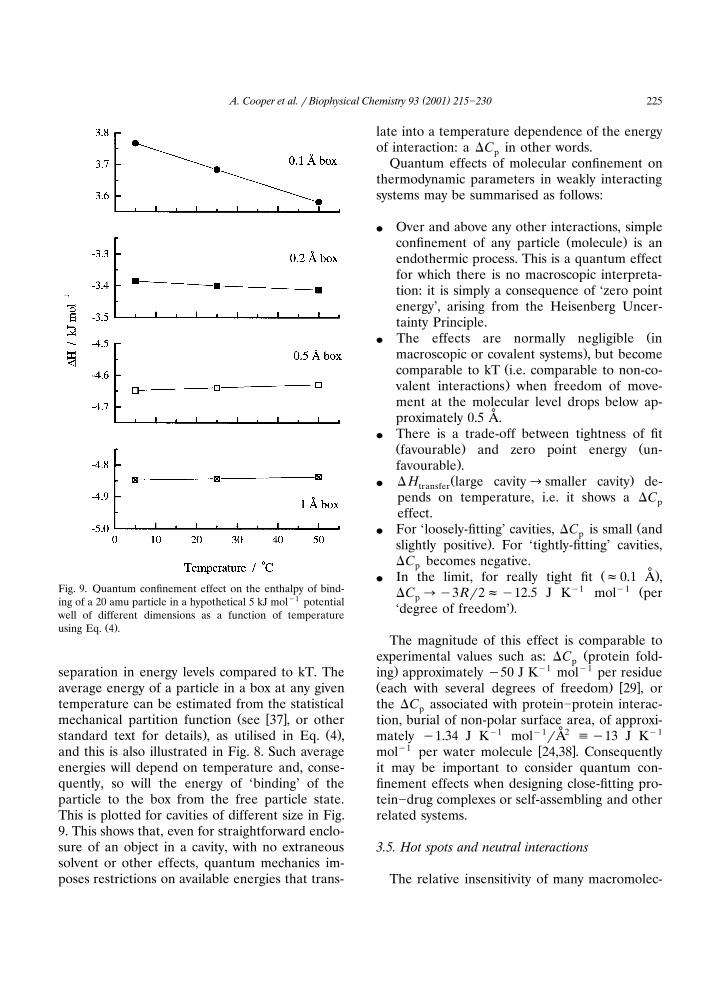
Fig. 9. Quantum confinement effect on the enthalpy of bind-ing of a 20 amu particle in a hypothetical 5 kJ mol�1 potentialwell of different dimensions as a function of temperature
Ž .using Eq. 4 .
separation in energy levels compared to kT. Theaverage energy of a particle in a box at any giventemperature can be estimated from the statistical
Ž � �mechanical partition function see 37 , or other. Ž .standard text for details , as utilised in Eq. 4 ,
and this is also illustrated in Fig. 8. Such averageenergies will depend on temperature and, conse-quently, so will the energy of ‘binding’ of theparticle to the box from the free particle state.This is plotted for cavities of different size in Fig.9. This shows that, even for straightforward enclo-sure of an object in a cavity, with no extraneoussolvent or other effects, quantum mechanics im-poses restrictions on available energies that trans-
late into a temperature dependence of the energyof interaction: a �C in other words.p
Quantum effects of molecular confinement onthermodynamic parameters in weakly interactingsystems may be summarised as follows:
� Over and above any other interactions, simpleŽ .confinement of any particle molecule is an
endothermic process. This is a quantum effectfor which there is no macroscopic interpreta-tion: it is simply a consequence of ‘zero pointenergy’, arising from the Heisenberg Uncer-tainty Principle.
Ž� The effects are normally negligible in.macroscopic or covalent systems , but become
Žcomparable to kT i.e. comparable to non-co-.valent interactions when freedom of move-
ment at the molecular level drops below ap-˚proximately 0.5 A.
� There is a trade-off between tightness of fitŽ . Žfavourable and zero point energy un-
.favourable .Ž .� � H large cavity�smaller cavity de-transfer
pends on temperature, i.e. it shows a �Cpeffect.
Ž� For ‘loosely-fitting’ cavities, �C is small andp.slightly positive . For ‘tightly-fitting’ cavities,
�C becomes negative.p˚Ž .� In the limit, for really tight fit �0.1 A ,
�1 �1 Ž�C ��3R�2��12.5 J K mol perp.‘degree of freedom’ .
The magnitude of this effect is comparable toŽexperimental values such as: �C protein fold-p
. �1 �1ing approximately �50 J K mol per residueŽ . � �each with several degrees of freedom 29 , orthe �C associated with protein�protein interac-ption, burial of non-polar surface area, of approxi-
�1 �1 ˚2 �1mately �1.34 J K mol �A ��13 J K�1 � �mol per water molecule 24,38 . Consequently
it may be important to consider quantum con-finement effects when designing close-fitting pro-tein�drug complexes or self-assembling and otherrelated systems.
3.5. Hot spots and neutral interactions
The relative insensitivity of many macromolec-
( )A. Cooper et al. � Biophysical Chemistry 93 2001 215�230226
ular systems, at least at the free energy level, tomutations or other chemical changes suggests that
Ž .many contacts or interactions at the macro-molecular interface may be thermodynamicallyneutral. That is, as illustrated by the colicin-porindata, such systems can be surprisingly tolerant toquite large chemical changes. Although mutationsmay give rise to large changes in � H and �S,such changes compensate to give much less of aneffect on the �G of interaction. A corollary of
Žthis is that most of the binding affinity contribu-. Ž .tion to �G must reside in just one or a few
crucial locations or ‘hot spots’. One may picture asituation in which just a few contacts at a macro-molecular interface might be responsible for themajority of the binding free energy, but that the
Ž .remainder control stereochemical structural?specificity, for example. The latter may make azero contribution to �G in the correct conforma-
Ž .tion even though � H and �S might be finite ,but any distortion from the correct configurationwould incur a free energy penalty. In such a way,these interactions will be thermodynamically neu-tral in the sense that they do not contribute tothe overall free energy of the interaction, but arenonetheless vital to control the specificity of thecomplex. Deletion of such ‘neutral’ groups would,thus, not affect the overall �G of interactionŽeven though � H and �S would change in a
.complementary fashion , though the specificitymight suffer. This is consistent with similar viewsobtained by structural analysis of protein inter-
� �faces 39,40 .
3.6. Thermodynamic homeostasis
Although, as we have seen, entropy�enthalpycompensation effects seem inevitable in any non-covalent macromolecular interacting system, andindeed frustrate attempts to characterise suchinteractions, they confer thermodynamic stabilityand buffering against environmental and mutatio-nal challenges that may be of significant advan-tage in the evolution and function of biomolecu-lar systems. Living organisms depend on a deli-cate interplay and balance of intermolecular in-teractions, and anything that upsets this balance
is likely to be a disadvantage in evolutionaryterms.
Regardless of the actual molecular origin ofentropy�enthalpy compensation, the buffering ofthermodynamic free energy that arises in conse-quence may well be of considerable importance.As illustrated in Fig. 3, in the presence of large�C effects, the temperature variations in � Hpand �S� tend to cancel to give relatively muchsmaller changes in �G� and, consequently, smallerchanges in K. In contrast, if � H and �S were
Ž .constant �C �0 , then no such compensationpwould occur and both �G� and K would varymuch more rapidly with T. Bearing in mind thatbiological systems depend on a very delicatebalance of interactions, and that the extent ofsuch interaction is determined by K and �G,rather than by � H and �S, this ‘thermodynamichomeostasis’ would allow a developing or evolvingorganism to withstand much greater fluctuationsin environmental conditions than might otherwisebe the case. Similar arguments may be applied to
Ž .explain stability to most random mutations.Such homeostasis might also be a useful design
feature in synthetic self-assembling systems andin attempts at rational drug development. On theone hand, if � H��S compensation is unavoid-able, then attempts to improve binding affinitiesŽ .�G� or K are frustrated by thermodynamichomeostasis. On the other hand, having op-timised the binding affinity of one’s ligand orreceptor, there may be reasons why one mightwish to introduce modifications for other pur-
Ž .poses solubility, stability, antigenicity . . . withoutcompromising binding affinity. In such instancesthermodynamic homeostasis is a potential advan-tage.
4. Pressure perturbation calorimetry
PPC is a new technique recently introduced by� �MicroCal LLC 41 that exploits the sensitivity of
calorimetric methods to determine volumetricproperties in solution. The device is based onDSC, but with the additional facility to apply orrelease pressure simultaneously to both sample
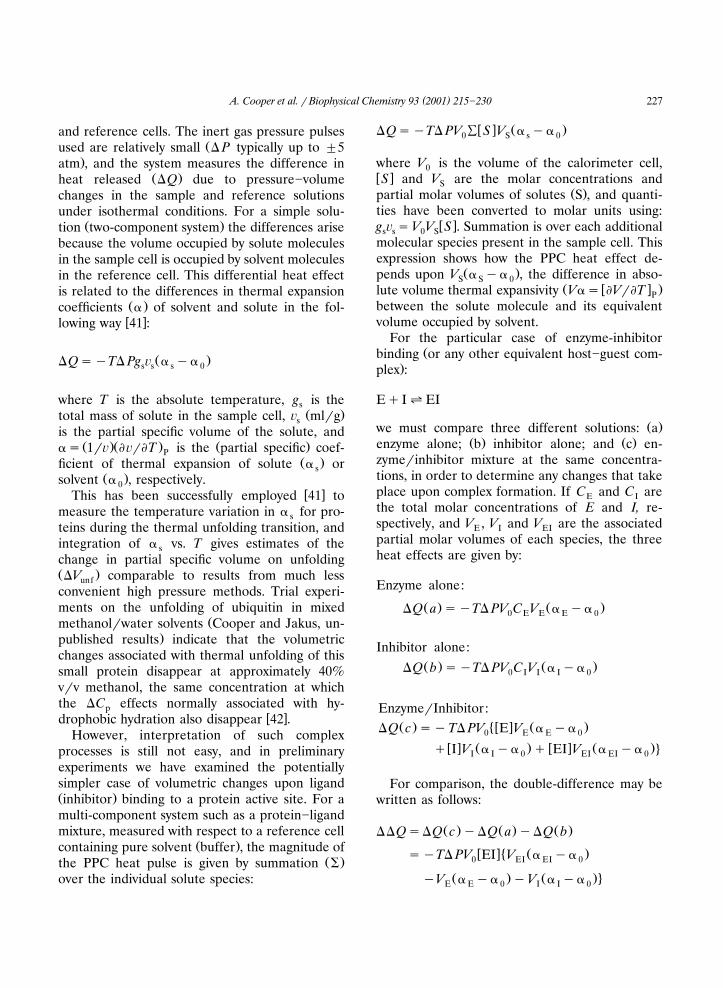
( )A. Cooper et al. � Biophysical Chemistry 93 2001 215�230 227
and reference cells. The inert gas pressure pulsesŽused are relatively small � P typically up to �5
.atm , and the system measures the difference inŽ .heat released �Q due to pressure�volume
changes in the sample and reference solutionsunder isothermal conditions. For a simple solu-
Ž .tion two-component system the differences arisebecause the volume occupied by solute moleculesin the sample cell is occupied by solvent moleculesin the reference cell. This differential heat effectis related to the differences in thermal expansion
Ž .coefficients � of solvent and solute in the fol-� �lowing way 41 :
Ž .�Q��T� Pg � � ��s s s 0
where T is the absolute temperature, g is thesŽ .total mass of solute in the sample cell, � ml�gs
is the partial specific volume of the solute, andŽ .Ž . Ž .�� 1�� ����T is the partial specific coef-P
Ž .ficient of thermal expansion of solute � orsŽ .solvent � , respectively.0
� �This has been successfully employed 41 tomeasure the temperature variation in � for pro-steins during the thermal unfolding transition, andintegration of � vs. T gives estimates of theschange in partial specific volume on unfoldingŽ .�V comparable to results from much lessunfconvenient high pressure methods. Trial experi-ments on the unfolding of ubiquitin in mixed
Žmethanol�water solvents Cooper and Jakus, un-.published results indicate that the volumetric
changes associated with thermal unfolding of thissmall protein disappear at approximately 40%v�v methanol, the same concentration at whichthe �C effects normally associated with hy-p
� �drophobic hydration also disappear 42 .However, interpretation of such complex
processes is still not easy, and in preliminaryexperiments we have examined the potentiallysimpler case of volumetric changes upon ligandŽ .inhibitor binding to a protein active site. For amulti-component system such as a protein�ligandmixture, measured with respect to a reference cell
Ž .containing pure solvent buffer , the magnitude ofŽ .the PPC heat pulse is given by summation
over the individual solute species:
� � Ž .�Q��T� PV Ý S V � ��0 S s 0
where V is the volume of the calorimeter cell,0� �S and V are the molar concentrations andS
Ž .partial molar volumes of solutes S , and quanti-ties have been converted to molar units using:
� �g � � V V S . Summation is over each additionals s 0 Smolecular species present in the sample cell. Thisexpression shows how the PPC heat effect de-
Ž .pends upon V � �� , the difference in abso-S S 0Ž � � .lute volume thermal expansivity V�� �V��T P
between the solute molecule and its equivalentvolume occupied by solvent.
For the particular case of enzyme-inhibitorŽbinding or any other equivalent host�guest com-
.plex :
E�I�EI
Ž .we must compare three different solutions: aŽ . Ž .enzyme alone; b inhibitor alone; and c en-
zyme�inhibitor mixture at the same concentra-tions, in order to determine any changes that takeplace upon complex formation. If C and C areE Ithe total molar concentrations of E and I, re-spectively, and V , V and V are the associatedE I EIpartial molar volumes of each species, the threeheat effects are given by:
Enzyme alone:
Ž . Ž .�Q a ��T� PV C V � ��0 E E E 0
Inhibitor alone:Ž . Ž .�Q b ��T� PV C V � ��0 I I I 0
Enzyme�Inhibitor:Ž . � � � Ž .�Q c ��T� PV E V � ��0 E E 0
� � Ž . � � Ž .4� I V � �� � EI V � ��I I 0 EI EI 0
For comparison, the double-difference may bewritten as follows:
Ž . Ž . Ž .��Q��Q c ��Q a ��Q b
� � � Ž .��T� PV EI V � ��0 EI EI 0
Ž . Ž .4�V � �� �V � ��E E 0 I I 0
( )A. Cooper et al. � Biophysical Chemistry 93 2001 215�230228
showing that any differential PPC heat effectŽ .depends naturally on the concentration of en-
zyme�inhibitor complex formed, and on the dif-ference in volumetric expansivity properties ofthe complex compared to the free molecules.
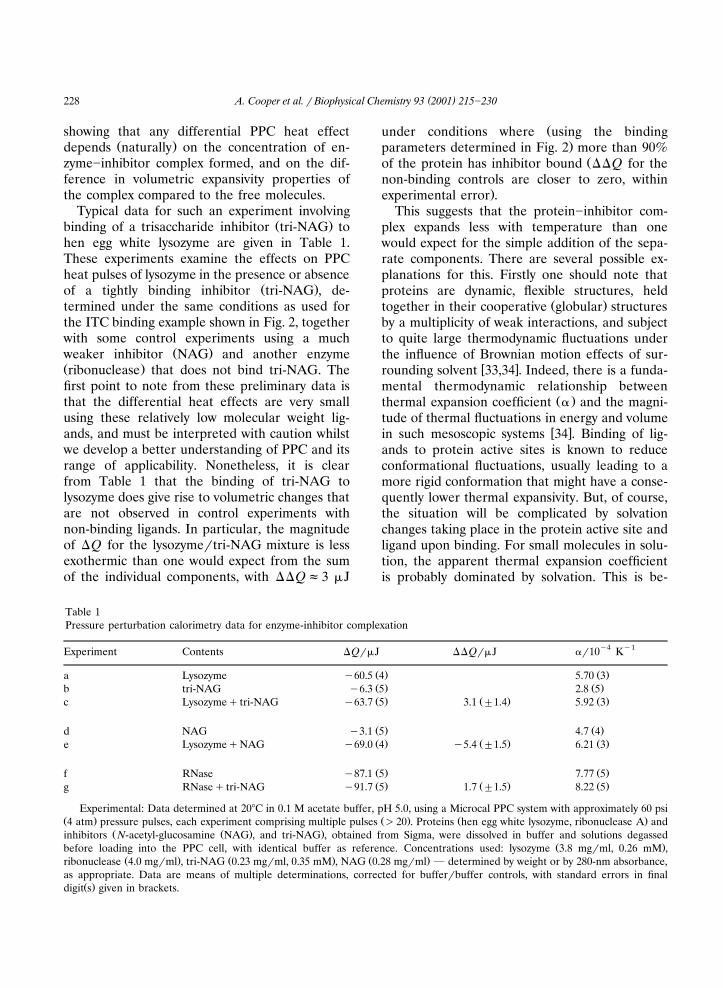
Typical data for such an experiment involvingŽ .binding of a trisaccharide inhibitor tri-NAG to
hen egg white lysozyme are given in Table 1.These experiments examine the effects on PPCheat pulses of lysozyme in the presence or absence
Ž .of a tightly binding inhibitor tri-NAG , de-termined under the same conditions as used forthe ITC binding example shown in Fig. 2, togetherwith some control experiments using a much
Ž .weaker inhibitor NAG and another enzymeŽ .ribonuclease that does not bind tri-NAG. Thefirst point to note from these preliminary data isthat the differential heat effects are very smallusing these relatively low molecular weight lig-ands, and must be interpreted with caution whilstwe develop a better understanding of PPC and itsrange of applicability. Nonetheless, it is clearfrom Table 1 that the binding of tri-NAG tolysozyme does give rise to volumetric changes thatare not observed in control experiments withnon-binding ligands. In particular, the magnitudeof �Q for the lysozyme�tri-NAG mixture is lessexothermic than one would expect from the sumof the individual components, with ��Q�3 �J
Žunder conditions where using the binding.parameters determined in Fig. 2 more than 90%
Žof the protein has inhibitor bound ��Q for thenon-binding controls are closer to zero, within
.experimental error .This suggests that the protein�inhibitor com-
plex expands less with temperature than onewould expect for the simple addition of the sepa-rate components. There are several possible ex-planations for this. Firstly one should note thatproteins are dynamic, flexible structures, held
Ž .together in their cooperative globular structuresby a multiplicity of weak interactions, and subjectto quite large thermodynamic fluctuations underthe influence of Brownian motion effects of sur-
� �rounding solvent 33,34 . Indeed, there is a funda-mental thermodynamic relationship between
Ž .thermal expansion coefficient � and the magni-tude of thermal fluctuations in energy and volume
� �in such mesoscopic systems 34 . Binding of lig-ands to protein active sites is known to reduceconformational fluctuations, usually leading to amore rigid conformation that might have a conse-quently lower thermal expansivity. But, of course,the situation will be complicated by solvationchanges taking place in the protein active site andligand upon binding. For small molecules in solu-tion, the apparent thermal expansion coefficientis probably dominated by solvation. This is be-
Table 1Pressure perturbation calorimetry data for enzyme-inhibitor complexation
�4 �1Experiment Contents �Q��J ��Q��J ��10 K
Ž . Ž .a Lysozyme �60.5 4 5.70 3Ž . Ž .b tri-NAG �6.3 5 2.8 5Ž . Ž . Ž .c Lysozyme� tri-NAG �63.7 5 3.1 �1.4 5.92 3
Ž . Ž .d NAG �3.1 5 4.7 4Ž . Ž . Ž .e Lysozyme�NAG �69.0 4 �5.4 �1.5 6.21 3
Ž . Ž .f RNase �87.1 5 7.77 5Ž . Ž . Ž .g RNase� tri-NAG �91.7 5 1.7 �1.5 8.22 5
Experimental: Data determined at 20�C in 0.1 M acetate buffer, pH 5.0, using a Microcal PPC system with approximately 60 psiŽ . Ž . Ž .4 atm pressure pulses, each experiment comprising multiple pulses �20 . Proteins hen egg white lysozyme, ribonuclease A and
Ž Ž . .inhibitors N-acetyl-glucosamine NAG , and tri-NAG , obtained from Sigma, were dissolved in buffer and solutions degassedŽ .before loading into the PPC cell, with identical buffer as reference. Concentrations used: lysozyme 3.8 mg�ml, 0.26 mM ,
Ž . Ž . Ž .ribonuclease 4.0 mg�ml , tri-NAG 0.23 mg�ml, 0.35 mM , NAG 0.28 mg�ml determined by weight or by 280-nm absorbance,as appropriate. Data are means of multiple determinations, corrected for buffer�buffer controls, with standard errors in final
Ž .digit s given in brackets.
( )A. Cooper et al. � Biophysical Chemistry 93 2001 215�230 229
cause the excluded volume of a small molecule byitself, held together solely by covalent bonds andwith no secondary or tertiary structure, will re-spond very little to temperature change, becausecovalent bond vibrational excitation energies liewell above normal experimental temperatures,and covalent bond lengths will not change muchwith temperature. The solvation shell around themolecule, however, involves much weaker non-co-valent forces and will be much more sensitive totemperature. Consequently, at least for small rigidligands, volumetric changes upon binding arelikely to reflect mainly changes in solvation. Re-moval of the hydration layer around tri-NAGupon binding to lysozyme is therefore likely toreduce the overall thermal expansivity, asobserved.
5. Conclusions
Calorimetric techniques yield detailed informa-tion about the thermodynamics of biomolecularinteractions, in which solvation plays a major role,but interpretation in terms of specific interactionsis frustrated by the lack of characteristic thermo-dynamic signatures and by ubiquitous entropy�enthalpy compensation.
There are numerous reasons for entropy�en-thalpy compensation, but the thermodynamichomeostasis that results may be of evolutionarysignificance in allowing adaptation to harsher en-vironments.
Limited free energy windows, conditioned ei-ther by experimental limitations or by functionalrelevance, give rise to apparent entropy�enthalpycompensation even between chemically unrelatedspecies.
Heat capacity effects, which give rise to en-tropy�enthalpy compensation in the temperaturedomain, are an inevitable consequence in cooper-ative systems comprising networks of weakly in-teracting units.
Even in the absence of specific interactions,molecular confinement can give rise to quantumzero-point energy effects and temperature depen-dence of enthalpies.
Pressure perturbation calorimetry of protein�
ligand complexes shows how changes in thermalexpansion properties may be related to changes inmacromolecular conformational dynamics andsolvation.
Acknowledgements
This work was supported in part by fundingfrom BBSRC, EPSRC and the Medical ResearchCouncil. We are grateful to the Wellcome Trustfor research studentship support under the 4-year
Ž .PhD scheme Nollmann , and to Margaret Nutley¨for technical assistance.
References
� �1 J.M. Sturtevant, The thermodynamic effects of proteinŽ .mutations, Curr. Opin. Struct. Biol. 4 1994 69�78.
� �2 A. Cooper, Thermodynamic analysis of biomolecularŽ .interactions, Curr. Opin. Chem. Biol. 3 1999 557�563.
� �3 V.V. Plotnikov, J.M. Brandts, L.N. Lin, J.F. Brandts, Anew ultrasensitive scanning calorimeter, Anal. Biochem.
Ž .250 1997 237�244.� �4 A. Cooper, M.A. Nutley, A. Wadood, Differential scan-
ning microcalorimetry in: S.E. Harding, B.Z. ChowdhryŽ .Eds. , Protein�Ligand Interactions: Hydrodynamics andCalorimetry, Oxford University Press, Oxford, New York,2000, pp. 287�318.
� �5 G.I. Makhatadze, P.L. Privalov, Energetics of proteinŽ .structure, Adv. Protein Chem. 47 1995 307�425.
� �6 T. Wiseman, S. Williston, J.F. Brandts, L.N. Lin, Rapidmeasurement of binding constants and heats of bindingusing a new titration calorimeter, Anal. Biochem. 179Ž .1989 131�137.
� �7 A. Cooper, K.E. McAuley-Hecht, Microcalorimetry andthe molecular recognition of peptides and proteins, Phi-los. Trans. R. Soc. Lond. Ser. A-Math. Phys. Eng. Sci.
Ž .345 1993 23�35.� �8 A. Cooper, Microcalorimetry of protein�DNA interac-
Ž .tions in: A. Travers, M. Buckle Eds. , DNA�ProteinInteractions, Oxford University Press, Oxford, 2000, pp.125�139.
� �9 A. Lovatt, A. Cooper, P. Camilleri, Energetics of cy-clodextrin-induced dissociation of insulin, Eur. Biophys.
Ž .J. 24 1996 354�357.� �10 C. Frisch, G. Schreiber, C.M. Johnson, A.R. Fersht,
Thermodynamics of the interaction of barnase andbarstar: Changes in free energy versus changes in en-
Ž .thalpy on mutation, J. Mol. Biol. 267 1997 696�706.� �11 A. Cooper, Microcalorimetry of protein-protein interac-
Ž .tions in: J.E. Ladbury, B.Z. Chowdhry Eds. ,Biocalorimetry: The Applications of Calorimetry in theBiological Sciences, Wiley, 1998, pp. 103�111.
� �12 S. Knapp, M. Zamai, D. Volpi et al., Thermodynamics of
( )A. Cooper et al. � Biophysical Chemistry 93 2001 215�230230
the high-affinity interaction of TCF4 with �-catenin, J.Ž .Mol. Biol. 306 2001 1179�1189.
� �13 R. Lumry, S. Rajender, Enthalpy�entropy compensationphenomena in water solutions of proteins and smallmolecules: a ubiquitous property of water, BiopolymersŽ .9 1970 1125�1227.
� �14 K. Sharp, Entropy�enthalpy compensation: Fact or arte-Ž .fact? Protein Sci. 10 2001 661�667.
� �15 J.D. Dunitz, Win some, lose some enthalpy�entropycompensation in weak intermolecular interactions,
Ž .Chem. Biol. 2 1995 709�712.� �16 L.J.A. Evans, S. Labeit, A. Cooper, L.H. Bond, J.H.
Lakey, The central domain of colicin N possesses thereceptor recognition site but not the binding affinity of
Ž .the whole toxin, Biochemistry 35 1996 15143�15148.� �17 L.J.A. Evans, A. Cooper, J.H. Lakey, Direct measure-
ment of the association of a protein with a family ofŽ .membrane receptors, J. Mol. Biol. 255 1996 559�563.
� �18 E.M. Raggett, G. Bainbridge, L.J.A. Evans, A. Cooper,J.H. Lakey, Discovery of critical tol A-binding residuesin the bactericidal toxin colicin N: a biophysical ap-
Ž .proach, Mol. Microbiol. 28 1998 1335�1343.� �19 S.E. Jackson, M. Moracci, N. Elmasry, C.M. Johnson,
A.R. Fersht, Effect of cavity-creating mutations in thehydrophobic core of chymotrypsin inhibitor-2, Biochem-
Ž .istry 32 1993 11259�11269.� �20 C.M. Johnson, M. Oliveberg, J. Clarke, A.R. Fersht,
Thermodynamics of denaturation of mutants of barnaseŽ .with disulfide crosslinks, J. Mol. Biol. 268 1997 198�208.
� �21 D. McPhail, A. Cooper, Thermodynamics and kinetics ofdissociation of ligand-induced dimers of vancomycin
Ž .antibiotics, J. Chem. Soc.-Faraday Trans. 93 19972283�2289.
� �22 W. Kauzmann, Some factors in the interpretation ofŽ .protein denaturation, Adv. Protein Chem. 14 1959
1�63.� �23 K.A. Dill, Dominant forces in protein folding, Biochem-
Ž .istry 29 1990 7133�7155.� �24 J.R. Livingstone, R.S. Spolar, M.T. Record, Contribu-
tion to the thermodynamics of protein folding from thereduction in water-accessible nonpolar surface-area,
Ž .Biochemistry 30 1991 4237�4244.� �25 R.S. Spolar, J.R. Livingstone, M.T. Record, Use of liq-
uid-hydrocarbon and amide transfer data to estimatecontributions to thermodynamic functions of proteinfolding from the removal of nonpolar and polar surface
Ž .from water, Biochemistry 31 1992 3947�3955.� �26 E.R. Guinto, E. Di Cera, Large heat capacity change in
a protein-monovalent cation interaction, BiochemistryŽ .35 1996 8800�8804.
� �27 B. Kuhlman, D.P. Raleigh, Global analysis of the ther-mal and chemical denaturation of the N-terminal do-main of the ribosomal protein L9 in H O and D O.2 2Determination of the thermodynamic parameters, �H�,�S�, and �Cp, and evaluation of solvent isotope effects,
Ž .Protein Sci. 7 1998 2405�2412.
� �28 D.A. Henriques, J.E. Ladbury, R.M. Jackson, Compar-ison of binding energies of SrcSH2-phosphotyrosyl pep-tides with structure-based prediction using surface area
Ž .based empirical parameterization, Protein Sci. 9 20001975�1985.
� �29 A. Cooper, Heat capacity of hydrogen-bonded networks:an alternative view of protein folding thermodynamics,
Ž .Biophys. Chem. 85 2000 25�39.� �30 J.O. Hirschfelder, C.F. Curtiss, R.B. Bird, Molecular
Theory of Gases and Liquids, Wiley, New York, 1954.� �31 K.A. Dill, S. Bromberg, K.Z. Yue et al., Principles of
protein-folding a perspective from simple exact mod-Ž .els, Protein Sci. 4 1995 561�602.
� �32 Y. Zhou, D. Vitkup, M. Karplus, Native proteins aresurface molten solids: application of the Lindemanncriterion for solid versus liquid state, J. Mol. Biol. 285Ž .1999 1371�1375.
� �33 A. Cooper, Thermodynamic fluctuations in proteinŽ .molecules, Proc. Natl. Acad. Sci. USA 73 1976
2740�2741.� �34 A. Cooper, Protein fluctuations and the thermodynamic
Ž .uncertainty principle, Prog. Biophys. Mol. Biol. 44 1984181�214.
� �35 A. Cooper, Conformational change, fluctuation and driftin biological macromolecules an empirical Langevin
Ž .approach, J. Mol. Liq. 39 1988 195�206.� �36 P.W. Atkins, Physical Chemistry, 5th ed., Oxford Uni-
versity Press, Oxford, 1994.� �37 D.A. McQuarrie, Statistical Mechanics, Harper & Row,
New York, London, 1976.� �38 R.S. Spolar, J.H. Ha, M.T. Record, Hydrophobic effect
in protein folding and other noncovalent processes in-Ž .volving proteins, Proc. Natl. Acad. Sci. USA 86 1989
8382�8385.� �39 A.A. Bogan, K.S. Thorn, Anatomy of hot spots in pro-
Ž .tein interfaces, J. Mol. Biol. 280 1998 1�9.� �40 C.K. Vaughan, A.M. Buckle, A.R. Fersht, Structural
response to mutation at a protein�protein interface, J.Ž .Mol. Biol. 286 1999 1487�1506.
� �41 MicroCal, Pressure Perturbation Calorimetry applica-Ž .tion note, http:��www.microcalorimetry.com� 2000 ,
ŽMicroCal, LLC, 22 Industrial Drive East, Northampton,.MA 01060-02327 USA .
� �42 D.N. Woolfson, A. Cooper, M.M. Harding, D.H. Willi-ams, P.A. Evans, Protein folding in the absence of thesolvent ordering contribution to the hydrophobic inter-
Ž .action, J. Mol. Biol. 229 1993 502�511.� �43 I. Gokce, E.M. Raggett, Q. Hong, R. Virden, A. Cooper,
J.H. Lakey, The TolA-recognition site of colicin N. ITC,SPR and stopped-flow fluorescence define a crucial 27-
Ž .residue segment, J. Mol. Biol. 304 2000 621�632.� �44 K.E. McAuley-Hecht, A. Cooper, Microcalorimetry of
enzyme-substrate binding-yeast phosphoglycerate ki-Ž .nase, J. Chem. Soc.-Faraday Trans. 89 1993 2693�2699.