Embed Size (px)
Citation preview

Heat-Associated Deaths in Maricopa County, AZ
Final Report for 2019
Photograph by Dan Sorensen:
http://www.dansorensenphotography.com/

1 Heat Death Report | 2019
ACKNOWLEDGEMENTS .......................................................................................................... 2
INTRODUCTION ..................................................................................................................... 3
RESULTS ................................................................................................................................ 4
Heat-Associated Deaths by Year ............................................................................................................................ 4
Heat-Associated Deaths and Temperatures ........................................................................................................... 6
Heat-Associated Deaths by Residency ................................................................................................................... 7
Heat-Associated Deaths by Time Residing in Arizona* ........................................................................................... 8
DEMOGRAPHIC CHARACTERISTICS OF HEAT-ASSOCIATED DEATHS ......................................... 8
Heat-Associated Death Rates* ............................................................................................................................. 10
Heat-Associated Deaths by Place of Injury ........................................................................................................... 12
Air Conditioning Use for Indoor Deaths* .............................................................................................................. 15
Substance Use among Heat-Associated Deaths ................................................................................................... 16
Living Situation among Heat-Associated Deaths .................................................................................................. 17
CONCLUSIONS ..................................................................................................................... 19
APPENDIX............................................................................................................................ 20
Background .......................................................................................................................................................... 20
Methodology ....................................................................................................................................................... 20

2 Heat Death Report | 2019
Acknowledgements
The Maricopa County Department of Public Health (MCDPH), Office of Epidemiology would like to thank
the following agencies for their contributions to this report:
➢ Maricopa County Office of the Medical Examiner (OME)
➢ Maricopa County Office of Vital Registration (OVR)
➢ Arizona Department of Health Services (ADHS), Office of Vital Registration
➢ National Weather Service (NWS)
➢ Maricopa Association of Governments (MAG)
➢ Local hospitals (infection preventionists, emergency departments, social worker staff)
➢ City of Phoenix Heat Relief Network
To receive additional data, please submit a data request form through the Maricopa County
Public Health website here. A staff member from the Climate and Health team will contact
you to discuss your request.
You may also contact the Climate and Health Team through email:
Vjollca Berisha: [email protected]
Aaron Gettel: [email protected]
Adriana Holmes: [email protected]

3 Heat Death Report | 2019
Introduction
Mortality from environmental heat is a significant public health problem in Maricopa County,
especially because it is largely preventable. Maricopa County has conducted heat surveillance
since 2006. Each year, the enhanced heat surveillance season usually begins in May and ends in
October. The main goals of heat surveillance are to identify the demographic characteristics of
heat-associated deaths (e.g., age and gender) and the risk factors for mortality (e.g.,
homelessness). Sharing this information helps community stakeholders to design interventions
to prevent heat-associated deaths among vulnerable populations.
The two main sources of data for heat surveillance are: preliminary reports of death (PRODs)
from the Office of the Medical Examiner (OME) and death certificates from the MCDPH Office of
Vital Registration.
Heat-associated deaths are classified as heat caused or heat related. Heat caused deaths are
those in which environmental heat was directly involved in the sequence of conditions causing
deaths. Heat related deaths are those in which environmental heat contributed to the deaths but
was not in the sequence of conditions causing these deaths. For more information on how heat-
associated deaths are classified, see the definitions in Appendix. For more information on
MCDPH’s surveillance system, see Background and Methodology.

4 Heat Death Report | 2019
Results Note: Values of ≤ 5 or a value that would facilitate calculation of a suppressed value are not
included in graphs. To receive additional data, please submit a data request form through the
Maricopa County Public Health website here. A staff member from the Climate and Health
team will contact you to discuss your request.
Heat-Associated Deaths by Year
*3 cases pending
Data Sources: Maricopa County, Office of Vital Registration and Office of Medical Examiner; Arizona Department
of Health Services, Office of Vital Registration
2138
49 42
75
85
51 49
7482
106 110
7561
84
154
179 182
197*
2001 2002 2003 2004 2005 2006 2007 2008 2009 2010 2011 2012 2013 2014 2015 2016 2017 2018 2019
Graph 1. There were 197 heat-associated deaths reported in 2019.
➢ See Methodology in the Appendix for more information about the number of confirmed, ruled-out, and pending cases by year.

5 Heat Death Report | 2019
Heat-Associated Deaths by Month
* Indicates suppressed value of ≤ 5.
5838 32
47 4857 63
4233
45
88 90
11913727
13 17
2734
4947
33
28
39
66
89
63
60
2006 2007 2008 2009 2010 2011 2012 2013 2014 2015 2016 2017 2018 2019
Graph 2. Sixty percent of heat-associated deaths since 2006 have been classified as heat-caused.
Heat-Caused Heat-Related
0 * 8
24 21
* * ** *
15
55
39
20
* 0
April May June July August September October November
Graph 3. Eighty-three percent of all heat-associated deaths occurred in the months of July, August, and September (N=163).
Heat-Related (N=60) Heat-Caused (N=137)

6 Heat Death Report| 2019
Heat-Associated Deaths and Temperatures
0
2
4
6
8
10
12
0°F
20°F
40°F
60°F
80°F
100°F
120°F
Nu
mb
er o
f D
eath
s
Graph 4. Thirty-four percent of heat-associated deaths occurred on days for which an excessive heat warning has been issued. (N=67)
Excessive Heat Warning Heat-Associated Deaths High Temperature Low Temperature
➢ The National Weather Service issued 10 excessive heat warnings for a total of twenty-five days in 2019.
➢ The highest daily maximum temperature in 2019 was 115°F and occurred on July 16th and August 5th.
Heat Death Report | 2019
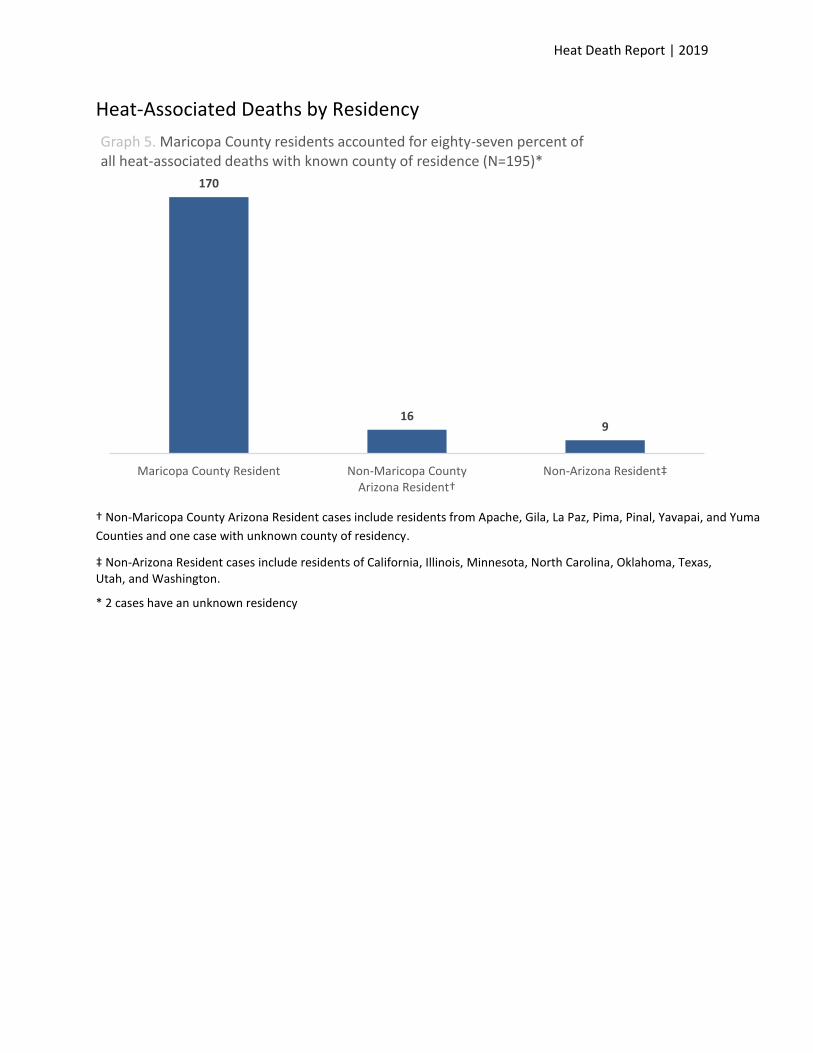
Heat-Associated Deaths by Residency
† Non-Maricopa County Arizona Resident cases include residents from Apache, Gila, La Paz, Pima, Pinal, Yavapai, and Yuma
Counties and one case with unknown county of residency.
‡ Non-Arizona Resident cases include residents of California, Illinois, Minnesota, North Carolina, Oklahoma, Texas, Utah, and Washington.
* 2 cases have an unknown residency
170
169
Maricopa County Resident Non-Maricopa County Arizona Resident†
Non-Arizona Resident‡
Graph 5. Maricopa County residents accounted for eighty-seven percent of all heat-associated deaths with known county of residence (N=195)*

8 Heat Death Report| 2019
Heat-Associated Deaths by Time Residing in Arizona*
*Seventy-one cases for which time spent in Arizona was unknown were excluded from analysis.
Demographic Characteristics of Heat-Associated Deaths
12
2219
73
<3 Years 3-9 Years 10-19 Years 20+ Years
Graph 6. Fivty-eight percent of heat-associated deaths with known residency history had lived in Arizona for 20 or more years at time of death.
Male76%
Female24%
Graph 7. The majority of heat-associated deaths occurred among males.

9 Heat Death Report| 2019
.
* The ages for three cases were unknown.
0%
0%
8%
26%
34%
15%
15%
6%
8%
10%
29%
21%
25%
0-4
5-19
20-34
35-49
50-64
65-74
75+
Graph 8. Most female deaths (46%) occur among those 65+ years and older, while most male deaths (34%) occur among those 50-64 years old.
Male Female
1.5% 0.0%
8.2%
22.2%
33.5%
16.5% 18.0%
0-4 5-19 20-34 35-49 50-64 65-74 75+
Age Range
Graph 9. Sixty-eight percent of heat-associated deaths were among those 50 and older. (N=194)*
10 Heat Death Report| 2019
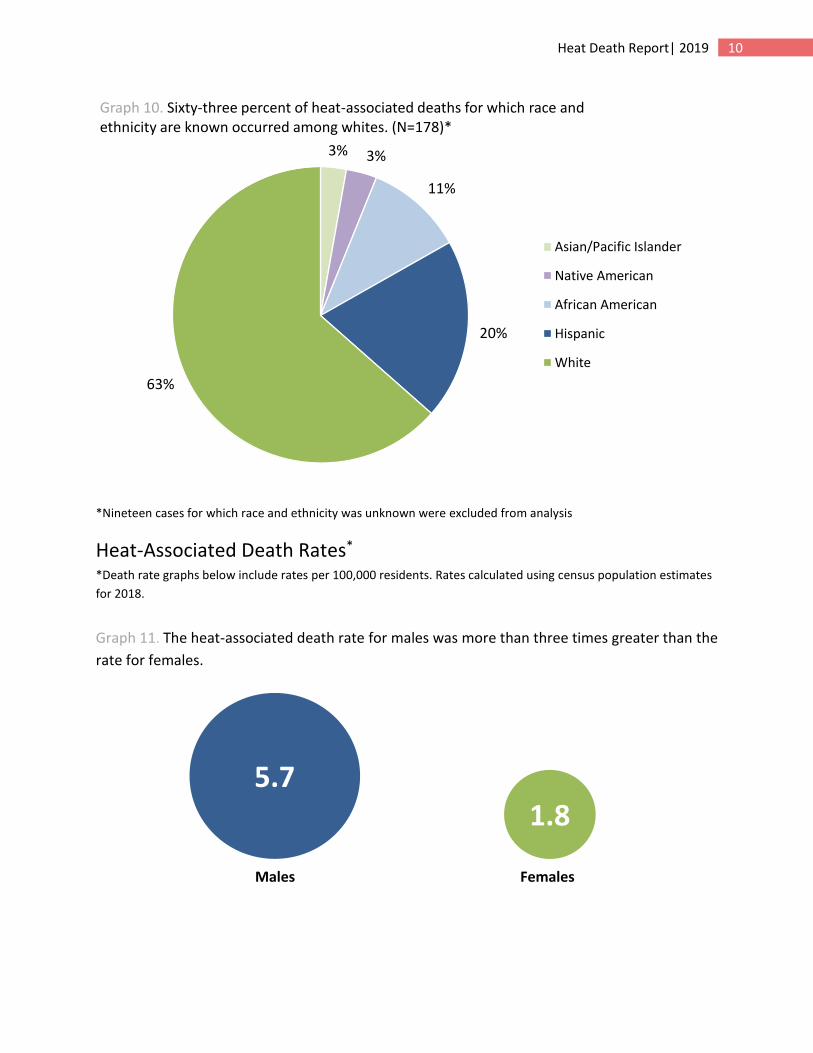
*Nineteen cases for which race and ethnicity was unknown were excluded from analysis
Heat-Associated Death Rates*
*Death rate graphs below include rates per 100,000 residents. Rates calculated using census population estimates
for 2018.
Graph 11. The heat-associated death rate for males was more than three times greater than the
rate for females.
Males Females
3% 3%
11%
20%
63%
Graph 10. Sixty-three percent of heat-associated deaths for which race and ethnicity are known occurred among whites. (N=178)*
Asian/Pacific Islander
Native American
African American
Hispanic
White
5.7
1.8

11 Heat Death Report| 2019
0.0 0.0
1.7
7.5
11.911.2
15.5
2.2
0.00.7 0.7
2.7
4.3
7.6
0-4 5-19 20-34 35-49 50-64 65-74 75+
rate
s p
er 1
00
,00
0
Age Group
Graph 12. While most deaths among females occur for those aged 65 years or older, more deaths among males occur in those 50-64 years old than 65-74 years old.
Male Female
1.1
0.0
1.2
4.1
7.2 7.5
11.0
0-4 5-19 20-34 35-49 50-64 65-74 75+
rate
s p
er 1
00
,00
0
Age Group
Graph 13. The heat-associated death rate increases with age.

12 Heat Death Report| 2019
Heat-Associated Deaths by Place of Injury
2.56
4.37
6.59
2.432.86
Asian/Pacific Islander Native American African American Hispanic White
Graph 14. African Americans and Native Americans had the highest rates of heat-associated deaths per 100,000 residents.
76%
72%
60%
61%
61%
72%
59%
58%
Outdoor, 46%
24%
28%
40%
39%
39%
28%
41%
42%
Indoor, 54%
2019
2018
2017
2016
2015
2014
2013
2012
2011
Graph 15. A lower proportion of deaths occurred indoors than in previous years.
Outdoor Indoor

13 Heat Death Report| 2019
Males Females
* Indicates suppressed value of ≤ 5. **3 cases have an unknown place of injury
85
23
21
12
*
*
Urban Area/Park
Residence
Desert Area/Hiking Trail
Car
Business
Yard
Graph 17. Fifty-four percent of outdoor deaths with a known location of injury occurred in an urban area.
Indoor8%
Outdoor16%
Indoor16%
Outdoor60%
Graph 16. A higher proportion of male deaths than female deaths occurred outdoors.

14 Heat Death Report| 2019
* Indicates suppressed value of ≤ 5. **1 case has an unknown place of injury
23
19
*
*
*
Residence
Trailer/RV
Apartment
Group Home
Shed
Graph 18. Sixty-three percent of indoor deaths occurred in a house or apartment.
20
10
Indoor Deaths Outdoor Deaths
Graph 19. Fouty-three percent of indoor deaths were discovered during a welfare check, compared to just seven percent of outdoor deaths.

15 Heat Death Report| 2019
Air Conditioning Use for Indoor Deaths* *Evaporative coolers were not considered as A/C units as their ability to cool becomes inadequate in extreme
Maricopa County temperatures.
A/C Present91%
A/C Not Present
9%
Graph 20. Ninety-one percent of indoor deaths had an air conditioning unit present at time of death. (N=43)
87%
8%
5%
Graph 21. Among deaths where an A/C unit was present, a non-functioning A/C unit was the most common reason for not having a cooled environment at the time of death.
Non-Functioning
Functioning but Not In Use
No Electricity

16 Heat Death Report| 2019
Substance Use among Heat-Associated Deaths
Substance Use47%
No Substance Use53%
Graph 22. Fourty-seven percent of all cases involved substance use as a cause of death or a contributing factor. (N=93)
68
19
6
Drugs only Alcohol only Drugs and alcohol
Graph 23. In thirty-five percent of cases, drug use was listed as either a cause of death or a contributing factor. (N=68)

17 Heat Death Report| 2019
*Cases involving both drug and alcohol use are represented uniquely on each line.
Living Situation among Heat-Associated Deaths
0%
10%
20%
30%
40%
50%
2006 2007 2008 2009 2010 2011 2012 2013 2014 2015 2016 2017 2018 2019
Graph 24. The proportion of heat-associated deaths involving drug use increased by six percent from the previous year.*
67
50
36
43
Homeless
Living Independently
Co-Habitating/Roommate
Unknown
Graph 25. Thirty-seven percent of cases were homeless at time of death.
Drugs
Alcohol

18 Heat Death Report| 2019
* Indicates suppressed value of ≤ 5.
32
6 *21 22 20 20 20
7 8
54 57 61 67
53
45 46
53 6086 90
55
5476
100
122 121
158
2006 2007 2008 2009 2010 2011 2012 2013 2014 2015 2016 2017 2018 2019
Graph 26. More heat-associated deaths occurred among homeless individuals than any previous year on record.
Homeless Non-Homeless

19 Heat Death Report| 2019
Conclusions
There was an 8.2% increase in heat-associated deaths between 2018 and 2019.
Ten excessive heat warnings were issued in 2019 and ranged in average of 3 days. On
those days, 34% of all heat-associated deaths occurred.
For the second consecutive year, more heat deaths occurred in September than in June.
There were more heat-caused deaths than heat-related deaths.
Most cases were residents of Maricopa County. Furthermore, most cases had lived in
Arizona for 20 years or more.
Among Maricopa County residents, the rate of heat-associated deaths was the highest for
males, African Americans, Native Americans, and those 65 years of age or older.
Most cases were injured outdoors. The most common place of injury for outdoor deaths
was an urban area. The most common place of injury for indoor deaths was at a private
residence.
While 83% of indoor deaths had an A/C unit present at the time of death, in all cases the
environment was not being adequately cooled. Reasons for lack of cooling in the presence
of an A/C unit include a malfunctioning unit, a lack of electricity, the unit being turned off
due to cost, forgetfulness, or other reasons, and the unit being set to a high temperature.
A total of 9% of indoor cases did not have an A/C unit present.
Drugs or alcohol were mentioned on the death certificate in half of all cases.
Individuals experiencing homelessness accounted for 37% of heat-associated deaths.

20 Heat Death Report| 2019
Appendix
Background
In July 2005, Maricopa County (MC) experienced exceptionally high temperatures that contributed to 45
deaths, of which 35 occurred over nine consecutive days. Temperatures reached 116°_F and three
excessive heat warnings were issued during this month. After this event, the Maricopa County
Department of Public Health (MCDPH) created a novel and effective approach for surveillance of heat-
associated deaths in 2006 and has continued to use this system annually.
Methodology
Surveillance data is obtained from the following sources:
1. The Maricopa County Office of the Medical Examiner (OME) forwards suspected heat-
related deaths to MCDPH and provides data including demographics, preliminary
information regarding how the death occurred, and the circumstances of death. In the
past, this information came solely as a weekly line list with limited information for each
case. However, in February of 2012, MCDPH started receiving all preliminary reports of
death (PRODs) from the OME. These reports provide expanded information daily and
have changed the screening methods used by MCDPH staff to ensure that all potential
heat-related deaths are documented.
2. The MCDPH Office of Vital Registration registers all Maricopa County death certificates in
the Arizona Department of Health Services vital records database. The MCDPH Office of
Epidemiology searches this database looking for causes of death associated with
environmental heat. A Statistical Analysis Software (SAS) program looks for the key
phrases and International Classification of Disease-10 (ICD-10) codes listed below.
Key Phrases ICD 10 Code Corresponding Definition
HEAT EXPOSURE X30 Exposure to excessive natural heat
ENVIRON T67.X Effects of heat and light
EXHAUSTION
P810 Environmental hyperthermia of newborn
SUN HEAT STRESS HEAT STROKE HYPERTHERMIA

21 Heat Death Report| 2019
3. Hospital and media reports can sometimes initiate a heat death investigation, for
example, if a child is reportedly left in a hot car.
Once data are received, analysis of the information is required to identify only those deaths
caused as a result of environmental heat. Environmental heat is heat generated by the climate
(sun, humidity, etc.) rather than heat from man-made sources such as ovens or manufacturing
equipment. Heat-associated deaths are categorized based on the classification criteria listed
below:
Heat-caused (HC) deaths are those in which environmental heat was directly involved in the
sequence of conditions causing deaths. These are deaths where environmental heat terms
were indicated in Part I1 of the death certificate causes of death (diseases or conditions in
the direct sequence causing death), for cause of death variables (cod_a, cod_b, cod_c, or
cod_d). County of death: Maricopa.
Heat-related (HR) deaths are those in which environmental heat contributed to the deaths
but was not in the sequence of conditions causing these deaths. These are cases where
environmental heat terms were mentioned in Part II2 of the death certificate causes of death
(diseases and conditions contributing but not directly resulting in the death sequence), but
not in any of the Part I death variables (cod_a, cod_b, cod_c, or cod_d). County of death:
Maricopa.
For the purposes of this report, heat-caused and heat-related deaths are combined and referred
to as “heat-associated deaths.” Please note that most jurisdictions report only heat-caused
deaths. This should be considered when comparing Maricopa County data with data from other
locations.
Death certificate data, in combination with the OME notes, are used to produce the information
that is contained in this report. Total case count, demographics, residency, drug/alcohol use, and
years lived in Arizona are directly retrieved from death certificate data. Place of death location,
indoor/outdoor occurrence, air conditioning use, and homelessness are retrieved based on
explicit notations made in the death certificate and/or OME notes. For the purposes of this
report, reasons for not having a cooled environment at the time of death in indoor cases where
an A/C unit was present were grouped into three categories: non-functioning, functioning but
turned off, and no electricity. “Non-functioning” is defined as an A/C unit that was not operating
properly, was broken, or could not be turned on despite the presence of electricity. Cases
categorized as having a “functioning but turned off” A/C unit indicate that the unit worked
properly but was the A/C was turned off for some reason at the time of the OME scene
inspection. In cases where the unit could not be turned on due to a lack of electricity, regardless
of whether it was functioning or non-functioning, were counted in the “no electricity” category.

22 Heat Death Report| 2019
Homelessness is defined as having an address on the death certificate that matches a homeless
shelter, government agency, business, or an intersection. Cases are also classified as homeless if
there is an indication on the death certificate. If the address is listed as unknown on the death
certificate then an examination of the medical examiner’s notes is made to determine if there is
a reference to an address - if none, then the person is classified as homeless. If the address is
listed as out of jurisdiction then time spent in Arizona, as provided by the death certificate, is
taken into consideration.
Once classification is completed, the data are summarized for the production and dissemination
of reports. Reports are generated weekly during the season and posted to the MCDPH website
which can be found at: http://www.maricopa.gov/publichealth/Services/EPI/Reports/heat.aspx
1 Part I of the death certificate: cod a – is the immediate cause (final disease or condition
resulting in death) cod b, cod c, cod d – are sequentially listed conditions leading to the cause
listed on cod a.
2 Part II of the death certificate: Other significant conditions contributing to death but not
resulting in the underlying cause given in Part I.
To receive additional data, please submit a data request form through the Maricopa County
Public Health website here. A staff member from the Climate and Health team will contact you
to discuss your request.
You may also contact the Climate and Health Team through email:
Vjollca Berisha: [email protected]
Aaron Gettel: [email protected]
Adriana Holmes: [email protected]