Embed Size (px)
Citation preview
DOI:10.23883/IJRTER.2018.4318.TTBCC 71
Heart Rate Calculation by Detection of R Peak
Aditi Sengupta Department of Electronics & Communication Engineering, Siliguri Institute of Technology
Abstract- Electrocardiogram (ECG) is one of the most common bioelectrical signals, which play a
significant role in the diagnosis of heart diseases. One of the most important parts of ECG signal
processing is interpretation of QRS complex and obtaining its characteristics. R wave is one of the
most important sections of this complex, which has an essential role in diagnosis of heart rhythm
irregularities and in determining heart rate variability (HRV). This paper employs Hilbert transforms
and wavelet transforms as well as adaptive thresholding method to investigate an optimal
combination of these signal-processing techniques for the detection of R peak. In the experimental
sections of this paper, the proposed algorithms are evaluated using both ECG signals from MIT-BIH
database and synthetic data simulated in MATLAB environment with different arrhythmias,
artefacts, and noise levels. Finally, by using wavelet and Hilbert transforms as well as by employing
adaptive thresholding technique, an optimal combinational method for R peak detection namely
WHAT is obtained that outperforms other techniques quantitatively and qualitatively.
Keywords- MATLAB stimulator, QRS complex, Hilbert transforms, R peak, wavelet transform
I. INTRODUCTION
The electrocardiogram (ECG) signal is one of the most important and well-known biological signals
used for diagnosing people's health. Detection of QRS complex is one of the most important parts
carried out in the ECG signal analysis. QRS detection, especially detection of R wave in heart signal,
is easier than other portions of ECG signal due to its structural form and high amplitude
Until now, various methods have been reported by researchers for detection of QRS complex such as
differentiation methods, digital filters, filter banks, genetic algorithm, and maximum a posterior
(MAP) estimator. used differentiator operator for detection of QRS complex; Using ordinary filters
is another class of methods used for this purpose, but its high sensitivity to noise and its
incompatibility with frequency of input disorders cause errors in the output of relative function. In
fact, most of the presented methods have a fundamental problem known as sensitivity to noise.
Although, wavelet filters can be proposed for solving this problem, however, the problem of
sensitivity to noise does not solve in these systems completely. In this paper, we try to decrease the
sensitivity to noise by selecting an optimal combination among offered techniques.
In addition to the proposed methods, experimental techniques and averaging in signal decomposition
using partial derivatives and wavelet transforms and also methods based on neural networks have
been proposed for the detection of QRS complex and R wave. Methods based on experimental
techniques or differentiation usually have high sensitivity to noise and methods based on neural
networks are less used because of complication of their designing and learning.
II. DETECTION PROCESS
• An electrocardiogram (ECG or EKG) means recording of electrical activity of the heart.
Small electrical impulses are created in the heart by so-called pacemaker cells. These impulses
spread through the heart muscle and make it contract. ECG records these signals as they travel
through the heart. To the trained specialists, ECG provides large amount of information about the
International Journal of Recent Trends in Engineering & Research (IJRTER) Volume 04, Issue 06; June - 2018 [ISSN: 2455-1457]
@IJRTER-2018, All Rights Reserved 72
structure and the function of the heart. ECG is widely used to detect various abnormalities in heart
rhythm, size of the heart chambers or possible damage to the heart muscle or its nervous system.
• Heart rate variability (HRV) is calculated based on variation of time in milliseconds between
two heartbeats. HRV varies as you breathe in and out and is a relatively new method for assessing. If
we take stress as an example. What makes HRV interesting is the fact that it can reflect changes in
stress while other physiological parameters, like blood pressure, sugar level are still in normal or
accepted ranges. That is why HRV is becoming increasingly popular parameter in the fields of sports
and sports science, corporate health, cardiology, ergonomics, diabetes care and relaxation training
therapy. HRV is also being widely used on physiological research of autonomic nervous system.
• In this section, we are going to make transiting points of zero more evident by using
differentiation technique, which has been used as pre-processing part in the next sections. The reason
is distinguishing QRS complex pattern in order to simplify next stages of processing. In this stage,
place of QRS complex is identified by using the first and second order derivatives and then
windowing technique have been used in order to smooth signal.
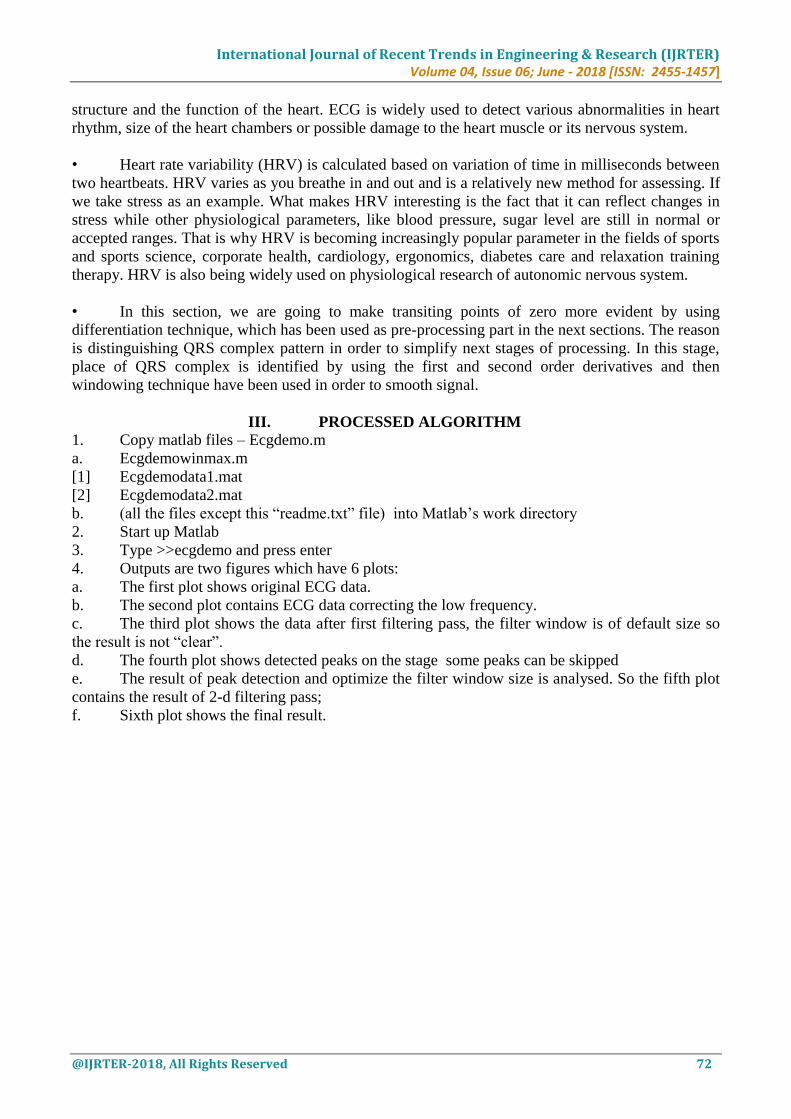
III. PROCESSED ALGORITHM
1. Copy matlab files – Ecgdemo.m
a. Ecgdemowinmax.m
[1] Ecgdemodata1.mat
[2] Ecgdemodata2.mat
b. (all the files except this “readme.txt” file) into Matlab’s work directory
2. Start up Matlab
3. Type >>ecgdemo and press enter
4. Outputs are two figures which have 6 plots:
a. The first plot shows original ECG data.
b. The second plot contains ECG data correcting the low frequency.
c. The third plot shows the data after first filtering pass, the filter window is of default size so
the result is not “clear”.
d. The fourth plot shows detected peaks on the stage some peaks can be skipped
e. The result of peak detection and optimize the filter window size is analysed. So the fifth plot
contains the result of 2-d filtering pass;
f. Sixth plot shows the final result.
International Journal of Recent Trends in Engineering & Research (IJRTER) Volume 04, Issue 06; June - 2018 [ISSN: 2455-1457]
@IJRTER-2018, All Rights Reserved 73
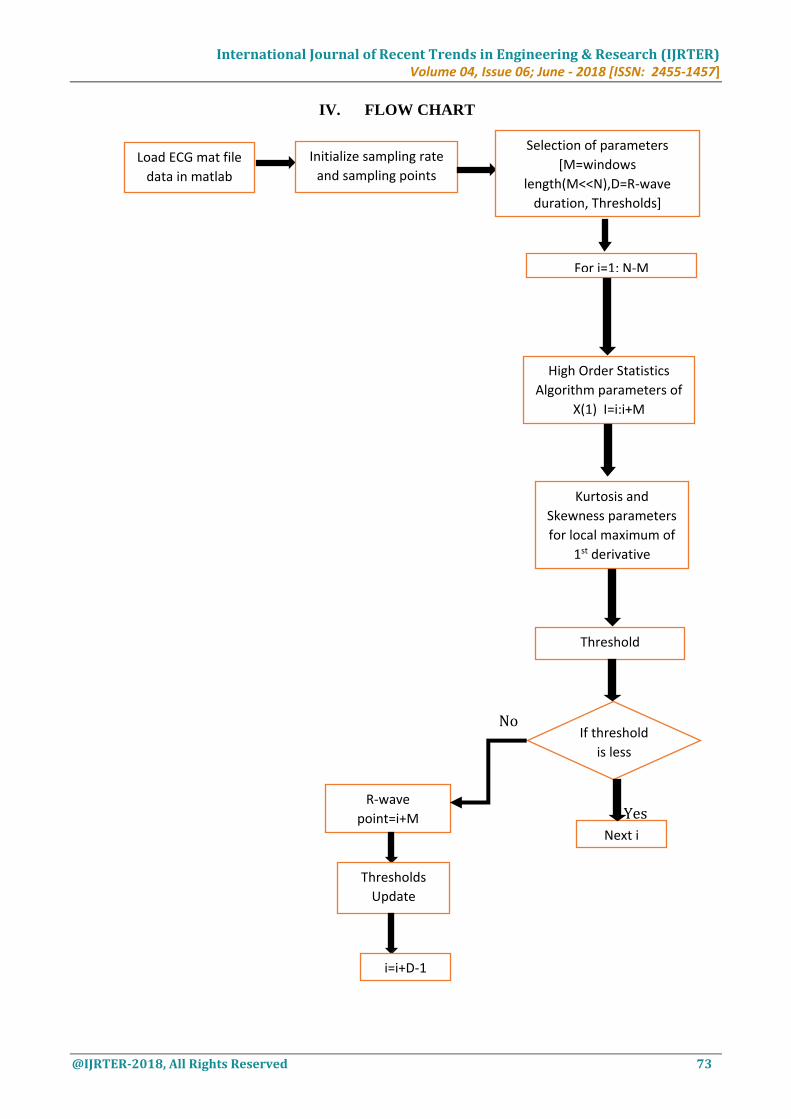
IV. FLOW CHART
No
Yes
Load ECG mat file
data in matlab
Initialize sampling rate
and sampling points
Selection of parameters
[M=windows
length(M<<N),D=R-wave
duration, Thresholds]
For i=1: N-M
High Order Statistics
Algorithm parameters of
Χ(1) I=i:i+M
Kurtosis and
Skewness parameters
for local maximum of
1st derivative
If threshold
is less
Threshold
Next i
R-wave
point=i+M
Thresholds
Update
i=i+D-1
International Journal of Recent Trends in Engineering & Research (IJRTER) Volume 04, Issue 06; June - 2018 [ISSN: 2455-1457]
@IJRTER-2018, All Rights Reserved 74
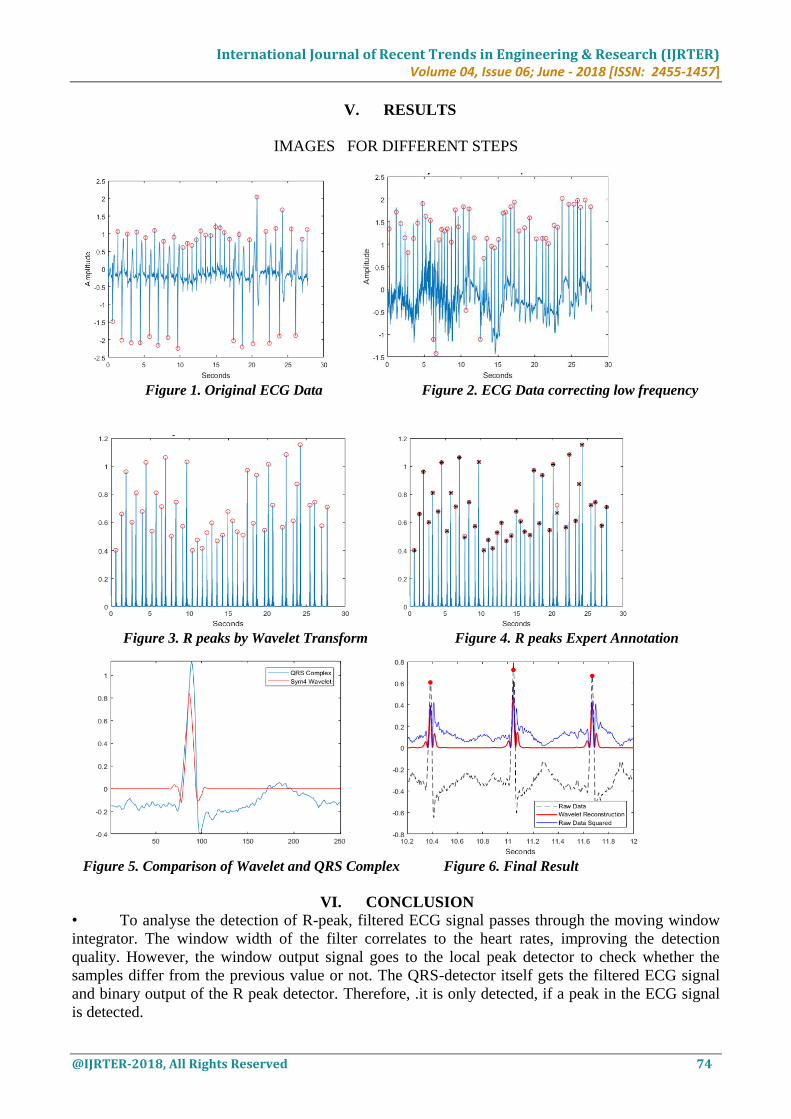
V. RESULTS
IMAGES FOR DIFFERENT STEPS
Figure 1. Original ECG Data Figure 2. ECG Data correcting low frequency
Figure 3. R peaks by Wavelet Transform Figure 4. R peaks Expert Annotation
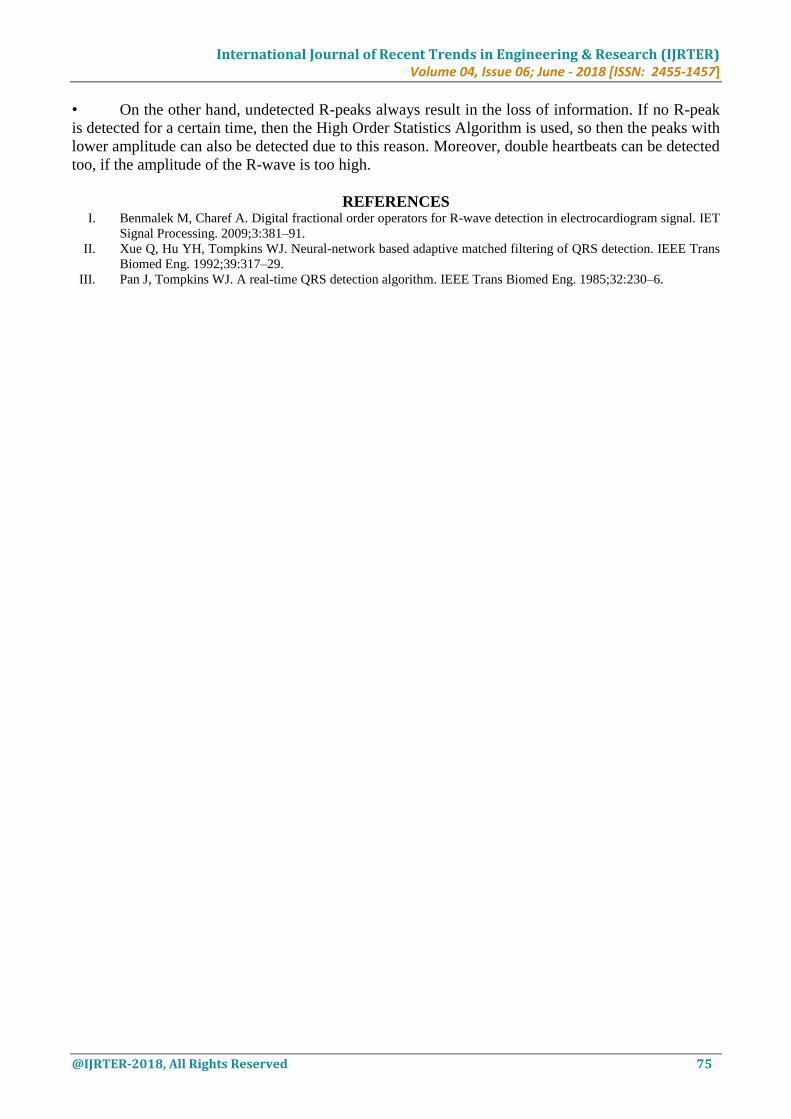
Figure 5. Comparison of Wavelet and QRS Complex Figure 6. Final Result
VI. CONCLUSION
• To analyse the detection of R-peak, filtered ECG signal passes through the moving window
integrator. The window width of the filter correlates to the heart rates, improving the detection
quality. However, the window output signal goes to the local peak detector to check whether the
samples differ from the previous value or not. The QRS-detector itself gets the filtered ECG signal
and binary output of the R peak detector. Therefore, .it is only detected, if a peak in the ECG signal
is detected.
International Journal of Recent Trends in Engineering & Research (IJRTER) Volume 04, Issue 06; June - 2018 [ISSN: 2455-1457]
@IJRTER-2018, All Rights Reserved 75
• On the other hand, undetected R-peaks always result in the loss of information. If no R-peak
is detected for a certain time, then the High Order Statistics Algorithm is used, so then the peaks with
lower amplitude can also be detected due to this reason. Moreover, double heartbeats can be detected
too, if the amplitude of the R-wave is too high.
REFERENCES I. Benmalek M, Charef A. Digital fractional order operators for R-wave detection in electrocardiogram signal. IET
Signal Processing. 2009;3:381–91.
II. Xue Q, Hu YH, Tompkins WJ. Neural-network based adaptive matched filtering of QRS detection. IEEE Trans
Biomed Eng. 1992;39:317–29.
III. Pan J, Tompkins WJ. A real-time QRS detection algorithm. IEEE Trans Biomed Eng. 1985;32:230–6.