Embed Size (px)
DESCRIPTION
Heart Pump and Cardiac Cycle. Faisal I. Mohammed, MD, PhD. Objectives. To understand the volume, mechanical, pressure and electrical changes during the cardiac cycle To understand the inter-relationship between all these changes - PowerPoint PPT Presentation
Citation preview
1
Heart Pump and Cardiac Cycle
Faisal I. Mohammed, MD, PhD
2
Objectives
To understand the volume, mechanical, pressure and electrical changes during the cardiac cycle
To understand the inter-relationship between all these changes
To describe the factors that regulate Cardiac output and Stroke volume.
Resources: Textbook of Medical Physiology By Guyton and Hall 12th Edition.
3
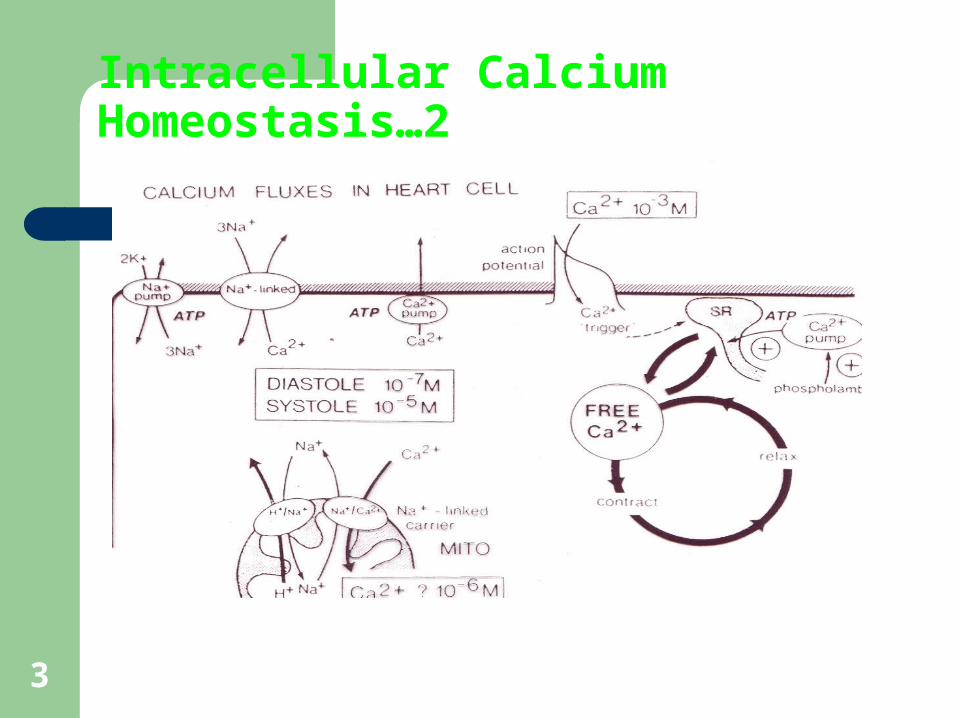
Intracellular Calcium Homeostasis…2
4
5
6
Cardiac Cycle
Cardiac cycle refers to all events associated with blood flow through the heart– Systole – contraction of heart
muscle– Diastole – relaxation of heart muscle
7
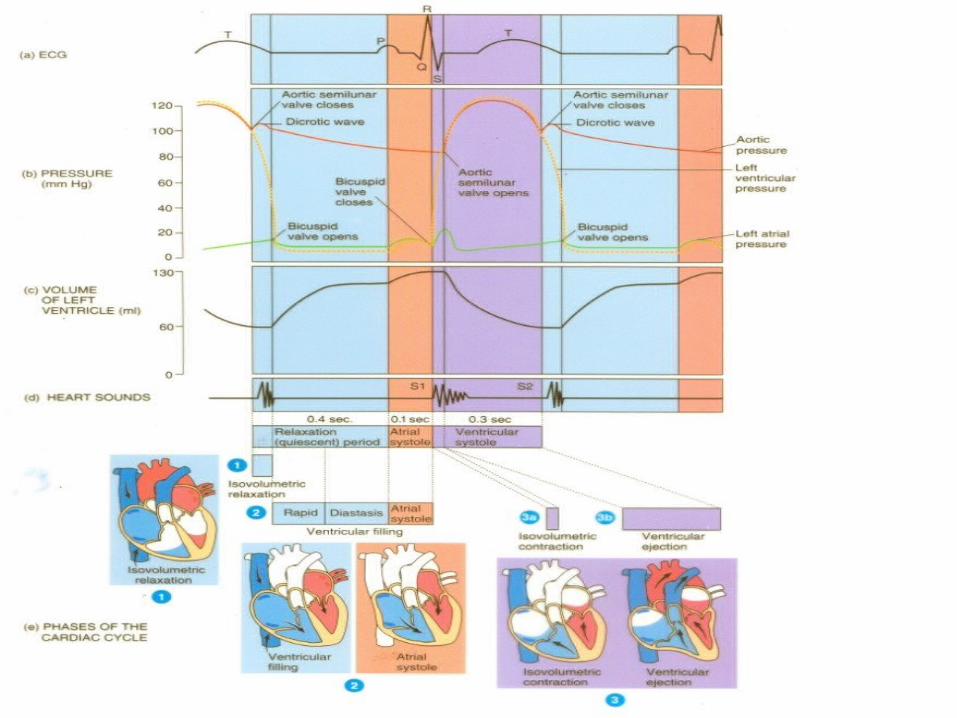
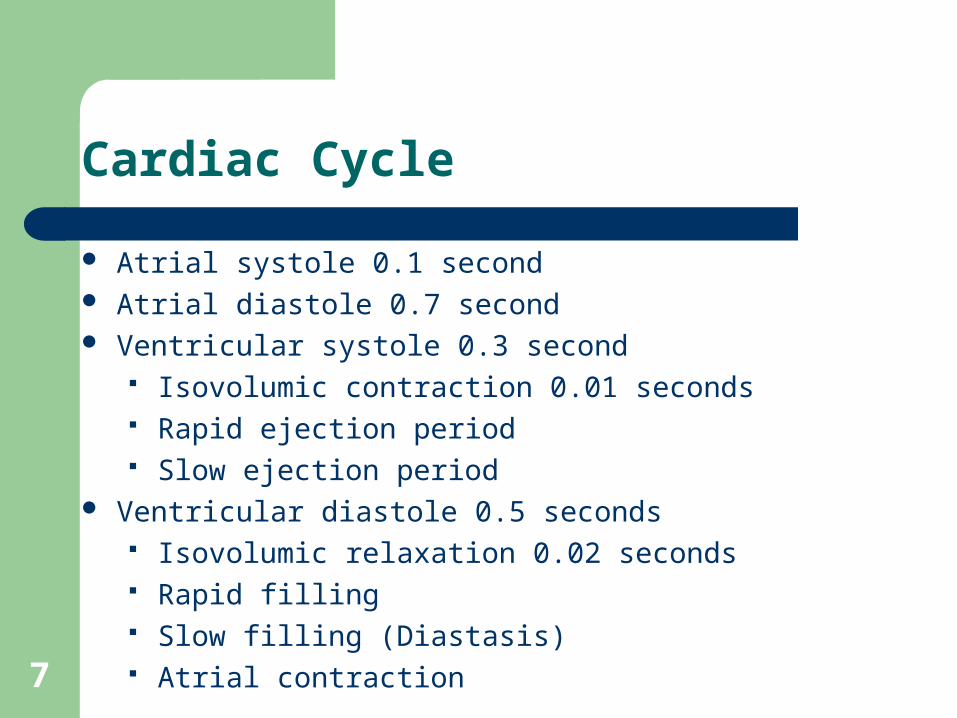
Cardiac Cycle
Atrial systole 0.1 second Atrial diastole 0.7 second Ventricular systole 0.3 second
Isovolumic contraction 0.01 seconds Rapid ejection period Slow ejection period
Ventricular diastole 0.5 seconds Isovolumic relaxation 0.02 seconds Rapid filling Slow filling (Diastasis) Atrial contraction
8
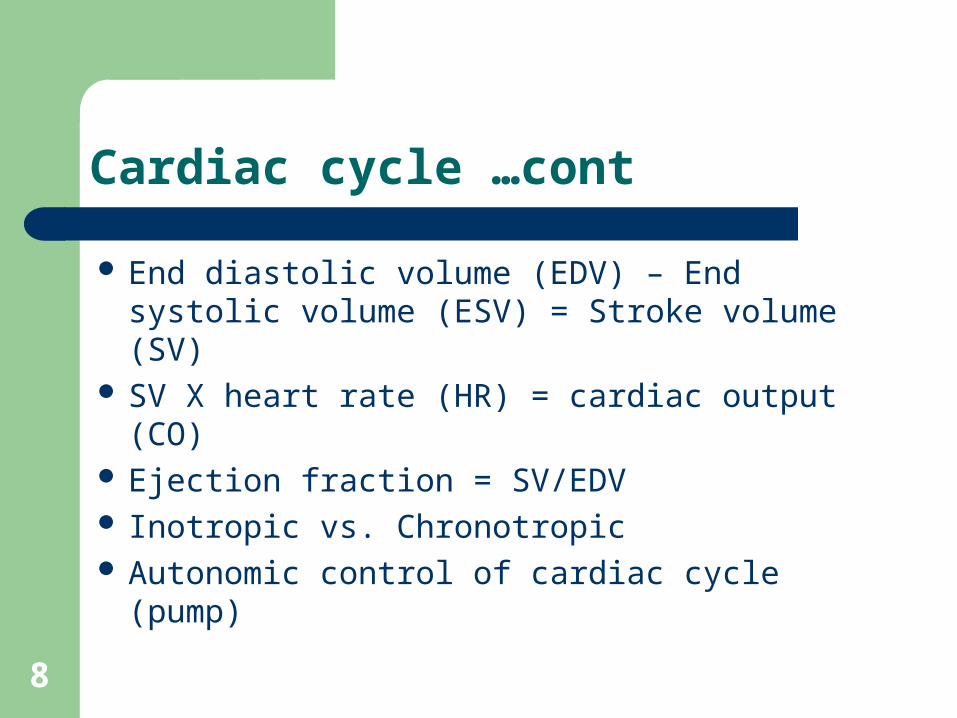
Cardiac cycle …cont
End diastolic volume (EDV) – End systolic volume (ESV) = Stroke volume (SV)
SV X heart rate (HR) = cardiac output (CO) Ejection fraction = SV/EDV Inotropic vs. Chronotropic Autonomic control of cardiac cycle (pump)
9
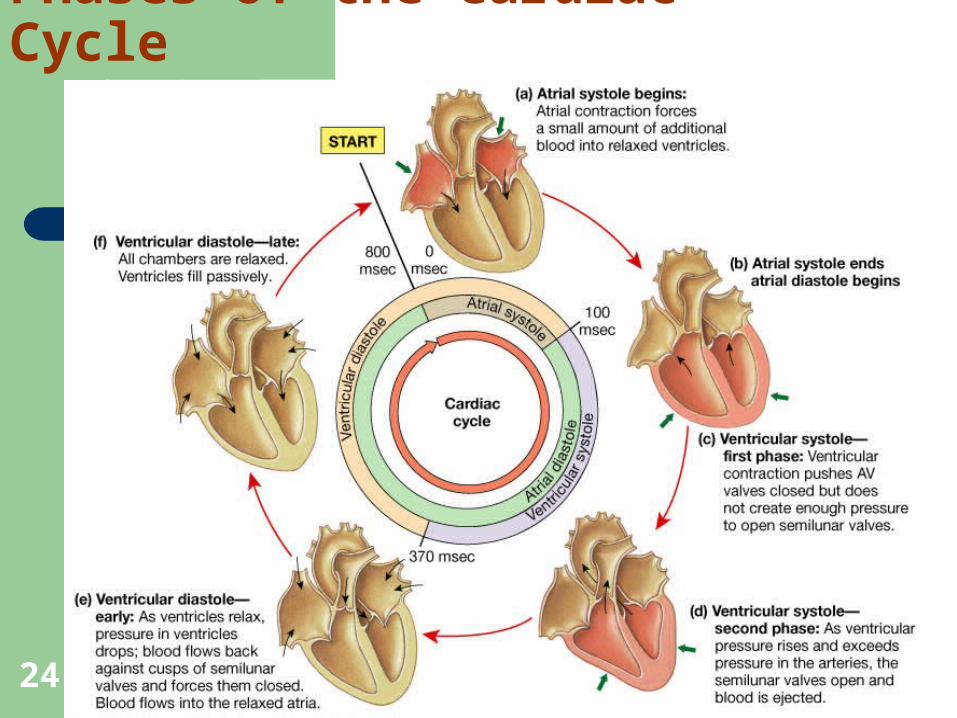
Ventricular filling – mid-to-late diastole– Heart blood pressure is low as blood
enters atria and flows into ventricles– AV valves are open, then atrial
systole occurs
Phases of the Cardiac Cycle
10
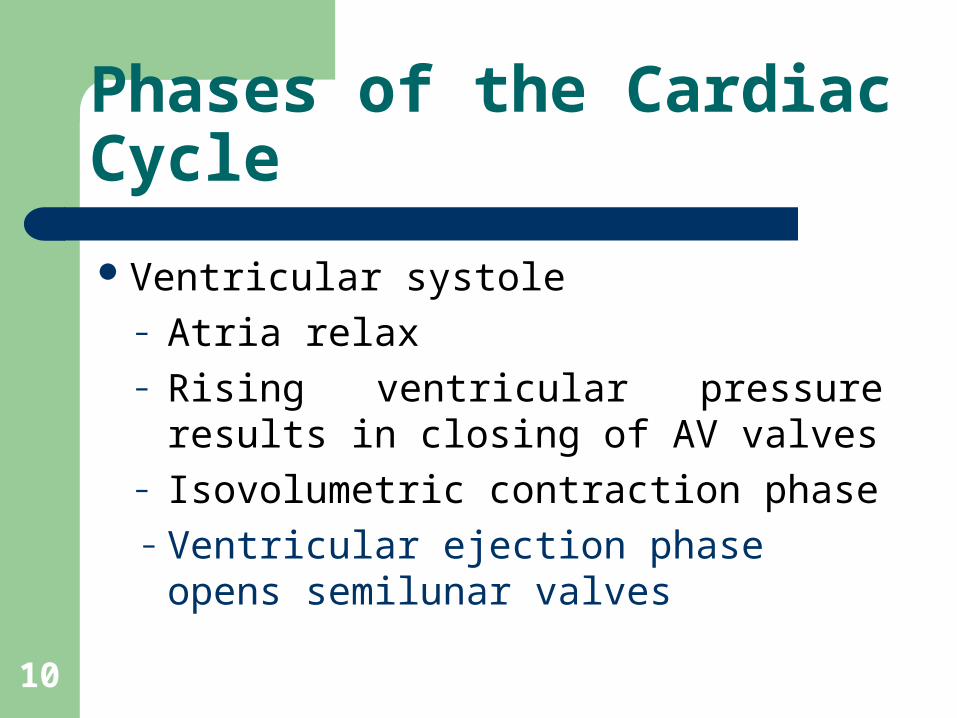
Ventricular systole– Atria relax – Rising ventricular pressure results in
closing of AV valves– Isovolumetric contraction phase– Ventricular ejection phase opens
semilunar valves
Phases of the Cardiac Cycle

11
Phases of the Cardiac Cycle
Isovolumetric relaxation – early diastole– Ventricles relax– Backflow of blood in aorta and pulmonary
trunk closes semilunar valvesDicrotic notch – brief rise in aortic pressure
caused by backflow of blood rebounding off semilunar valves
12
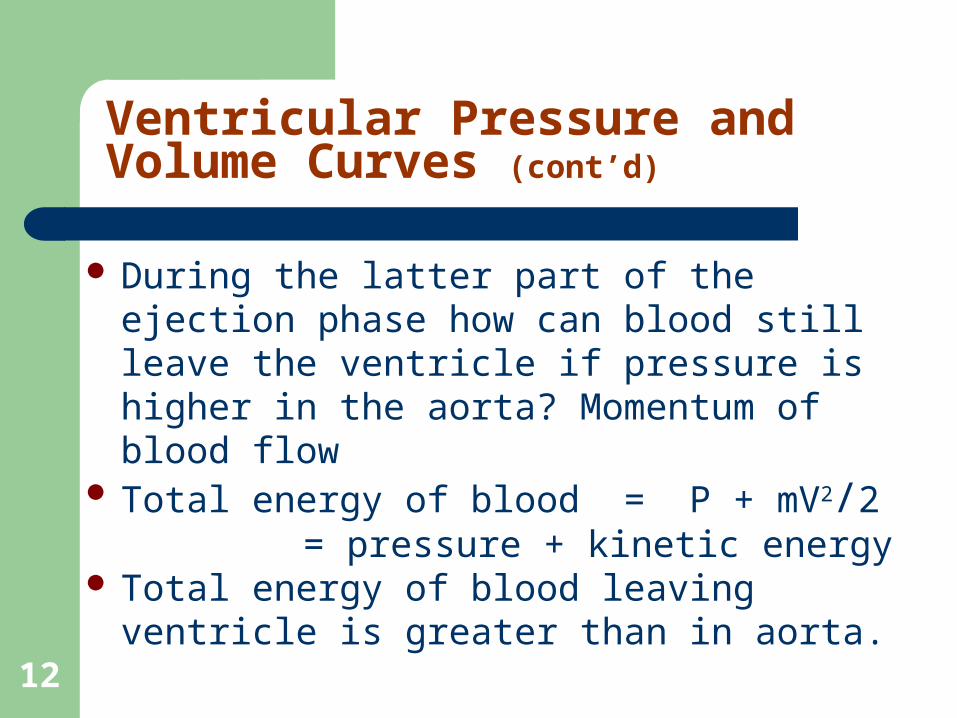
During the latter part of the ejection phase how can blood still leave the ventricle if pressure is higher in the aorta? Momentum of blood flow
Total energy of blood = P + mV2/2 = pressure + kinetic energy
Total energy of blood leaving ventricle is greater than in aorta.
Ventricular Pressure and Volume Curves (cont’d)
13
Aortic Pressure Curve
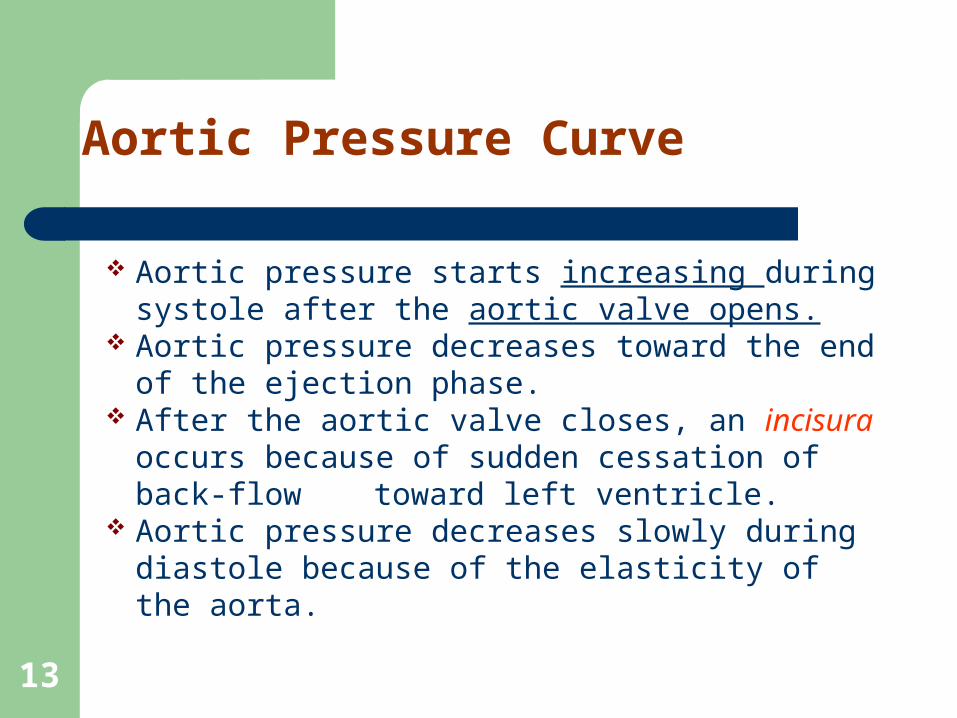
Aortic pressure starts increasing during systole after the aortic valve opens.
Aortic pressure decreases toward the end of the ejection phase.
After the aortic valve closes, an incisura occurs because of sudden cessation of back-flow toward left ventricle.
Aortic pressure decreases slowly during diastole because of the elasticity of the aorta.
15
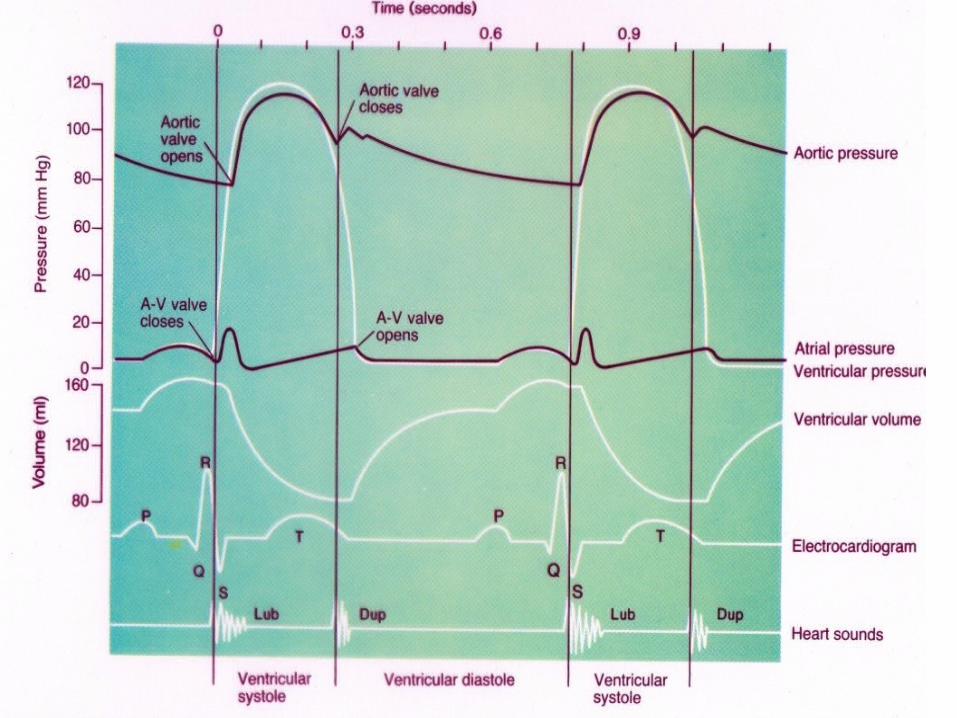
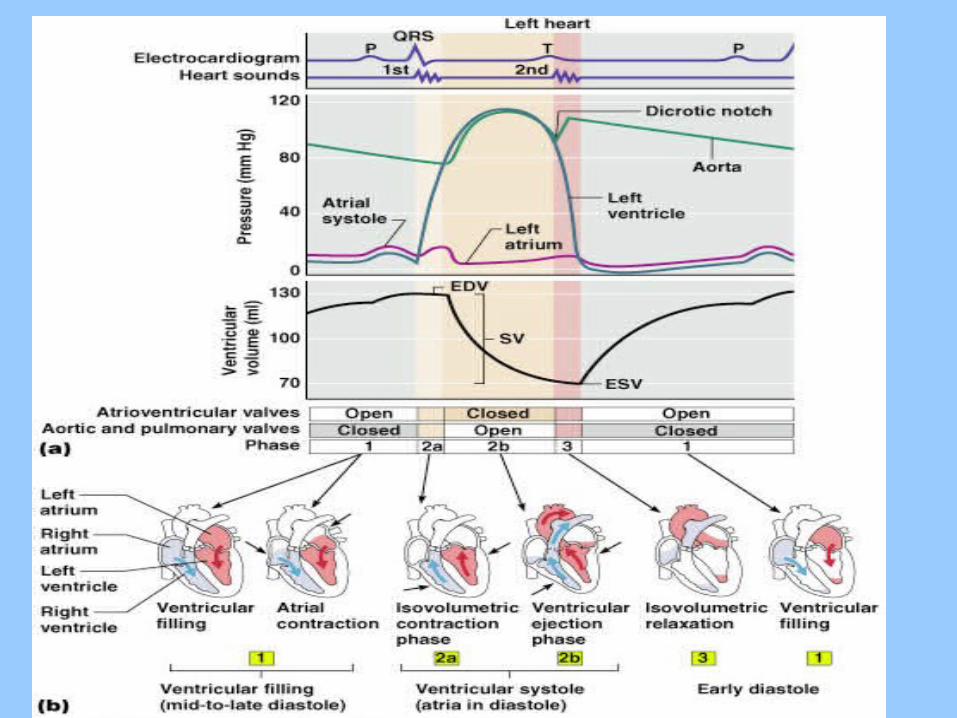
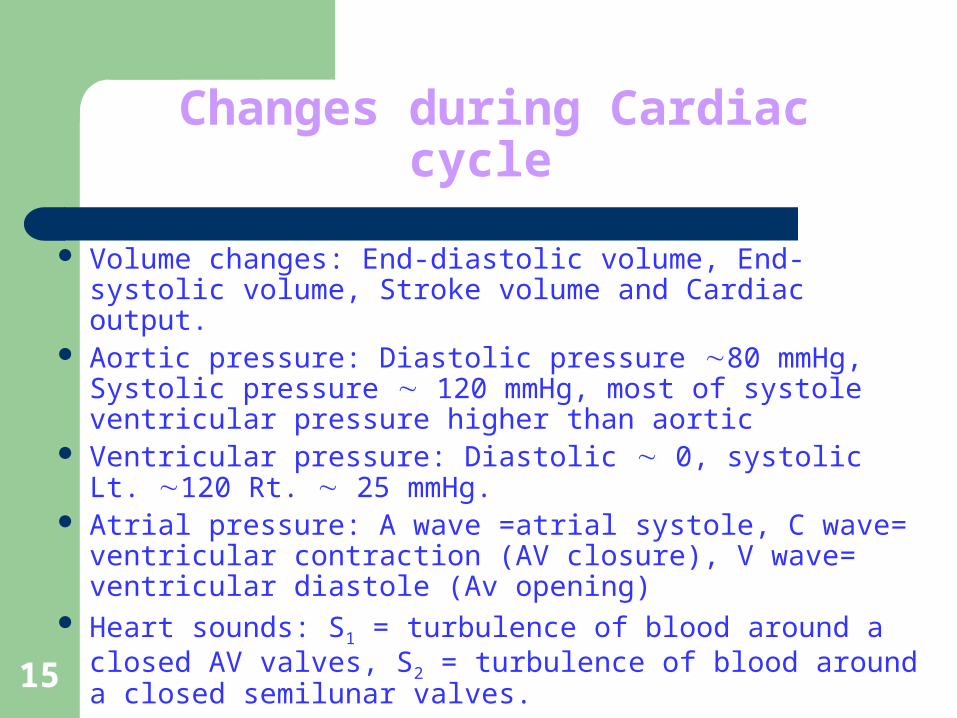
Changes during Cardiac cycle
Volume changes: End-diastolic volume, End-systolic volume, Stroke volume and Cardiac output.
Aortic pressure: Diastolic pressure 80 mmHg, Systolic pressure 120 mmHg, most of systole ventricular pressure higher than aortic
Ventricular pressure: Diastolic 0, systolic Lt. 120 Rt. 25 mmHg.
Atrial pressure: A wave =atrial systole, C wave= ventricular contraction (AV closure), V wave= ventricular diastole (Av opening)
Heart sounds: S1 = turbulence of blood around a closed AV valves, S2 = turbulence of blood around a closed semilunar valves.
16
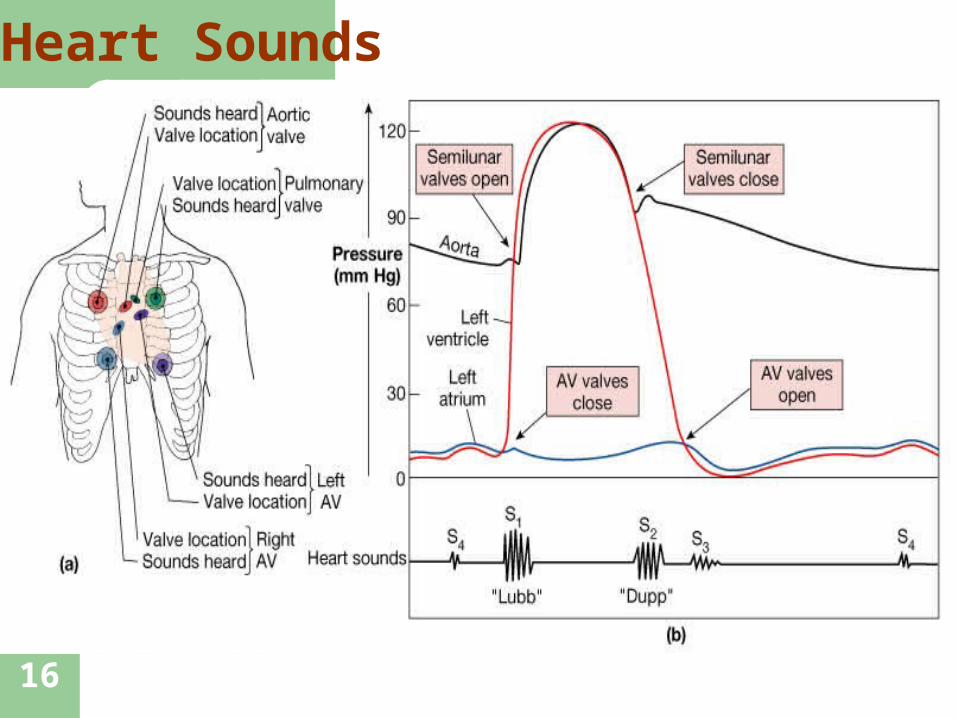
Heart Sounds
17
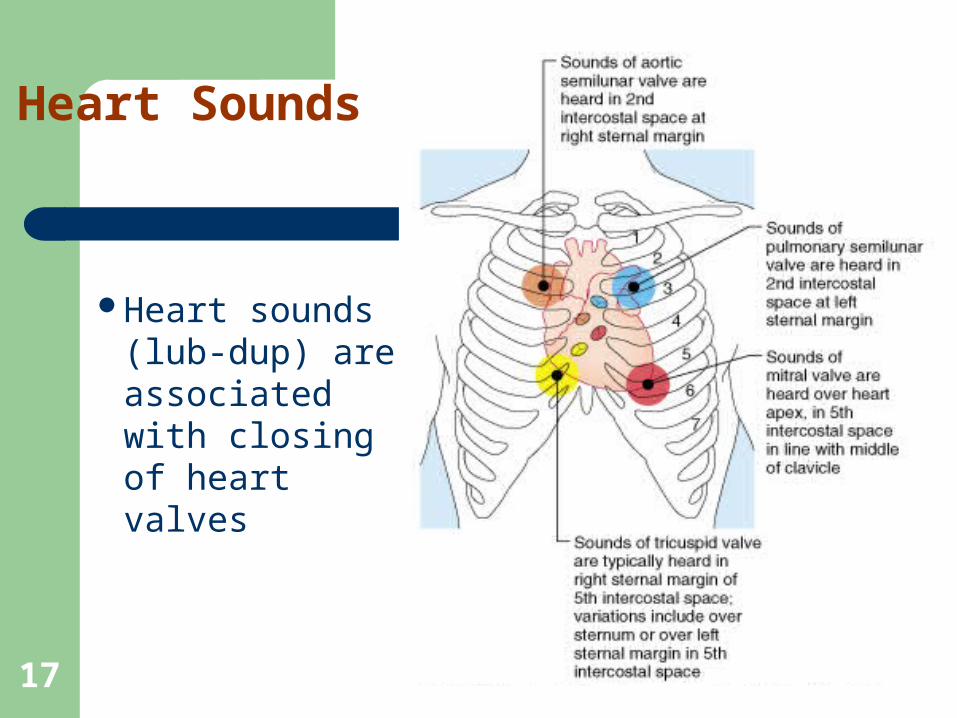
Heart Sounds
Heart sounds (lub-dup) are associated with closing of heart valves
18
Auscultation – listening to heart sound via stethoscope Four heart sounds
– S1 – “lubb” caused by the closing of the AV valves
– S2 – “dupp” caused by the closing of the semilunar valves
– S3 – a faint sound associated with blood flowing into the ventricles
– S4 – another faint sound associated with atrial contraction
Heart sounds
19
Cardiac Output: Example
CO (ml/min) = HR (75 beats/min) x SV (70 ml/beat)
CO = 5250 ml/min (5.25 L/min)
20
Regulation of Stroke Volume
SV = end diastolic volume (EDV) minus end systolic volume (ESV)
EDV = amount of blood collected in a ventricle during diastole
ESV = amount of blood remaining in a ventricle after contraction
21
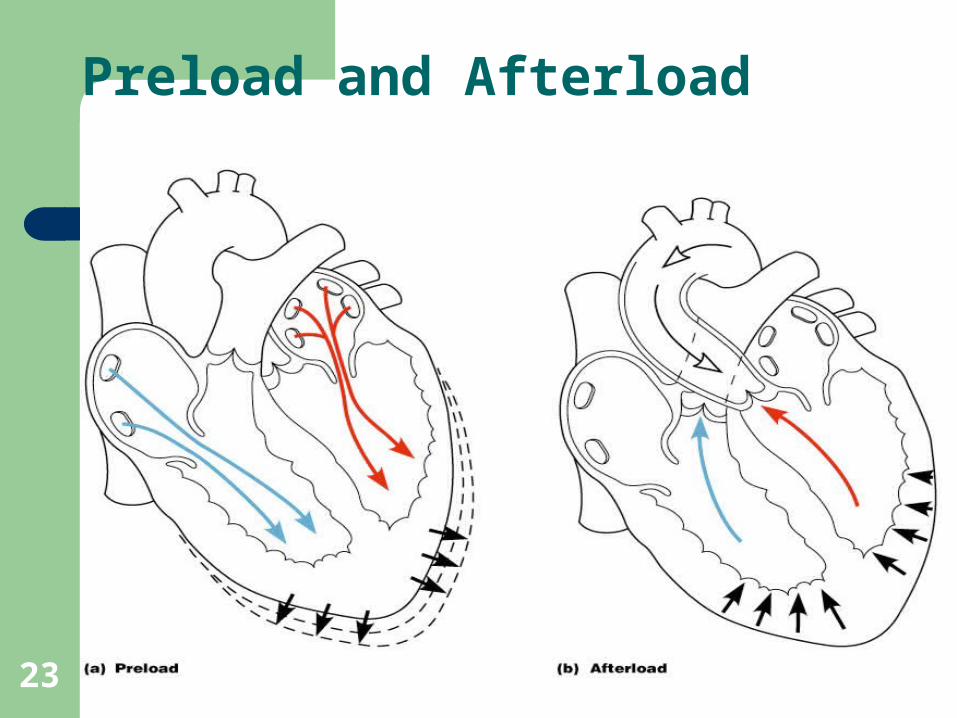
Factors Affecting Stroke Volume
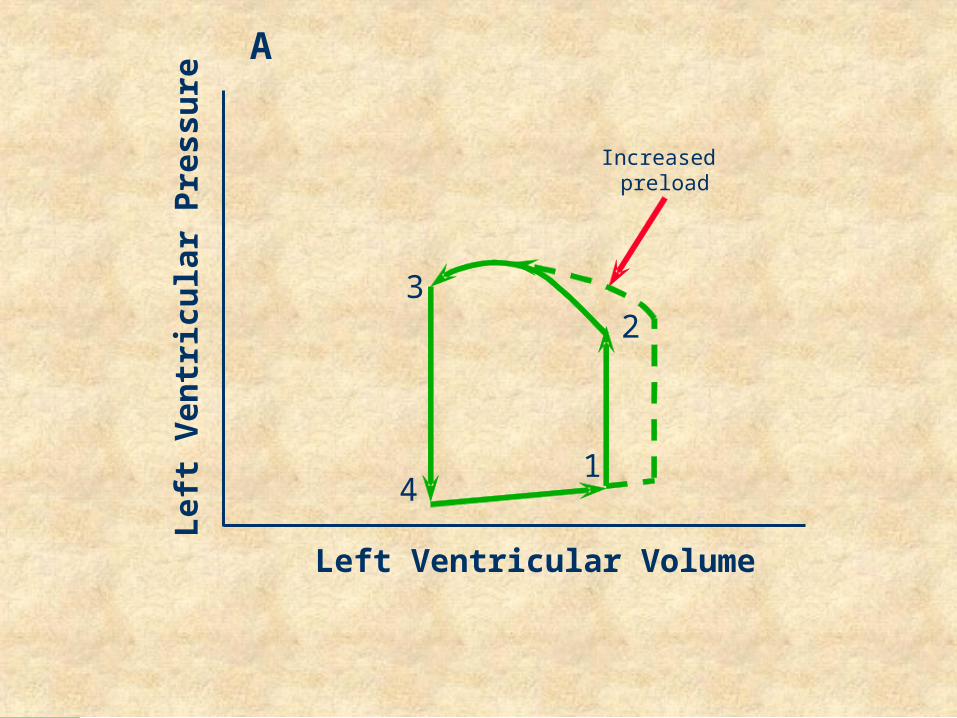
Preload – amount ventricles are stretched by contained blood
Contractility – cardiac cell contractile force due to factors other than EDV
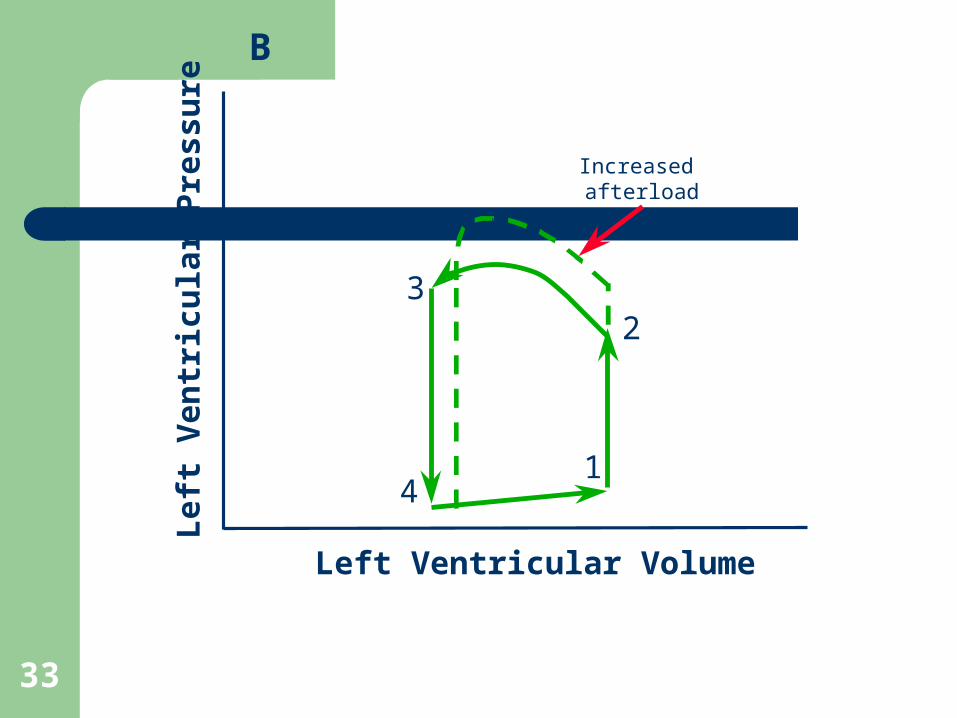
Afterload – back pressure exerted by blood in the large arteries leaving the heart
22
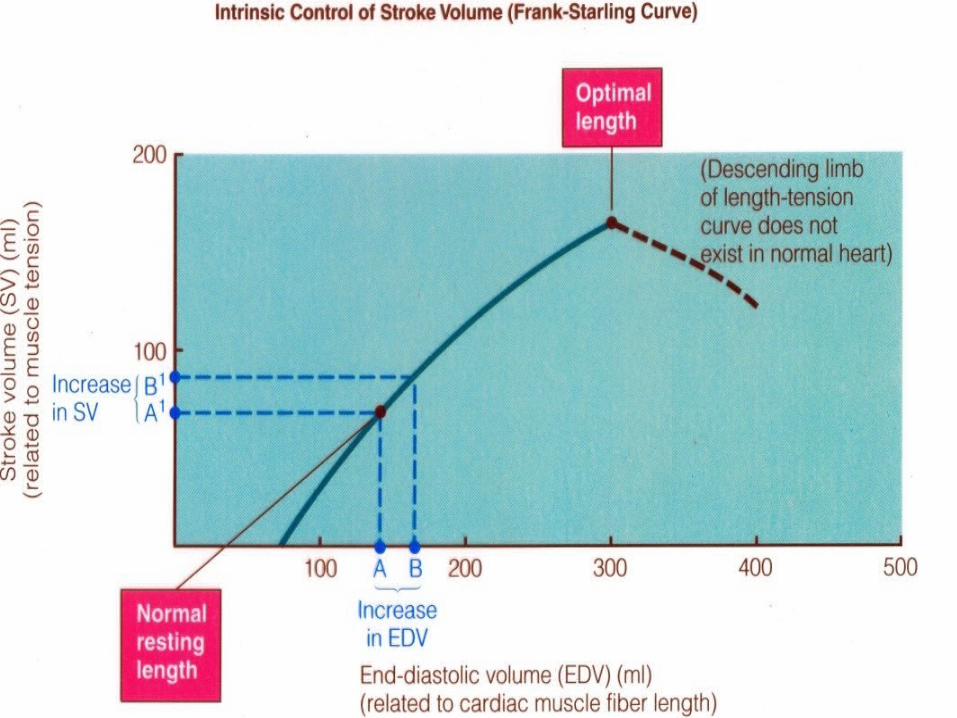
Frank-Starling Law of the Heart
Preload, or degree of stretch, of cardiac muscle cells before they contract is the critical factor controlling stroke volume
Slow heartbeat and exercise increase venous return to the heart, increasing SV
Blood loss and extremely rapid heartbeat decrease SV
23
Preload and Afterload
24
Phases of the Cardiac Cycle
25
Extrinsic Factors Influencing Stroke Volume
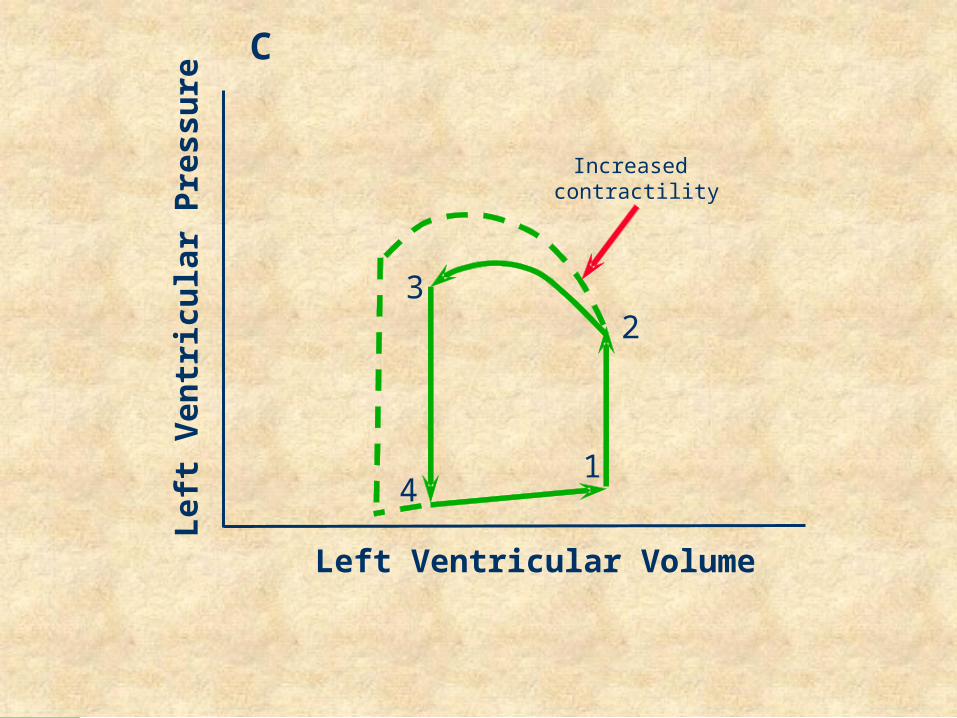
Contractility is the increase in contractile strength, independent of stretch and EDV
Increase in contractility comes from: – Increased sympathetic stimuli– Certain hormones– Ca2+ and some drugs
26
Extrinsic Factors Influencing Stroke Volume
Agents/factors that decrease contractility include:– Acidosis– Increased extracellular K+
– Calcium channel blockers
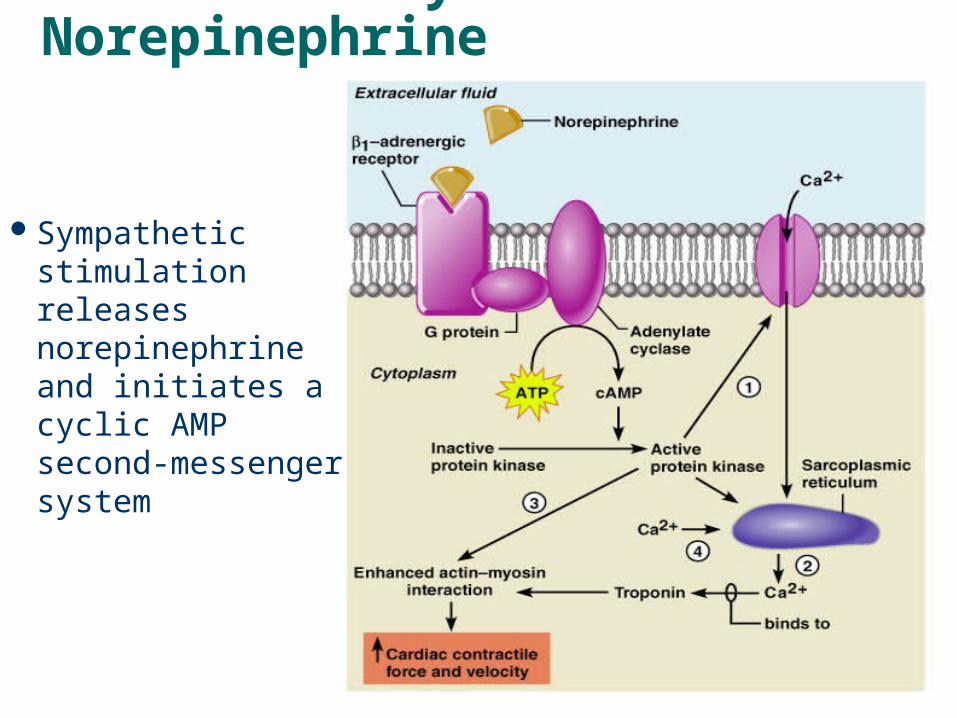
Contractility and Norepinephrine
Sympathetic stimulation releases norepinephrine and initiates a cyclic AMP second-messenger system
28
29
Valvular Function
To prevent back-flow. Chordae tendineae are attached to A-V valves. Papillary muscle, attached to chordae
tendineae, contract during systole and help prevent back-flow.
Because of smaller opening, velocity through aortic and pulmonary valves exceed that through the A-V valves.
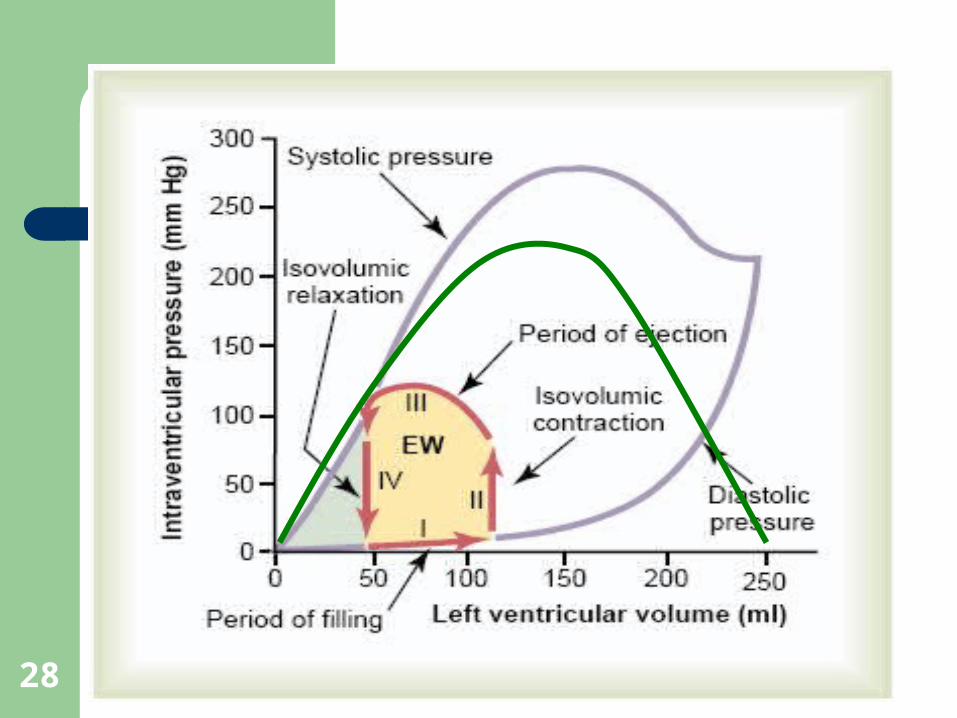
Valvular Function (cont’d)
Most work is external work or pressure-volume work.
A small amount of work is required to impart kinetic energy to the heart (1/2 mV2).
What is stroke-volume in previous figure? External work is area of Pressure-Volume curve. Work output is affected by “preload” (end-
diastolic pressure) and “afterload” (aortic pressure).
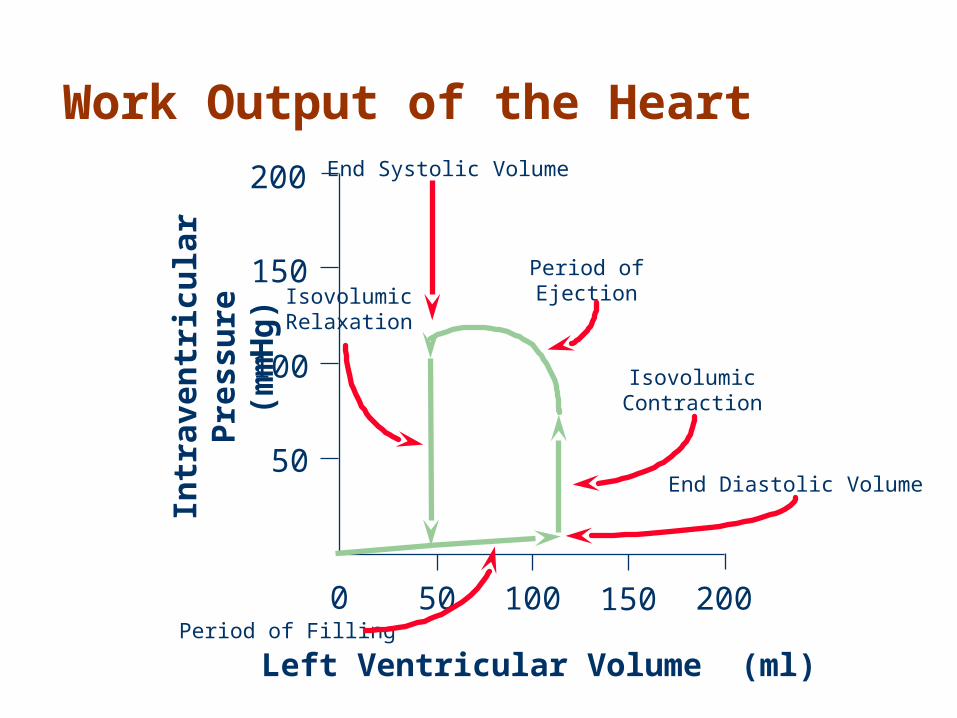
50
100
150
200
50 100 150 2000
Intr
aven
tric
ula
r P
ress
ure
(m
mH
g)
Left Ventricular Volume (ml)Period of Filling
IsovolumicRelaxation
Period ofEjection
IsovolumicContraction
End Systolic Volume
End Diastolic Volume
Work Output of the Heart
32
Left Ventricular Volume
Lef
t V
entr
icu
lar
Pre
ssu
re
A
3
41
2
Increased preload
33
Left Ventricular Volume
Lef
t V
entr
icu
lar
Pre
ssu
re
B
Increased afterload
3
4
2
1
34
Lef
t V
entr
icu
lar
Pre
ssu
re
Left Ventricular Volume
C
Increased contractility
3
4
2
1
35
0
10
20
30
40
10 20
Left Atrial Mean Pressure(mm Hg)
L.V.strokework(gram
meters)
0
1
2
3
4
10 20
Right Atrial Mean Pressure(mm Hg)
R.V.strokework(gram
meters)
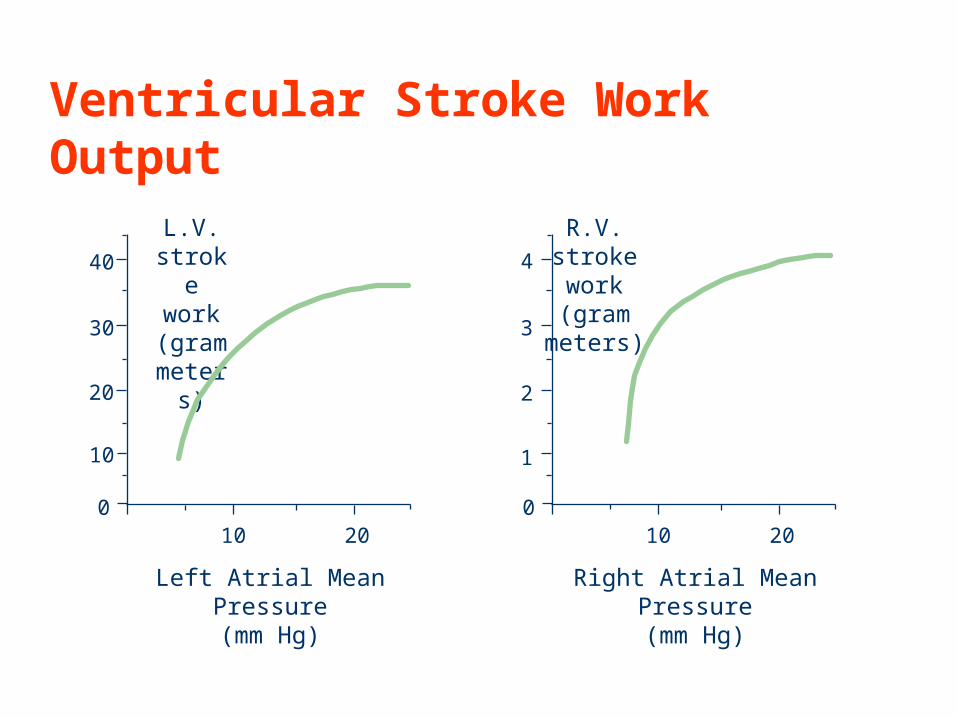
Ventricular Stroke Work Output
37
Regulation of Heart Rate
Positive chronotropic factors increase heart rate
Negative chronotropic factors decrease heart rate
38
Sympathetic nervous system (SNS) stimulation is activated by stress, anxiety, excitement, or exercise
Parasympathetic nervous system (PNS) stimulation is mediated by acetylcholine and opposes the SNS
PNS dominates the autonomic stimulation, slowing heart rate and causing vagal tone
Regulation of Heart Rate: Autonomic Nervous System
Autonomic Effects on Heart
Sympathetic stimulation causes increased HR and increased contractility with HR = 180-200 and C.O. = 15-20 L/min.
Parasympathetic stimulation decreases HR markedly and decreases cardiac contractility slightly. Vagal fibers go mainly to atria.
Fast heart rate (tachycardia) can decrease C.O. because there is not enough time for heart to fill during diastole.
40
Atrial (Bainbridge) Reflex
Atrial (Bainbridge) reflex – a sympathetic reflex initiated by increased blood in the atria– Causes stimulation of the SA node– Stimulates baroreceptors in the atria,
causing increased SNS stimulation
41
Chemical Regulation of the Heart
The hormones epinephrine and thyroxine increase heart rate
Intra- and extracellular ion concentrations must be maintained for normal heart function
Cardiac Contractility
Best is to measure the C.O. curve, but this is nearly impossible in humans.
dP/dt is not an accurate measure because this increases with increasing preload and afterload.
(dP/dt)/P ventricle is better. P ventricle is instantaneous ventricular pressure.
Excess K+ decreases contractility. Excess Ca++ causes spastic contraction, and
low Ca++ causes cardiac dilation.
43
Ejection Fraction
End diastolic volume = 125 ml End systolic volume = 55 ml Ejection volume (stroke volume) = 70 ml Ejection fraction = 70ml/125ml = 56%
(normally 60%) If heart rate (HR) is 70 beats/minute, what is
cardiac output? Cardiac output = HR * stroke volume
= 70/min. * 70 ml = 4900ml/min.
44
Ejection Fraction (cont’d)
If HR =100, end diastolic volume = 180 ml, end systolic vol. = 20 ml, what is cardiac
output? C.O. = 100/min. * 160 ml = 16,000 ml/min. Ejection fraction= 160/180%=~ 90%

45
Thank YouThank You