Embed Size (px)
Citation preview

Running head: FRUIT AND VEGETABLE CONSUMPTION 1
Heart-Healthy Fruit and Vegetable Consumption by Young Adults in Ohio
Nicole Scheidler
The Ohio State University
FRUIT AND VEGETABLE CONSUMPTION 2
Abstract
Cardiovascular disease (CVD) remains the leading cause of death across the United States. A
single dietary change of increasing antioxidant-rich fruit and vegetable consumption can
significantly decrease CVD risk. Thus in 2006, the American Heart Association (AHA) began
promoting 8-10 daily servings of fruits and vegetables. The purpose of this secondary analysis
of data from two parent studies was to determine if young adults in Central Ohio are meeting
AHA fruit and vegetable recommendations and to describe associations between fruit and
vegetable consumption, anthropometric measurements, education, and income. A socioeconomic
model of health and its inequalities (Dahlgren & Whitehead) guided variable choices. Sample:
Sixty healthy young adults from Central Ohio, ages 18-45 years. Methods: A descriptive, cross-
sectional design was used to determine daily fruit and vegetable intake and evaluate relationships
between variables. Lifestyle and food frequency questionnaires were completed by participants
at The Ohio State University (OSU) Clinical Research Center (CRC). Anthropometric data were
collected by CRC nurses. Results: The sample majority (87%) did not meet AHA fruit and
vegetable recommendations. On average, participants consumed 2 servings (SD = 1.69) of fruit
and 2 servings (SD = 2.45) of vegetables per day, which fall well below the minimum 8 daily
servings advisement. A strong positive correlation emerged between vegetable consumption and
income (p = 0.05). Furthermore, an average body mass index of 25.78 (SD = 5.89) classified the
group as overweight, placing it at increased risk for several chronic diseases including CVD.
Conclusions: Young adults in Central Ohio may not be consuming enough heart-healthy fruits
and vegetables to lower their CVD risk. Developing strategies to promote AHA guidelines and
identifying barriers to meeting the guidelines may improve long-term health in this population.
Keywords: fruits, vegetables, cardiovascular health
FRUIT AND VEGETABLE CONSUMPTION 3
I. Introduction
Cardiovascular disease (CVD) is the most significant healthcare issue across the globe in
terms of cost and lives affected. An estimated 17.3 million people died worldwide from CVD in
2008, representing 30% of all global deaths and ranking CVD as the number one cause of
mortality (WHO, 2011). Furthermore, as the leading cause of mortality in both men and women
in the U.S., CVD is linked to more than 2,200 daily deaths (Roger et al., 2011). It has been
estimated that CVD leads to one U.S. death every 39 seconds. Among the 50 states and the
District of Columbia, the state of Ohio ranks 14th
in heart disease mortality rates (DeFiore-
Hyrmer & Pryor, 2009). In 2003, there were more than 190,000 CVD-associated
hospitalizations in Ohio, accounting for $4.8 billion in charges. Furthermore, in 2005, CVD was
associated with 27% (28,995) of all Ohio deaths. If these dramatic trends continue, it is
predicted that almost 23.6 million people worldwide will die from CVD by 2030 (WHO, 2011).
Although genetic factors play a significant role in the pathogenesis of CVD, there is a
growing body of evidence that the effectiveness of lifestyle improvement strategies such as
maintaining a healthy weight and choosing nutrient dense foods help prevent CVD (Lichtenstein
et al., 2006). In spite of what is known about CVD prevention, however, the incidence and
mortality rates continue to rise. Therefore, developing and disseminating innovative messaging
strategies regarding CVD prevention should be major priorities for nurses and other healthcare
professionals. One valuable lifestyle change that nurses can recommend to all patients, but
especially to younger adults who may benefit the most from CVD prevention strategies, involves
a cost-effective, non-pharmacological approach: choosing a healthier eating pattern. Importantly,
a single dietary change of increasing antioxidant-rich fruits and vegetables has been linked to the
prevention of CVD morbidity and mortality (Bazzano et al., 2002; Joshipura et al., 2001; Liu,
FRUIT AND VEGETABLE CONSUMPTION 4
Lee, et al., 2001; Liu, Manson, et al., 2000). Thus, the American Heart Association (AHA)
began recommending 8-10 daily servings of fruits and vegetables in 2006 as a strategy to prevent
CVD (Lichtenstein et al., 2006). On the global front, the World Health Organization (WHO)
recently reported that inadequate consumption of fruits and vegetables is associated with up to
2.635 million deaths per year and that increasing individual intake to 600g/day could reduce the
worldwide burden of CVD related morbidity and mortality by 31% (Lock, Pomerleau, Causer,
Altmann, & McKee, 2005). The collective scientific evidence provides support for evaluating
the impact that the AHA’s fruit and vegetable advisements have on intake levels in the U.S.,
especially in population groups that could benefit the most from CVD prevention strategies.
Public health clinicians and policymakers often use socioeconomic models of health and
its inequalities in the development of health promotion strategies to ensure that interventions
support all subgroups of society and that care is directed in proportion to need (“Inequalities and
Health,” n.d.). A frequently used socioeconomic model of health inequalities is one developed
by Dahlgren and Whitehead (1991). Their theoretical framework conceptualizes how a range of
factors, or social determinants, can influence an individual's potential for health (“Inequalities
and Health,” n.d.). The individual is at the center of the model. Non-modifiable factors
influencing health include age, gender, and genetic predisposition to disease. Modifiable
determinants of health surround the individual and are depicted as a series of layers of influence;
personal lifestyle factors (e.g. diet, physical activity, smoking, and alcohol or drug use); social
and community factors (e.g. crime, social exclusion, and local cultural practices); environmental
living and working conditions (e.g. housing and air or water sanitation); and general
socioeconomic factors (e.g. poverty, income, and education). Thus, the Dahlgren and Whitehead
(1991) model of health inequalities guided variable choices in the current study that could impact
FRUIT AND VEGETABLE CONSUMPTION 5
health (fruit and vegetable consumption, education, income, and anthropometric measures, which
reflect diet and physical activity choices).
Although some studies have evaluated fruit and vegetable consumption patterns of the
general U.S. population (Casagrande, Wang, Anderson, & Gary, 2007; Grimm et al., 2010;
Guenther, Dodd, Reedy, & Krebs-Smith, 2006; Kimmons, Gillespie, Seymour, Serdula, &
Blanck, 2009; Krebs-Smith, Cook, Subar, Cleveland, & Friday, 1995; Serdula et al., 1995; Subar
et al., 1995; Thompson et al., 1999), the patterns of young adults who live in geographic
locations known to have a higher prevalence of CVD morbidity and mortality, such as the state
of Ohio, are unclear. Determining the average daily intake of fruits and vegetables and potential
barriers to meeting the AHA recommendations in a sample of young adults in Ohio will generate
new knowledge that can be used to inform the development of innovative strategies to encourage
fruit and vegetable consumption in this population sector. Thus, the purpose of this secondary
analysis of data from two parent studies was to compare the average daily servings of fruits and
vegetables consumed by a sample of young adults in Central Ohio to the AHA recommended
daily levels and to determine relationships between the number of daily servings of fruits and
vegetables and key factors associated with CVD risk such as body mass index (BMI) and sagittal
abdominal diameter (SAD), a measure of visceral obesity. In addition, based on the
socioeconomic model of health and its inequalities by Dahlgren and Whitehead (1991), the
relationships among fruit and vegetable intake, years of education completed, and income level
were also explored.
II. Review of Literature
Literature searches were conducted in PubMed to identify original research studies and
review articles relevant to the relationships among fruit and vegetable intake, CVD, and CVD
FRUIT AND VEGETABLE CONSUMPTION 6
risk. Studies that explored relationships among fruit and vegetable intake, BMI, SAD, education,
and income were also identified. In this review of literature, applicable studies were grouped
into five categories: fruit and vegetable consumption and CVD; fruit and vegetable consumption
and CVD risk factors; fruit and vegetable consumption and BMI; fruit and vegetable
consumption and education/income; and average fruit and vegetable consumption in the general
U.S. population.
Fruit and Vegetable Consumption and CVD
The primary risk factors for CVD are dyslipidemia, hypertension, diabetes, and obesity,
which are all linked to diets high in fat, sodium, sugar, and calories (Lichtenstein et al., 2006).
Importantly, however, multiple studies have shown that dietary choices are modifiable and that
consuming healthy foods contributes to optimal cardiovascular health (Appel et al., 1997; Appel
et al., 2005; Knoops et al., 2004). Accordingly, key organizations focusing on CVD prevention,
such as the AHA, began promoting healthy eating patterns as early as 1957. In 2006, the AHA
proposed comprehensive dietary recommendations for the general public that emphasized whole-
grains, high-fiber foods; oily fish; foods with little or no salt; and minimal foods with added
sugar and saturated and trans fats (Lichtenstein et al., 2006). They also began recommending
that Americans consume a diet rich in fruits and vegetables. Specifically, the AHA advises a
total of 8-10 servings of fruits and vegetables per day. This advisement is based on the most
current recommendations from the Dietary Guidelines for Americans released by the U.S.
Departments of Health and Human Services and Agriculture (2005). The AHA (2011) defines a
single serving as 1 medium fruit; ½ cup fresh, frozen, or canned fruit; ¼ cup dried fruit; ½ cup
fruit juice; 1 cup raw leafy vegetable; ½ cup cut-up raw or cooked vegetable; or ½ cup vegetable
juice. This recommendation is based on scientific evidence that most fruits and vegetables are
FRUIT AND VEGETABLE CONSUMPTION 7
high in fiber, potassium, folate, and antioxidant vitamins; nutritional components which have
been associated with cardioprotective effects (U.S. Department of Health and Human Services &
U.S. Department of Agriculture, 2005).
Several studies have examined the link between CVD risk and the consumption of fruits
and vegetables as whole foods rather than the consumption of their individual nutritional
components. In the Nurses' Health Study and the Health Professionals Follow-up Study, with
84,251 female participants aged 34-59 years and 42,148 males 40-75 years, Joshipura et al.
(2001) found that, after adjusting for standard cardiovascular risk factors, persons in the highest
quintile of fruit and vegetable intake (median: 5.8 servings per day among women and 5.1
servings per day among men) had a 20% lower risk for heart disease (multivariate relative risk,
0.80 [95% CI, 0.69 to 0.93]) than did those in the lowest quintile. They also reported that an
intake greater than four servings per day appeared to decrease CVD risk and an intake of at least
8 servings per day produced an even greater risk reduction. Significantly, each one serving per
day increase in participants' intake of fruits or vegetables was associated with a 4% lower risk for
heart disease (relative risk, 0.96 [CI, 0.94 to 0.99]). The lowest risks were apparent in persons
with high consumptions of green leafy vegetables, cruciferous vegetables, and vitamin C-rich
fruits and vegetables.
Similar to the findings of the Nurses' Health Study and Health Professionals' Follow-Up
Study (Joshipura et al., 2001), data from food-frequency questionnaires (FFQs) completed by
participants in the Women's Health Study revealed a significant inverse association between fruit
and vegetable intake and CVD risk (Liu, Manson, et al., 2000). The analysis of the information
provided by 39,127 female health professionals showed that the median intake of total fruit and
vegetables ranged from 2.6 servings per day in the lowest quintile to >10 servings per day in the
FRUIT AND VEGETABLE CONSUMPTION 8
highest quintile. After excluding participants with a self-reported history of diabetes,
hypertension, hypercholesterolemia, and other high-risk conditions for CVD, the inverse
association between consumption and CVD risk became even stronger. The age- and treatment-
adjusted relative risk was 0.33 (95% CI, 0.17 to 0.64) and the multivariate-adjusted relative risk
was 0.45 (95% CI, 0.22 to 0.91) when the two extreme quintiles were compared.
In another large, prospective cohort follow-up study of 15,220 middle-aged male
physicians without a history of CVD or cancer, Liu, Lee, et al. (2001) also observed an inverse
association between vegetable intake and risk of CVD. In multivariate models adjusted for age,
treatment, history of diabetes, history of high cholesterol, history of hypertension, physical
activity, BMI, cigarette smoking, alcohol intake, and use of multivitamins, the researchers found
a relative risk for CVD of 0.83 (95% CI, 0.71 to 0.98) for each additional serving per day of
vegetables consumed in this population segment.
Although the aforementioned studies report a significant correlation between increased
fruit and vegetable consumption and CVD risk, they are not without limitations. As with many
epidemiological studies of dietary patterns, misclassification is a concern because fruit and
vegetable intake was self-reported through FFQs. However, FFQs have been found to have
relatively high levels of reproducibility and validity as measures of average dietary intake over
time (Feskanich et al., 1993; Rimm et al., 1992; Salvini et al., 1989; Willett et al., 1985). In
addition, the study populations consisted of only healthcare professionals who may have
different food habits and knowledge bases from those of the general population. While the
relative homogeneity of education and occupation of the study participants added internal
validity by minimizing the possibility that socioeconomic variables distorted findings, it remains
unclear whether education and income have an influence on dietary choices (Liu, Lee, et al.,
FRUIT AND VEGETABLE CONSUMPTION 9
2001). Despite these limitations, the studies' large sample sizes and statistically significant
findings provide evidence that fruit and vegetable consumption is associated with heart health.
In the interest of exploring the potential link between fruit and vegetable consumption
and CVD in the general U.S. population, the first National Health and Nutrition Examination
Survey Epidemiologic Follow-up Study (NHEFS) used a single 24-hour dietary recall and 3-
month FFQs completed by a cross-sectional sample of 9,608 adults aged 25-74 years to assess
usual fruit and vegetable consumption patterns (Bazzano et al., 2002). Sample participants
consisted of an ongoing cohort from the first National Health and Nutrition Examination Survey
(NHANES I), who were free of cardiovascular disease at the time of their baseline examination
between 1971 and 1975. Over an average follow-up period of 19 years, consuming at least three
or more servings of fruits and vegetables per day, compared with less than one serving per day,
was associated with a 24% lower ischemic heart disease mortality (relative risk, 0.76 [95% CI,
0.56 to 1.03]), a 27% lower CVD mortality (0.73 [CI, 0.58 to 0.92]), and a 15% lower all-cause
mortality (0.85 [CI, 0.72 to 1.00]) after adjustment for age, race, sex, history of diabetes,
physical activity, education level, regular alcohol intake, current smoking, use of vitamin
supplements, and total energy intake.
Although the NHEFS provides widely generalizable evidence of fruit and vegetable
consumption benefits, self-report error is still a concern with FFQs and 24-hour dietary recall
assessment measures (Bazzano et al., 2002). It is important to note, however, that it would be
difficult to obtain enough participation and consent for a large long-term randomized, controlled
trial of dietary patterns.
Collectively, the above study findings provide evidence that increased fruit and vegetable
consumption has significant cardioprotective effects that would be particularly beneficial for
FRUIT AND VEGETABLE CONSUMPTION 10
young adults for whom CVD prevention is crucial. In addition, the findings provide scientific
support for current national guidelines, such as those from the AHA, that promote increased
intake of fruits and vegetables rather than individual nutrients to prevent CVD.
Fruit and Vegetable Consumption and CVD Risk Factors
Although the exact mechanisms of how fruits and vegetables allay the development of
CVD are still being explored, several studies have linked increased fruit and vegetable intake to a
lower incidence of hypertension, one of the most significant CVD risk factors. The Dietary
Approaches to Stop Hypertension (DASH) randomized clinical trial tested the combined effects
of nutrients within foods eaten as a whole on hypertension (Appel et al., 1997). DASH
researchers fed 459 enrolled adults a control diet that was low in fruits, vegetables, and dairy
products and contained a fat content typical of the average American diet for three weeks. Study
participants were then randomly assigned to receive either the control diet, a diet rich in fruits
and vegetables, or a combination diet rich in fruits, vegetables, and low-fat dairy products and
with reduced saturated and total fat over an eight week period. The data revealed that a dietary
pattern rich in fruits and vegetables significantly lowered blood pressure in adults both with and
without hypertension. Similarly, a review by Dauchet, Amouyel, and Dallongeville (2009)
reported that two additional clinical trials (Hypertension Prevention Trial Research Group, 1990;
Margetts, Beilin, Vandongen, & Armstrong, 1986) and four observational population studies
(Ascherio et al., 1992; Dauchet et al., 2007; Sacks, Rosner, & Kass, 1974; Shah et al., 1990)
provided evidence that fruit and vegetable consumption aids in blood pressure regulation.
Additionally, a randomized, controlled clinical trial in the U.K. found that 690 community-
dwelling individuals aged 25-64 years who were encouraged to consume five daily portions of
fruits and vegetables for six months had lower systolic and diastolic blood pressure values when
FRUIT AND VEGETABLE CONSUMPTION 11
compared to the control group (John, Ziebland, Yudkin, Roe, & Neil, 2002).
While a number of studies support the inverse relationship between fruit and vegetable
consumption and hypertension, the review of literature findings by Dauchet, Amouyel, and
Dallongeville (2009) suggested that the effects of fruit and vegetable intake on other CVD risk
factors such as abnormal plasma lipid profiles, diabetes, and obesity are still unclear. Dauchet et
al. (2009) reported inappropriate study designs, a lack of longitudinal study data, and
inconsistent results across the studies reviewed. For example, some of the randomized
prevention trials reviewed tested interventions involving a combination of fruit and vegetable
intake promotion, physical activity, and weight loss on diabetes risk reduction. Therefore, the
individual contribution of fruit and vegetables on diabetes risk was not definitive.
Conversely, in another review article, Lydia Bazzano (2006) reported growing – and
promising – evidence for the benefits of fruit and vegetable intake on weight management and
diabetes prevention. Fruits and vegetables are known to have low energy densities; and so, it has
been hypothesized that replacing high energy-dense foods with fruits and vegetables can help to
lower caloric intake and, thus, body weight. Bazzano referenced both a short- (5-day; Duncan,
Bacon, & Weinsier, 1983) and long-term (3-week; Shintani, Hughes, Beckham, & O’Connor,
1991) study that confirmed this hypothesis. However, in addition to greater amounts of fruits
and vegetables in the diet, she posits that little fat and increased whole grains in the diets may
have been confounding factors contributing to participants' weight loss and reduced energy
intake (Bazzano, 2006). Bazzano emphasized other important factors to consider regarding the
study data she reviewed. For instance, the Nurses' Health Study demonstrated an inverse
relationship between intake of vegetables and the development of diabetes, but no such
association with fruits was reported (Colditz et al., 1992). Similarly, in the U.S. National Health
FRUIT AND VEGETABLE CONSUMPTION 12
and Nutrition Examination I Follow-Up Study, women who consumed five or more servings of
fruits and vegetables per day were found to have a significantly lower incidence of diabetes than
those who consumed none, but results were insignificant among men in the study (Ford &
Mokdad, 2001).
An analysis of the current literature regarding fruit and vegetable intake in relation to
CVD risk factors is crucial in determining whether there is a cause-and-effect relationship
between increased fruit and vegetable consumption and CVD incidence. Thus it was meaningful
to consider previous research before going forward with the current study. The majority of the
collective findings suggest an association between increased consumption and reduced CVD risk
factors, specifically reduced blood pressure; however, additional studies are needed to elucidate
the link between fruit and vegetable intake and other CVD risk factors and to explore the
mechanisms of CVD risk reduction.
Fruit and Vegetable Consumption and BMI
Obesity, defined by high BMI and high SAD, is linked to high blood cholesterol and
triglyceride levels, low “good” HDL cholesterol, high fasting blood sugar, hypertension, and
increased cardiac workload, factors which are associated with increased CVD risk (Poirier et al.,
2006). Therefore, increasing fruit and vegetable consumption may reduce CVD risk by reducing
BMI. A recent review of the literature to date provides a synthesis of the epidemiologic evidence
available for the comparison of fruit and vegetable consumption and BMI or body weight
(Tohill, Seymour, Serdula, Kettel-Khan, & Rolls, 2004). Tohill, Seymour, Serdula, Kettel-Khan,
and Rolls (2004) found only one adult study that examined this issue as a primary objective. The
majority of relevant studies reviewed evaluated the relationship between fruit and vegetable
intake and disease; and so, only the bivariate association of fruit and vegetable intake with an
FRUIT AND VEGETABLE CONSUMPTION 13
anthropometric outcome was reported and available for review. Studies included in the review
had varied methodologies, and very few adjusted for demographic, lifestyle, or other potential
confounding factors. Tohill et al. (2004) concluded that although there was a tendency for higher
body weight, and thus higher BMI, to be associated with lower fruit and vegetable consumption
among adults in the examined studies, the evidence for this association remains insufficient. A
number of studies reviewed reported a significant association between higher BMI categories
and lower fruit and/or vegetable intake (Bazzano et al., 2002; Flood et al., 2002; Lin & Morrison,
2002; Rissanen et al., 2003), but others found no association (Laforge, Greene, & Prochaska,
1994; Liu, Lee, et al., 2001; Liu, Manson, et al., 2000; Patterson, B. H., Block, Rosenberger, Pee,
& Kahle, 1990). Findings of higher weight linked to lower fruit and vegetable intake were also
inconsistent among the genders (Lin & Morrison, 2002).
Thus, data from previous studies showing an association between fruit and vegetable
consumption and BMI suggest that adding fruits and vegetables to the diet may result in a lower
BMI, as this addition may replace foods with higher caloric and fat contents. Nevertheless, due
to the small number of studies with this particular focus, further research is warranted to clarify
the impact that fruit and vegetable consumption may have on BMI, or SAD, a more specific
measure of abdominal obesity.
Fruit and Vegetable Consumption and Education/Income
Although rarely listed as a primary objective, several studies identified a link between
frequency of fruit and vegetable consumption and sociodemographic data. Most recently, the
2009 Behavioral Risk Factor Surveillance System (BRFSS) found that the prevalence of
consuming at least two servings of fruits and three servings of vegetables per day was greatest
amongst college graduates and individuals with an annual household income of $50,000 or more
FRUIT AND VEGETABLE CONSUMPTION 14
(Grimm et al., 2010). Similarly, higher income and greater education were significantly
associated with compliance to the USDA-recommended 5-A-Day consumption pattern examined
in the NHANES III and NHANES 1999-2002 (Casagrande, Wang, Anderson, & Gary, 2007). At
least five additional studies have also reported a positive association between educational
attainment and/or income level with increased fruit and vegetable consumption (Kimmons,
Gillespie, Seymour, Serdula, & Blanck, 2009; Miura, Giskes, & Turrell, 2011; Serdula et al.,
1995; Subar et al., 1995; Thompson et al., 1999).
The overwhelming evidence suggests that educational and economic disparities are
affecting fruit and vegetable intake. Regular consumption of inexpensive and convenient, yet
less healthy, take-out foods may be displacing fruit and vegetables in the diet (Miura, Giskes, &
Turrell, 2011). Limited access to fresh food, limited dietary health awareness, and the high cost
of fruits and vegetables may also be contributing to lower intake. Thus, national messages to
increase fruit and vegetable intake may be ineffective in producing behavioral change in certain
population segments, such as those with a low socioeconomic status. These findings are
disconcerting because education and income levels have also been inversely associated with
heart disease rates in U.S. adults (Schiller, Lucas, Ward, & Peregoy, 2012). Therefore, additional
research is needed to inform the development of more effective, multifaceted approaches to
change fruit and vegetable intake patterns in vulnerable populations.
Average Fruit and Vegetable Consumption in the General U.S. Population
While the cardiovascular benefits of consuming a diet rich in fruits and vegetables are
scientifically based, the majority of Americans, regardless of sociodemographic factors, eat far
fewer daily servings than recommended. Numerous studies have reported the consistent under-
consumption of recommended fruit and vegetable intake by American adults from the late 1980s
FRUIT AND VEGETABLE CONSUMPTION 15
through today (Casagrande, Wang, Anderson, & Gary, 2007; Grimm et al., 2010; Guenther,
Dodd, Reedy, & Krebs-Smith, 2006; Kimmons, Gillespie, Seymour, Serdula, & Blanck, 2009;
Krebs-Smith, Cook, Subar, Cleveland, & Friday, 1995; Serdula et al., 1995; Subar et al., 1995;
Thompson et al., 1999). For example, Guenther, Dodd, Reedy, and Krebs-Smith (2006) found
that in 1999-2000 only 40% of the U.S. population met the then-current USDA recommendation
of five or more servings of fruits and vegetables per day – a mere 8% increase in compliant
American adults from the USDA's 1989-1991 findings in the Continuing Surveys of Food
Intakes by Individuals (CSFII; Krebs-Smith et al., 1995). Compared to the previously reported
mean intake of 4.3 servings per day (Krebs-Smith et al., 1995), Guenther et al. (2006) estimated
the population's mean intake of fruits and vegetables to be marginally higher at 4.7 ± 0.1 servings
per day at that time. Mean intakes by all sex-age groups were below the recommended values
for fruits, total vegetables, and all subgroups of vegetables with one exception: starchy
vegetables (mainly white potatoes, corn, and peas).
This trend of under-consumption of fruits and vegetables in the U.S. has become more
pronounced over the years. Using 24-hour dietary recall data from similar sample sizes in a
similar time period, researchers analyzing the NHANES III (1988-1994) and NHANES 1999-
2002 estimated that a lower percentage of adults met the USDA's vegetable (> 3 servings per
day) guidelines from 1999-2002 compared to 1988-1994 (Casagrande, Wang, Anderson, & Gary,
2007). Furthermore, only 11% met the guidelines for both fruit and vegetable intake (> 5
servings per day) from 1988-1994 and 1999-2002, indicating no change in consumption patterns
despite the initiation of the national “5-A-Day” fruit and vegetable campaign in 1991.
Furthermore, the results of a random-digit dialing telephone survey of 23,699 adults from 16
U.S. states in 1990 indicated lower consumption rates than previously reported data (Serdula et
FRUIT AND VEGETABLE CONSUMPTION 16
al., 1995). The data revealed that only 20% of the study population consumed the recommended
five or more daily servings. Additionally, an analysis of 24-hour recall data from the 2003-2004
NHANES found that less than 1 in 10 Americans met their calorie-specific MyPyramid fruit or
vegetable recommendations (Kimmons, Gillespie, Seymour, Serdula, & Blanck, 2009).
More recently, using the now-outdated 5-A-Day guidelines, the Centers for Disease
Control (CDC) compiled data from 420,968 Americans, representing all 50 states and the District
of Columbia (Grimm et al., 2010). These data showed that in 2009, an estimated 32.5% of adults
consumed fruit two or more times per day and 26.3% consumed vegetables three or more times
per day. According to the CDC, these statistics fall far short of the national targets outlined in
Healthy People 2010, which aim to increase the proportion of persons who follow the 5-A-Day
recommendation. Importantly, the CDC revealed that no state met the fruit and vegetable 5-A-
Day targets and considerable variability occurred among states. The collective findings suggest
that the general U.S. population is under-consuming fruits and vegetables. Moreover, studies
continue to reference the USDA's 5-A-Day guideline, which is not aligned with the current
minimum AHA intake recommendation of eight combined servings of fruits and vegetables per
day. Thus, future research should not only focus on individual states, but also consider the most
current fruit and vegetable endorsements for heart health from the AHA.
Conclusion
The majority of studies presented in this review of literature demonstrate the significant
cardiovascular benefits to increasing fruit and vegetable consumption to meet AHA guidelines.
While the exact mechanisms of how fruits and vegetables prevent CVD remain unclear, studies
suggest that nutrient-rich fruits and vegetables may inhibit the development of known CVD risk
factors such as hypertension and high BMI. However, research has identified lower levels of
FRUIT AND VEGETABLE CONSUMPTION 17
education and income as potential barriers to choosing a diet rich in fruits and vegetables.
Although some studies have shown that the general U.S. population is not meeting national
guideline recommendations for fruit and vegetable intake, it is unknown whether specific
population segments, such as young adults in areas with high prevalence rates for CVD, are
following the most current AHA guidelines for a heart-healthy diet. Therefore, this study’s goal
was to compare the estimated daily servings of fruits and vegetables consumed by young adults
in Central Ohio to the AHA guidelines and explore the relationships among fruit and vegetable
intake, BMI, SAD, years of education, and income level.
III. Methods
This study is a secondary analysis of data derived from two randomized, double-blind,
prospective trials (McDaniel, Belury, Ahijevych, & Blakely, 2008; McDaniel, Massey, &
Nicolaou, 2011) conducted at The Ohio State University Clinical Research Center (CRC). The
current study evaluated sociodemographic, nutritional, and body composition data collected at
baseline in the parent studies to answer the research questions: (1) Are young adults in a Central
Ohio community consuming the AHA's recommended servings of fruits and vegetables for CVD
prevention? (2) Are the daily servings of fruits and vegetables consumed by the young adult
sample associated with anthropometric measures (BMI, SAD), education, and income?
We hypothesized that young adults in Central Ohio are consuming less than the AHA's
recommended daily servings of fruits and vegetables and that higher BMI, higher SAD, lower
educational level, and lower economic status would be associated with fewer daily servings of
fruits and vegetables.
Theoretical Framework
The socioeconomic model of health and its inequalities by Dahlgren and Whitehead
FRUIT AND VEGETABLE CONSUMPTION 18
(1991) guided the choice of variables: fruit and vegetable intake, anthropometric measures,
education, and income. This model was designed to explore the associations among certain
physiological and socioeconomic factors that could impact behavioral determinants of health,
such as choosing to eat adequate servings of fruits and vegetables on a daily basis.
Design
This retrospective, secondary analysis used a descriptive, cross-sectional design to answer
the research questions.
Participants
Data from a total of 60 healthy young adults, ages 18-45 years, from Central Ohio were
included in this analysis. Complete data were obtained from forty participants (20 men and 20
women) in the first parent study (McDaniel, Belury, Ahijevych, & Blakely, 2008) and from 20
participants (10 men and 10 women) in the second study (McDaniel, Massey, & Nicolaou, 2011).
Inclusion criteria included healthy adults between 18 and 45 years of age. Exclusion criteria
included vitamin, mineral, or other nutritional supplement or medication use within three months
of study entry. Individuals with a history of health problems such as cancer, autoimmune
diseases, diabetes mellitus or peripheral vascular disease, difficulties with wound healing,
surgery in the past year, self-reported current smokers, or those reporting drinking 10 or more
alcoholic beverages per week were also excluded. Participants were recruited from an academic
area by placing advertisements in The Ohio State University's newspaper and posting flyers in
several of the individual colleges. The parent studies were approved by an Institutional Review
Board and conducted in accordance with the ethical rules for human experimentation stated in
the 1975 Declaration of Helsinki.
FRUIT AND VEGETABLE CONSUMPTION 19
Sample Size Justification
Before conducting the study, a power analysis determined that 85 subjects would be
necessary to obtain 80% power to detect a correlation of 0.266 at an alpha level of 0.05 among
fruit and vegetable intake, body composition, education, and income. Since there were data from
only 60 subjects, the power to detect a correlation of 0.266 at an alpha level of 0.05 was reduced
to 67%.
Protocol
In the two parent studies (McDaniel, Belury, Ahijevych, & Blakely, 2008; McDaniel,
Massey, & Nicolaou, 2011), young adults who met the inclusion/exclusion criteria participated in
a 25-hour protocol at The Ohio State University Clinical Research Center (CRC). Both parent
studies were prospective, randomized trials designed to test the efficacy of a nutritional
supplement on acute blister wound healing. On arrival, anthropometric measures were taken and
recorded by the CRC bionutritionists. During this time, all study participants completed one
questionnaire that elicited sociodemographic data including education and income levels. In
addition, electronic FFQs were completed by all study participants that generated nutritional
data. The VioFFQ software (Viocare Technologies, Inc.) used is designed to obtain information
about micro and macro nutrient intake during the three months prior to completing the
questionnaire. Data from the FFQs allowed for comparisons of nutrients important for efficient
wound healing between groups at baseline in the parent studies. Additional protocol details have
been described previously (McDaniel, Belury, et al., 2008; McDaniel, Massey, et al., 2011).
Instruments
Anthropometric Data. Height, weight, BMI, and SAD were calculated. Height was
measured using the Harpendon Stadiometer (Holtain Limited, Crymych, Dyfed, U.K.) to the
FRUIT AND VEGETABLE CONSUMPTION 20
nearest 0.1 cm. Body weight was measured using the ProPlus Scale (Healthometer, Bridgeview
Illinois) to the nearest 0.1 kg. BMI was calculated as body weight (kg) divided by height (m)
squared. SAD, the distance from the back to the upper abdomen at the point midway between
the top of the pelvis and the bottom of the ribs while supine, was measured to the nearest 0.1 cm
using the Holtain-Kahn Abdominal Caliper (Holtain Limited, Crymych, Dyfed, U.K.).
Education and Income. Participants completed a health and lifestyle questionnaire
wherein they self-reported gender, age, race, years of education (less than 7 years, junior high
school, some high school, high school, some college, college or university graduate [Bachelors
or equivalent], and graduate or professional training [Masters, JD, MD, PhD, etc.]), and income
level ($0 to 4,999; $5,000 to 9,999; $10,000 to 14,999; $15,000 to 19,999; $20,000 to 24,999;
$25,000 to 29,999; $30,000 to 34,999; $35,000 to 39,999; $40,000 to 44,999; and $45,000 and
up).
Fruit and Vegetable Intake. The VioFFQ software tool (Viocare Technologies, Inc.)
was used to estimate food choices such as fruit and vegetable intake in the previous 90 days. It is
based on the FFQ used and validated for the Women’s Health Initiative (Patterson, R. E., et al.,
1999). This web-based system allows subjects to self-administer the FFQ from a tablet computer
connected to the Internet. Participants received five minutes of audio and visual instruction
before completing the FFQ, which takes approximately 30 minutes to complete and asks
questions about the type, frequency, and quantity of foods and beverages consumed in the past
90 days. The bionutritionists at the CRC were available to assist participants as needed. The
data generated included a nutrient analysis of macro and micro nutrients consumed on a per day
basis, food patterning, and an educational report for the study participants. The dietary analysis
was completed by the CRC bionutritionists and utilized food and nutrient information from the
FRUIT AND VEGETABLE CONSUMPTION 21
Nutrition Coordinating Center (NCC) Food and Nutrient Database developed and maintained by
the NCC, located at the University of Minnesota Division of Epidemiology and Community
Health in Minneapolis.
Data Analysis
Descriptive statistics, including percent, range, mean, and standard deviation (SD), were
used to characterize sociodemographic, nutritional, and body composition data. Statistical
analysis was performed using a series of regression and ANOVA models. In all models, servings
of fruit and servings of vegetables were found to be right-skewed, so these variables were
transformed to the natural log scale before performing statistical analysis. ANOVA models were
used to examine the relationship between education level and intake of fruit and vegetables as
well as the relationships between gender and race and intake of fruit and vegetables. Separate
regression models were fit to examine the relationship between income level and intake of fruit
and vegetables along with the relationship between age and intake of fruit and vegetables.
Finally, regression models were used to examine the relationship between BMI and intake of
fruit and vegetables.
IV. Results
Participant Characteristics
This secondary analysis compiled data on 60 young adults, ages 18-45 years, from
Central Ohio who had no history of chronic disease and were not presently taking prescription
medications, vitamins, or minerals. In this sample, half of the participants were male and the
majority was Caucasian (Table 1). The mean age was 25.5 years. The participants had an
average BMI of 25.8 and an average SAD of 19.2 cm. The vast majority of participants had over
12 years of education, with 41.9% having had some college education and 40.3% college or
FRUIT AND VEGETABLE CONSUMPTION 22
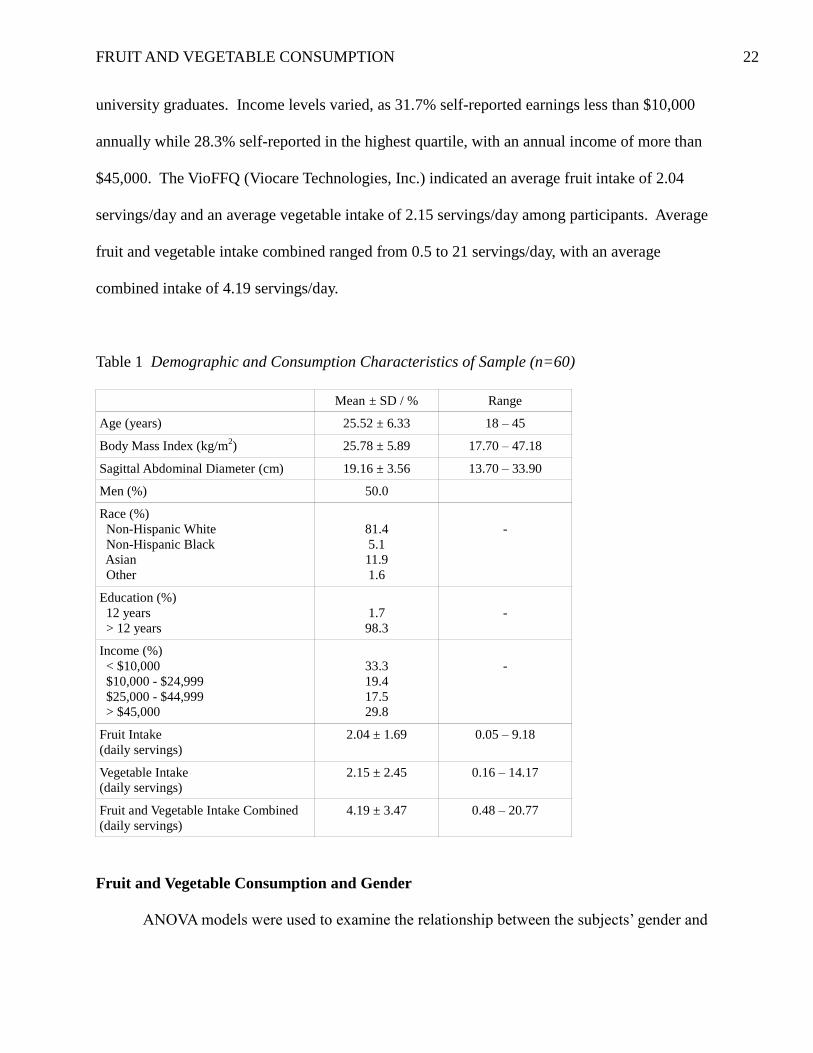
university graduates. Income levels varied, as 31.7% self-reported earnings less than $10,000
annually while 28.3% self-reported in the highest quartile, with an annual income of more than
$45,000. The VioFFQ (Viocare Technologies, Inc.) indicated an average fruit intake of 2.04
servings/day and an average vegetable intake of 2.15 servings/day among participants. Average
fruit and vegetable intake combined ranged from 0.5 to 21 servings/day, with an average
combined intake of 4.19 servings/day.
Table 1 Demographic and Consumption Characteristics of Sample (n=60)
Mean ± SD / % Range
Age (years) 25.52 ± 6.33 18 – 45
Body Mass Index (kg/m2) 25.78 ± 5.89 17.70 – 47.18
Sagittal Abdominal Diameter (cm) 19.16 ± 3.56 13.70 – 33.90
Men (%) 50.0
Race (%)
Non-Hispanic White
Non-Hispanic Black
Asian
Other
81.4
5.1
11.9
1.6
-
Education (%)
12 years
> 12 years
1.7
98.3
-
Income (%)
< $10,000
$10,000 - $24,999
$25,000 - $44,999
> $45,000
33.3
19.4
17.5
29.8
-
Fruit Intake
(daily servings)
2.04 ± 1.69 0.05 – 9.18
Vegetable Intake
(daily servings)
2.15 ± 2.45 0.16 – 14.17
Fruit and Vegetable Intake Combined
(daily servings)
4.19 ± 3.47 0.48 – 20.77
Fruit and Vegetable Consumption and Gender
ANOVA models were used to examine the relationship between the subjects’ gender and
FRUIT AND VEGETABLE CONSUMPTION 23
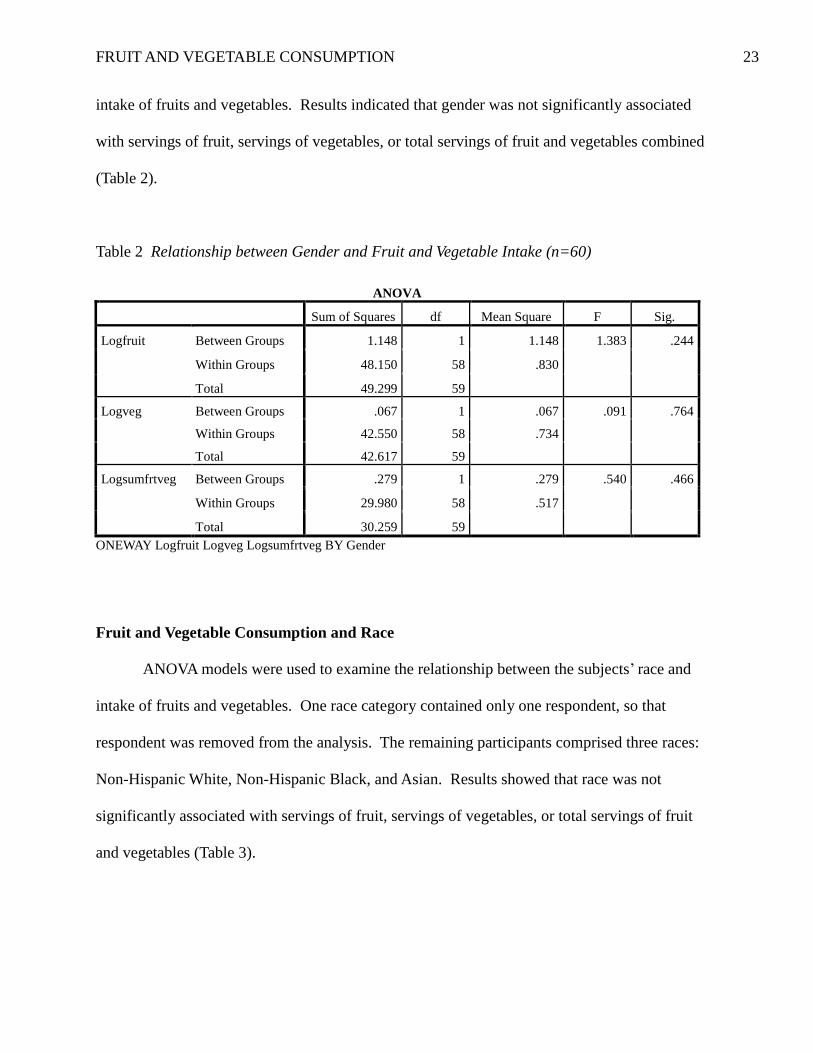
intake of fruits and vegetables. Results indicated that gender was not significantly associated
with servings of fruit, servings of vegetables, or total servings of fruit and vegetables combined
(Table 2).
Table 2 Relationship between Gender and Fruit and Vegetable Intake (n=60)
ANOVA
Sum of Squares df Mean Square F Sig.
Logfruit Between Groups 1.148 1 1.148 1.383 .244
Within Groups 48.150 58 .830
Total 49.299 59
Logveg Between Groups .067 1 .067 .091 .764
Within Groups 42.550 58 .734
Total 42.617 59
Logsumfrtveg Between Groups .279 1 .279 .540 .466
Within Groups 29.980 58 .517
Total 30.259 59
ONEWAY Logfruit Logveg Logsumfrtveg BY Gender
Fruit and Vegetable Consumption and Race
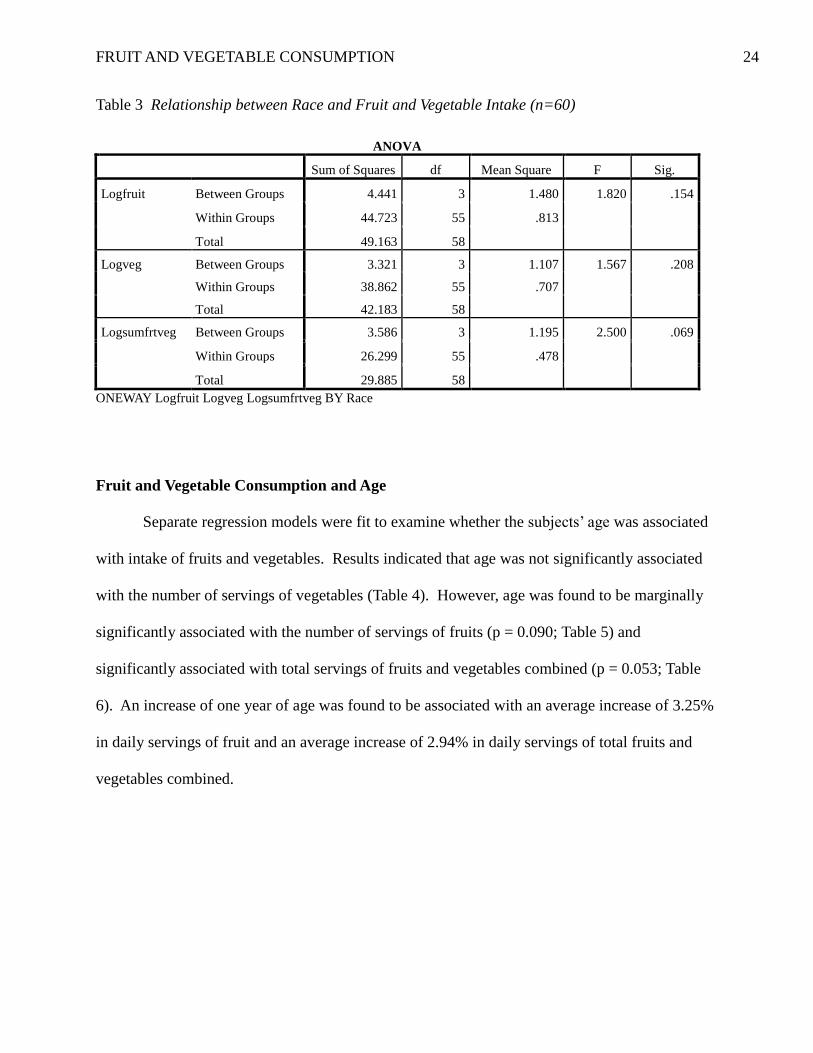
ANOVA models were used to examine the relationship between the subjects’ race and
intake of fruits and vegetables. One race category contained only one respondent, so that
respondent was removed from the analysis. The remaining participants comprised three races:
Non-Hispanic White, Non-Hispanic Black, and Asian. Results showed that race was not
significantly associated with servings of fruit, servings of vegetables, or total servings of fruit
and vegetables (Table 3).
FRUIT AND VEGETABLE CONSUMPTION 24
Table 3 Relationship between Race and Fruit and Vegetable Intake (n=60)
ANOVA
Sum of Squares df Mean Square F Sig.
Logfruit Between Groups 4.441 3 1.480 1.820 .154
Within Groups 44.723 55 .813
Total 49.163 58
Logveg Between Groups 3.321 3 1.107 1.567 .208
Within Groups 38.862 55 .707
Total 42.183 58
Logsumfrtveg Between Groups 3.586 3 1.195 2.500 .069
Within Groups 26.299 55 .478
Total 29.885 58
ONEWAY Logfruit Logveg Logsumfrtveg BY Race
Fruit and Vegetable Consumption and Age
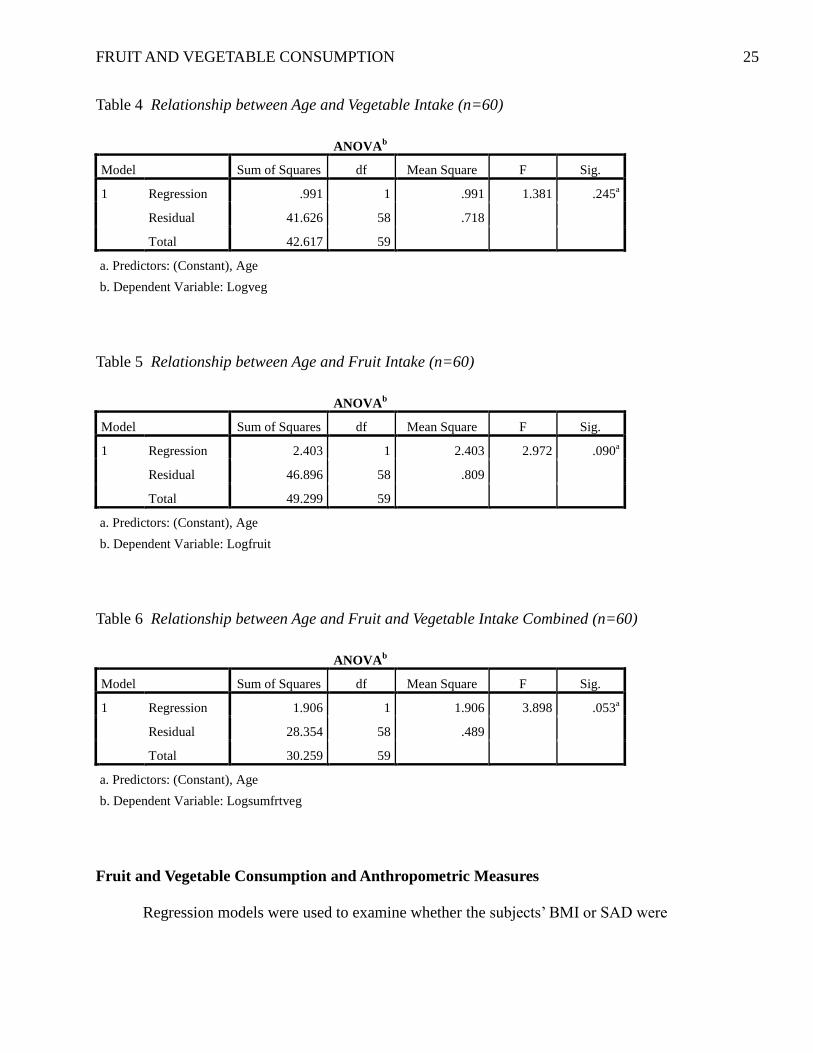
Separate regression models were fit to examine whether the subjects’ age was associated
with intake of fruits and vegetables. Results indicated that age was not significantly associated
with the number of servings of vegetables (Table 4). However, age was found to be marginally
significantly associated with the number of servings of fruits (p = 0.090; Table 5) and
significantly associated with total servings of fruits and vegetables combined (p = 0.053; Table
6). An increase of one year of age was found to be associated with an average increase of 3.25%
in daily servings of fruit and an average increase of 2.94% in daily servings of total fruits and
vegetables combined.
FRUIT AND VEGETABLE CONSUMPTION 25
Table 4 Relationship between Age and Vegetable Intake (n=60)
ANOVAb
Model Sum of Squares df Mean Square F Sig.
1 Regression .991 1 .991 1.381 .245a
Residual 41.626 58 .718
Total 42.617 59
a. Predictors: (Constant), Age
b. Dependent Variable: Logveg
Table 5 Relationship between Age and Fruit Intake (n=60)
ANOVAb
Model Sum of Squares df Mean Square F Sig.
1 Regression 2.403 1 2.403 2.972 .090a
Residual 46.896 58 .809
Total 49.299 59
a. Predictors: (Constant), Age
b. Dependent Variable: Logfruit
Table 6 Relationship between Age and Fruit and Vegetable Intake Combined (n=60)
ANOVAb
Model Sum of Squares df Mean Square F Sig.
1 Regression 1.906 1 1.906 3.898 .053a
Residual 28.354 58 .489
Total 30.259 59
a. Predictors: (Constant), Age
b. Dependent Variable: Logsumfrtveg
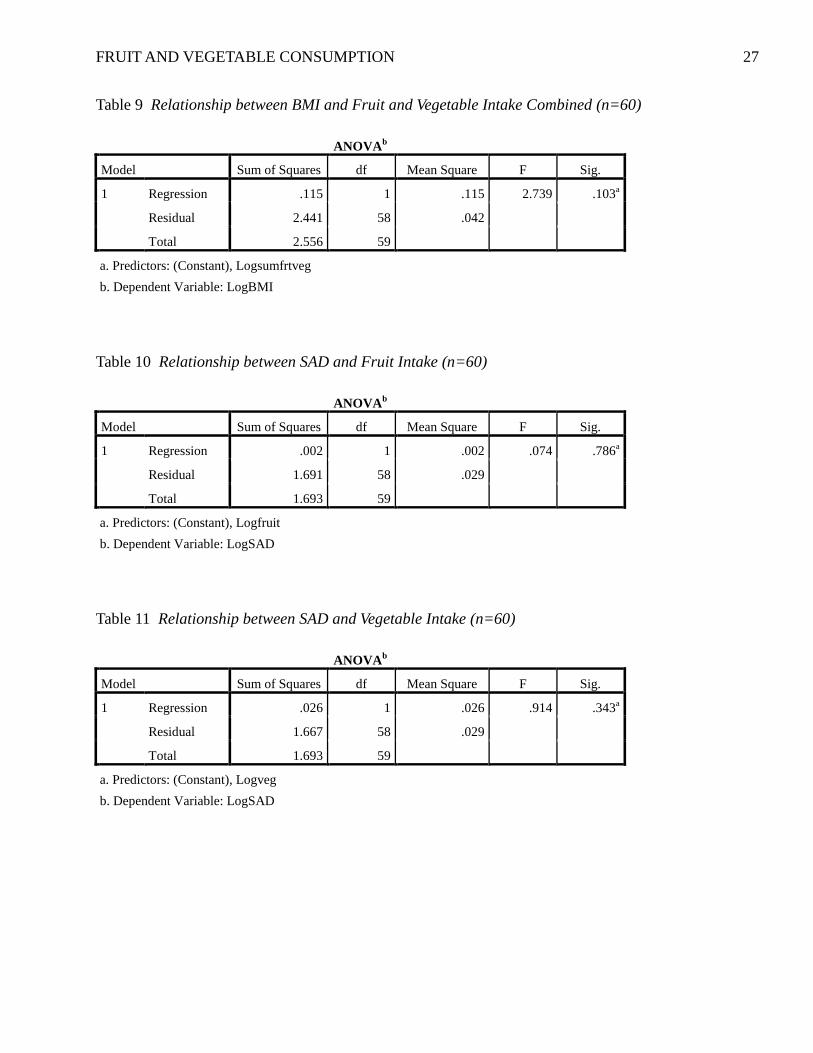
Fruit and Vegetable Consumption and Anthropometric Measures
Regression models were used to examine whether the subjects’ BMI or SAD were
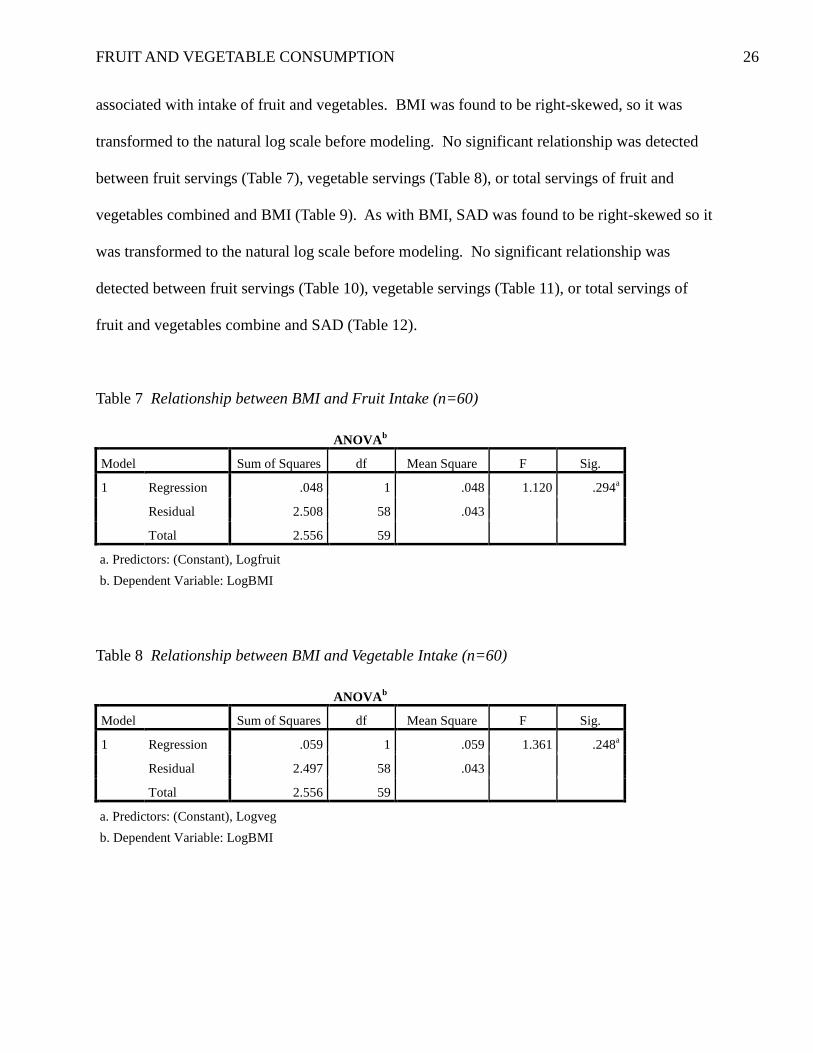
FRUIT AND VEGETABLE CONSUMPTION 26
associated with intake of fruit and vegetables. BMI was found to be right-skewed, so it was
transformed to the natural log scale before modeling. No significant relationship was detected
between fruit servings (Table 7), vegetable servings (Table 8), or total servings of fruit and
vegetables combined and BMI (Table 9). As with BMI, SAD was found to be right-skewed so it
was transformed to the natural log scale before modeling. No significant relationship was
detected between fruit servings (Table 10), vegetable servings (Table 11), or total servings of
fruit and vegetables combine and SAD (Table 12).
Table 7 Relationship between BMI and Fruit Intake (n=60)
ANOVAb
Model Sum of Squares df Mean Square F Sig.
1 Regression .048 1 .048 1.120 .294a
Residual 2.508 58 .043
Total 2.556 59
a. Predictors: (Constant), Logfruit
b. Dependent Variable: LogBMI
Table 8 Relationship between BMI and Vegetable Intake (n=60)
ANOVAb
Model Sum of Squares df Mean Square F Sig.
1 Regression .059 1 .059 1.361 .248a
Residual 2.497 58 .043
Total 2.556 59
a. Predictors: (Constant), Logveg
b. Dependent Variable: LogBMI
FRUIT AND VEGETABLE CONSUMPTION 27
Table 9 Relationship between BMI and Fruit and Vegetable Intake Combined (n=60)
ANOVAb
Model Sum of Squares df Mean Square F Sig.
1 Regression .115 1 .115 2.739 .103a
Residual 2.441 58 .042
Total 2.556 59
a. Predictors: (Constant), Logsumfrtveg
b. Dependent Variable: LogBMI
Table 10 Relationship between SAD and Fruit Intake (n=60)
ANOVAb
Model Sum of Squares df Mean Square F Sig.
1 Regression .002 1 .002 .074 .786a
Residual 1.691 58 .029
Total 1.693 59
a. Predictors: (Constant), Logfruit
b. Dependent Variable: LogSAD
Table 11 Relationship between SAD and Vegetable Intake (n=60)
ANOVAb
Model Sum of Squares df Mean Square F Sig.
1 Regression .026 1 .026 .914 .343a
Residual 1.667 58 .029
Total 1.693 59
a. Predictors: (Constant), Logveg
b. Dependent Variable: LogSAD
FRUIT AND VEGETABLE CONSUMPTION 28
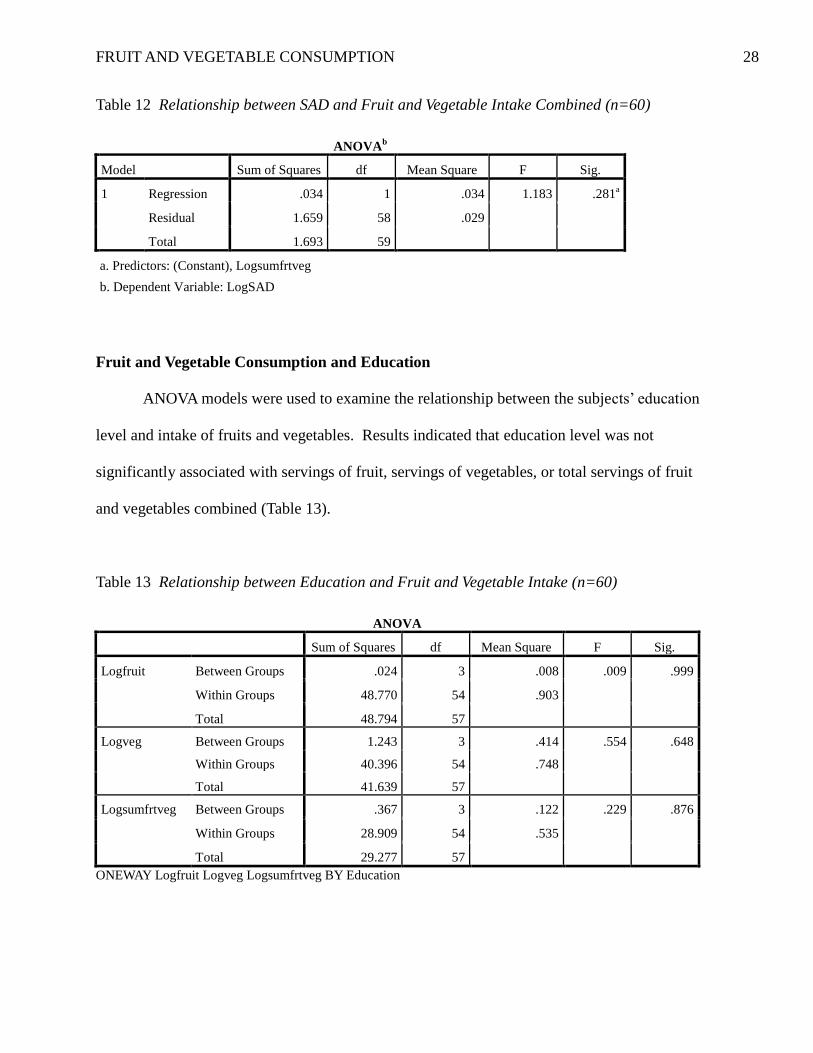
Table 12 Relationship between SAD and Fruit and Vegetable Intake Combined (n=60)
ANOVAb
Model Sum of Squares df Mean Square F Sig.
1 Regression .034 1 .034 1.183 .281a
Residual 1.659 58 .029
Total 1.693 59
a. Predictors: (Constant), Logsumfrtveg
b. Dependent Variable: LogSAD
Fruit and Vegetable Consumption and Education
ANOVA models were used to examine the relationship between the subjects’ education
level and intake of fruits and vegetables. Results indicated that education level was not
significantly associated with servings of fruit, servings of vegetables, or total servings of fruit
and vegetables combined (Table 13).
Table 13 Relationship between Education and Fruit and Vegetable Intake (n=60)
ANOVA
Sum of Squares df Mean Square F Sig.
Logfruit Between Groups .024 3 .008 .009 .999
Within Groups 48.770 54 .903
Total 48.794 57
Logveg Between Groups 1.243 3 .414 .554 .648
Within Groups 40.396 54 .748
Total 41.639 57
Logsumfrtveg Between Groups .367 3 .122 .229 .876
Within Groups 28.909 54 .535
Total 29.277 57
ONEWAY Logfruit Logveg Logsumfrtveg BY Education
FRUIT AND VEGETABLE CONSUMPTION 29
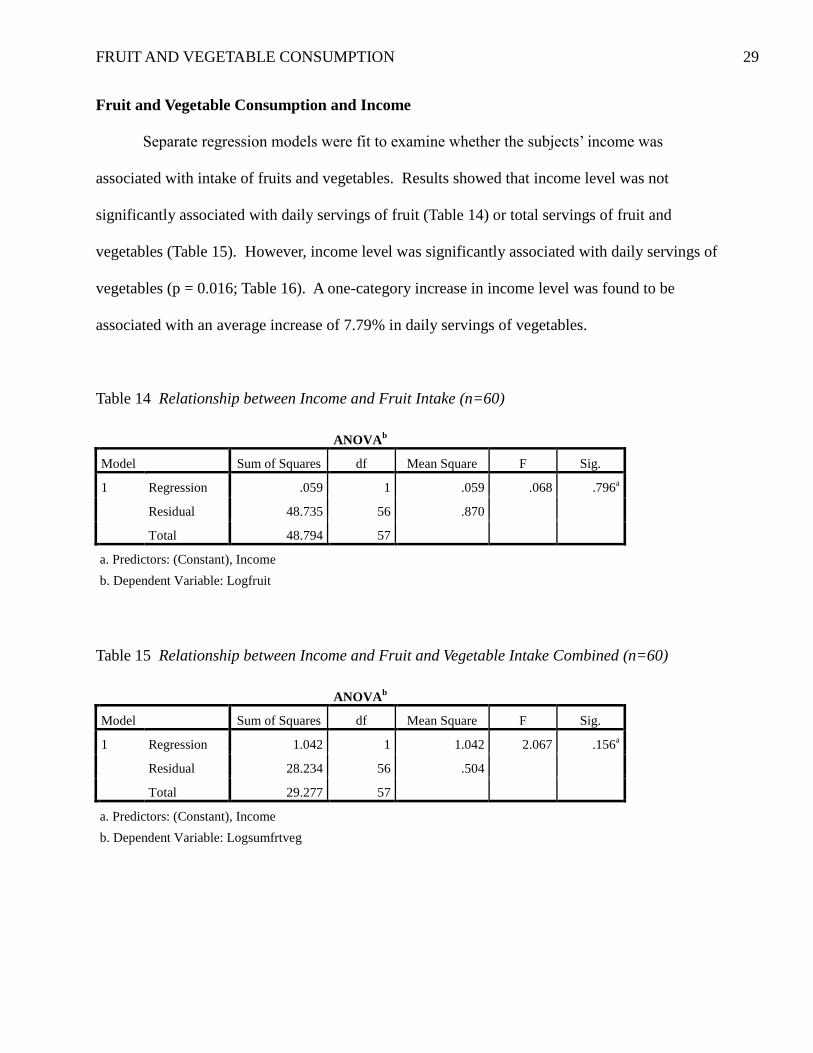
Fruit and Vegetable Consumption and Income
Separate regression models were fit to examine whether the subjects’ income was
associated with intake of fruits and vegetables. Results showed that income level was not
significantly associated with daily servings of fruit (Table 14) or total servings of fruit and
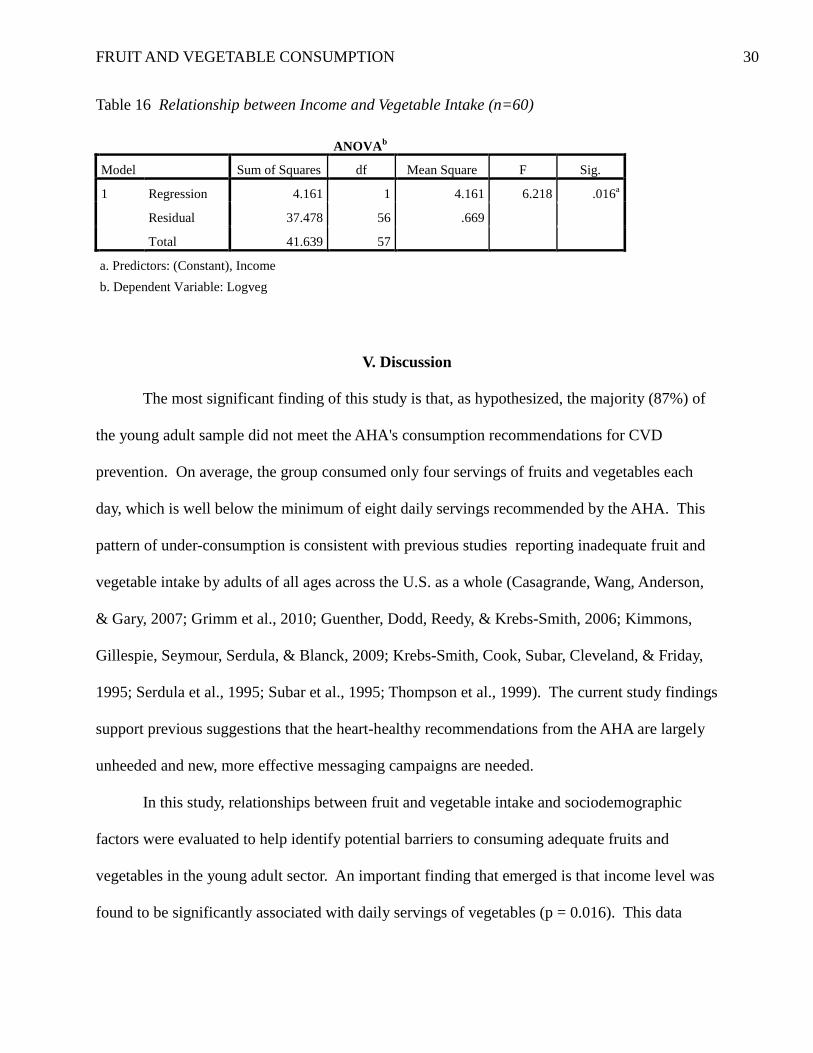
vegetables (Table 15). However, income level was significantly associated with daily servings of
vegetables (p = 0.016; Table 16). A one-category increase in income level was found to be
associated with an average increase of 7.79% in daily servings of vegetables.
Table 14 Relationship between Income and Fruit Intake (n=60)
ANOVAb
Model Sum of Squares df Mean Square F Sig.
1 Regression .059 1 .059 .068 .796a
Residual 48.735 56 .870
Total 48.794 57
a. Predictors: (Constant), Income
b. Dependent Variable: Logfruit
Table 15 Relationship between Income and Fruit and Vegetable Intake Combined (n=60)
ANOVAb
Model Sum of Squares df Mean Square F Sig.
1 Regression 1.042 1 1.042 2.067 .156a
Residual 28.234 56 .504
Total 29.277 57
a. Predictors: (Constant), Income
b. Dependent Variable: Logsumfrtveg
FRUIT AND VEGETABLE CONSUMPTION 30
Table 16 Relationship between Income and Vegetable Intake (n=60)
ANOVAb
Model Sum of Squares df Mean Square F Sig.
1 Regression 4.161 1 4.161 6.218 .016a
Residual 37.478 56 .669
Total 41.639 57
a. Predictors: (Constant), Income
b. Dependent Variable: Logveg
V. Discussion
The most significant finding of this study is that, as hypothesized, the majority (87%) of
the young adult sample did not meet the AHA's consumption recommendations for CVD
prevention. On average, the group consumed only four servings of fruits and vegetables each
day, which is well below the minimum of eight daily servings recommended by the AHA. This
pattern of under-consumption is consistent with previous studies reporting inadequate fruit and
vegetable intake by adults of all ages across the U.S. as a whole (Casagrande, Wang, Anderson,
& Gary, 2007; Grimm et al., 2010; Guenther, Dodd, Reedy, & Krebs-Smith, 2006; Kimmons,
Gillespie, Seymour, Serdula, & Blanck, 2009; Krebs-Smith, Cook, Subar, Cleveland, & Friday,
1995; Serdula et al., 1995; Subar et al., 1995; Thompson et al., 1999). The current study findings
support previous suggestions that the heart-healthy recommendations from the AHA are largely
unheeded and new, more effective messaging campaigns are needed.
In this study, relationships between fruit and vegetable intake and sociodemographic
factors were evaluated to help identify potential barriers to consuming adequate fruits and
vegetables in the young adult sector. An important finding that emerged is that income level was
found to be significantly associated with daily servings of vegetables (p = 0.016). This data
FRUIT AND VEGETABLE CONSUMPTION 31
suggests that those with greater financial resources are more likely to purchase and consume
heart-healthy vegetables than those with lower incomes, which is a finding that is aligned with
several previous studies reporting a significant positive relationship between income and fruit
and vegetable consumption (Casagrande, Wang, Anderson, & Gary, 2007; Grimm et al., 2010;
Subar et al., 1995). Interestingly, however, educational level was not significantly associated
with daily fruit and vegetable servings in the current study. This finding does not support our
hypothesis that those with more years of education consume more fruits and vegetables on a
daily basis than those with less education. In addition, our findings are not aligned with several
previous studies noting positive correlations between these two variables (Casagrande et al.,
2007; Grimm et al., 2010; Kimmons, Gillespie, Seymour, Serdula, & Blanck, 2009; Miura,
Giskes, & Turrell, 2011; Serdula et al., 1995; Subar et al., 1995; Thompson et al., 1999).
Nevertheless, these study findings suggest that a young adult with a higher level of education
may not be more knowledgeable of nutritional health than a young adult with a lower level of
education. Thus, interventions designed to disseminate the important messages regarding fruit
and vegetable consumption should target all young adults regardless of educational status.
Other sociodemographic characteristics that were evaluated in the current study included
gender, race, and age. No significant relationship was found between gender or race and fruit
and vegetable consumption. These findings are not aligned with previous study reports of gender
and racial disparities regarding fruit and vegetable intake (Casagrande, Wang, Anderson, & Gary,
2007; Grimm et al., 2010; Kimmons, Gillespie, Seymour, Serdula, & Blanck, 2009; Serdula et
al., 1995; Subar et al., 1995; Thompson et al., 1999). Although neither gender nor race predicted
consumption patterns in the current study, age was found to be marginally significantly
associated with the number of servings of fruits (p = 0.090) and significantly associated with
FRUIT AND VEGETABLE CONSUMPTION 32
total servings of fruits and vegetables combined (p = 0.053). This data implies that even within
the young adult age group (18-45 years) as one ages, consuming a healthy diet becomes more
important. Furthermore, this finding is comparable to similar studies that have noted increased
fruit and vegetable consumption with advancing age (Casagrande et al., 2007; Grimm et al.,
2010; Kimmons et al., 2009; Serdula et al., 1995; Subar et al., 1995). For example, Grimm et al.
(2010) reported that in 2009 the greatest prevalence of consuming fruit two or more times per
day or vegetables three or more times per day was observed in a large representative sample of
U.S. adults aged 65 or older. The collective findings of the current study regarding
sociodemographic characteristics suggest that dietary initiatives to increase fruit and vegetable
intake should target all younger adults, regardless of gender, race, income or education level.
In addition to sociodemographic characteristics, anthropometric measures (BMI and
SAD) were evaluated in the current study because several previous studies have reported an
inverse relationship between BMI and fruit and vegetable consumption (Bazzano et al., 2002;
Flood et al., 2002; Lin & Morrison, 2002; Rissanen et al., 2003). Interestingly, however, no
significant relationships emerged among these variables in the current study. Yet associations
among BMI, SAD, and fruit and vegetable intake are plausible because fruits and vegetables are
low in fat and energy density and replacing high-fat, energy-dense foods with fruits and
vegetables may decrease caloric intake and thus, lower body weight. We may have been able to
detect significant relationships among these variables, as other studies have reported, with a
larger sample size, and thus greater statistical power. Nevertheless, our study findings suggest
that participants of all weight categories should be equally considered when marketing dietary
initiatives to increase fruit and vegetable intake for cardiovascular health. Furthermore, the
finding that an average BMI of 25.8 classified our young adult sample as overweight, and
FRUIT AND VEGETABLE CONSUMPTION 33
therefore at increased risk for several chronic diseases including CVD, supports the need for
more effective strategies to promote heart-healthy dietary patterns in the young adult sector.
The results of the current study must be considered in light of the limitations. The small
sample size and cross-sectional design limit the generalizability of the findings. Additionally,
there are limitations to the self-report method of identifying fruit and vegetable intake via
electronic FFQs because participant responses may not accurately reflect actual food intake
levels.
In conclusion, this study generated new knowledge about heart-healthy dietary choices of
young adults in a state that has a higher incidence of CVD than the national average. It
highlights the need for nurses and other healthcare clinicians to promote current health initiatives
to increase fruit and vegetable consumption to all patients, but particularly to young adults for
whom CVD prevention is a significant goal. Furthermore, the findings indicate that innovative
strategies to promote heart-healthy choices should be used for young adults of all genders, races,
and educational levels. However, novel dietary interventions that consider the unique needs of
younger adults from lower socioeconomic levels may lead to better outcomes. Future research
should consider larger samples of young adults in other regions of the U.S. in order to elucidate
the effects of geographic and socioeconomic factors on meeting the AHA fruit and vegetable
recommendations. By designing and implementing strategies to more effectively promote the
AHA dietary guidelines, nurses may improve long-term cardiovascular health in the young adult
population.
FRUIT AND VEGETABLE CONSUMPTION 34
References
American Heart Association. (2011). Suggested servings from each food group. Retrieved from
http://www.heart.org/HEARTORG/GettingHealthy/NutritionCenter/HealthyDietGoals/
Suggested-Servings-from-Each-Food-Group_UCM_318186_Article.jsp
Appel, L. J., Moore, T. J., Obarzanek, E., Vollmer, W. M., Svetkey, L. P., Sacks, F. M., . . .
Karanja, N. (1997). A clinical trial of the effects of dietary patterns on blood pressure.
New England Journal of Medicine, 336(16), 1117-1124. Retrieved from http://www.nejm.
org/doi/pdf/10.1056/NEJM199704173361601
Appel, L. J., Sacks, F. M., Carey, V. J., Obarzanek, E., Swain, J. F., Miller, E. R., . . . Bishop,
L. M. (2005). Effects of protein, monounsaturated fat, and carbohydrate intake on blood
pressure and serum lipids: Results of the OmniHeart randomized trial. Journal of the
American Medical Association, 294(19), 2455-2464. doi:10.1001/jama.294.19.2455
Ascherio, A., Rimm, E. B., Giovannucci, E. L., Colditz, G. A., Rosner, B., Willett, W. C., . . .
Stampfer, M. J. (1992). A prospective study of nutritional factors and hypertension among
U.S. men. Circulation, 86, 1475-1484. doi:10.1161/01.CIR.86.5.1475
Bazzano, L. A. (2006). The high cost of not consuming fruits and vegetables. Journal of the
American Dietetic Association, 106(9), 1364-1368. doi:10.1016/j.jada.2006.06.021
Bazzano, L. A., He, J., Ogden, L. G., Loria, C. M., Vupputuri, S., Myers, L., & Whelton, P. K.
(2002). Fruit and vegetable intake and risk of cardiovascular disease in U.S. adults: The
first National Health and Nutrition Examination Survey Epidemiologic Follow-up Study.
American Journal of Clinical Nutrition, 76(1), 93-99. Retrieved from http://www.ajcn.
org/content/76/1/93.full.pdf+html
Casagrande, S. S., Wang, Y., Anderson, C., & Gary, T. L. (2007). Have Americans increased
FRUIT AND VEGETABLE CONSUMPTION 35
their fruit and vegetable intake? The trends between 1988 and 2002. American Journal of
Preventive Medicine, 32(4), 1-7. doi:10.1016/j.amepre.2006.12.002
Colditz, G. A., Manson, J. E., Stampfer, M. J., Rosner, B., Willett, W. C., & Speizer, F. E. (1992).
Diet and risk of clinical diabetes in women. American Journal of Clinical Nutrition,
55(5), 1018-1023. Retrieved from http://www.ajcn.org/content/55/5/1018.full.pdf+html
Dahlgren, G., & Whitehead, M. (1991). Policies and strategies to promote social equity in
health. Stockholm, Sweden: Institute for Future Studies.
Dauchet, L., Amouyel, P., & Dallongeville, J. (2009). Fruits, vegetables and coronary heart
disease. Nature Reviews Cardiology, 6, 599-608. doi:10.1038/nrcardio.2009.131
Dauchet, L., Kesse-Guyot, E., Czernichow, S., Bertrais, S., Estaquio, C., Peneau, S., . . .
Hercberg, S. (2007). Dietary patterns and blood pressure change over 5-y follow-up in the
SU.VI.MAX cohort. American Journal of Clinical Nutrition, 85(6), 1650-1656. Retrieved
from http://ajcn.nutrition.org/content/85/6/1650.full.pdf+html
DeFiore-Hyrmer, J., & Pryor, B. (2009). The burden of heart disease in Ohio. Columbus, Ohio:
Center for Public Health Statistics and Informatics, Ohio Department of Health.
Duncan, K. H., Bacon, J. A., & Weinsier, R. L. (1983). The effects of high and low energy
density diets on satiety, energy intake, and eating time of obese and nonobese subjects.
American Journal of Clinical Nutrition, 37(5), 763-767. Retrieved from http://www.ajcn.
org/content/37/5/763.full.pdf+html
Feskanich, D., Rimm, E. B., Giovannucci, E. L., Colditz, G. A., Stampfer, M. J., Litin, L. B., &
Willett, W. C. (1993). Reproducibility and validity of food intake measurements from a
semiquantitative food frequency questionnaire. Journal of the American Dietetic
Association, 93(7), 790-796. Retrieved from http://www.journals.elsevierhealth.com/
FRUIT AND VEGETABLE CONSUMPTION 36
periodicals/yjada/article/0002-8223%2893%2991754-E/fulltext
Flood, A., Velie, E. M., Chaterjee, N., Subar, A. F., Thompson, F. E., Lacey, J. V., . . . Schatzkin,
A. (2002). Fruit and vegetable intakes and the risk of colorectal cancer in the Breast
Cancer Detection Demonstration Project follow-up cohort. American Journal of Clinical
Nutrition, 75(5), 936-943. Retrieved from http://www.ajcn.org/content/75/5/936.full.pdf
Ford, E.S., & Mokdad, A. H. (2001). Fruit and vegetable consumption and diabetes mellitus
incidence among U.S. adults. Preventive Medicine, 32(1), 33-39. Retrieved from http://
www.sciencedirect.com/science/article/pii/S0091743500907722
Grimm, K. A., Blanck, H. M., Scanlon, K. S., Moore, L. V., Grummer-Strawn, L. M., & Foltz,
J. L. (2010). State-specific trends in fruit and vegetable consumption among adults –
United States, 2000-2009. Morbidity and Mortality Weekly Report, 59(35), 1125-1130.
Retrieved from http://www.cdc.gov/mmwr/preview/mmwrhtml/mm5935a1.htm#tab2
Guenther, P. M., Dodd, K. W., Reedy, J., & Krebs-Smith, S. M. (2006). Most Americans eat
much less than recommended amounts of fruits and vegetables. Journal of the American
Dietetic Association, 106(9), 1371-1379. doi:10.1016/j.jada.2006.06.002
Hypertension Prevention Trial Research Group. (1990). The Hypertension Prevention Trial:
Three-year effects of dietary changes on blood pressure. Archives of Internal Medicine,
150(1), 153-162. doi:10.1001/archinte.1990.00390130131021
Inequalities and Health Policy. (n.d.). Retrieved from http://www.nwph.net/nwpho/inequalities/
health_wealth_ch2_(2).pdf
John, J. H., Ziebland, S., Yudkin, P., Roe, L. S., & Neil, H. A. (2002). Effects of fruit and
vegetable consumption on plasma antioxidant concentrations and blood pressure: A
randomised controlled trial. Lancet, 359(9322), 1969-1974. doi:10.1016/S0140-
FRUIT AND VEGETABLE CONSUMPTION 37
6736(02)98858-6
Joshipura, K. J., Hu, F. B., Manson, J. E., Stampfer, M. J., Rimm, E. B., Speizer, F. E., . . .
Willett, W. C. (2001). The effect of fruit and vegetable intake on risk for coronary heart
disease. Annals of Internal Medicine, 134(12), 1106-1114. Retrieved from http://www.
annals.org/content/134/12/1106.full.pdf+html
Kimmons, J., Gillespie, C., Seymour, J., Serdula, M., & Blanck, H. M. (2009). Fruit and
vegetable intake among adolescents and adults in the United States: Percentage meeting
individualized recommendations. Medscape Journal of Medicine, 11(1), 26. Retrieved
from http://www.medscape.com/viewarticle/586492
Knoops, K. T., de Groot, L. C., Kromhout, D., Perrin, A.-E., Moreiras-Varela, O., Menotti, A., &
van Staveren, W. A. (2004). Mediterranean diet, lifestyle factors, and 10-year mortality in
elderly European mean and women: The HALE Project. Journal of the American Medical
Association, 292(12), 1433-1439. doi:10.1001/jama.292.12.1433
Krebs-Smith, S. M., Cook, A., Subar, A. F., Cleveland, L. & Friday, J. (1995). U.S. adults’ fruit
and vegetable intakes, 1989 to 1991: A revised baseline for the Healthy People 2000
objective. American Journal of Public Health, 85(12), 1623-1629. Retrieved from
http://www.ncbi.nlm.nih.gov/pmc/articles/PMC1615724/pdf/amjph00450-0025.pdf
Laforge, R. G., Greene, G. W., & Prochaska, J. O. (1994). Psychosocial factors influencing low
fruit and vegetable consumption. Journal of Behavioral Medicine, 17(4), 361-374.
Lichtenstein, A. H., Appel, L. J., Brands, M., Carnethon, M., Daniels, S., Franch, H. A., . . .
Wylie-Rosett, J. (2006). Diet and lifestyle recommendations revision 2006: A scientific
statement from the American Heart Association Nutrition Committee. Circulation, 114,
82-96. doi:10.1161/CIRCULATIONAHA.106.176158
FRUIT AND VEGETABLE CONSUMPTION 38
Lin, B. H., & Morrison, R. M. (2002). Higher fruit consumption linked with lower body mass
index. Food Review, 25(3), 28-32. Retrieved from http://www.ers.usda.gov/publications/
foodreview/dec2002/frvol25i3d.pdf
Liu, S., Lee, I.-M., Ajani, U., Cole, S. R., Buring, J. E., & Manson, J. E. (2001). Intake of
vegetables rich in carotenoids and risk of coronary heart disease in men: The Physicians’
Health Study. International Journal of Epidemiology, 30(1), 130-135. doi:10.1093/ije/30.
1.130
Liu, S., Manson, J. E., Lee, I.-M., Cole, S. R., Hennekens, C. H., Willett, W. C., & Buring, J. E.
(2000). Fruit and vegetable intake and risk of cardiovascular disease: The Women’s
Health Study. American Journal of Clinical Nutrition, 72(4), 922-928. Retrieved from
http://www.ajcn.org/content/72/4/922.full.pdf+html
Lock, K., Pomerleau, J., Causer, L., Altmann, D. R., & McKee, M. (2005). The global burden of
disease attributable to low consumption of fruit and vegetables: Implications for the
global strategy on diet. Bulletin of the World Health Organization, 83(2), 100-108.
Retrieved from http://www.who.int/bulletin/volumes/83/2/100arabic.pdf
Margetts, B. M., Beilin, L. J., Vandongen, R., & Armstrong, B. K. (1986). Vegetarian diet in mild
hypertension: A randomised controlled trial. British Medical Journal, 293(6560), 1468-
1471. Retrieved from http://www.ncbi.nlm.nih.gov/pmc/articles/PMC1342239/pdf/
bmjcred00264-0018.pdf
McDaniel, J. C., Belury, M., Ahijevych, K., & Blakely, W. (2008). Omega-3 fatty acids effect on
wound healing. Wound Repair and Regeneration, 16(3), 337-345. doi:10.1111/j.1524-
475X.2008.00388.x
McDaniel, J. C., Massey, K., & Nicolaou, A. (2011). Fish oil supplementation alters levels of
FRUIT AND VEGETABLE CONSUMPTION 39
lipid mediators of inflammation in microenvironment of acute human wounds. Wound
Repair and Regeneration, 19(2), 189-200. doi:10.1111/j.1524-475X.2010.00659.x
Miura, K., Giskes, K., & Turrell, G. (2011). Contribution of take-out food consumption to
socioeconomic differences in fruit and vegetable intake: A mediation analysis. Journal of
the American Dietetic Association, 111(10), 1556-1562. doi:10.1016/j.jada.2011.07.009
Patterson, B. H., Block, G., Rosenberger, W. F., Pee, D., & Kahle, L. L. (1990). Fruit and
vegetables in the American diet: Data from the NHANES II Survey. American Journal of
Public Health, 80(12), 1443-1449. Retrieved from http://www.ncbi.nlm.nih.gov/pmc/
articles/PMC1405127/pdf/amjph00225-0021.pdf
Patterson, R. E., Kristal, A. R., Tinker, L. F., Carter, R. A., Bolton, M. P., & Agurs-Collins, T.
(1999). Measurement characteristics of the Women’s Health Initiative food frequency
questionnaire. Annals of Epidemiology, 9(3), 178-187. Retrieved from http://www.
annalsofepidemiology.org/article/S1047-2797%2898%2900055-6/fulltext
Poirier, P., Giles, T. D., Bray, G. A., Hong, Y., Stern, J. S., Pi-Sunyer, F. X., & Eckel, R. H.
(2006). Obesity and cardiovascular disease: Pathophysiology, evaluation, and effect of
weight loss: An update of the 1997 American Heart Association scientific statement on
obesity and heart disease from the Obesity Committee of the Council on Nutrition,
Physical Activity, and Metabolism. Circulation, 113, 898-918. doi:10.1161/
CIRCULATIONAHA.106.171016
Rimm, E. B., Giovannucci, E. L., Stampfer, M. J., Colditz, G. A., Litin, L. B., & Willett, W. C.
(1992). Reproducibility and validity of an expanded self-administered semiquantitative
food frequency questionnaire among male health professionals. American Journal of
Epidemiology, 135(10), 1114-1126. Retrieved from http://aje.oxfordjournals.org/content/
FRUIT AND VEGETABLE CONSUMPTION 40
135/10/1114.full.pdf+html
Rissanen, T. H., Voutilainen, S., Virtanen, J. K., Venho, B., Vanharanta, M., Mursu, J., &
Salonen, J. T. (2003). Low intake of fruits, berries, and vegetables is associated with
excess mortality in men: The Kuopio Ischaemic Heart Disease Risk Factor (KIHD) Study.
Journal of Nutrition, 133(1), 199-204. Retrieved from http://jn.nutrition.org/content/133/
1/199.full.pdf+html
Roger, V. L., Go, A. S., Lloyd-Jones, D. M., Benjamin, E. J., Berry, J. D., Borden, W. B., . . .
Turner, M. B. (2011). Heart disease and stroke statistics – 2012 update: A report from the
American Heart Association. Circulation, 125, e2-e220. doi:10.1161/CIR.0b013e31823a
c046
Sacks, F. M., Rosner, B., & Kass, E. H. (1974). Blood pressure in vegetarians. American Journal
of Epidemiology, 100(5), 390-398. Retrieved from http://aje.oxfordjournals.org/content/
100/5/390.full.pdf+html
Salvini, S., Hunter, D. J., Sampson, L., Stampfer, M. J., Colditz, G. A., Rosner, B., & Willett, W.
C. (1989). Food-based validation of a dietary questionnaire: The effects of week-to-week
variation in food consumption. International Journal of Epidemiology, 18(4), 858-867.
doi:10.1093/ije/18.4.858
Schiller, J. S., Lucas, J. W., Ward, B. W., & Peregoy, J. A. (2012). Summary health statistics for
U.S. adults: National Health Interview Survey, 2010. Vital and Health Statistics, 10(252),
1-217. Retrieved from http://www.cdc.gov/nchs/data/series/sr_10/sr10_252.pdf
Serdula, M. K., Coates, R. J., Byers, T., Simoes, E., Mokdad, A. H., & Subar, A. F. (1995). Fruit
and vegetable intake among adults in 16 states: Results of a brief telephone survey.
American Journal of Public Health, 85(2), 236-239. Retrieved from http://www.ncbi.nlm.
FRUIT AND VEGETABLE CONSUMPTION 41
nih.gov/pmc/articles/PMC1615308/pdf/amjph00440-0094.pdf
Shah, M., Jeffery, R. W., Laing, B., Savre, S. G., Van Natta, M., & Strickland, D. (1990).
Hypertension Prevention Trial (HPT): Food pattern changes resulting from intervention
on sodium, potassium, and energy intake. Journal of the American Dietetic Association,
90(1), 69-76.
Shintani, T. T., Hughes, C. K., Beckham, S., & O’Connor, H. K. (1991). Obesity and
cardiovascular risk intervention through the ad libitum feeding of traditional Hawaiian
diet. American Journal of Clinical Nutrition, 53(6 Suppl.), 1647S-1651S. Retrieved from
http://www.ajcn.org/content/53/6/1647S.long
Subar, A. F., Heimendinger, J., Pattreson, B. H., Krebs-Smith, S. M., Pivonka, E., & Kessler, R.
(1995). Fruit and vegetable intake in the United States: The baseline survey of the Five A
Day for Better Health Program. American Journal of Health Promotion, 9(5), 352-60.
Thompson, B., Demark-Wahnefried, W., Taylor, G., McClelland, J. W., Stables, G., Havas, S., . . .
Cohen, N. (1999). Baseline fruit and vegetable intake among adults in seven 5 A Day
study centers located in diverse geographic areas. Journal of the American Dietetic
Association, 99(10), 1241-1248. doi:10.1016/S0002-8223(99)00306-5
Tohill, B. C., Seymour, J., Serdula, M., Kettel-Khan, L., & Rolls, B. J. (2004). What
epidemiologic studies tell us about the relationship between fruit and vegetable
consumption and body weight. Nutrition Reviews, 62(10), 365-374. doi:10.1301/nr.2004.
oct.365–374
U.S. Department of Health and Human Services & U.S. Department of Agriculture. (2005).
Dietary Guidelines for Americans, 2005. 6th Edition. Washington, D.C.: U.S.
Government Printing Office.
FRUIT AND VEGETABLE CONSUMPTION 42
Viocare Technologies, Inc. Electronic food frequency questionnaire. 145 Witherspoon Street,
Princeton, New Jersey. 08542.
Willett, W. C., Sampson, L., Stampfer, M. J., Rosner, B., Bain, C., Witschi, J., . . . Speizer, F. E.
(1985). Reproducibility and validity of a semiquantitative food frequency questionnaire.
American Journal of Epidemiology, 122(1), 51-65. Retrieved from http://aje.oxford
journals.org/content/122/1/51.full.pdf+html
World Health Organization. (2011). Cardiovascular diseases (CVDs; Fact sheet N°317).
Retrieved from http://www.who.int/mediacentre/factsheets/fs317/en/index.html


![The Effect of Fruit and Vegetable Consumption on Cancer Incidence [1.0]](https://img.pdfslide.us/doc/110x75/577cd1c01a28ab9e7894f588/the-effect-of-fruit-and-vegetable-consumption-on-cancer-incidence-10.jpg)