Embed Size (px)
Citation preview
Quest Diagnostics Health Trends™ Page 1 of 45
Health Trends™ - Heart Health Report Highlights
• The Heart Health Report is the first analysis to encompass such a large sample (nearly 80 million) of LDL cholesterol test results. It provides the most up to date information available on national LDL cholesterol trends.
• According to the Heart Health Report, average LDL (low-density lipoprotein) cholesterol levels decreased approximately 10 percent, among Americans who have seen a physician, from 2001 to 2004. LDL, or “bad cholesterol”, is a significant risk factor for heart disease.
• The Heart Health Report also showed that women’s LDL cholesterol levels are not decreasing as much as men’s.
Graphs Maps Data
Overall Mean Mean LDL by State Data Tables
% >Selected NCEP Guidelines
% 130 by State
By Age
Quest Diagnostics Health Trends™ Page 2 of 45
By Gender
By Age and Gender
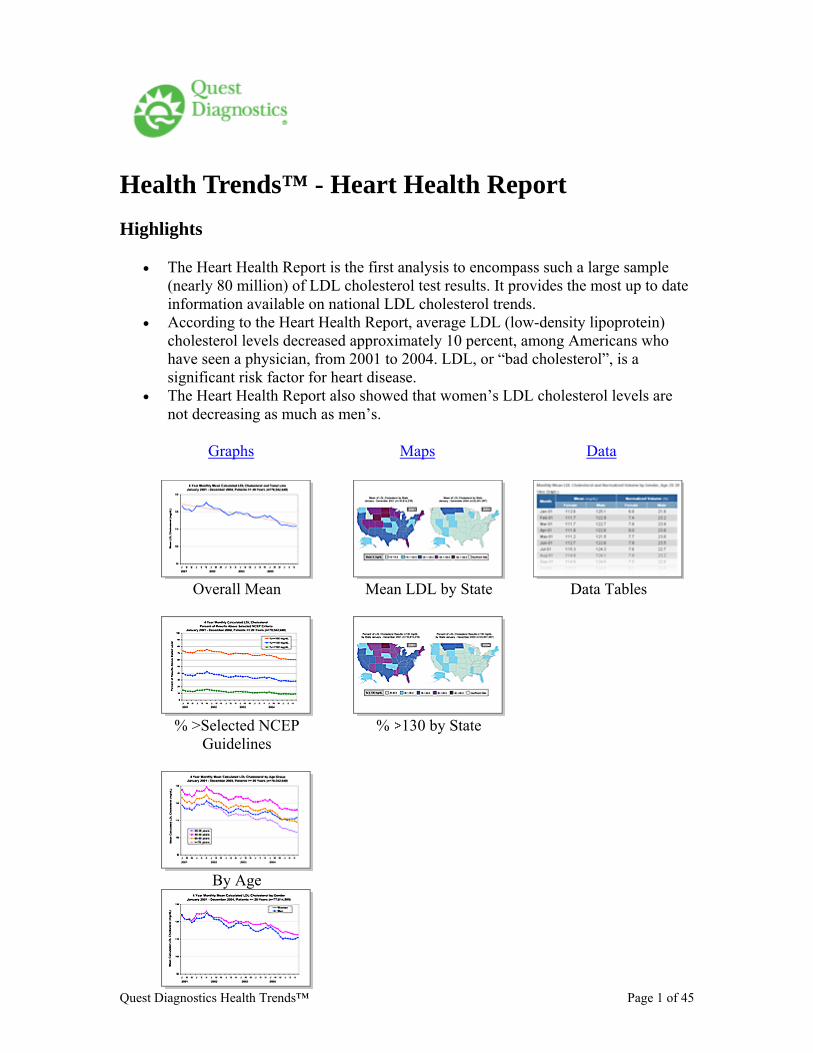
Heart Health Graphs Overall Mean
Average low-density lipoprotein (LDL or “bad” cholesterol) levels dropped by 10% from 2001 to 2004.
Quest Diagnostics Health Trends™ Page 3 of 45
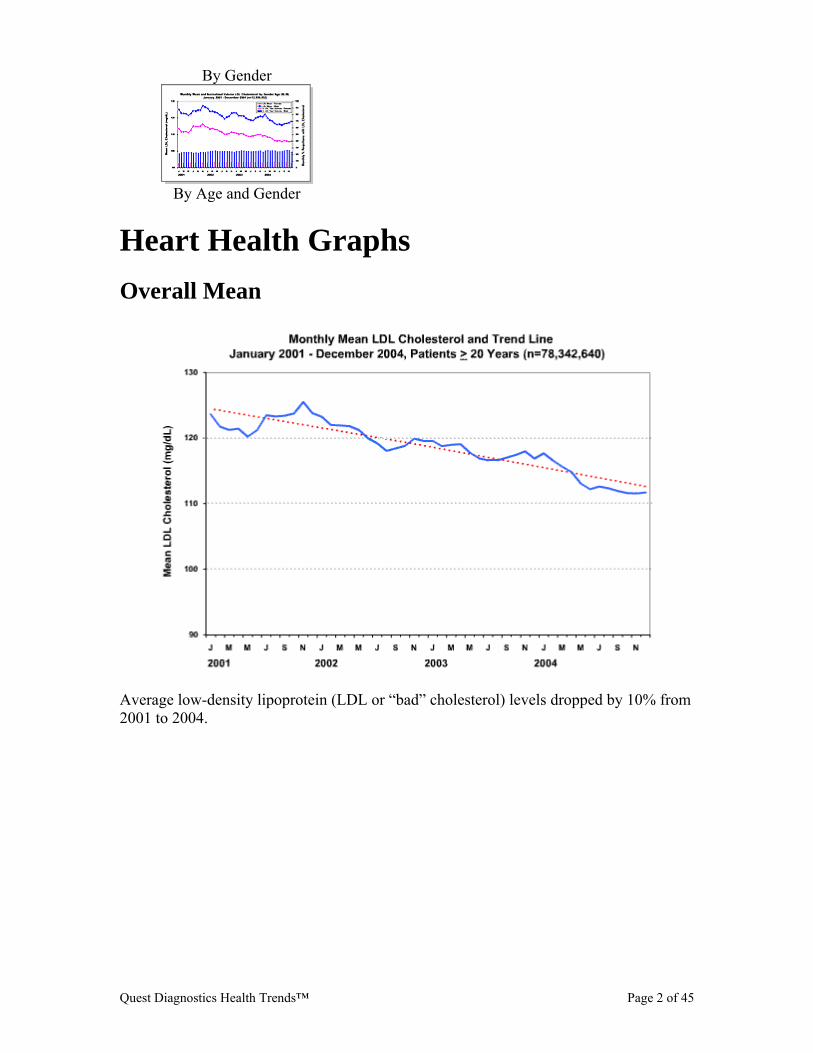
Heart Health Graphs % >Selected NCEP Guidelines
The National Cholesterol Education Program (NCEP) has defined guidelines for cholesterol levels. This graph shows the percentage of test results above three NCEP levels, and indicates improvement at each level.
Quest Diagnostics Health Trends™ Page 4 of 45
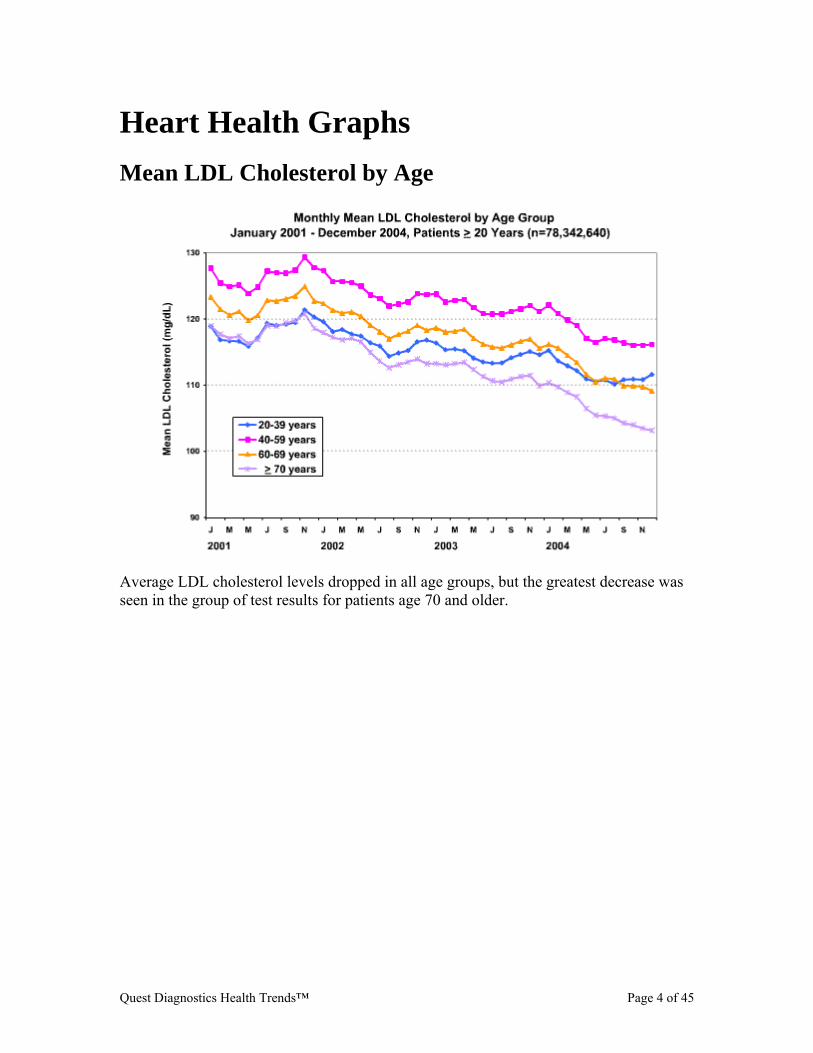
Heart Health Graphs Mean LDL Cholesterol by Age
Average LDL cholesterol levels dropped in all age groups, but the greatest decrease was seen in the group of test results for patients age 70 and older.
Quest Diagnostics Health Trends™ Page 5 of 45
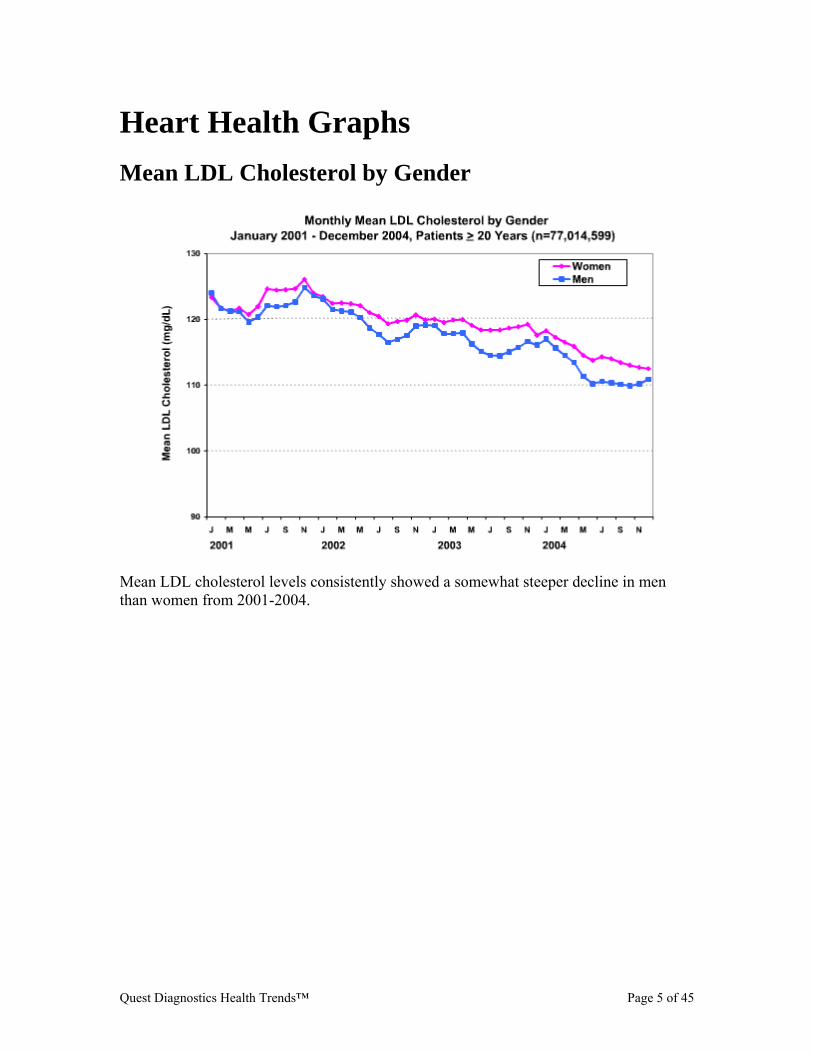
Heart Health Graphs Mean LDL Cholesterol by Gender
Mean LDL cholesterol levels consistently showed a somewhat steeper decline in men than women from 2001-2004.
Quest Diagnostics Health Trends™ Page 6 of 45
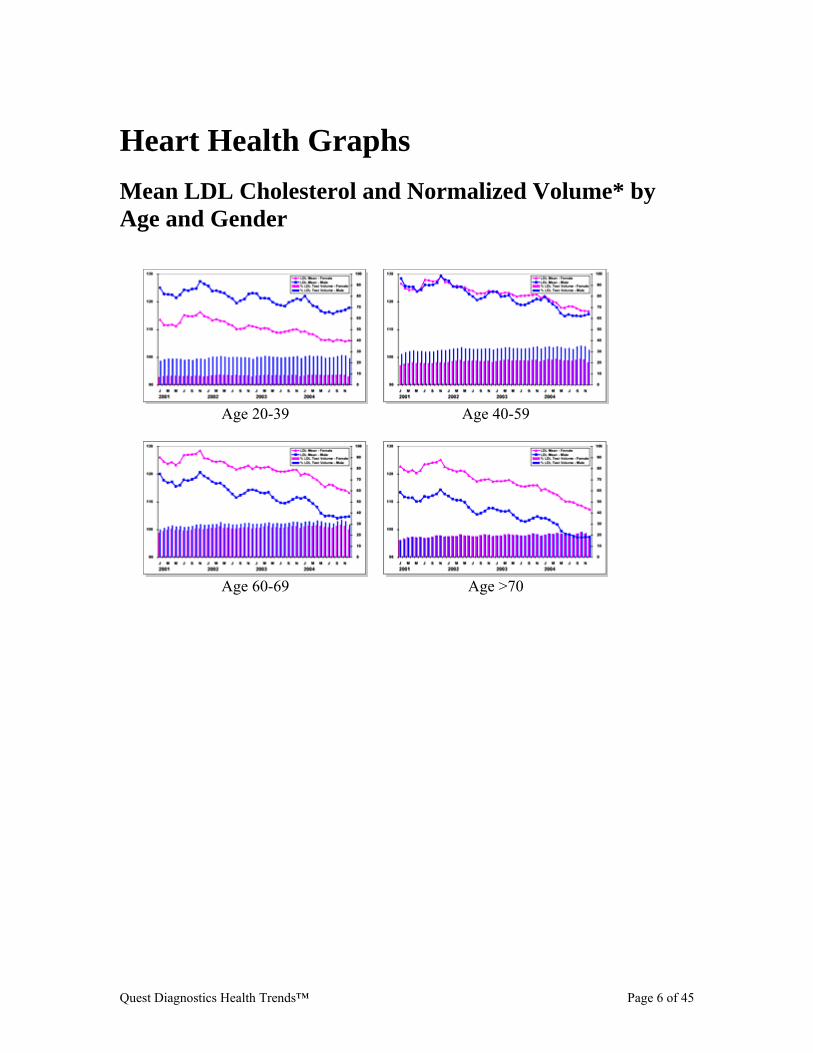
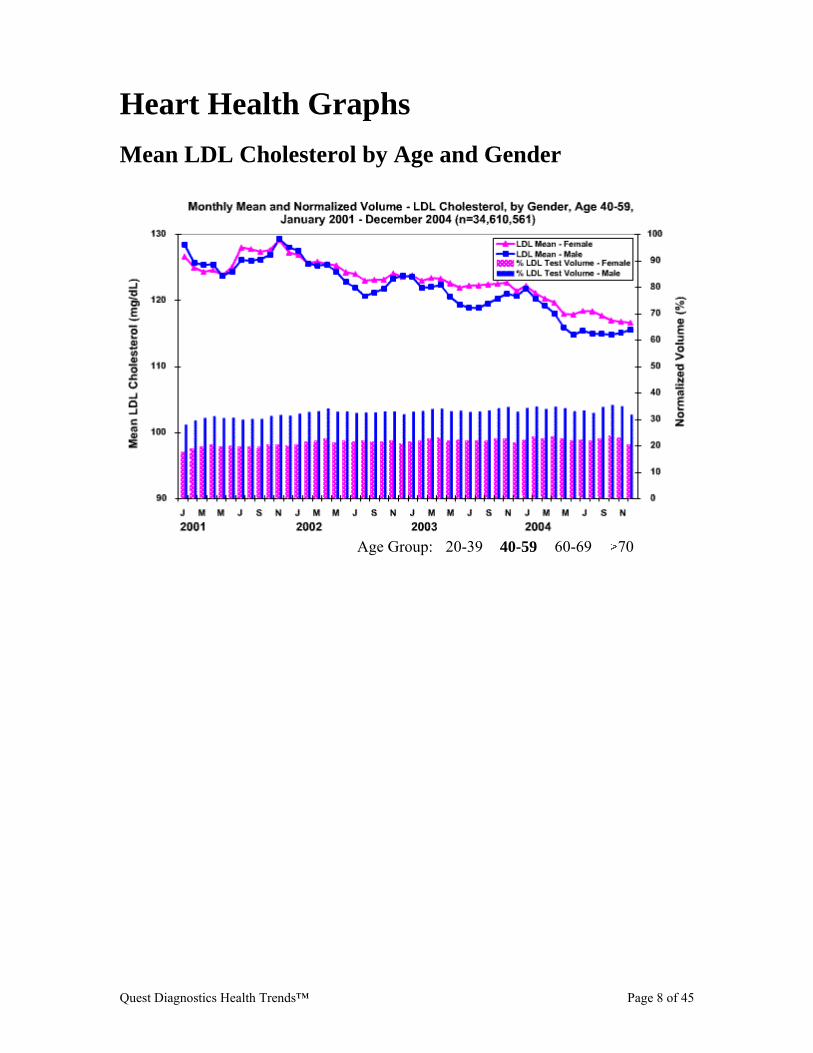
Heart Health Graphs Mean LDL Cholesterol and Normalized Volume* by Age and Gender
Age 20-39 Age 40-59
Age 60-69 Age >70
Quest Diagnostics Health Trends™ Page 7 of 45
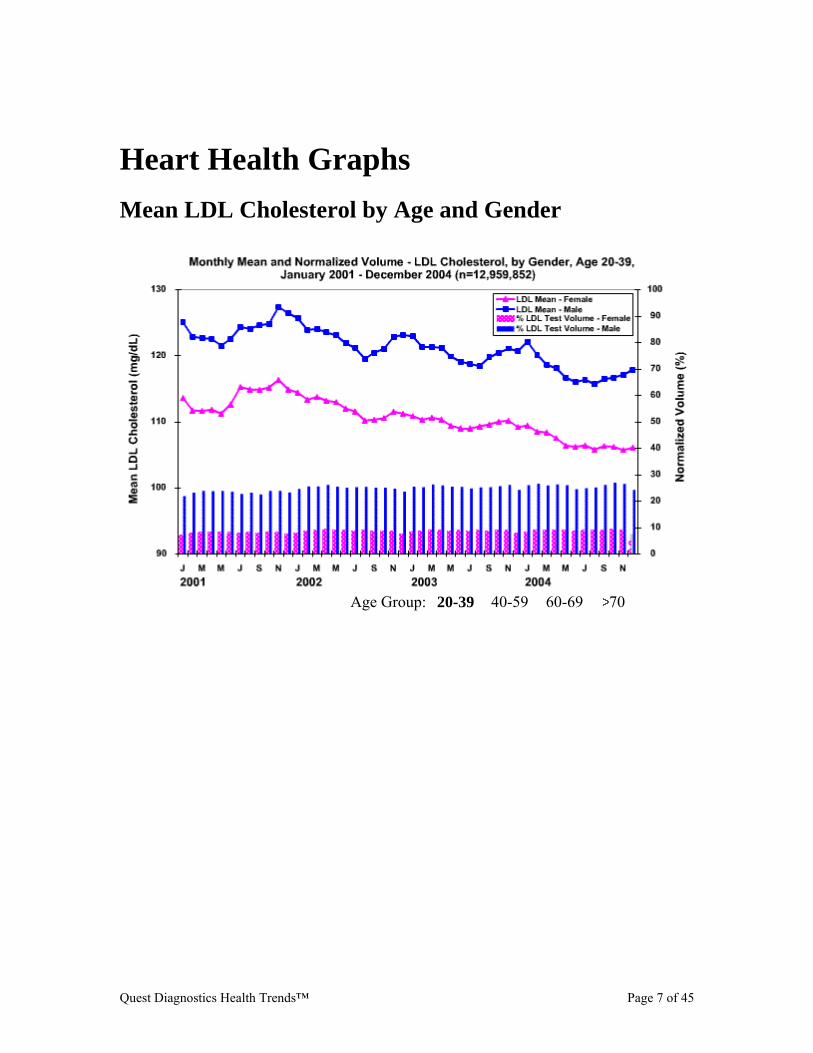
Heart Health Graphs Mean LDL Cholesterol by Age and Gender
Age Group: 20-39 40-59 60-69 70
Quest Diagnostics Health Trends™ Page 8 of 45
Heart Health Graphs Mean LDL Cholesterol by Age and Gender
Age Group: 20-39 40-59 60-69 70
Quest Diagnostics Health Trends™ Page 9 of 45
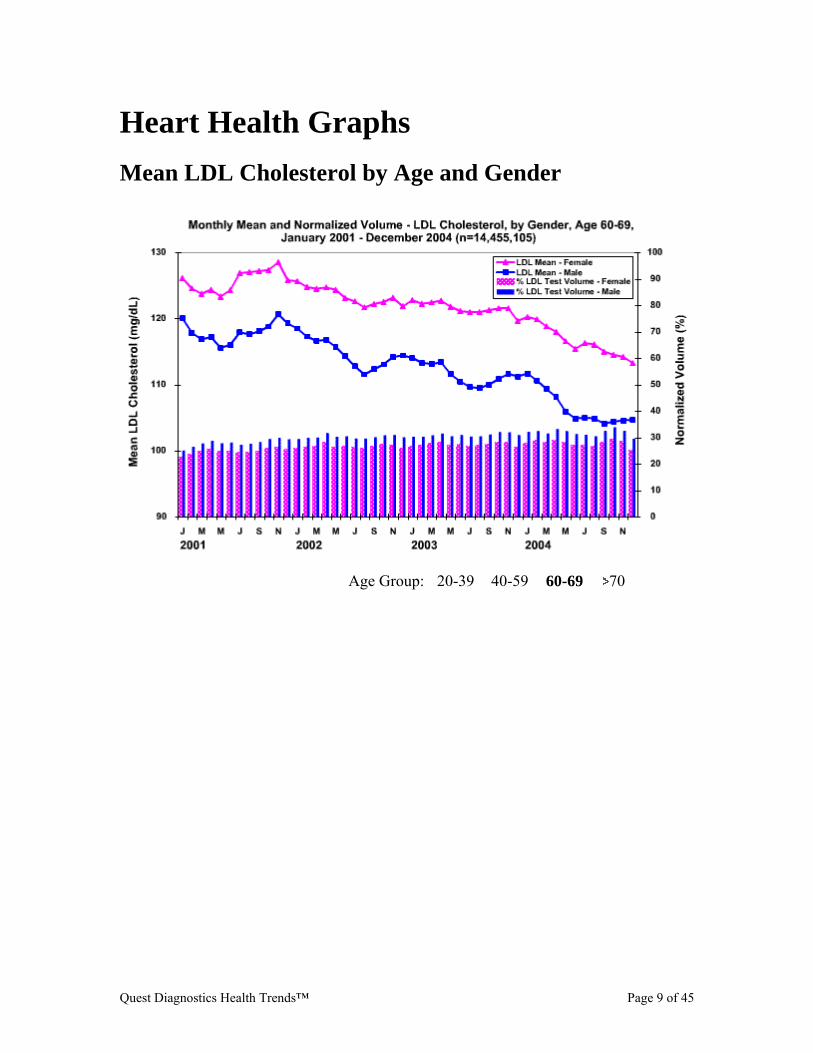
Heart Health Graphs Mean LDL Cholesterol by Age and Gender
Age Group: 20-39 40-59 60-69 70
Quest Diagnostics Health Trends™ Page 10 of 45
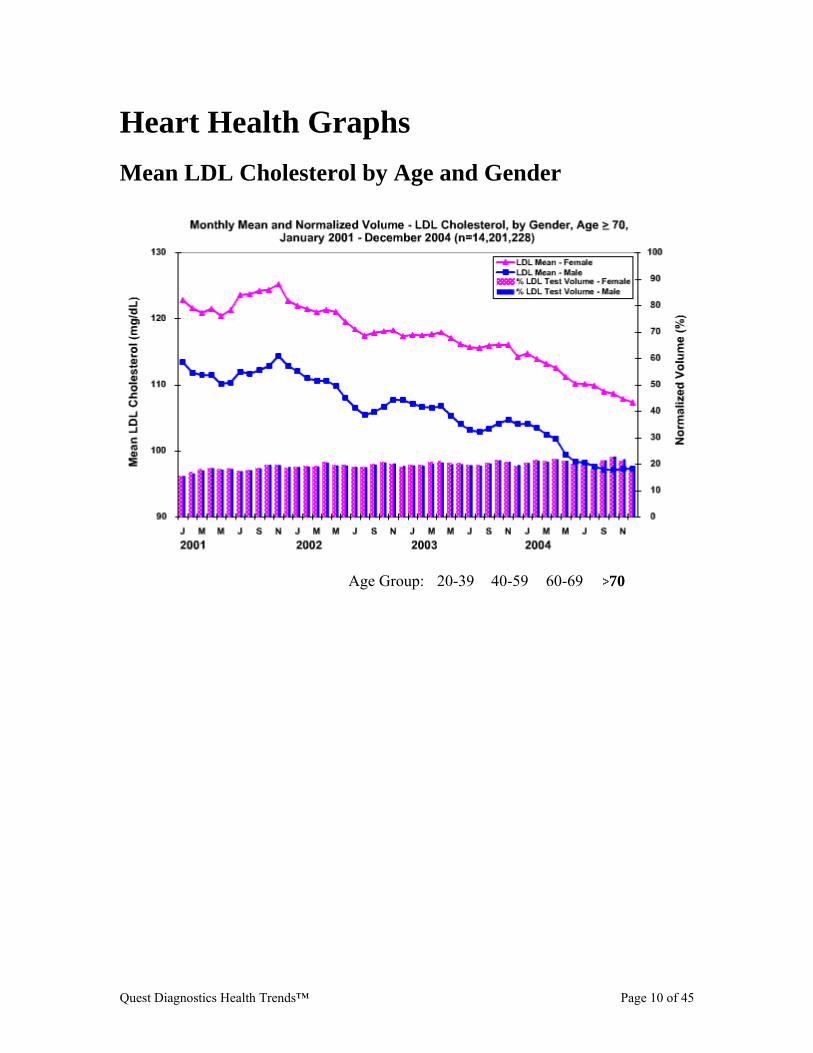
Heart Health Graphs Mean LDL Cholesterol by Age and Gender
Age Group: 20-39 40-59 60-69 70
Quest Diagnostics Health Trends™ Page 11 of 45
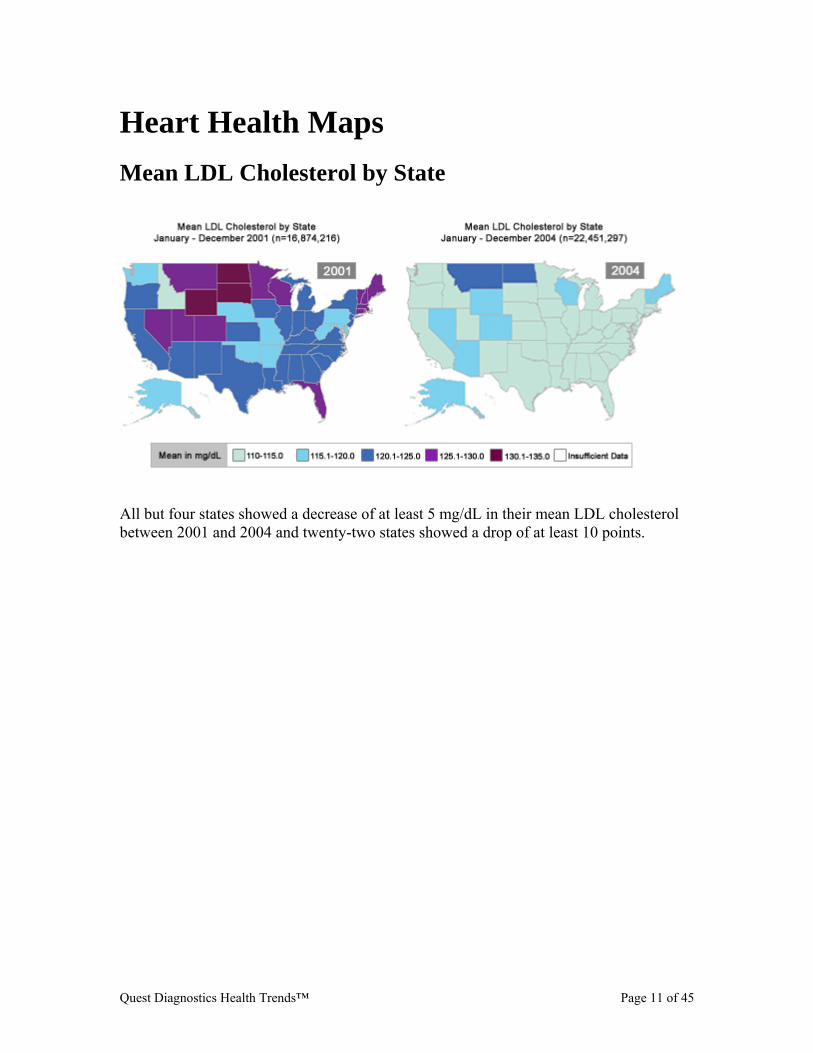
Heart Health Maps Mean LDL Cholesterol by State
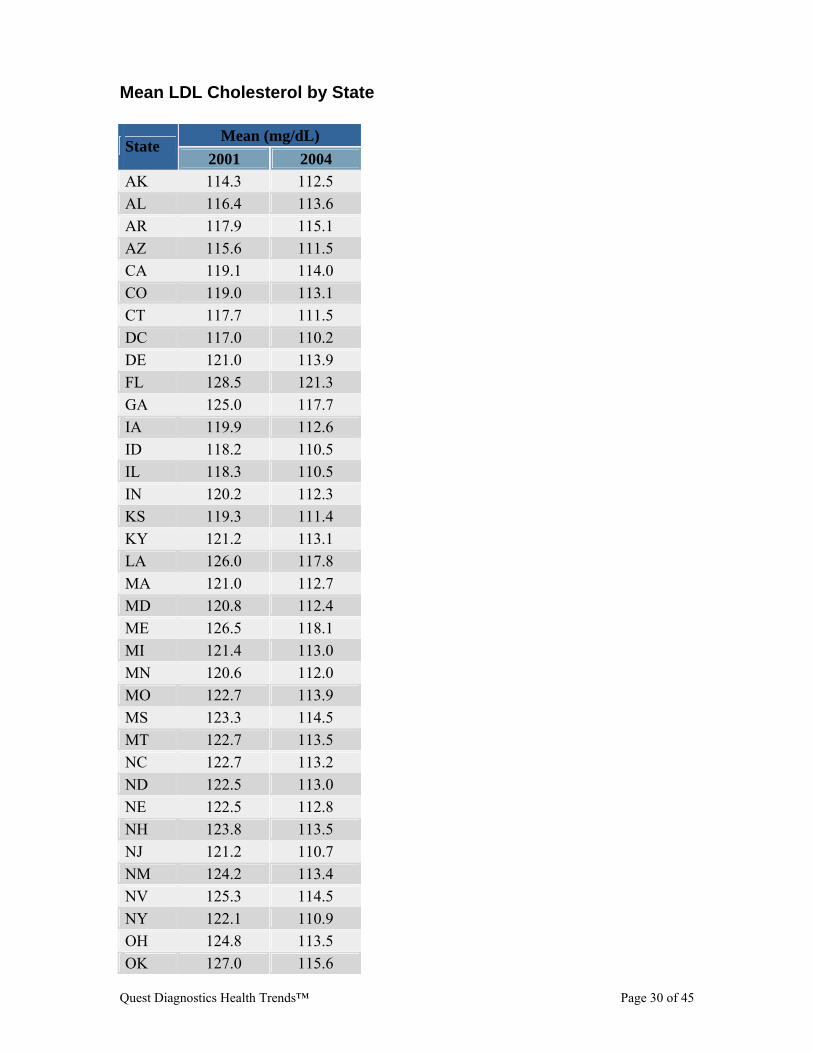
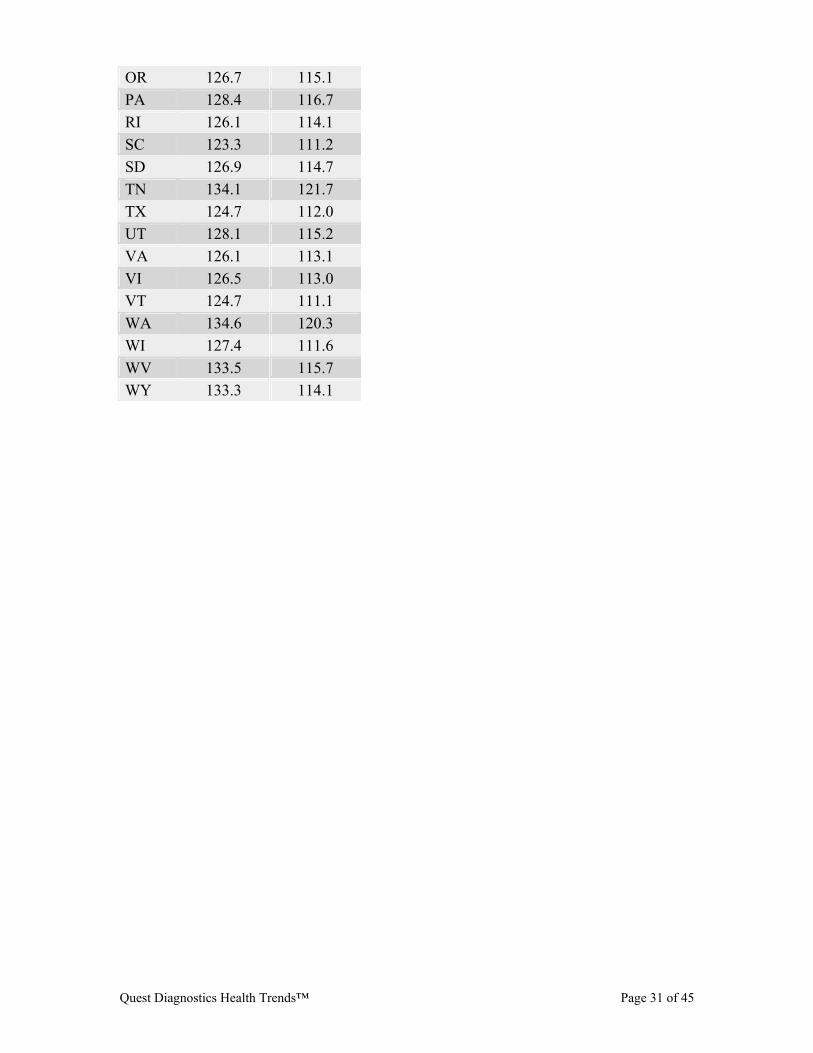
All but four states showed a decrease of at least 5 mg/dL in their mean LDL cholesterol between 2001 and 2004 and twenty-two states showed a drop of at least 10 points.
Quest Diagnostics Health Trends™ Page 12 of 45
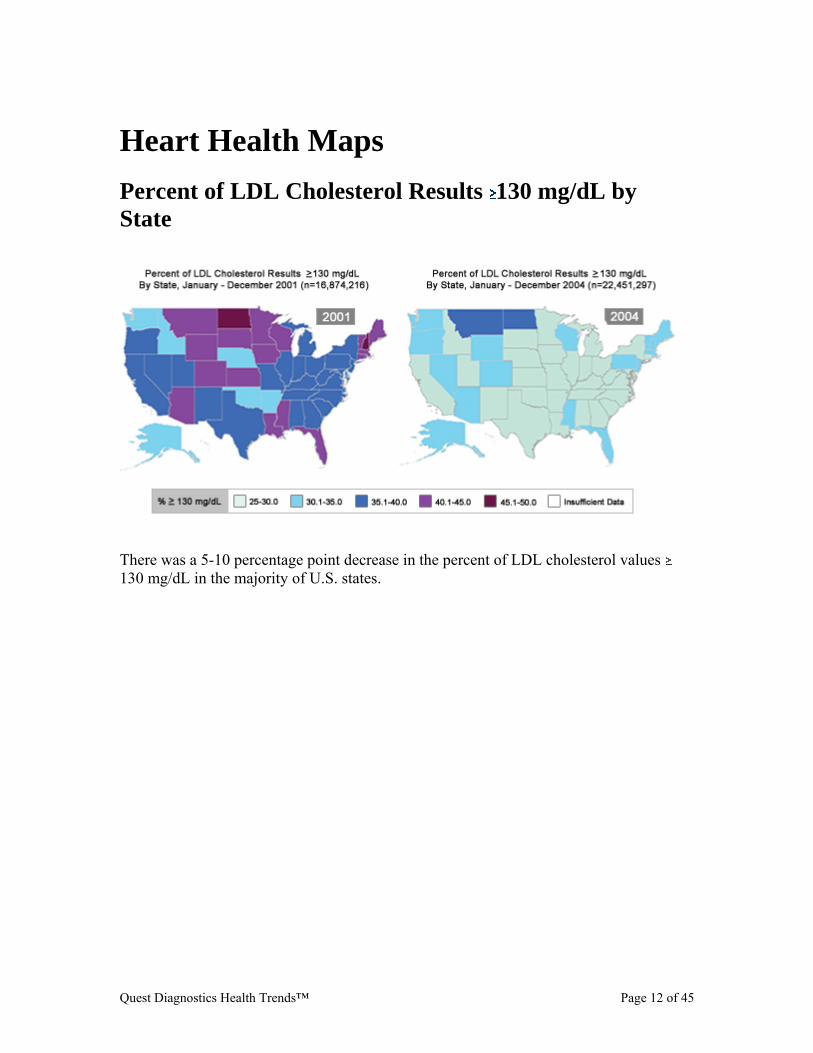
Heart Health Maps Percent of LDL Cholesterol Results 130 mg/dL by State
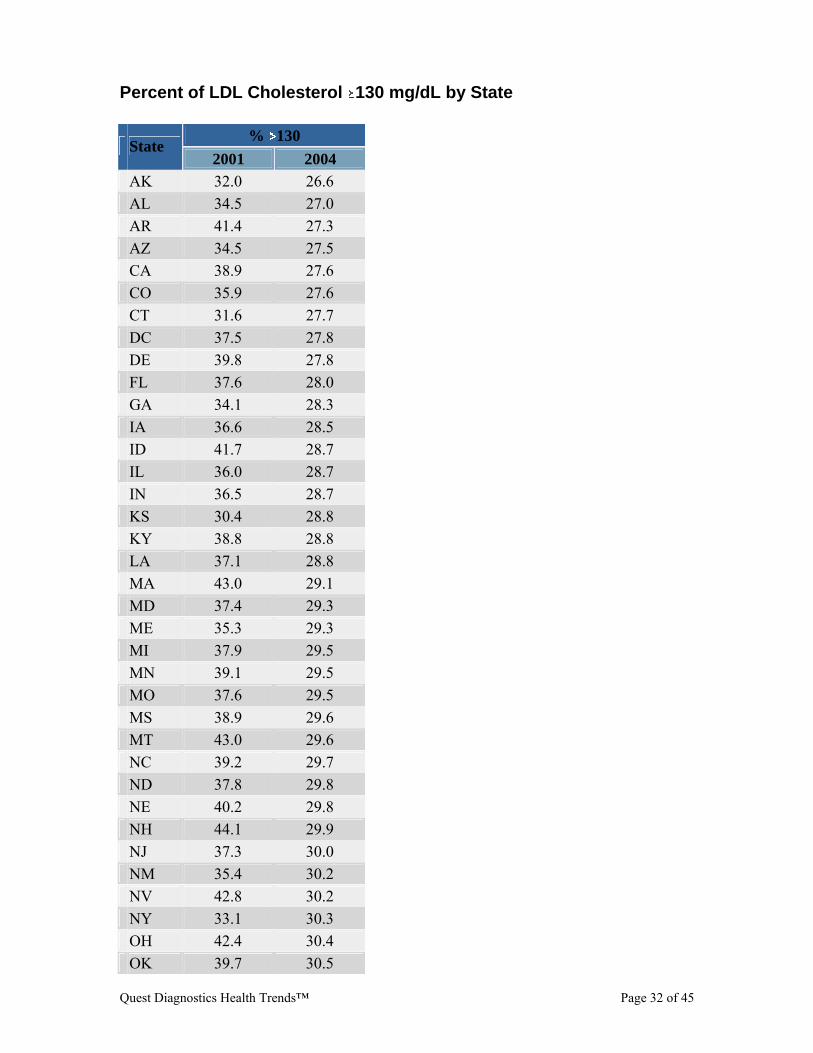
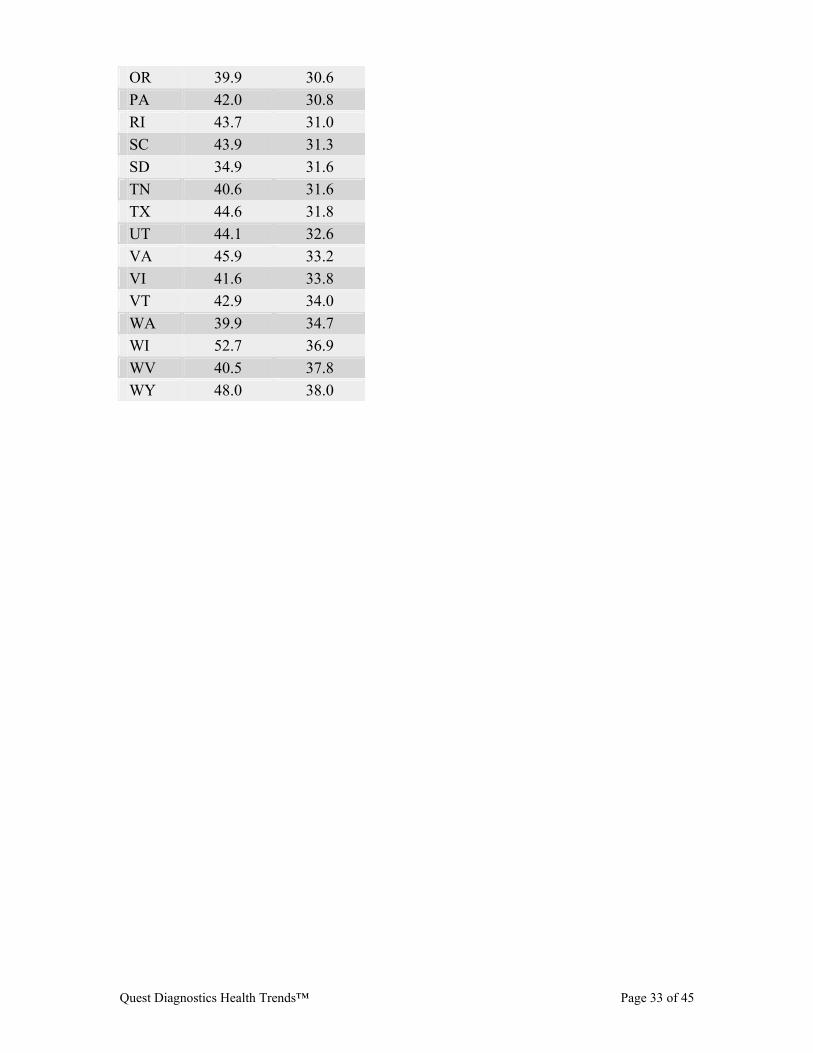
There was a 5-10 percentage point decrease in the percent of LDL cholesterol values 130 mg/dL in the majority of U.S. states.
Quest Diagnostics Health Trends™ Page 13 of 45
Heart Health Data Data Tables for Graphs Monthly Mean LDL Cholesterol Percent of LDL Cholesterol Results Above Selected NCEP Guidelines Monthly Mean LDL Cholesterol by Age Group Monthly Mean LDL Cholesterol by Gender Monthly Mean LDL Cholesterol by Age and Gender
• 20-39 • 40-59 • 60-69 • Over 70
Data Tables for Maps Mean LDL Cholesterol by State Percent of LDL Cholesterol Results ≥130 mg/dL by State
Quest Diagnostics Health Trends™ Page 14 of 45
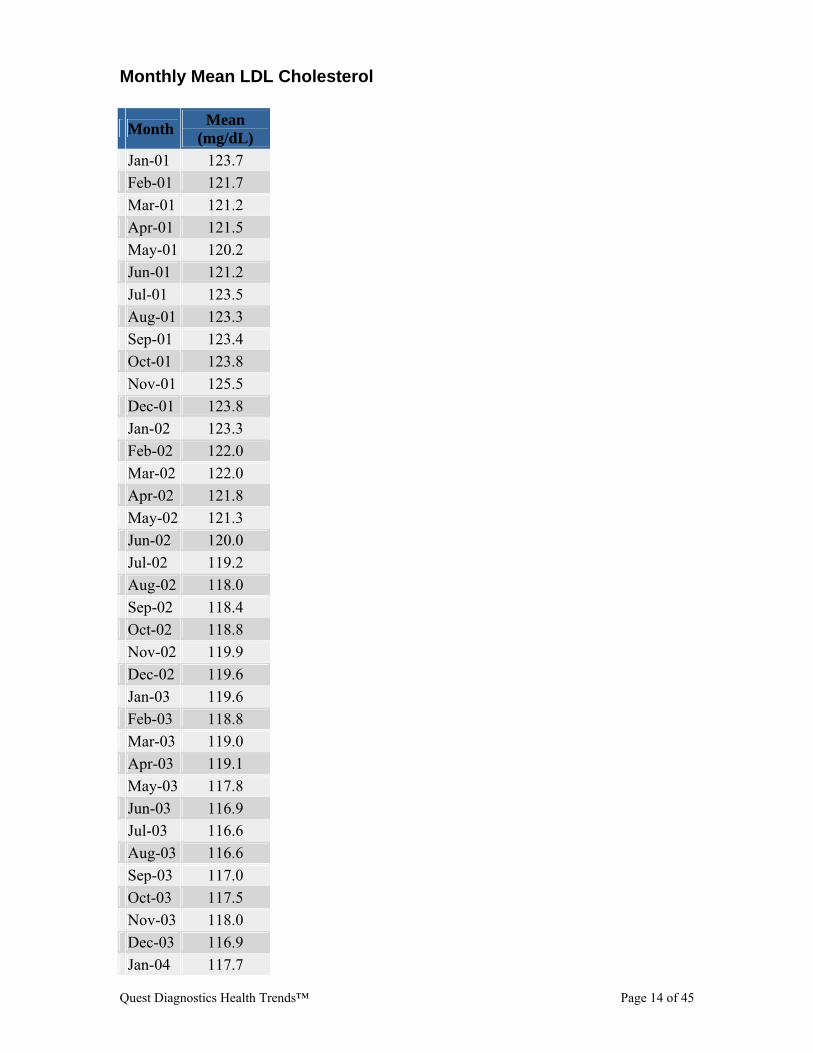
Monthly Mean LDL Cholesterol
Month Mean (mg/dL)
Jan-01 123.7 Feb-01 121.7 Mar-01 121.2 Apr-01 121.5 May-01 120.2 Jun-01 121.2 Jul-01 123.5 Aug-01 123.3 Sep-01 123.4 Oct-01 123.8 Nov-01 125.5 Dec-01 123.8 Jan-02 123.3 Feb-02 122.0 Mar-02 122.0 Apr-02 121.8 May-02 121.3 Jun-02 120.0 Jul-02 119.2 Aug-02 118.0 Sep-02 118.4 Oct-02 118.8 Nov-02 119.9 Dec-02 119.6 Jan-03 119.6 Feb-03 118.8 Mar-03 119.0 Apr-03 119.1 May-03 117.8 Jun-03 116.9 Jul-03 116.6 Aug-03 116.6 Sep-03 117.0 Oct-03 117.5 Nov-03 118.0 Dec-03 116.9 Jan-04 117.7
Quest Diagnostics Health Trends™ Page 15 of 45
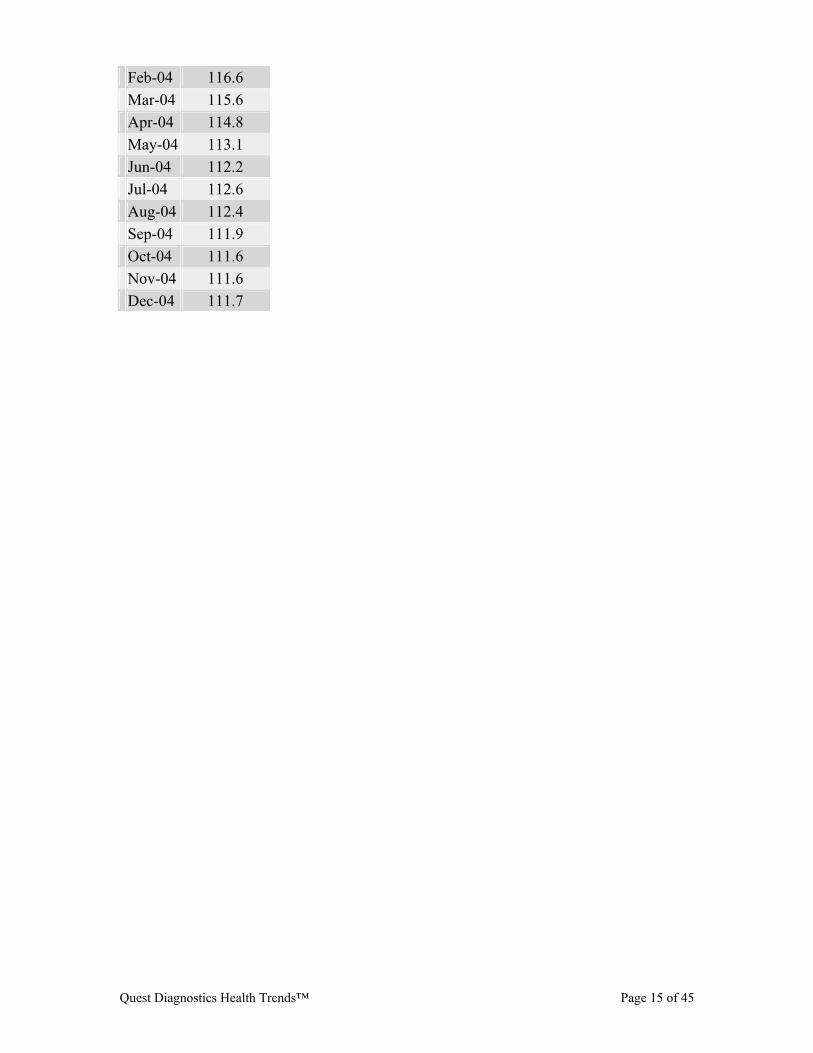
Feb-04 116.6 Mar-04 115.6 Apr-04 114.8 May-04 113.1 Jun-04 112.2 Jul-04 112.6 Aug-04 112.4 Sep-04 111.9 Oct-04 111.6 Nov-04 111.6 Dec-04 111.7
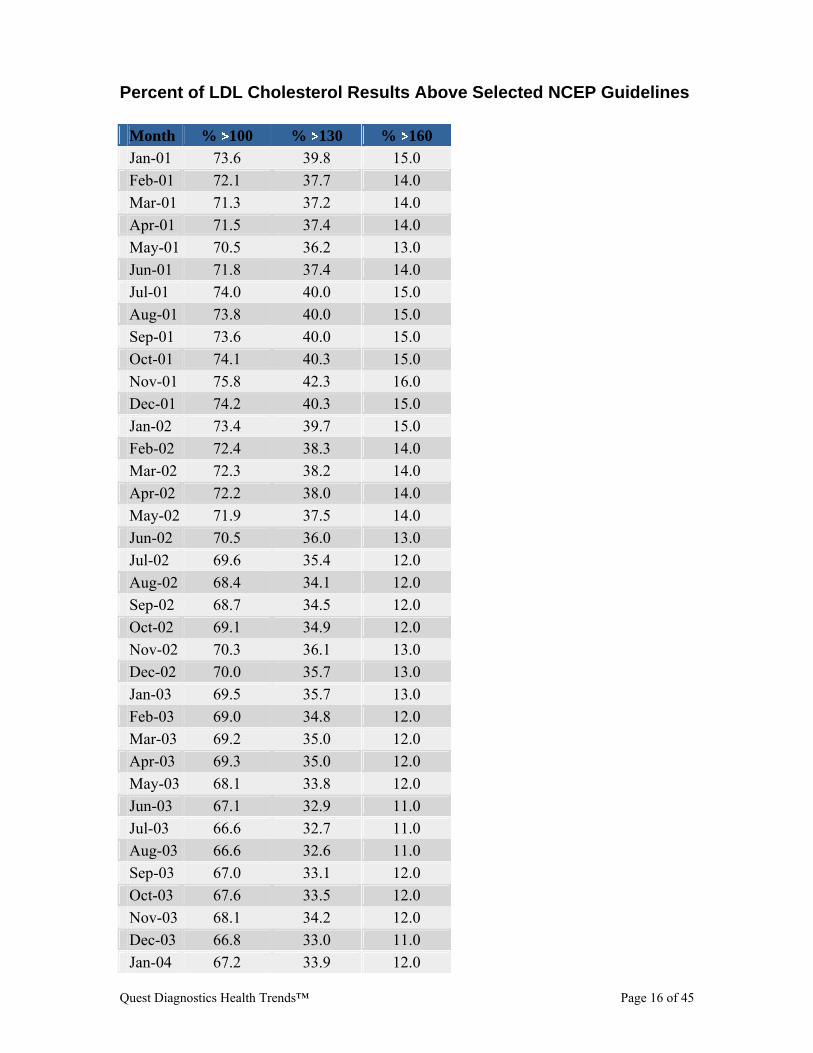
Quest Diagnostics Health Trends™ Page 16 of 45
Percent of LDL Cholesterol Results Above Selected NCEP Guidelines Month % 100 % 130 % 160 Jan-01 73.6 39.8 15.0 Feb-01 72.1 37.7 14.0 Mar-01 71.3 37.2 14.0 Apr-01 71.5 37.4 14.0 May-01 70.5 36.2 13.0 Jun-01 71.8 37.4 14.0 Jul-01 74.0 40.0 15.0 Aug-01 73.8 40.0 15.0 Sep-01 73.6 40.0 15.0 Oct-01 74.1 40.3 15.0 Nov-01 75.8 42.3 16.0 Dec-01 74.2 40.3 15.0 Jan-02 73.4 39.7 15.0 Feb-02 72.4 38.3 14.0 Mar-02 72.3 38.2 14.0 Apr-02 72.2 38.0 14.0 May-02 71.9 37.5 14.0 Jun-02 70.5 36.0 13.0 Jul-02 69.6 35.4 12.0 Aug-02 68.4 34.1 12.0 Sep-02 68.7 34.5 12.0 Oct-02 69.1 34.9 12.0 Nov-02 70.3 36.1 13.0 Dec-02 70.0 35.7 13.0 Jan-03 69.5 35.7 13.0 Feb-03 69.0 34.8 12.0 Mar-03 69.2 35.0 12.0 Apr-03 69.3 35.0 12.0 May-03 68.1 33.8 12.0 Jun-03 67.1 32.9 11.0 Jul-03 66.6 32.7 11.0 Aug-03 66.6 32.6 11.0 Sep-03 67.0 33.1 12.0 Oct-03 67.6 33.5 12.0 Nov-03 68.1 34.2 12.0 Dec-03 66.8 33.0 11.0 Jan-04 67.2 33.9 12.0
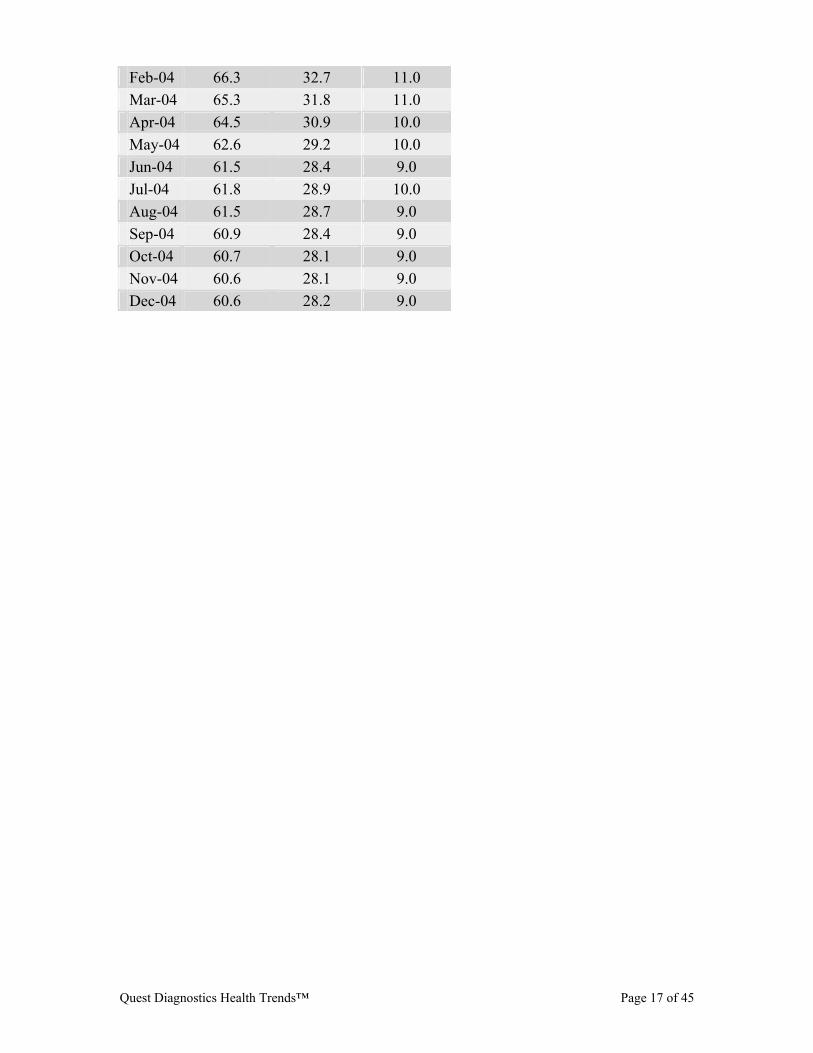
Quest Diagnostics Health Trends™ Page 17 of 45
Feb-04 66.3 32.7 11.0 Mar-04 65.3 31.8 11.0 Apr-04 64.5 30.9 10.0 May-04 62.6 29.2 10.0 Jun-04 61.5 28.4 9.0 Jul-04 61.8 28.9 10.0 Aug-04 61.5 28.7 9.0 Sep-04 60.9 28.4 9.0 Oct-04 60.7 28.1 9.0 Nov-04 60.6 28.1 9.0 Dec-04 60.6 28.2 9.0
Quest Diagnostics Health Trends™ Page 18 of 45
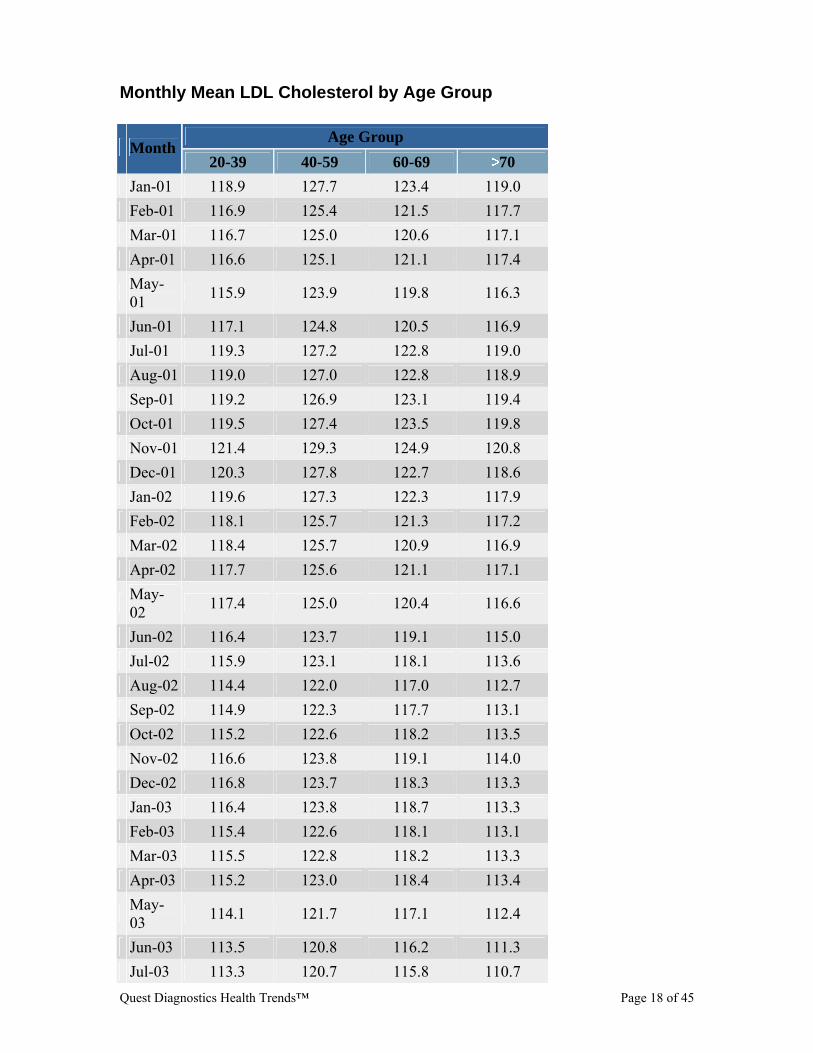
Monthly Mean LDL Cholesterol by Age Group
Age Group Month
20-39 40-59 60-69 70 Jan-01 118.9 127.7 123.4 119.0 Feb-01 116.9 125.4 121.5 117.7 Mar-01 116.7 125.0 120.6 117.1 Apr-01 116.6 125.1 121.1 117.4
May-01 115.9 123.9 119.8 116.3
Jun-01 117.1 124.8 120.5 116.9 Jul-01 119.3 127.2 122.8 119.0 Aug-01 119.0 127.0 122.8 118.9 Sep-01 119.2 126.9 123.1 119.4 Oct-01 119.5 127.4 123.5 119.8 Nov-01 121.4 129.3 124.9 120.8 Dec-01 120.3 127.8 122.7 118.6 Jan-02 119.6 127.3 122.3 117.9 Feb-02 118.1 125.7 121.3 117.2 Mar-02 118.4 125.7 120.9 116.9 Apr-02 117.7 125.6 121.1 117.1
May-02 117.4 125.0 120.4 116.6
Jun-02 116.4 123.7 119.1 115.0 Jul-02 115.9 123.1 118.1 113.6 Aug-02 114.4 122.0 117.0 112.7 Sep-02 114.9 122.3 117.7 113.1 Oct-02 115.2 122.6 118.2 113.5 Nov-02 116.6 123.8 119.1 114.0 Dec-02 116.8 123.7 118.3 113.3 Jan-03 116.4 123.8 118.7 113.3 Feb-03 115.4 122.6 118.1 113.1 Mar-03 115.5 122.8 118.2 113.3 Apr-03 115.2 123.0 118.4 113.4
May-03 114.1 121.7 117.1 112.4
Jun-03 113.5 120.8 116.2 111.3 Jul-03 113.3 120.7 115.8 110.7
Quest Diagnostics Health Trends™ Page 19 of 45
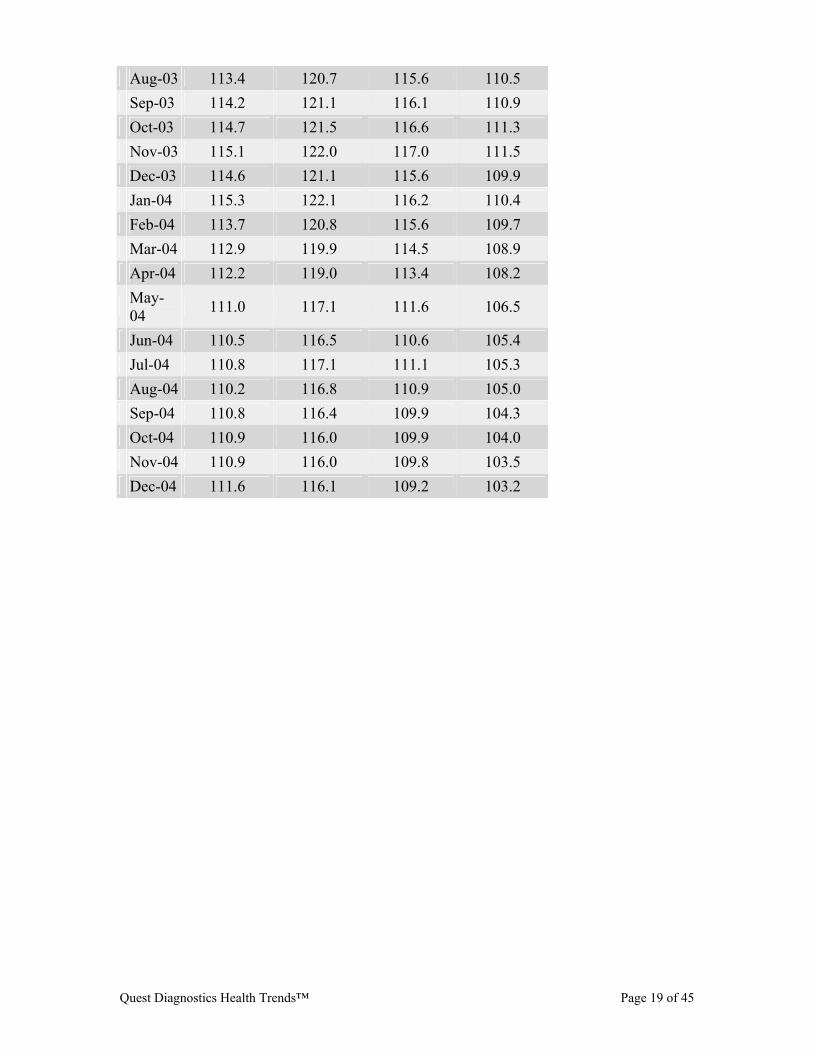
Aug-03 113.4 120.7 115.6 110.5 Sep-03 114.2 121.1 116.1 110.9 Oct-03 114.7 121.5 116.6 111.3 Nov-03 115.1 122.0 117.0 111.5 Dec-03 114.6 121.1 115.6 109.9 Jan-04 115.3 122.1 116.2 110.4 Feb-04 113.7 120.8 115.6 109.7 Mar-04 112.9 119.9 114.5 108.9 Apr-04 112.2 119.0 113.4 108.2
May-04 111.0 117.1 111.6 106.5
Jun-04 110.5 116.5 110.6 105.4 Jul-04 110.8 117.1 111.1 105.3 Aug-04 110.2 116.8 110.9 105.0 Sep-04 110.8 116.4 109.9 104.3 Oct-04 110.9 116.0 109.9 104.0 Nov-04 110.9 116.0 109.8 103.5 Dec-04 111.6 116.1 109.2 103.2
Quest Diagnostics Health Trends™ Page 20 of 45
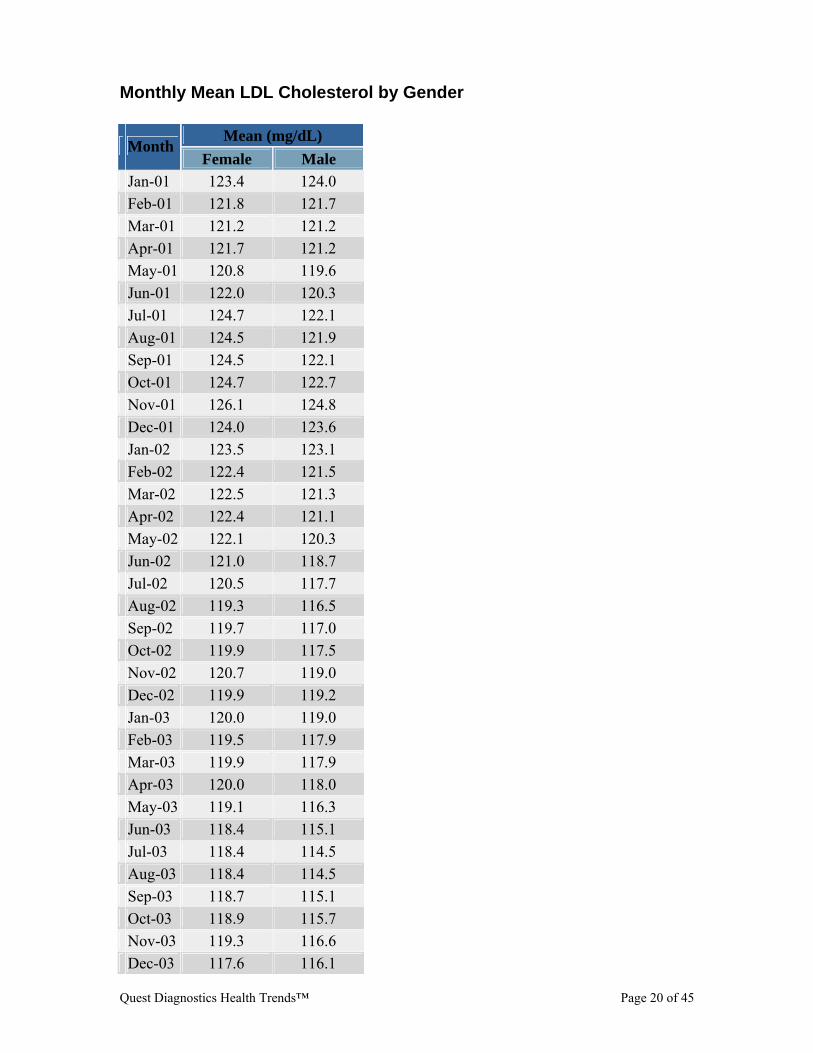
Monthly Mean LDL Cholesterol by Gender
Mean (mg/dL) Month
Female Male Jan-01 123.4 124.0 Feb-01 121.8 121.7 Mar-01 121.2 121.2 Apr-01 121.7 121.2 May-01 120.8 119.6 Jun-01 122.0 120.3 Jul-01 124.7 122.1 Aug-01 124.5 121.9 Sep-01 124.5 122.1 Oct-01 124.7 122.7 Nov-01 126.1 124.8 Dec-01 124.0 123.6 Jan-02 123.5 123.1 Feb-02 122.4 121.5 Mar-02 122.5 121.3 Apr-02 122.4 121.1 May-02 122.1 120.3 Jun-02 121.0 118.7 Jul-02 120.5 117.7 Aug-02 119.3 116.5 Sep-02 119.7 117.0 Oct-02 119.9 117.5 Nov-02 120.7 119.0 Dec-02 119.9 119.2 Jan-03 120.0 119.0 Feb-03 119.5 117.9 Mar-03 119.9 117.9 Apr-03 120.0 118.0 May-03 119.1 116.3 Jun-03 118.4 115.1 Jul-03 118.4 114.5 Aug-03 118.4 114.5 Sep-03 118.7 115.1 Oct-03 118.9 115.7 Nov-03 119.3 116.6 Dec-03 117.6 116.1
Quest Diagnostics Health Trends™ Page 21 of 45
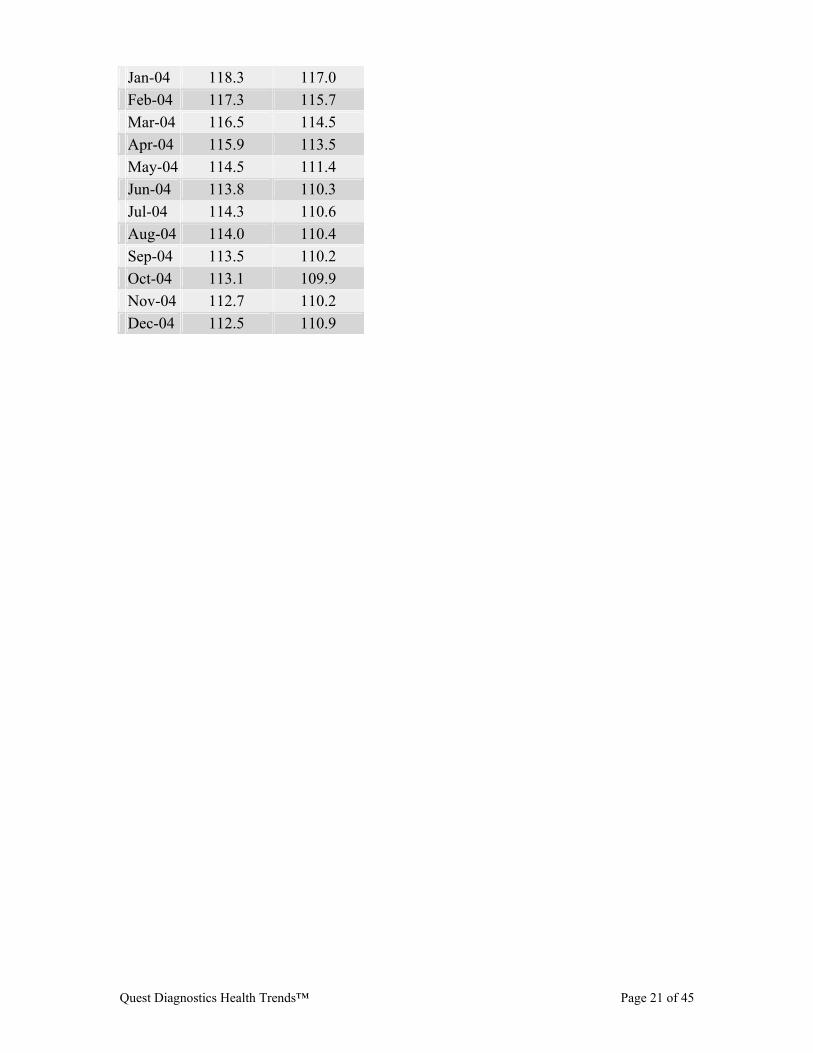
Jan-04 118.3 117.0 Feb-04 117.3 115.7 Mar-04 116.5 114.5 Apr-04 115.9 113.5 May-04 114.5 111.4 Jun-04 113.8 110.3 Jul-04 114.3 110.6 Aug-04 114.0 110.4 Sep-04 113.5 110.2 Oct-04 113.1 109.9 Nov-04 112.7 110.2 Dec-04 112.5 110.9
Quest Diagnostics Health Trends™ Page 22 of 45
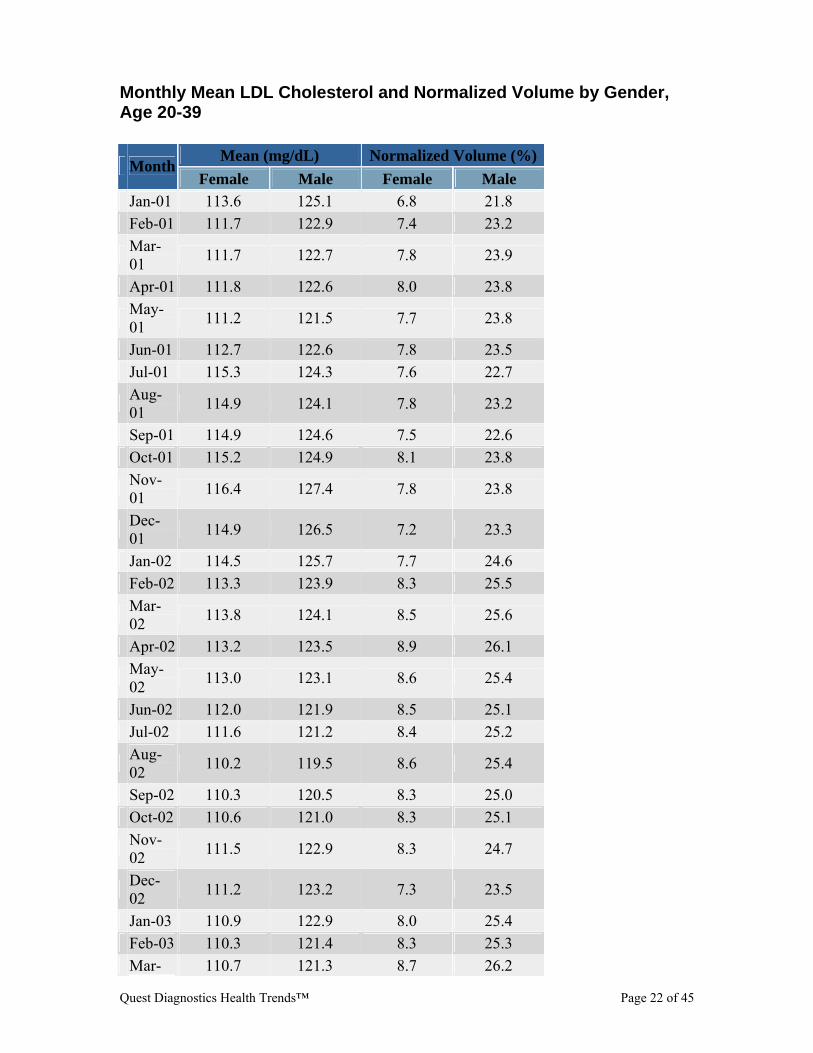
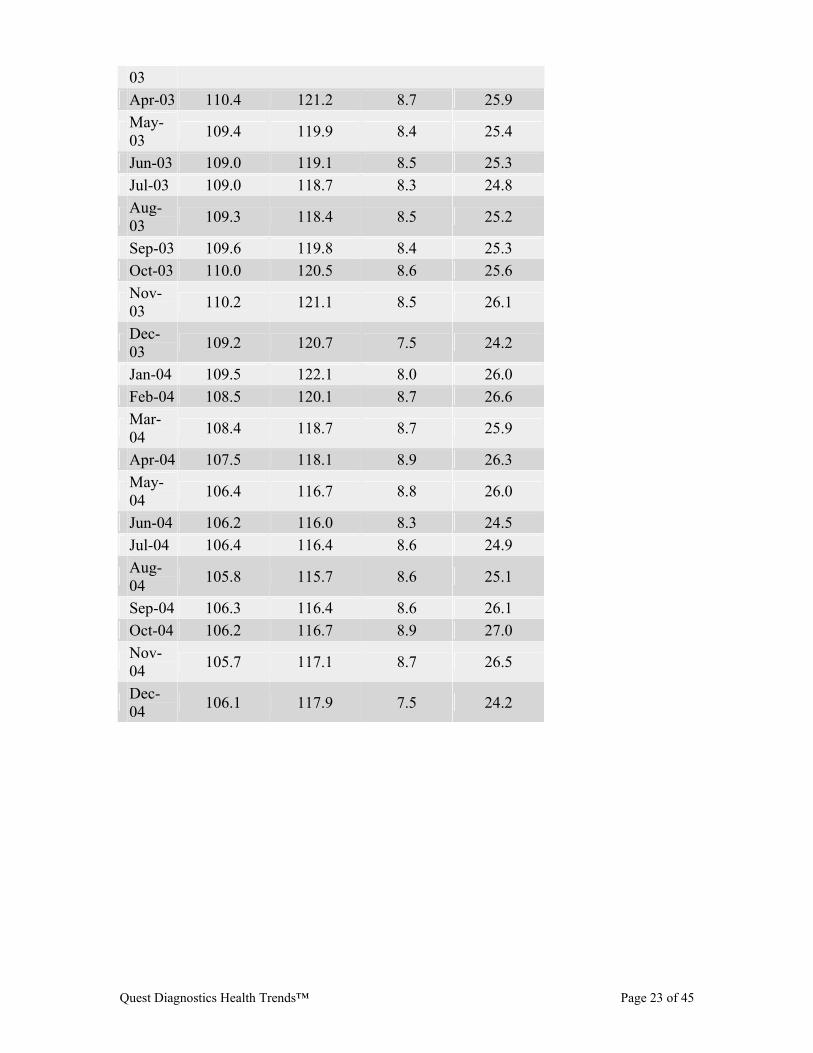
Monthly Mean LDL Cholesterol and Normalized Volume by Gender, Age 20-39
Mean (mg/dL) Normalized Volume (%) Month
Female Male Female Male Jan-01 113.6 125.1 6.8 21.8 Feb-01 111.7 122.9 7.4 23.2
Mar-01 111.7 122.7 7.8 23.9
Apr-01 111.8 122.6 8.0 23.8
May-01 111.2 121.5 7.7 23.8
Jun-01 112.7 122.6 7.8 23.5 Jul-01 115.3 124.3 7.6 22.7
Aug-01 114.9 124.1 7.8 23.2
Sep-01 114.9 124.6 7.5 22.6 Oct-01 115.2 124.9 8.1 23.8
Nov-01 116.4 127.4 7.8 23.8
Dec-01 114.9 126.5 7.2 23.3
Jan-02 114.5 125.7 7.7 24.6 Feb-02 113.3 123.9 8.3 25.5
Mar-02 113.8 124.1 8.5 25.6
Apr-02 113.2 123.5 8.9 26.1
May-02 113.0 123.1 8.6 25.4
Jun-02 112.0 121.9 8.5 25.1 Jul-02 111.6 121.2 8.4 25.2
Aug-02 110.2 119.5 8.6 25.4
Sep-02 110.3 120.5 8.3 25.0 Oct-02 110.6 121.0 8.3 25.1
Nov-02 111.5 122.9 8.3 24.7
Dec-02 111.2 123.2 7.3 23.5
Jan-03 110.9 122.9 8.0 25.4 Feb-03 110.3 121.4 8.3 25.3 Mar- 110.7 121.3 8.7 26.2
Quest Diagnostics Health Trends™ Page 23 of 45
03 Apr-03 110.4 121.2 8.7 25.9
May-03 109.4 119.9 8.4 25.4
Jun-03 109.0 119.1 8.5 25.3 Jul-03 109.0 118.7 8.3 24.8
Aug-03 109.3 118.4 8.5 25.2
Sep-03 109.6 119.8 8.4 25.3 Oct-03 110.0 120.5 8.6 25.6
Nov-03 110.2 121.1 8.5 26.1
Dec-03 109.2 120.7 7.5 24.2
Jan-04 109.5 122.1 8.0 26.0 Feb-04 108.5 120.1 8.7 26.6
Mar-04 108.4 118.7 8.7 25.9
Apr-04 107.5 118.1 8.9 26.3
May-04 106.4 116.7 8.8 26.0
Jun-04 106.2 116.0 8.3 24.5 Jul-04 106.4 116.4 8.6 24.9
Aug-04 105.8 115.7 8.6 25.1
Sep-04 106.3 116.4 8.6 26.1 Oct-04 106.2 116.7 8.9 27.0
Nov-04 105.7 117.1 8.7 26.5
Dec-04 106.1 117.9 7.5 24.2

Quest Diagnostics Health Trends™ Page 24 of 45
Monthly Mean LDL Cholesterol and Normalized Volume by Gender, Age 40-59
Mean (mg/dL) Normalized Volume (%) Month
Female Male Female Male Jan-01 126.8 128.6 17.4 28.0 Feb-01 125.1 125.8 18.7 29.6
Mar-01 124.4 125.5 19.4 30.6
Apr-01 124.7 125.5 20.1 31.3
May-01 123.9 123.8 19.2 30.6
Jun-01 125.1 124.5 19.6 30.7 Jul-01 128.1 126.2 19.4 29.9
Aug-01 127.9 126.1 19.4 30.2
Sep-01 127.5 126.3 19.2 30.2 Oct-01 127.7 127.0 20.0 31.3
Nov-01 129.3 129.4 20.2 31.7
Dec-01 127.4 128.1 19.7 31.4
Jan-02 127.0 127.6 20.3 32.1 Feb-02 125.7 125.6 21.1 32.9
Mar-02 126.0 125.4 21.5 33.1
Apr-02 125.6 125.5 22.4 34.2
May-02 125.4 124.5 21.0 33.0
Jun-02 124.4 122.9 21.5 33.1 Jul-02 124.1 122.0 21.4 32.5
Aug-02 123.1 120.7 21.5 32.7
Sep-02 123.2 121.3 21.2 32.7 Oct-02 123.3 121.9 21.4 33.0
Nov-02 124.2 123.4 21.6 33.1
Dec-02 123.6 123.8 20.5 32.0
Jan-03 123.9 123.7 21.2 32.9 Feb-03 123.1 122.0 21.7 33.2 Mar- 123.5 122.1 22.4 34.0

Quest Diagnostics Health Trends™ Page 25 of 45
03 Apr-03 123.4 122.4 22.7 34.1
May-03 122.7 120.6 21.6 33.1
Jun-03 122.0 119.5 22.1 33.4 Jul-03 122.3 119.0 21.7 32.8
Aug-03 122.4 118.9 21.8 33.1
Sep-03 122.5 119.6 21.6 33.4 Oct-03 122.6 120.4 22.3 34.3
Nov-03 122.8 121.1 22.5 34.8
Dec-03 121.5 120.7 20.9 33.0
Jan-04 122.3 121.9 22.0 34.3 Feb-04 121.2 120.4 23.1 34.9
Mar-04 120.4 119.3 22.4 34.1
Apr-04 119.8 118.1 23.2 34.9
May-04 118.0 116.0 22.4 34.3
Jun-04 118.0 114.8 21.6 33.1 Jul-04 118.5 115.5 22.0 33.4
Aug-04 118.4 115.0 21.6 32.5
Sep-04 117.8 115.0 22.5 34.8 Oct-04 117.1 114.9 23.3 35.5
Nov-04 116.9 115.2 22.7 35.1
Dec-04 116.7 115.6 20.2 31.9
Quest Diagnostics Health Trends™ Page 26 of 45
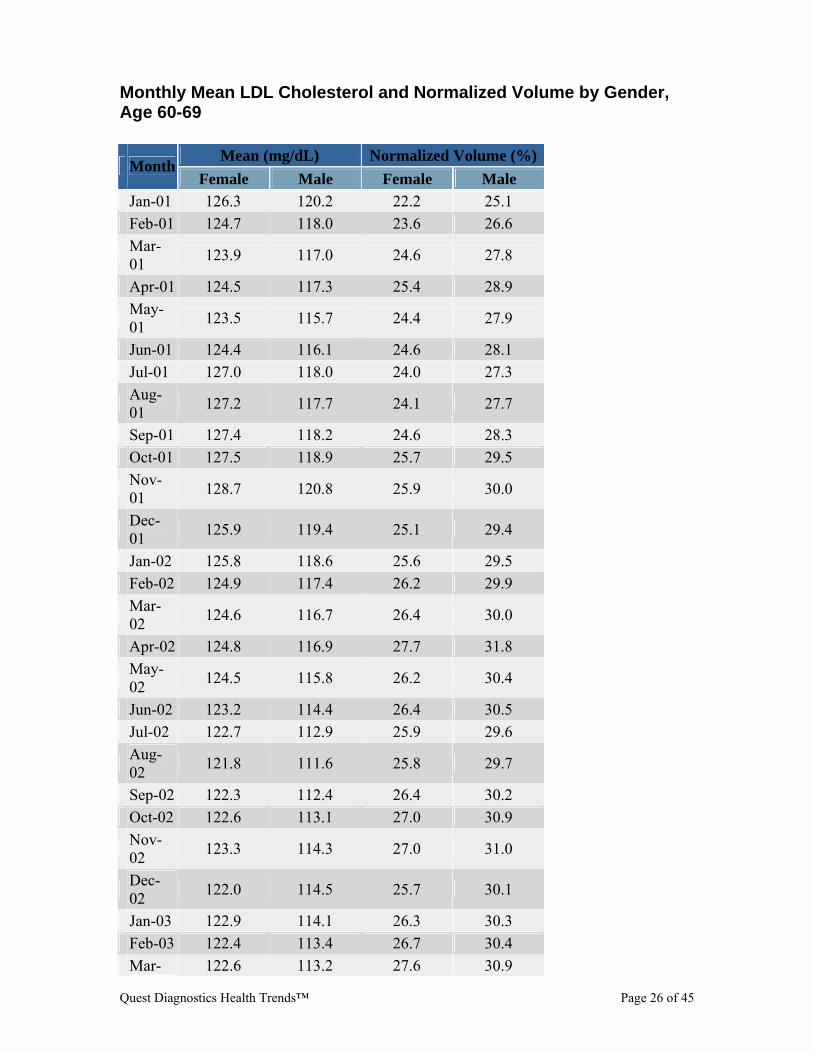
Monthly Mean LDL Cholesterol and Normalized Volume by Gender, Age 60-69
Mean (mg/dL) Normalized Volume (%) Month
Female Male Female Male Jan-01 126.3 120.2 22.2 25.1 Feb-01 124.7 118.0 23.6 26.6
Mar-01 123.9 117.0 24.6 27.8
Apr-01 124.5 117.3 25.4 28.9
May-01 123.5 115.7 24.4 27.9
Jun-01 124.4 116.1 24.6 28.1 Jul-01 127.0 118.0 24.0 27.3
Aug-01 127.2 117.7 24.1 27.7
Sep-01 127.4 118.2 24.6 28.3 Oct-01 127.5 118.9 25.7 29.5
Nov-01 128.7 120.8 25.9 30.0
Dec-01 125.9 119.4 25.1 29.4
Jan-02 125.8 118.6 25.6 29.5 Feb-02 124.9 117.4 26.2 29.9
Mar-02 124.6 116.7 26.4 30.0
Apr-02 124.8 116.9 27.7 31.8
May-02 124.5 115.8 26.2 30.4
Jun-02 123.2 114.4 26.4 30.5 Jul-02 122.7 112.9 25.9 29.6
Aug-02 121.8 111.6 25.8 29.7
Sep-02 122.3 112.4 26.4 30.2 Oct-02 122.6 113.1 27.0 30.9
Nov-02 123.3 114.3 27.0 31.0
Dec-02 122.0 114.5 25.7 30.1
Jan-03 122.9 114.1 26.3 30.3 Feb-03 122.4 113.4 26.7 30.4 Mar- 122.6 113.2 27.6 30.9

Quest Diagnostics Health Trends™ Page 27 of 45
03 Apr-03 122.8 113.5 28.0 31.6
May-03 121.9 111.6 26.9 30.6
Jun-03 121.2 110.5 27.1 31.0 Jul-03 121.1 109.7 26.6 30.4
Aug-03 121.1 109.5 26.6 30.5
Sep-03 121.4 110.1 27.2 31.2 Oct-03 121.6 110.9 28.1 32.2
Nov-03 121.7 111.7 27.9 32.1
Dec-03 119.8 111.3 26.2 31.0
Jan-04 120.4 111.8 27.6 32.2 Feb-04 120.0 110.7 28.6 32.5
Mar-04 118.9 109.4 27.9 31.6
Apr-04 118.1 108.2 28.7 33.3
May-04 116.7 106.0 27.9 32.5
Jun-04 115.5 104.9 26.9 31.4 Jul-04 116.4 105.0 27.0 31.1
Aug-04 116.2 104.9 26.6 30.6
Sep-04 115.1 104.1 28.1 32.6 Oct-04 114.6 104.5 29.1 34.0
Nov-04 114.3 104.6 28.1 32.6
Dec-04 113.4 104.8 24.9 29.6
Quest Diagnostics Health Trends™ Page 28 of 45
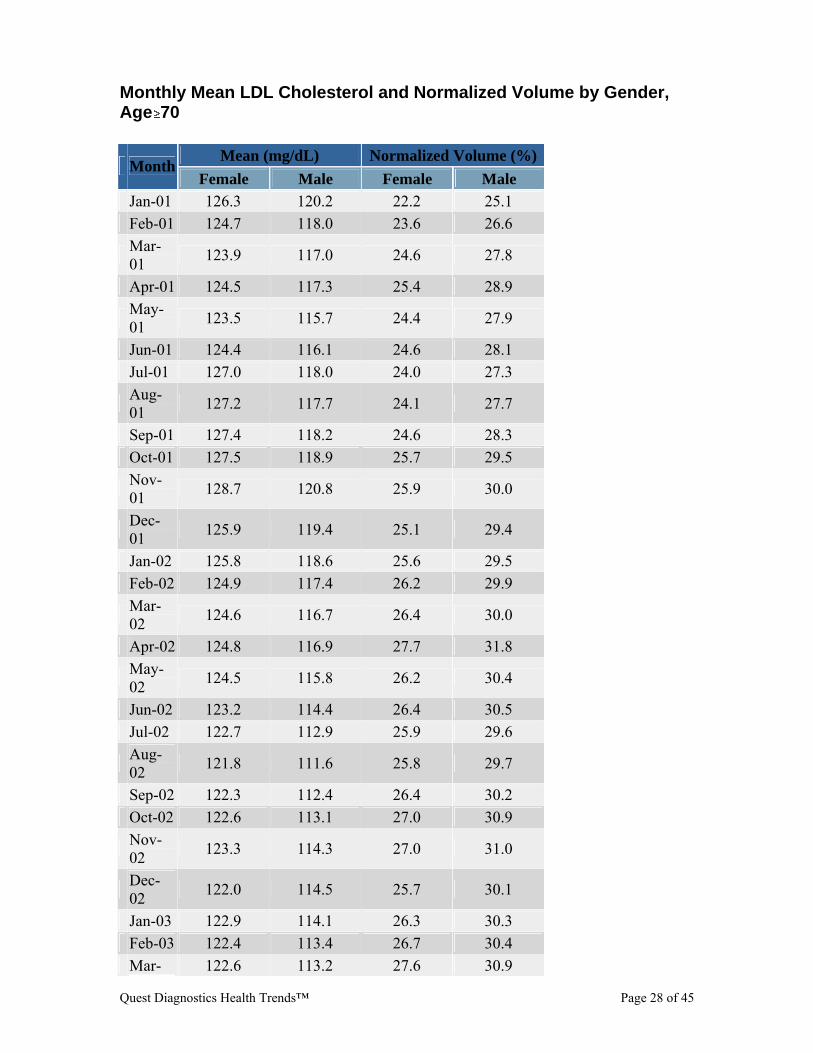
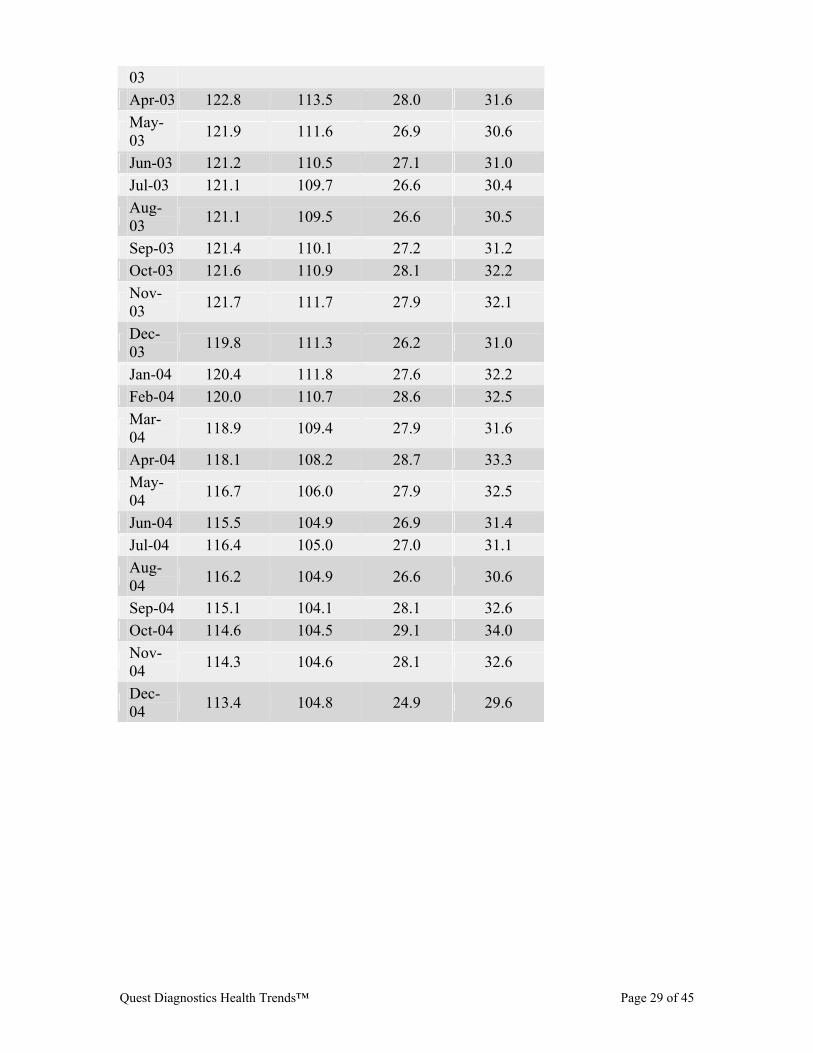
Monthly Mean LDL Cholesterol and Normalized Volume by Gender, Age 70
Mean (mg/dL) Normalized Volume (%) Month
Female Male Female Male Jan-01 126.3 120.2 22.2 25.1 Feb-01 124.7 118.0 23.6 26.6
Mar-01 123.9 117.0 24.6 27.8
Apr-01 124.5 117.3 25.4 28.9
May-01 123.5 115.7 24.4 27.9
Jun-01 124.4 116.1 24.6 28.1 Jul-01 127.0 118.0 24.0 27.3
Aug-01 127.2 117.7 24.1 27.7
Sep-01 127.4 118.2 24.6 28.3 Oct-01 127.5 118.9 25.7 29.5
Nov-01 128.7 120.8 25.9 30.0
Dec-01 125.9 119.4 25.1 29.4
Jan-02 125.8 118.6 25.6 29.5 Feb-02 124.9 117.4 26.2 29.9
Mar-02 124.6 116.7 26.4 30.0
Apr-02 124.8 116.9 27.7 31.8
May-02 124.5 115.8 26.2 30.4
Jun-02 123.2 114.4 26.4 30.5 Jul-02 122.7 112.9 25.9 29.6
Aug-02 121.8 111.6 25.8 29.7
Sep-02 122.3 112.4 26.4 30.2 Oct-02 122.6 113.1 27.0 30.9
Nov-02 123.3 114.3 27.0 31.0
Dec-02 122.0 114.5 25.7 30.1
Jan-03 122.9 114.1 26.3 30.3 Feb-03 122.4 113.4 26.7 30.4 Mar- 122.6 113.2 27.6 30.9
Quest Diagnostics Health Trends™ Page 29 of 45
03 Apr-03 122.8 113.5 28.0 31.6
May-03 121.9 111.6 26.9 30.6
Jun-03 121.2 110.5 27.1 31.0 Jul-03 121.1 109.7 26.6 30.4
Aug-03 121.1 109.5 26.6 30.5
Sep-03 121.4 110.1 27.2 31.2 Oct-03 121.6 110.9 28.1 32.2
Nov-03 121.7 111.7 27.9 32.1
Dec-03 119.8 111.3 26.2 31.0
Jan-04 120.4 111.8 27.6 32.2 Feb-04 120.0 110.7 28.6 32.5
Mar-04 118.9 109.4 27.9 31.6
Apr-04 118.1 108.2 28.7 33.3
May-04 116.7 106.0 27.9 32.5
Jun-04 115.5 104.9 26.9 31.4 Jul-04 116.4 105.0 27.0 31.1
Aug-04 116.2 104.9 26.6 30.6
Sep-04 115.1 104.1 28.1 32.6 Oct-04 114.6 104.5 29.1 34.0
Nov-04 114.3 104.6 28.1 32.6
Dec-04 113.4 104.8 24.9 29.6
Quest Diagnostics Health Trends™ Page 30 of 45
Mean LDL Cholesterol by State
Mean (mg/dL) State
2001 2004 AK 114.3 112.5 AL 116.4 113.6 AR 117.9 115.1 AZ 115.6 111.5 CA 119.1 114.0 CO 119.0 113.1 CT 117.7 111.5 DC 117.0 110.2 DE 121.0 113.9 FL 128.5 121.3 GA 125.0 117.7 IA 119.9 112.6 ID 118.2 110.5 IL 118.3 110.5 IN 120.2 112.3 KS 119.3 111.4 KY 121.2 113.1 LA 126.0 117.8 MA 121.0 112.7 MD 120.8 112.4 ME 126.5 118.1 MI 121.4 113.0 MN 120.6 112.0 MO 122.7 113.9 MS 123.3 114.5 MT 122.7 113.5 NC 122.7 113.2 ND 122.5 113.0 NE 122.5 112.8 NH 123.8 113.5 NJ 121.2 110.7 NM 124.2 113.4 NV 125.3 114.5 NY 122.1 110.9 OH 124.8 113.5 OK 127.0 115.6
Quest Diagnostics Health Trends™ Page 31 of 45
OR 126.7 115.1 PA 128.4 116.7 RI 126.1 114.1 SC 123.3 111.2 SD 126.9 114.7 TN 134.1 121.7 TX 124.7 112.0 UT 128.1 115.2 VA 126.1 113.1 VI 126.5 113.0 VT 124.7 111.1 WA 134.6 120.3 WI 127.4 111.6 WV 133.5 115.7 WY 133.3 114.1
Quest Diagnostics Health Trends™ Page 32 of 45
Percent of LDL Cholesterol 130 mg/dL by State
% 130 State
2001 2004 AK 32.0 26.6 AL 34.5 27.0 AR 41.4 27.3 AZ 34.5 27.5 CA 38.9 27.6 CO 35.9 27.6 CT 31.6 27.7 DC 37.5 27.8 DE 39.8 27.8 FL 37.6 28.0 GA 34.1 28.3 IA 36.6 28.5 ID 41.7 28.7 IL 36.0 28.7 IN 36.5 28.7 KS 30.4 28.8 KY 38.8 28.8 LA 37.1 28.8 MA 43.0 29.1 MD 37.4 29.3 ME 35.3 29.3 MI 37.9 29.5 MN 39.1 29.5 MO 37.6 29.5 MS 38.9 29.6 MT 43.0 29.6 NC 39.2 29.7 ND 37.8 29.8 NE 40.2 29.8 NH 44.1 29.9 NJ 37.3 30.0 NM 35.4 30.2 NV 42.8 30.2 NY 33.1 30.3 OH 42.4 30.4 OK 39.7 30.5
Quest Diagnostics Health Trends™ Page 33 of 45
OR 39.9 30.6 PA 42.0 30.8 RI 43.7 31.0 SC 43.9 31.3 SD 34.9 31.6 TN 40.6 31.6 TX 44.6 31.8 UT 44.1 32.6 VA 45.9 33.2 VI 41.6 33.8 VT 42.9 34.0 WA 39.9 34.7 WI 52.7 36.9 WV 40.5 37.8 WY 48.0 38.0
Quest Diagnostics Health Trends™ Page 34 of 45
Heart Health Press Release Average LDL Cholesterol Levels Decreased Approximately 10 Percent Among People Under Doctors' Care from 2001 to 2004 Quest Diagnostics launches Health Trends(R), a national source of patient health information that provides insights from the nation's largest private database of clinical test results.
Cholesterol levels decreased less in women than men.
LYNDHURST, N.J., Oct. 10 /PRNewswire-FirstCall/ -- Quest Diagnostics (NYSE: DGX), the nation's leading provider of diagnostic testing, information and services, announced today that it identified a significant and steady decline of approximately 10 percent over a four-year period in average LDL (low-density lipoprotein) cholesterol levels in blood tests ordered on behalf of patients under a physician's care in the United States. However, the decline was slower in women than in men.
The average serum LDL cholesterol level declined from 123.7 milligrams per deciliter (mg/dL) at the beginning of 2001 to 111.7 mg/dL at the end of 2004. The recommended upper limit of LDL cholesterol for people at average risk for heart disease is 130 mg/dL, according to the National Cholesterol Education Program (NCEP). Lowering LDL cholesterol, also known as "bad" cholesterol, decreases the risk of arteriosclerosis and heart attack.
The findings are contained in an LDL Cholesterol Heart Health Report released as the first in a series of Quest Diagnostics Health Trends, a new indicator of patient health based on de-identified patient testing data in the nation's largest private database of clinical test results. For the Heart Health Report, Quest Diagnostics conducted a retrospective analysis of data from nearly 80 million LDL cholesterol results reported by its laboratories across the U.S. from 2001 through 2004 for adult patients age 20 years and older.
The Heart Health Report is the first assessment of its kind to involve so many people, and it provides up-to-date information on national LDL cholesterol trends for people who visit the doctor. Other population-based cardiovascular disease studies rigorously evaluate general populations ranging from 3,000 to 60,000 well-characterized study participants and are often regional or localized in scope. Certain characteristics of the Quest Diagnostics data, such as seasonal variation and gender differences, have been well described in prior studies.
"The 10% decline we saw in average LDL cholesterol levels between 2001 and 2004 is a steeper decrease than has been reported in a published U.S. population study, and these data are very current," said Joyce G. Schwartz, M.D., Vice President and Chief
Quest Diagnostics Health Trends™ Page 35 of 45
Laboratory Officer for Quest Diagnostics. "In addition, women showed higher average LDL cholesterol levels than men, and their results declined less than the men's."
"The Quest Diagnostics study shows that cholesterol is decreasing in Americans who see their doctors and have their cholesterol measured, and this is very important for public health," said Frank M. Sacks, M.D., Professor of Cardiovascular Disease Prevention at Harvard School of Public Health. "I would expect that these patients have an improved quality of life because lower cholesterol means fewer heart attacks and other cardiovascular events."
The decline in average LDL cholesterol levels was observed across all age groups, but was most pronounced for tests performed on older patients. The decrease was greatest (approximately 13%) for people aged 70 years and older and least pronounced (approximately 7%) for the 20-to-39-year age range.
Gender Differences
The data also revealed gender differences in LDL cholesterol levels, which declined further in men than in women over the four-year period. The largest differences between men and women were observed in the older age groups. Overall, from January 2001 to December 2004, average LDL cholesterol in men fell from 124.0 mg/dL to 110.9 mg/dL. In women, average LDL cholesterol declined from 123.4 mg/dL to 112.5 mg/dL during the same time period. The rate of decline was larger in men than women, and is statistically significant.
"These data highlight a potentially important gender gap in cardiovascular disease risk among patients with access to medical care. The finding underscores the need to develop system approaches to improve the application of evidence-based guidelines and quality of care for both men and women," said Lori Mosca, M.D., M.P.H, Ph.D., Director, Preventive Cardiology, New York- Presbyterian Hospital and Associate Professor of Medicine at Columbia University.
"At a time when the world is looking to evidence-based medicine to drive better outcomes, we are proud to be able to utilize our unique clinical database to provide quantitative insights on the health of patients," said Surya N. Mohapatra, Ph.D., Chairman and Chief Executive Officer, Quest Diagnostics. "Our first Health Trends report provides a glimpse into how 'real-world medicine' is advancing the nation's heart health and well-being. This is an exciting undertaking and we are pleased to share our findings."
"The Quest Diagnostics' data are remarkably consistent with more conventional studies, such as the government's National Health and Nutrition Examination Survey (NHANES)," said Josef Coresh, M.D., Ph.D., Professor of Epidemiology, Biostatistics & Medicine at Johns Hopkins University. "The broad representation and large sample size of the Quest Diagnostics population make this report unique and gives Quest Diagnostics the ability to provide fresh data without the longer lag time necessarily associated with research studies, such as NHANES."
Quest Diagnostics Health Trends™ Page 36 of 45
Quest Diagnostics is not providing interpretation of the data, which has to be considered in the context of the extensive published research in the field. Data used in the report only include test results with the patient's age, gender, and geographic region.
"The compilation of this large amount of lipid testing data represents an ambitious effort to assemble information that is potentially related to the health of Americans over the past few years of laboratory testing by Quest Diagnostics," said Peter W. F. Wilson, M.D., Professor of Medicine at Medical University of South Carolina and the former Director of Laboratories for the Framingham Heart Study. "However, there are limitations of the data that affect interpretation." The limitations include the fact that individuals or their physicians were not identified by name; some tests have been repeated for the same person; and the data does not include defining characteristics such as a person's ethnicity, medications, or medical history.
LDL cholesterol data was derived from results of 78.3 million tests ordered by physicians on their adult, predominantly non-hospitalized patients from January 1, 2001 through December 31, 2004. LDL cholesterol results were calculated from serum measurements of total cholesterol, HDL cholesterol and triglycerides using standardized laboratory procedures. The company plans to utilize its extensive database of de-identified laboratory test results to identify health trends for other medical conditions.
About Quest Diagnostics
Quest Diagnostics is the leading provider of diagnostic testing, information and services that patients and doctors need to make better healthcare decisions. The company offers the broadest access to diagnostic testing services through its national network of laboratories and patient service centers, and provides interpretive consultation through its extensive medical and scientific staff. Quest Diagnostics is a pioneer in developing innovative new diagnostic tests and advanced information technology solutions that help improve patient care. Additional company information is available at: http://www.questdiagnostics.com.
The statements in this press release which are not historical facts or information may be forward-looking statements. These forward-looking statements involve risks and uncertainties that could cause actual results and outcomes to be materially different. Certain of these risks and uncertainties may include, but are not limited to, competitive environment, changes in government regulations, changing relationships with customers, payers, suppliers and strategic partners and other factors described in the Quest Diagnostics Incorporated 2004 Form 10-K and subsequent filings.
SOURCE Quest Diagnostics Incorporated
CONTACT: Gary Samuels - Media, +1-201-393-5700, or Laure Park - Investors, +1-201-393-5030, both of Quest Diagnostics Incorporated
Quest Diagnostics Health Trends™ Page 37 of 45
Heart Health Methodology Quest Diagnostics Health Trends™ Heart Health Report, 2005
Summary
The findings of the 2005 Quest Diagnostics Health Trends™ Heart Health Report are based on results from nearly 80 million LDL cholesterol tests performed between 2001 and 2004.
The Quest Diagnostics database of clinical laboratory test results is one of the largest private databases of its kind in the world. The Informatics Data Warehouse (IDW) is maintained in an Oracle database running under HPUX. The IDW contains information on all clinical test results reported out by Quest Diagnostics laboratories in the United States, and includes data from all 50 states and the District of Columbia. Approximately nine million result records are loaded into the IDW every night. The IDW contains information about the ordering physician, patient, tests ordered and results reported and is maintained in a HIPAA compliant manner. The data used for the Health Trends™ Heart Health Report utilizes only de-identified testing data that does not contain any patient or physician identifiable health information.
Numerous quality checks were performed on the data and methodology internally to rule out various types of bias or artifact. For example, the age and gender distribution of results from different regions were compared to confirm that the results for age and gender were similar throughout the country. Likewise, the test results from Quest Diagnostics regional laboratories were compared to rule out analytical bias among the different laboratories performing testing. Leading experts in the field of cardiovascular disease and biostatistics were also invited to evaluate our data, methods and conclusions. These experts generally found the approach and conclusions to be valid, although they did note certain limitations to the data, such as the fact that we have minimal clinical information about patients, and no information about their medications.
General Methodology
Laboratory Testing Methodology: Serum testing was performed using commercial reagent kits on multi-channel chemistry analyzers (Models AU800, AU5200 and AU5400, Olympus America Inc., Melville, NY). The methods meet the U.S. Centers for Disease Control and Prevention-National Heart, Lung and Blood Institute Lipid Standardisation Program guidelines (McNamara, Leary et al. 1997) (CDC, 2005). Cholesterol was measured spectrophotometrically at 540/600 nm using cholesterol esterase, cholesterol oxidase, peroxidase, 4-aminoantipyrine and phenol (Allain, Poon et al. 1974) (Rieschlau, P., Bernt, E. and Gruber, W.,Z Klin Chem Klin Biochem, 12: 403: 1974.) (Olympus Diagnostica GmbH, Co. Clare, Ireland). High density lipoprotein cholesterol (HDL-C) was measured using magnesium and dextran sulfate, cholesterol oxidase modified with polyethylene glycol, peroxidase, 4-amino-antipyrine and N-(2-
Quest Diagnostics Health Trends™ Page 38 of 45
hydroxy-3-sulfopropyl)-3,5-dimethoxyaniline (Sugiuchi, Uji et al. 1995) (Roche Diagnostics, Indianapolis, IN). Low density lipoprotein cholesterol (LDL-C) was estimated from total and HDL cholesterol using the Friedewald equation (Friedewald, Levy et al. 1972). Triglycerides was measured using microbial lipases, glycerol kinase, glycerol-3-phosphate, glycerol phosphate oxidase, p-chlorophenol, 4-aminoantipyrine and peroxidase (Bucolo and David 1973) (Olympus Diagnostica GmbH, Co. Clare, Ireland).
Data Analysis: Data was retrieved from the Informatics Data Warehouse by means of SQL queries and older data was retrieved from archive tapes via Java. The data sets were combined, aggregated by month and analyzed using a combination of SAS/STAT and UNIX tools. Charts and graphs were produced by importing aggregated data into Microsoft Excel.
Validation Methodology
The goal of validation was to examine and rule out possible sources of artifact or error due to either testing methodology changes or our analytic processes that could account for the observed drop in mean LDL value. A series of comparisons and analyses were conducted and in all cases supported the hypothesis that the observed change is a legitimate finding. The analyses performed are described below.
Data variations: Data from different business units were compared to examine the possible impact of location-specific practices or population variance. Results were compared for mean, median and percentage of values greater than selected thresholds, including 70, 100, 130 and 150 mg/dL. Finally, results for calculated LDL-C were compared with total cholesterol, HDL cholesterol and triglycerides. Results of all these comparisons were consistent with our findings.
Methodology variations: Methodology changes were identified during the time period covered by our data, which primarily consisted of a transition from the Olympus AU5200 to the Olympus AU5400. QC data from these two platforms were obtained and evaluated and gave no indication that the observed decline in mean LDL-C could be attributed to this platform change.
External variations: Data for lipid-lowering prescription volume were obtained that showed an increase in prescription volume during the same time period as our observed decrease in mean LDL-C. Data was also examined for a patient sub-group considered unlikely to have received statins (females, 20-35 yrs. old), and the decreasing trend was also observed in this group.
Repeat Patient Effects: Due the nature of the data, as well as the fact that analyses were performed in an aggregated, HIPAA compliant manner without any access to individual patient identifiers, no attempt was made to match patients in order to eliminate, analyze, or adjust for the effects of repeat testing on individual patients.
Test Volume Normalization: One of the interesting aspects of the breakdowns by age and gender are the differences in testing volume between men and women at different ages. However, underlying changes in our overall volume, e.g. as a result of acquisitions or consolidations, may have a significant impact on the volume of any individual test

Quest Diagnostics Health Trends™ Page 39 of 45
over time. This means that observed changes in volume for an individual test over time might not represent true changes in the frequency with which the test is ordered by physicians. In order to adjust for this potential source of artifact, we have chosen to normalize LDL testing volume to overall requisition volume and display volume in the form of “percent of requisitions containing an LDL cholesterol result”.
Quest Diagnostics Health Trends™ Page 40 of 45
Heart Health Frequently Asked Questions (FAQs) About Quest Diagnostics Health Trends™ What is Health Trends™? Quest Diagnostics Health Trends™ is a new source of patient health information based on patient testing data in the nation’s largest database of clinical results Only de-identified data is used in the analysis, meaning that all identifying information, such as the patient’s name and address, insurance identifiers, and the physician’s name, is removed.
Why has Quest Diagnostics launched Health Trends™? We have a wealth of important data about the health status of people who visit the doctor because of the clinical laboratory testing we perform. In particular, we feel that our data provides a window into how “real-world medicine” is advancing the nation’s health and well-being.
What is Quest Diagnostics’ objective for Health Trends™? Our goal for Health Trends™ is to identify and track health trends and make them available as a public service to help educate patients, health professionals, and policy-makers about the current status of the nation’s health, and to help them make decisions using our data. We are launching the first edition of Health Trends™ on LDL cholesterol, but hope to utilize our extensive database of de-identified laboratory test results to study trends in other diseases and medical conditions.
About the Health Trends™ Heart Health Report What is the Health Trends™ Heart Health Report? The Quest Diagnostics Health Trends™ Heart Health Report was created to identify LDL cholesterol trends among people who visit the doctor in the United States.
Why look at LDL cholesterol instead of total cholesterol, which is what other studies often track? LDL cholesterol is used to classify and manage patients with elevated lipids. LDL cholesterol is the primary lipid used to assess cardiovascular disease in the guidelines developed by the National Cholesterol Education Program (NCEP), Adult Treatment Panel III (ATP III) and has been widely adopted across the U.S.
Why are you doing this? Our objective is to identify and track health trends and make them available as a public service. We don’t expect this information to contribute to changes in doctors’ test-ordering patterns.
Quest Diagnostics Health Trends™ Page 41 of 45
How often will you update this data? We anticipate updating the Heart Health Report periodically based on the acceptance of the validity of our approach and the usefulness of the information. The response we receive from consumers, physicians and other public health professionals will guide us in determining the appropriate frequency.
What disease(s) or medical condition(s) is (are) next? Our focus has been on launching the Heart Health Report, so no decision has been made yet regarding the next Health Trends™ report topic.
What is unique about the Quest Diagnostics Health Trends™ Heart Health Report? The Quest Diagnostics Health Trends™ Heart Health Report is unique and different from traditional studies in many ways. Some of these differences are described below.
Scale:
• Our database includes a very large number of tests from more than 140 million patient interactions annually. The Health Trends™ Heart Health Report on LDL cholesterol includes approximately 20 million results per year, totaling nearly 80 million results over four years.
• Population-based studies typically include 5,000 to 60,000 study participants.
Coverage:
• Our test results are from patients across the nation. Men and women age 20 and above are included.
• Population-based studies are typically from limited geographic regions and may be limited by age range and gender.
Data Content:
• In the Quest Diagnostics database, patients are included based on their seeking medical care and their physicians ordering laboratory tests. Each result from each patient encounter is considered, regardless of the number of times each patient is tested. Further, Quest Diagnostics does not have access to information about the medical conditions and medications taken by patients in the database.
• Most heart health studies, on the other hand, have a standard study design in which individual patients are tracked over time and participants are well characterized.
Who evaluated the Health Trends™ Heart Health Report? Quest Diagnostics performed numerous quality checks on the data and our methodology to rule out bias from testing method, population selection or geographical considerations. The data analysis was performed at Quest Diagnostics by a team of physicians and statisticians. We received input on the data, methodology and findings from recognized academic authorities in cardiovascular health and epidemiology, including Josef Coresh, M.D., Ph.D., Professor of Epidemiology, Biostatistics & Medicine, Johns Hopkins University; Lori Mosca, M.D., M.P.H, Ph.D., Director, Preventive Cardiology, New York-Presbyterian Hospital, and Associate Professor of Medicine Columbia University; Frank Sacks, M.D., Professor of Cardiovascular Disease Prevention, Harvard School of
Quest Diagnostics Health Trends™ Page 42 of 45
Public Health; and Peter Wilson, M.D., Professor of Medicine, Medical University of South Carolina.
How many test results are from the same patients? Health Trends™ Heart Health Report data does not track individual patients. The results represent population-based trends rather than individual patient trends
What are the limitations of the Health Trends™ Heart Health Report data? The data does not track individual patients, as all the tests are de-identified before being evaluated as part of the Health Trends™ Heart Health Report. The report does not provide information about the health history of patients or treatment that may have been prescribed by a doctor. The report looks solely at people who visited a doctor.
Does this report compromise patient confidentiality? No. The test results evaluated show the patient’s age, gender, and geographic region. They do not identify individuals or their physicians by name, or provide defining characteristics such as a person’s ethnicity, medications, cardiac or general medical history.
About the Findings of the Health Trends™ Heart Health Report What are the findings of the Health Trends™ Heart Health Report? The Health Trends™ Heart Health Report shows a steady decline totaling over 10% in average LDL cholesterol results over a four-year period from 2001-2004 among tests from adults who saw a physician during that time period. In addition, Health Trends™ demonstrates a larger decrease in LDL cholesterol in tests from men than those from women.
Is the 10% decline over four years significant? Three of the experts who reviewed our findings considered the 10% decline significant. (See “What the Experts Say about Health Trends™”) One way to demonstrate this significance is to focus in on the number of results that exceed a particular threshold, such as 130 mg/dL. In January 2001, 40% of results exceeded this limit. Four years later in December 2004, only 30% of results exceeded this limit. We believe this reflects significant progress toward the goals set out in the U.S. Department of Health & Human Services’ Healthy People 2010 initiative. For more information, visit www.HealthyPeople.gov. Whether or not its findings are deemed “significant,” or demonstrate progress toward goals, Quest Diagnostics Health Trends™ will report its data and insights as a public service.
To what can we attribute this trend towards lower cholesterol in Americans? Some of the experts who reviewed our findings suggest that a number of factors contribute to lower cholesterol, such as eating a low-fat, low-cholesterol diet; exercising regularly; and taking lipid-lowering prescription drugs.
Why is there such a difference in how men’s and women’s LDL cholesterol levels change over the years? The Health Trends™ Heart Health Report clearly showed a disparity in LDL cholesterol
Quest Diagnostics Health Trends™ Page 43 of 45
decreases between men and women. The experts who reviewed our work spoke about the concept of a “treatment gap” between men and women for heart disease, which has been widely discussed in the medical literature, and our results may suggest that the problem is continuing.
Is the observed gap between men and women statistically significant? Yes. Because the difference is based on millions of data points, an average change of this magnitude is statistically significant. Cardiovascular disease mortality is declining in men and increasing in women. According to CDC/NCHS and American Heart Association data from 1980 through 1999, the annual number of deaths due to cardiovascular disease fell in men from 510,000 to 440,000 and rose in women from 490,000 to 510,000 (numbers rounded). Deaths of men fell by about 70,000 annually while deaths of women rose by about 20,000 annually. Mortality is the ultimate outcome of multiple factors including differences in medical diagnosis and treatment for cardiovascular disease. According to experts in the field of cardiovascular disease and public health, an important cause is differences in treatment of men versus women.
Why is average LDL cholesterol so variable month-by-month? Our data reflect patterns of seasonal variation that correspond to trends that have been well described in the medical literature. An interesting finding of the Heart Health Report is that seasonal variability appears to be much more pronounced in men than women, with LDL cholesterol levels falling in summer months and rising in winter.
About Heart Disease What is cholesterol? Cholesterol is a soft, waxy substance found among the lipids (fats) in the bloodstream and in all the body’s cells. It is transported in the blood by a number of special carriers such as low-density lipoprotein (LDL) and high-density lipoprotein (HDL). LDL is the major cholesterol carrier in the blood, while HDL carries about one-third to one-fourth of blood cholesterol.
What is “bad cholesterol”? LDL is known as the “bad” cholesterol carrier as it is the main cause of harmful plaque deposits that can clog arteries and increase risk of heart disease. High levels of LDL cholesterol increase the risk of heart disease significantly. Heart disease often does not display symptoms during the early stages, so reducing your individual risk is critical. Everyone age 20 and older should have their blood cholesterol measured at least once every five years to track LDL and HDL cholesterol numbers.

Quest Diagnostics Health Trends™ Page 44 of 45
Heart Health Expert Commentary What Experts Are Saying About Health Trends™
About the principal findings of the Quest Diagnostics Health Trends™ Heart Health Report:
“The takeaway is that cholesterol levels in this country are still high, but are improving. We are seeing a downward trend in cholesterol because of changes in dietary fat and because of treatment. But, we still have a long way to go.”
Josef Coresh, M.D., Ph.D. Professor of Epidemiology, Biostatistics & Medicine Johns Hopkins University
“The implication of the data is that in office practice, doctors aren’t giving women the same treatment and screening for cardiovascular disease as men. Campaigns such as the [National Heart, Blood and Lung Institute’s] “red dress” heart disease awareness campaign for women are still very much needed.”
Frank Sacks, M.D. Professor of Cardiovascular Disease Prevention Harvard School of Public Health
About the uniqueness of Quest Diagnostics Health Trends™ compared with other heart health studies:
“The compilation of this large amount of lipid testing data represents an ambitious effort to assemble information that is potentially related to the health of Americans over the past few years of laboratory testing by Quest Diagnostics…. However, there are limitations of the data that affect interpretation.”
Peter Wilson, M.D. Professor of Medicine Medical University of South Carolina
“The Quest Diagnostics data are unique in the large, national scope, and the timeliness of having up-to-date information. The data reflects what is happening in the general population. In addition, the Quest Diagnostics data complements existing studies by providing more data, more timely data and national data. This information is remarkably consistent with more conventional studies, such as the National Health and Nutrition Examination Survey (NHANES), but reflects orders by physicians rather than research design.”

Quest Diagnostics Health Trends™ Page 45 of 45
Josef Coresh, M.D., Ph.D. Professor of Epidemiology, Biostatistics & Medicine Johns Hopkins University
About what Quest Diagnostics Health Trends™ indicates about gender differences in LDL cholesterol levels:
“These data highlight a potentially important gender gap in cardiovascular disease risk among patients with access to medical care. The finding underscores the need to develop system approaches to improve the application of evidence-based guidelines and quality of care for both men and women.”
Lori Mosca, M.D., M.P.H., Ph.D. Director, Preventive Cardiology New York-Presbyterian Hospital Associate Professor of Medicine Columbia University
“The concept of a treatment intensity gap between men and women for heart disease has been described and discussed for 15 years. Some studies show improvement in screening and diagnosis of cardiovascular disease in women, that the gap has narrowed or disappeared. The Quest Diagnostics database, which is based on office practice, shows that there could still be a treatment gap.”
Frank Sacks, M.D. Professor of Cardiovascular Disease Prevention Harvard School of Public Health