Embed Size (px)
Citation preview

Healthy Eating Promotion in Hong Kong – How far we’ve come & what’s next
Dr Anne FUNG
Assistant Director (Health Promotion)
Department of Health
Hong Kong Special Administrative Region
1

Outline
Overview of healthy lifestyle promotion in Hong Kong
Healthy eating promotion in schools
2

Overview of healthy lifestyle promotion in Hong Kong
3

Intervene at Upstream
DiseasesAddressing Behavioural Risk Factors
Diabetes mellitus
Heart diseaseStroke
Cancer
40%
80%
4
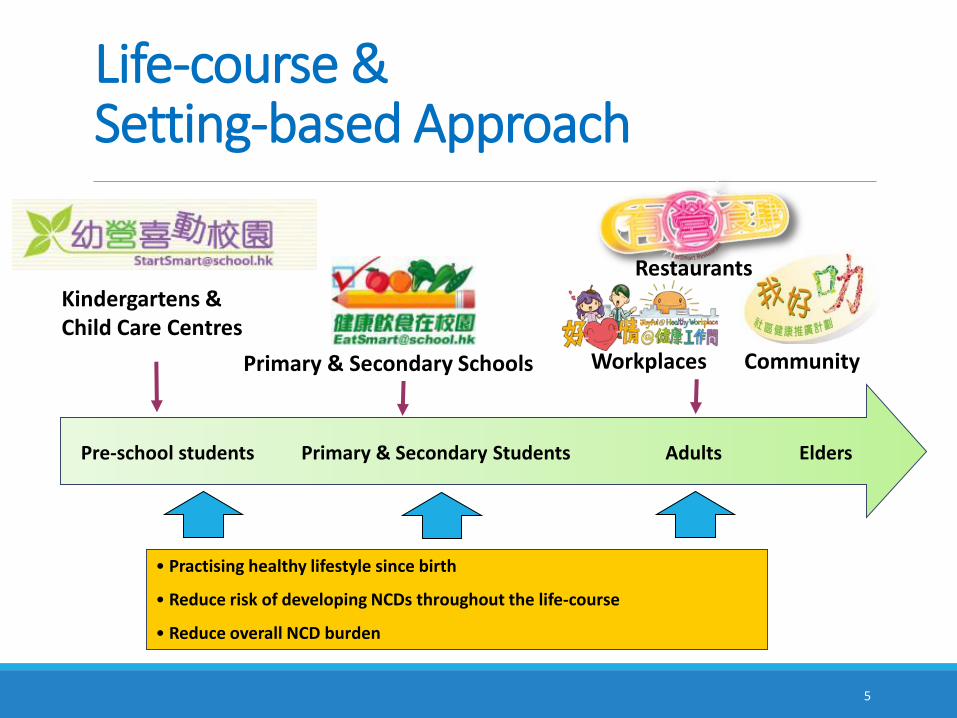
Life-course & Setting-based Approach
Pre-school students Primary & Secondary Students Adults Elders
• Practising healthy lifestyle since birth
• Reduce risk of developing NCDs throughout the life-course
• Reduce overall NCD burden
Kindergartens & Child Care Centres
Primary & Secondary Schools Workplaces
Restaurants
Community
5

Healthy eating promotion in schools
6

Healthy Eating Promotion in Schools
[email protected] (ESS) Campaign
[email protected](SSS) Campaign
7

1997/98 1998/99 1999/00 2000/01 2001/02 2002/03 2003/04 2004/05 2005/06
Overall 16.4% 17.6% 17.7% 17.9% 17.6% 18.6% 18.7% 18.7% 19.4%
Boys 19.4% 20.8% 21.0% 21.2% 20.9% 22.2% 22.4% 22.80% 23.80%
Girls 13.3% 14.2% 14.2% 14.4% 14.1% 14.8% 14.9% 14.50% 14.70%
0%
5%
10%
15%
20%
25%
Ob
esit
y R
ate
Primary Student Overweight/Obesity Rate
16.4%
19.4%
8

2005-06 Policy Agenda
Promote healthy eating habit among school children to protect the public from life-style diseases
9

ESS Campaign
• Launched in 2006-07 school year• Joint venture of Department of Health (DH) and
Education Bureau (EDB)
10

Comprehensive Strategies
Alliance Building
Supportive Environment
Research & Evaluation
Education & Empowerment
Publicity & Advocacy
11

Steering Committee
• Government Bodies◦ DH, EDB, Food & Environmental Hygiene Department
• Professional Associations◦ HK Association for the Study of Obesity
◦ HK College of Cardiology
◦ Hong Kong Dietitians Association
◦ Hong Kong Nutrition Association
• Education sector◦ Associations of principals of primary & special schools
◦ Hong Kong Education City
◦ Chinese University of Hong Kong
• Committee on Home-School Cooperation
12

Supportive Environment
Nutritional Guidelines on Lunch for Students
13

Guidelines on Quantity
HEALTHY LUNCH
Ratio of grains, vegetables & meat (& its alternatives) is
3:2:1 by volume
Food groups
Recommended quantity
P1 to P3 students P4 to P6 students
Grains At least 4 servings At least 5 servings
Vegetables At least 1 serving At least 1 serving
Meat, fish, egg and alternatives
1 – 2 servings 1 ½ – 2 ½ servings
Fruits At least 1 serving At least 1 serving
Fat and oils * 2 servings maximum 2 servings maximum
* Used during food preparation and cooking process
Recommendations on lunch provision for primary school students
14

Guidelines on Quality
• 3 Low 1 High
◦ Low fat, low sugar, low salt and High fibre
• Classification of food items
◦ Strongly discouraged food items
◦ Limited food items
◦ Encouraged food items
15

Supply: not to be provided
Strongly Discouraged Food Items
Food Items Examples
Deep-fried food items French fries, deep-fried pork chops, spring roll
Food items with added animal fat & plant sources of saturated fat
Food items with butter, cream, palm oil, coconut oil
Food items containing trans fatBakery products (e.g. pastry, crackers) in which trans fat & shortening are used
Beverages in “Snack to Choose Less” category
Soft drinks, fruit drinks, fruit juices with added sugar
Food items with very high salt content Salted fish, salted egg
16

Supportive Environment
Nutritional Guidelines on Snacks for Students
• Snack Classification
• Snack amount:◦ ≦125 kcal of energy per package
◦ Drinks ≦250 ml
• Snack time:◦ at least 1.5 – 2 hours between meals
17

Putting Guidelines into Practice
Guidelines
• Training
• Tools
Compliance
• Incentives
Award Scheme
• Monitoring
18

Training
Nutrition training workshops for school staff
Nutrition training workshops for lunch suppliers
19

Tools
Handbook of Selection of Lunch Suppliers
To facilitate the selection of lunch suppliers in a fair, just & open environment & provision of healthy, nutritive & environmental friendly lunch at the same time
20

ToolsSchool lunch suppliers database• Production mode
◦ cook-service system
◦ cook-chill system
◦ school on-site portioning
• Dietetic advice◦ in-house dietitian
◦ consultation service
◦ analysis software
• Staff training◦ nutrition training
• Special needs◦ food allergy
◦ ethnic minority
• Food quality and quantity◦ different serving size
◦ 3:2:1 ratio
◦ whole wheat / grains with added vegetables
◦ provide vegetable
◦ provide fruit
◦ no dessert & confectionery
◦ no strongly discouraged food items
◦ limited food items
• Participation in Salt Reduction Scheme for School Lunches
21

• Snack Analysis◦ Classify snacks based on its nutritional quality
in accordance with “Nutritional Guidelines on Snacks for Students”
◦ Recommend consumption quantity
◦ Allow sharing on social media
• Snack Database◦ Include information of >200 healthier snacks
◦ Allow users to save their own snack information
◦ Allow nutritional comparison between different snacks
ToolsMobile Application
22

ToolsDatabase of Prepackaged Snacks
• Facilitate the public in making healthy snack choices
• Update annually
23
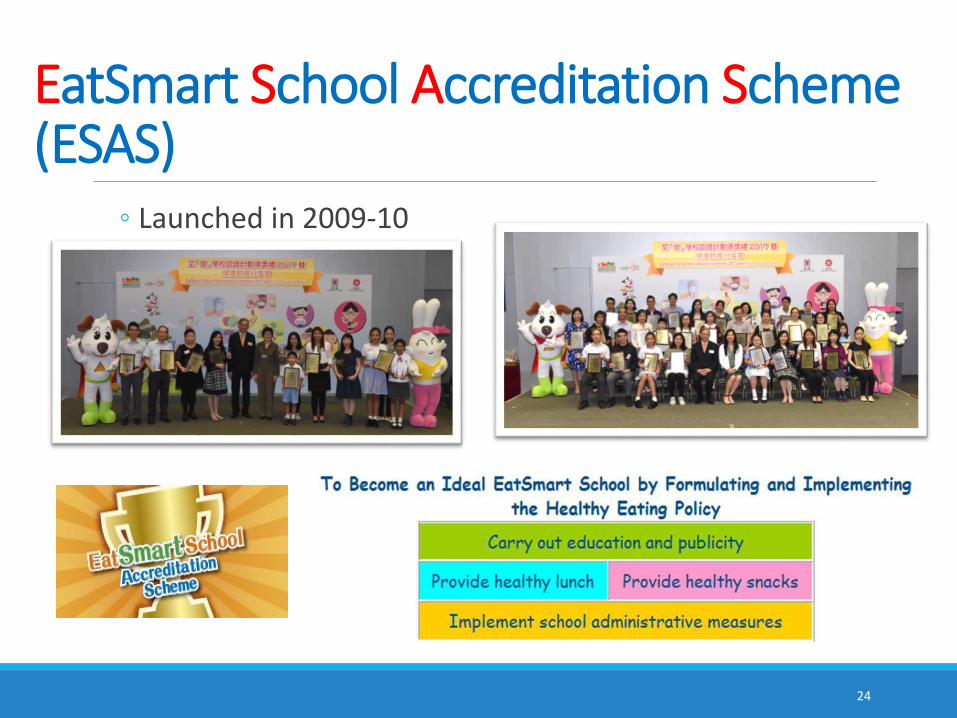
EatSmart School Accreditation Scheme (ESAS)
◦ Launched in 2009-10
24

Two Levels of Accreditation
• School Policy
• Restriction on sales of unhealthy food items (both lunch & snacks)
• Education & promotion
Basic Accreditation
• Full compliance:
• Nutritional Guidelines on Lunch for Students
• Nutritional Guidelines on Snacks for Students
Eatsmart School
Accreditation
25

Accreditation Process
Provide Continuous Support• Meeting / school visit• Training• Information sharing
Ready for accreditation?
Conduct an assessment using checklist
Accreditation School visit• Observation (e.g. lunch boxes, tuck shop, vending
machine, drinking water supply facilities)• Meeting with stakeholders
Understand their barriers Provide support to facilitate changes
Documents Ready?
NO
YES
Grant the accreditation
Fulfill requirements
Do not fulfill requirements
26

EatSmart School Accreditation Ceremony
27

Healthy eating promotion in schoolsHOW FAR WE’VE COME & WHAT’S NEXT
28
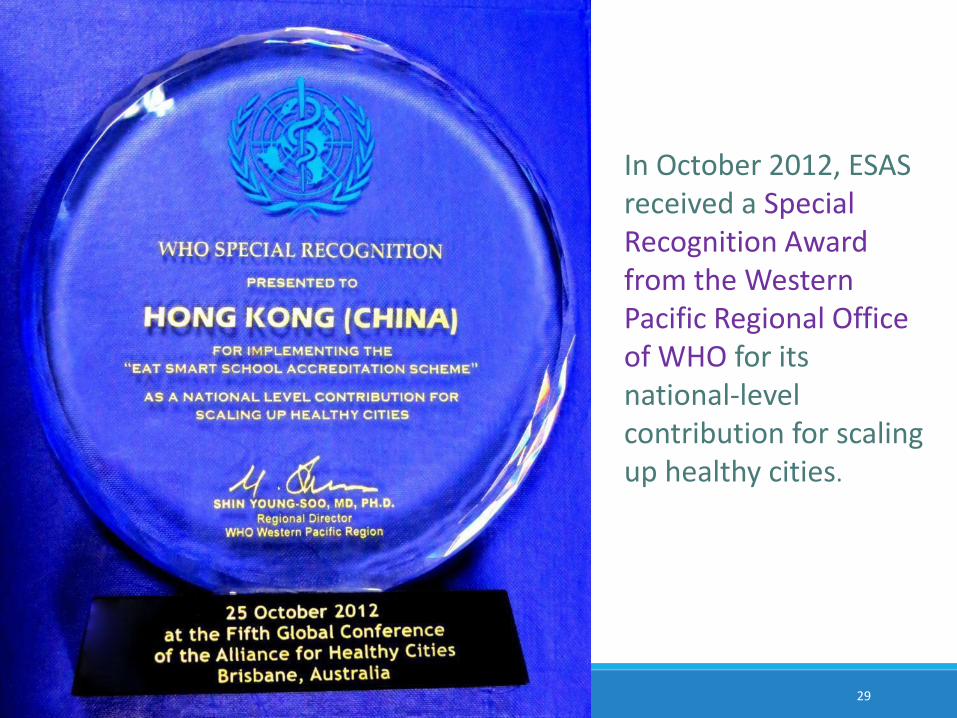
In October 2012, ESAS received a Special Recognition Award from the Western Pacific Regional Office of WHO for its national-level contribution for scaling up healthy cities.
29

ESAS - Participation Statistics
2009/10 2010/11 2011/12 2012/13 2013/14 2014/15 2015/16 2016/17 2017/18
Enrolled School 155 146 135 130 124 129 128 130 139
Basic Accredication 10 20 27 22 29 18 24 24 25
EatSmart School 6 19 40 64 74 90 90 99 100
0
50
100
150
200
No
. of
Sch
oo
ls
Total 171 185 202 216 227 237 242 253 264
30

Primary Student Overweight/Obesity Rate
16.1% 15.9% 16.4%17.6% 17.7% 17.9% 17.6%
18.6% 18.7% 18.7% 19.4%20.2%
21.3%22.2% 22.2%
21.4% 20.9% 20.8%20.0%
18.7%18.0% 17.6%
0%
5%
10%
15%
20%
25%
30%
Overall Boys Girls
31

Nutrient Testing of School Lunches in Primary Schools in Hong Kong 2013: Sodium
• >90% of lunch samples exceed recommend intake (500mg) per lunch box (mean 950mg/lunch box)
• 40 samples (42%) exceeded the recommended daily intake of sodium
• Top 3 lunches with highest sodium content:
(3) Fried noodles with mushrooms &
Beijing-style dumplings (1632mg)
(2) Rice noodles with Japanese-
style sesame chicken (1632mg)
(1) Indonesian fried rice & chicken
nuggets (1722mg)
32

Working Group on Promoting Healthy School Lunch
• Established in 2015
• Terms of reference: to identify areas for improvement in the nutrient content of primary school lunch & to formulate work plans
• Members:
Lunch suppliers
Education Sector • Committee of Home-School Co-
operation• HK Aided Primary School Heads
Association• Subsidized Primary School
Council• Union of Government Primary
School Headmasters and Headmistresses
Professional organisations
• HK Dietitians Association
• HK Nutrition Association
• Chinese Culinary Institute
Government Departments
• Department of Health
• Centre for Food Safety
33

Long Term Target of Sodium Reduction in School Lunches in Hong Kong
2027
Baseline
950mg
Target 1
≤ 905mg
Final target
≤ 500mg -47.3%
2013 2018
A phrased sodium reduction approach to reduce the sodium content in school lunches
Help students’ palates gradually adapt to change in taste & increase their acceptance of less sodium in foods
34

Pilot Project on Sodium Reductionin School Lunch Boxes
• Aim: To examine the feasibility to reduce sodium content gradually in school lunches
• Period: Conducted between September & December 2016
• Result: Feasible
35

Salt Reduction Scheme for School Lunches
Aim: Gradually lower the sodium level of school lunches by 5-10% each year
Commencement: 2017/18 school year
36
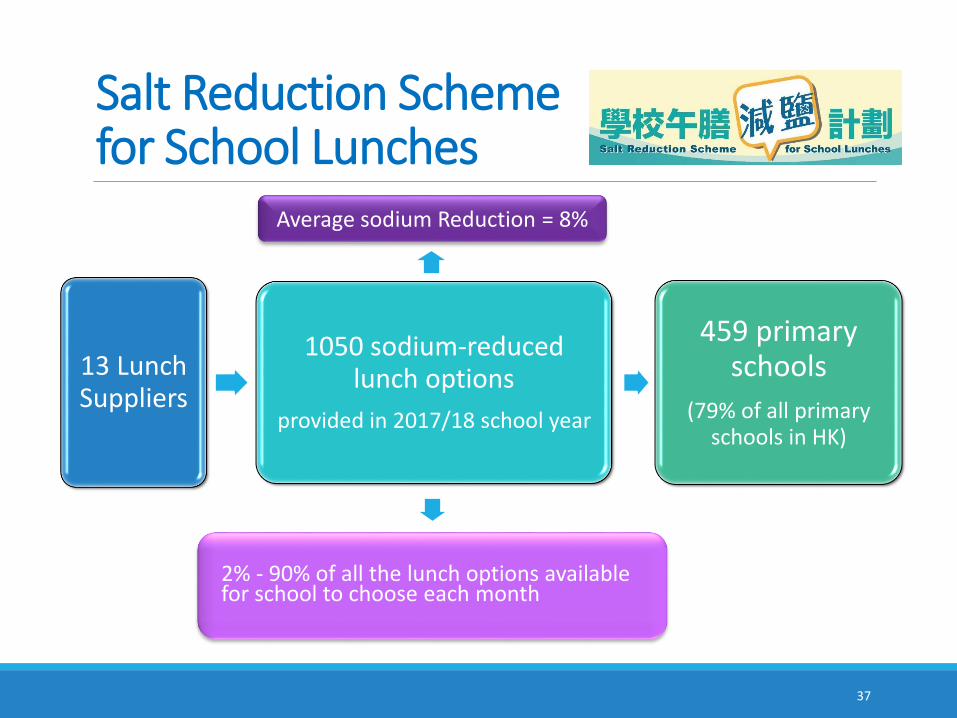
Salt Reduction Scheme for School Lunches
13 Lunch Suppliers
1050 sodium-reduced lunch options
provided in 2017/18 school year
459 primary schools
(79% of all primary schools in HK)
Average sodium Reduction = 8%
2% - 90% of all the lunch options available for school to choose each month
37

Evaluation(in early 2018)
Laboratory testing
Energy and nutrients including:
- Protein
- Carbohydrates
- Sugars
- Dietary fibre
- Total fat
- Saturated fatty acids
- Trans fat
- Cholesterol
- Sodium
Results:
- Reach target?
- Compare with similar study in 2013
38

Healthy Eating Promotion in Schools
[email protected] (ESS) Campaign
[email protected] (SSS) Campaign
39

Formulate healthy policies
Create healthy school
environments
Design health-related teaching
activities
Promote home-school
cooperation
SSS Campaign
• Launched in 2012
• Joint venture of DH, EDB, Leisure & Cultural Services Department
• Target: children aged 2 to 6
• Setting: kindergartens & child care centres (Pre-primary Institutions, PPIs)
40

Task Force• Government Bodies
◦ DH, EDB, Leisure & Cultural Services Department
• Professional Associations◦ HK Association for the Study of Obesity
◦ Hong Kong Nutrition Association
• Education sector◦ Chinese University of Hong Kong, Education University of Hong Kong
• School associations◦ Committee on Home-School Cooperation, Hong Kong Kindergarten Association,
Non-profit-making Kindergarten Council of Hong Kong
• School sponsoring bodies◦ Caritas-Hong Kong, Catholic Diocese of Hong Kong, Hong Kong Christian Service,
Hong Kong Sheng Kung Hui, Po Leung Kuk, the Salvation Army, Tung Wah Group of Hospitals, Yan Chai Hospital, Yan Oi Tong
41

• Objectives◦ To create conducive environments to healthy eating & physical activity in the
school & at home
◦ To help preschool children cultivate a sustainable healthy lifestyle
• Two main themes: Healthy Eating & Physical Activity
School YearTheme on
Healthy EatingTheme on
Physical Activity
2016/17 Eat more vegetables Less screen time
2017/18 Healthy drinksAdequate amount of
physical activity
2018/19Eating only one healthy snack
in between mealsMore parent-childphysical activities
SSS Campaign
42

Stakeholders:PrincipalsTeachers
Food preparersParents & carers
Health literacy Empowerment
Create conducive
environments to healthy eating & physical activity
SSS Campaign
43

Principals, Teachers & Food Preparers
1. GUIDELINES & NEWSLETTER 2. TRAINING WORKSHOPS
44

Principals, Teachers & Food Preparers
3. TEACHING KITS
45

Principals, Teachers & Food Preparers4. TOOLS
Recipe Sharing Platform
Menus & recipes
46

Parents & Carers1. GUIDELINES & LETTERS
TO PARENTS2. TEACHING KITS
47

Parents & Carers
3. TOOLSLogbook and souvenirs to encourage parent-child activities
48

Healthy eating promotion in schoolsHOW FAR WE’VE COME & WHAT’S NEXT
49

Participation Statistics
As of 31 March 2018◦ Over 900 schools ever participated since 2012
◦ Over 610 (~60%) schools participating in 2017/18 school year
50

Dietary & Physical Activity Survey among Preschool Children
Dietary and Physical
Activity Survey
2013/14
school year
2016/17
school year
51

Area for Improvement:Drink Provision
• Unhealthy drinks were provided in schools
Full-cream or sweetened
dairy products
53%
Instant drinks51%
49% added full-cream or sweeteneddairy products
24% added sugars
52

What’s Next?
Healthy Drinks at School Charter
Status Quo?
Accreditation Scheme
similar as in primary schools?
Healthy Drinks at School Charter1. Encourage young
children to drink water
2. Make healthy drinks available to young children
3. Not to provide drinks with added sugar or drinks with a relatively high sugar content
53
Conclusion
54

55

![Eating Healthy when Eating Out.ppt [Read-Only]health.mo.gov/living/wellness/worksitewellness/pdf/HealthyEatingWh… · K.I.I .. I o_o -- --.. Eating Healthy . When Eating Out . Healthy](https://img.pdfslide.us/doc/110x75/5f37e8bc754f1548a7534ea4/eating-healthy-when-eating-outppt-read-only-kii-i-oo-eating-healthy.jpg)