Embed Size (px)
Citation preview
Statistician: Craig Thomas ~ 0300 025 1646 ~ [email protected]
Enquiries from the press: 0300 025 8099 Public enquiries : 0300 025 5050 Twitter: @statisticswales
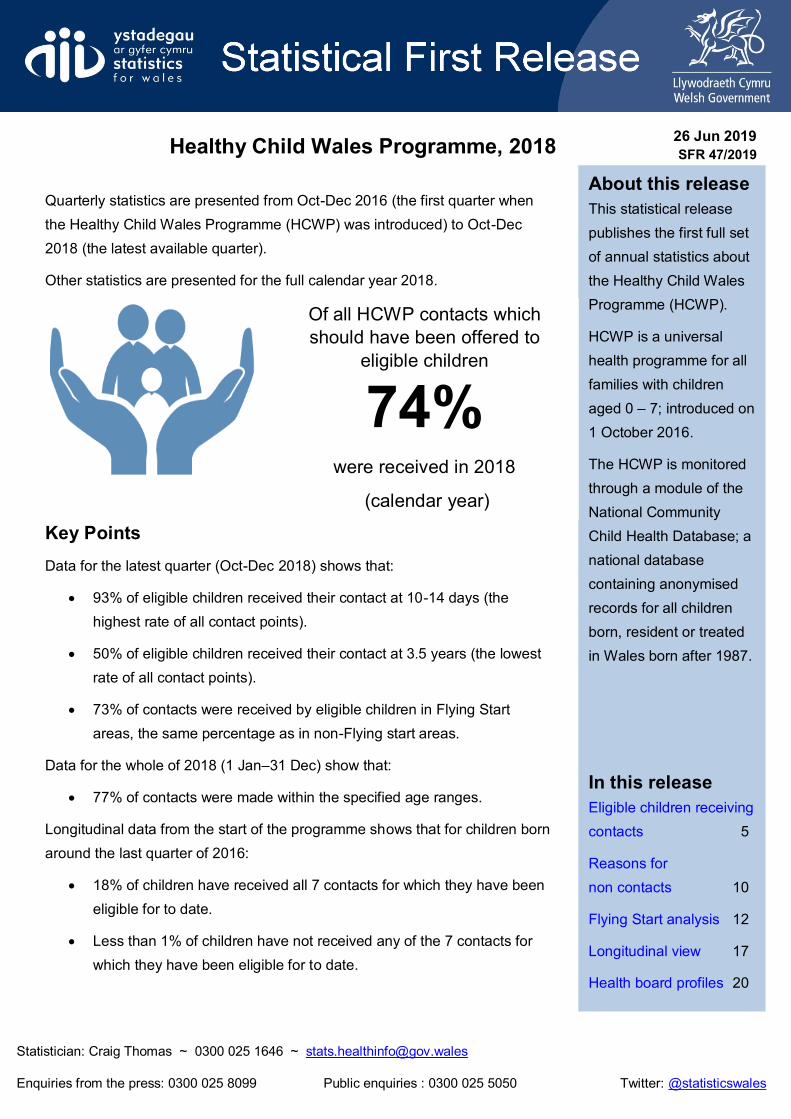
Healthy Child Wales Programme, 2018
26 Jun 2019
SFR 47/2019
Quarterly statistics are presented from Oct-Dec 2016 (the first quarter when
the Healthy Child Wales Programme (HCWP) was introduced) to Oct-Dec
2018 (the latest available quarter).
Other statistics are presented for the full calendar year 2018.
Key Points
Data for the latest quarter (Oct-Dec 2018) shows that:
93% of eligible children received their contact at 10-14 days (the
highest rate of all contact points).
50% of eligible children received their contact at 3.5 years (the lowest
rate of all contact points).
73% of contacts were received by eligible children in Flying Start
areas, the same percentage as in non-Flying start areas.
Data for the whole of 2018 (1 Jan–31 Dec) show that:
77% of contacts were made within the specified age ranges.
Longitudinal data from the start of the programme shows that for children born
around the last quarter of 2016:
18% of children have received all 7 contacts for which they have been
eligible for to date.
Less than 1% of children have not received any of the 7 contacts for
which they have been eligible for to date.
About this release
This statistical release
publishes the first full set
of annual statistics about
the Healthy Child Wales
Programme (HCWP).
HCWP is a universal
health programme for all
families with children
aged 0 – 7; introduced on
1 October 2016.
The HCWP is monitored
through a module of the
National Community
Child Health Database; a
national database
containing anonymised
records for all children
born, resident or treated
in Wales born after 1987.
In this release
Eligible children receiving
contacts 5
Reasons for
non contacts 10
Flying Start analysis 12
Longitudinal view 17
Health board profiles 20
Of all HCWP contacts which
should have been offered to
eligible children 74%
were received in 2018
(calendar year)
2
Healthy Child Wales Programme
Background
The Healthy Child Wales Programme (HCWP) was launched on 1 October 2016, with the
expectation that health boards would fully implement the programme within two years. The HCWP
is a universal health programme for all families with children aged 0 – 7 years. It includes a
consistent range of evidence based preventative and early intervention measures, with advice and
guidance to support parenting and healthy lifestyle choices. The HCWP sets out what planned
contacts children and their families can expect from their health boards from maternity service
handover to the first years of schooling. These universal contacts cover three areas of intervention:
screening; immunisation; and monitoring and supporting child development.
The programme underpins the concept of progressive universalism and aims to identify a minimum
set of key interventions to all families with pre-school children, irrespective of need.
Monitoring the programme
The programme is supported by an updated Child Health System, delivered by the NHS Wales
Informatics Service (NWIS), ensuring that health boards are able to schedule contacts effectively
under HCWP and that there is accurate and comparable data collected to support improvements to
child health across Wales.
The National Community Child Health Database (NCCHD) consists of anonymised records for all
children born, resident or treated in Wales and born after 1987. It brings together data from the
Child Health System databases which are held by local health boards. Welsh Government and
NWIS have worked together with health professionals to establish a dataset for those HCWP
contacts with children between the ages of 10 days and 3.5 years. The data is collected by health
visitors and other health professionals and recorded on the Child Health System by health board
community child health staff. The NCCHD is refreshed from local Child Health System databases
every quarter (end January, April, July and October).
Note that only data extracted from the NCCHD is analysed here and that HCWP contacts before
10 days of age and after 3.5 years are not reported in this release. Other key components of the
programme are reported elsewhere:
Immunisation statistics (COVER statistics) are published by Public Health Wales.
Infant feeding statistics are published in our annual Births in Wales, data from the NCCHD
statistical release.
Measuring coverage of the programme
In order to measure how the programme is being implemented for children living in Wales using
the National Community Child Health Database (NCCHD), the following methodology has been
used:
Identified appropriate eligible children during the period for each contact. For example, in
relation to the 10-14 day contact, we have looked at all children in Wales becoming 10 days
old during the quarter.
3
For these eligible children we have counted the valid records for each HCWP contact.
Delayed reporting by one quarter to allow time for data to be recorded on Child Health
System databases.
Note that annual data is extracted at the same time as the last quarter in the year and data
for the three previous quarters in the year are not revised. If there are late submissions of
data for contacts which happened in the first three quarters of the year, then these will be
counted in the annual data but not in the quarterly data from when they happened. As a
result annual data may not be the sum of the constituent quarters.
Implementing the programme
Statistics in this release only relate to the following HCWP contacts:
health visitor home contact at 10-14 days;
physical examination at 6-8 weeks;
health visitor service contact (growth assessment) at 8, 12 and 16 weeks;
health visitor service contact at 6 months;
health visitor service contact at 15 months;
health visitor service contact at 27 months; and
health visitor service contact at 3.5 years pre-school.
After the first home contact at 10-14 days, health visitor service contacts occur either in the home
or in clinics, although growth assessments contacts can also take place at GP practices. The
physical examination takes place mostly in GP practices or in clinics.
4
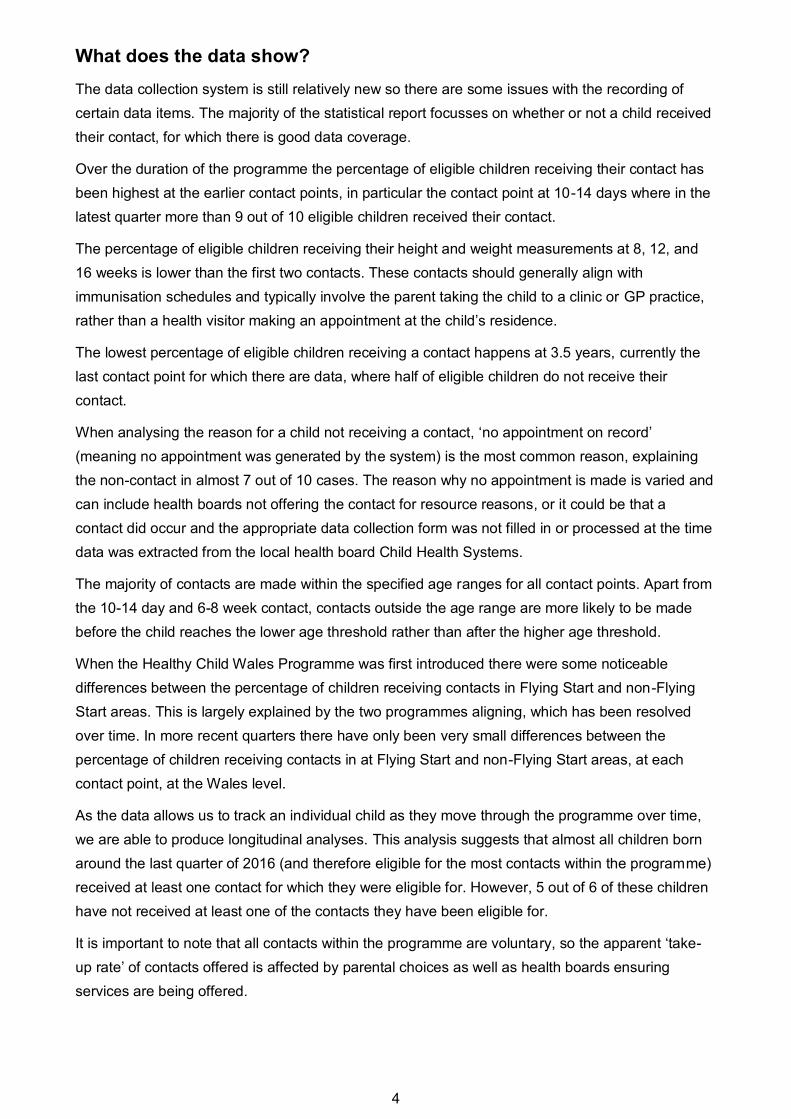
What does the data show?
The data collection system is still relatively new so there are some issues with the recording of
certain data items. The majority of the statistical report focusses on whether or not a child received
their contact, for which there is good data coverage.
Over the duration of the programme the percentage of eligible children receiving their contact has
been highest at the earlier contact points, in particular the contact point at 10-14 days where in the
latest quarter more than 9 out of 10 eligible children received their contact.
The percentage of eligible children receiving their height and weight measurements at 8, 12, and
16 weeks is lower than the first two contacts. These contacts should generally align with
immunisation schedules and typically involve the parent taking the child to a clinic or GP practice,
rather than a health visitor making an appointment at the child’s residence.
The lowest percentage of eligible children receiving a contact happens at 3.5 years, currently the
last contact point for which there are data, where half of eligible children do not receive their
contact.
When analysing the reason for a child not receiving a contact, ‘no appointment on record’
(meaning no appointment was generated by the system) is the most common reason, explaining
the non-contact in almost 7 out of 10 cases. The reason why no appointment is made is varied and
can include health boards not offering the contact for resource reasons, or it could be that a
contact did occur and the appropriate data collection form was not filled in or processed at the time
data was extracted from the local health board Child Health Systems.
The majority of contacts are made within the specified age ranges for all contact points. Apart from
the 10-14 day and 6-8 week contact, contacts outside the age range are more likely to be made
before the child reaches the lower age threshold rather than after the higher age threshold.
When the Healthy Child Wales Programme was first introduced there were some noticeable
differences between the percentage of children receiving contacts in Flying Start and non-Flying
Start areas. This is largely explained by the two programmes aligning, which has been resolved
over time. In more recent quarters there have only been very small differences between the
percentage of children receiving contacts in at Flying Start and non-Flying Start areas, at each
contact point, at the Wales level.
As the data allows us to track an individual child as they move through the programme over time,
we are able to produce longitudinal analyses. This analysis suggests that almost all children born
around the last quarter of 2016 (and therefore eligible for the most contacts within the programme)
received at least one contact for which they were eligible for. However, 5 out of 6 of these children
have not received at least one of the contacts they have been eligible for.
It is important to note that all contacts within the programme are voluntary, so the apparent ‘take-
up rate’ of contacts offered is affected by parental choices as well as health boards ensuring
services are being offered.
5
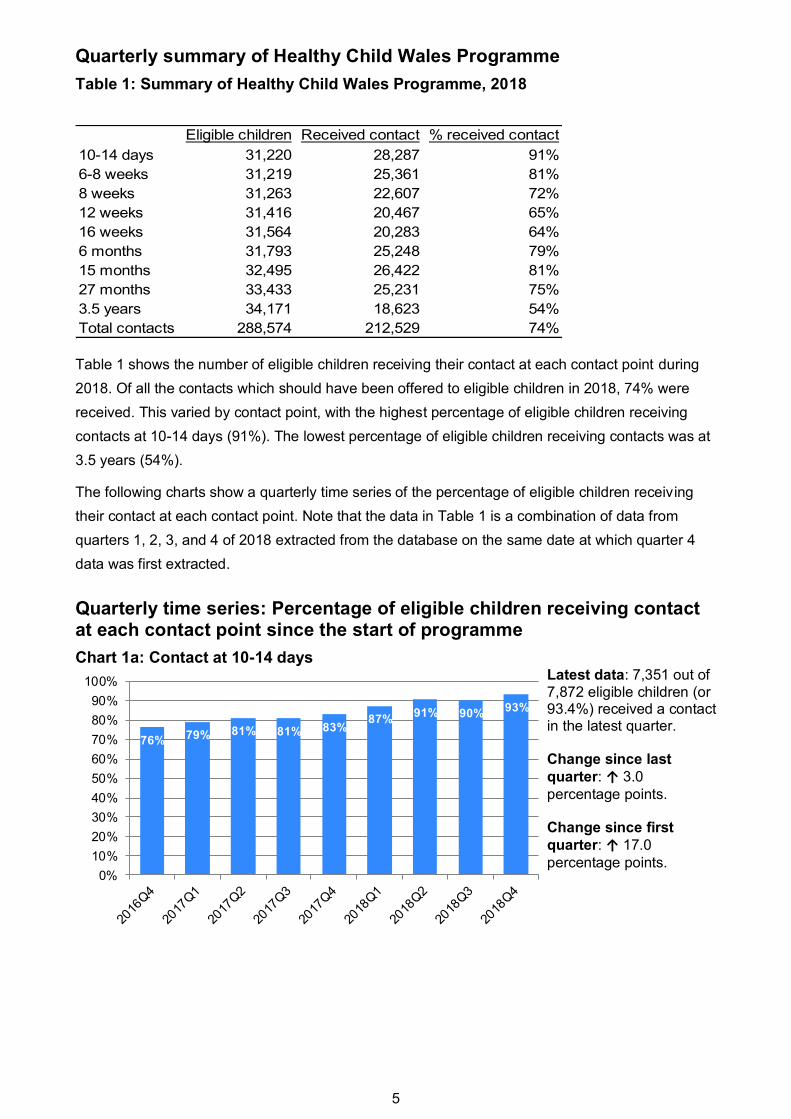
Quarterly summary of Healthy Child Wales Programme
Table 1: Summary of Healthy Child Wales Programme, 2018
Eligible children Received contact % received contact
10-14 days 31,220 28,287 91%
6-8 weeks 31,219 25,361 81%
8 weeks 31,263 22,607 72%
12 weeks 31,416 20,467 65%
16 weeks 31,564 20,283 64%
6 months 31,793 25,248 79%
15 months 32,495 26,422 81%
27 months 33,433 25,231 75%
3.5 years 34,171 18,623 54%
Total contacts 288,574 212,529 74%
Table 1 shows the number of eligible children receiving their contact at each contact point during
2018. Of all the contacts which should have been offered to eligible children in 2018, 74% were
received. This varied by contact point, with the highest percentage of eligible children receiving
contacts at 10-14 days (91%). The lowest percentage of eligible children receiving contacts was at
3.5 years (54%).
The following charts show a quarterly time series of the percentage of eligible children receiving
their contact at each contact point. Note that the data in Table 1 is a combination of data from
quarters 1, 2, 3, and 4 of 2018 extracted from the database on the same date at which quarter 4
data was first extracted.
Quarterly time series: Percentage of eligible children receiving contact at each contact point since the start of programme
Chart 1a: Contact at 10-14 days
76% 79% 81% 81% 83%87%
91% 90%93%
0%
10%
20%
30%
40%
50%
60%
70%
80%
90%
100%
Latest data: 7,351 out of
7,872 eligible children (or 93.4%) received a contact in the latest quarter. Change since last
quarter: ↑ 3.0
percentage points. Change since first
quarter: ↑ 17.0
percentage points.
6
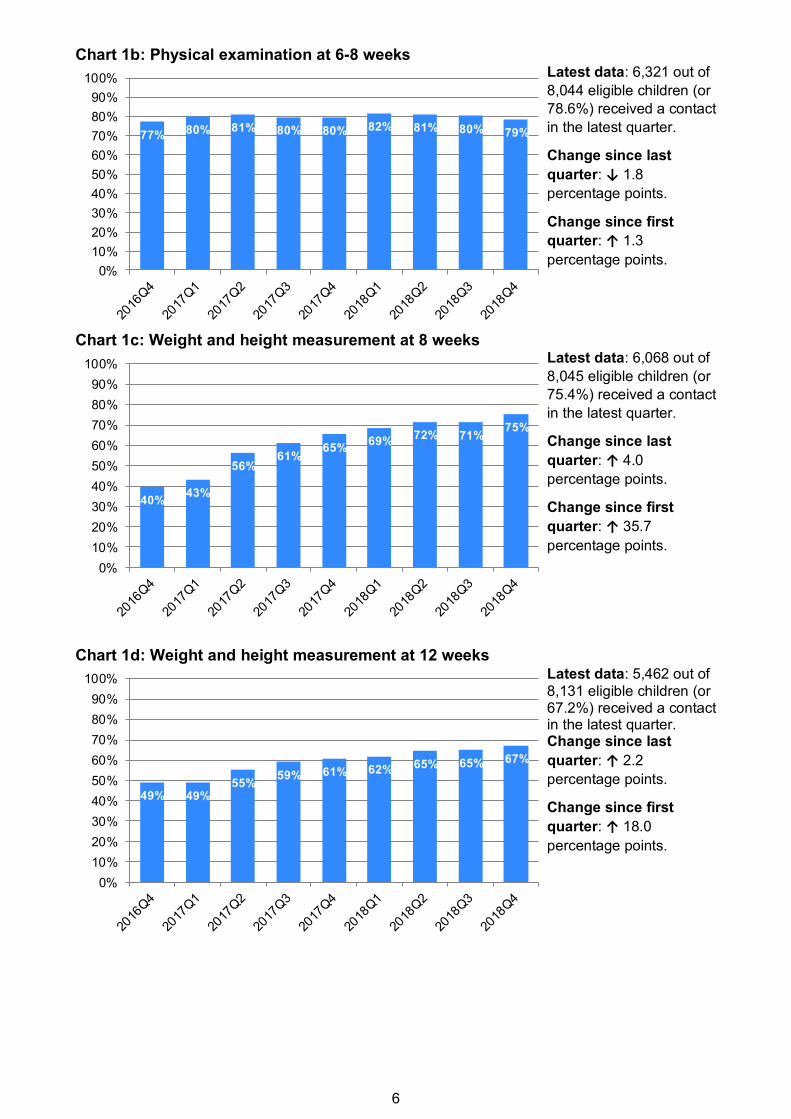
Chart 1b: Physical examination at 6-8 weeks
77% 80% 81% 80% 80% 82% 81% 80% 79%
0%
10%
20%
30%
40%
50%
60%
70%
80%
90%
100%
Latest data: 6,321 out of
8,044 eligible children (or
78.6%) received a contact
in the latest quarter.
Change since last
quarter: ↓ 1.8
percentage points.
Change since first
quarter: ↑ 1.3
percentage points.
Chart 1c: Weight and height measurement at 8 weeks
40%43%
56%61%
65%69%
72% 71%75%
0%
10%
20%
30%
40%
50%
60%
70%
80%
90%
100%
Latest data: 6,068 out of
8,045 eligible children (or
75.4%) received a contact
in the latest quarter.
Change since last
quarter: ↑ 4.0
percentage points.
Change since first
quarter: ↑ 35.7
percentage points.
Chart 1d: Weight and height measurement at 12 weeks
49% 49%55%
59% 61% 62% 65% 65% 67%
0%
10%
20%
30%
40%
50%
60%
70%
80%
90%
100%
Latest data: 5,462 out of
8,131 eligible children (or 67.2%) received a contact in the latest quarter. Change since last
quarter: ↑ 2.2
percentage points.
Change since first
quarter: ↑ 18.0
percentage points.
7
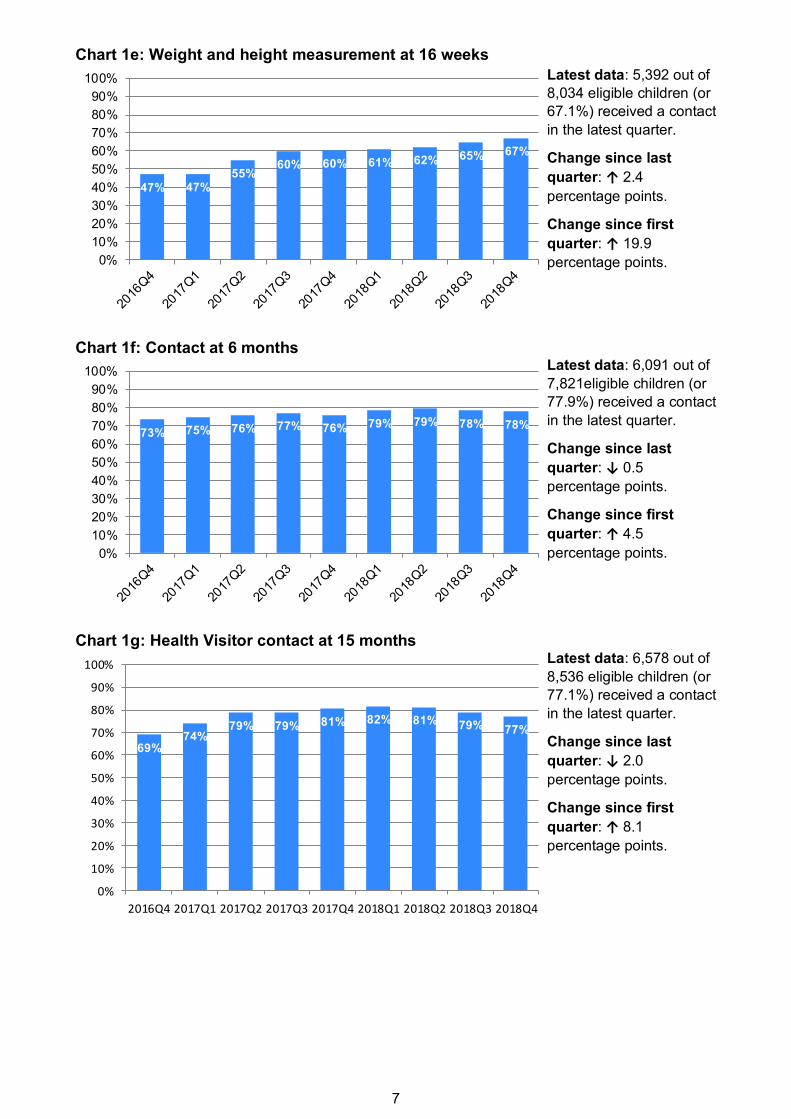
Chart 1e: Weight and height measurement at 16 weeks
47% 47%55%
60% 60% 61% 62% 65% 67%
0%
10%
20%
30%
40%
50%
60%
70%
80%
90%
100%
Latest data: 5,392 out of
8,034 eligible children (or
67.1%) received a contact
in the latest quarter.
Change since last
quarter: ↑ 2.4
percentage points.
Change since first
quarter: ↑ 19.9
percentage points.
Chart 1f: Contact at 6 months
73% 75% 76% 77% 76% 79% 79% 78% 78%
0%
10%
20%
30%
40%
50%
60%
70%
80%
90%
100%
Latest data: 6,091 out of
7,821eligible children (or
77.9%) received a contact
in the latest quarter.
Change since last
quarter: ↓ 0.5
percentage points.
Change since first
quarter: ↑ 4.5
percentage points.
Chart 1g: Health Visitor contact at 15 months
69%74%
79% 79% 81% 82% 81% 79% 77%
0%
10%
20%
30%
40%
50%
60%
70%
80%
90%
100%
2016Q4 2017Q1 2017Q2 2017Q3 2017Q4 2018Q1 2018Q2 2018Q3 2018Q4
Latest data: 6,578 out of
8,536 eligible children (or
77.1%) received a contact
in the latest quarter.
Change since last
quarter: ↓ 2.0
percentage points.
Change since first
quarter: ↑ 8.1
percentage points.
8
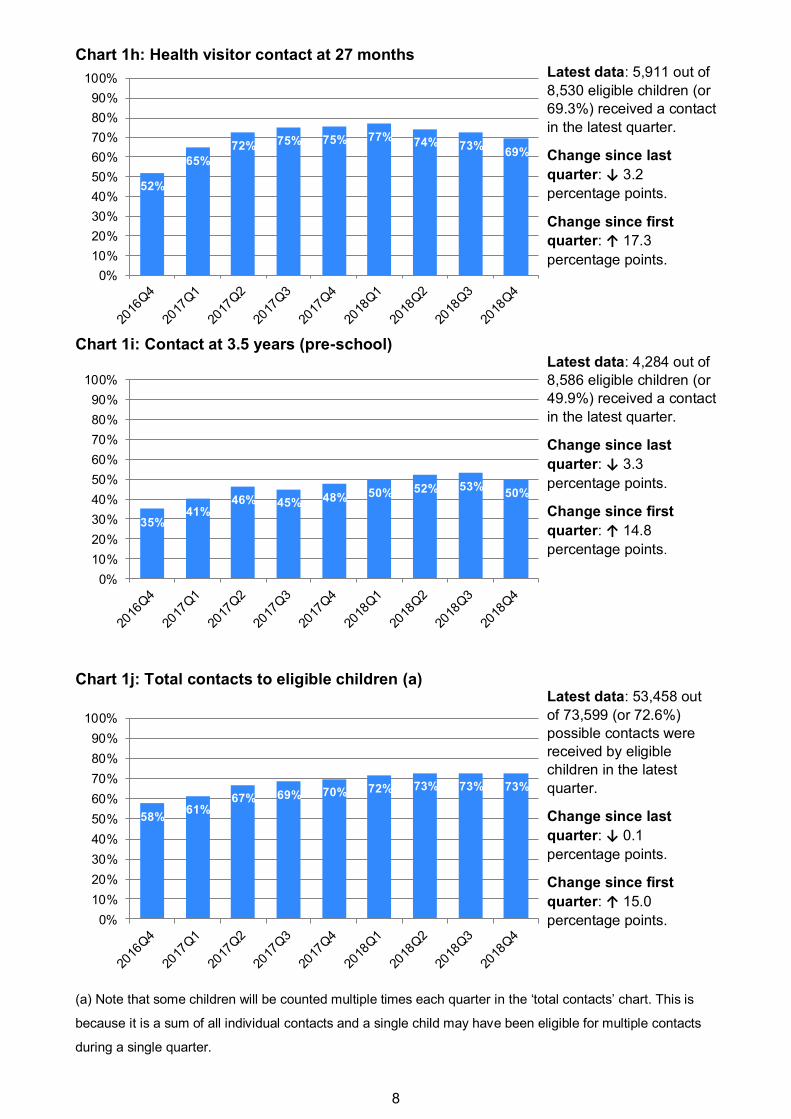
Chart 1h: Health visitor contact at 27 months
52%
65%
72% 75% 75% 77% 74% 73%69%
0%
10%
20%
30%
40%
50%
60%
70%
80%
90%
100%
Latest data: 5,911 out of
8,530 eligible children (or
69.3%) received a contact
in the latest quarter.
Change since last
quarter: ↓ 3.2
percentage points.
Change since first
quarter: ↑ 17.3
percentage points.
Chart 1i: Contact at 3.5 years (pre-school)
35%41%
46% 45% 48% 50% 52% 53%50%
0%
10%
20%
30%
40%
50%
60%
70%
80%
90%
100%
Latest data: 4,284 out of
8,586 eligible children (or
49.9%) received a contact
in the latest quarter.
Change since last
quarter: ↓ 3.3
percentage points.
Change since first
quarter: ↑ 14.8
percentage points.
Chart 1j: Total contacts to eligible children (a)
58%61%
67% 69% 70% 72% 73% 73% 73%
0%
10%
20%
30%
40%
50%
60%
70%
80%
90%
100%
Latest data: 53,458 out
of 73,599 (or 72.6%)
possible contacts were
received by eligible
children in the latest
quarter.
Change since last
quarter: ↓ 0.1
percentage points.
Change since first
quarter: ↑ 15.0
percentage points.
(a) Note that some children will be counted multiple times each quarter in the ‘total contacts’ chart. This is
because it is a sum of all individual contacts and a single child may have been eligible for multiple contacts
during a single quarter.
9
Summary
When all the contacts are combined, 72% or more of the contacts which should have been offered
to eligible children, were received, in each of the 4 quarters of 2018. The percentage of contacts
being received by eligible children, for all contacts combined, has increased in every quarter since
the start of the programme until 2018, quarter two. Since this point, the percentage has levelled off.
While there has been a general upward trend in the percentage of eligible children receiving their
contacts, there has been some variation at each contact point.
Throughout the duration of the programme, the 10-14 day contact has tended to be the contact
point with the highest percentage of eligible children receiving their contact. In the latest quarter
more than 9 out of 10 (93%) of eligible children received their contact.
The 3.5 year contact had the lowest percentage of eligible children receiving their contact in the
latest quarter and every other quarter since the programme was introduced. However, there has
been an increase in the ‘take-up’ of this contact since the programme was introduced, with the
percentage of eligible children being 50% or greater in each of the four quarters in 2018.
The contacts at 8, 12 and 16 week have a lower percentage of eligible children receiving their
contact than the contacts immediately preceding or following them. A number of factors might
influence this: for example, if a parent does not consent to the child receiving immunisations, a
health visitor form will not be generated and a contact not arranged; not all health visitors coincide
their clinics with GP immunisation sessions as there may not be space available in the surgery;
drop-in clinics may be shared between different health visitors so the contact might occur but not
get recorded on the data collection form; and if there are no concerns at the 6-8 week contact,
some parents may decide that their child does not need another contact soon after.
Note that all contacts offered through the Healthy Child Wales Programme are voluntary, so
personal choice also affects the percentage of eligible children receiving a contact.
10
Reasons for not receiving a contact
All eligible children across Wales should be sent an invite for all contacts either directly via a mailer
(for contacts that align with immunisations, providing consent is provided) or via their health visitor
for contacts led by the health visitor. Where a contact is not recorded, a reason is provided.
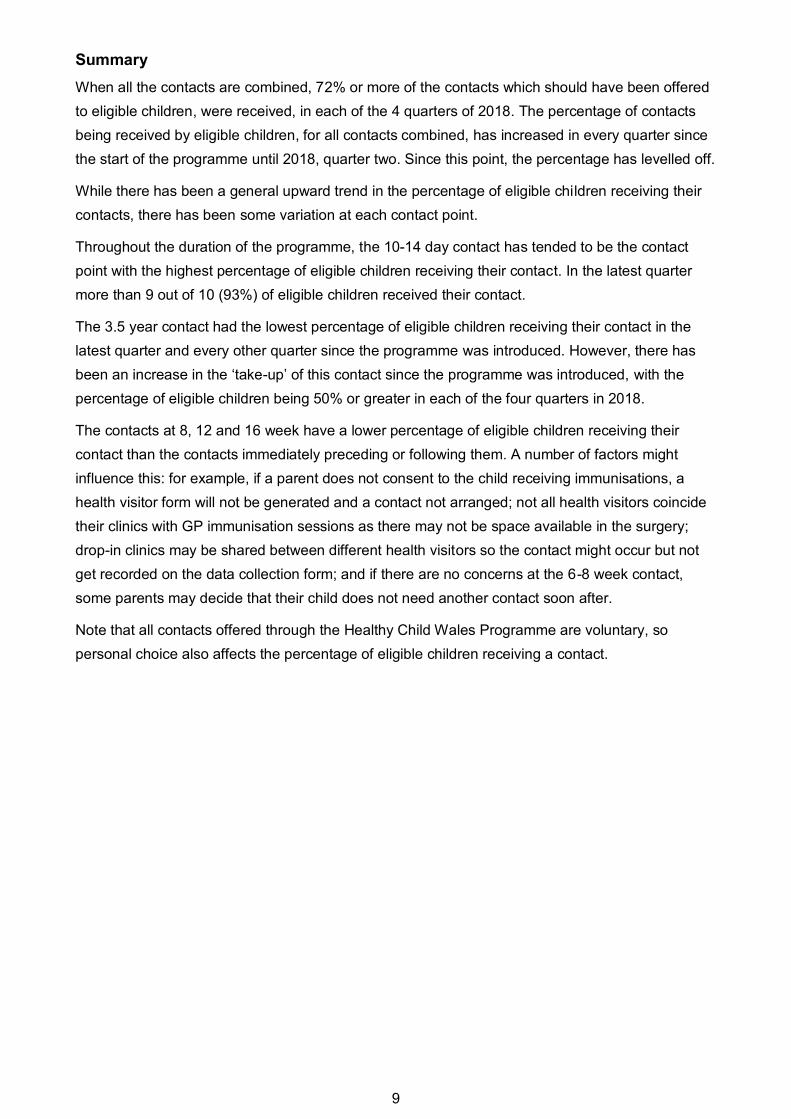
Chart 2: Reason for no contact, all contacts combined, 2018
68.1%
23.1%
0.3% 0.8% 0.2%
7.5%
0%
10%
20%
30%
40%
50%
60%
70%
80%
90%
100%
No appointment
on recordWas not brought Unwell or
uncooporative
child
Exam refused Parent/carer not
presentInvalid/Missing
Summary
During 2018 there were just over 76,000 contacts which were either not offered by health boards or
offered and not taken up by eligible children. 92% of these children had information recorded on
the system indicating why they did not take the contact. The majority (68%) of contacts were not
made because there was no record of an appointment being made. Where an appointment was
made, the main reason why the contact did not happen was because the child was not brought to
the appointment (23%).
There are a number of reasons why there may be no appointment on record: for example, it may
be that health boards do not have the capacity to provide a contact so it is not offered; the health
visitor may not have arranged an appointment; or a contact may have occurred and the child
health department has not processed the data collection form, or that department may not have
received the data collection form yet.
11
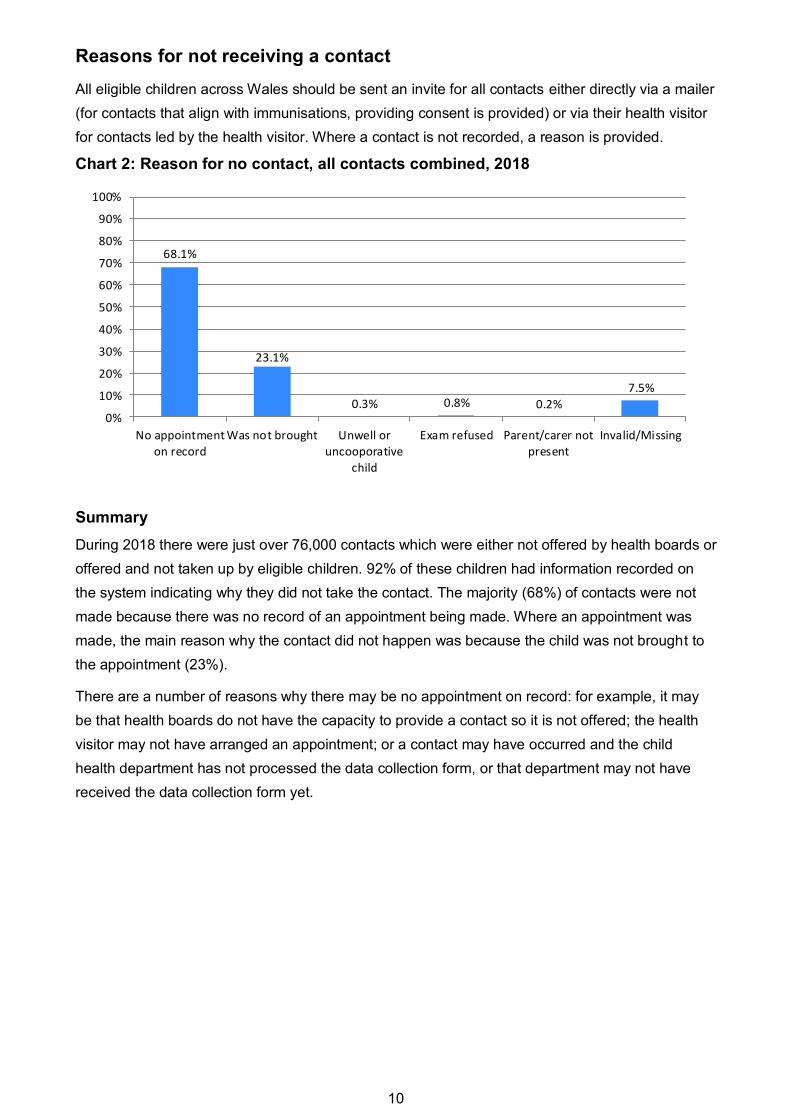
Contacts within programme age range, 2018
While the Healthy Child Wales Programme is designed for children to receive a contact at specific
ages, in practice each contact point has a minimum and maximum age threshold within which the
contact should take place. These thresholds were determined by Heads of Health Visitors at local
health boards and are shown in Table 2.
Table 2: Healthy Child Wales Programme contact age thresholds
Chart 3: Percentage of contacts received within age range, below the minimum age, and above the maximum age
77%
95%
71%
83%81%
69%
78% 78%
56%
77%
8%2%
28%
14% 12%
28%
19% 17%
43%
18%15%
2% 1% 3%6%
3% 3% 5% 1%5%
0%
10%
20%
30%
40%
50%
60%
70%
80%
90%
100%
10-14 days 6-8 weeks 8 weeks 12 weeks 16 weeks 6 months 5 months 27 months 3.5 years All
contacts
within programme age range below min age above max age
Summary
The majority of all contacts (77%) are made within the specified age range, though there is some
variation between contact points. If a child has their appointment outside of the age threshold, it’s
more likely to be before the minimum age, apart from at the first two contact points. The largest
percentage of children not seen within the age range is at 3.5 years, where over two-fifths (43%)
have their contact before the lower age threshold.
12
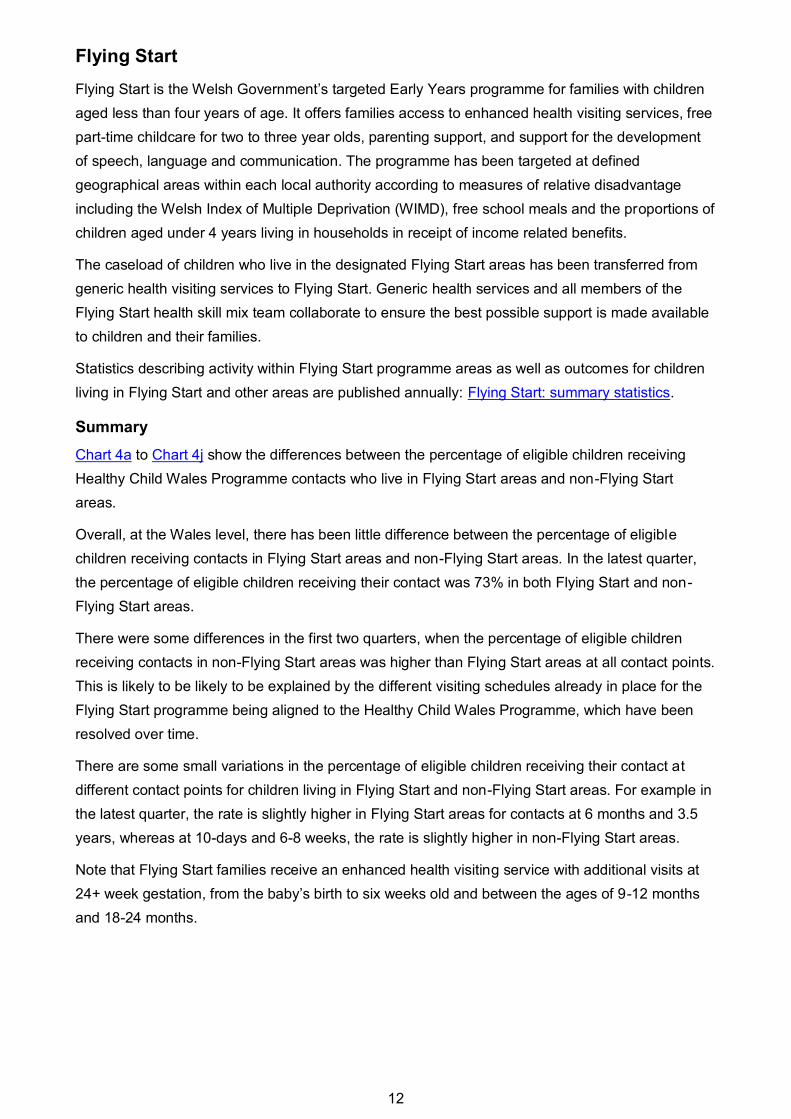
Flying Start
Flying Start is the Welsh Government’s targeted Early Years programme for families with children
aged less than four years of age. It offers families access to enhanced health visiting services, free
part-time childcare for two to three year olds, parenting support, and support for the development
of speech, language and communication. The programme has been targeted at defined
geographical areas within each local authority according to measures of relative disadvantage
including the Welsh Index of Multiple Deprivation (WIMD), free school meals and the proportions of
children aged under 4 years living in households in receipt of income related benefits.
The caseload of children who live in the designated Flying Start areas has been transferred from
generic health visiting services to Flying Start. Generic health services and all members of the
Flying Start health skill mix team collaborate to ensure the best possible support is made available
to children and their families.
Statistics describing activity within Flying Start programme areas as well as outcomes for children
living in Flying Start and other areas are published annually: Flying Start: summary statistics.
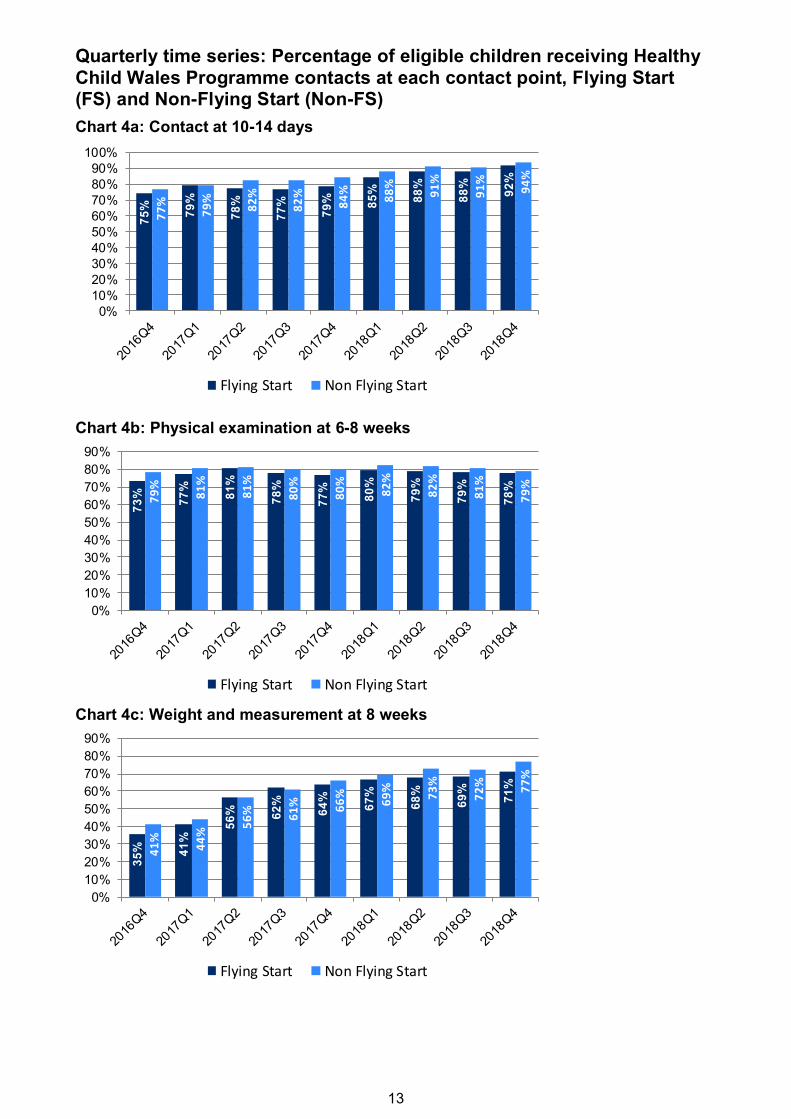
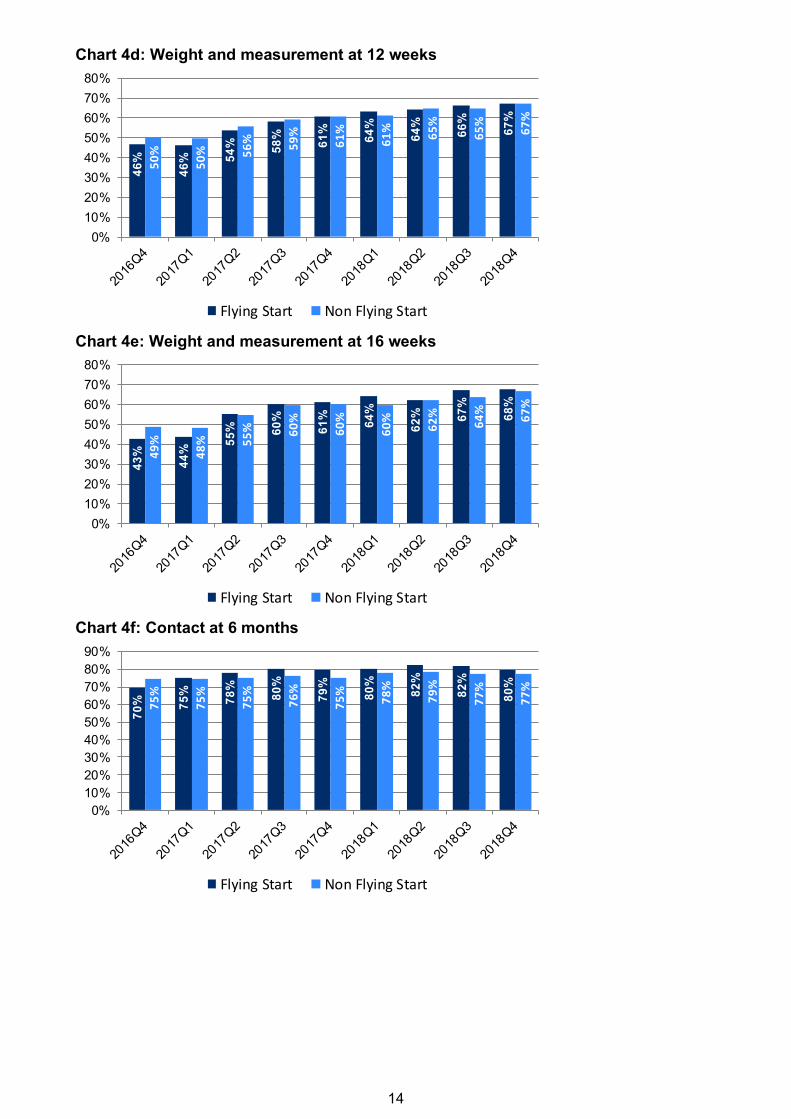
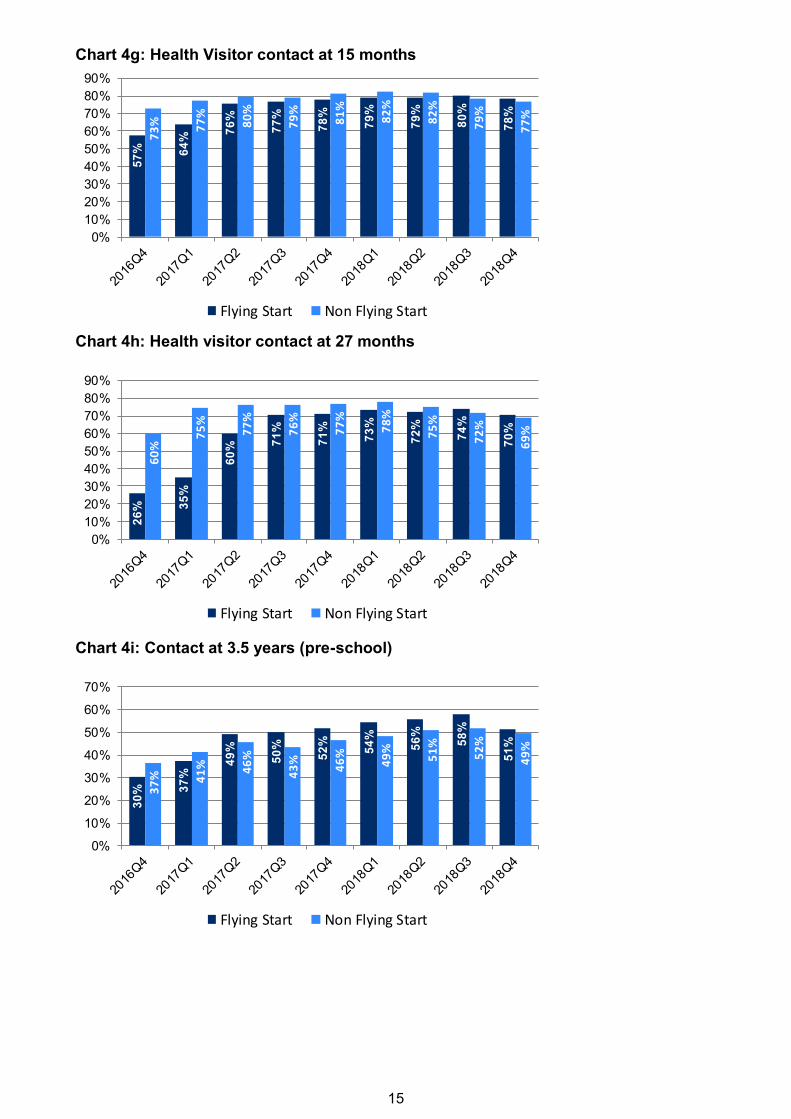
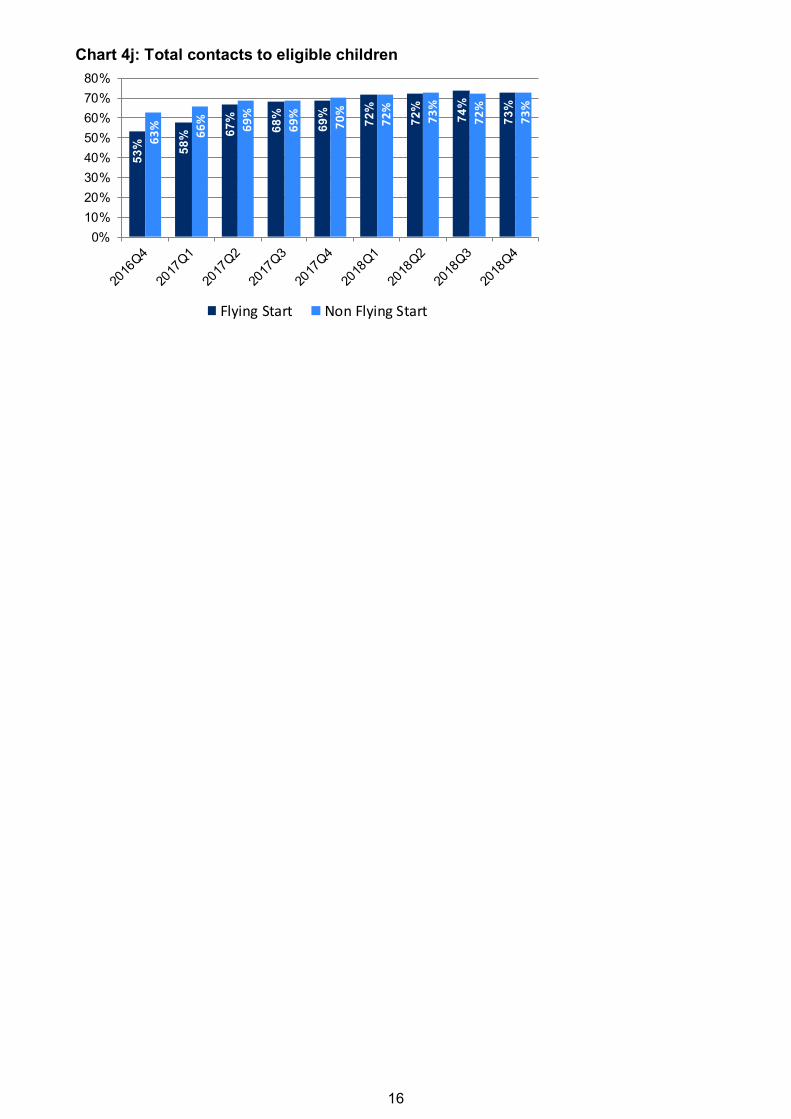
Summary
Chart 4a to Chart 4j show the differences between the percentage of eligible children receiving
Healthy Child Wales Programme contacts who live in Flying Start areas and non-Flying Start
areas.
Overall, at the Wales level, there has been little difference between the percentage of eligible
children receiving contacts in Flying Start areas and non-Flying Start areas. In the latest quarter,
the percentage of eligible children receiving their contact was 73% in both Flying Start and non-
Flying Start areas.
There were some differences in the first two quarters, when the percentage of eligible children
receiving contacts in non-Flying Start areas was higher than Flying Start areas at all contact points.
This is likely to be likely to be explained by the different visiting schedules already in place for the
Flying Start programme being aligned to the Healthy Child Wales Programme, which have been
resolved over time.
There are some small variations in the percentage of eligible children receiving their contact at
different contact points for children living in Flying Start and non-Flying Start areas. For example in
the latest quarter, the rate is slightly higher in Flying Start areas for contacts at 6 months and 3.5
years, whereas at 10-days and 6-8 weeks, the rate is slightly higher in non-Flying Start areas.
Note that Flying Start families receive an enhanced health visiting service with additional visits at
24+ week gestation, from the baby’s birth to six weeks old and between the ages of 9-12 months
and 18-24 months.
13
Quarterly time series: Percentage of eligible children receiving Healthy Child Wales Programme contacts at each contact point, Flying Start (FS) and Non-Flying Start (Non-FS)
Chart 4a: Contact at 10-14 days7
5%
79
%
78
%
77
%
79
% 85
%
88
%
88
%
92
%
77
%
79
%
82
%
82
%
84
%
88
%
91
%
91
%
94
%
0%
10%
20%
30%
40%
50%
60%
70%
80%
90%
100%
Flying Start Non Flying Start
Chart 4b: Physical examination at 6-8 weeks
73
%
77
%
81
%
78
%
77
%
80
%
79
%
79
%
78
%
79
%
81
%
81
%
80
%
80
%
82
%
82
%
81
%
79
%
0%
10%
20%
30%
40%
50%
60%
70%
80%
90%
Flying Start Non Flying Start
Chart 4c: Weight and measurement at 8 weeks
35
% 41
%
56
% 62
%
64
%
67
%
68
%
69
%
71
%
41
%
44
%
56
% 61
% 66
%
69
%
73
%
72
% 77
%
0%
10%
20%
30%
40%
50%
60%
70%
80%
90%
Flying Start Non Flying Start
14
Chart 4d: Weight and measurement at 12 weeks
46
%
46
% 54
% 58
%
61
%
64
%
64
%
66
%
67
%
50
%
50
% 56
%
59
%
61
%
61
%
65
%
65
%
67
%
0%
10%
20%
30%
40%
50%
60%
70%
80%
Flying Start Non Flying Start
Chart 4e: Weight and measurement at 16 weeks
43
%
44
%
55
% 60
%
61
%
64
%
62
% 67
%
68
%
49
%
48
% 55
% 60
%
60
%
60
%
62
%
64
%
67
%0%
10%
20%
30%
40%
50%
60%
70%
80%
Flying Start Non Flying Start
Chart 4f: Contact at 6 months
70
% 75
%
78
%
80
%
79
%
80
%
82
%
82
%
80
%
75
%
75
%
75
%
76
%
75
%
78
%
79
%
77
%
77
%
0%
10%
20%
30%
40%
50%
60%
70%
80%
90%
Flying Start Non Flying Start
15
Chart 4g: Health Visitor contact at 15 months
57
% 64
%
76
%
77
%
78
%
79
%
79
%
80
%
78
%
73
% 77
%
80
%
79
%
81
%
82
%
82
%
79
%
77
%
0%
10%
20%
30%
40%
50%
60%
70%
80%
90%
Flying Start Non Flying Start
Chart 4h: Health visitor contact at 27 months
26
% 35
%
60
% 71
%
71
%
73
%
72
%
74
%
70
%
60
%
75
%
77
%
76
%
77
%
78
%
75
%
72
%
69
%0%
10%
20%
30%
40%
50%
60%
70%
80%
90%
Flying Start Non Flying Start
Chart 4i: Contact at 3.5 years (pre-school)
30
% 37
%
49
%
50
%
52
%
54
%
56
%
58
%
51
%
37
% 41
% 46
%
43
%
46
%
49
%
51
%
52
%
49
%
0%
10%
20%
30%
40%
50%
60%
70%
Flying Start Non Flying Start
16
Chart 4j: Total contacts to eligible children
53
% 58
% 67
%
68
%
69
%
72
%
72
%
74
%
73
%
63
%
66
%
69
%
69
%
70
%
72
%
73
%
72
%
73
%
0%
10%
20%
30%
40%
50%
60%
70%
80%
Flying Start Non Flying Start
17
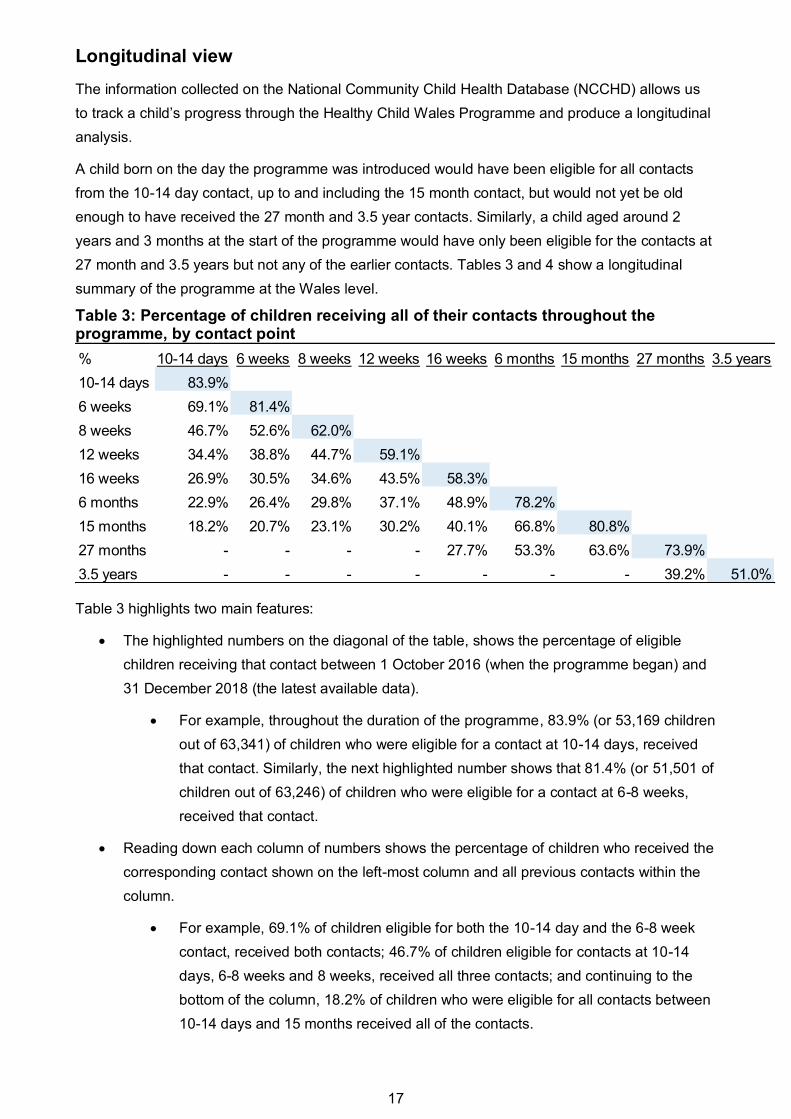
Longitudinal view
The information collected on the National Community Child Health Database (NCCHD) allows us
to track a child’s progress through the Healthy Child Wales Programme and produce a longitudinal
analysis.
A child born on the day the programme was introduced would have been eligible for all contacts
from the 10-14 day contact, up to and including the 15 month contact, but would not yet be old
enough to have received the 27 month and 3.5 year contacts. Similarly, a child aged around 2
years and 3 months at the start of the programme would have only been eligible for the contacts at
27 month and 3.5 years but not any of the earlier contacts. Tables 3 and 4 show a longitudinal
summary of the programme at the Wales level.
Table 3: Percentage of children receiving all of their contacts throughout the programme, by contact point
% 10-14 days 6 weeks 8 weeks 12 weeks 16 weeks 6 months 15 months 27 months 3.5 years
10-14 days 83.9%
6 weeks 69.1% 81.4%
8 weeks 46.7% 52.6% 62.0%
12 weeks 34.4% 38.8% 44.7% 59.1%
16 weeks 26.9% 30.5% 34.6% 43.5% 58.3%
6 months 22.9% 26.4% 29.8% 37.1% 48.9% 78.2%
15 months 18.2% 20.7% 23.1% 30.2% 40.1% 66.8% 80.8%
27 months - - - - 27.7% 53.3% 63.6% 73.9%
3.5 years - - - - - - - 39.2% 51.0%
Table 3 highlights two main features:
The highlighted numbers on the diagonal of the table, shows the percentage of eligible
children receiving that contact between 1 October 2016 (when the programme began) and
31 December 2018 (the latest available data).
For example, throughout the duration of the programme, 83.9% (or 53,169 children
out of 63,341) of children who were eligible for a contact at 10-14 days, received
that contact. Similarly, the next highlighted number shows that 81.4% (or 51,501 of
children out of 63,246) of children who were eligible for a contact at 6-8 weeks,
received that contact.
Reading down each column of numbers shows the percentage of children who received the
corresponding contact shown on the left-most column and all previous contacts within the
column.
For example, 69.1% of children eligible for both the 10-14 day and the 6-8 week
contact, received both contacts; 46.7% of children eligible for contacts at 10-14
days, 6-8 weeks and 8 weeks, received all three contacts; and continuing to the
bottom of the column, 18.2% of children who were eligible for all contacts between
10-14 days and 15 months received all of the contacts.
18
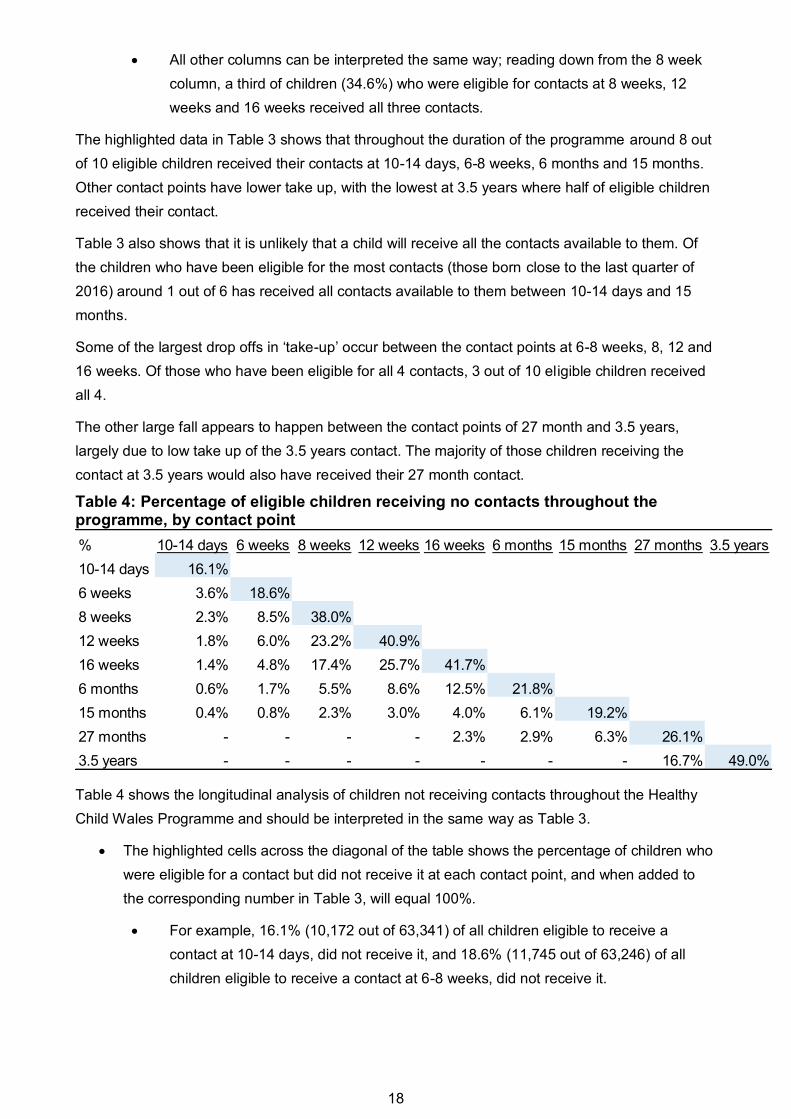
All other columns can be interpreted the same way; reading down from the 8 week
column, a third of children (34.6%) who were eligible for contacts at 8 weeks, 12
weeks and 16 weeks received all three contacts.
The highlighted data in Table 3 shows that throughout the duration of the programme around 8 out
of 10 eligible children received their contacts at 10-14 days, 6-8 weeks, 6 months and 15 months.
Other contact points have lower take up, with the lowest at 3.5 years where half of eligible children
received their contact.
Table 3 also shows that it is unlikely that a child will receive all the contacts available to them. Of
the children who have been eligible for the most contacts (those born close to the last quarter of
2016) around 1 out of 6 has received all contacts available to them between 10-14 days and 15
months.
Some of the largest drop offs in ‘take-up’ occur between the contact points at 6-8 weeks, 8, 12 and
16 weeks. Of those who have been eligible for all 4 contacts, 3 out of 10 eligible children received
all 4.
The other large fall appears to happen between the contact points of 27 month and 3.5 years,
largely due to low take up of the 3.5 years contact. The majority of those children receiving the
contact at 3.5 years would also have received their 27 month contact.
Table 4: Percentage of eligible children receiving no contacts throughout the programme, by contact point
% 10-14 days 6 weeks 8 weeks 12 weeks 16 weeks 6 months 15 months 27 months 3.5 years
10-14 days 16.1%
6 weeks 3.6% 18.6%
8 weeks 2.3% 8.5% 38.0%
12 weeks 1.8% 6.0% 23.2% 40.9%
16 weeks 1.4% 4.8% 17.4% 25.7% 41.7%
6 months 0.6% 1.7% 5.5% 8.6% 12.5% 21.8%
15 months 0.4% 0.8% 2.3% 3.0% 4.0% 6.1% 19.2%
27 months - - - - 2.3% 2.9% 6.3% 26.1%
3.5 years - - - - - - - 16.7% 49.0%
Table 4 shows the longitudinal analysis of children not receiving contacts throughout the Healthy
Child Wales Programme and should be interpreted in the same way as Table 3.
The highlighted cells across the diagonal of the table shows the percentage of children who
were eligible for a contact but did not receive it at each contact point, and when added to
the corresponding number in Table 3, will equal 100%.
For example, 16.1% (10,172 out of 63,341) of all children eligible to receive a
contact at 10-14 days, did not receive it, and 18.6% (11,745 out of 63,246) of all
children eligible to receive a contact at 6-8 weeks, did not receive it.
19
Reading down the columns shows the percentage of eligible children who did not receive
their contact at the corresponding point on the left-most column, and did not receive all
previous contacts they were eligible for.
For example, 3.6% of children eligible for a contact at 10-14 days and 6-8 weeks did
not receive both contacts; 2.3% of children eligible for contacts at 10-14 days, 6-8
weeks and 8 weeks did not receive any of the contacts; and continuing down to the
bottom of the column, 0.4% of children did not receive any of the contacts they were
eligible for between 10-14 days and 15 months.
Table 4 shows that the vast majority of children have received at least one contact throughout the
programme, but there are a small number of children who have yet to be seen. Of those eligible for
the most contacts (those born around the last quarter of 2016), over 96% are seen either at 10-14
days or 6-8 weeks (or both); however, by the 15 month contact (the last contact they are currently
eligible for) 0.4% (or 86 children) have not received any contact as part of the programme.
While ‘take up’ of all the contacts between 6-8 weeks and 16 weeks is relatively low, just over 95%
of eligible children received at least one of these contacts.
Weight and height measurements are taken at the 8, 12 and 16 weeks contact points and around 1
in 6 children have not received these appointments since the start of the programme.
20
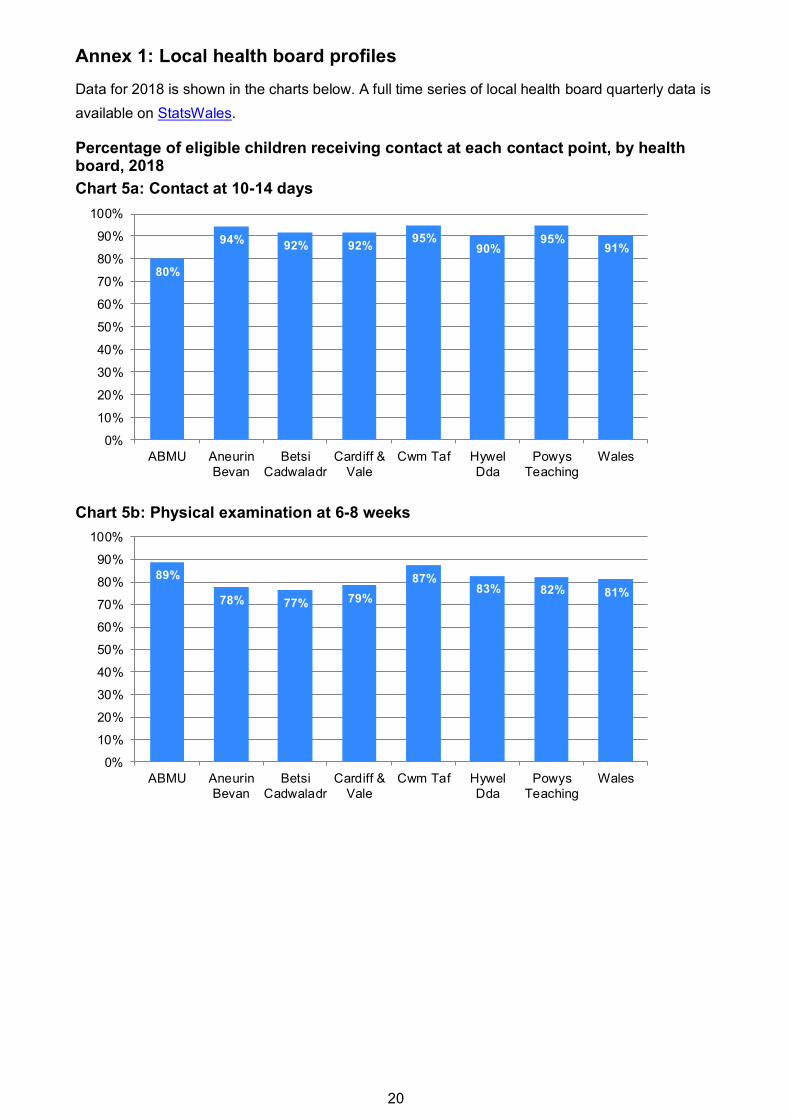
Annex 1: Local health board profiles
Data for 2018 is shown in the charts below. A full time series of local health board quarterly data is
available on StatsWales.
Percentage of eligible children receiving contact at each contact point, by health board, 2018
Chart 5a: Contact at 10-14 days
80%
94%92% 92%
95%90%
95%91%
0%
10%
20%
30%
40%
50%
60%
70%
80%
90%
100%
ABMU Aneurin
Bevan
Betsi
Cadwaladr
Cardiff &
Vale
Cwm Taf Hywel
Dda
Powys
Teaching
Wales
Chart 5b: Physical examination at 6-8 weeks
89%
78% 77% 79%
87%83% 82% 81%
0%
10%
20%
30%
40%
50%
60%
70%
80%
90%
100%
ABMU Aneurin
Bevan
Betsi
Cadwaladr
Cardiff &
Vale
Cwm Taf Hywel
Dda
Powys
Teaching
Wales
21
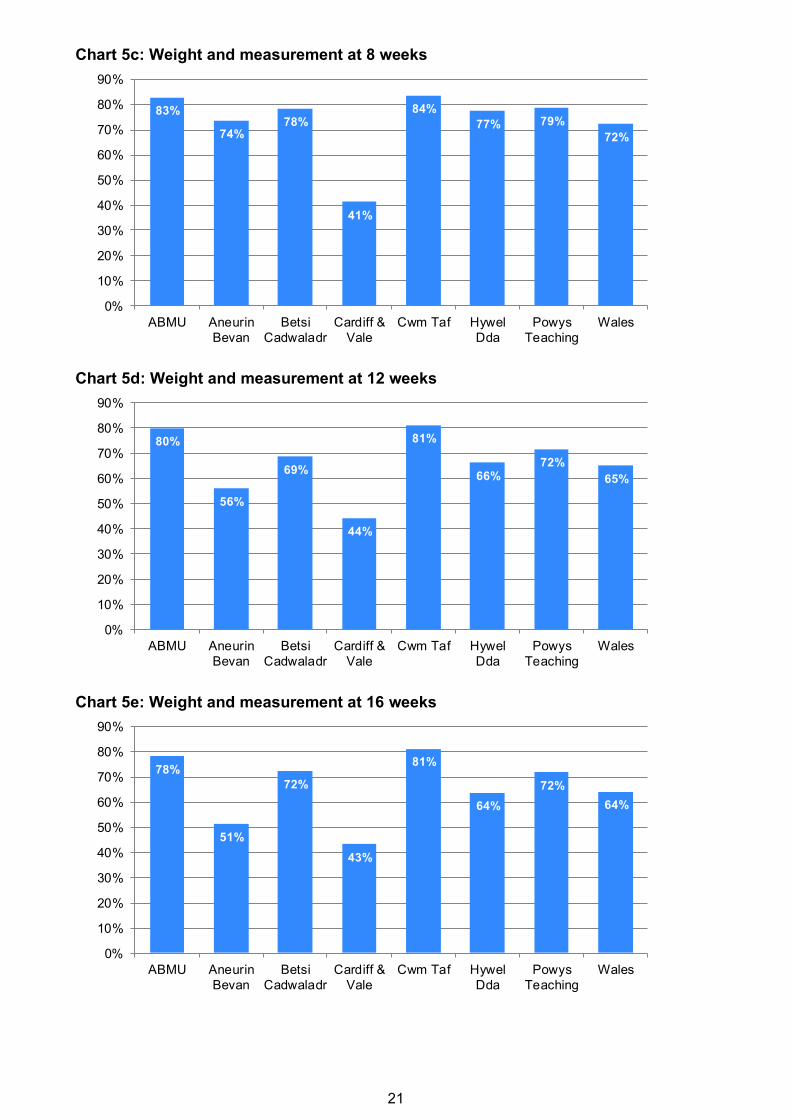
Chart 5c: Weight and measurement at 8 weeks
83%
74%78%
41%
84%
77% 79%
72%
0%
10%
20%
30%
40%
50%
60%
70%
80%
90%
ABMU Aneurin
Bevan
Betsi
Cadwaladr
Cardiff &
Vale
Cwm Taf Hywel
Dda
Powys
Teaching
Wales
Chart 5d: Weight and measurement at 12 weeks
80%
56%
69%
44%
81%
66%72%
65%
0%
10%
20%
30%
40%
50%
60%
70%
80%
90%
ABMU Aneurin
Bevan
Betsi
Cadwaladr
Cardiff &
Vale
Cwm Taf Hywel
Dda
Powys
Teaching
Wales
Chart 5e: Weight and measurement at 16 weeks
78%
51%
72%
43%
81%
64%
72%
64%
0%
10%
20%
30%
40%
50%
60%
70%
80%
90%
ABMU Aneurin
Bevan
Betsi
Cadwaladr
Cardiff &
Vale
Cwm Taf Hywel
Dda
Powys
Teaching
Wales
22
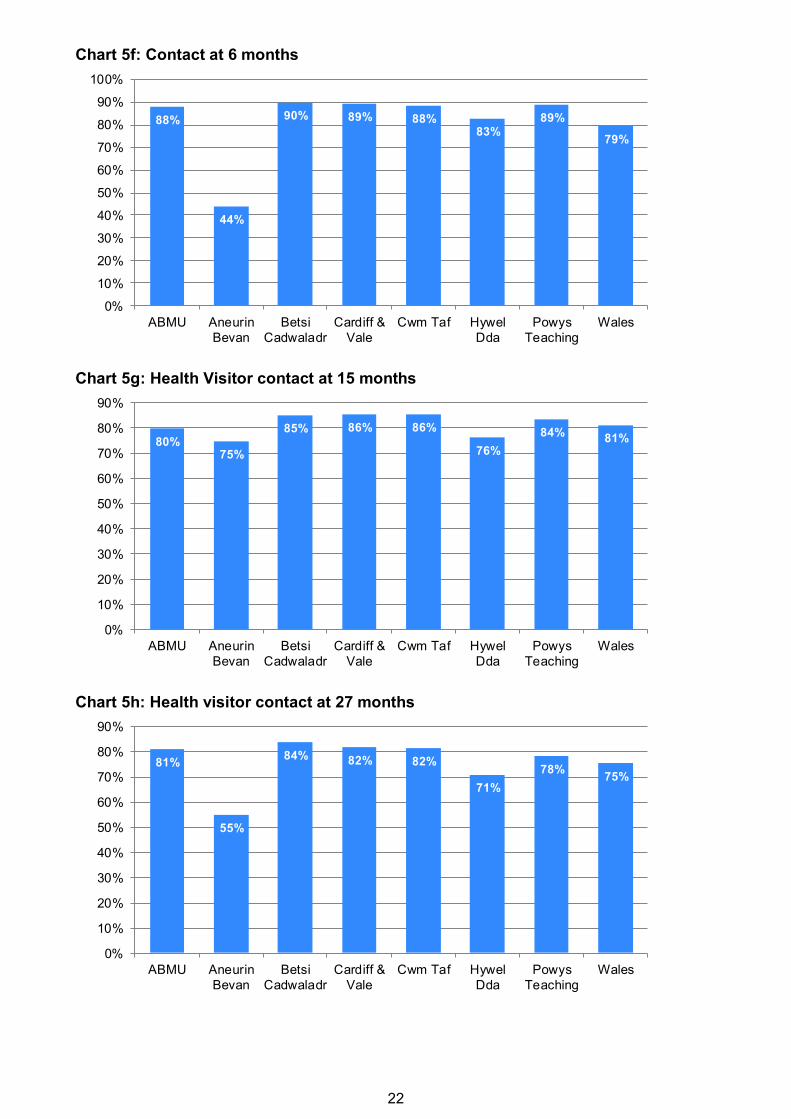
Chart 5f: Contact at 6 months
88%
44%
90% 89% 88%83%
89%
79%
0%
10%
20%
30%
40%
50%
60%
70%
80%
90%
100%
ABMU Aneurin
Bevan
Betsi
Cadwaladr
Cardiff &
Vale
Cwm Taf Hywel
Dda
Powys
Teaching
Wales
Chart 5g: Health Visitor contact at 15 months
80%75%
85% 86% 86%
76%
84%81%
0%
10%
20%
30%
40%
50%
60%
70%
80%
90%
ABMU Aneurin
Bevan
Betsi
Cadwaladr
Cardiff &
Vale
Cwm Taf Hywel
Dda
Powys
Teaching
Wales
Chart 5h: Health visitor contact at 27 months
81%
55%
84% 82% 82%
71%
78%75%
0%
10%
20%
30%
40%
50%
60%
70%
80%
90%
ABMU Aneurin
Bevan
Betsi
Cadwaladr
Cardiff &
Vale
Cwm Taf Hywel
Dda
Powys
Teaching
Wales
23
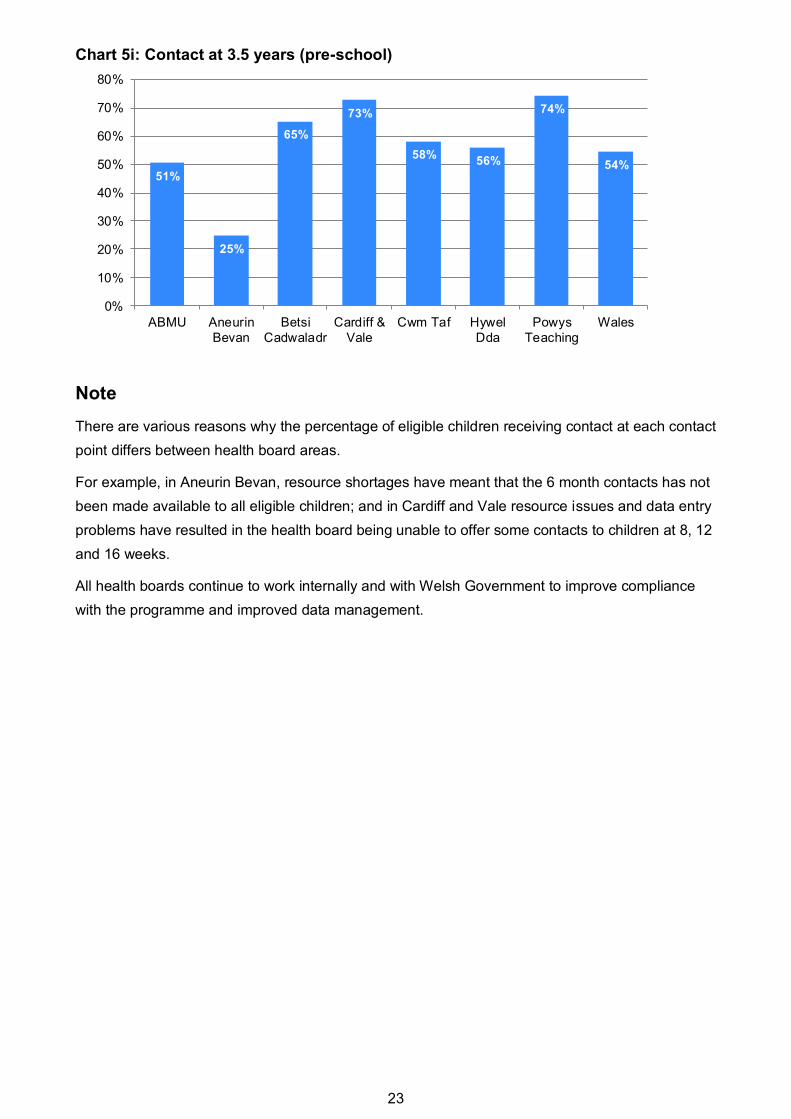
Chart 5i: Contact at 3.5 years (pre-school)
51%
25%
65%
73%
58%56%
74%
54%
0%
10%
20%
30%
40%
50%
60%
70%
80%
ABMU Aneurin
Bevan
Betsi
Cadwaladr
Cardiff &
Vale
Cwm Taf Hywel
Dda
Powys
Teaching
Wales
Note
There are various reasons why the percentage of eligible children receiving contact at each contact
point differs between health board areas.
For example, in Aneurin Bevan, resource shortages have meant that the 6 month contacts has not
been made available to all eligible children; and in Cardiff and Vale resource issues and data entry
problems have resulted in the health board being unable to offer some contacts to children at 8, 12
and 16 weeks.
All health boards continue to work internally and with Welsh Government to improve compliance
with the programme and improved data management.
24
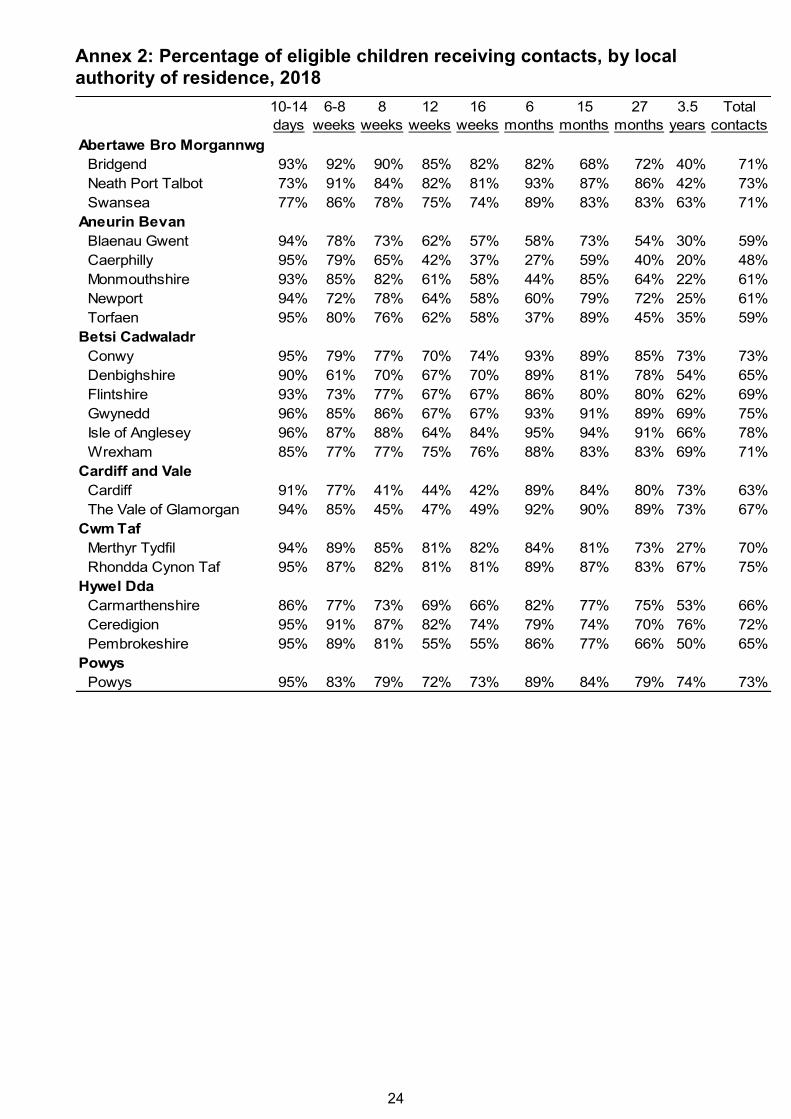
Annex 2: Percentage of eligible children receiving contacts, by local authority of residence, 2018
10-14
days
6-8
weeks
8
weeks
12
weeks
16
weeks
6
months
15
months
27
months
3.5
years
Total
contacts
Abertawe Bro Morgannwg
Bridgend 93% 92% 90% 85% 82% 82% 68% 72% 40% 71%
Neath Port Talbot 73% 91% 84% 82% 81% 93% 87% 86% 42% 73%
Swansea 77% 86% 78% 75% 74% 89% 83% 83% 63% 71%
Aneurin Bevan
Blaenau Gwent 94% 78% 73% 62% 57% 58% 73% 54% 30% 59%
Caerphilly 95% 79% 65% 42% 37% 27% 59% 40% 20% 48%
Monmouthshire 93% 85% 82% 61% 58% 44% 85% 64% 22% 61%
Newport 94% 72% 78% 64% 58% 60% 79% 72% 25% 61%
Torfaen 95% 80% 76% 62% 58% 37% 89% 45% 35% 59%
Betsi Cadwaladr
Conwy 95% 79% 77% 70% 74% 93% 89% 85% 73% 73%
Denbighshire 90% 61% 70% 67% 70% 89% 81% 78% 54% 65%
Flintshire 93% 73% 77% 67% 67% 86% 80% 80% 62% 69%
Gwynedd 96% 85% 86% 67% 67% 93% 91% 89% 69% 75%
Isle of Anglesey 96% 87% 88% 64% 84% 95% 94% 91% 66% 78%
Wrexham 85% 77% 77% 75% 76% 88% 83% 83% 69% 71%
Cardiff and Vale
Cardiff 91% 77% 41% 44% 42% 89% 84% 80% 73% 63%
The Vale of Glamorgan 94% 85% 45% 47% 49% 92% 90% 89% 73% 67%
Cwm Taf
Merthyr Tydfil 94% 89% 85% 81% 82% 84% 81% 73% 27% 70%
Rhondda Cynon Taf 95% 87% 82% 81% 81% 89% 87% 83% 67% 75%
Hywel Dda
Carmarthenshire 86% 77% 73% 69% 66% 82% 77% 75% 53% 66%
Ceredigion 95% 91% 87% 82% 74% 79% 74% 70% 76% 72%
Pembrokeshire 95% 89% 81% 55% 55% 86% 77% 66% 50% 65%
Powys
Powys 95% 83% 79% 72% 73% 89% 84% 79% 74% 73%
25
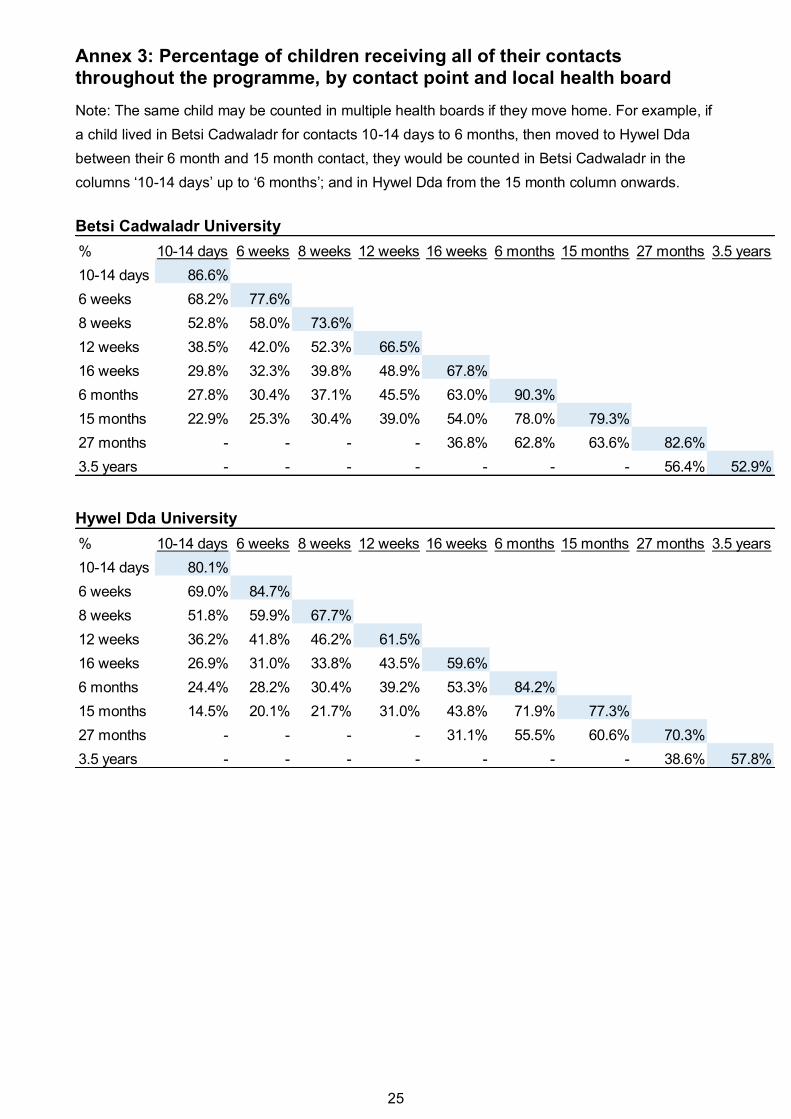
Annex 3: Percentage of children receiving all of their contacts throughout the programme, by contact point and local health board
Note: The same child may be counted in multiple health boards if they move home. For example, if
a child lived in Betsi Cadwaladr for contacts 10-14 days to 6 months, then moved to Hywel Dda
between their 6 month and 15 month contact, they would be counted in Betsi Cadwaladr in the
columns ‘10-14 days’ up to ‘6 months’; and in Hywel Dda from the 15 month column onwards.
Betsi Cadwaladr University
% 10-14 days 6 weeks 8 weeks 12 weeks 16 weeks 6 months 15 months 27 months 3.5 years
10-14 days 86.6%
6 weeks 68.2% 77.6%
8 weeks 52.8% 58.0% 73.6%
12 weeks 38.5% 42.0% 52.3% 66.5%
16 weeks 29.8% 32.3% 39.8% 48.9% 67.8%
6 months 27.8% 30.4% 37.1% 45.5% 63.0% 90.3%
15 months 22.9% 25.3% 30.4% 39.0% 54.0% 78.0% 79.3%
27 months - - - - 36.8% 62.8% 63.6% 82.6%
3.5 years - - - - - - - 56.4% 52.9%
Hywel Dda University
% 10-14 days 6 weeks 8 weeks 12 weeks 16 weeks 6 months 15 months 27 months 3.5 years
10-14 days 80.1%
6 weeks 69.0% 84.7%
8 weeks 51.8% 59.9% 67.7%
12 weeks 36.2% 41.8% 46.2% 61.5%
16 weeks 26.9% 31.0% 33.8% 43.5% 59.6%
6 months 24.4% 28.2% 30.4% 39.2% 53.3% 84.2%
15 months 14.5% 20.1% 21.7% 31.0% 43.8% 71.9% 77.3%
27 months - - - - 31.1% 55.5% 60.6% 70.3%
3.5 years - - - - - - - 38.6% 57.8%
26
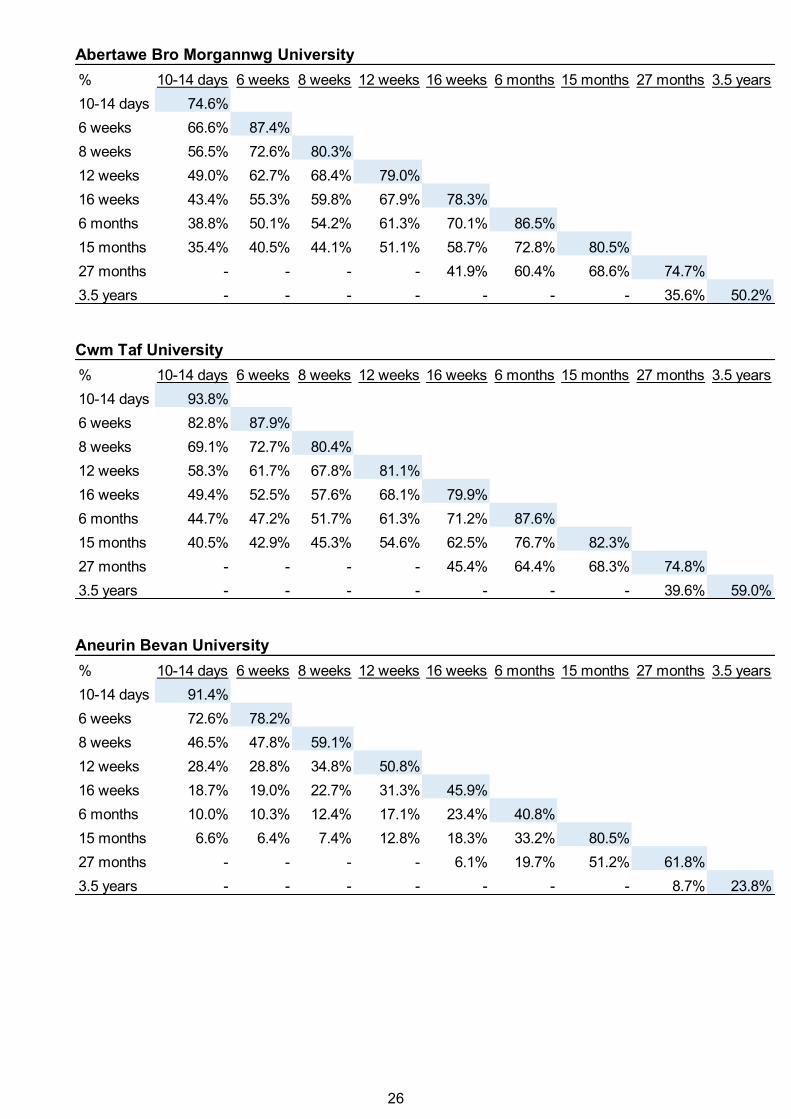
Abertawe Bro Morgannwg University
% 10-14 days 6 weeks 8 weeks 12 weeks 16 weeks 6 months 15 months 27 months 3.5 years
10-14 days 74.6%
6 weeks 66.6% 87.4%
8 weeks 56.5% 72.6% 80.3%
12 weeks 49.0% 62.7% 68.4% 79.0%
16 weeks 43.4% 55.3% 59.8% 67.9% 78.3%
6 months 38.8% 50.1% 54.2% 61.3% 70.1% 86.5%
15 months 35.4% 40.5% 44.1% 51.1% 58.7% 72.8% 80.5%
27 months - - - - 41.9% 60.4% 68.6% 74.7%
3.5 years - - - - - - - 35.6% 50.2% Cwm Taf University
% 10-14 days 6 weeks 8 weeks 12 weeks 16 weeks 6 months 15 months 27 months 3.5 years
10-14 days 93.8%
6 weeks 82.8% 87.9%
8 weeks 69.1% 72.7% 80.4%
12 weeks 58.3% 61.7% 67.8% 81.1%
16 weeks 49.4% 52.5% 57.6% 68.1% 79.9%
6 months 44.7% 47.2% 51.7% 61.3% 71.2% 87.6%
15 months 40.5% 42.9% 45.3% 54.6% 62.5% 76.7% 82.3%
27 months - - - - 45.4% 64.4% 68.3% 74.8%
3.5 years - - - - - - - 39.6% 59.0% Aneurin Bevan University
% 10-14 days 6 weeks 8 weeks 12 weeks 16 weeks 6 months 15 months 27 months 3.5 years
10-14 days 91.4%
6 weeks 72.6% 78.2%
8 weeks 46.5% 47.8% 59.1%
12 weeks 28.4% 28.8% 34.8% 50.8%
16 weeks 18.7% 19.0% 22.7% 31.3% 45.9%
6 months 10.0% 10.3% 12.4% 17.1% 23.4% 40.8%
15 months 6.6% 6.4% 7.4% 12.8% 18.3% 33.2% 80.5%
27 months - - - - 6.1% 19.7% 51.2% 61.8%
3.5 years - - - - - - - 8.7% 23.8%
27
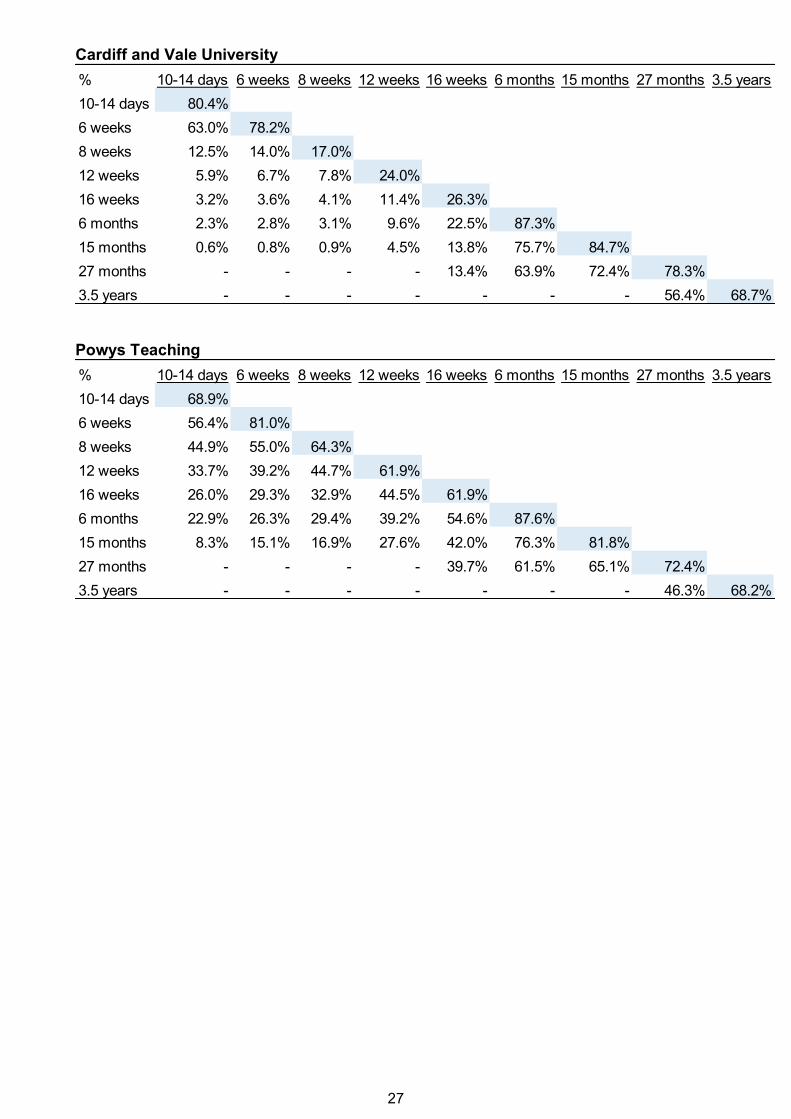
Cardiff and Vale University
% 10-14 days 6 weeks 8 weeks 12 weeks 16 weeks 6 months 15 months 27 months 3.5 years
10-14 days 80.4%
6 weeks 63.0% 78.2%
8 weeks 12.5% 14.0% 17.0%
12 weeks 5.9% 6.7% 7.8% 24.0%
16 weeks 3.2% 3.6% 4.1% 11.4% 26.3%
6 months 2.3% 2.8% 3.1% 9.6% 22.5% 87.3%
15 months 0.6% 0.8% 0.9% 4.5% 13.8% 75.7% 84.7%
27 months - - - - 13.4% 63.9% 72.4% 78.3%
3.5 years - - - - - - - 56.4% 68.7% Powys Teaching
% 10-14 days 6 weeks 8 weeks 12 weeks 16 weeks 6 months 15 months 27 months 3.5 years
10-14 days 68.9%
6 weeks 56.4% 81.0%
8 weeks 44.9% 55.0% 64.3%
12 weeks 33.7% 39.2% 44.7% 61.9%
16 weeks 26.0% 29.3% 32.9% 44.5% 61.9%
6 months 22.9% 26.3% 29.4% 39.2% 54.6% 87.6%
15 months 8.3% 15.1% 16.9% 27.6% 42.0% 76.3% 81.8%
27 months - - - - 39.7% 61.5% 65.1% 72.4%
3.5 years - - - - - - - 46.3% 68.2%
28
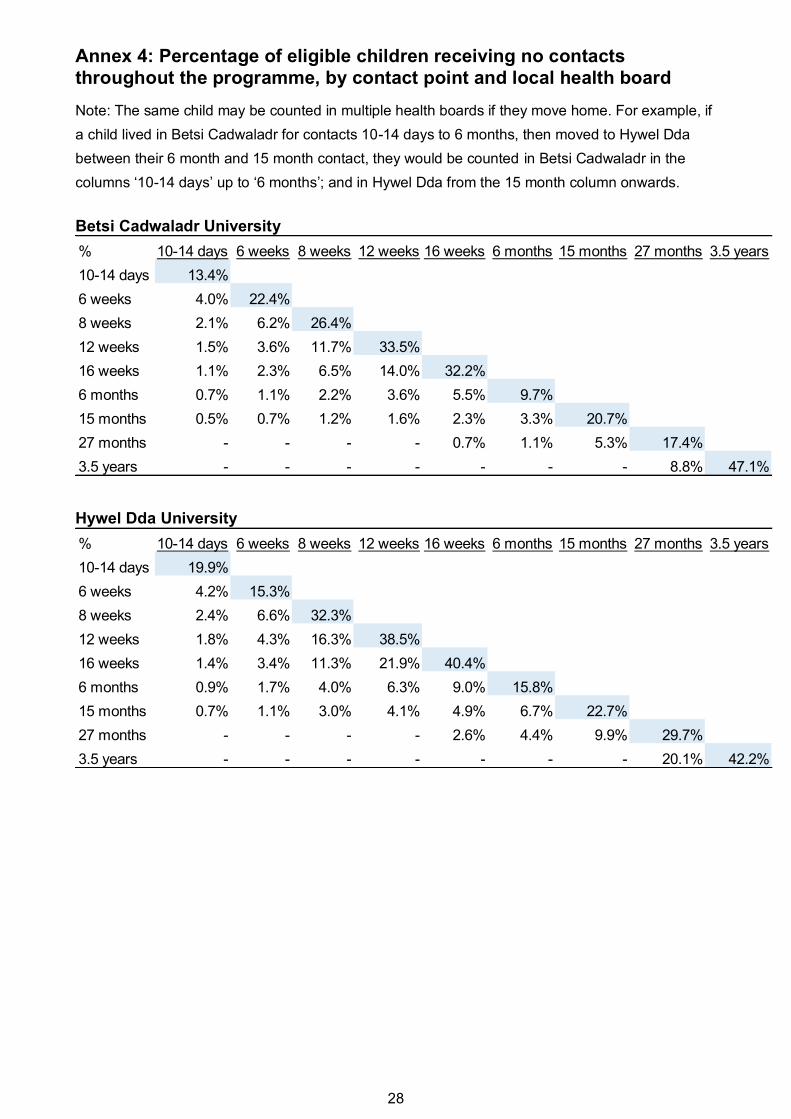
Annex 4: Percentage of eligible children receiving no contacts throughout the programme, by contact point and local health board
Note: The same child may be counted in multiple health boards if they move home. For example, if
a child lived in Betsi Cadwaladr for contacts 10-14 days to 6 months, then moved to Hywel Dda
between their 6 month and 15 month contact, they would be counted in Betsi Cadwaladr in the
columns ‘10-14 days’ up to ‘6 months’; and in Hywel Dda from the 15 month column onwards.
Betsi Cadwaladr University
% 10-14 days 6 weeks 8 weeks 12 weeks 16 weeks 6 months 15 months 27 months 3.5 years
10-14 days 13.4%
6 weeks 4.0% 22.4%
8 weeks 2.1% 6.2% 26.4%
12 weeks 1.5% 3.6% 11.7% 33.5%
16 weeks 1.1% 2.3% 6.5% 14.0% 32.2%
6 months 0.7% 1.1% 2.2% 3.6% 5.5% 9.7%
15 months 0.5% 0.7% 1.2% 1.6% 2.3% 3.3% 20.7%
27 months - - - - 0.7% 1.1% 5.3% 17.4%
3.5 years - - - - - - - 8.8% 47.1%
Hywel Dda University
% 10-14 days 6 weeks 8 weeks 12 weeks 16 weeks 6 months 15 months 27 months 3.5 years
10-14 days 19.9%
6 weeks 4.2% 15.3%
8 weeks 2.4% 6.6% 32.3%
12 weeks 1.8% 4.3% 16.3% 38.5%
16 weeks 1.4% 3.4% 11.3% 21.9% 40.4%
6 months 0.9% 1.7% 4.0% 6.3% 9.0% 15.8%
15 months 0.7% 1.1% 3.0% 4.1% 4.9% 6.7% 22.7%
27 months - - - - 2.6% 4.4% 9.9% 29.7%
3.5 years - - - - - - - 20.1% 42.2%
29
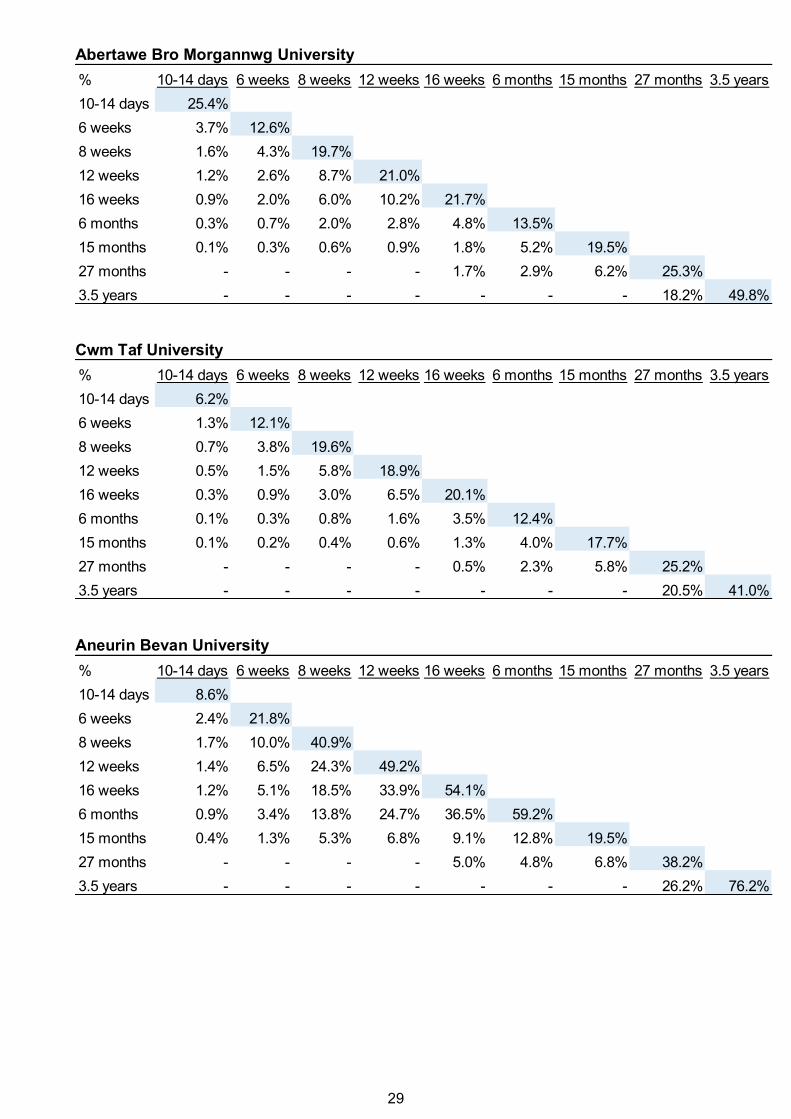
Abertawe Bro Morgannwg University
% 10-14 days 6 weeks 8 weeks 12 weeks 16 weeks 6 months 15 months 27 months 3.5 years
10-14 days 25.4%
6 weeks 3.7% 12.6%
8 weeks 1.6% 4.3% 19.7%
12 weeks 1.2% 2.6% 8.7% 21.0%
16 weeks 0.9% 2.0% 6.0% 10.2% 21.7%
6 months 0.3% 0.7% 2.0% 2.8% 4.8% 13.5%
15 months 0.1% 0.3% 0.6% 0.9% 1.8% 5.2% 19.5%
27 months - - - - 1.7% 2.9% 6.2% 25.3%
3.5 years - - - - - - - 18.2% 49.8% Cwm Taf University
% 10-14 days 6 weeks 8 weeks 12 weeks 16 weeks 6 months 15 months 27 months 3.5 years
10-14 days 6.2%
6 weeks 1.3% 12.1%
8 weeks 0.7% 3.8% 19.6%
12 weeks 0.5% 1.5% 5.8% 18.9%
16 weeks 0.3% 0.9% 3.0% 6.5% 20.1%
6 months 0.1% 0.3% 0.8% 1.6% 3.5% 12.4%
15 months 0.1% 0.2% 0.4% 0.6% 1.3% 4.0% 17.7%
27 months - - - - 0.5% 2.3% 5.8% 25.2%
3.5 years - - - - - - - 20.5% 41.0% Aneurin Bevan University
% 10-14 days 6 weeks 8 weeks 12 weeks 16 weeks 6 months 15 months 27 months 3.5 years
10-14 days 8.6%
6 weeks 2.4% 21.8%
8 weeks 1.7% 10.0% 40.9%
12 weeks 1.4% 6.5% 24.3% 49.2%
16 weeks 1.2% 5.1% 18.5% 33.9% 54.1%
6 months 0.9% 3.4% 13.8% 24.7% 36.5% 59.2%
15 months 0.4% 1.3% 5.3% 6.8% 9.1% 12.8% 19.5%
27 months - - - - 5.0% 4.8% 6.8% 38.2%
3.5 years - - - - - - - 26.2% 76.2%
30
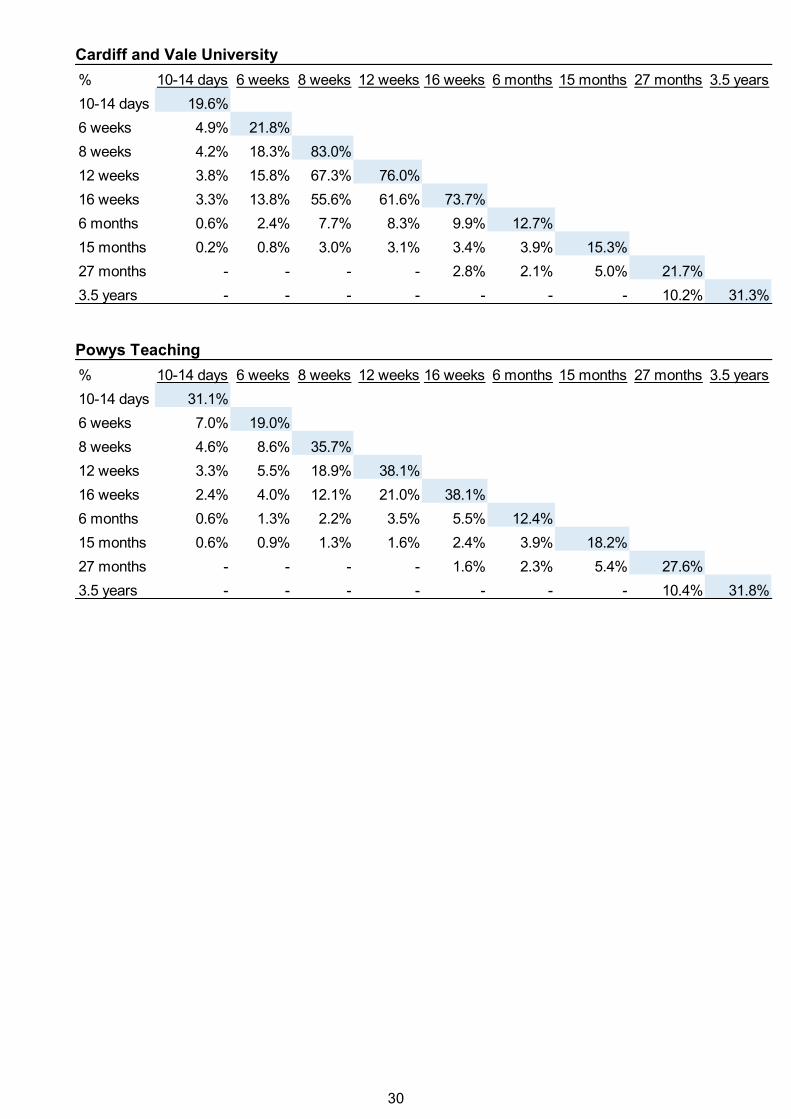
Cardiff and Vale University
% 10-14 days 6 weeks 8 weeks 12 weeks 16 weeks 6 months 15 months 27 months 3.5 years
10-14 days 19.6%
6 weeks 4.9% 21.8%
8 weeks 4.2% 18.3% 83.0%
12 weeks 3.8% 15.8% 67.3% 76.0%
16 weeks 3.3% 13.8% 55.6% 61.6% 73.7%
6 months 0.6% 2.4% 7.7% 8.3% 9.9% 12.7%
15 months 0.2% 0.8% 3.0% 3.1% 3.4% 3.9% 15.3%
27 months - - - - 2.8% 2.1% 5.0% 21.7%
3.5 years - - - - - - - 10.2% 31.3% Powys Teaching
% 10-14 days 6 weeks 8 weeks 12 weeks 16 weeks 6 months 15 months 27 months 3.5 years
10-14 days 31.1%
6 weeks 7.0% 19.0%
8 weeks 4.6% 8.6% 35.7%
12 weeks 3.3% 5.5% 18.9% 38.1%
16 weeks 2.4% 4.0% 12.1% 21.0% 38.1%
6 months 0.6% 1.3% 2.2% 3.5% 5.5% 12.4%
15 months 0.6% 0.9% 1.3% 1.6% 2.4% 3.9% 18.2%
27 months - - - - 1.6% 2.3% 5.4% 27.6%
3.5 years - - - - - - - 10.4% 31.8%
31
Key Quality Information
The Healthy Child Wales Programme
Further information on the Healthy Child Wales Programme (HCWP) can be found on the Welsh
Government website and the NHS Wales Data Dictionary.
Source
Maintained by NHS Wales Informatics Service (NWIS), the National Community Child Health
Database (NCCHD) is Wales’ national community child health database and consists of
anonymised records for all children born, resident or treated in Wales and born after 1987. It brings
together data from local Child Health System databases which are held by local health boards.
Coverage
Statistics in the release relate to contacts by health professionals with children resident in Wales.
Bridgend local authority moving health board
Health service provision for residents of Bridgend local authority has moved from Abertawe Bro
Morgannwg to Cwm Taf on April 1st 2019. This joint statement provides further detail. The health
board names were confirmed in this statement with Cwm Taf University Health Board becoming
Cwm Taf Morgannwg University Health Board and Abertawe Bro Morgannwg University Health
Board becoming Swansea Bay University Health Board.
As a result, the quarterly data for Jan-Mar 2019 (provisionally due for publication on StatsWales in
August 2019) will be the last quarter in the time series for both Cwm Taf and Abertawe Bro
Morgannwg. The subsequent quarterly data for Apr-Jun 2019 (provisionally due for publication on
StatsWales in November 2019) will include data for the two new health boards, Cwm Taf
Morgannwg and Swansea Bay.
The next annual statistical release, provisionally scheduled for June 2018 may see data published
for both the old and new health boards. Data for Cwm Taf and Abertawe Bro Morgannwg will only
refer to the first quarter of 2019 (Jan-Mar) while data for Cwm Taf Morgannwg and Swansea Bay
will only refer to the last 3 quarters of 2019 (Apr-Jun, Jul-Sep, Oct-Dec).
Time series for all five other health boards and at the Wales level will remain unaffected.
Related statistics
Births: Data from the National Community Child Health Database statistics on where and when
babies were born, their birth weight, whether they were preterm and about their mothers - their age
and whether the babies were breastfed.
Flying Start provides key statistics from the Flying Start programme for each of the 22 local
authorities in Wales.
Maternity statistics provides statistics on maternity services in Wales including antenatal care, care
at delivery and outcomes for babies.
32
Data access, confidentiality and disclosure control
The extract supplied to Welsh Government by NWIS has been anonymised so that it contains no
personal identifiable information.
Statistics take into account our disclosure control guidance and follow ONS confidentiality
guidelines for Health statistics available from: ONS best-practice guidelines.
Revisions
NCCHD is a live database and is refreshed quarterly. If reports are extracted from subsequent
versions of the database counts will differ from published figures. Historical data is not revised
unless errors are discovered. In the case of incorrect data being published, revisions would be
made and users informed.
What are the potential uses of these statistics?
These statistics will be used in a variety of ways. Some examples of these are:
advice to Ministers
to inform debate in the National Assembly for Wales and beyond
to make publicly available data on child health statistics in Wales
monitoring service delivery
policy development
providing advice on birth choices.
Users of this data
The main users of this data are likely to be:
ministers and the Members Research Service in the National Assembly for Wales
local health boards
the research community
students, academics and universities
those concerned with child health, Individual citizens and private hospitals
NHS organisations
voluntary birth organisations.
Relevance
The statistics provide an opportunity to monitor the implementation of the HCWP and provide an
insight into the profile of the early years in Wales.
Users of the statistics are encouraged to contact Welsh Government to let us know how they use
the data.
Key users have been contacted prior to release of this data and will continue to be liaised with as
the statistical release develops.
The release will be adapted to respond to policy changes ensuring our statistics remain relevant.
33
Accuracy
HCWP data is a newly established part of NCCHD and data quality is mixed. Welsh Government
and NWIS are working with health boards to improve completeness and quality. Only a selection of
the available data items has been included in this statistical release but as the data quality
improves its scope may be expanded.
Completeness
Data completeness varies across data items, but is sufficiently high to produce official statistics.
NCCHD is a live database and is refreshed quarterly. If reports are extracted from subsequent
versions of the database counts will differ from published figures. Historical data is not revised
unless errors are discovered. In the case of incorrect data being published, revisions would be
made and users informed.
Timeliness and punctuality
The NCCHD is refreshed from data derived from local child health systems every quarter. The next
statistical release is planned for June 2020, following the April NCCHD refresh and will cover the
whole calendar year for 2019.
To supplement the annual statistical release, quarterly data are published on StatsWales.
Accessibility and clarity
The statistics are published in an accessible, orderly, pre-announced manner on the Welsh
Government website at 9:30am on the day of publication. An RSS feed alerts registered users to
this publication. Simultaneously the releases are also published on the National Statistics
Publication Hub. We also publicise our outputs on Twitter. All releases are available to download
for free.
Open data tables are available via StatsWales every quarter.
We aim to use plain English in our outputs and all outputs adhere to the Welsh Government’s
accessibility policy. Furthermore, all our headlines are published in Welsh and English.
Further information regarding the statistics can be obtained by contacting the relevant staff detailed
on the release or via [email protected].
Comparability and coherence
Where there are changes to the source data provided, this will be shown in the statistical outputs.
Where advance warning is known of future changes these will be pre-announced in accordance
with Welsh Government arrangements.
Data collected from NCCHD adheres to national standards and are coherent within and across
health organisations in Wales.
England has a Healthy Child Programme which is similar scheme to Healthy Child Wales.
Scotland has a Child Health Programme which differs somewhat from the Healthy Child Wales
Programme.
Northern Ireland statistics on public health are available from the Northern Ireland Public Health
Agency and demography statistics from the Northern Ireland Statistics & Research Agency
(NISRA).
34
Well-being of Future Generations Act (WFG)
The Well-being of Future Generations Act 2015 is about improving the social, economic,
environmental and cultural well-being of Wales. The Act puts in place seven well-being goals for
Wales. These are for a more equal, prosperous, resilient, healthier and globally responsible Wales,
with cohesive communities and a vibrant culture and thriving Welsh language. Under section
(10)(1) of the Act, the Welsh Ministers must (a) publish indicators (“national indicators”) that must
be applied for the purpose of measuring progress towards the achievement of the Well-being
goals, and (b) lay a copy of the national indicators before the National Assembly.
Information on the indicators, along with narratives for each of the well-being goals and associated
technical information is available in the Well-being of Wales report.
As a national indicator under the Act they must be referred to in the analyses of local well-being
produced by public services boards when they are analysing the state of economic, social,
environmental and cultural well-being in their areas.
Further information on the Well-being of Future Generations (Wales) Act 2015.
The statistics included in this release could also provide supporting narrative to the national
indicators and be used by public services boards in relation to their local well-being assessments
and local well-being plans.
Further details
The document is available at: https://gov.wales/healthy-child-wales-programme
Next update
June 2020 (provisional)
We want your feedback
We welcome any feedback on any aspect of these statistics which can be provided by email to
Open Government Licence
All content is available under the Open Government Licence v3.0, except where otherwise stated.