Embed Size (px)
Citation preview

Overweight & Obesity Among Chicago Public Schools Students, 2010-11
HEALTHY CHICAGO: TRANSFORMING THE HEALTH OF OUR CITY
1
City of Chicago
City of Chicago
HEALTHY CHICAGOTRANSFORMING THE HEALTH OF OUR CITY
Overweight and Obesity among Chicago Public Schools
Students, 2010-11
February 2013
Barbara Byrd-BennettChief Executive Offi cer
Rahm EmanuelMayor
Bechara Choucair, M.D.Commissioner

Overweight and Obesity Among Chicago Public Schools Students, 2010-11
HEALTHY CHICAGO: TRANSFORMING THE HEALTH OF OUR CITY
1
February 28, 2013
Dear Fellow Chicagoans:
Th e health of our children is paramount to their individual futures and the future of our city. Th at is why the Chicago Department of Public Health and the Chicago Public Schools (CPS) have joined together to develop and launch initiatives to ensure the health of all students in the CPS system. As former U.S. Surgeon General Joycelyn Elders once said, “You can’t educate a child who isn’t healthy, and you can’t keep a child healthy who isn’t educated.” Together, we will help ensure all children in Chicago have an opportunity to be both healthy and well educated.
Part of our work is to gather data and insight into the health of CPS students. Th is report accomplishes this by providing estimates of the prevalence of overweight and obesity among the CPS student population. It represents the most comprehensive description ever available of how the obesity epidemic aff ects children in our city. Our fi ndings are mixed. While more CPS kindergarteners are at a healthy weight than in recent years, the overall proportion of students who are overweight or obese remains unacceptably high.
But more than simply providing data, this report serves as a guide for both public health and education advocates to develop community- and school-based interventions to make options for physical activity and healthy eating more accessible for our students. Together, we can halt the course of the epidemic for the health and well-being of our children and our future. Together we can help make Chicago the healthiest city in our nation.
To fi nd out how you can participate in our eff orts to improve student health or to share your own eff orts, please contact us at [email protected].
Sincerely,
Bechara Choucair, M.D. Commissioner Chicago Department of Public Health
Barbara Byrd-BennettChief Executive Offi cerChicago Public Schools

Overweight and Obesity Among Chicago Public Schools Students, 2010-11
HEALTHY CHICAGO: TRANSFORMING THE HEALTH OF OUR CITY
2
Our assessment found that one in fi ve CPS kindergartners is obese. Th is highlights the importance of obesity preven-tion eff orts being initiated at very young ages, but also sup-ports the conclusion that more young Chicago children are at a healthy weight than in recent years. In studies conducted by the Consortium to Lower Obesity in Chicago Children (CLOCC), the prevalence of obesity in kindergarten-aged students in Chicago was estimated to be 24% in 2003 and 22% in 2008. Th is reduction was among the fi rst evidence of declining childhood obesity rates in large cities. Th e obesity prevalence estimate of 20% in the 2010-11 CPS kindergarten cohort suggests that the downward trend continues in Chi-cago.
Our approach to combating obesity in Chicago mirrors the priorities outlined in a consensus report released by the Institute of Medicine in 2012 that identifi es fi ve critical ar-eas or environments for change: 1) environments for physi-cal activity; 2) food and beverage environments; 3) message environments; 4) health care and work environments; and 5) school environments. Th ese priorities are refl ected in the ac-tivities of the Chicago Department of Public Health (CDPH) and the CPS Offi ce of Student Health and Wellness.
Healthy Chicago is the City’s fi rst-ever comprehensive plan for public health. Obesity prevention is one of the 12 prior-ity areas for action. A major component is Healthy Places, a partnership between CDPH and CLOCC to implement sus-tainable policies and environmental changes to combat obe-sity. Initiatives underway include the expansion of programs that make healthy foods more readily available to residents of all Chicago neighborhoods, the establishment of nutri-tion, physical activity and screen time standards for children in child care settings, and neighborhood assessments to assist in defi ning policies that will make Chicago’s parks easier and safer to access by foot or bike.
As part of Healthy Places, CPS has adopted school meals that meet or exceed the gold standard established by the United States Department of Agriculture. Individual schools are also engaged in meeting the certifi cation requirements of the HealthierUS School Challenge (HUSSC), a key compo-nent of First Lady Michelle Obama’s Let’s Move initiative. HUSSC certifi cation refl ects a school-wide commitment to student wellness through student access to healthy food at school, (including school meals, celebrations and fund rais-ing), nutrition education and physical activity.
EXECUTIVE SUMMARY
Childhood obesity has more than tripled over the past three decades in the United States. Compared to children at a healthy weight, children who are overweight or obese have a higher risk of developing cardiovascular disease, type 2 dia-betes, and other physical and psychological ailments. Th ese factors can decrease life span and impact quality of life. Th e causes of the problem are complex. Obesity is related to an individual’s biology and behaviors, but is also impacted by family and household factors, the surrounding community and institutions, and society in general.
Th is report provides estimates of the prevalence of over-weight and obesity in the Chicago Public Schools (CPS) student population. Not only does this help us understand where we stand when it comes to obesity, but also serves in developing community- and school-based interventions to combat the epidemic. Studies conducted over the past decade have shown that Chicago youths are deeply aff ected by the obesity epidemic, and the results of this analysis validate those fi ndings.
CPS estimates that its student population is made up of 87% low-income households, with a race-ethnicity composi-tion of approximately 45% Hispanic and 42% non-Hispanic black students. We assessed over 88,000 de-identifi ed student physical exam records of students enrolled in kindergarten, sixth grade, and ninth grade in the 2010-11 school year. Th e overall prevalence of obesity for the three grades was 25%. Obesity prevalence was higher in sixth graders (29%) and ninth graders (25%) than in kindergartners (20%).
Th ese estimates are higher than national averages for sim-ilarly-aged youths. However, there is substantial variation across the school district. Consistent with national trends, at all three grade-levels the prevalence of obesity in Hispanic and non-Hispanic black students was higher than in non-Hispanic whites and non-Hispanic Asian or Pacifi c Islanders. By community area, rates were as low as 13% in students residing in Lincoln Park (home to a predominantly white, higher-income population) and as high as 33% in those living in South Lawndale (a predominantly Hispanic, lower-income population).

Overweight and Obesity Among Chicago Public Schools Students, 2010-11
HEALTHY CHICAGO: TRANSFORMING THE HEALTH OF OUR CITY
3
BACKGROUND
Childhood obesity has more than tripled over the past three decades in the United States. Compared to those at a healthy weight, children with excess body fat have a higher risk of developing cardiovascular disease, type 2 diabetes, and other physical and psychological ailments that decrease qual-ity of life and shorten life span. Nationally 30% of all chil-dren and adolescents are overweight or obese. Th e prevalence of obesity among youth is 17%, accounting for 12.5 million individuals, with rates varying across age groups, gender, in-come levels, and race-ethnicities.1 For example, among ado-lescent boys, the prevalence of obesity is signifi cantly higher in Mexican-Americans (27%) than in non-Hispanic whites (17%). Among adolescent girls, non-Hispanic blacks have an obesity prevalence nearly double that of non-Hispanic whites (29% vs. 15%, respectively).2 Both white and black youths living in poverty are at higher risk of obesity than children of the same age, gender and race from higher-income house-holds.3
Studies conducted over the past decade suggest that Chi-cago children are deeply aff ected by the obesity epidemic. A review of the school physical exam records of students aged 3-5 years in 2002-03 revealed an estimated obesity prevalence of 24%, more than double the national estimate at the time for similarly-aged children.4 Around the same period, a door-to-door health survey undertaken in six Chicago community areas found that 56% of the 2-12 year olds in Roseland were obese, with prevalence estimates of 48%, 46%, 42%, and 34% in Humboldt Park, North Lawndale, West Town, and South Lawndale, respectively. “To our knowledge,” the inves-tigators concluded, “such elevated proportions of pediatric obesity have never before been documented.”5 More recently, a 2008 study found obesity prevalence in Chicago sixth grad-ers to be at 28%, about nine percentage points higher than the national estimate for similarly-aged children.6
While public health monitoring systems have long been in place to understand and inform interventions in response to acute disease emergencies, childhood body mass index (BMI) surveillance is not as well-established. Data on the percent-age of students who are overweight or obese in a school dis-trict can be useful for program and policy planning, advocacy eff orts, and evaluation.7 In 2003, Arkansas became the fi rst state to mandate BMI screening of public school students. Several states select a sample from particular grades, schools or districts for screening, or measure students as part of phys-ical education classes. For example, California collects data
on all students in the fi fth, seventh, and ninth grades using a series of fi tness tests that measure aerobic capacity, body composition, and muscular strength. As of 2010, approxi-mately 30 states had proposed or enacted BMI surveillance regulations or laws, and about two-thirds were implement-ing them.8 New York City’s Department of Education initi-ated the annual BMI measurement of public school students in kindergarten through twelfth grade as part of its physical education programming, and has collaborated with the lo-cal department of public health in analyses and interventions for the past several years.9 Eff ective in 2005, Illinois Public Act 093-0966 authorizes the Illinois Department of Public Health to collect and analyze BMI data from schools, but at present, a surveillance system has not been established.10
In recognition of the need for aggressive intervention to combat obesity in Chicago, Chicago Public Schools (CPS) and the Chicago Department of Public Health (CDPH) have entered into a fi ve-year intergovernmental agreement begin-ning in 2011 to develop community- and school-based in-terventions that are informed by ongoing analyses of student health data. Under this agreement CPS and CDPH have shared data, conducted analyses, and convened to interpret fi ndings and develop complementary interventions. Th is brief report establishes baseline prevalence estimates for over-weight and obesity by demographic group and community area, and highlights the interventions that CPS, CDPH, and community partners have launched in response.
APPROACH
A detailed description of materials and methods is pro-vided in Appendix 1. To establish the estimates, we used de-identifi ed student physical exam information. Th is informa-tion is recorded by healthcare providers on paper forms that students then submit to their schools. Subsequently, the data are entered by staff at each school into IMPACT SIM, a web-based student information management system operated and maintained by CPS. BMI calculation in children and ado-lescents requires all of the following data: date of birth, sex, height, weight, and date of measurement. Using the defi ni-tions of the United States Centers for Disease Control and Prevention (CDC), obesity is defi ned in youths as BMI equal to or greater than the 95th percentile on the sex-specifi c CDC BMI-for-age growth charts; between the 85th and 95th per-centiles, an individual is classifi ed as overweight. In this re-port, “overweight or obese” refers to BMI equal to or greater than the 85th percentile.

Overweight and Obesity Among Chicago Public Schools Students, 2010-11
HEALTHY CHICAGO: TRANSFORMING THE HEALTH OF OUR CITY
4
Overweight or Obesity
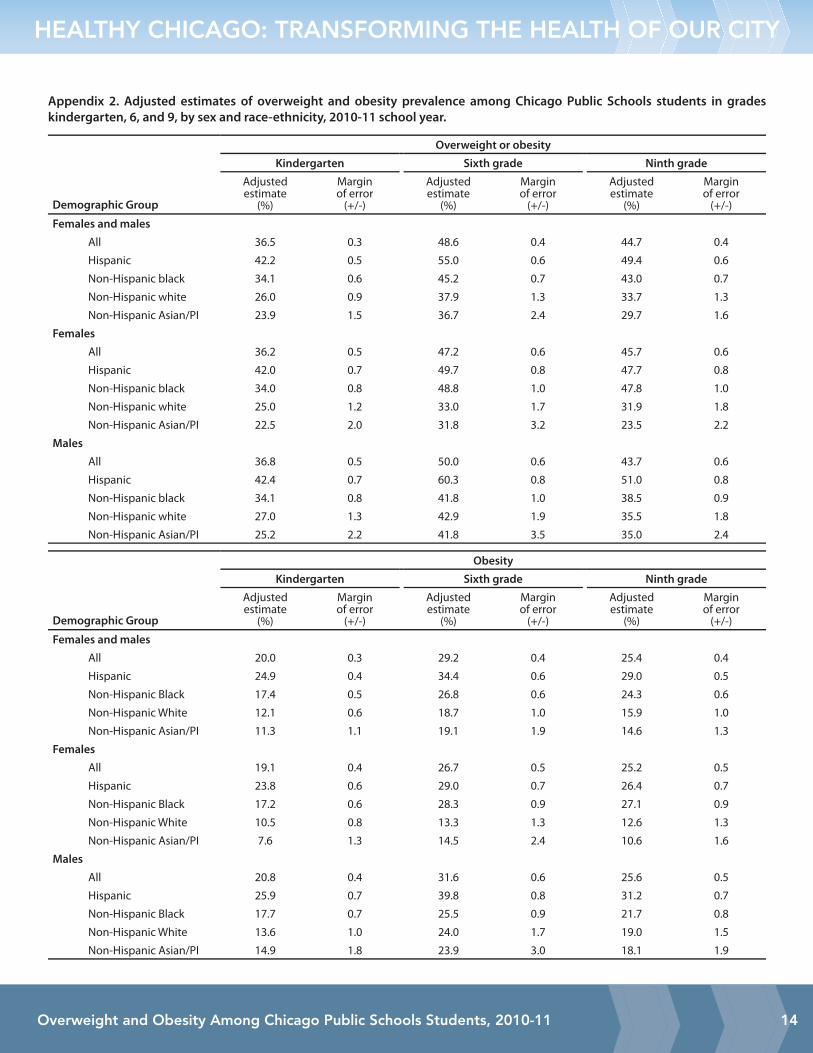
Th e overall prevalence of overweight or obesity for these three grade levels was 43.3%. Consistent with childhood growth patterns and trends seen in national data, overweight or obesity prevalence was higher among sixth graders (48.6%) and ninth graders (44.7%) than in kindergartners (36.5%). Among demographic subgroups, overweight or obesity preva-lence estimates varied substantially across each grade, sex, and race-ethnicity category (Figure 1 and Appendix 2). For exam-ple, 60.3% of Hispanic male sixth graders were overweight or obese while 22.5% of non-Hispanic Asian or Pacifi c Islander female kindergartners were overweight or obese. An analysis of overweight or obesity prevalence by community area of res-idence also revealed disparities, with estimates ranging from 21.4% in Edison Park to 52.3% in South Lawndale (Figure 2 and Appendix 3).
Th e analysis was based on records of CPS students enrolled in kindergarten, sixth grade, or ninth grade in the 2010-11 school year for whom recent, valid, and complete height and weight measurements were available. To account for the po-tential unequal representation of demographic subgroups in the set of analyzed records, statistical adjustments were made. Th e percentages in this report refl ect adjusted, or “weighted,” estimates.
FINDINGS
Th e records of 88,527 students in kindergarten, sixth grade, and ninth grade from 672 traditional and charter schools were included in the assessment. Roughly 44% were identifi ed as Hispanic, 42% as non-Hispanic black, 9% as non-Hispanic white, and 3% as non-Hispanic Asian or Pa-cifi c Islander. Recent, valid, and complete height and weight measurements were available for 59,794 (67.5%) records.
Figure 1. Adjusted estimates of overweight or obesity prevalence among Chicago Public Schools students in grades
kindergarten, 6, and 9, by sex and race-ethnicity, 2010-11 school year. Orange bars denote 95% confi dence limits (i.e., the
margin of error associated with each estimate).
Kindergarten Sixth grade Ninth grade
23.9
26.0
34.1
42.2
36.5
22.5
25.0
34.0
42.0
36.2
25.2
27.0
34.1
42.4
36.8
0 10 20 30 40 50 60 70
36.7
37.9
45.2
55.0
48.6
31.8
33.0
48.8
49.2
47.2
41.8
42.9
41.8
60.3
50.0
0 10 20 30 40 50 60 70
29.7
33.7
43.0
49.4
44.7
23.5
31.9
47.8
47.7
45.7
35.0
35.5
38.6
51.0
43.7
0 10 20 30 40 50 60 70
Non-Hispanic Asian
Non-Hispanic White
Non-Hispanic Black
Hispanic
All
Non-Hispanic Asian
Non-Hispanic White
Non-Hispanic Black
Hispanic
All
Non-Hispanic Asian
Non-Hispanic White
Non-Hispanic Black
Hispanic
All
Females and males
Females
Males
*
*
*
*Includes Pacifi c Islanders.

Overweight and Obesity Among Chicago Public Schools Students, 2010-11
HEALTHY CHICAGO: TRANSFORMING THE HEALTH OF OUR CITY
5
Figure 2. Estimates of overweight or obesity prevalence among Chicago Public Schools students in grades kindergarten, 6,
and 9, adjusted for non-response and standardized to District-wide grade-level enrollment proportions, by community area
of residence, 2010-11 school year.
76
51
25
28
2
55
7
6
70
61
49
30
24
10
8
56
4
15
19
71
17
3
23
22
69
54
66
46
75
516
29
12
72
67 68
52
44
6543
31
1
58
74
64
1311
63
50
60
42
57
21
27
14
9
33
48
38
77
32
35
4140
59
26
45
62
20
39
18
53
73
34
37
47
36
Less than 33
33 - 39
40 - 46
47 - 53
Community Areas
1 Rogers Park 40 Washington Park
2 West Ridge 41 Hyde Park
3 Uptown 42 Woodlawn
4 Lincoln Square 43 South Shore
5 North Center 44 Chatham
6 Lake View 45 Avalon Park
7 Lincoln Park 46 South Chicago
8 Near North Side 47 Burnside
9 Edison Park 48 Calumet Heights
10 Norwood Park 49 Roseland
11 Jeff erson Park 50 Pullman
12 Forest Glen 51 South Deering
13 North Park 52 East Side
14 Albany Park 53 West Pullman
15 Portage Park 54 Riverdale
16 Irving Park 55 Hedgewisch
17 Dunning 56 Garfi eld Ridge
18 Montclaire 57 Archer Heights
19 Belmont Cragin 58 Brighton Park
20 Hermosa 59 McKinley Park
21 Avondale 60 Bridgeport
22 Logan Square 61 New City
23 Humboldt Park 62 West Elsdon
24 West Town 63 Gage Park
25 Austin 64 Clearing
26 West Garfi eld Park 65 West Lawn
27 East Garfi eld Park 66 Chicago Lawn
28 Near West Side 67 West Englewood
29 North Lawndale 68 Englewood
30 South Lawndale 69 Greater Grand Crossing
31 Lower West Side 70 Ashburn
32 Loop 71 Auburn Gresham
33 Near South Side 72 Beverly
34 Armour Square 73 Washington Heights
35 Douglas 74 Mount Greenwood
36 Oakland 75 Morgan Park
37 Fuller Park 76 O'Hare
38 Grand Boulevard 77 Edgewater
39 Kenwood
Overweight or obesityprevalence estimate (%)
Less than 33
33 - 39
40 - 46
47 - 53

Overweight and Obesity Among Chicago Public Schools Students, 2010-11
HEALTHY CHICAGO: TRANSFORMING THE HEALTH OF OUR CITY
6
Obesity
Th e overall prevalence of obesity for the three grades was 24.9%. Obesity prevalence was higher in sixth graders (29.2%) and ninth graders (25.4%) than in kindergartners (20.0%). By demographic subgroup, estimates ranged from 7.6% of non-Hispanic Asian or Pacifi c Islander female kin-dergartners to 39.8% of Hispanic male sixth graders (Figure 3 and Appendix 2). By community area, obesity estimates were as low as 12.7% in Lincoln Park and as high as 32.9% in South Lawndale (Figure 4 and Appendix 3).
CONCLUSIONS
One in four CPS kindergartners, sixth graders, and ninth graders is obese. Although there are no published national obesity estimates that directly correspond to the age groups that compose these grade levels, our fi ndings verify that CPS students are deeply aff ected by the obesity epidemic. Accord-ing to the 2009-10 National Health and Nutrition Examina-tion Survey (NHANES), 12.1% of 2-5 year olds are obese (compared to 20.0% of CPS kindergartners), 18.0% of 6-11
year olds are obese (compared to 29.2% of CPS sixth grad-ers), and 18.4% of 12-19 year olds are obese (compared to 25.4% of CPS ninth graders).10 Th ese discrepancies are ex-plained in part by the fact that the attributes that place a child or adolescent at high risk for obesity, such as coming from a low-income household or being Hispanic or African-Ameri-can, are prevalent in the CPS student population. Stratifi ed by age and race-ethnicity, the NHANES data mirror the pat-terns identifi ed in CPS.
Th e importance of obesity prevention at very young ages is underscored by the fact that one in fi ve kindergartners begins his or her CPS career obese. Despite the fi nding that CPS kindergartners’ obesity rate continues to exceed national esti-mates, the 20% estimate obtained for the 2010-11 cohort is lower than what was found in 2003 (24%) and 2008 (22%).6
Th is is consistent with a national trend showing that the prev-alence of obesity appears to have stabilized nationally among preschool and school-aged children.9 However, the 29.2% estimate obtained for 2010-11 sixth graders is slightly higher than the 2008 estimate of 28% for Chicago sixth graders.6
Figure 3. Adjusted estimates of obesity prevalence among Chicago Public Schools students in grades kindergarten, 6, and 9,
by sex and race-ethnicity, 2010-11 school year. Orange bars denote 95% confi dence limits (i.e., the margin of error associated
with each estimate).
Kindergarten Sixth grade Ninth grade
11.3
12.1
17.4
24.9
20
7.6
10.5
17.2
23.8
19.1
14.9
13.6
17.7
25.9
20.8
0 10 20 30 40 50
19.1
18.7
26.8
34.4
29.2
14.5
13.3
28.3
29
26.7
23.9
24
25.5
39.8
31.6
0 10 20 30 40 50
14.6
15.9
24.3
29
25.4
10.6
12.6
27.1
26.4
25.2
18.1
19
21.7
31.2
25.6
0 10 20 30 40 50
Non-Hispanic Asian
Non-Hispanic White
Non-Hispanic Black
Hispanic
All
Non-Hispanic Asian
Non-Hispanic White
Non-Hispanic Black
Hispanic
All
Non-Hispanic Asian
Non-Hispanic White
Non-Hispanic Black
Hispanic
All
Females and males
Females
Males
*
*
*
*Includes Pacifi c Islanders.

Overweight and Obesity Among Chicago Public Schools Students, 2010-11
HEALTHY CHICAGO: TRANSFORMING THE HEALTH OF OUR CITY
7
76
51
25
28
2
55
7
6
70
61
49
30
24
10
8
56
4
15
19
71
17
3
23
22
69
54
66
46
75
516
29
12
72
67 68
52
44
6543
31
1
58
74
64
1311
63
50
60
42
57
21
27
14
9
33
48
38
77
32
35
4140
59
26
45
62
20
39
18
53
73
34
37
47
36
12 - 16
17 - 21
22 - 26
27 - 33
Insufficient data
Figure 4. Estimates of obesity prevalence among Chicago Public Schools students in grades kindergarten, 6, and 9, adjusted for
non-response and standardized to District-wide grade-level enrollment proportions, by community area of residence, 2010-11
school year.
Community Areas
1 Rogers Park 40 Washington Park
2 West Ridge 41 Hyde Park
3 Uptown 42 Woodlawn
4 Lincoln Square 43 South Shore
5 North Center 44 Chatham
6 Lake View 45 Avalon Park
7 Lincoln Park 46 South Chicago
8 Near North Side 47 Burnside
9 Edison Park 48 Calumet Heights
10 Norwood Park 49 Roseland
11 Jeff erson Park 50 Pullman
12 Forest Glen 51 South Deering
13 North Park 52 East Side
14 Albany Park 53 West Pullman
15 Portage Park 54 Riverdale
16 Irving Park 55 Hedgewisch
17 Dunning 56 Garfi eld Ridge
18 Montclaire 57 Archer Heights
19 Belmont Cragin 58 Brighton Park
20 Hermosa 59 McKinley Park
21 Avondale 60 Bridgeport
22 Logan Square 61 New City
23 Humboldt Park 62 West Elsdon
24 West Town 63 Gage Park
25 Austin 64 Clearing
26 West Garfi eld Park 65 West Lawn
27 East Garfi eld Park 66 Chicago Lawn
28 Near West Side 67 West Englewood
29 North Lawndale 68 Englewood
30 South Lawndale 69 Greater Grand Crossing
31 Lower West Side 70 Ashburn
32 Loop 71 Auburn Gresham
33 Near South Side 72 Beverly
34 Armour Square 73 Washington Heights
35 Douglas 74 Mount Greenwood
36 Oakland 75 Morgan Park
37 Fuller Park 76 O'Hare
38 Grand Boulevard 77 Edgewater
39 Kenwood
Obesityprevalence estimate (%)
12 -16
17 - 21
22 - 26
27 - 33
Insuffi cient data

Overweight and Obesity Among Chicago Public Schools Students, 2010-11
HEALTHY CHICAGO: TRANSFORMING THE HEALTH OF OUR CITY
8
• Child care standards were issued by the Chicago Board of Health providing guidance for nutrition, physical activity and screen time for children in child care set-tings. Th e standards have been imposed by the Chicago Department of Family and Support Services on all of its Head Start, Early Head Start and child care centers, which impact more than 20,000 Chicago children.
• In collaboration with the Chicago Department of Hous-ing and Economic Development, CDPH is support-ing the launch of an entrepreneurial venture to fund Healthy Produce Carts as a means to increase the avail-ability of fruits and vegetables to Chicago communities, including those with limited access to fresh produce.
• Th e City received commitments from grocers to make available fresh fruit and vegetables in 18 new stores and 18 retrofi tted stores located in low-access areas by 2014. Also, fi ve new farmers markets opened in June, 2012 in West side neighborhoods that have limited grocery options. Th e farmers markets are a result of partner-ships between the City of Chicago and several organiza-tions, including Kraft Foods and Safeway Foundation, each donating $75,000 to cover the costs of opening and maintaining the markets for the next fi ve years. Th e markets will accept LINK cards and provide access to fresh and healthy foods.
• With Blue Cross and Blue Shield support, CDPH be-gan implementing PlayStreets in neighborhoods across the City in August, 2012. Th e goal of PlayStreets is to promote health and wellness by increasing access to safe play spaces for children and adults in Chicago, and re-place sedentary activity with play and physical activity.
Healthy CPS
Th e Healthy CPS agenda parallels CDPH’s Healthy Chi-cago, and is spearheaded by the CPS Offi ce of Student Health and Wellness (OSHW). Th e newly-created Chief Health Of-fi cer position directs OSHW, reports to both the CPS and CDPH administrations, and is tasked with developing and implementing Healthy CPS and removing health-related bar-riers for learning by advancing health promotion, health edu-cation, health policy and direct services in CPS.
OSHW has initiated a variety of high-impact policy, sys-tems and environmental change strategies that build school capacity to positively infl uence their wellness environments.
INTERVENTIONS
Th e results from this assessment establish baselines for obe-sity prevention and control initiatives that CPS, CDPH and their partners have launched in response to the obesity epi-demic. Th e fi ndings and supplemental analyses will inform decisions about needs, assets, and resource allocation in rela-tion to both school networks and Chicago neighborhoods. In a consensus report released by the Institute of Medicine (IOM) in 2012, an expert committee reviewed almost 800 previously published recommendations and strategies related to obesity prevention and identifi ed fi ve critical areas or envi-ronments for change: 1) environments for physical activity; 2) food and beverage environments; 3) message environments; 4) health care and work environments; and 5) school environ-ments.12 Th e IOM’s emphasis on policies and environments is refl ected in the establishment of CDPH’s Healthy Chicagopublic health agenda, the Healthy CPS agenda and Offi ce of Student Health and Wellness activities, and CDPH’s Healthy Places partnership with the Consortium to Lower Obesity in Chicago Children (CLOCC).
Healthy Chicago
Released in August 2011, Healthy Chicago is the fi rst-ever comprehensive plan for public health put forth by the City.13 Mayor Emanuel originally called for the formation of an agenda in his transition report and Healthy Chicago now serves as a blueprint for a focused approach by CDPH to im-plement policies and system changes to transform the health of the city over the next fi ve years. Obesity prevention is one of the 12 prioritized activities of the Department, and a major component is Healthy Places, a partnership between CDPH and CLOCC to implement sustainable policies and environ-mental changes to combat obesity.14 Over the past year,
• Th e Chicago Park District unveiled a new vending policy, requiring Park District vending machines to be stocked with healthy snacks. Th e new nutritional stan-dards include limitations on calories, sodium, fat and sugar per serving. In addition, the City recently imple-mented a contract that will provide healthier vending options in all machines in City-owned or operated buildings.
• Th e Chicago City Council passed an ordinance in Sep-tember 2011 amending the Chicago Zoning Code to more clearly defi ne and regulate urban agriculture uses.

Overweight and Obesity Among Chicago Public Schools Students, 2010-11
HEALTHY CHICAGO: TRANSFORMING THE HEALTH OF OUR CITY
9
CPS has demonstrated its commitment to promoting stu-dent health through promotion of the United States Depart-ment of Agriculture’s (USDA) HealthierUS School Challenge (HUSSC), rigorous policy creation and implementation, stu-dent engagement programming, support for physical activity and physical education (PE), and resource allocation among schools.
CPS has a history of supporting student health and well-ness, as evidenced by a healthy vending policy passed in 2004, a Local School Wellness Policy regarding nutrition and physi-cal activity in 2006, and more recently, the adoption of school meals that meet or exceed the gold standard established by the USDA. In an eff ort to support the district’s ongoing commit-ment to student health, CPS has undertaken eff orts to assist schools in becoming certifi ed for the HUSSC, a key compo-nent of First Lady Michelle Obama’s Let’s Move initiative.15
HUSSC certifi cation refl ects a school-wide commitment to student wellness through student access to healthy food at school (including school meals, celebrations and fundrais-ing), nutrition education and physical activity. By December 2012, 70 schools were certifi ed for the HUSSC, with an ad-ditional 75 pending approval by the USDA (Figure 5).
Th e HUSSC serves as an implementation strategy to help schools meet the new policies targeting obesity prevention and health and wellness promotion. In October 2012, the Chicago Board of Education (CBOE) passed an updated Lo-cal School Wellness Policy that requires the establishment of School Wellness Teams at all schools, ensures health-optimiz-ing PE programming, prohibits the use of food or physical ac-tivity (e.g., participation in recess) as a reward or punishment, and requires recess in all elementary schools.
In November 2012, the CBOE approved the Healthy Snack and Beverage Policy intended to ensure that any snack or drink available to students throughout the school day is of high nutritional value (not including the school meals program, which is addressed by the Local School Wellness Policy). Th is policy requires all foods and beverages sold out-side federally reimbursable meals meet rigorous nutrition standards. Th e policy strengthens the district’s previous vend-ing machine standards, encourages schools to adopt healthy school fundraisers and promote healthy celebrations, and prohibits distributing food as a reward or withholding it as a punishment. Th e policy also prohibits the sale of unhealthy food items by independent vendors on school property.
Collaboration for eff ective policy implementation with community partners is crucial due to limited capacity, ex-pertise, and funding at the school level. Th erefore, OSHW has developed a process for vetting community partners that provide health-related programming to schools. Th is process is necessary to ensure that health programming is aligned to new policy guidelines, research-based, equitably distributed, and targeted to student needs. Th e partner vetting process is being undertaken in conjunction with the HUSSC appli-cation process to ensure schools have access to high quality resources promoting healthful environments where students can excel academically. Th e new vetting process will include curriculum review and allow CPS to facilitate partnerships between schools with the greatest need for wellness program-ming and partners who are qualifi ed and eager to provide it.
In addition, OSHW is working to increase the quality and quantity of PE students receive to ensure that all students have access to health-optimizing PE. Specifi cally, OSHW is working with a group of highly qualifi ed PE teachers (called the PE Leadership Team) to develop a scope and sequence, curriculum, assessments, and ongoing professional develop-ment for PE teachers. Th e collaboration between OSHW and the PE Leadership Team will help guide initiatives to improve and build upon the PE program in CPS.
Finally, in 2013, under a new federal grant, CPS and its partners will implement several additional policy, systems and environmental strategies designed to further improve the health of all CPS students.
NEXT STEPS
Th is report is an initial overview of the CPS-CDPH col-laborative approach to reverse the trajectory of the obesity epidemic in Chicago youth. Th e prevalence estimates pre-sented are expected to provide evidence for the design and implementation of interventions that positively alter policies and environments in schools, neighborhoods, and the City as a whole. Over the next fi ve years, CPS and CDPH plan to repeat the assessment annually, and to use the fi ndings to evaluate initiatives, as well as better understand patterns and trends. Topics under consideration for future analyses include the relationship between obesity and environments (e.g., park or grocery store accessibility, neighborhood safety) and the impact of school- and community-based wellness interven-tions and policies.

Overweight and Obesity Among Chicago Public Schools Students, 2010-11
HEALTHY CHICAGO: TRANSFORMING THE HEALTH OF OUR CITY
10
Figure 5. U.S. Department of Agriculture HealthierUS School Challenge Certifi cation as of December 2012 with prevalence of
overweight or obesity among Chicago Public Schools Students in grades kindergarten, 6, and 9, adjusted for non-response and
standardized to District-wide grade-level enrollment proportions, by community area of residence.
Gold Bronze1 Air Force Academy 61 Gale2 Armour 62 Hawthorne3 Bronzeville Lighthouse 63 Hitch4 Burroughs 64 Jackson5 Canter 65 LaSalle6 Chopin 66 Lincoln7 Coleman 67 Poe8 Cuff e 68 Skinner North9 De Diego 69 Stone
10 Duprey 70 Wildwood11 Earle Pending12 Global Citizenship Charter* 71 Addams13 Greene 72 Agassiz14 Hammond 73 Armstrong, G.15 Henson 74 Avalon Park16 Johnson 75 Barton17 Madero 76 Bateman18 McCormick 77 Beilder19 Morton 78 Belding20 Namaste* 79 Belmont-Cragin21 Passages 80 Bond22 Perez 81 Boone23 Pulaski 82 Brentano24 Robinson 83 Burbank25 Ruiz 84 Burke26 Songhai 85 Burnham27 Tanner 86 Camras28 Taylor 87 Cardenas29 Walsh 88 Chappell
Silver 89 Chase30 Ashburn 90 Claremont31 Black 91 Dawes32 Bradwell 92 DePriest33 Calmeca 93 Disney II34 Chalmers 94 DuBois35 Daley 95 Edison Park36 Darwin 96 Evers37 Davis 97 Farnsworth Pending38 Drake 98 Fenger 122 Ortiz De Dominguez39 Eli Whitney 99 Foster Park 123 Parker, F.40 Everett 100 Fulton 124 Peirce41 Gregory 101 Galileo 125 Pilsen42 Haines 102 Gary 126 Prescott43 Henry 103 Graham Training Center 127 Reavis44 Higgins 104 Gunsaulus 128 Reilly45 Jahn 105 Hamilton 129 Richards46 Libby 106 Hay 130 Rickover47 McAuliff e 107 Healy 131 Schmid48 Nightingale 108 Hoyne 132 Senn49 Pasteur 109 Juarez HS 133 Sheridan50 Peabody 110 Kellman 134 Shields51 Peterson 111 Kohn 135 Smyser52 Sherman 112 Lake View 136 Solomon53 Smith 113 Lavizzo 137 Steinmetz HS54 South Loop 114 Lindblom HS 138 Sullivan55 Stevenson 115 Lorca 139 Talcott56 Tonti 116 Lozano 140 Turner-Drew57 Washington, W. 117 Mather 141 Uplift58 White 118 McDowell 142 Ward
Bronze 119 Mollison 143 Wells Prep59 Burr 120 New Field 144 Williams ES60 Coonley 121 Newberry 145 Woods
*With distinction.
!(!(
!(!(
!(
!(
!(
!(
!(!(
!(
!(
!(
!(
!( !(
!(!(
!(
!(
!(
!(
!(
!(
!(
!(
!(
!(
!(
!(
!(
!(
!(
!(
!(
!(
!(
!(!(
!(
!(
!(
!(
!(
!(
!(
!(
!(
!(
!(
!(
!(
!(
!(
!(
!(
!(
!(
!(
!(
!(
!(
!(
!(
!(
!(
!(
!(
!(
!(
")
")
")
")")
")
")
")
")
")
")
")
")
")
")
")
")
")
")
")
")
")
")
")
")
")
")
")
")
")
")
")
")
")
")
")
")
")
")
")
")
")
")
")
")
")
")
")
")
")
")
")
")
")
")
")
")
")
")
")
")
")
")
")
")
")
")
")
")
")
")
")
")
")
")
12
3
4
5
6
7
8
910
11
12
13
14
15 16
17
18
19
20
21
22
23
24
25
26
27
28
29
30
31
32
33
34
35
36
37
3839
40
41
42
43
44
45
46
47
48
49
50
51
52
53
54
55
56
57
58
59
60
61
62
63
64
65
66
67
68
69
70
71
72
73
7475
76
77
78
79
80
81
82
83
84
85
86
87
88
89
90
91
92
93
94
95
96
97
98
99
100
101
102
103
104
105
106
107
108
109
110
111
112
113
114
115
116
117
118
119
120
121
122
123
124
125
126
127
128
129
130
131
132
133
134
135
136
137
138
139
140
141
142
143
144
145
Less than 33
33 - 39
40 - 46
47 - 53
!( Gold
!( Silver
!( Bronze
") Pending
Overweight or obesity prevalence estimate (%)
Certifi cation
Less than 33
33 - 39
40 - 46
47 - 53
Gold
Silver
Bronze
Pending
Overweight and Obesity Among Chicago Public Schools Students, 2010-11
HEALTHY CHICAGO: TRANSFORMING THE HEALTH OF OUR CITY
11
REPORTED BY
Roderick C. Jones, MPH, Julie Morita, MD, Enrique Ramirez, Kirsti A. Bocskay, PhD, MPH, Azmina Lakhani, Chicago De-partment of Public Health; Annie Lionberger, MPP, Blair C. Harvey-Gintoft, MSW, Stephanie Whyte, MD, MBA, Chicago Public Schools.
SUGGESTED CITATION
Jones RC, Morita J, Ramirez E, Bocskay KA, Lakhani A, Lionberger A, Harvey-Gintoft BC, Whyte S. Overweight and Obesity among Chicago Public Schools Students, 2010-11. City of Chicago, 2013.
ACKNOWLEDGMENTS
For their contributions to the preparation of this report, CDPH and CPS thank Maryann Mason, PhD and Soyang Kwon, PhD, CLOCC; Richard T. Campbell, PhD, University of Illinois-Chicago School of Public Health; Craig Conover, MD, MPH and Tiefu Shen, MD, PhD, Illinois Department of Public Health; Christine Daman, MS, SAS Institute; Erica Salem, MPH, Shamika Smith, MPH, CDPH; the CDPH Epidemiology Advisory Group; and Amy Nowell.
REFERENCES
1. Ogden CL, Carroll MD, Kit BK, Flegal KM. Prevalence of obesity in the United States, 2009–2010. NCHS data brief, no 82. Hyattsville, MD: National Center for Health Statistics. 2012. http://www.cdc.gov/nchs/data/databriefs/db82.pdf. Accessed February 27, 2013.
2. Ogden CL, Carroll MD, Curtin LR, Lamb MM, Flegal KM. Prevalence of high body mass index in U.S. children and adolescents, 2007-2008. JAMA 303(3):242-9. 2010. http://jama.jamanetwork.com/article.aspx?articleid=185233. Accessed February 27, 2013.
3. Ogden CL, Lamb MM, Carroll MD, Flegal, KM. Obesity and socioeconomic status in children: United States 1988–1994 and 2005–2008. NCHS data brief no 51. Hyattsville, MD: National Center for Health Statistics. 2010. http://www.cdc.gov/nchs/data/databriefs/db51.pdf. Accessed February 27, 2013.
4. Mason M, Meleedy-Rey P, Christoff el KC, Longjohn M, Garcia MP, Ashlaw C. Prevalence of Overweight and Risk of Overweight Among 3- to 5-Year-Old Chicago Children, 2002-2003. J School Health. 2006;76(3):104-110.
5. Margellos-Anast H, Shah AM, Whitman S. Prevalence of Obesity Among Children in Six Chicago Communities: Findings from a Health Survey. Public Health Rep. 2008;123:117-125. http://www.suhichicago.org/fi les/publications/PHR_child_obesity.pdf. Accessed February 27, 2013.
6. Consortium to Lower Obesity in Chicago Children. Data show rates of obesity for Chicago children at school entry fell from 2003 to 2008 while still double the national average [Press release]. 2010. http://www.clocc.net/news/CLOCC_Data_R_FINAL.pdf. Accessed February 27, 2013.
7. Centers for Disease Control and Prevention.School Health Guidelines to Promote Healthy Eating and Physical Activity. MMWR Morb Mortal Wkly Rep.2011;60(5):1-76. http://www.cdc.gov/mmwr/pdf/rr/rr6005.pdf. Accessed February 27, 2013.
8. Longjohn M, Sheon AR, Card-Higginson P, Nader PR, Mason M. Learning from State Surveillance of Childhood Obesity. Health Aff airs. 2010;29(3):463-472.
9. Centers for Disease Control and Prevention. Obesity in K-8 Students — New York City, 2006-07 to 2010-11 School Years. MMWR Morb Mortal Wkly Rep.2009;60(49):1673-1678. http://www.cdc.gov/mmwr/pdf/wk/mm6049.pdf. Accessed February 27, 2013.
10. Illinois General Assembly. Public Act 093-0966. http://www.ilga.gov/legislation/publicacts/fulltext.asp?Name=093-0966. Accessed February 27, 2013.
11. Ogden CL, Carroll MD, Kit BK, Flegal KM. Prevalence of Obesity and Trends in Body Mass Index Among US Children and Adolescents, 1999-2010. JAMA. 2012;307(5):483-490. http://jama.jamanetwork.com/pdfaccess.ashx?ResourceID=2500472&PDFSource=13. Accessed February 27, 2013.
12. Glickman D, Parker L, Sim LJ, Cook HDV, Miller EA, editors. Accelerating Progress on Obesity Prevention: Solving the Weight of the Nation. Institute of Medicine Consensus Report. National Academies Press;2012. http://iom.edu/Reports/2012/Accelerating-Progress-in-Obesity-Prevention.aspx. Accessed February 27, 2013.
13. Chicago Department of Public Health. Healthy Chicago: Transforming the Health of Our City. http://www.cityofchicago.org/content/city/en/depts/cdph/provdrs/healthychicago.html. Accessed February 27, 2013.
14. Chicago Department of Public Health and Consortium to Lower Obesity in Chicago Children. Healthy Places, an initiative of Healthy Chicago. http://www.healthyplaceschicago.org/. Accessed February 27, 2013.
15. Chicago Public Schools and Healthy Schools Campaign. Go for the Gold in Food and Fitness! http://www.goforthegoldcps.org. Accessed February 27, 2013.

Overweight and Obesity Among Chicago Public Schools Students, 2010-11
HEALTHY CHICAGO: TRANSFORMING THE HEALTH OF OUR CITY
12
APPENDIX 1: MATERIALS AND METHODS
DATA SOURCE
Th e source of the data elements is the Illinois Child Health Examination form.1 CPS requires that this form be completed and turned in by October 15 of the school year for students:
• Entering preschool and kindergarten up to age 6 (physi-cal exam and lead screen)
• Entering the State of Illinois for the fi rst time at any grade level
• Entering kindergarten, sixth grade, or ninth grade (ages 5, 11, and 15 for ungraded programs).2
Information from paper forms are entered by staff (e.g., nurses, clerical staff ) at each school into IMPACT SIM, a web-based student information management system oper-ated and maintained by CPS.3 Although heights and weight are expected to be measured by a healthcare professional, equipment and methods (e.g., removal of shoes or clothing, use of self-reported information) are not standardized across the student population. Th e physical exam form is signed by a healthcare provider, but students or their family members participate in the completion of it, and are in possession of it prior to submitting it to the school.
DATA REVIEW AND PREPARATION FOR ANALYSIS
Use of IMPACT SIM across CPS was standard practice at the time these data were compiled. However, IMPACT SIM did not have a mechanism to prevent the entry of erroneous or inconsistent data, and audits and corrections of data from the physical exam unrelated to vaccination are not systematic. For example, although there are two distinct data elements for height in feet and height in inches, entry errors include the reversing of feet and inches (e.g., 10’4”) and centimeter measurements. (e.g., “181 cm”). Th ese errors were corrected in the analysis dataset, and recommendations were provided about enhancing the standardization of collection of these data elements in IMPACT SIM. Record completeness var-ied by school. Certain schools were under-represented in the analyses.
Th e age of the student at the time of measurement was calculated in months and used in calculations as a number with four decimal places. An alternative method is to count only the months of life completed at the time of measure-ment (i.e., a whole number that would almost always be less than the number with four decimal places). Use of the al-ternative methodology would in most cases result in slightly higher BMI values and BMI-for-age percentiles.
BMI AND PERCENTILE CALCULATION
To calculate BMI and percentiles for each student as well as to fl ag height and weight values that were biologically im-plausible, CDC methodology and SAS programs were used.4
BMI calculation in children and adolescents requires the fol-lowing data: date of birth, sex, height, weight, and the date these measurements were taken. If any of these elements are missing or implausible, an individual’s BMI cannot be calcu-lated.5
Th e analyses described in this document refer to “response” and “non-response.” “Response” refers to a record pertaining to a student enrolled in kindergarten, sixth grade, or ninth grade in the 2010-11 school year that was included in the analyses because it had valid and complete data suffi cient for BMI calculation, and refl ected height and weight measure-ments obtained in 2009, 2010, or 2011. Th e records of stu-dents enrolled in kindergarten, sixth grade, or ninth grade in the 2010-11 school year for which data were invalid or insuf-fi cient to calculate BMI, or which contained measurements obtained prior to 2009, are classifi ed as “non-response.”
Obesity was defi ned as equal to or greater than the 95th percentile on the CDC BMI-for-age growth charts (for either girls or boys). Between the 85th and 95th percentiles, an in-dividual is classifi ed as overweight. In this report, “overweight or obese” refers to BMI equal to or greater than the 85th percentile.6

Overweight and Obesity Among Chicago Public Schools Students, 2010-11
HEALTHY CHICAGO: TRANSFORMING THE HEALTH OF OUR CITY
13
TECHNICAL REFERENCES
1. Illinois Department of Human Services. Certifi cate of Child Health Examination. http://www.cps.edu/Programs/Wellness_and_transportation/Documents/EnglishChildHealthExaminationForm.pdf. Accessed February 27, 2013.
2. Chicago Public Schools. Minimum Health Requirements. http://www.cps.edu/Programs/Wellness_and_transportation/S c h o o l _ h e a l t h _ s e r v i c e s / M i n H e a l t h R e q / Pa g e s /MinimumHealthRequirements.aspx. Accessed February 27, 2013.
3. Chicago Public Schools. IMPACT: Instructional Management Program and Academic Communications Tool. http://impact.cps.k12.il.us/faq.shtml. Accessed February 27, 2013.
4. Centers for Disease Control and Prevention. A SAS Program for the CDC Growth Charts. http://www.cdc.gov/nccdphp/dnpao/growthcharts/resources/sas.htm. Accessed February 27, 2013.
5. Centers for Disease Control and Prevention. BMI Percentile Calculator for Child and Teen English Version. http://apps.nccd.cdc.gov/DNPABMI/. Accessed February 27, 2013.
6. Centers for Disease Control and Prevention. About BMI for Children and Teens. http://www.cdc.gov/healthyweight/assessing/bmi/childrens_bmi/about_childrens_bmi.html. Accessed February 27, 2013.
7. Iannacchione VG, Milne JG, Folsom RE. Response probability weight adjustment using logistic regression. Proceedings of the Section on Survey Research Methods, American Statistical Association. 1991:637–642. http://www.amstat.org/sections/srms/proceedings/papers/1991_109.pdf. Accessed February 27, 2013.
8. Zeng Z. Adding the Feature of Age Adjustment for Survey-related Procedures in SAS - Age Adjusting Prevalence Estimates from Population Based Surveys. http://www.lexjansen.com/wuss/2007/CodersCorner/COD_Zheng_AddingTh eFeature.pdf. Accessed February 27, 2013.
OVERWEIGHT OR OBESITY AND
OBESITY PREVALENCE ESTIMATION
Demographic Estimates
Crude estimates and estimates adjusted for non-response were calculated for the three grade levels and for sex and race-ethnicity subgroups within each grade level. Th e method used to adjust for non-response was logistic regression.7 Th e inde-pendent variables included in the logistic regression model were sex, grade level, free-or-reduced meal enrollment (yes or no), and race-ethnicity (categorized as Hispanic, non-Hispan-ic black, and non-Hispanic, non-black). For each domain, re-spondent weights were ratio-adjusted so they summed to the total number of students (respondents and non-respondents) within the domain. For each estimate, 95% confi dence lim-its were calculated and a fi nite population correction was ap-plied.
By demographic subgroup, respondent counts ranged from 290 to 20,958 (median, 4,014), response rates ranged from 57.8% to 77.4% (median, 70.6%). Diff erences between crude and adjusted estimates ranged from 0 to 0.3 percentage points (median, 0) for obesity, and from 0 to 0.4 percentage points (median, 0.1) for overweight or obesity.
Community Area Estimates
To generate estimates based on community area of resi-dence, the dataset with weight adjustments determined through logistic regression modeling was used, with the re-cords of kindergarten, sixth, and ninth graders pooled. One additional step was introduced to standardize the estimates by calibrating the three grade levels to refl ect the proportions of students in these grades across the entire school district. Th e approach and SAS code of Zheng was applied, using stan-dardization weights of 0.32293 for kindergarten, 0.32870 for sixth grade, and 0.34836 for ninth grade.8
By community area, respondent counts ranged from 69 to 2,845 (median, 596), and response rates ranged from 32.9% to 89.3% (median, 67.8%). Diff erences between crude and standardized estimates ranged from 0 to 1.9 percentage points (median, 0.3) for obesity, and from 0 to 2.9 percentage points (median, 0.4) for overweight or obesity.
Overweight and Obesity Among Chicago Public Schools Students, 2010-11
HEALTHY CHICAGO: TRANSFORMING THE HEALTH OF OUR CITY
14
Overweight or obesity
Kindergarten Sixth grade Ninth grade
Demographic Group
Adjusted estimate
(%)
Marginof error
(+/-)
Adjusted estimate
(%)
Marginof error
(+/-)
Adjusted estimate
(%)
Marginof error
(+/-)
Females and males
All 36.5 0.3 48.6 0.4 44.7 0.4
Hispanic 42.2 0.5 55.0 0.6 49.4 0.6
Non-Hispanic black 34.1 0.6 45.2 0.7 43.0 0.7
Non-Hispanic white 26.0 0.9 37.9 1.3 33.7 1.3
Non-Hispanic Asian/PI 23.9 1.5 36.7 2.4 29.7 1.6
Females
All 36.2 0.5 47.2 0.6 45.7 0.6
Hispanic 42.0 0.7 49.7 0.8 47.7 0.8
Non-Hispanic black 34.0 0.8 48.8 1.0 47.8 1.0
Non-Hispanic white 25.0 1.2 33.0 1.7 31.9 1.8
Non-Hispanic Asian/PI 22.5 2.0 31.8 3.2 23.5 2.2
Males
All 36.8 0.5 50.0 0.6 43.7 0.6
Hispanic 42.4 0.7 60.3 0.8 51.0 0.8
Non-Hispanic black 34.1 0.8 41.8 1.0 38.5 0.9
Non-Hispanic white 27.0 1.3 42.9 1.9 35.5 1.8
Non-Hispanic Asian/PI 25.2 2.2 41.8 3.5 35.0 2.4
Appendix 2. Adjusted estimates of overweight and obesity prevalence among Chicago Public Schools students in grades
kindergarten, 6, and 9, by sex and race-ethnicity, 2010-11 school year.
Obesity
Kindergarten Sixth grade Ninth grade
Demographic Group
Adjusted estimate
(%)
Marginof error
(+/-)
Adjusted estimate
(%)
Marginof error
(+/-)
Adjusted estimate
(%)
Marginof error
(+/-)
Females and males
All 20.0 0.3 29.2 0.4 25.4 0.4
Hispanic 24.9 0.4 34.4 0.6 29.0 0.5
Non-Hispanic Black 17.4 0.5 26.8 0.6 24.3 0.6
Non-Hispanic White 12.1 0.6 18.7 1.0 15.9 1.0
Non-Hispanic Asian/PI 11.3 1.1 19.1 1.9 14.6 1.3
Females
All 19.1 0.4 26.7 0.5 25.2 0.5
Hispanic 23.8 0.6 29.0 0.7 26.4 0.7
Non-Hispanic Black 17.2 0.6 28.3 0.9 27.1 0.9
Non-Hispanic White 10.5 0.8 13.3 1.3 12.6 1.3
Non-Hispanic Asian/PI 7.6 1.3 14.5 2.4 10.6 1.6
Males
All 20.8 0.4 31.6 0.6 25.6 0.5
Hispanic 25.9 0.7 39.8 0.8 31.2 0.7
Non-Hispanic Black 17.7 0.7 25.5 0.9 21.7 0.8
Non-Hispanic White 13.6 1.0 24.0 1.7 19.0 1.5
Non-Hispanic Asian/PI 14.9 1.8 23.9 3.0 18.1 1.9

Overweight and Obesity Among Chicago Public Schools Students, 2010-11
HEALTHY CHICAGO: TRANSFORMING THE HEALTH OF OUR CITY
15
Obesity Overweight or obesity Obesity Overweight or obesity
Community Area
Adjusted,standardized
estimate (%)
Marginof error
(+/-)
Adjusted,standardized
estimate (%)
Marginof error
(+/-) Community Area
Adjusted,standardized
estimate (%)
Marginof error
(+/-)
Adjusted,standardized
estimate (%)
Marginof error
(+/-)
1 Rogers Park 25.1 1.3 44.2 1.5 40 Washington Park 24.4 2.9 41.9 3.3
2 West Ridge 22.9 1.0 40.5 1.2 41 Hyde Park 16.7 3.0 34.5 3.8
3 Uptown 23.6 1.9 40.5 2.2 42 Woodlawn 22.9 2.4 40.8 2.8
4 Lincoln Square 21.5 1.4 41.4 1.6 43 South Shore 21.9 1.9 38.5 2.3
5 North Center 16.5 1.6 32.3 2.1 44 Chatham 26.8 2.6 44.2 2.9
6 Lake View 14.2 1.6 30.3 2.2 45 Avalon Park 21.3 3.4 42.2 4.1
7 Lincoln Park 12.7 1.6 26.1 2.0 46 South Chicago 23.6 1.8 43.4 2.1
8 Near North Side 21.4 2.3 39.7 2.8 47 Burnside 21.9 5.3 33.2 6.0
9 Edison Park* . . 21.4 5.6 48 Calumet Heights 23.9 2.8 40.6 3.1
10 Norwood Park 14.7 1.5 31.9 2.0 49 Roseland 21.4 1.5 38.1 1.7
11 Jeff erson Park 21.8 1.8 42.5 2.1 50 Pullman 19.4 4.0 38.7 4.8
12 Forest Glen 15.5 2.0 35.8 2.6 51 South Deering 20.5 3.0 41.7 3.6
13 North Park 19.8 2.5 35.3 3.0 52 East Side 30.9 1.7 49.2 1.8
14 Albany Park 22.8 1.4 43.7 1.6 53 West Pullman 24.5 1.6 41.1 1.8
15 Portage Park 22.8 1.0 41.0 1.2 54 Riverdale 28.9 4.2 42.2 4.6
16 Irving Park 22.6 1.3 42.3 1.6 55 Hegewisch 22.6 3.7 45.1 4.5
17 Dunning 21.0 1.6 42.4 1.9 56 Garfi eld Ridge 23.0 2.9 42.7 3.3
18 Montclaire 28.0 2.4 49.0 2.6 57 Archer Heights 29.8 2.3 48.9 2.5
19 Belmont Cragin 29.3 0.9 48.7 1.0 58 Brighton Park 27.7 1.1 48.0 1.2
20 Hermosa 31.3 1.6 50.4 1.8 59 McKinley Park 29.4 1.7 44.7 1.9
21 Avondale 28.5 1.3 48.4 1.5 60 Bridgeport 23.2 2.0 36.7 2.2
22 Logan Square 26.7 1.3 43.1 1.4 61 New City 27.7 1.3 48.2 1.5
23 Humboldt park 27.7 1.1 47.3 1.2 62 West Elsdon 28.5 1.8 48.9 2.0
24 West Town 25.2 1.4 43.8 1.6 63 Gage Park 29.8 1.1 48.6 1.2
25 Austin 25.4 0.9 44.1 1.0 64 Clearing 27.7 2.2 47.4 2.5
26 West Garfi eld Park 24.6 2.0 43.4 2.3 65 West Lawn 30.2 1.4 49.2 1.5
27 East Garfi eld Park 25.1 2.0 41.4 2.2 66 Chicago Lawn 26.8 1.5 45.8 1.7
28 Near West Side 20.3 1.8 37.5 2.1 67 West Englewood 22.6 1.4 39.4 1.6
29 North Lawndale 22.4 1.4 42.0 1.7 68 Englewood 20.9 1.5 36.7 1.8
30 South Lawndale 32.9 1.0 52.3 1.0 69 Gtr. Grand Crossing 21.0 1.8 40.0 2.2
31 Lower West Side 30.5 1.6 48.9 1.7 70 Ashburn 25.1 1.2 44.5 1.4
32 Loop 13.5 3.5 34.3 5.0 71 Auburn Gresham 25.2 1.5 42.5 1.7
33 Near South Side 20.2 3.3 37.2 3.9 72 Beverly 15.6 2.3 32.1 2.9
34 Armour Square 14.1 2.4 29.9 3.1 73 Washington Heights 23.3 1.8 41.7 2.1
35 Douglas 21.8 2.7 38.3 3.1 74 Mount Greenwood 12.9 1.9 29.5 2.5
36 Oakland 25.9 4.1 44.5 4.6 75 Morgan Park 19.3 2.4 39.6 3.0
37 Fuller Park 29.0 6.2 37.4 6.6 76 O'Hare 20.9 7.8 36.0 9.2
38 Grand Boulevard 23.6 2.3 40.8 2.7 77 Edgewater 21.2 2.0 40.3 2.3
39 Kenwood 20.1 3.1 35.5 3.7
*Due to small numbers, the data for Edison Park did not meet CDPH’s threshold for statistical reliability (defi ned as a relative standard error of less than 0.25).
Appendix 3. Adjusted, standardized estimates of overweight and obesity prevalence for Chicago Public Schools students in
grades kindergarten, 6, and 9, by community area of residence, 2010-11 school year.