Embed Size (px)
Citation preview
Healthcare Seminar
Medical Malpractice and Its Complementary Coverages: What Are
They?
March 7, 2007

Today’s Speakers
KIMBER LANTRY – Hudson Healthcare
BILL DYER – HCP National Insurance Services
ALICE JOHANSSON – OneBeacon Professional Partners
DREW BARTKIEWICZ – Darwin Professional Underwriters
Malpractice Loss Trends 2007 Malpractice Loss Trends 2007 UpdateUpdate
Kimber J. Lantry, Executive Vice PresidentHudson Insurance Group851 Napa Valley Corporate Way, Suite NNapa, CA 94558(707) 225-3301(707) 224-6936 [email protected]
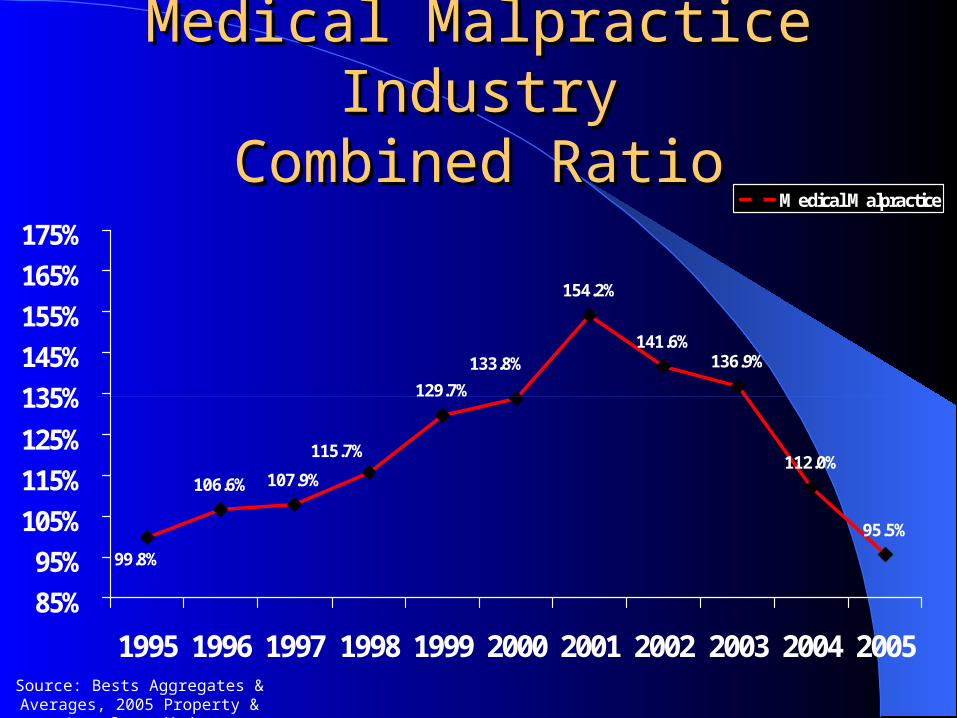
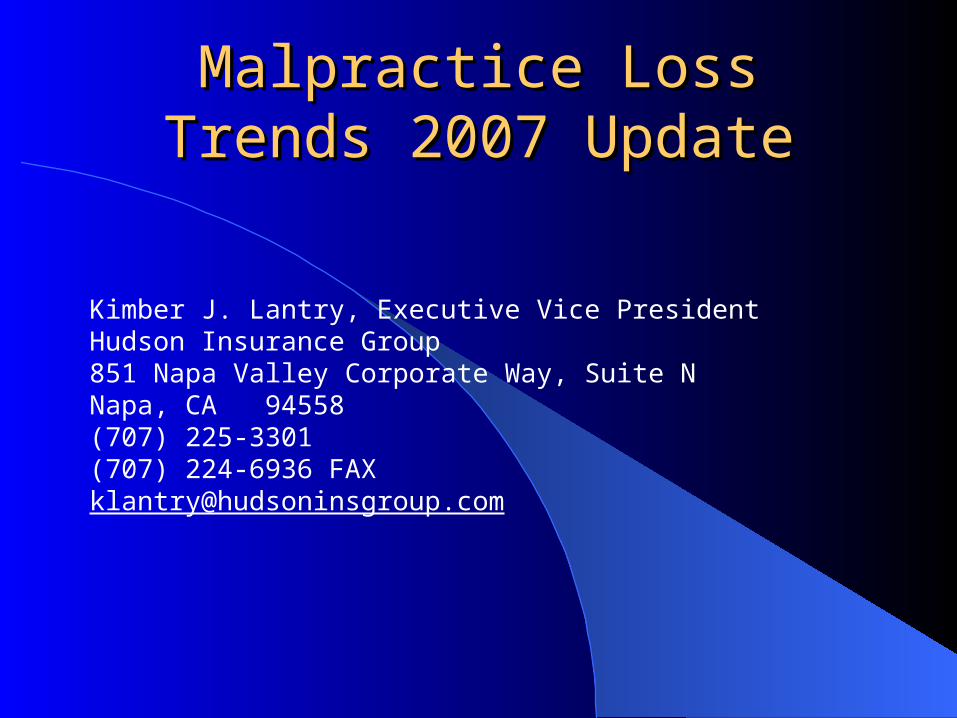
Medical Malpractice IndustryMedical Malpractice IndustryCombined RatioCombined Ratio
106.6% 107.9%
129.7%
154.2%
141.6%136.9%
112.0%
95.5%
115.7%
99.8%
133.8%
85%
95%
105%
115%
125%
135%
145%
155%
165%
175%
1995 1996 1997 1998 1999 2000 2001 2002 2003 2004 2005
Medical Malpractice
Source: Bests Aggregates & Averages, 2005 Property & Casualty edition

Selected Company ResultsSelected Company Results20052005
Source: A. M. Best Statistical Study, August 28, 2006Source: A. M. Best Statistical Study, August 28, 2006
Companies Direct Premiums Written* *$thousands
Loss Ratio
MLMIC $871,089 97%
AIG $856,834 30%
Berkshire Hathaway (Med Pro, GenStar) $710,021 57%
ProAssurance Group $612,242 28%
CNA Insurance Companies $516,517 60%
Doctors Co Ins Group $492,153 41%
ISMIE $405,420 56%
Mag Mutual Group $355,949 43%
ProMutual Group $344,706 57%
Health Care Indemnity $331,020 56%
Norcal Group $297,648 56%
Physicians’ Reciprocal Insurers $290,698 77%
FPIC Ins Group $279,540 46%
Fairfax Financial Group $148,701 41%

SEVERITYSEVERITY
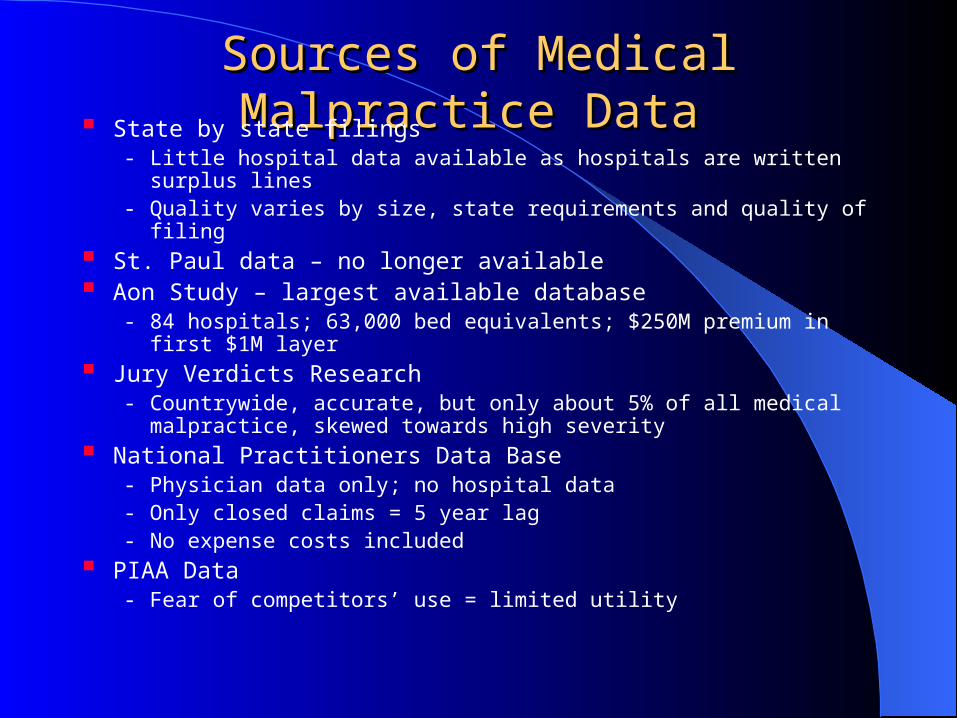
Sources of Medical Malpractice DataSources of Medical Malpractice Data
State by state filings- Little hospital data available as hospitals are written surplus lines- Quality varies by size, state requirements and quality of filing
St. Paul data – no longer available Aon Study – largest available database
- 84 hospitals; 63,000 bed equivalents; $250M premium in first $1M layer
Jury Verdicts Research - Countrywide, accurate, but only about 5% of all medical malpractice,
skewed towards high severity
National Practitioners Data Base - Physician data only; no hospital data- Only closed claims = 5 year lag- No expense costs included
PIAA Data- Fear of competitors’ use = limited utility
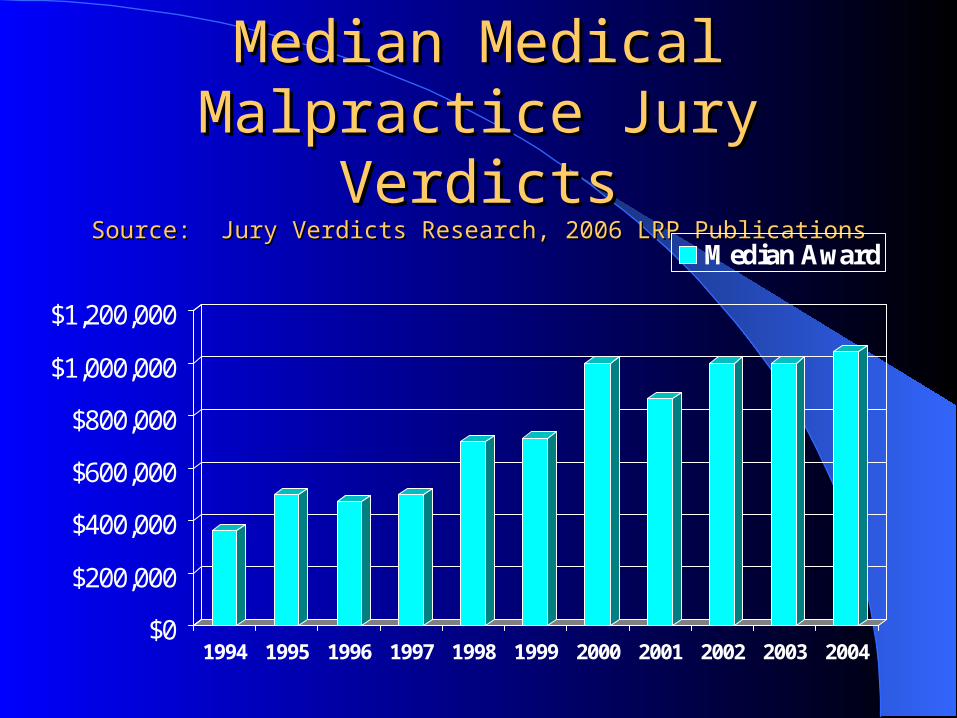
Median Medical Malpractice Median Medical Malpractice Jury VerdictsJury Verdicts
Source: Jury Verdicts Research, 2006 LRP PublicationsSource: Jury Verdicts Research, 2006 LRP Publications
$0
$200,000
$400,000
$600,000
$800,000
$1,000,000
$1,200,000
1994 1995 1996 1997 1998 1999 2000 2001 2002 2003 2004
Median Award
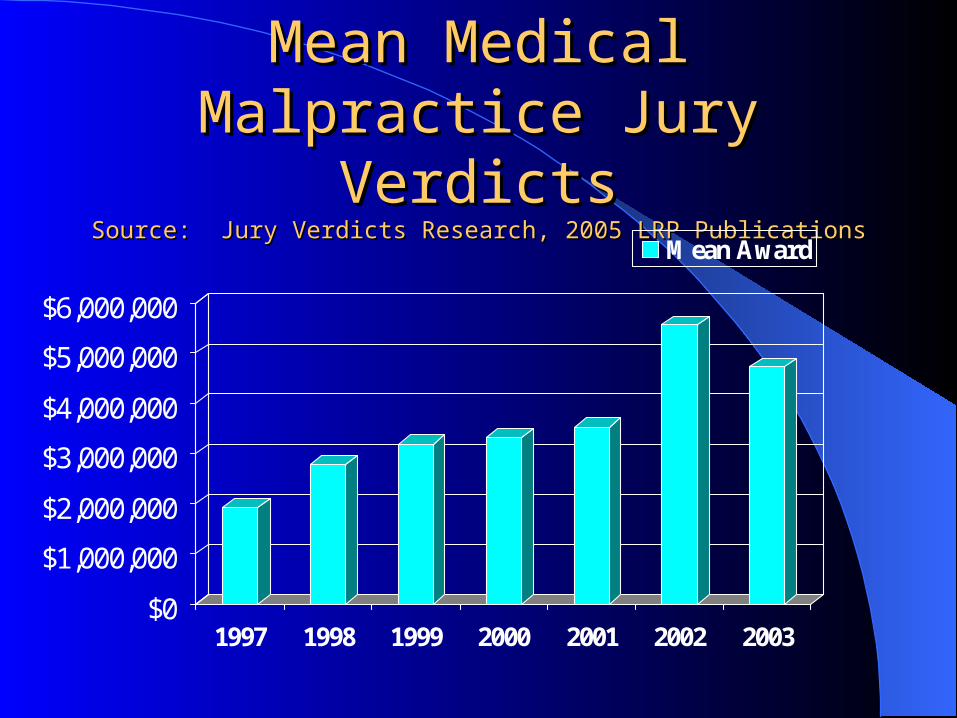
Mean Medical Malpractice Mean Medical Malpractice Jury VerdictsJury Verdicts
Source: Jury Verdicts Research, 2005 LRP PublicationsSource: Jury Verdicts Research, 2005 LRP Publications
$0
$1,000,000
$2,000,000
$3,000,000
$4,000,000
$5,000,000
$6,000,000
1997 1998 1999 2000 2001 2002 2003
Mean Award
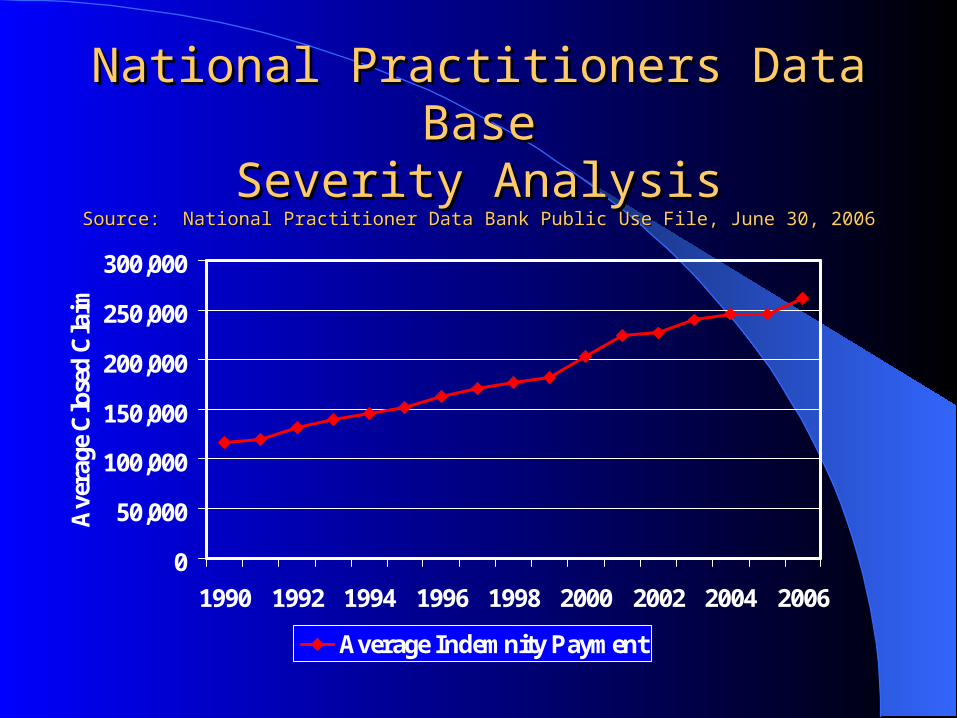
National Practitioners Data BaseNational Practitioners Data BaseSeverity AnalysisSeverity Analysis
Source: National Practitioner Data Bank Public Use File, June 30, 2006Source: National Practitioner Data Bank Public Use File, June 30, 2006
0
50,000
100,000
150,000
200,000
250,000
300,000
1990 1992 1994 1996 1998 2000 2002 2004 2006
Ave
rage
Clo
sed
Cla
im
Average Indemnity Payment

PIAA Data BasePIAA Data BaseSeverity AnalysisSeverity Analysis
Source: PIAA, 2004Source: PIAA, 2004
0
50,000
100,000
150,000
200,000
250,000
300,000
350,000
1996 1997 1998 1999 2000 2001 2002 2003
Ave
rage
Clo
sed
Cla
im
Average Indemnity Payment Median Indemnity Payment
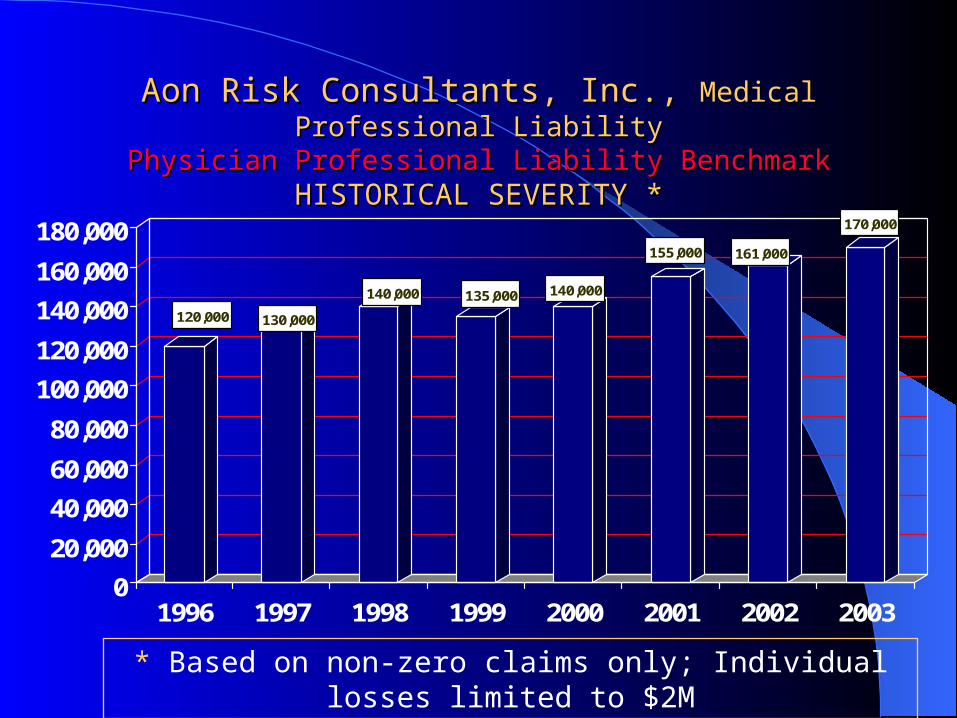
Aon Risk Consultants, Inc., Aon Risk Consultants, Inc., Medical Professional LiabilityMedical Professional LiabilityPhysician Professional Liability BenchmarkPhysician Professional Liability Benchmark
HISTORICAL SEVERITY *HISTORICAL SEVERITY *
120,000 130,000
140,000 135,000 140,000
155,000 161,000
170,000
0
20,000
40,000
60,000
80,000
100,000
120,000
140,000
160,000
180,000
1996 1997 1998 1999 2000 2001 2002 2003
* Based on non-zero claims only; Individual losses limited to $2M

FREQUENCYFREQUENCY
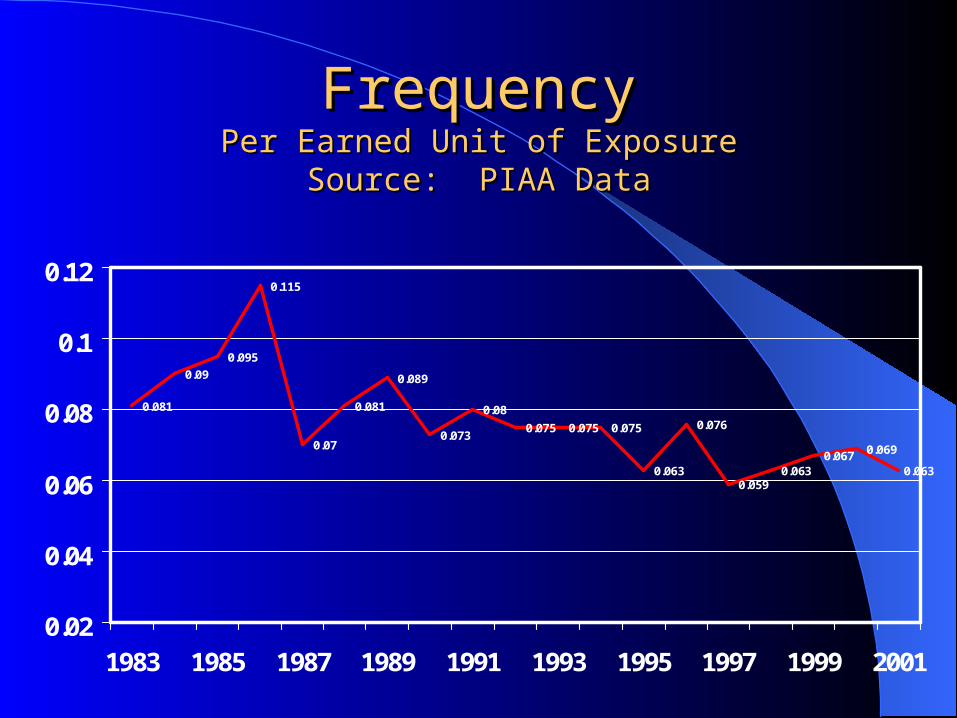
FrequencyFrequencyPer Earned Unit of ExposurePer Earned Unit of Exposure
Source: PIAA DataSource: PIAA Data
0.081
0.09
0.095
0.115
0.07
0.081
0.089
0.073
0.08
0.075 0.075 0.075
0.063
0.076
0.0590.063
0.067 0.069
0.063
0.02
0.04
0.06
0.08
0.1
0.12
1983 1985 1987 1989 1991 1993 1995 1997 1999 2001

National Practitioners Data BaseNational Practitioners Data BaseFrequency AnalysisFrequency Analysis
Source: National Practitioners Data Bank public use file, June 30, 2006Source: National Practitioners Data Bank public use file, June 30, 2006
2.93.1 3 2.9
2.6 2.62.4 2.3 2.4 2.4 2.5
2.2 2.22 1.91.8
0
0.5
1
1.5
2
2.5
3
3.5
Cla
ims
Per
100
Phy
sici
ans
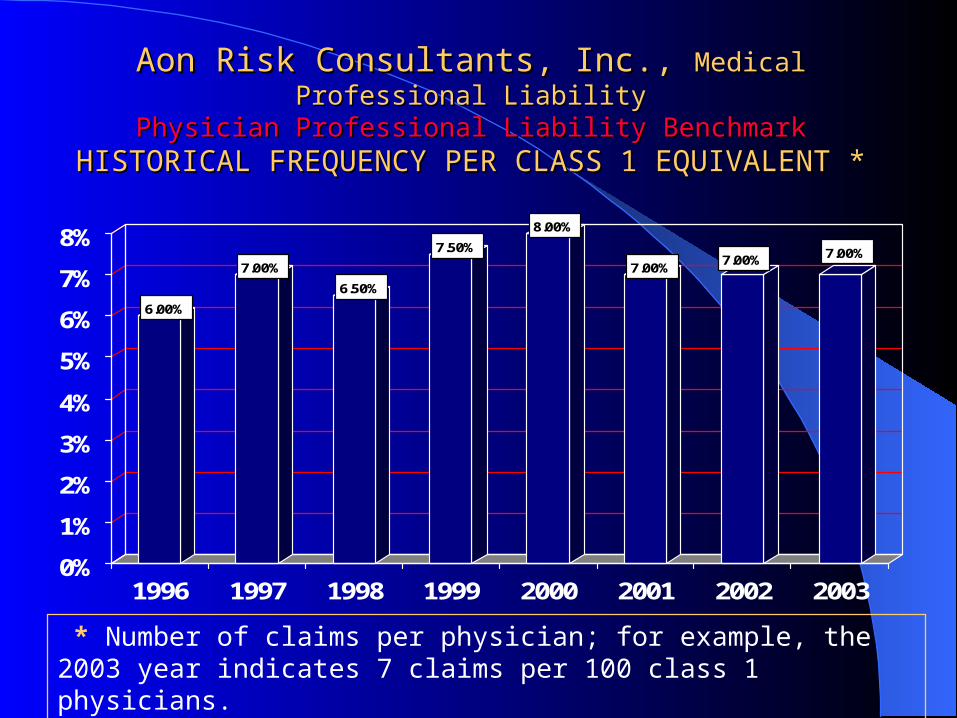
Aon Risk Consultants, Inc., Aon Risk Consultants, Inc., Medical Professional LiabilityMedical Professional LiabilityPhysician Professional Liability BenchmarkPhysician Professional Liability Benchmark
HISTORICAL FREQUENCY PER CLASS 1 EQUIVALENT *HISTORICAL FREQUENCY PER CLASS 1 EQUIVALENT *
6.00%
7.00%
6.50%
7.50%
8.00%
7.00%7.00% 7.00%
0%
1%
2%
3%
4%
5%
6%
7%
8%
1996 1997 1998 1999 2000 2001 2002 2003
* Number of claims per physician; for example, the 2003 year indicates 7 claims per 100 class 1 physicians.

FREQUENCY AND FREQUENCY AND SEVERITY SEVERITY
TREND ANALYSISTREND ANALYSIS

Aon Risk Consultants, Inc., Aon Risk Consultants, Inc., Medical Professional LiabilityMedical Professional LiabilityPhysician Professional Liability BenchmarkPhysician Professional Liability Benchmark
HISTORICAL LOSS COSTS PER CLASS 1 EQUIVALENT *HISTORICAL LOSS COSTS PER CLASS 1 EQUIVALENT *
7,500
9,50010,000
10,500
12,250 12,000 12,250 12,500
0
2,000
4,000
6,000
8,000
10,000
12,000
14,000
1996 1997 1998 1999 2000 2001 2002 2003
* Individual losses limited to $2M
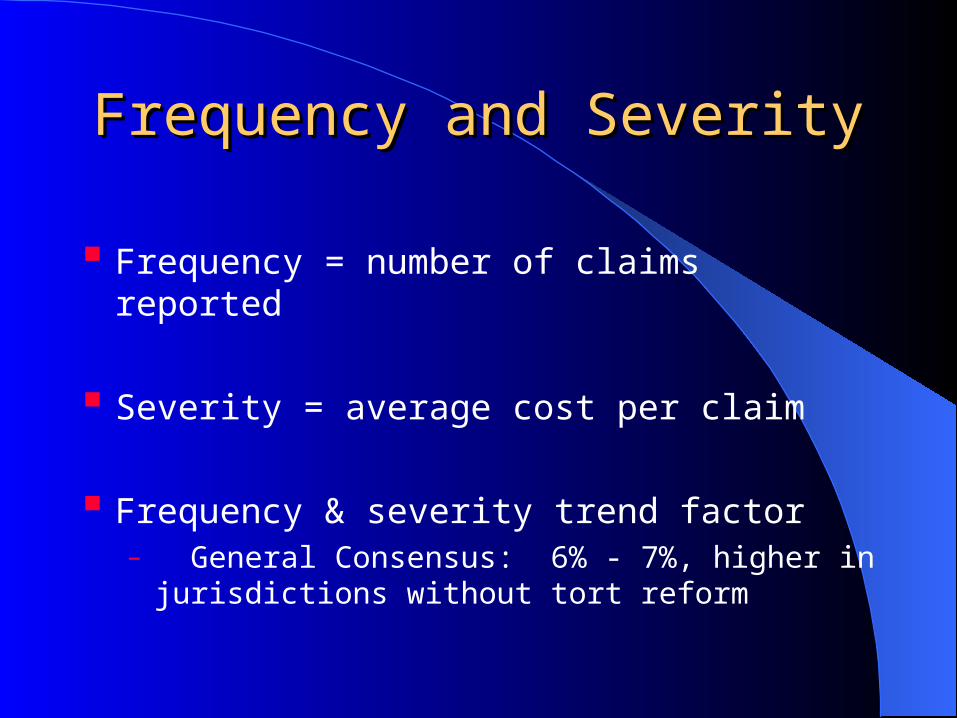
Frequency and SeverityFrequency and Severity
Frequency = number of claims reported
Severity = average cost per claim
Frequency & severity trend factor– General Consensus: 6% - 7%, higher in jurisdictions
without tort reform

PHYSICIAN ISSUESPHYSICIAN ISSUES
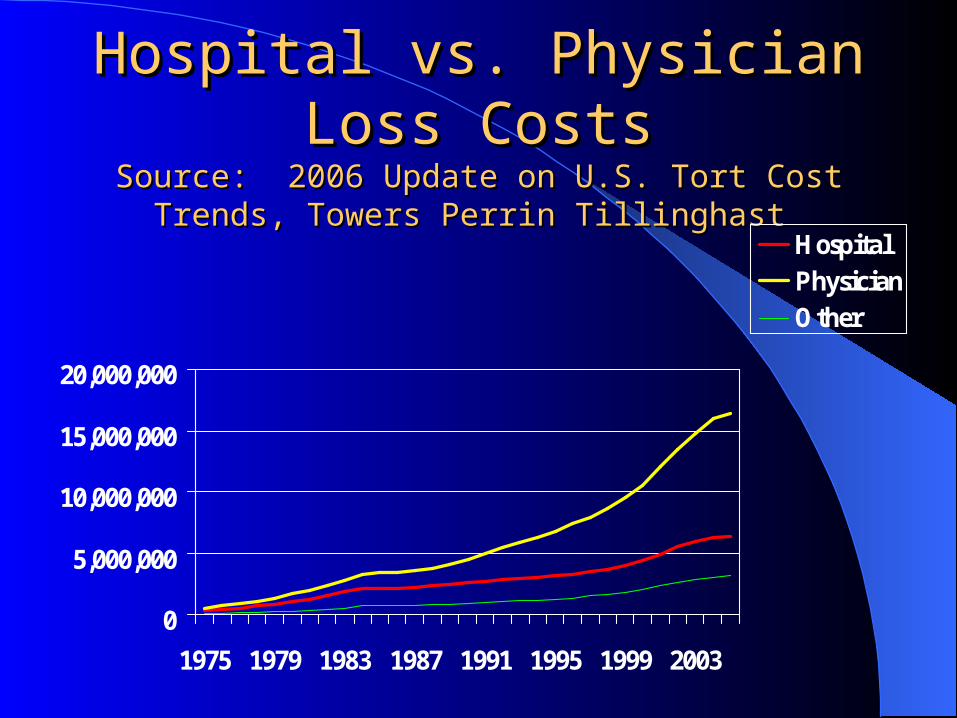
Hospital vs. Physician Loss Hospital vs. Physician Loss CostsCosts
Source: 2006 Update on U.S. Tort Cost Trends, Towers Source: 2006 Update on U.S. Tort Cost Trends, Towers Perrin Tillinghast Perrin Tillinghast
0
5,000,000
10,000,000
15,000,000
20,000,000
1975 1979 1983 1987 1991 1995 1999 2003
HospitalPhysicianOther

MEDICAL MALPRACTICE MEDICAL MALPRACTICE INSURANCE COMPANY INSURANCE COMPANY
RESULTSRESULTS
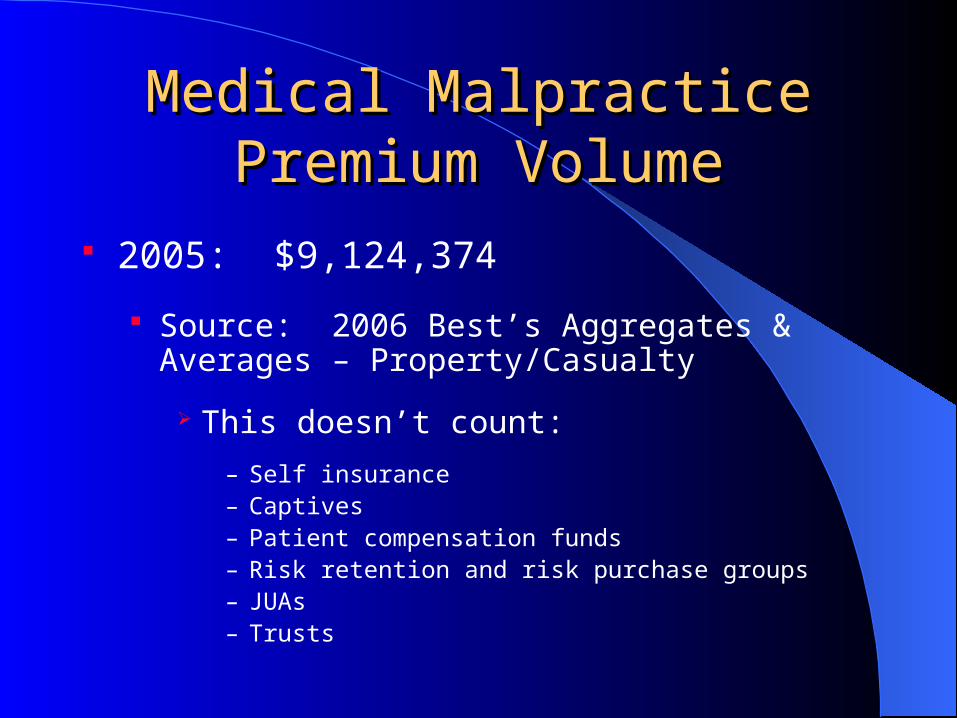
Medical Malpractice Premium Medical Malpractice Premium VolumeVolume
2005: $9,124,374
Source: 2006 Best’s Aggregates & Averages – Property/Casualty
This doesn’t count:
– Self insurance– Captives– Patient compensation funds– Risk retention and risk purchase groups– JUAs– Trusts
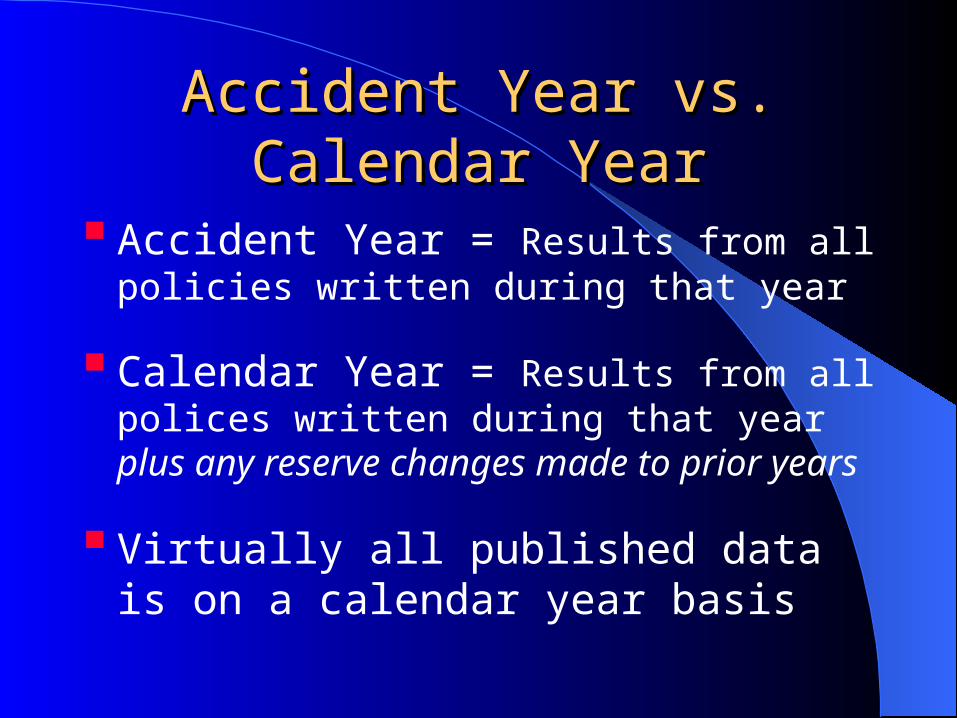
Accident Year vs. Calendar Accident Year vs. Calendar YearYear
Accident Year = Results from all policies written during that year
Calendar Year = Results from all polices written during that year plus any reserve changes made to prior years
Virtually all published data is on a calendar year basis
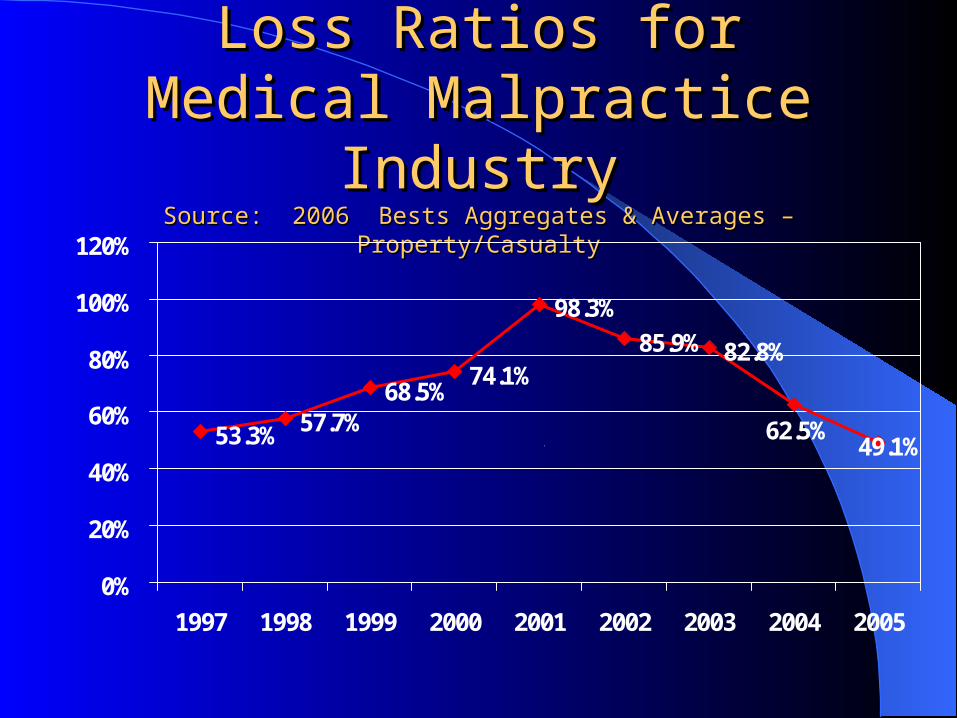
Loss Ratios for Medical Loss Ratios for Medical Malpractice IndustryMalpractice Industry
Source: 2006 Bests Aggregates & Averages – Property/CasualtySource: 2006 Bests Aggregates & Averages – Property/Casualty
53.3% 57.7%68.5%
74.1%
98.3%
85.9% 82.8%
49.1%62.5%
0%
20%
40%
60%
80%
100%
120%
1997 1998 1999 2000 2001 2002 2003 2004 2005
1
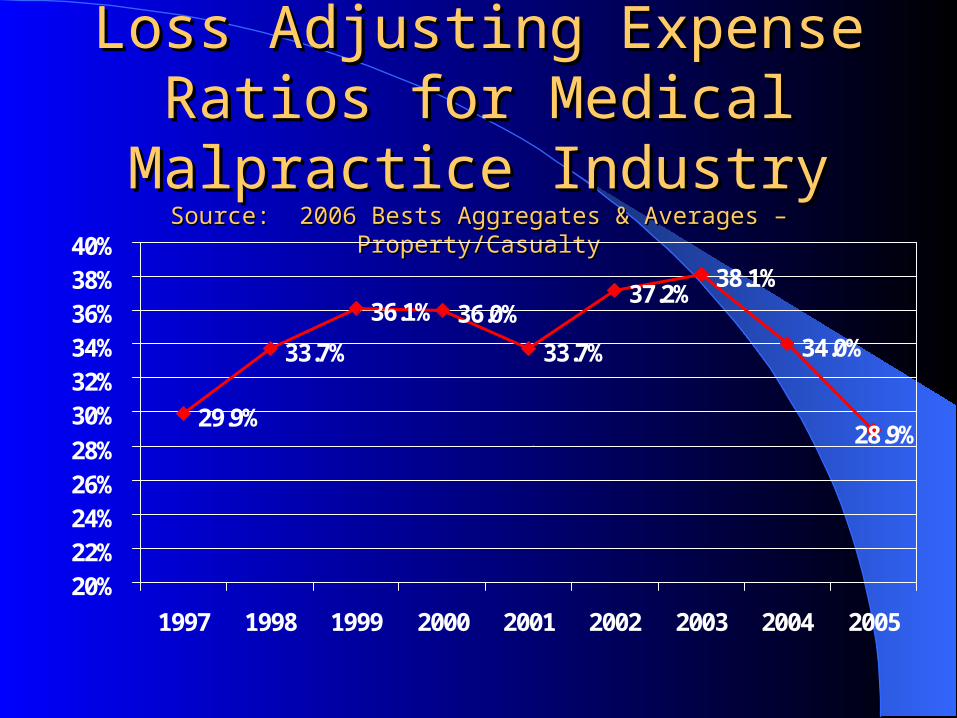
Loss Adjusting Expense Loss Adjusting Expense Ratios for Medical Malpractice Ratios for Medical Malpractice
IndustryIndustrySource: 2006 Bests Aggregates & Averages – Property/CasualtySource: 2006 Bests Aggregates & Averages – Property/Casualty
29.9%
33.7%
36.1% 36.0%
33.7%
37.2%38.1%
34.0%
28.9%
20%22%24%26%28%
30%32%34%36%38%40%
1997 1998 1999 2000 2001 2002 2003 2004 2005
1
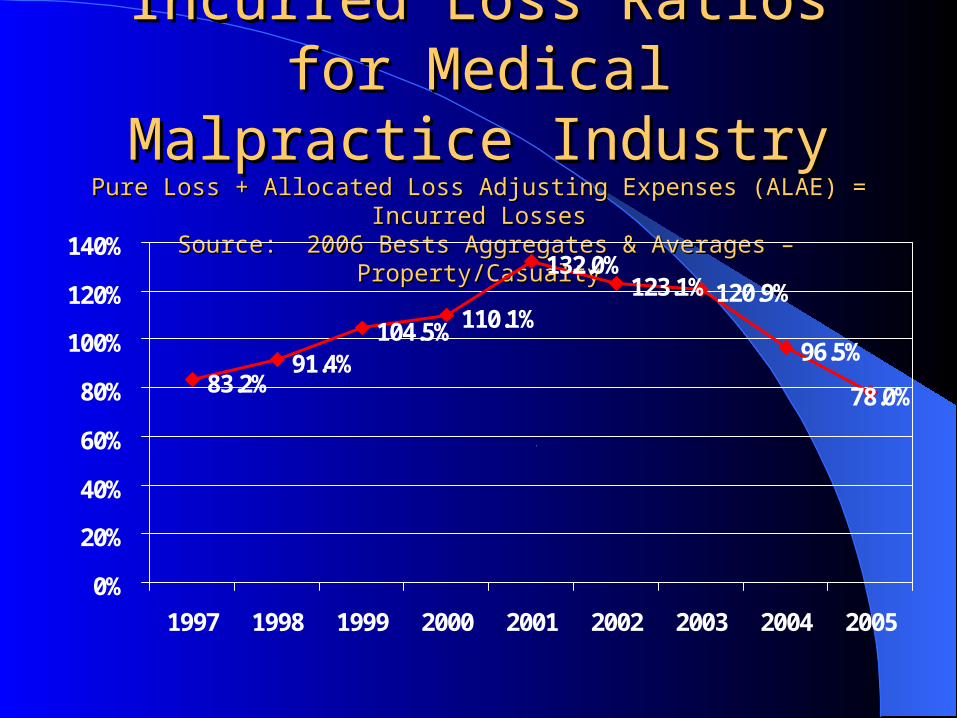
Incurred Loss Ratios for Incurred Loss Ratios for Medical Malpractice IndustryMedical Malpractice Industry
Pure Loss + Allocated Loss Adjusting Expenses (ALAE) = Incurred LossesPure Loss + Allocated Loss Adjusting Expenses (ALAE) = Incurred Losses Source: 2006 Bests Aggregates & Averages – Property/Casualty Source: 2006 Bests Aggregates & Averages – Property/Casualty
83.2%91.4%
104.5%110.1%
132.0%123.1%120.9%
96.5%
78.0%
0%
20%
40%
60%
80%
100%
120%
140%
1997 1998 1999 2000 2001 2002 2003 2004 2005
1
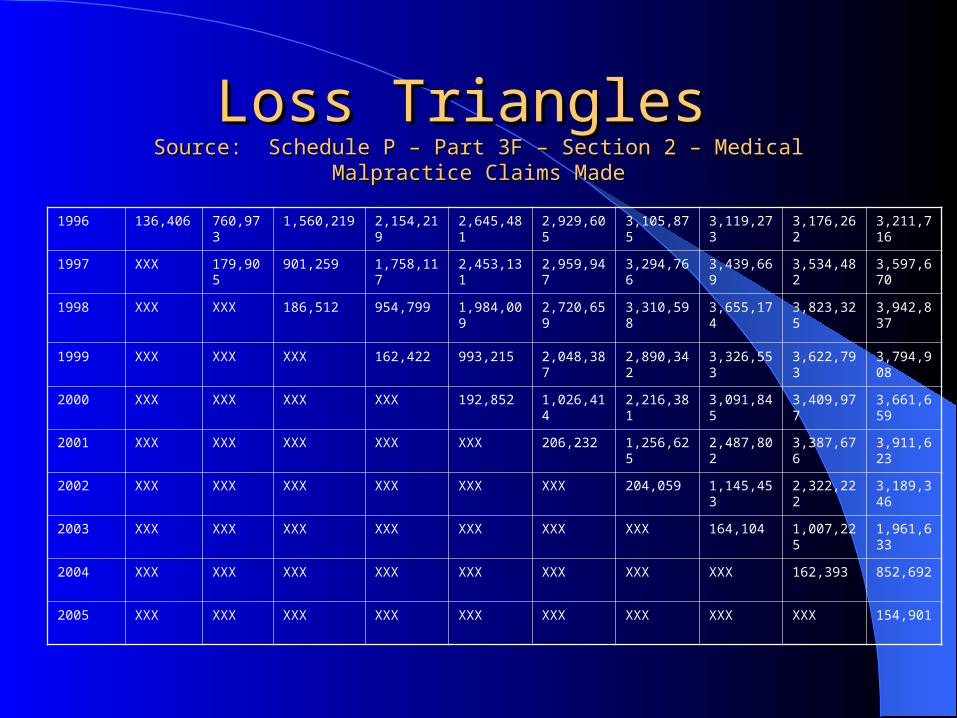
Loss Triangles Loss Triangles Source: Schedule P – Part 3F – Section 2 – Medical Malpractice Claims MadeSource: Schedule P – Part 3F – Section 2 – Medical Malpractice Claims Made
1996 136,406 760,973 1,560,219 2,154,219 2,645,481 2,929,605 3,105,875 3,119,273 3,176,262 3,211,716
1997 XXX 179,905 901,259 1,758,117 2,453,131 2,959,947 3,294,766 3,439,669 3,534,482 3,597,670
1998 XXX XXX 186,512 954,799 1,984,009 2,720,659 3,310,598 3,655,174 3,823,325 3,942,837
1999 XXX XXX XXX 162,422 993,215 2,048,387 2,890,342 3,326,553 3,622,793 3,794,908
2000 XXX XXX XXX XXX 192,852 1,026,414 2,216,381 3,091,845 3,409,977 3,661,659
2001 XXX XXX XXX XXX XXX 206,232 1,256,625 2,487,802 3,387,676 3,911,623
2002 XXX XXX XXX XXX XXX XXX 204,059 1,145,453 2,322,222 3,189,346
2003 XXX XXX XXX XXX XXX XXX XXX 164,104 1,007,225 1,961,633
2004 XXX XXX XXX XXX XXX XXX XXX XXX 162,393 852,692
2005 XXX XXX XXX XXX XXX XXX XXX XXX XXX 154,901
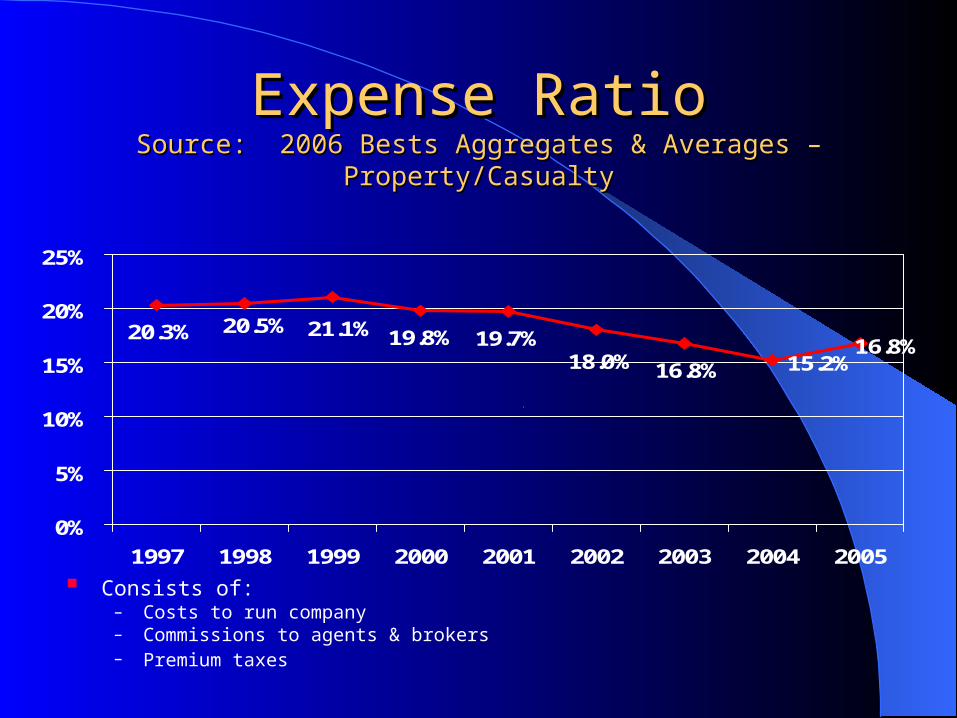
Expense RatioExpense RatioSource: 2006 Bests Aggregates & Averages – Property/CasualtySource: 2006 Bests Aggregates & Averages – Property/Casualty
15.2%16.8%
16.8%18.0%19.7%19.8%21.1%20.5%20.3%
0%
5%
10%
15%
20%
25%
1997 1998 1999 2000 2001 2002 2003 2004 2005
1
Consists of:– Costs to run company– Commissions to agents & brokers– Premium taxes

Combined Ratio Combined Ratio Source: 2006 Bests Aggregates & Averages – Property/CasualtySource: 2006 Bests Aggregates & Averages – Property/Casualty
112.3%95.5%107.9%
142.3%154.8%133.8%
129.7%115.7% 138.1%
0%
20%
40%
60%
80%
100%
120%
140%
160%
180%
1997 1998 1999 2000 2001 2002 2003 2004 2005
1
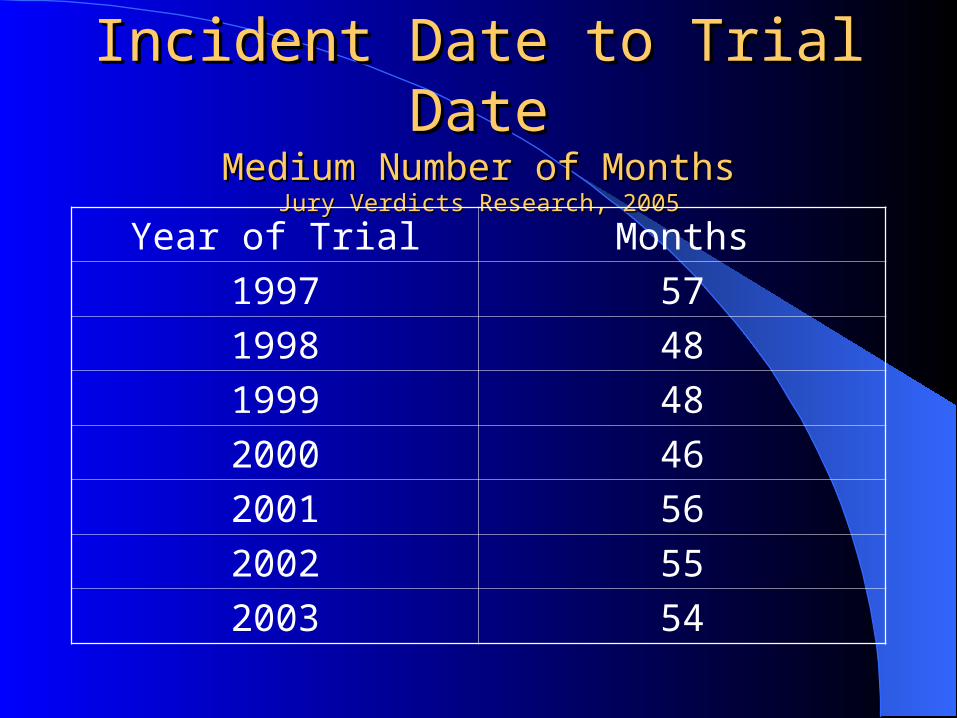
Incident Date to Trial DateIncident Date to Trial DateMedium Number of MonthsMedium Number of Months
Jury Verdicts Research, 2005Jury Verdicts Research, 2005
Year of Trial Months
1997 57
1998 48
1999 48
2000 46
2001 56
2002 55
2003 54

Occurrence to Settlement LagOccurrence to Settlement Lag(in number of years)(in number of years)
Source: National Practitioners Data Bank public use file, June 30, 2006Source: National Practitioners Data Bank public use file, June 30, 2006
4.14.24.34.44.54.64.74.84.9
5
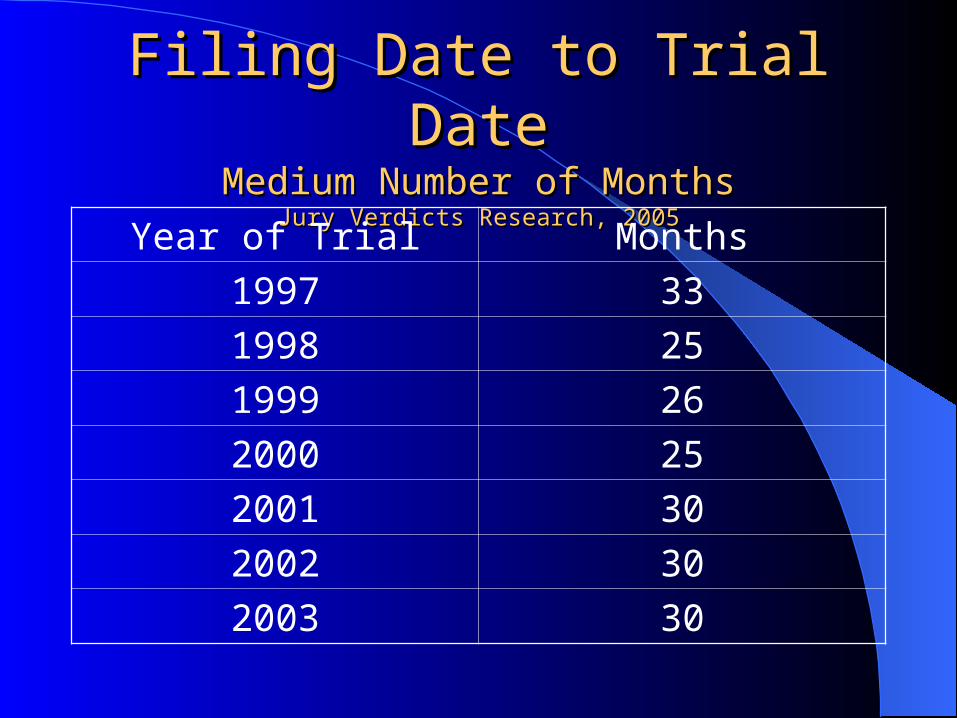
Filing Date to Trial DateFiling Date to Trial DateMedium Number of MonthsMedium Number of Months
Jury Verdicts Research, 2005Jury Verdicts Research, 2005
Year of Trial Months
1997 33
1998 25
1999 26
2000 25
2001 30
2002 30
2003 30
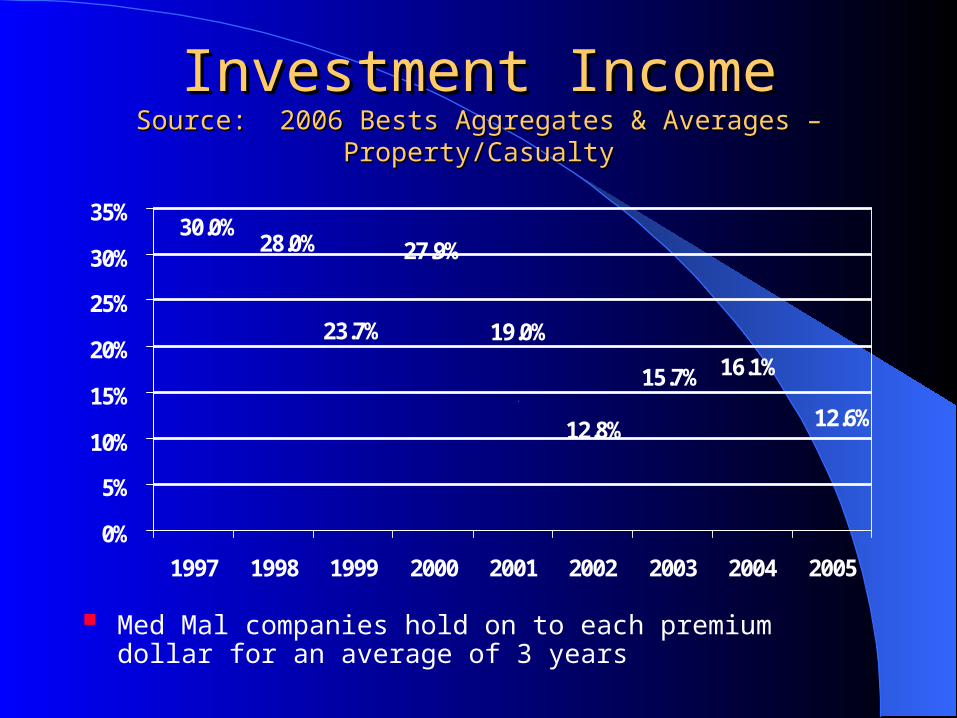
Investment IncomeInvestment IncomeSource: 2006 Bests Aggregates & Averages – Property/CasualtySource: 2006 Bests Aggregates & Averages – Property/Casualty
Med Mal companies hold on to each premium dollar for an average of 3 years
12.6%
16.1%15.7%
12.8%
19.0%
27.9%
23.7%
28.0%30.0%
0%
5%
10%
15%
20%
25%
30%
35%
1997 1998 1999 2000 2001 2002 2003 2004 2005
1

Overall Operating RatioOverall Operating Ratio“The Bottom Line”“The Bottom Line”
Source: 2006 Bests Aggregates & Averages – Property/CasualtySource: 2006 Bests Aggregates & Averages – Property/Casualty
96.3%82.9%
122.4%
129.5%
135.8%105.9%
106.0%87.7%
77.9%
0%
20%
40%
60%
80%
100%
120%
140%
160%
1997 1998 1999 2000 2001 2002 2003 2004 2005
1
0
1,000
2,000
3,000
4,000
5,000
6,000
7,000
8,000
9,000
10,000
11,00019
7619
7719
7819
7919
8019
8119
8219
8319
8419
8519
8619
8719
8819
8919
9019
9119
9219
9319
9419
9519
9619
9719
9819
9920
0020
0120
0220
0320
0420
05
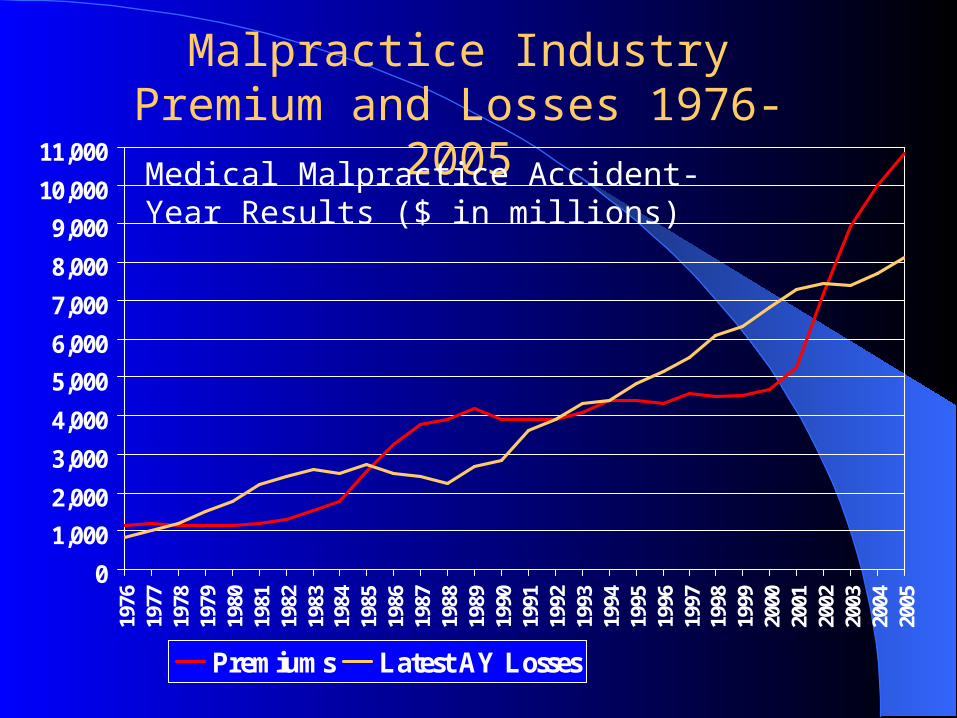
Premiums Latest AY Losses
Malpractice Industry Premium and Losses 1976-2005
Medical Malpractice Accident-Year Results ($ in millions)

TORT REFORMTORT REFORM
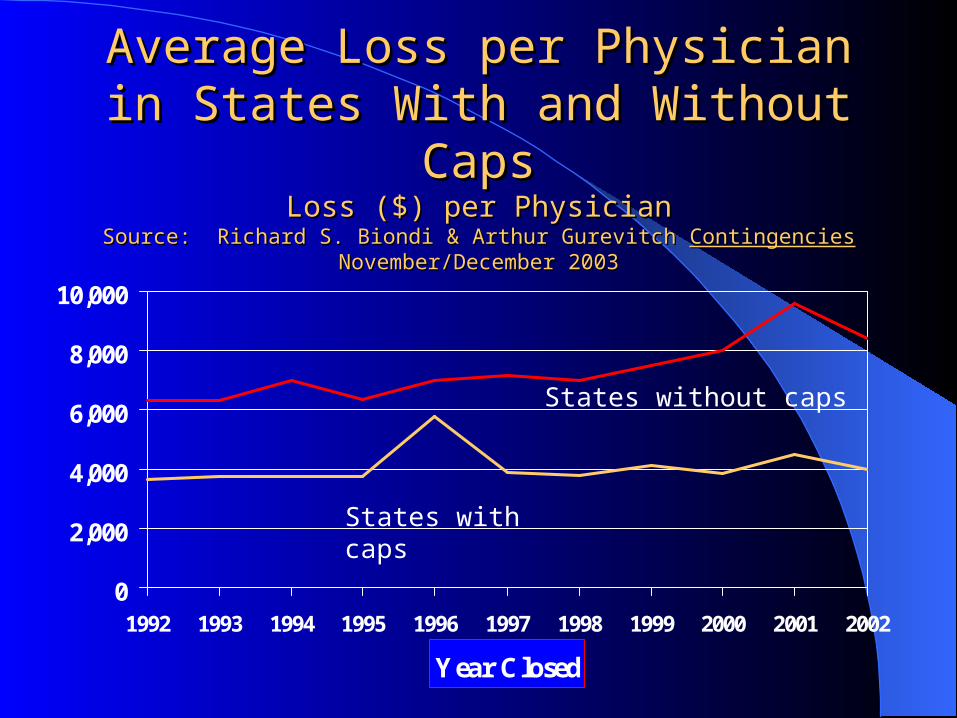
Average Loss per Physician in States Average Loss per Physician in States With and Without CapsWith and Without Caps
Loss ($) per PhysicianLoss ($) per PhysicianSource: Richard S. Biondi & Arthur Gurevitch Source: Richard S. Biondi & Arthur Gurevitch ContingenciesContingencies November/December November/December
20032003
0
2,000
4,000
6,000
8,000
10,000
1992 1993 1994 1995 1996 1997 1998 1999 2000 2001 2002
Year Closed
States without caps
States with caps
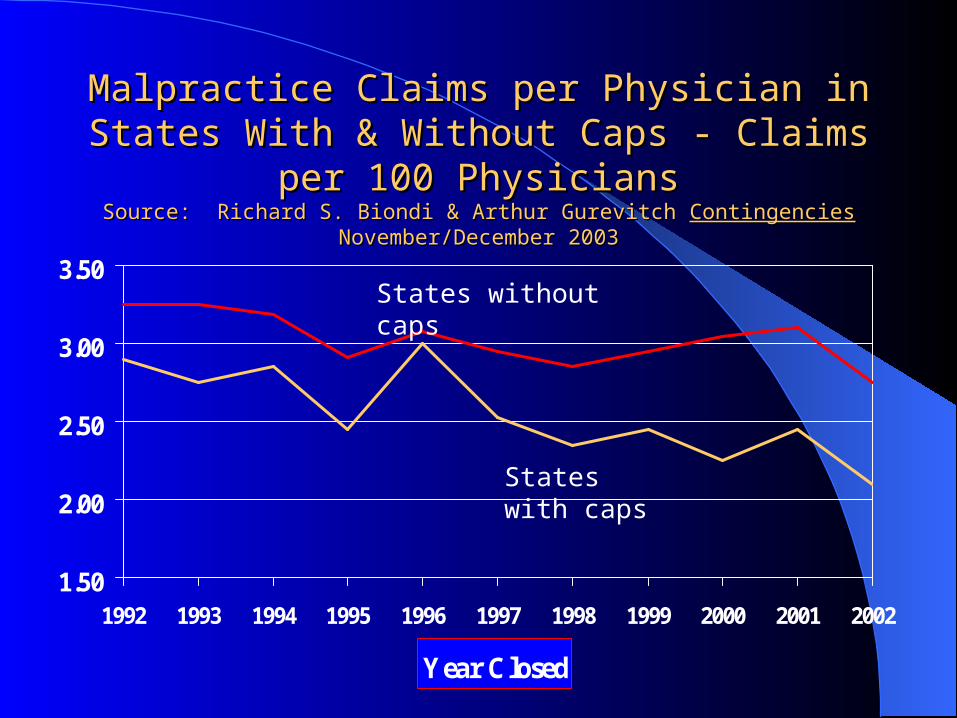
Malpractice Claims per Physician in States With Malpractice Claims per Physician in States With & Without Caps - Claims per 100 Physicians& Without Caps - Claims per 100 Physicians
Source: Richard S. Biondi & Arthur Gurevitch Source: Richard S. Biondi & Arthur Gurevitch ContingenciesContingencies November/December November/December 20032003
1.50
2.00
2.50
3.00
3.50
1992 1993 1994 1995 1996 1997 1998 1999 2000 2001 2002
Year Closed
States without caps
States with caps
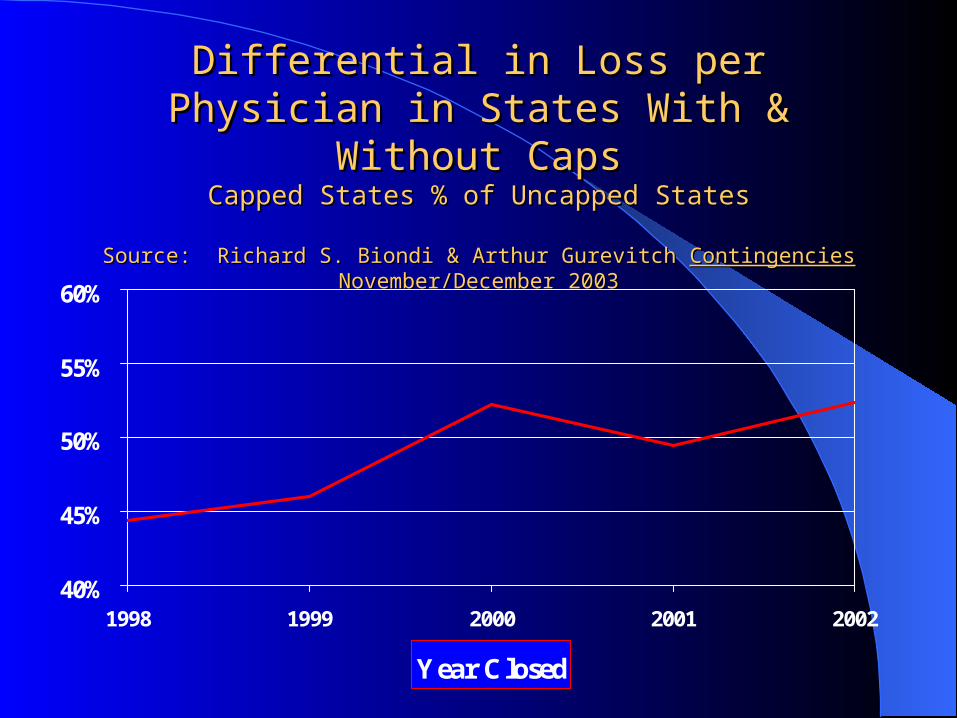
Differential in Loss per Physician in States Differential in Loss per Physician in States With & Without CapsWith & Without Caps
Capped States % of Uncapped StatesCapped States % of Uncapped States
Source: Richard S. Biondi & Arthur Gurevitch Source: Richard S. Biondi & Arthur Gurevitch ContingenciesContingencies November/December November/December 20032003
40%
45%
50%
55%
60%
1998 1999 2000 2001 2002
Year Closed
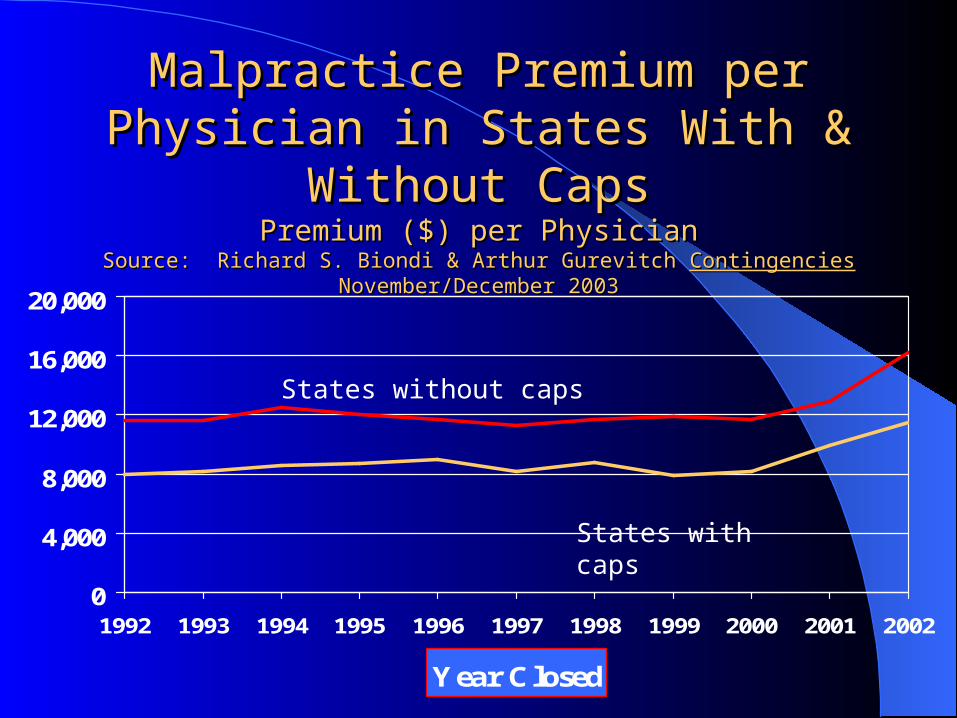
Malpractice Premium per Physician Malpractice Premium per Physician in States With & Without Capsin States With & Without Caps
Premium ($) per PhysicianPremium ($) per PhysicianSource: Richard S. Biondi & Arthur Gurevitch Source: Richard S. Biondi & Arthur Gurevitch ContingenciesContingencies November/December November/December
20032003
0
4,000
8,000
12,000
16,000
20,000
1992 1993 1994 1995 1996 1997 1998 1999 2000 2001 2002
Year Closed
States without caps
States with caps

National Practitioners Data BaseNational Practitioners Data BaseFrequency Analysis – MichiganFrequency Analysis – Michigan
NOTE: Michigan enacted caps on non-economic NOTE: Michigan enacted caps on non-economic damages in 1994damages in 1994
Source: National Practitioners Data Bank public use June 30, 2006Source: National Practitioners Data Bank public use June 30, 2006
5.4 5.7
4.8
5.85.1
3.3 3 3.2 3.32.9
3.43
2.42.1 1.9 1.7
0
1
2
3
4
5
6
7
1991
1992
1993
1994
1995
1996
1997
1998
1999
2000
2001
2002
2003
2004
2005
2006
Cla
ims
Per
100
Phy
sici
ans
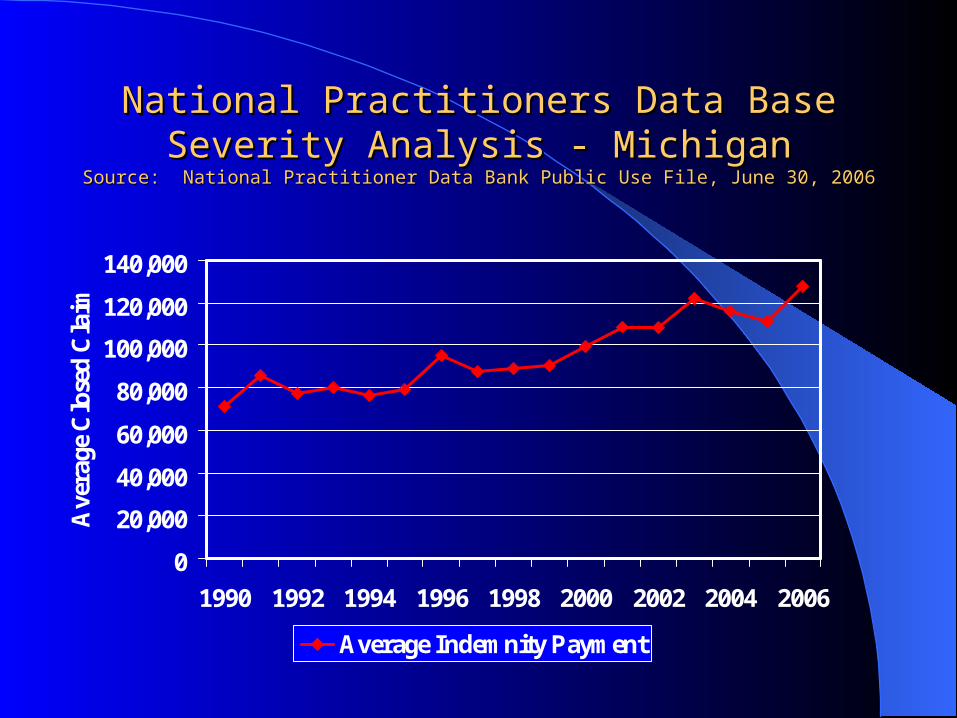
National Practitioners Data BaseNational Practitioners Data BaseSeverity Analysis - MichiganSeverity Analysis - Michigan
Source: National Practitioner Data Bank Public Use File, June 30, 2006Source: National Practitioner Data Bank Public Use File, June 30, 2006
0
20,000
40,000
60,000
80,000
100,000
120,000
140,000
1990 1992 1994 1996 1998 2000 2002 2004 2006
Ave
rage
Clo
sed
Cla
im
Average Indemnity Payment
Tort ReformTort Reform
In 1975-77, in 1985-87 and in 2001-2003 numerous states enacted medical malpractice tort reform.
Five to seven years later (1980-82 and 1990-92), after court challenges to virtually every element of tort reform, approximately 50% was struck down by the states’ high courts. By that standard, we should start seeing the 2001-2003 tort reform start being struck down in 2007.
MT$250k
ID$250k
WA
OR
CA
$250k
AK$400k*
HI$375k
NV$350k
WY
UT$400k
AZNM
$200k*1
CO$300k
ND$500k
SD$500k
MN
NE$500k1
KS$250k
OK$300k
TX$250k
IA
MO$350k
AR
LA $500k1*
WI$350k1
MI$500k*
IL IN$250k1
OH$350k
KYT
NMS
$350kAL GA
$350k
FL$500k*
SC
VA*
WV$250k
PA
NY
ME$400k*
VT
NH
MA - $500k
RI
CT
NJDE
MD - $650k+*
DC
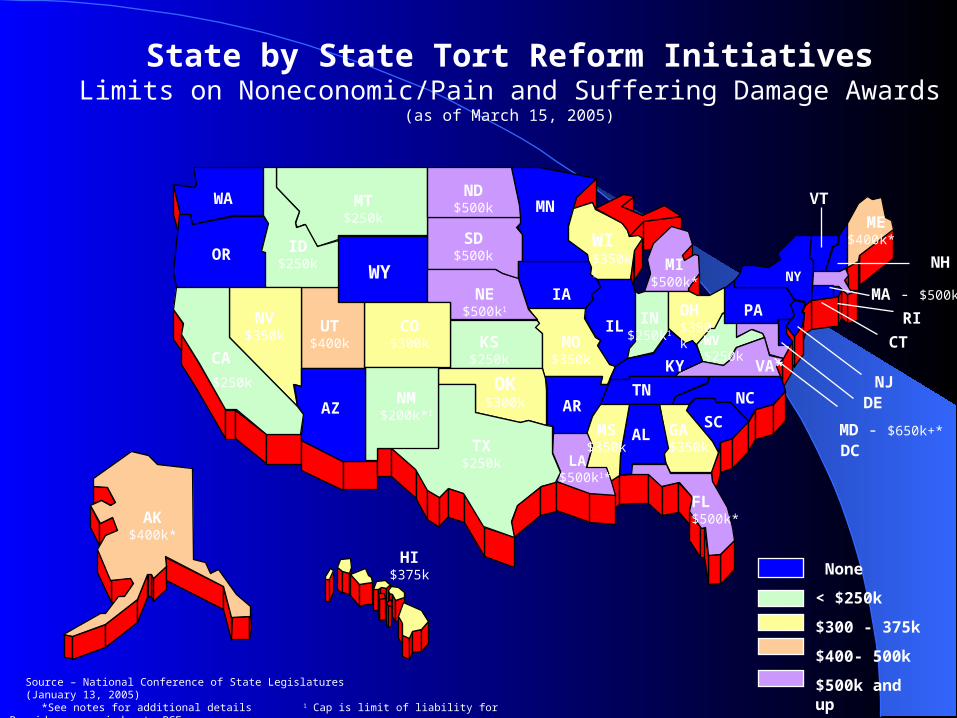
State by State Tort Reform InitiativesLimits on Noneconomic/Pain and Suffering Damage Awards
(as of March 15, 2005)
Source – National Conference of State Legislatures (January 13, 2005)
None
< $250k
$300 - 375k
$400- 500k
$500k and up *See notes for additional details 1 Cap is limit of liability for Providers; remainder to PCF
NC

THE FUTURETHE FUTURE
Medical Malpractice Crisis – Medical Malpractice Crisis – What Crisis?What Crisis?
HOSPITALSSoft market has returned. Hospital excess insurance is the most competitive, but insurance bidding wars are increasingly common for primary as well.
PHYSICIANSRate filing are commonly for modest declines. Large physician groups are enjoying insurance company bidding wars. Numerous carriers are aggressively attempting to expand market share.

Factors Affecting The MarketFactors Affecting The Market
“Class of 2001” is mostly doing wellArch CapitalAceGen StarEndurance SpecialtyBerkeley Medical Excess UnderwritersOneBeaconDarwin Underwriters
Availability of reinsurance support for new entrants A plethora of risk retention groups and admitted
physician company startups Rush to self-insurance and captives is over

The FutureThe Future
Steadily softening market for the next 5 years or more
Continued new market entrants as industry profitability becomes clearer
Higher limits, broader policies Likely to be followed by:
– Unwinding of captives as commercial insurance market becomes cheaper
Followed by…inexorable rising of severity…and the next malpractice crisis

Assessing An Insured ‘s Risk Covering All The Healthcare
Angles – Groups and Solo Doctors
Bill Dyer, President
If you have the opportunity to go to the provider’s office or offices, look at what they have for handouts in their lobby: • Non plastic surgeons or dermatologists offering
• Weight loss programs
• Telemedicine
• Doctor’s names on the door or in brochures that are not on the policy
cosmetic procedures
Ask How They Make Their Money, Meaning:
• Do they rent space to any other doctors?
• Do they have any PAs on salary or working
• Do they have an urgent care or lab?
in their practices that are not covered under their malpractice policy?

Other Insurance
• Do they have entity and individual protection? Many physicians do not know the difference.
• If it’s a group with multiple owners, do they have
• Check out their web sites. See what services they
Directors and Officers and Errors and Omissions insurance - do they have the right kind?
offer. Is there a tech medical E&O exposure not currently covered? (Telemedicine, askadoc.com)

Trends
• Non standard and standard markets are crossing over
• Non standard can be cheaper than standard.
• Non standard policies offer true group policies
Big advantage
• Some doctors are not accepted by the non standard market and then
• Standard insurers are getting more flexible about non standard physicians
• Pricing is softer as is underwriting requirements.
each other.
that offer Departed Physician Roster versus having to tail off doctors when they leave.
taken by the standard market…who knew?
and often are not requiring them to buy tail, but accepting them with full
prior acts.
• We find many physicians who are put in the non standard market for all the wrong reasons.

Questions/concerns insured’s have and how to address them
• Upfront - price, price, price.
Most clients are not concerned with: AM Best rating
Loss control
How many cases the insurer has settled
Financial ratings of most kinds

Questions/concerns insured’s have and how to address them
• Most doctors buy malpractice in denial - they don’t think they’ll
ever be sued so they want the cheapest deal no matter what.
• We need to educate the market as much as possible to go beyond just price, but unfortunately most learn the hard way by their mistakes or those of their colleagues.
• When a physician is sued, the only thing they want to hear fromtheir broker is, “The attorney for your malpractice insurer willbe contacting you shortly.” Remember, this is a very significantevent in a physician’s life. Your job is to make sure everythinggoes the way the policy and the insurer’s procedure’s dictate.
Medical Spas and Clinics
• Non MDs running and owning clinics?
• Where does the Medical Director begin and end? The non MD owner needs to be very careful about
patient care when it comes to his Medical Director.
• How will claims be effected when consumers findthere is no MD onsite?
• Vicarious liability issues for Medical Spas where an MD owns a spa and is also a partner in a medical
Group.
Healthcare D&O Risk Exposures
Presented by
Alice JohanssonMarch 7, 2007

It’s not your grandmother’s community hospital any more

Shift in exposures created by spiral of competitive and environmental issues
in the industry
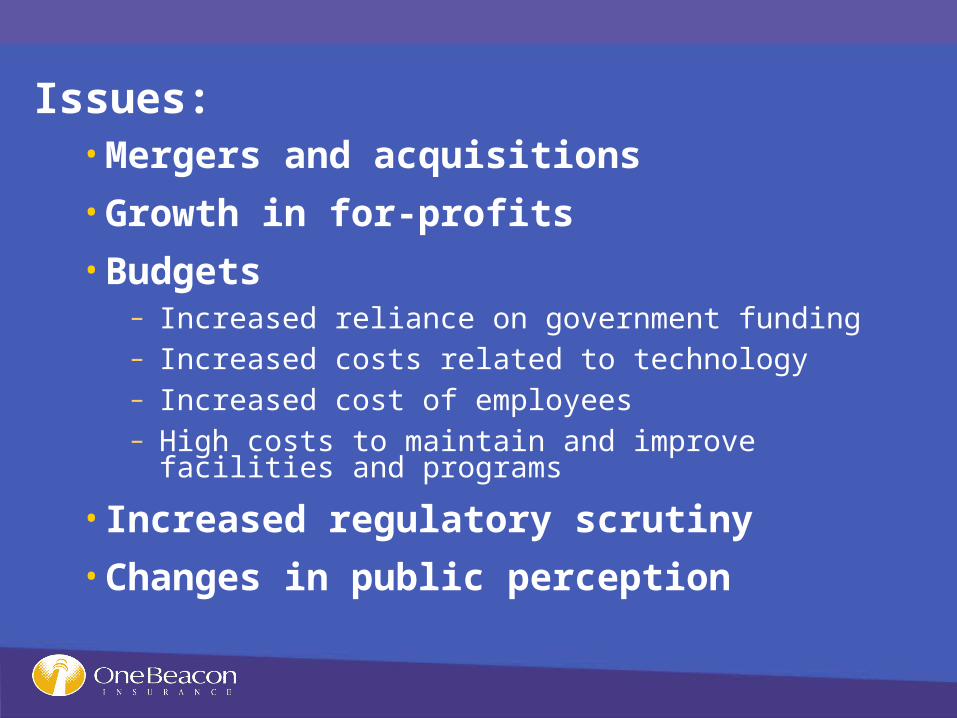
Issues:• Mergers and acquisitions
• Growth in for-profits
• Budgets– Increased reliance on government funding– Increased costs related to technology– Increased cost of employees– High costs to maintain and improve facilities and
programs
• Increased regulatory scrutiny
• Changes in public perception
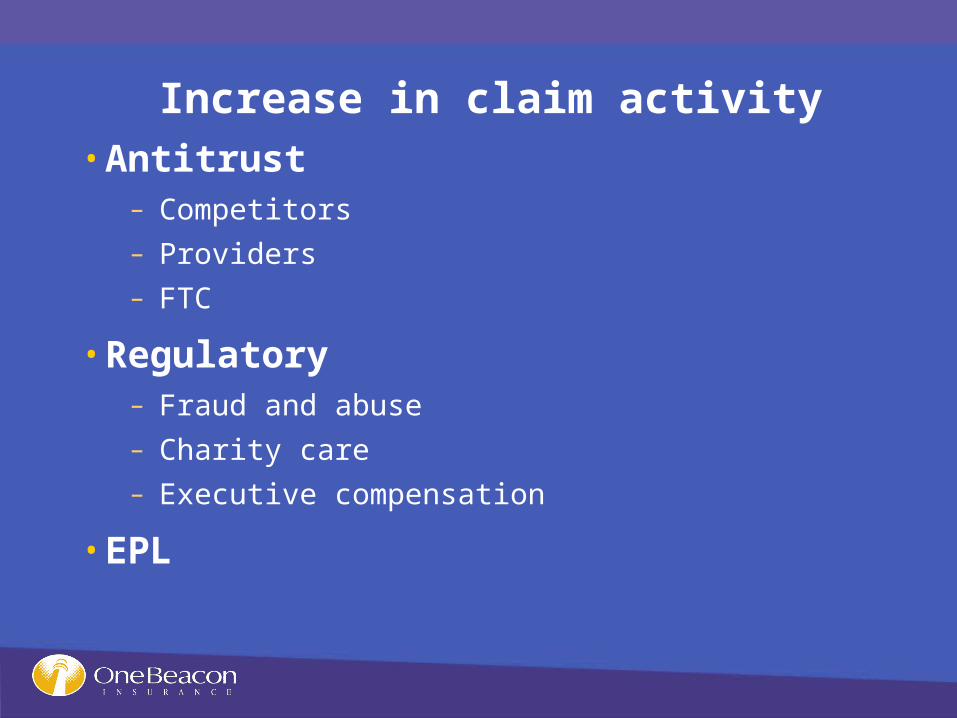
Increase in claim activity• Antitrust
– Competitors– Providers– FTC
• Regulatory– Fraud and abuse– Charity care– Executive compensation
• EPL

What does all of this mean to an underwriter?
• Areas of underwriting focus
• Declinations

Managed Care Risk Exposures
Presented by
Alice JohanssonMarch 7, 2007
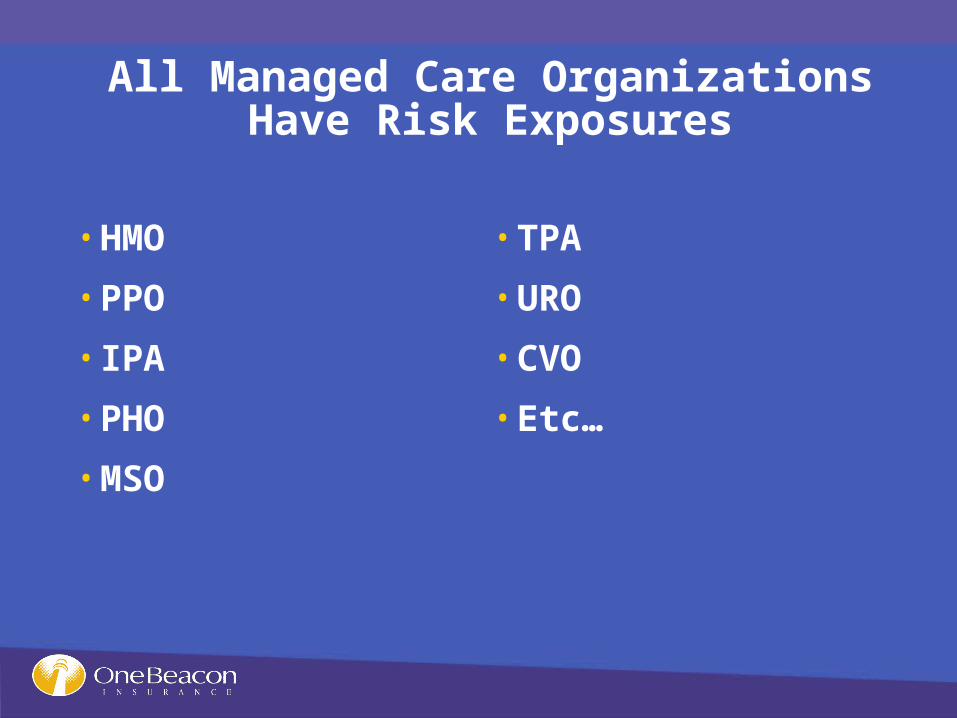
All Managed Care OrganizationsHave Risk Exposures
• HMO
• PPO
• IPA
• PHO
• MSO
• TPA
• URO
• CVO
• Etc…
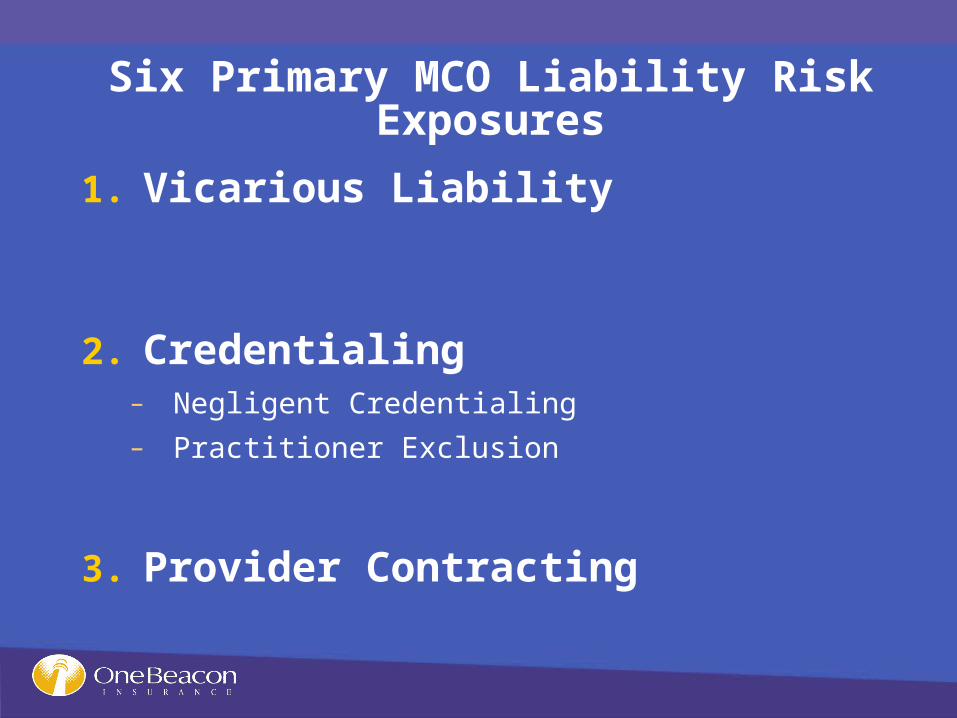
Six Primary MCO Liability Risk Exposures
1. Vicarious Liability
2. Credentialing– Negligent Credentialing– Practitioner Exclusion
3. Provider Contracting
Six Primary MCO Liability Risk Exposures
4. Utilization Management
– Financial incentives
– Practice of medicine
– Breach of contract/bad faith claim denial
Six Primary MCO Liability Risk Exposures
5. Misrepresentation– Of the coverage itself– Of the quality of care– Of the quality of the providers– By non-disclosure of financial arrangements– Through promotional materials– Through statements by employees
Six Primary MCO Liability Risk Exposures
6. Business Disputes– Customers– Providers– Vendors
MCO Exposure Shift
• Bodily injury claims on the decrease
• Business practices claims on the increase
• Increase in class action claims
• High cost of antitrust claims
• Shift in defense vs indemnity dollars spent

Contact me at [email protected]
• MCO organization descriptions
• Article on historical managed care claim trends
• Managed Care claim scenarios

Technology and Information Risk Summary
Drew Bartkiewicz
Darwin Professional Underwriters
Darwin Professional Copyright 2007
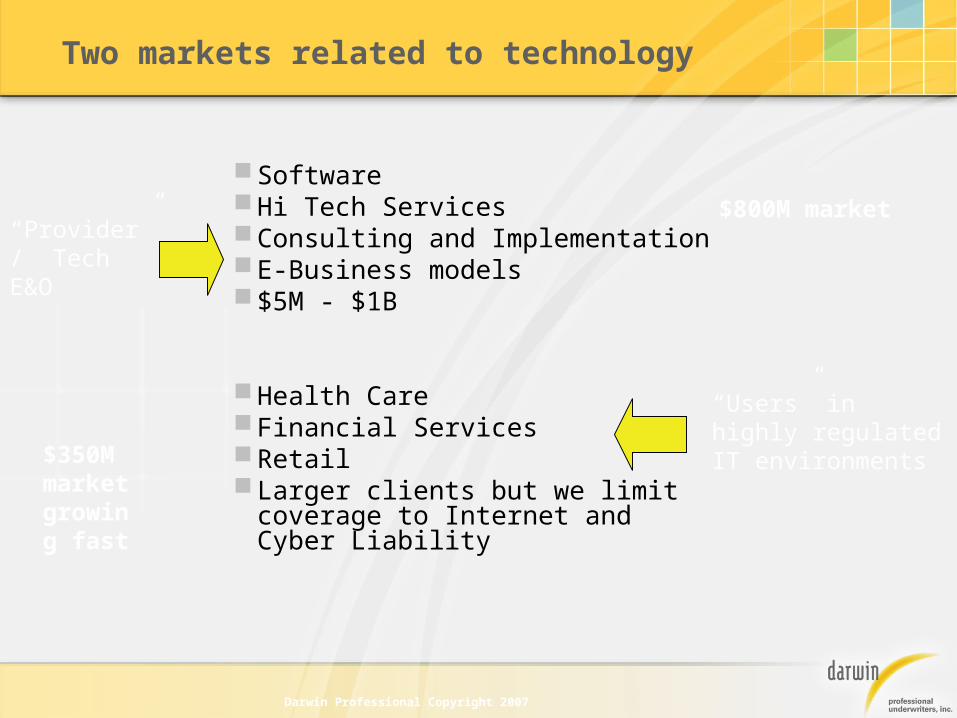
Two markets related to technology
SoftwareHi Tech Services Consulting and ImplementationE-Business models$5M - $1B
Health CareFinancial ServicesRetailLarger clients but we limit coverage to
Internet and Cyber Liability
“Provider” / Tech E&O
“Users” in highly regulated IT environments
$800M market
$350M market growing fast

Darwin Professional Copyright 2007
In high compliance industries, there is a clear technology landscape for Insurance.
Builders Software product for others as primary business model (product liabilities)
Software product as an enabler or secondary business model (for their customers or partners).
Providers On site tech services for others as primary business model (integration, installation, professional liabilities)
Information-based services for others as added service (sending newsletters, reports, analysis). Have content and professional liabilities.
Operators Remote management of data, processes, applications as primary business model (privacy and security liabilities)
Aggregation of direct customer or patient data or hosted online application to support their primary business of medical or financial transactions (privacy and security liability)
Providers Users

Darwin Professional Copyright 2007
Every professional industry has changed
1. Improved professional efficiency2. Demand from customers for access and “self service”3. Compliance expectations4. Competitive mandate5. Financial requirements to drive better performance, aka
higher revenue / employee
Technology has become necessary to respond to:
A Business Imperative that every other industry has embraced.
Darwin Professional Copyright 2007
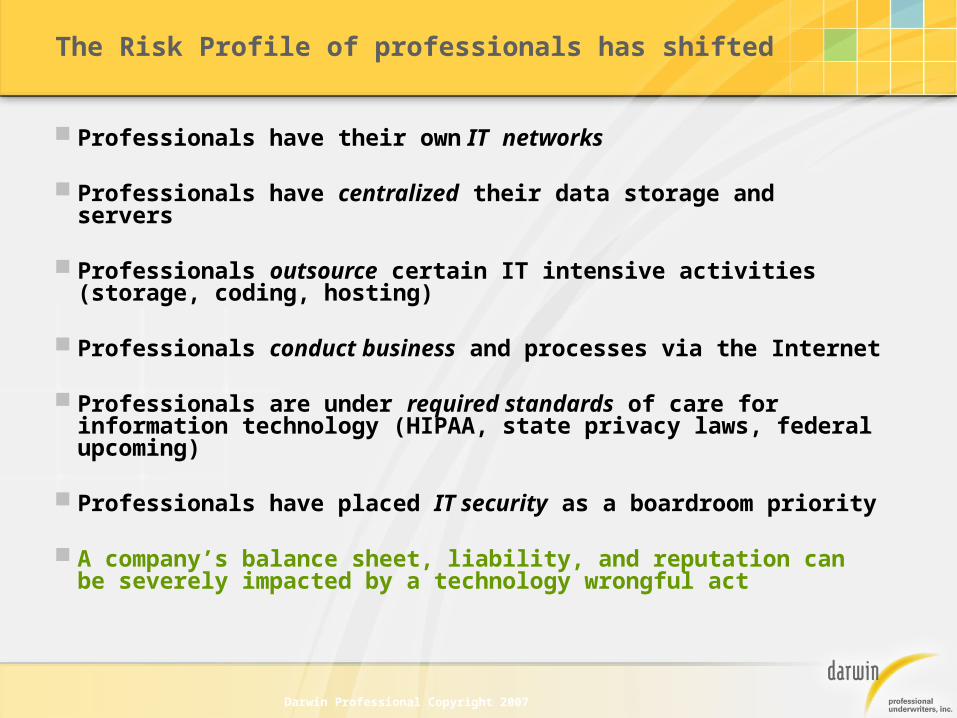
Professionals have their own IT networks
Professionals have centralized their data storage and servers
Professionals outsource certain IT intensive activities (storage, coding, hosting)
Professionals conduct business and processes via the Internet
Professionals are under required standards of care for information technology (HIPAA, state privacy laws, federal upcoming)
Professionals have placed IT security as a boardroom priority
A company’s balance sheet, liability, and reputation can be severely impacted by a technology wrongful act
The Risk Profile of professionals has shifted
Darwin Professional Copyright 2007
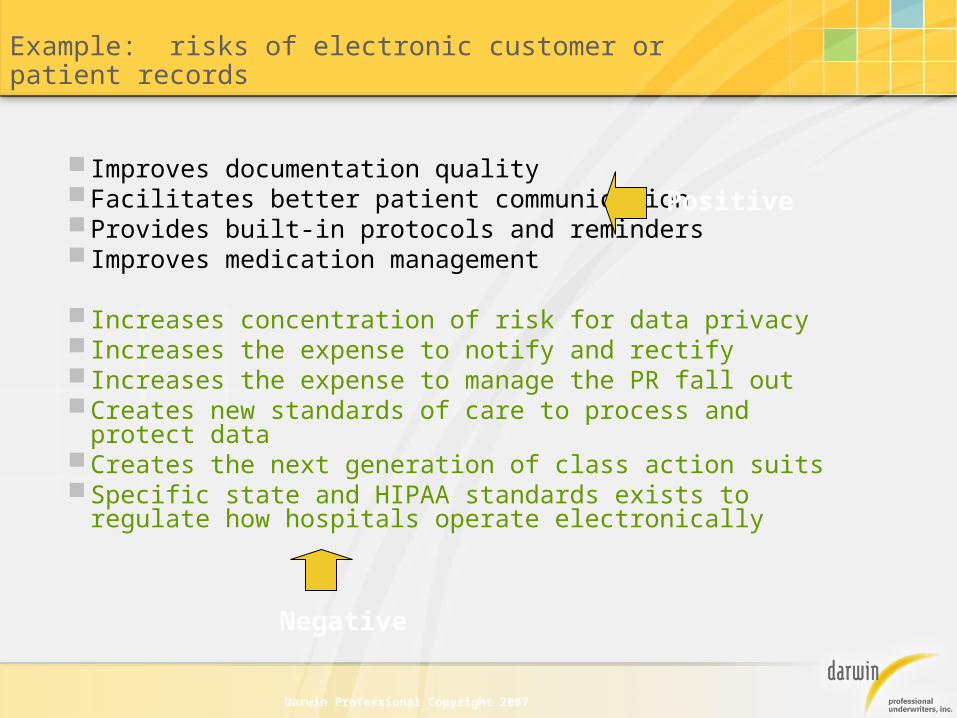
Example: risks of electronic customer or patient records
Improves documentation quality Facilitates better patient communication Provides built-in protocols and reminders Improves medication management
Increases concentration of risk for data privacy Increases the expense to notify and rectify Increases the expense to manage the PR fall outCreates new standards of care to process and protect dataCreates the next generation of class action suitsSpecific state and HIPAA standards exists to regulate how
hospitals operate electronically
Positive
Negative

Darwin Professional Copyright 2007
The Internet is also driving new liabilities
Email errorsWebsite incidents Improved communication and “patient
information”
Wrong online adviceWrong person accessing the data
(privacy)Wrong people sent the data (privacy) Infringement of other’s copyright and
trademarkLibel, slander, defamation via chat
rooms, blogs, advertising
Darwin Professional Copyright 2007
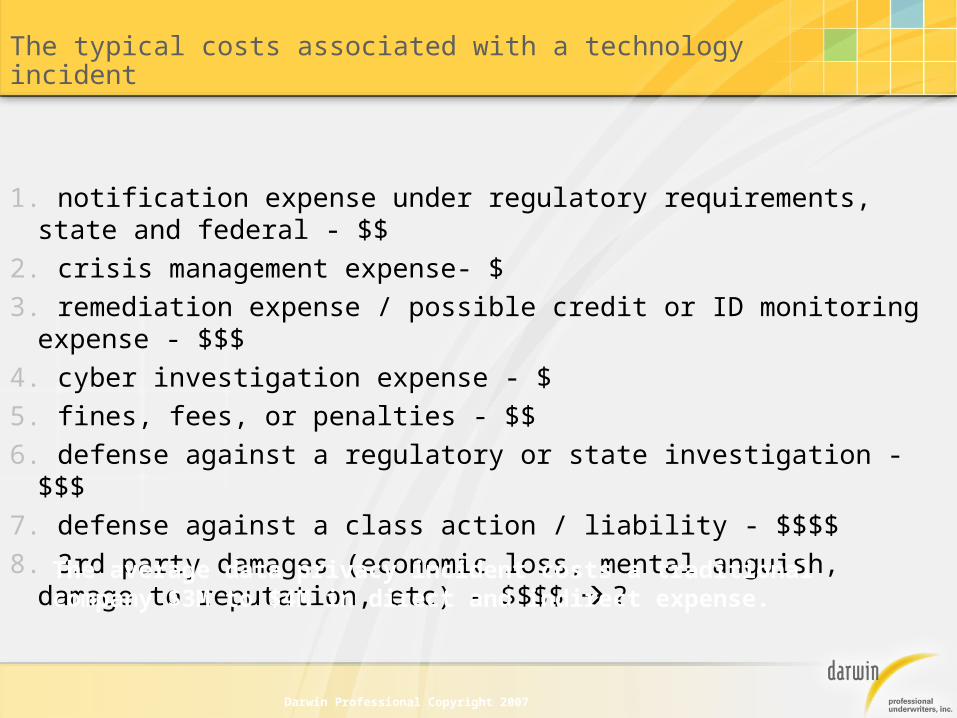
The typical costs associated with a technology incident
1. notification expense under regulatory requirements, state and federal - $$
2. crisis management expense- $
3. remediation expense / possible credit or ID monitoring expense - $$$
4. cyber investigation expense - $
5. fines, fees, or penalties - $$
6. defense against a regulatory or state investigation - $$$
7. defense against a class action / liability - $$$$
8. 3rd party damages (economic loss, mental anguish, damage to reputation, etc) - $$$$ ?
The average data privacy incident costs a traditional company $3M to $4M in direct and indirect expense.
Darwin Professional Copyright 2007
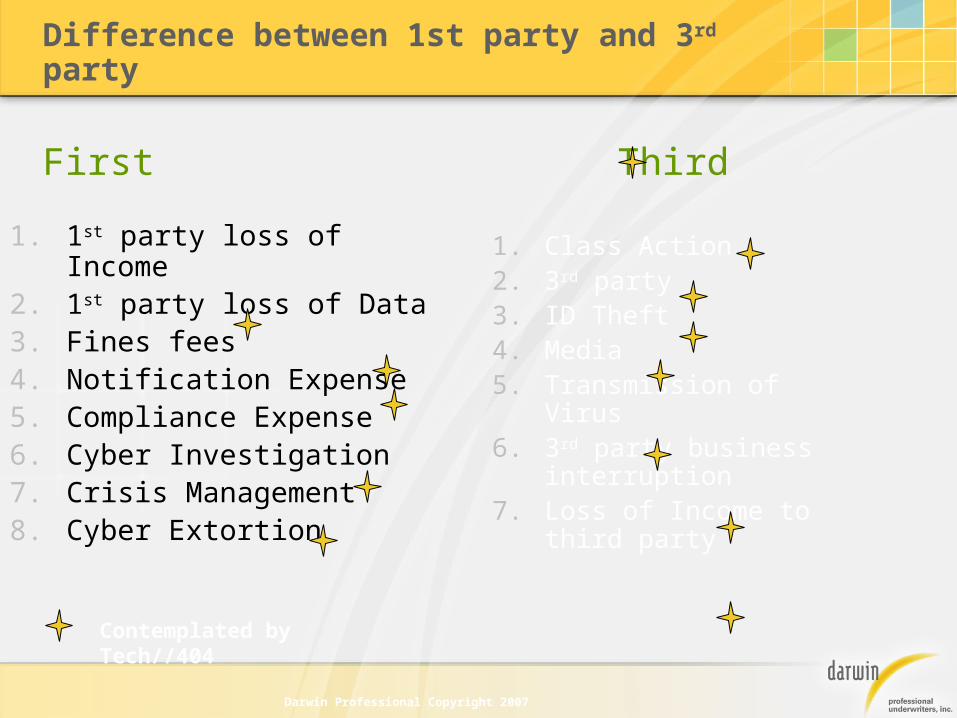
Difference between 1st party and 3rd party
1. 1st party loss of Income2. 1st party loss of Data3. Fines fees4. Notification Expense5. Compliance Expense6. Cyber Investigation7. Crisis Management8. Cyber Extortion
First Third
1. Class Action2. 3rd party3. ID Theft4. Media5. Transmission of
Virus6. 3rd party business
interruption7. Loss of Income to
third party
Contemplated by Tech//404
Darwin Professional Copyright 2007
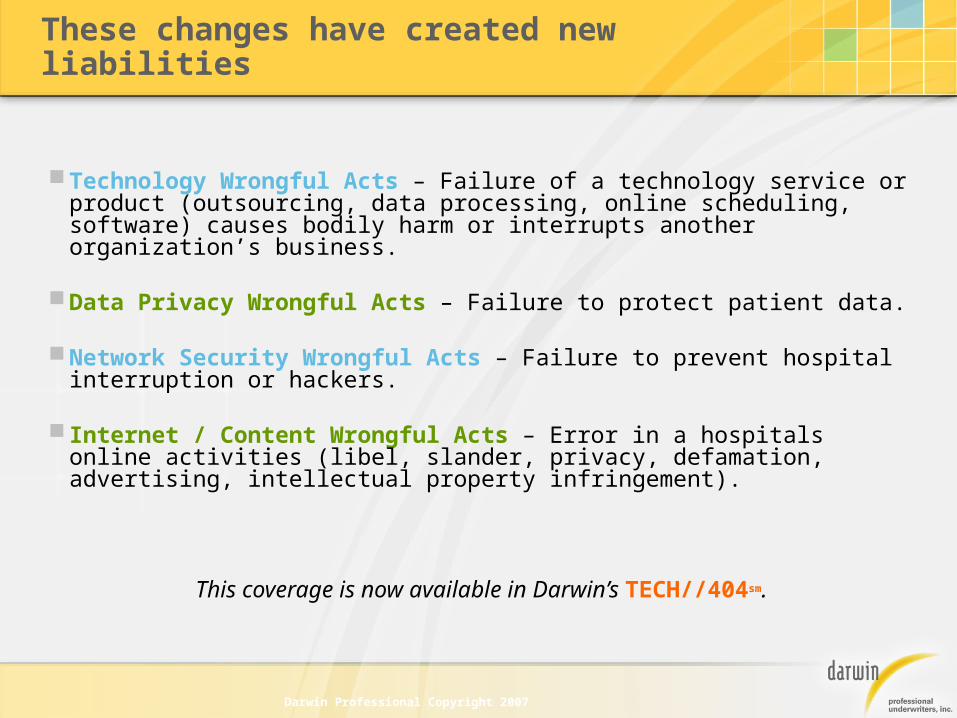
Technology Wrongful Acts – Failure of a technology service or product (outsourcing, data processing, online scheduling, software) causes bodily harm or interrupts another organization’s business.
Data Privacy Wrongful Acts – Failure to protect patient data.
Network Security Wrongful Acts – Failure to prevent hospital interruption or hackers.
Internet / Content Wrongful Acts – Error in a hospitals online activities (libel, slander, privacy, defamation, advertising, intellectual property infringement).
This coverage is now available in Darwin’s TECH//404sm.
These changes have created new liabilities
Darwin Professional Copyright 2007
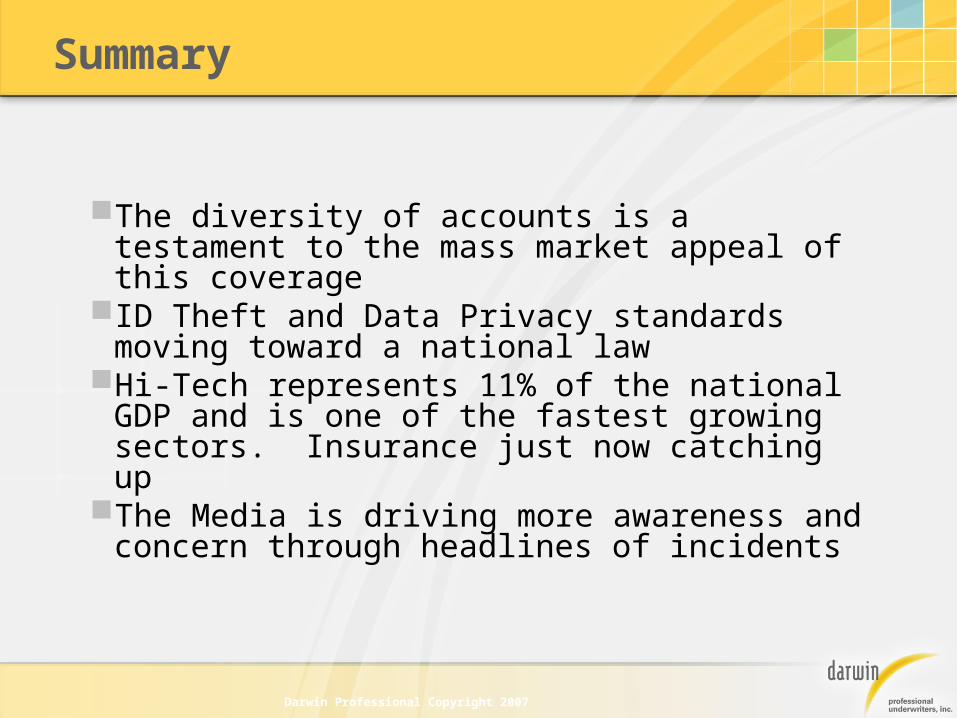
Summary
The diversity of accounts is a testament to the mass market appeal of this coverage
ID Theft and Data Privacy standards moving toward a national law
Hi-Tech represents 11% of the national GDP and is one of the fastest growing sectors. Insurance just now catching up
The Media is driving more awareness and concern through headlines of incidents

Darwin Professional Copyright 2007
Resources to help you sell…
www.tech-404.com for general education
Our Industry Specific sell sheets on www.darwinpro.com
Our articlesOur industry specific self-
assessmentsOur access on client visits
or client calls

Darwin Professional Copyright 2007
Drew Bartkiewicz
860-284-1456
Darwin Professional Underwriters
Questions
Contact:

Darwinism #8 regarding Information Currency
“Information thieves, black market buyers of data, and data brokers are definitive reference
points to suggest that information has surged as a
new resource, no longer protected by scarcity and
location, but unleashed with abundance and access.”

Questions and Answers
March 7, 2007