Embed Size (px)
Citation preview

We’re for you. Healthcare Reform What The Future Holds
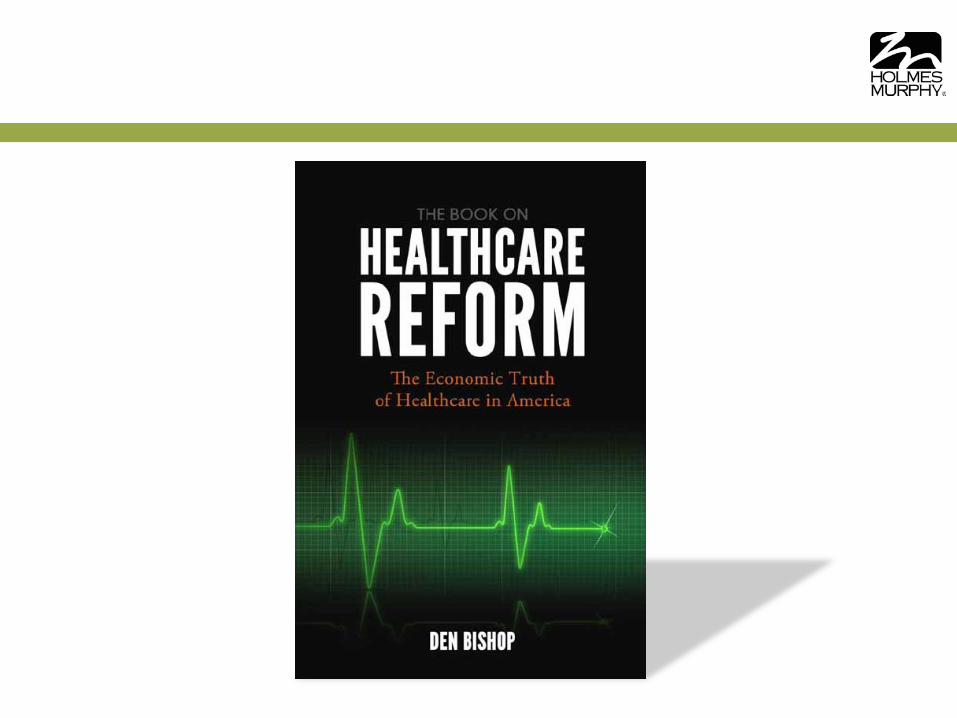
Average Annual Premiums for Single and Family Coverage,
1999-2012
* Estimate is statistically different from estimate for the previous year shown (p<.05).
Source: Kaiser/HRET Survey of Employer-Sponsored Health Benefits, 1999-2012.
$15,745*
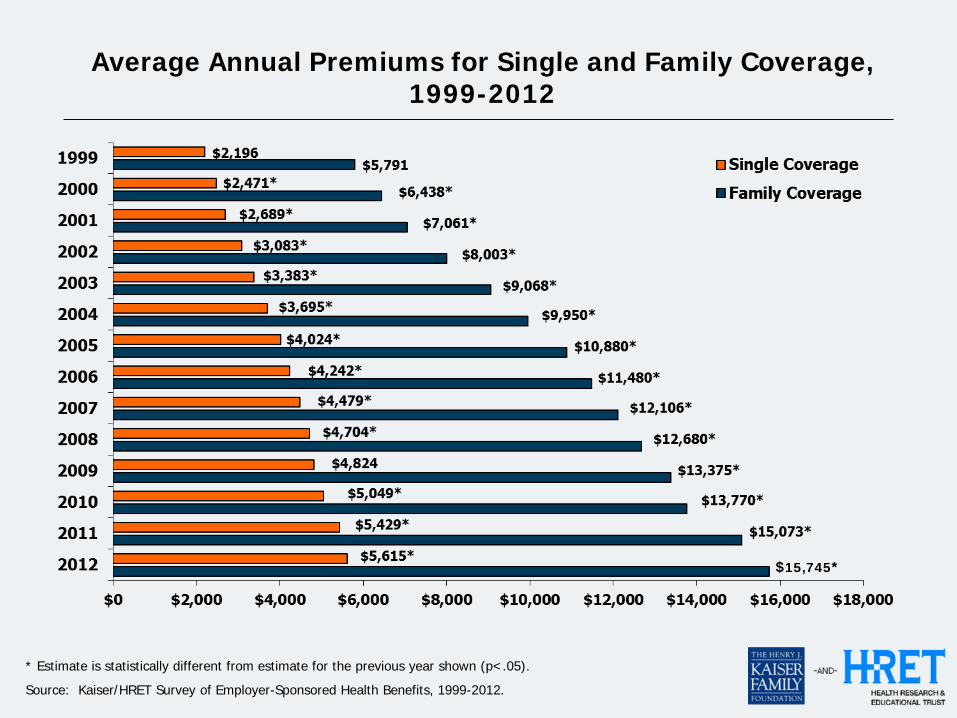
Cumulative Increases in Health Insurance Premiums, Workers’ Contributions to Premiums, Inflation, and
Workers’ Earnings, 1999-2012
38%
109%
172%
38%
113%
180%
11%
29%
47%
8%
24%
38%
0%
20%
40%
60%
80%
100%
120%
140%
160%
180%
200%
1999 2000 2001 2002 2003 2004 2005 2006 2007 2008 2009 2010 2011 2012
Health Insurance Premiums Workers' Contribution to Premiums Workers' Earnings Overall Inflation
Source: Kaiser/HRET Survey of Employer-Sponsored Health Benefits, 1999-2012. Bureau of Labor Statistics, Consumer Price Index, U.S. City Average of Annual Inflation (April to April), 1999-2012; Bureau of Labor Statistics, Seasonally Adjusted Data from the Current Employment Statistics Survey, 1999-2012 (April to April).
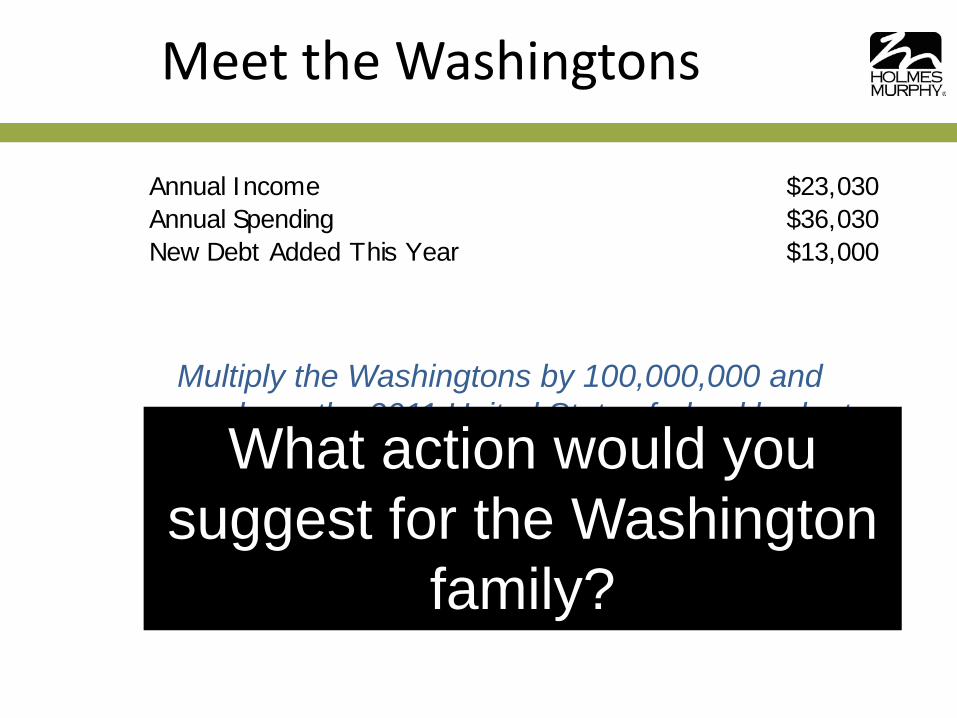
Annual Income $23,030Annual Spending $36,030New Debt Added This Year $13,000Credit Card Balance $101,280Mortgage $633,000
Meet the Washingtons
Annual Income $2,303,000,000,000Annual Spending $3,603,000,000,000New Debt Added This Year $1,300,000,000,000Debt Held by Public $10,128,000,000,000Unfunded Soc. Sec. / Medicare Liability $63,300,000,000,000
Multiply the Washingtons by 100,000,000 and you have the 2011 United States federal budget
What action would you suggest for the Washington
family?

PPACA and Medicare
• The gap between Medicare and private insurance payments to hospitals will continue to spread because the inflation rate for Medicare is now legislatively fixed
• Medicare future funding – Average of medical services CPI
and urban consumer CPI – After 2019, GDP growth plus 1%
• Independent Payment Advisory Board (IPAB)
6
$-
$10
$20
$30
$40
$50
$60
$70
$80
$90
2009 2010
$89.22
$36.60
Trill
ion
$
Medicare Unfunded Liability
Liability dropped by
over $56 trillion in one year
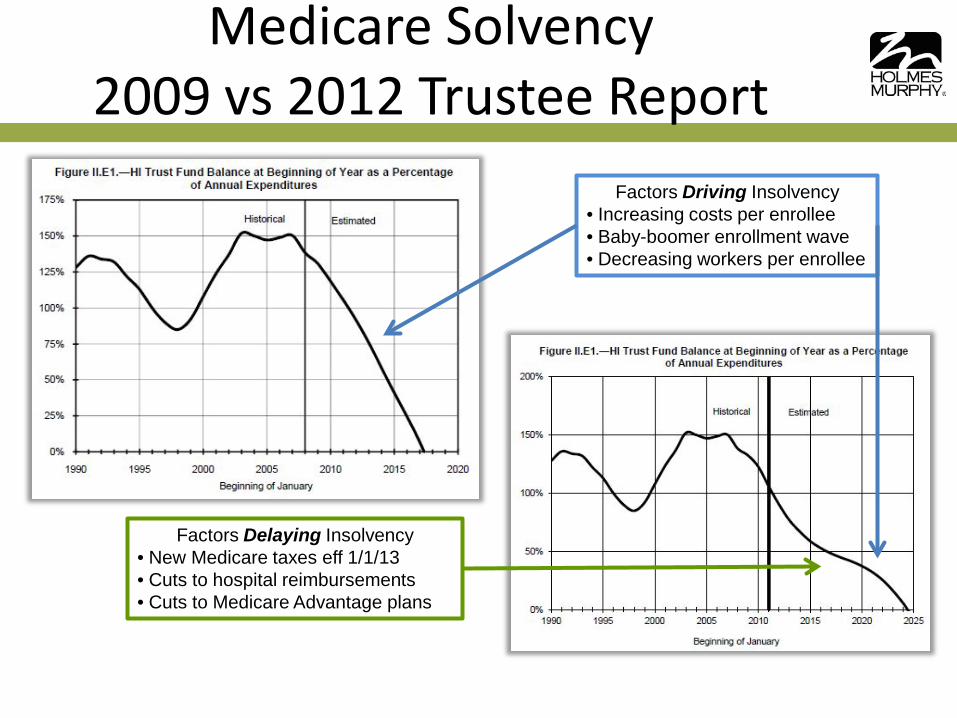
Medicare Solvency 2009 vs 2012 Trustee Report
Factors Driving Insolvency • Increasing costs per enrollee • Baby-boomer enrollment wave • Decreasing workers per enrollee
Factors Delaying Insolvency • New Medicare taxes eff 1/1/13 • Cuts to hospital reimbursements • Cuts to Medicare Advantage plans
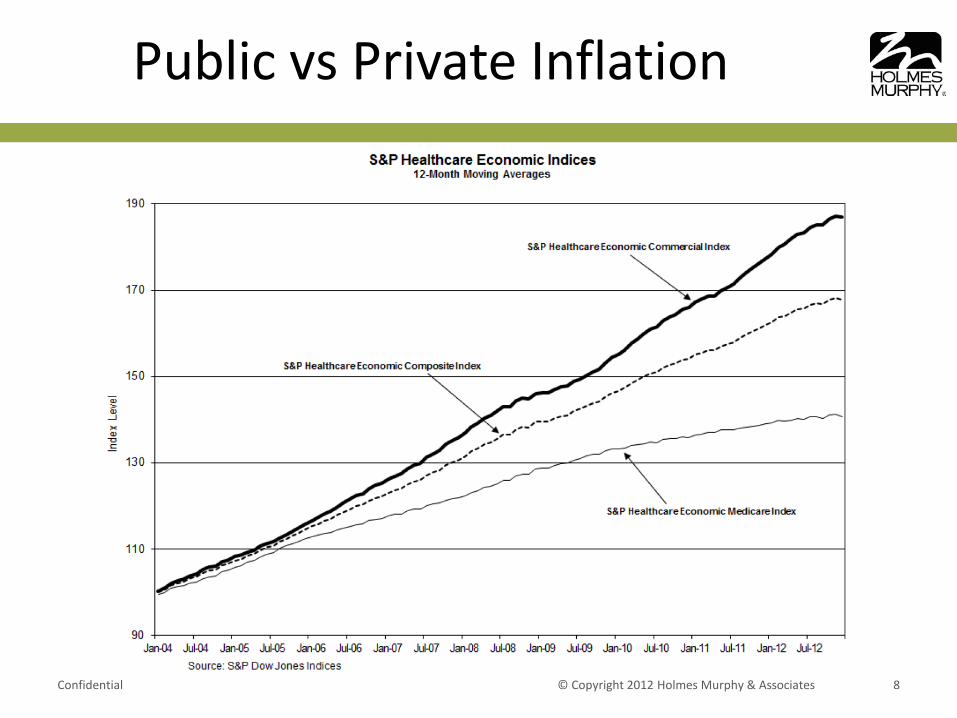
Public vs Private Inflation
Confidential © Copyright 2012 Holmes Murphy & Associates 8
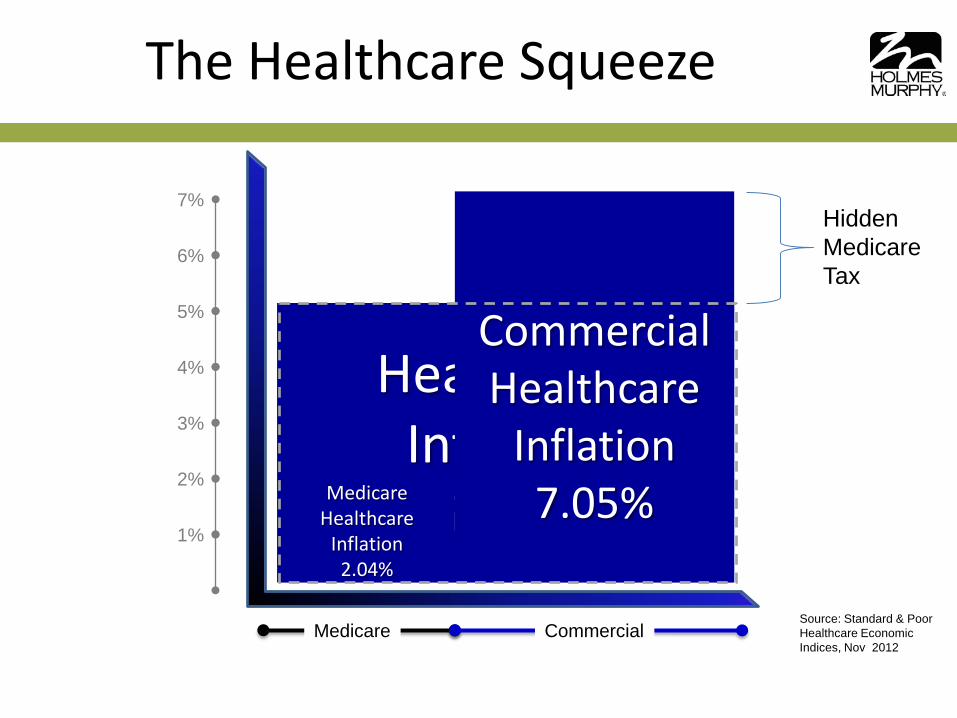
The Healthcare Squeeze
1%
2%
3%
4%
5%
6%
7%
Healthcare Inflation
5.06% Medicare Healthcare
Inflation 2.04%
Commercial Healthcare
Inflation 7.05%
Hidden Medicare Tax
Medicare Commercial Source: Standard & Poor Healthcare Economic Indices, Nov 2012
3
1
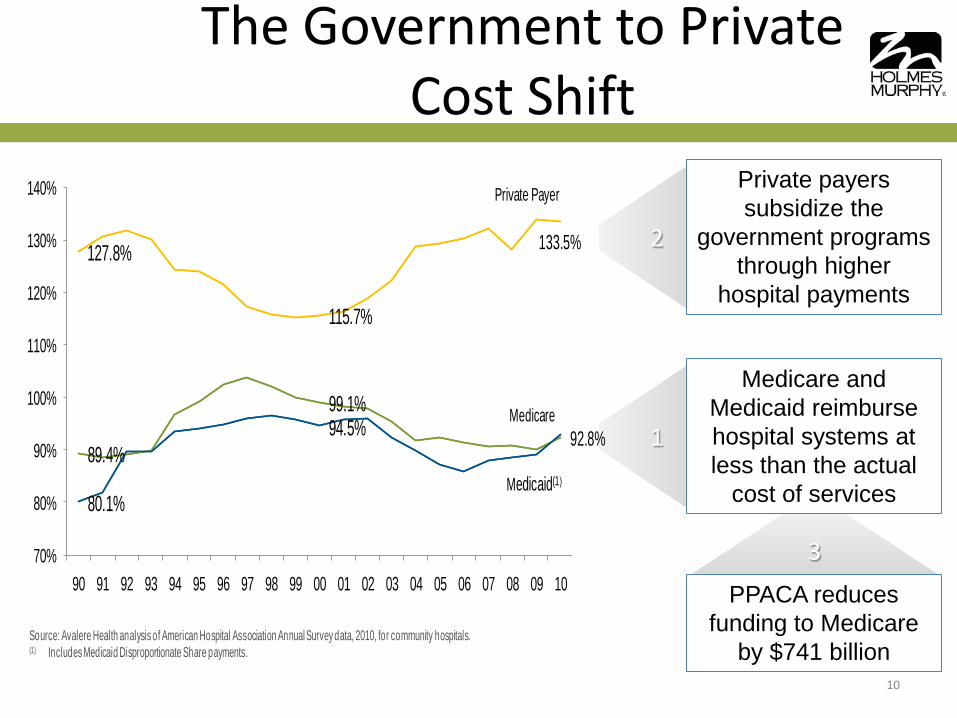
Source: Avalere Health analysis of American Hospital Association Annual Survey data, 2010, for community hospitals. (1) Includes Medicaid Disproportionate Share payments.
89.4%
99.1% Medicare
80.1%
94.5%
Medicaid(1)
127.8%
115.7%
Private Payer
70%
80%
90%
100%
110%
120%
130%
140%
90 91 92 93 94 95 96 97 98 99 00 01 02 03 04 05 06 07 08 09 10
133.5%
92.8%
The Government to Private Cost Shift
10
Medicare and Medicaid reimburse hospital systems at less than the actual
cost of services
2
Private payers subsidize the
government programs through higher
hospital payments
PPACA reduces funding to Medicare
by $741 billion
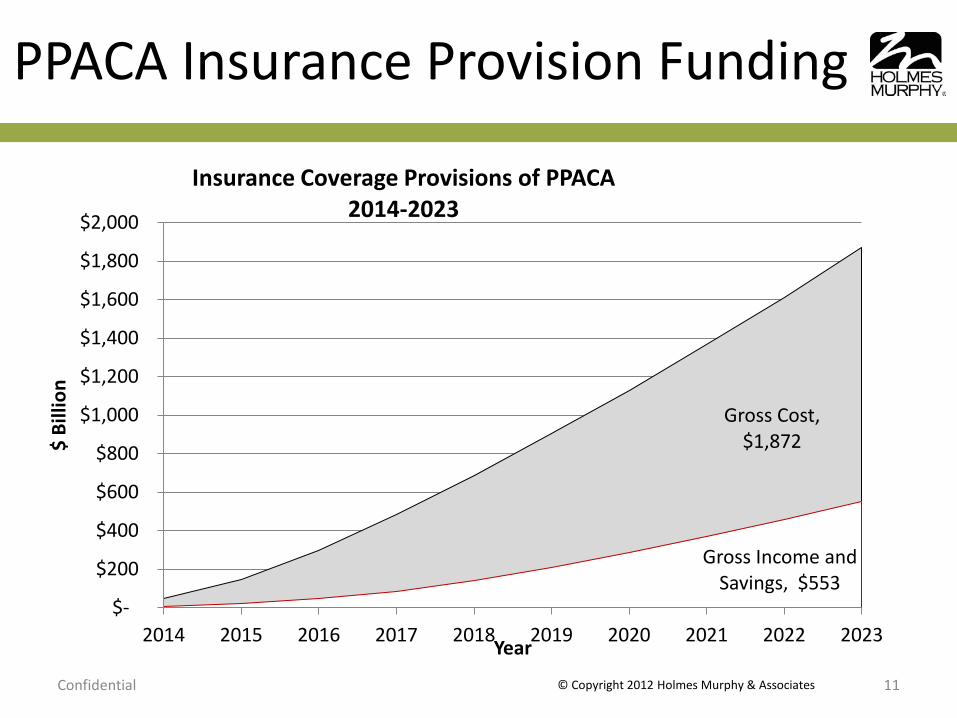
PPACA Insurance Provision Funding
Confidential © Copyright 2012 Holmes Murphy & Associates 11
Gross Cost, $1,872
Gross Income and Savings, $553
$-
$200
$400
$600
$800
$1,000
$1,200
$1,400
$1,600
$1,800
$2,000
2014 2015 2016 2017 2018 2019 2020 2021 2022 2023
$ Bi
llion
Year
Insurance Coverage Provisions of PPACA 2014-2023
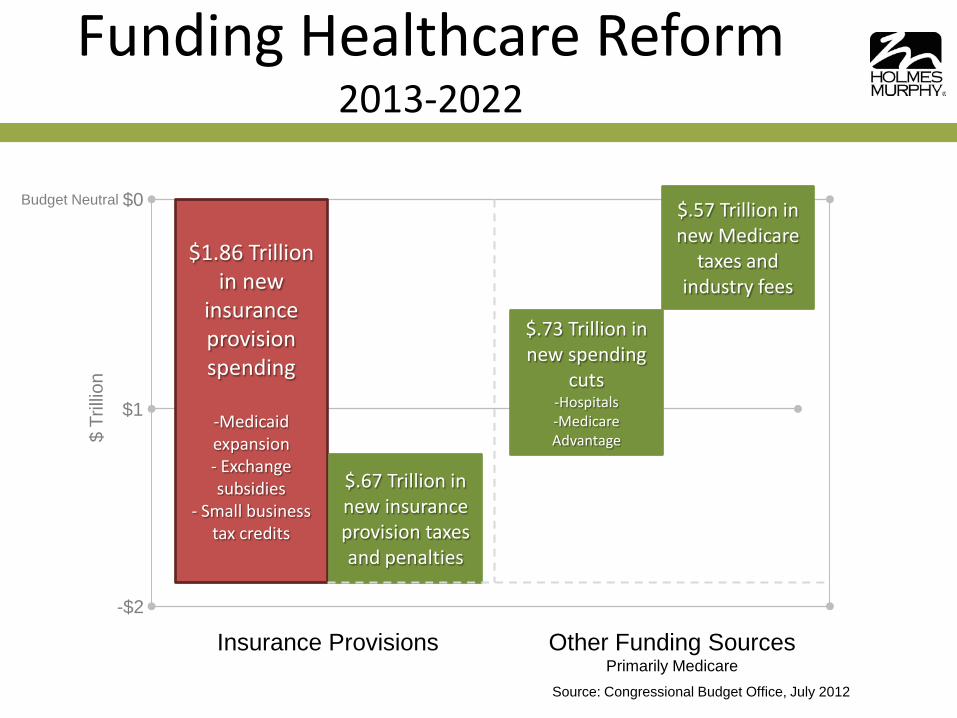
Funding Healthcare Reform 2013-2022
$ Tr
illio
n
$0
$1
-$2
$1.86 Trillion in new
insurance provision spending
-Medicaid expansion - Exchange subsidies
- Small business tax credits
$.73 Trillion in new spending
cuts -Hospitals -Medicare Advantage
$.57 Trillion in new Medicare
taxes and industry fees
Insurance Provisions Other Funding Sources Primarily Medicare
$.67 Trillion in new insurance provision taxes and penalties
Source: Congressional Budget Office, July 2012
Budget Neutral
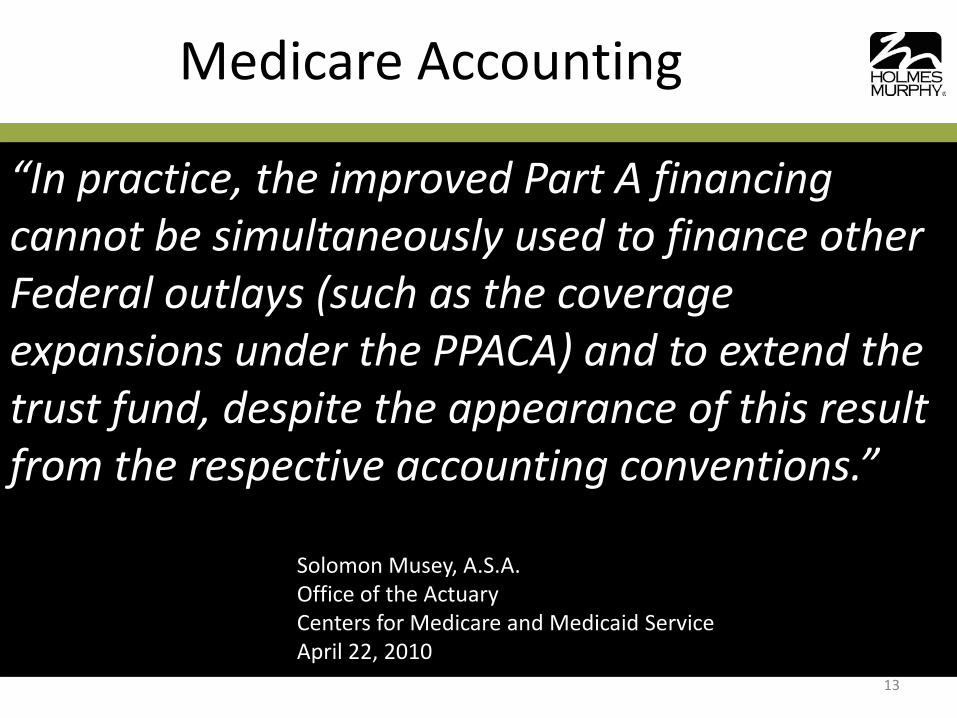
Medicare Accounting
13
“In practice, the improved Part A financing cannot be simultaneously used to finance other Federal outlays (such as the coverage expansions under the PPACA) and to extend the trust fund, despite the appearance of this result from the respective accounting conventions.” Solomon Musey, A.S.A. Office of the Actuary Centers for Medicare and Medicaid Service April 22, 2010
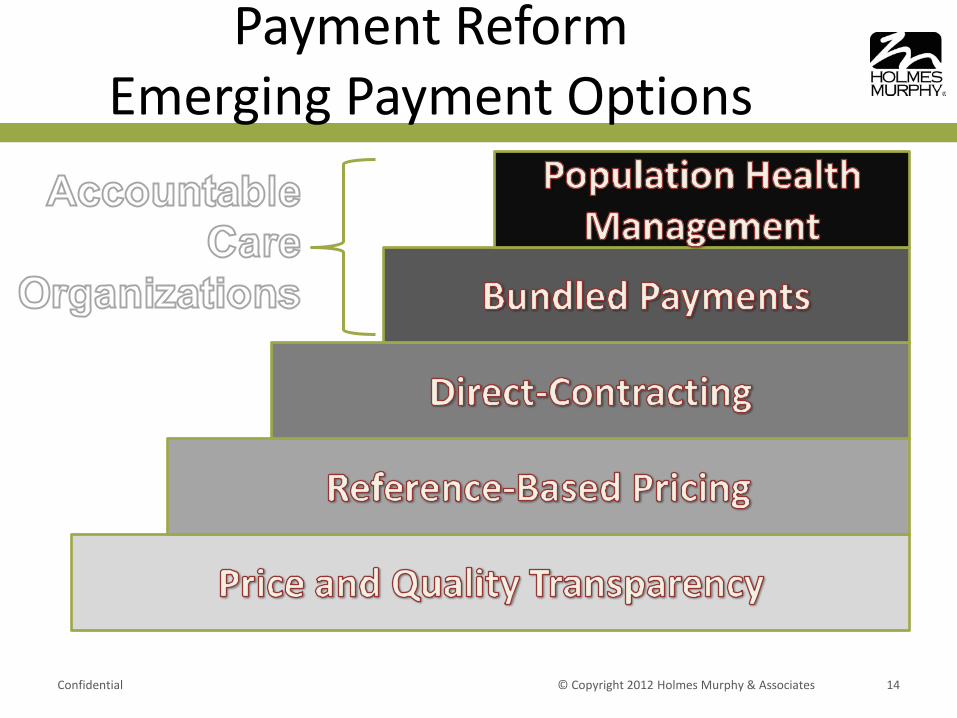
Payment Reform Emerging Payment Options
Confidential © Copyright 2012 Holmes Murphy & Associates 14
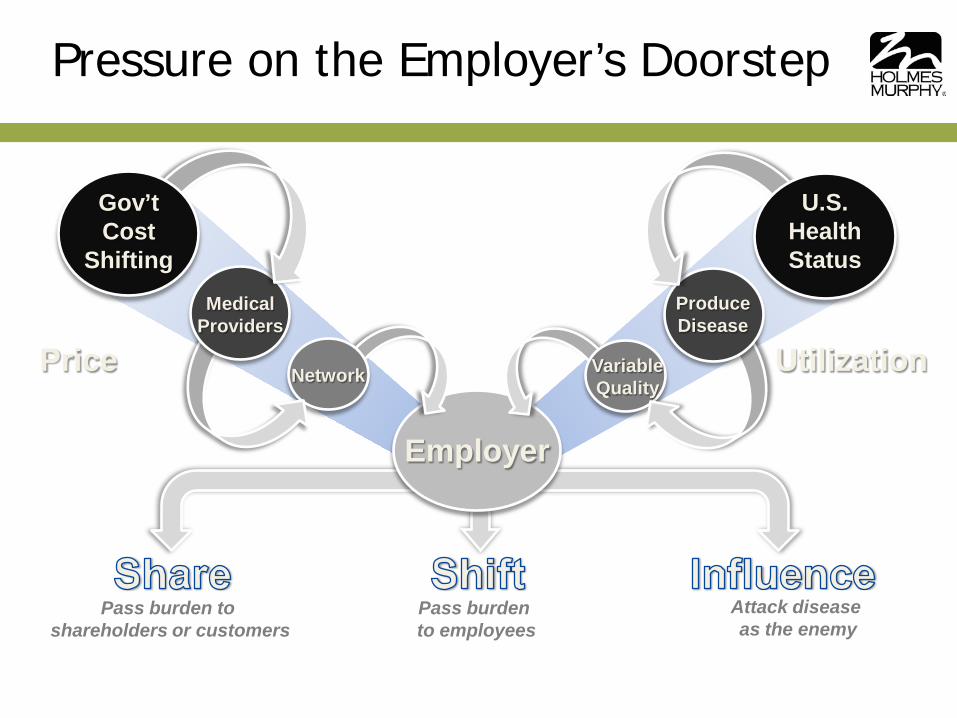
Attack disease as the enemy
Pass burden to shareholders or customers
Pass burden to employees
Pressure on the Employer’s Doorstep
Employer
Network
Produce Disease
Medical Providers
Variable Quality
Gov’t Cost
Shifting
U.S. Health Status
Price Utilization
Healthcare 2020
Confidential © Copyright 2012 Holmes Murphy & Associates 16
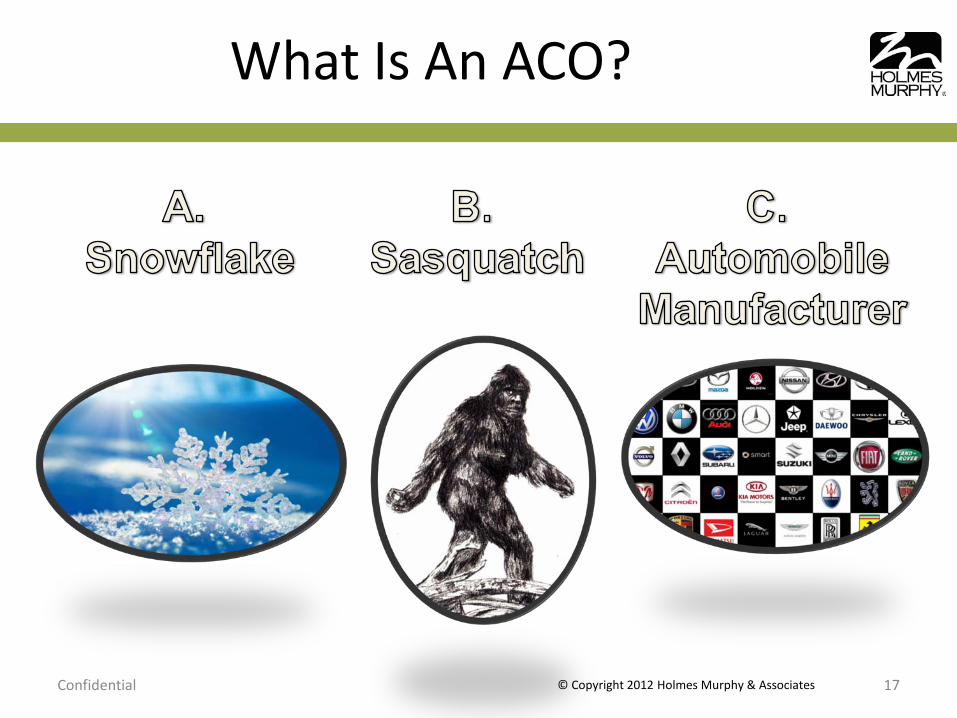
What Is An ACO?
Confidential © Copyright 2012 Holmes Murphy & Associates 17
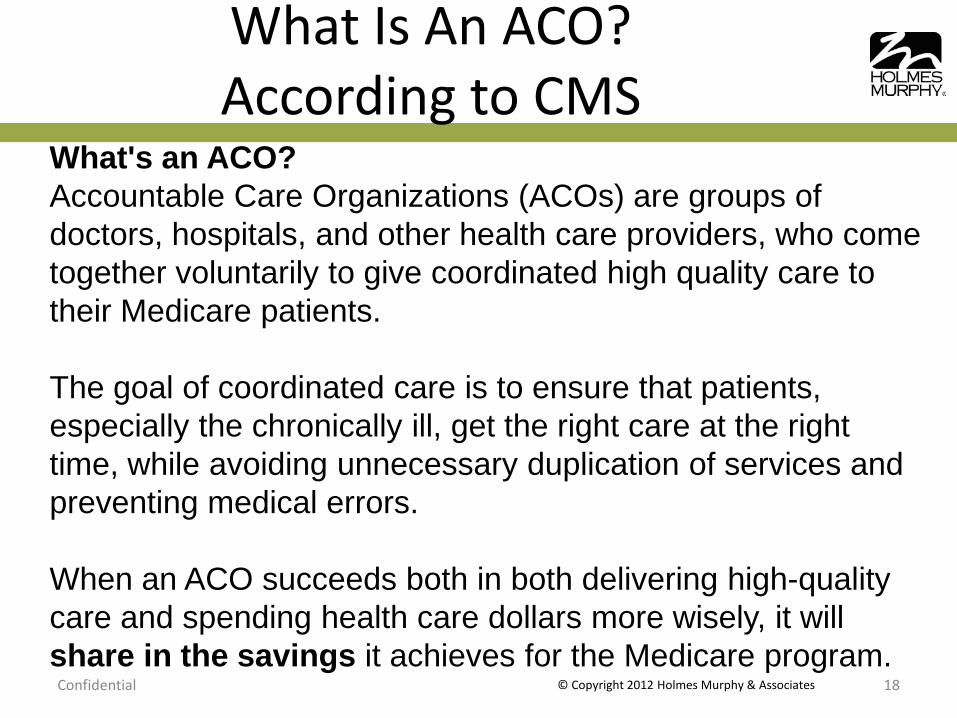
What Is An ACO? According to CMS
Confidential © Copyright 2012 Holmes Murphy & Associates 18
What's an ACO? Accountable Care Organizations (ACOs) are groups of doctors, hospitals, and other health care providers, who come together voluntarily to give coordinated high quality care to their Medicare patients. The goal of coordinated care is to ensure that patients, especially the chronically ill, get the right care at the right time, while avoiding unnecessary duplication of services and preventing medical errors. When an ACO succeeds both in both delivering high-quality care and spending health care dollars more wisely, it will share in the savings it achieves for the Medicare program.
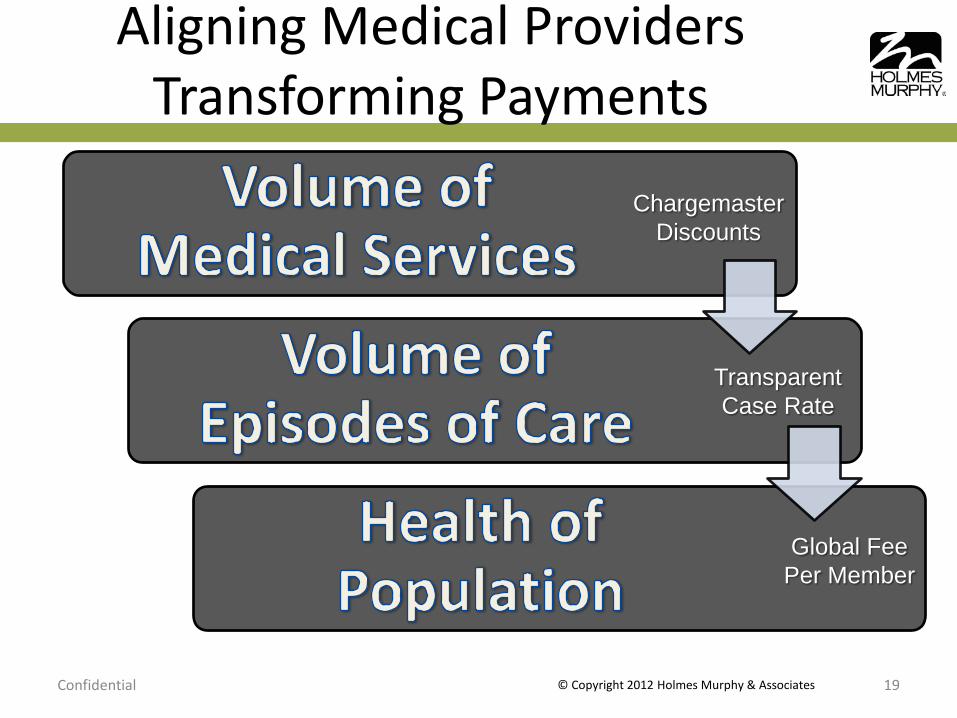
Aligning Medical Providers Transforming Payments
Confidential © Copyright 2012 Holmes Murphy & Associates 19
Chargemaster Discounts
Transparent Case Rate
Global Fee Per Member
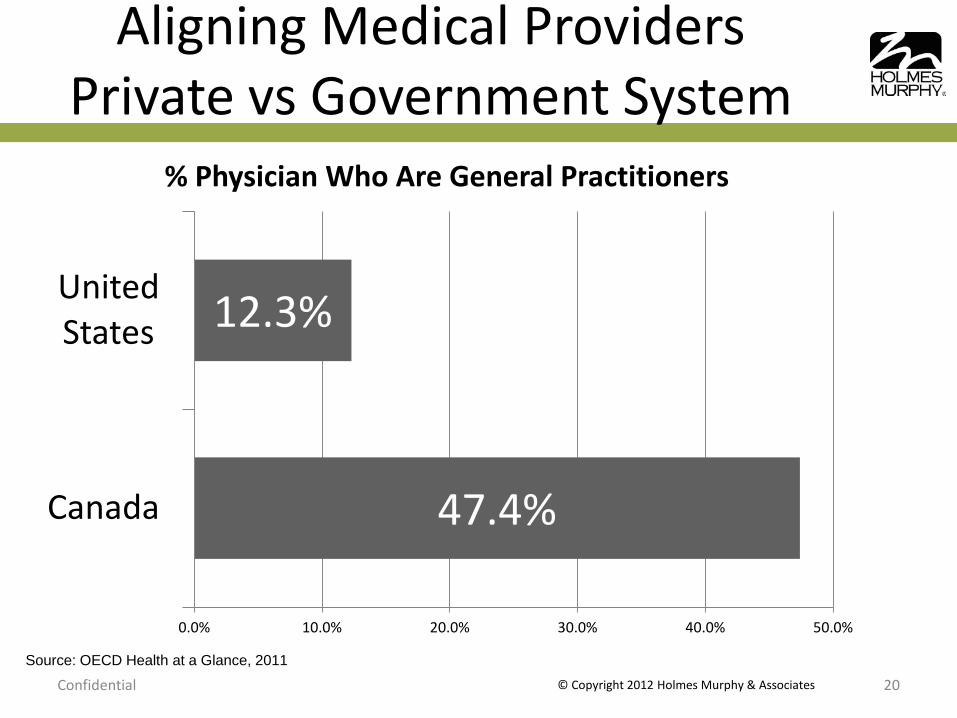
Aligning Medical Providers Private vs Government System
Confidential © Copyright 2012 Holmes Murphy & Associates 20
47.4%
12.3%
0.0% 10.0% 20.0% 30.0% 40.0% 50.0%
Canada
United States
% Physician Who Are General Practitioners
Source: OECD Health at a Glance, 2011
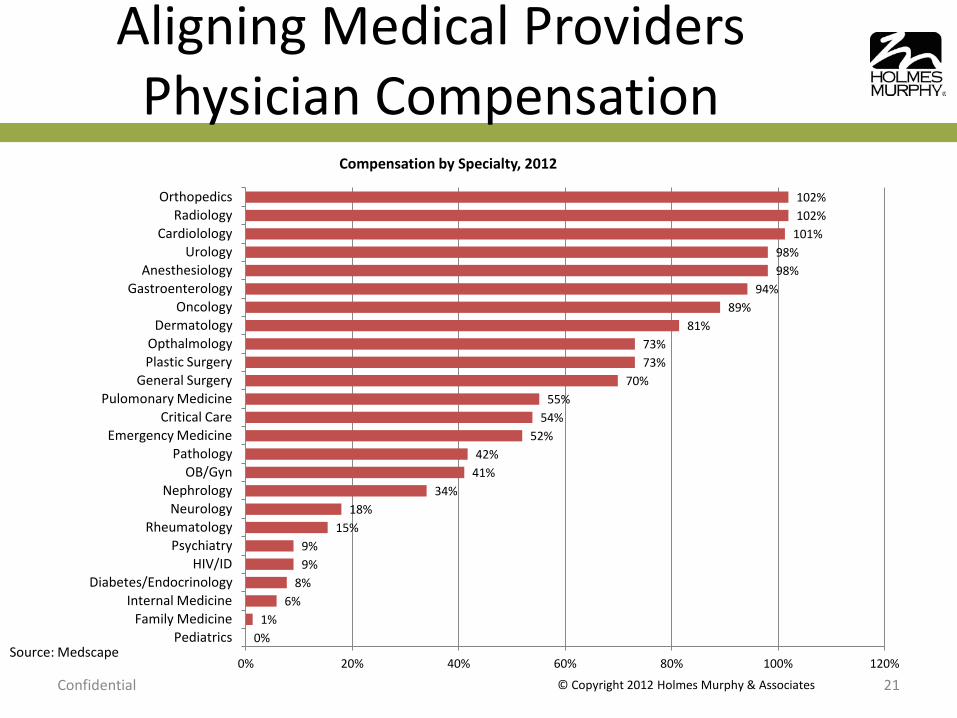
Aligning Medical Providers Physician Compensation
Confidential © Copyright 2012 Holmes Murphy & Associates 21
0% 1%
6% 8%
9% 9%
15% 18%
34% 41% 42%
52% 54%
55% 70%
73% 73%
81% 89%
94% 98% 98%
101% 102% 102%
0% 20% 40% 60% 80% 100% 120%
Pediatrics Family Medicine
Internal Medicine Diabetes/Endocrinology
HIV/ID Psychiatry
Rheumatology Neurology
Nephrology OB/Gyn
Pathology Emergency Medicine
Critical Care Pulomonary Medicine
General Surgery Plastic Surgery Opthalmology
Dermatology Oncology
Gastroenterology Anesthesiology
Urology Cardiolology
Radiology Orthopedics
Compensation by Specialty, 2012
Source: Medscape
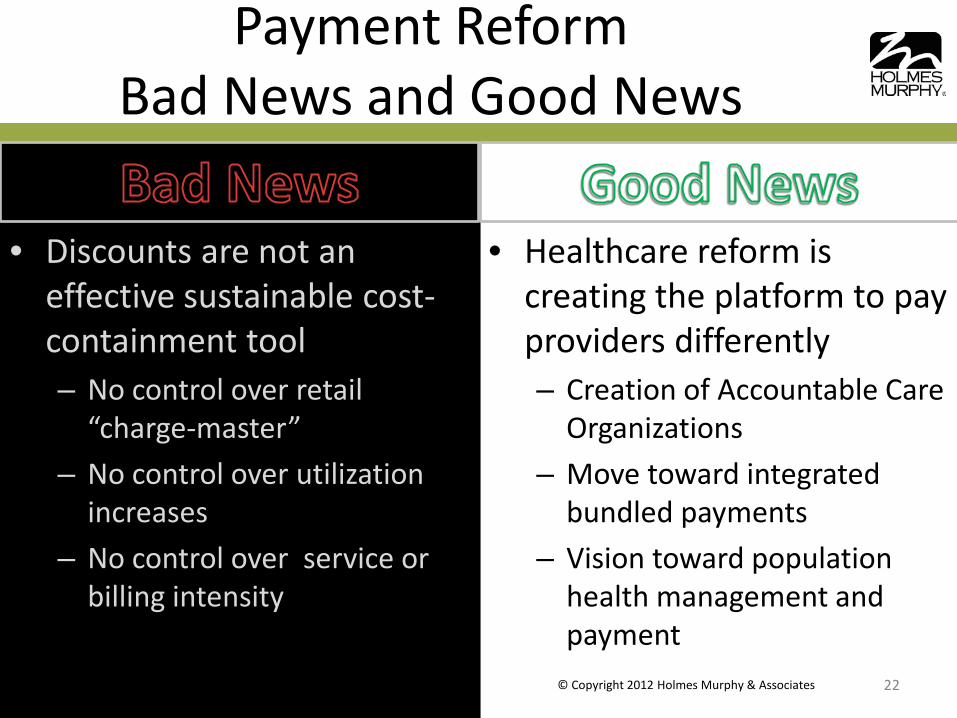
Payment Reform Bad News and Good News
• Healthcare reform is creating the platform to pay providers differently – Creation of Accountable Care
Organizations – Move toward integrated
bundled payments – Vision toward population
health management and payment
Confidential © Copyright 2012 Holmes Murphy & Associates 22
• Discounts are not an
effective sustainable cost-containment tool – No control over retail
“charge-master” – No control over utilization
increases – No control over service or
billing intensity
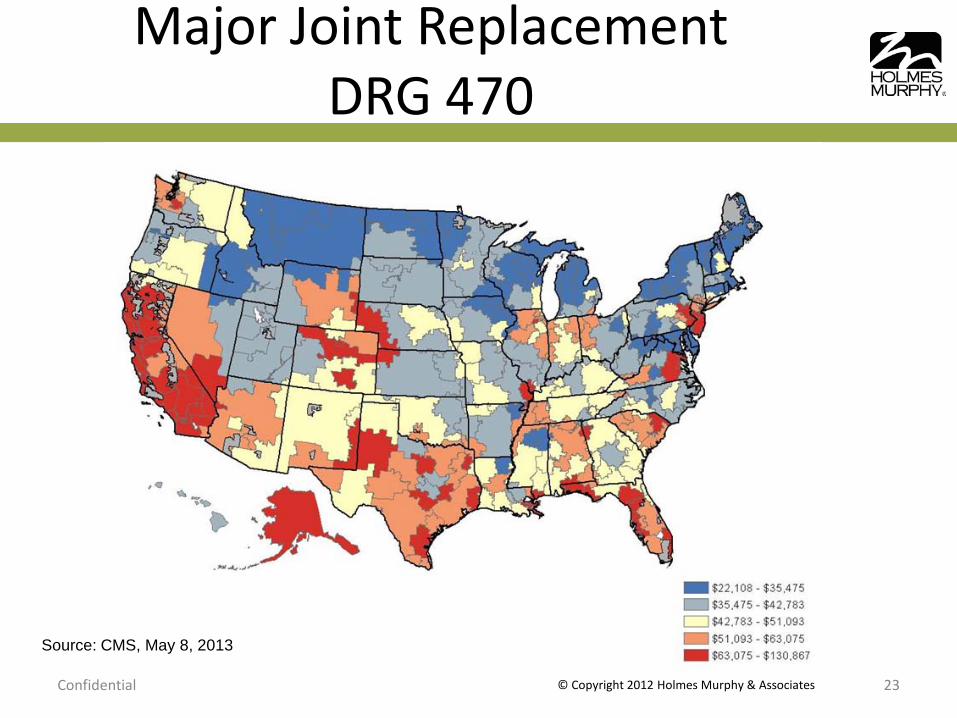
Major Joint Replacement DRG 470
Confidential © Copyright 2012 Holmes Murphy & Associates 23
Source: CMS, May 8, 2013
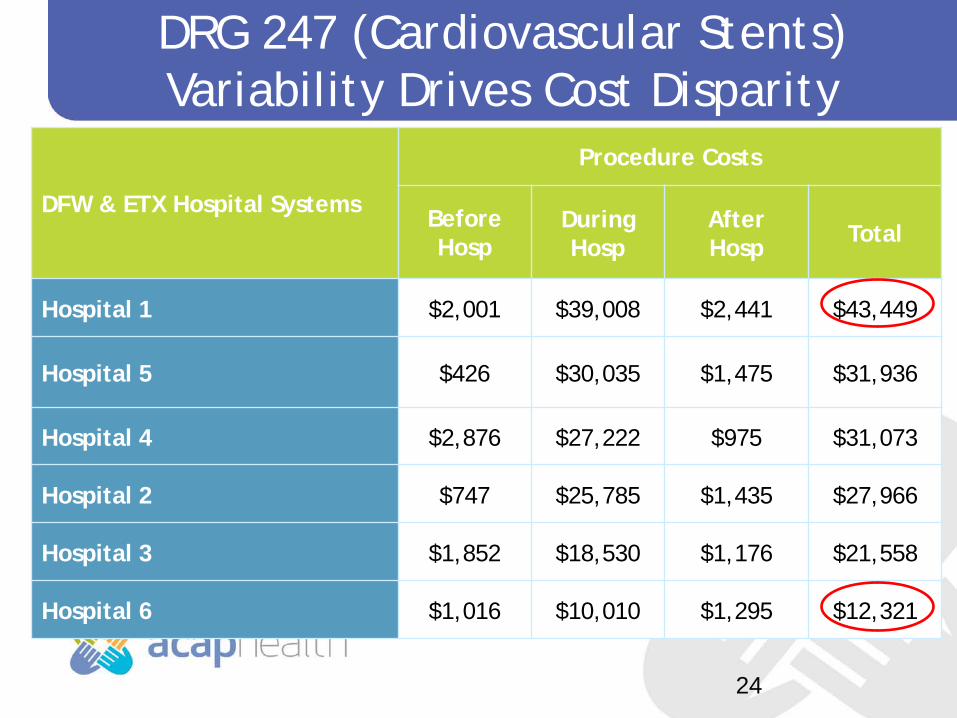
DRG 247 (Cardiovascular Stents) Variability Drives Cost Disparity
24
DFW & ETX Hospital Systems
Procedure Costs
Before Hosp
During Hosp
After Hosp Total
Hospital 1 $2,001 $39,008 $2,441 $43,449
Hospital 5 $426 $30,035 $1,475 $31,936
Hospital 4 $2,876 $27,222 $975 $31,073
Hospital 2 $747 $25,785 $1,435 $27,966
Hospital 3 $1,852 $18,530 $1,176 $21,558
Hospital 6 $1,016 $10,010 $1,295 $12,321
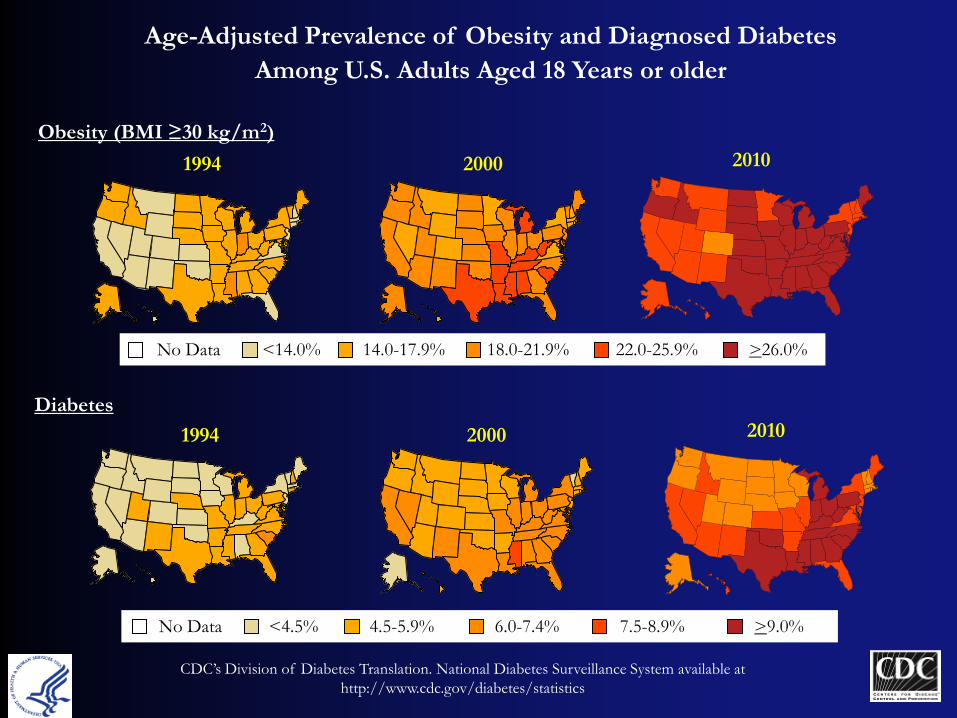
Age-Adjusted Prevalence of Obesity and Diagnosed Diabetes Among U.S. Adults Aged 18 Years or older
Obesity (BMI ≥30 kg/m2)
Diabetes
1994
1994
2000
2000
No Data <14.0% 14.0-17.9% 18.0-21.9% 22.0-25.9% >26.0%
No Data <4.5% 4.5-5.9% 6.0-7.4% 7.5-8.9% >9.0%
CDC’s Division of Diabetes Translation. National Diabetes Surveillance System available at http://www.cdc.gov/diabetes/statistics
2010
2010
Healthcare 2020
Confidential © Copyright 2012 Holmes Murphy & Associates 26
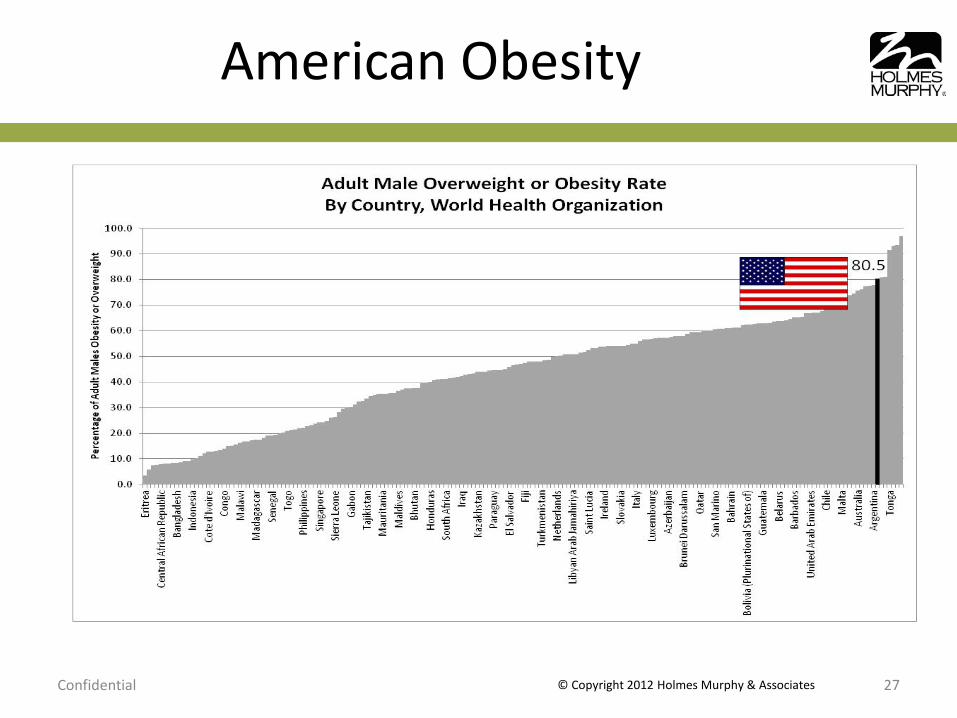
American Obesity
Confidential © Copyright 2012 Holmes Murphy & Associates 27
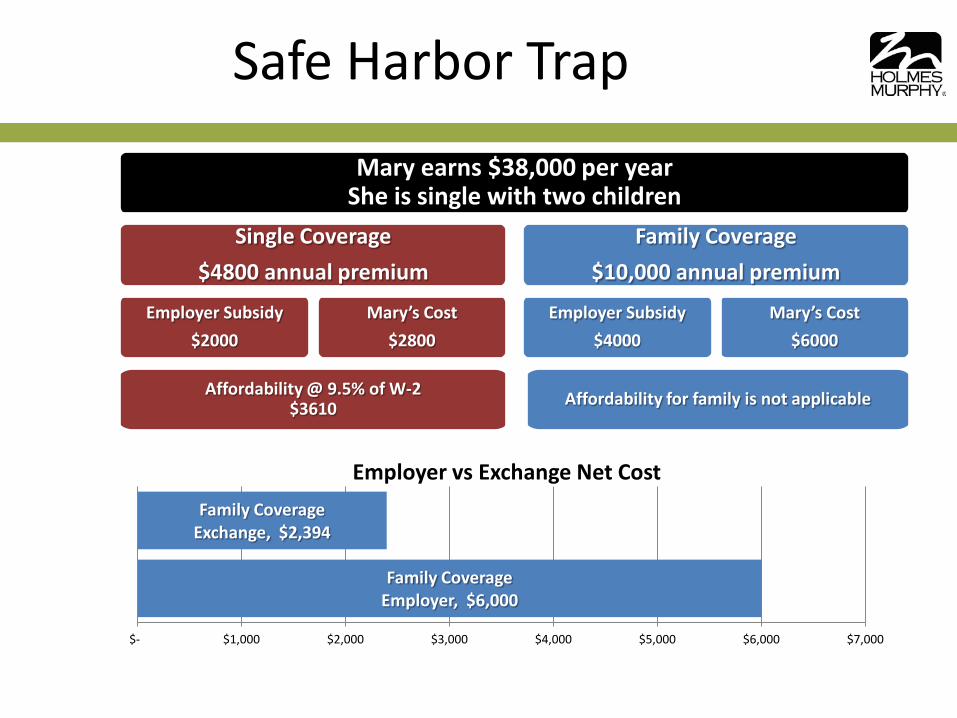
Safe Harbor Trap
Mary earns $38,000 per year She is single with two children
Single Coverage $4800 annual premium
Employer Subsidy $2000
Mary’s Cost $2800
Affordability @ 9.5% of W-2 $3610
Family Coverage $10,000 annual premium
Employer Subsidy $4000
Mary’s Cost $6000
Affordability for family is not applicable
Family Coverage Employer, $6,000
Family Coverage Exchange, $2,394
$- $1,000 $2,000 $3,000 $4,000 $5,000 $6,000 $7,000
Employer vs Exchange Net Cost
Healthcare 2020
Confidential © Copyright 2012 Holmes Murphy & Associates 29
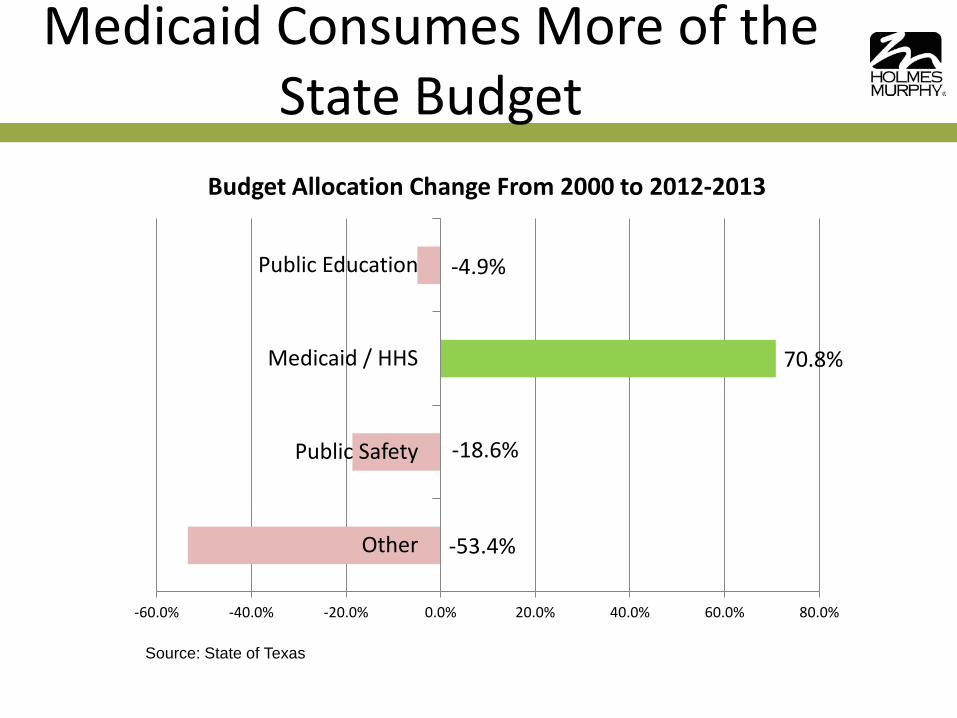
Medicaid Consumes More of the State Budget
-53.4%
-18.6%
70.8%
-4.9%
-60.0% -40.0% -20.0% 0.0% 20.0% 40.0% 60.0% 80.0%
Other
Public Safety
Medicaid / HHS
Public Education
Budget Allocation Change From 2000 to 2012-2013
Source: State of Texas
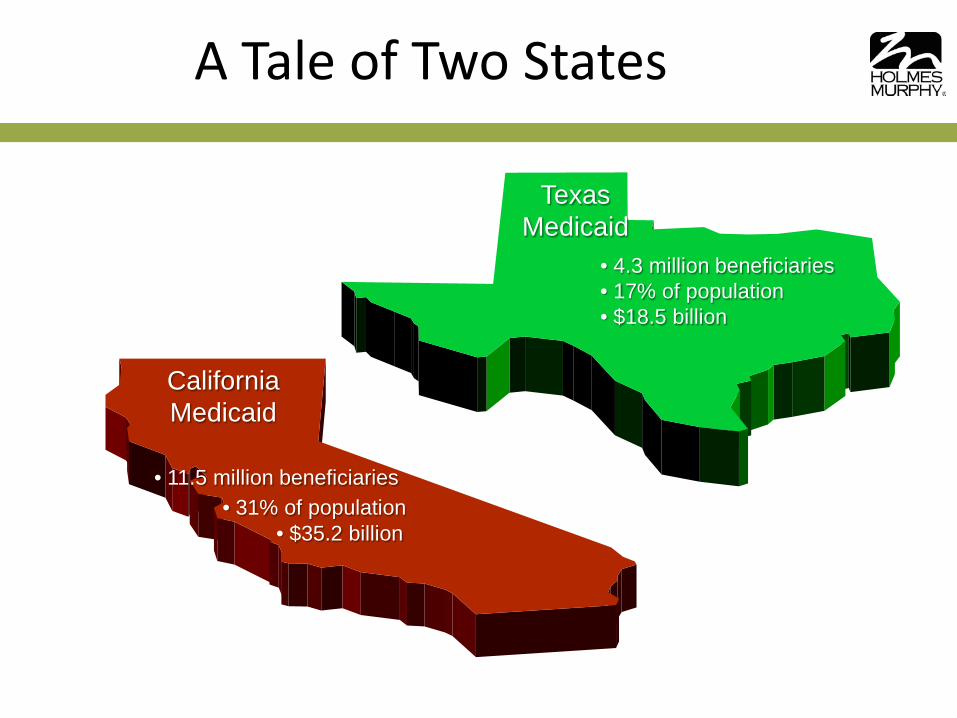
California Medicaid
Texas Medicaid
• 4.3 million beneficiaries • 17% of population • $18.5 billion
• 11.5 million beneficiaries • 31% of population
• $35.2 billion
A Tale of Two States
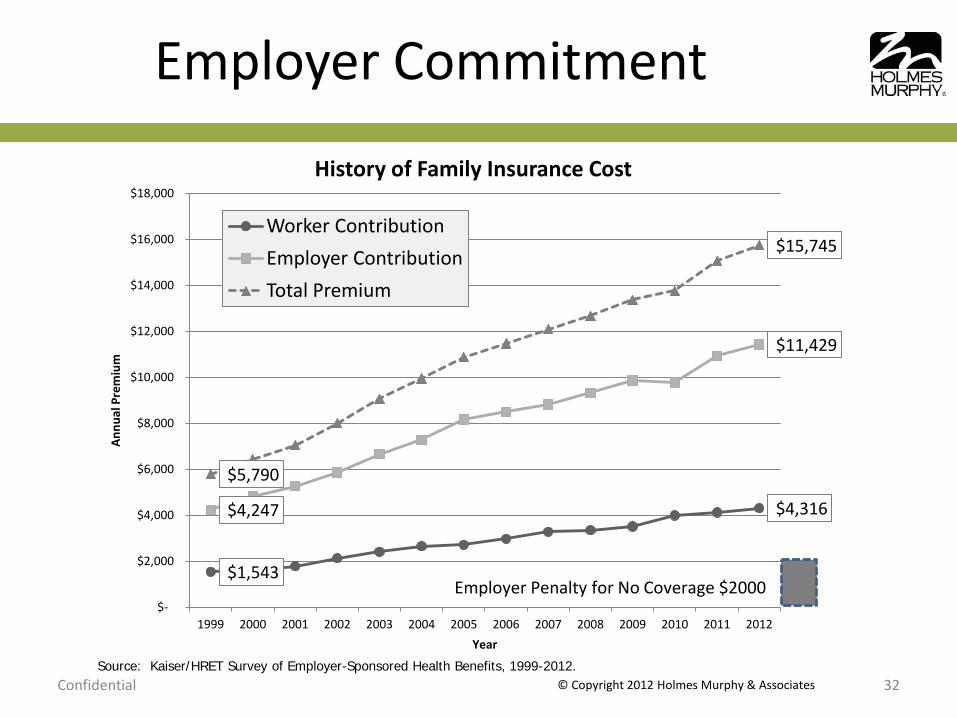
Employer Commitment
Confidential © Copyright 2012 Holmes Murphy & Associates 32
$1,543
$4,316 $4,247
$11,429
$5,790
$15,745
$-
$2,000
$4,000
$6,000
$8,000
$10,000
$12,000
$14,000
$16,000
$18,000
1999 2000 2001 2002 2003 2004 2005 2006 2007 2008 2009 2010 2011 2012
Annu
al P
rem
ium
Year
History of Family Insurance Cost
Worker Contribution Employer Contribution Total Premium
Source: Kaiser/HRET Survey of Employer-Sponsored Health Benefits, 1999-2012.
Employer Penalty for No Coverage $2000
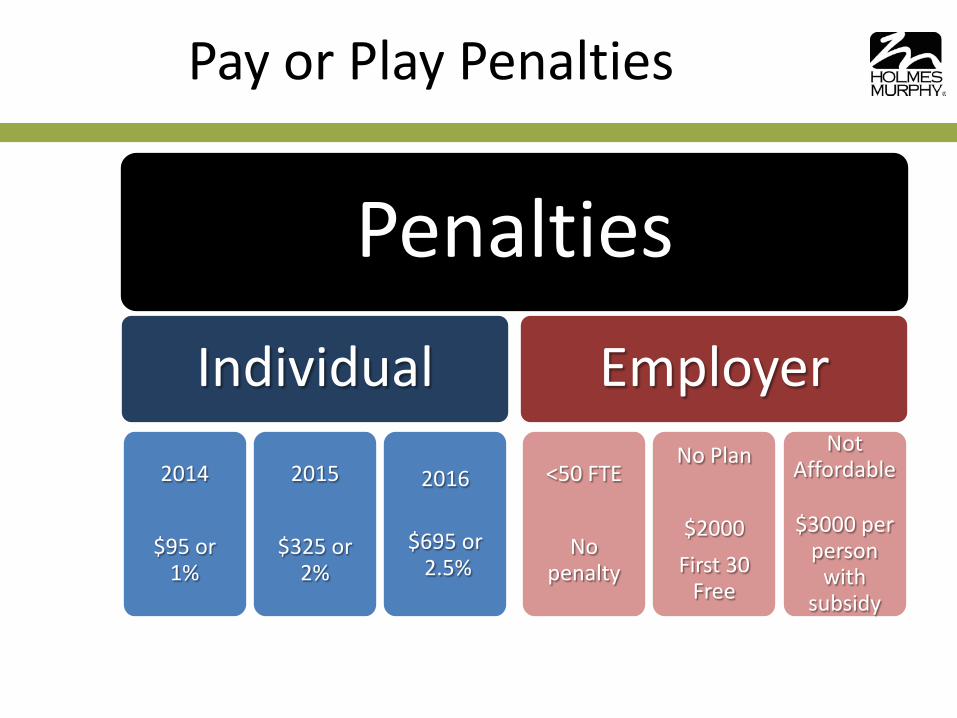
Pay or Play Penalties
Penalties Individual
2014
$95 or 1%
2015
$325 or 2%
2016
$695 or 2.5%
Employer
<50 FTE
No penalty
No Plan
$2000 First 30
Free
Not Affordable
$3000 per person
with subsidy
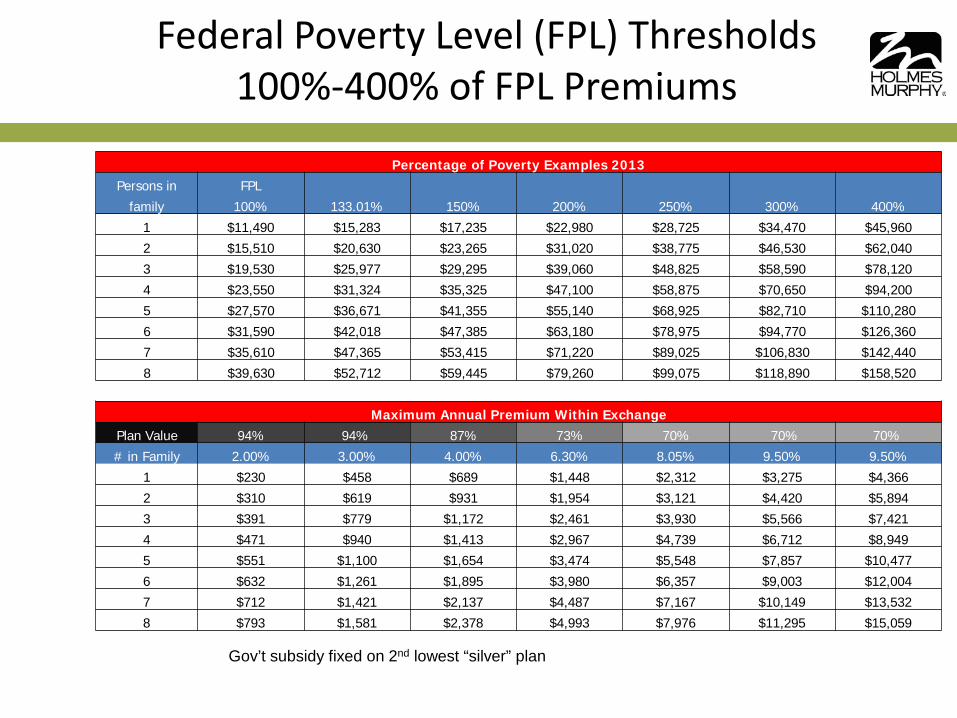
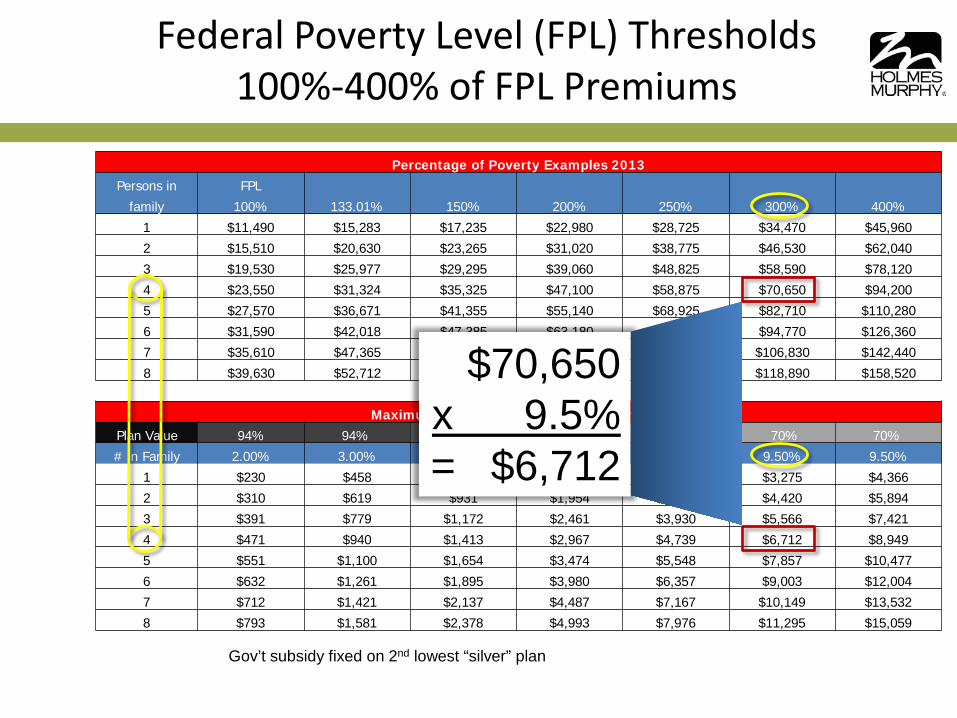
Percentage of Poverty Examples 2013 Persons in FPL
family 100% 133.01% 150% 200% 250% 300% 400%
1 $11,490 $15,283 $17,235 $22,980 $28,725 $34,470 $45,960
2 $15,510 $20,630 $23,265 $31,020 $38,775 $46,530 $62,040
3 $19,530 $25,977 $29,295 $39,060 $48,825 $58,590 $78,120
4 $23,550 $31,324 $35,325 $47,100 $58,875 $70,650 $94,200
5 $27,570 $36,671 $41,355 $55,140 $68,925 $82,710 $110,280
6 $31,590 $42,018 $47,385 $63,180 $78,975 $94,770 $126,360
7 $35,610 $47,365 $53,415 $71,220 $89,025 $106,830 $142,440
8 $39,630 $52,712 $59,445 $79,260 $99,075 $118,890 $158,520
Maximum Annual Premium Within Exchange Plan Value 94% 94% 87% 73% 70% 70% 70%
# in Family 2.00% 3.00% 4.00% 6.30% 8.05% 9.50% 9.50%
1 $230 $458 $689 $1,448 $2,312 $3,275 $4,366
2 $310 $619 $931 $1,954 $3,121 $4,420 $5,894
3 $391 $779 $1,172 $2,461 $3,930 $5,566 $7,421
4 $471 $940 $1,413 $2,967 $4,739 $6,712 $8,949
5 $551 $1,100 $1,654 $3,474 $5,548 $7,857 $10,477
6 $632 $1,261 $1,895 $3,980 $6,357 $9,003 $12,004
7 $712 $1,421 $2,137 $4,487 $7,167 $10,149 $13,532
8 $793 $1,581 $2,378 $4,993 $7,976 $11,295 $15,059
Federal Poverty Level (FPL) Thresholds 100%-400% of FPL Premiums
Gov’t subsidy fixed on 2nd lowest “silver” plan
$70,650 x 9.5% = $6,712
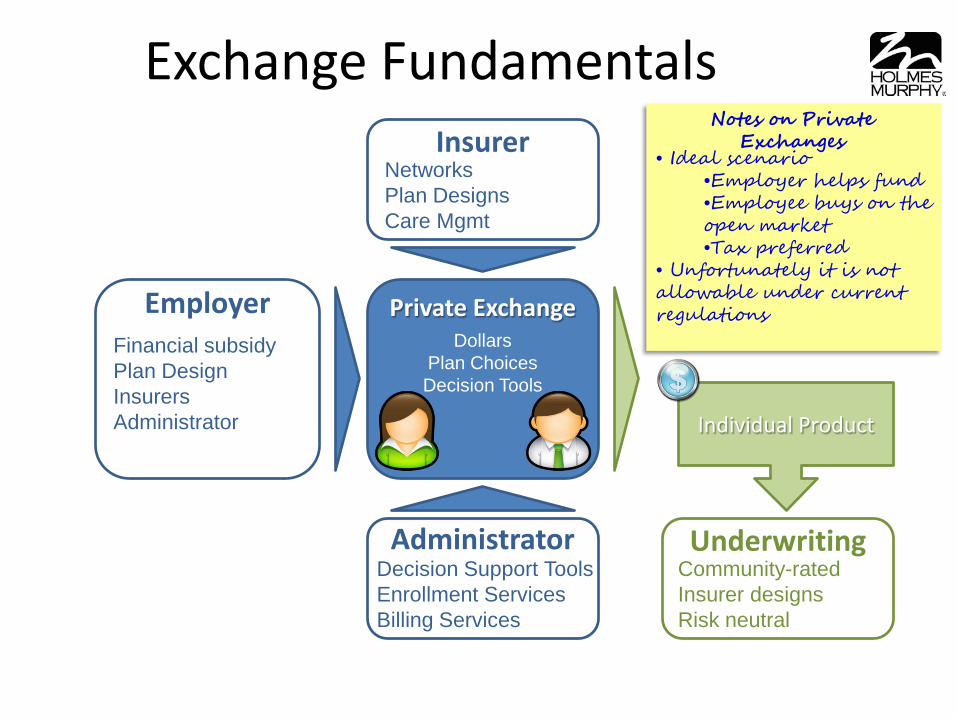
Exchange Fundamentals
Private Exchange
Employer
Insurer
Administrator
Decision Support Tools Enrollment Services Billing Services
Networks Plan Designs Care Mgmt
Financial subsidy Plan Design Insurers Administrator
Dollars Plan Choices Decision Tools
Individual Product
Underwriting
Community-rated Insurer designs Risk neutral
• Ideal scenario
•Employer helps fund •Employee buys on the open market •Tax preferred
• Unfortunately it is not allowable under current regulations
Notes on Private Exchanges
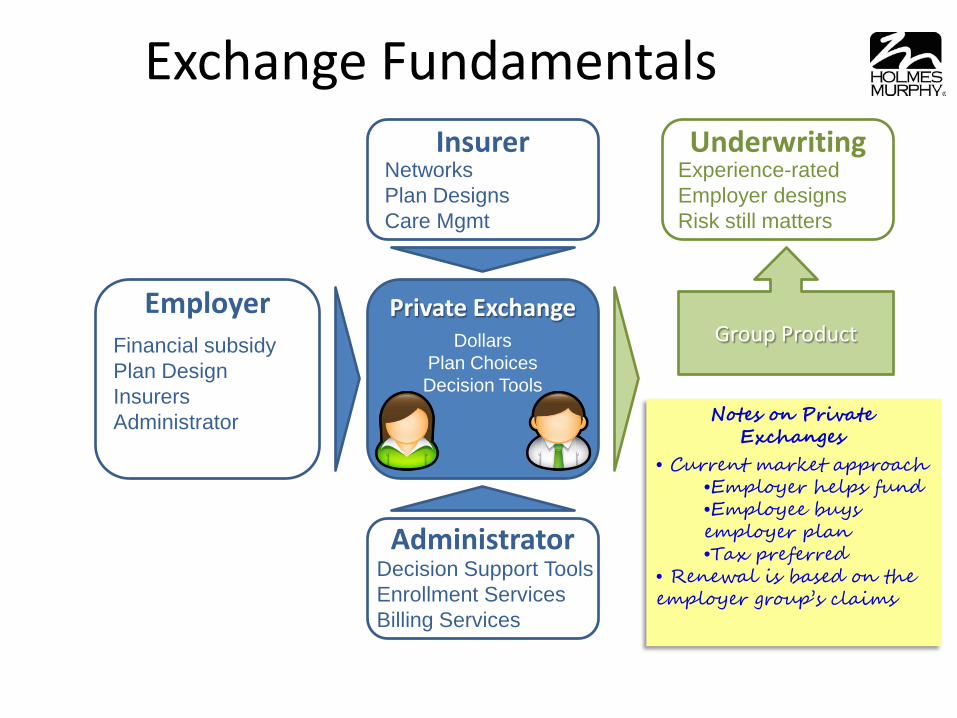
Exchange Fundamentals
Private Exchange
Employer
Insurer
Administrator
Decision Support Tools Enrollment Services Billing Services
Networks Plan Designs Care Mgmt
Financial subsidy Plan Design Insurers Administrator
Dollars Plan Choices Decision Tools
Group Product
Underwriting
Experience-rated Employer designs Risk still matters
• Current market approach
•Employer helps fund •Employee buys employer plan •Tax preferred
• Renewal is based on the employer group’s claims
Notes on Private Exchanges
Healthcare 2020
Confidential © Copyright 2012 Holmes Murphy & Associates 38
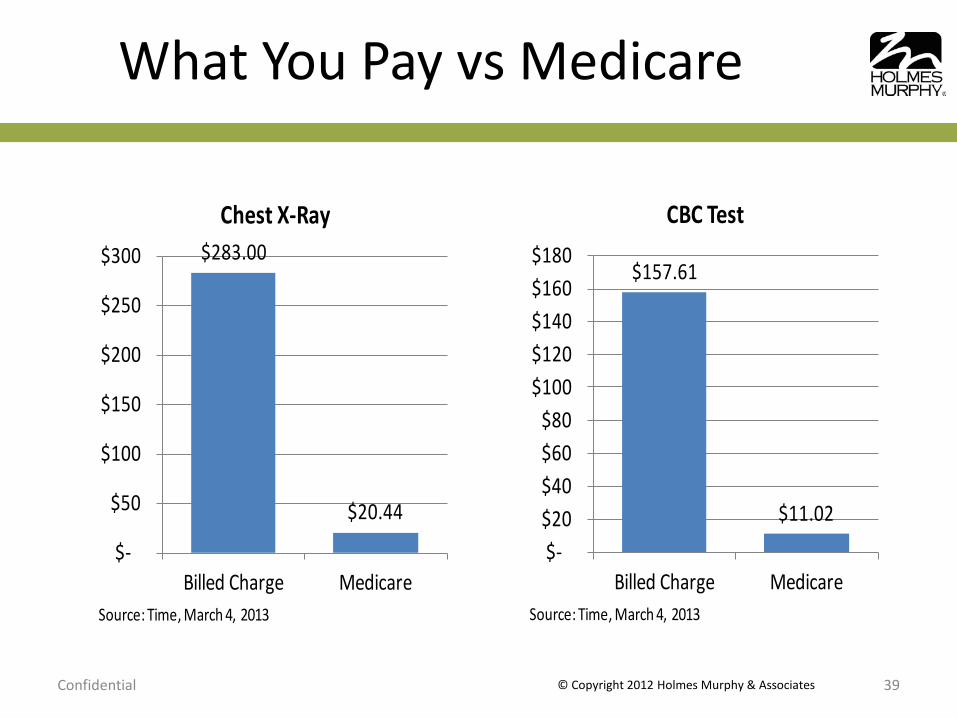
What You Pay vs Medicare
Confidential © Copyright 2012 Holmes Murphy & Associates 39
$283.00
$20.44
$-
$50
$100
$150
$200
$250
$300
Billed Charge Medicare
Chest X-Ray
Source: Time, March 4, 2013
$157.61
$11.02
$-$20 $40 $60 $80
$100 $120 $140 $160 $180
Billed Charge Medicare
CBC Test
Source: Time, March 4, 2013
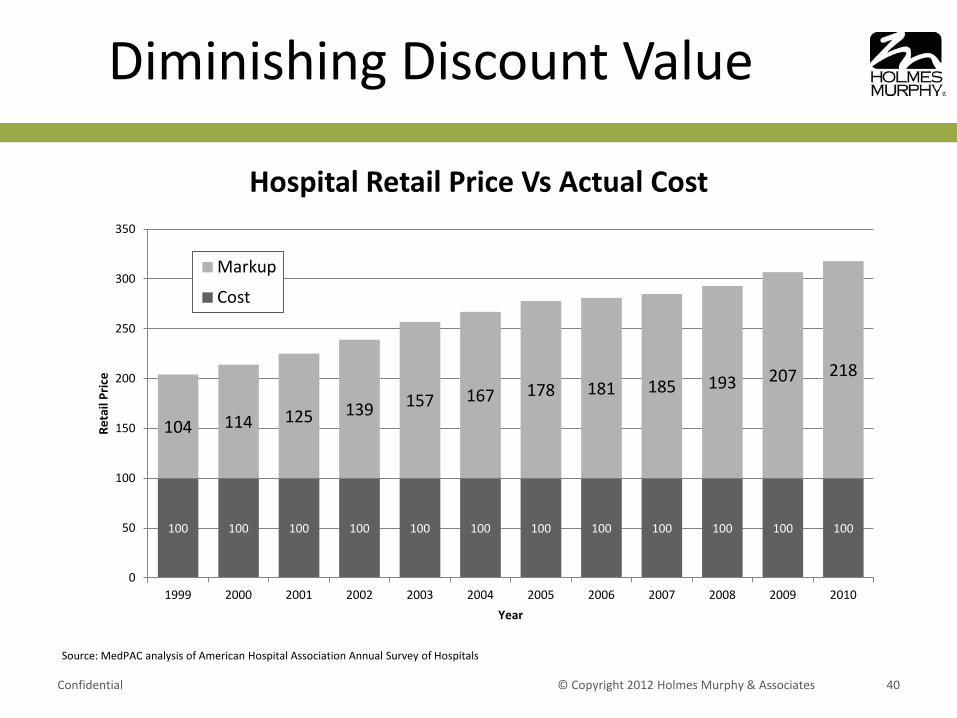
Diminishing Discount Value
Confidential © Copyright 2012 Holmes Murphy & Associates 40
100 100 100 100 100 100 100 100 100 100 100 100
104 114 125 139 157 167 178 181 185 193 207 218
0
50
100
150
200
250
300
350
1999 2000 2001 2002 2003 2004 2005 2006 2007 2008 2009 2010
Reta
il Pr
ice
Year
Hospital Retail Price Vs Actual Cost
Markup
Cost
Source: MedPAC analysis of American Hospital Association Annual Survey of Hospitals
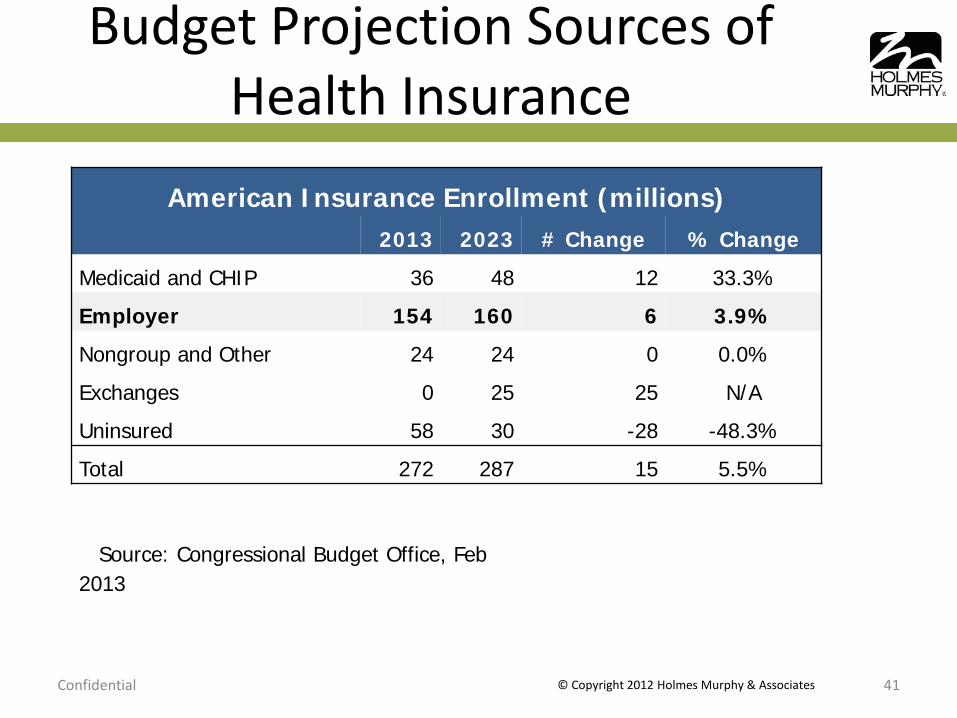
Budget Projection Sources of Health Insurance
Confidential © Copyright 2012 Holmes Murphy & Associates 41
American Insurance Enrollment (millions) 2013 2023 # Change % Change
Medicaid and CHIP 36 48 12 33.3%
Employer 154 160 6 3.9%
Nongroup and Other 24 24 0 0.0%
Exchanges 0 25 25 N/A
Uninsured 58 30 -28 -48.3%
Total 272 287 15 5.5%
Source: Congressional Budget Office, Feb 2013
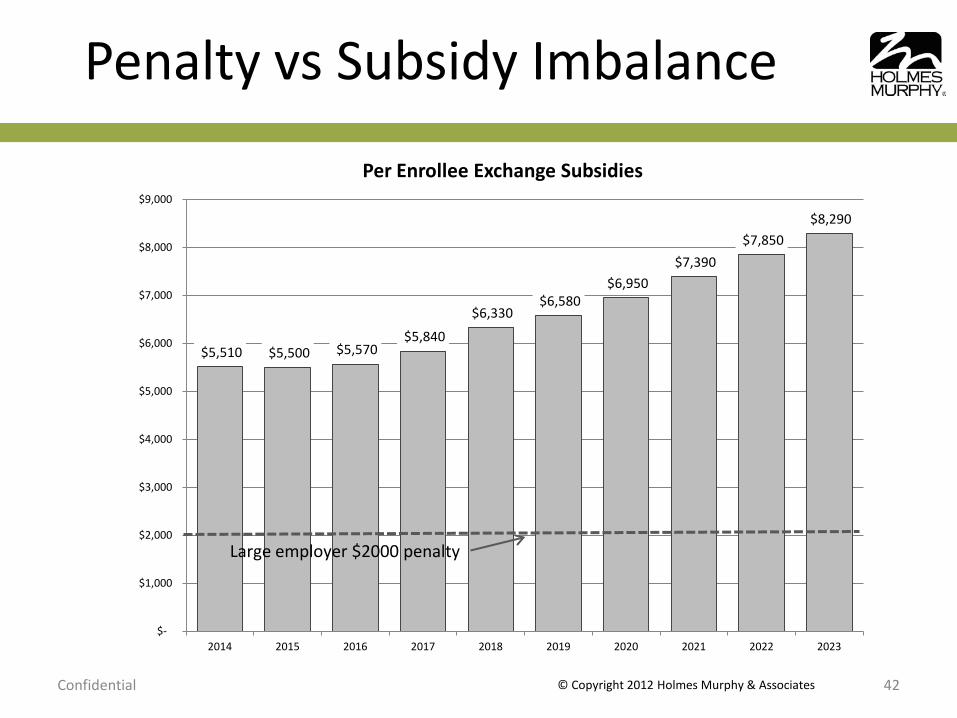
Penalty vs Subsidy Imbalance
Confidential © Copyright 2012 Holmes Murphy & Associates 42
$5,510 $5,500 $5,570 $5,840
$6,330 $6,580
$6,950 $7,390
$7,850 $8,290
$-
$1,000
$2,000
$3,000
$4,000
$5,000
$6,000
$7,000
$8,000
$9,000
2014 2015 2016 2017 2018 2019 2020 2021 2022 2023
Per Enrollee Exchange Subsidies
Large employer $2000 penalty
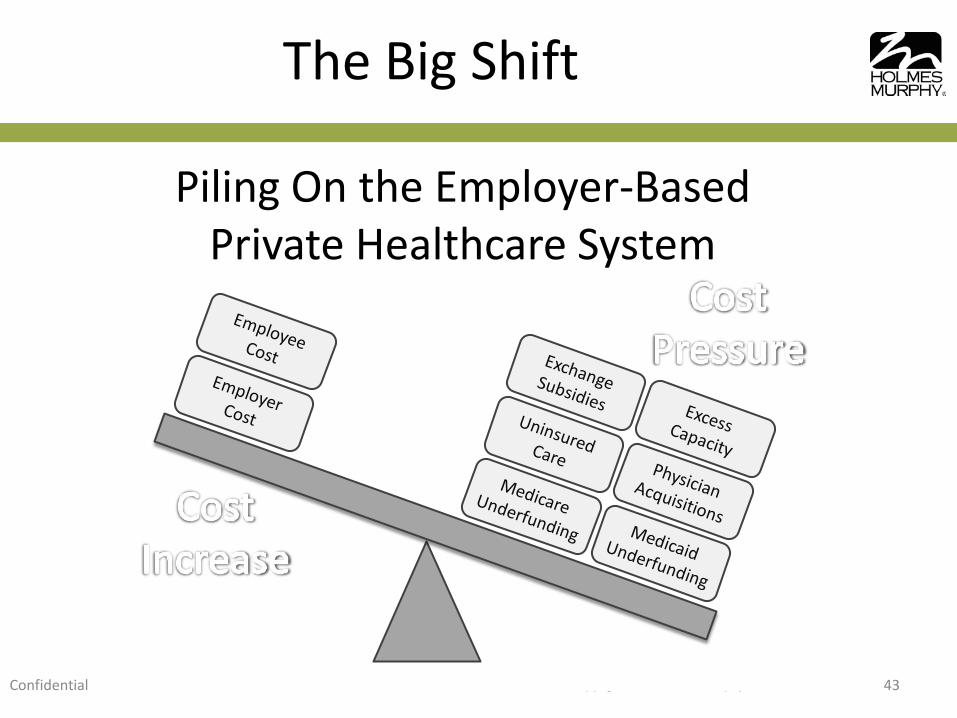
The Big Shift
Confidential © Copyright 2012 Holmes Murphy & Associates 43
Piling On the Employer-Based Private Healthcare System
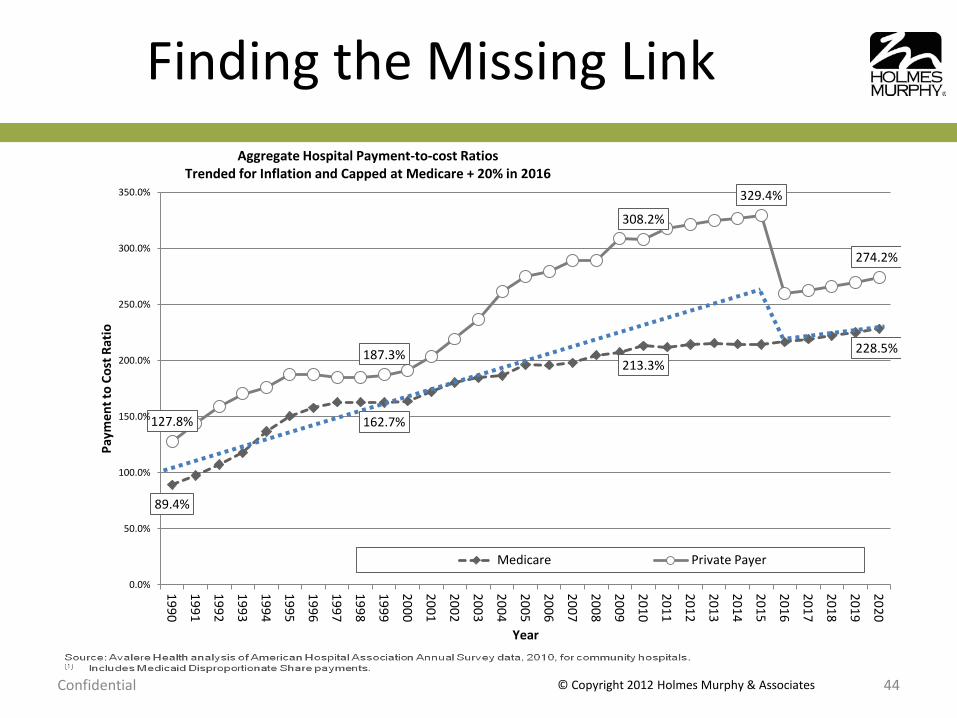
Finding the Missing Link
Confidential © Copyright 2012 Holmes Murphy & Associates 44
89.4%
162.7%
213.3% 228.5%
127.8%
187.3%
308.2%
329.4%
274.2%
0.0%
50.0%
100.0%
150.0%
200.0%
250.0%
300.0%
350.0%
1990
1991
1992
1993
1994
1995
1996
1997
1998
1999
2000
2001
2002
2003
2004
2005
2006
2007
2008
2009
2010
2011
2012
2013
2014
2015
2016
2017
2018
2019
2020
Paym
ent t
o Co
st R
atio
Year
Aggregate Hospital Payment-to-cost Ratios Trended for Inflation and Capped at Medicare + 20% in 2016
Medicare Private Payer
Healthcare 2020
Confidential © Copyright 2012 Holmes Murphy & Associates 45
Confidential © Copyright 2012 Holmes Murphy & Associates 46
What do you call it when someone keeps you in confinement for days or weeks?

Confidential © Copyright 2012 Holmes Murphy & Associates 47
What do you call it when someone takes a knife and slices you through the abdomen?
Confidential © Copyright 2012 Holmes Murphy & Associates 48
What do you call someone who takes thousands of dollars from your bank account?

Confidential © Copyright 2012 Holmes Murphy & Associates 49
What do you call someone who causes you to take pills every day for the rest of your life?
Confidential © Copyright 2012 Holmes Murphy & Associates 50
What do you call someone who kills people without regard to age, gender, race, or economic status?
Confidential © Copyright 2012 Holmes Murphy & Associates 51
Who is this kidnapping, torturing, thieving, drug dealing mass murderer?
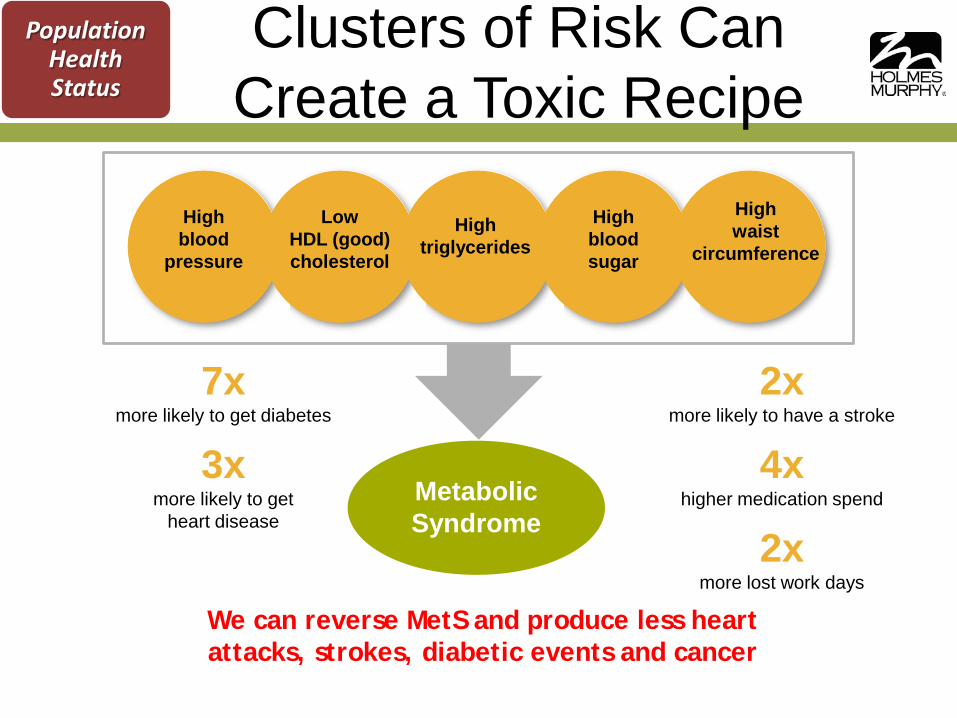
Metabolic Syndrome
Clusters of Risk Can Create a Toxic Recipe
7x more likely to get diabetes
3x more likely to get
heart disease
High blood
pressure
Low HDL (good) cholesterol
High triglycerides
High blood sugar
High waist
circumference
2x more likely to have a stroke
4x higher medication spend
2x more lost work days
We can reverse MetS and produce less heart attacks, strokes, diabetic events and cancer
Population Health Status
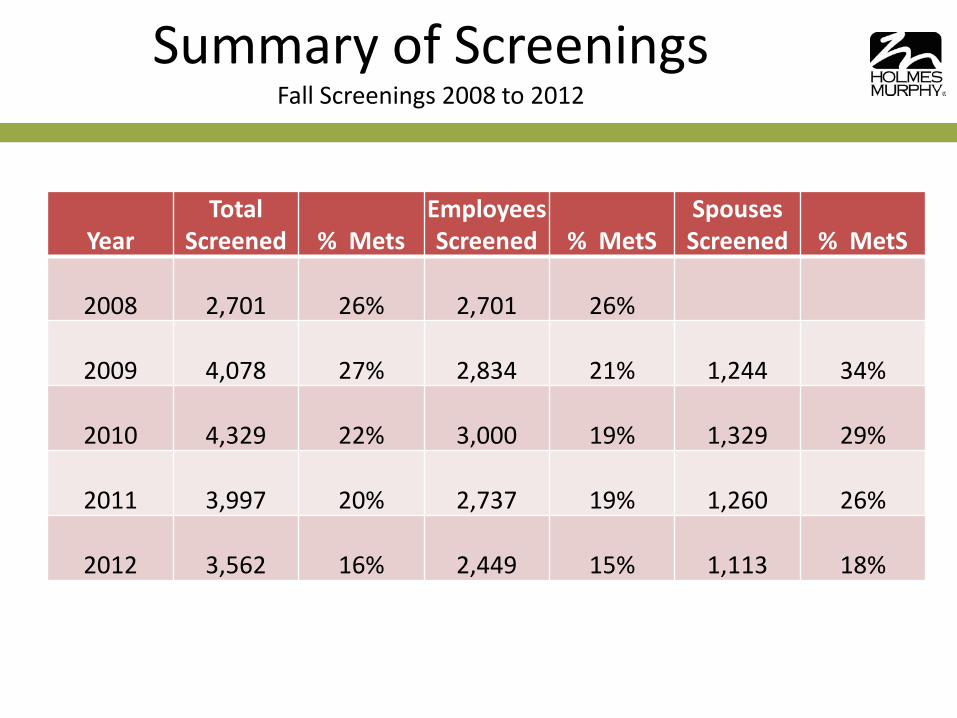
Summary of Screenings Fall Screenings 2008 to 2012
Year Total
Screened % Mets Employees Screened % MetS
Spouses Screened % MetS
2008
2,701 26%
2,701 26%
2009
4,078 27%
2,834 21%
1,244 34%
2010
4,329 22%
3,000 19%
1,329 29%
2011
3,997 20%
2,737 19%
1,260 26%
2012
3,562 16%
2,449 15%
1,113 18%
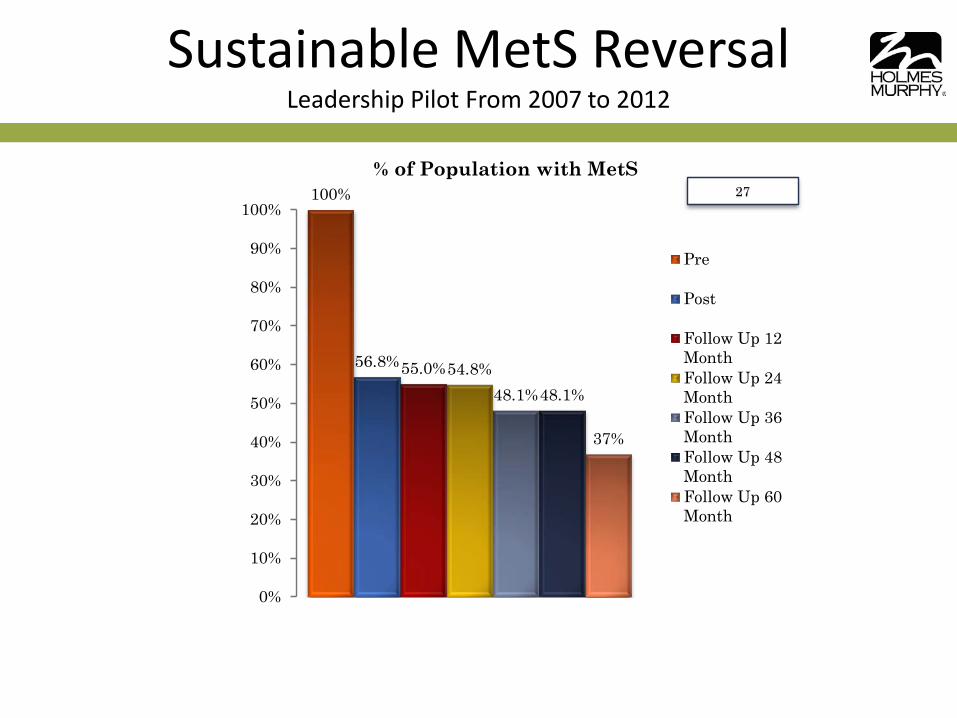
Sustainable MetS Reversal Leadership Pilot From 2007 to 2012
100%
56.8%55.0%54.8%48.1%48.1%
37%
0%
10%
20%
30%
40%
50%
60%
70%
80%
90%
100%
% of Population with MetS
Pre
Post
Follow Up 12MonthFollow Up 24MonthFollow Up 36MonthFollow Up 48MonthFollow Up 60Month
27
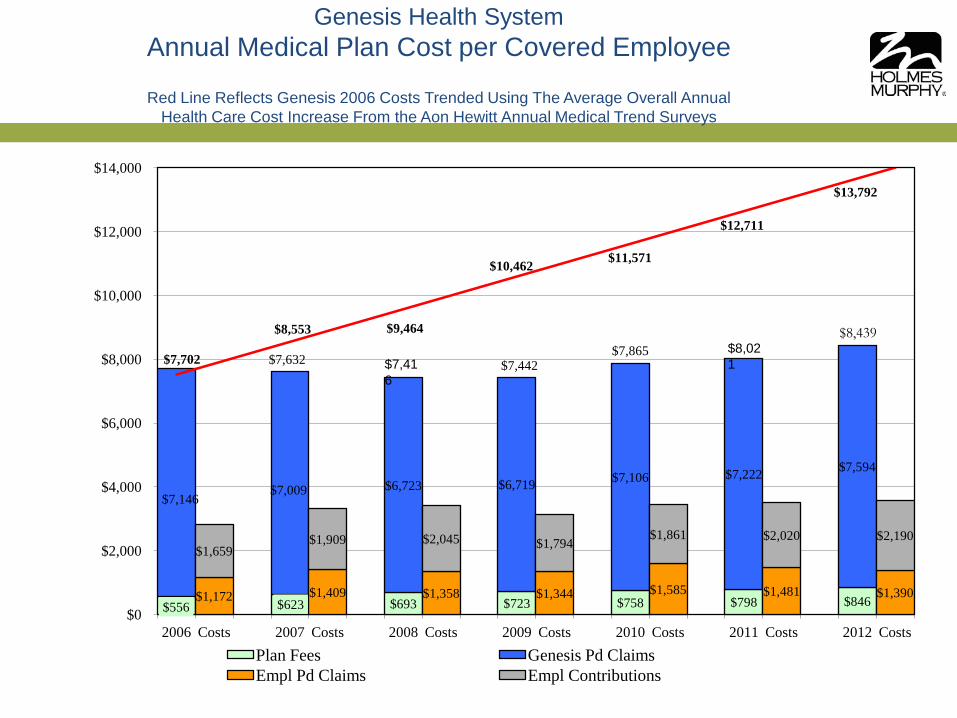
Genesis Health System Annual Medical Plan Cost per Covered Employee
Red Line Reflects Genesis 2006 Costs Trended Using The Average Overall Annual
Health Care Cost Increase From the Aon Hewitt Annual Medical Trend Surveys
$556 $623 $693 $723 $758 $798 $846
$7,146 $7,009 $6,723 $6,719 $7,106 $7,222 $7,594
$1,172 $1,409 $1,358 $1,344 $1,585 $1,481 $1,390
$1,659
$7,632
$1,909 $2,045
$7,442
$1,794
$7,865
$1,861 $2,020 $2,190
$7,702
$8,553 $9,464
$10,462 $11,571
$12,711
$13,792
$0
$2,000
$4,000
$6,000
$8,000
$10,000
$12,000
$14,000
2006 Costs 2007 Costs 2008 Costs 2009 Costs 2010 Costs 2011 Costs 2012 Costs Plan Fees Genesis Pd Claims Empl Pd Claims Empl Contributions
$8,439
$8,021 $7,41
6
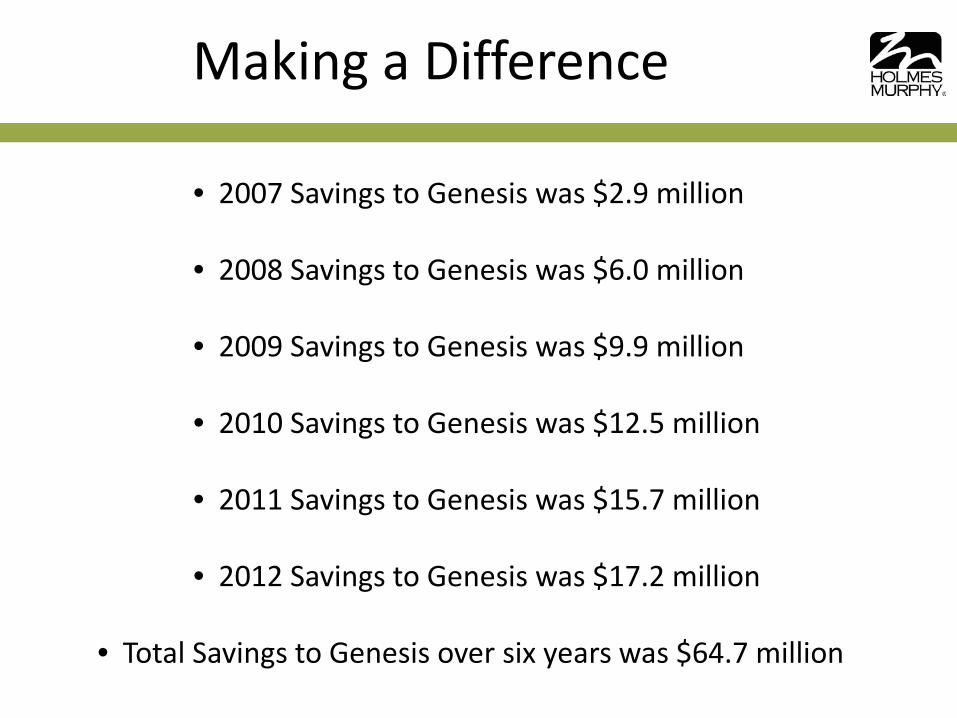
• 2007 Savings to Genesis was $2.9 million
• 2008 Savings to Genesis was $6.0 million
• 2009 Savings to Genesis was $9.9 million
• 2010 Savings to Genesis was $12.5 million • 2011 Savings to Genesis was $15.7 million • 2012 Savings to Genesis was $17.2 million
• Total Savings to Genesis over six years was $64.7 million
Making a Difference