Embed Size (px)
Citation preview

Healthcare Payments Data Program
Review CommitteeNovember 21, 2019
Office of Statewide Health Planning and Development 2020 W. El Camino Avenue, Sacramento, CA, 95833
Conference Room 1237

Welcome & Meeting Minutes
Cheryl DambergVice-Chair
Review Committee

Deputy Director’s ReportScott Christman,
Deputy Director and Chief Information Officer, OSHPD

End Users Panel
Paulette Cha, Research Fellow, Public Policy Institute of CaliforniaShannon McConville, Research Fellow, Public Policy Institute of California
Conrad Amenta, Director of Policy and Strategic Initiatives, California Academy of Family PhysiciansIsaac Menashe, Associate Director, Policy, Evaluation and Research, Covered California
Jill Yegian, Consultant, OSHPD

How an APCD can support research to inform California policymakers Preliminary, not for citation or distribution
Shannon McConville, Paulette Cha
Supported by the California Health Care Foundation
November 21, 2019

California’s research community is an important resource and potential user base for APCD
6
Researchers have deep experience using health payment data – Most often commercial claims and Medicare– Experience validating and using other state APCDs
We conducted in-depth interviews, online survey, lit review– Develop research use cases relevant for California policymakers– Gather researcher input for APCD development
Inform discussions around researcher access and governance

How does increased vertical integration affect costs, quality and patient outcomes?
7
Vertical integration whereby hospitals acquire physician practices has increased considerably statewide
Recent studies find associations between increased integration and higher costs
Missing component in current research is how vertical integration impacts quality, patient outcomes
Current sources of data: subset of commercial claims (e.g., IBM Marketscan, Truven Analytics Marketscan, IHA data)

Value of an APCD and relevance for California
8
Ability to examine effects on quality and outcomes Patient IDs to construct episodes of care, track referral patterns Quantify potential positive impacts of consolidation
– Improvements in quality of care, better patient outcomes
Inform state regulatory actions

How do housing interventions affect health care use, public costs for Californians with mental illness?
9
Using Medicaid funds for housing is prohibited– Several examples of housing investment by health care systems
Whole Person Care pilots offer multi-county initiative to address housing instability among high-need Medi-Cal enrollees
Evaluation analytic plans often limited in scope to respond to federal/state requirements
Current sources of data: DHCS Medi-Cal claims/encounters; hospital discharge data; integrated county data systems

Value of an APCD and relevance for California
10
Streamlined, timely access to data– Individual-level Medi-Cal claims/encounters– Pathways for linkages to other public program data
Facilitate more robust research opportunities not linked to formal, federally required evaluation studies.
– Allow for opportunities for more robust study designs – “Finder files” could allow broader number of interventions at
various levels to be evaluated
Policy interventions to address homelessness, behavioral health needs are high priorities for local/state agencies, public
Research Community Enthusiastic, Wants to Help
11
“The CA APCD would be a FANTASTIC and IMPORTANT resource. It can be used to improve the health care market for millions of Californians.”
Experienced claims researchers want to be a resource for the state (design input, APCD data use, evaluation)
47 of 51 survey respondents (>90%) “likely” or “very likely” to apply to use APCD
Researchers willing to pay for data access

Study Types Researchers would Pursue
12
Evaluate health care policies on health outcomes Social determinants of health / disparities Health services research Cost transparency Evaluate health care policies on non-health outcomes

Variables and Linkages Needed for Study Feasibility
13
Patient, provider, and plan IDs Geographical ID and geography-linked Census characteristics Race/ethnicity (quality issues acknowledged) Vital statistics Hospital discharges Disease registries Eventually: Safety net (CalWORKS, CalFresh, WIC) Eventually: Earnings / EITC

Related research studies
14
Vertical Integration of Hospitals and Physician Groups Baker et al. 2014. “ Vertical Integration: Hospital Ownership of Physician Practices is
Associated with Higher Prices and Spending.” Health Affairs 33(5) Robinson and Miller. 2014. “Total Expenditures per Patient in Hospital-Owned and
Physician-Owned Physician Organizations in California.” JAMA 312(16) Scheffler et al. 2018. “Consolidation Trends in California’s Health Care system Impacts on
ACA Premiums and Outpatient Visit Prices.” Health Affairs 37(9)
Evaluation of Whole Person Care Housing Pilots Berkowitz et al. 2019. “Association of the Use of a Medically Tailored Meal Plan on Health
Care Use.” JAMA Inter Med 179(6) Kanzaria et al. 2019. “Frequent Emergency Department Users: Focus on Medical
Utilization Misses the Whole Person.” Health Affairs 38(11) Lim et al. 2018. “Impact of a New York City Supportive Housing Program on Medicaid
Expenditure Patterns among People with Serious Mental Illness and Chronic Homelessness.” BMC Health Services Research 18(15)

Notes on the use of these slides
15
These slides were created to accompany a presentation. They do not include full documentation of sources, data samples, methods, and interpretations. To avoid misinterpretations, please contact:
Paulette Cha ([email protected]; 415-291-4479) orShannon McConville ([email protected]; 415-291-4481)
Thank you for your interest in this work.

Measuring Primary Care Spending:
A Proven Use for APCDs
Conrad Amenta, CAFP Director of Policy and Strategic Initiatives

Why Measure Primary Care Spending?• Lower health care costs, better patient outcomes
– Primary Care: A Critical Review Of The Evidence On Quality And Costs Of Health Care (Health Affairs)
• Seeing a PCP first would save U.S. $67 billion/year– Report on Financing the New Model of Family Medicine (Annals of Family Medicine)
• 19 percent lower odds of premature death than those who only see specialists– Primary Care: Our First Line of Defense (Commonwealth Fund)
• 1 in 5 Americans visit the ER annually; 12 percent result in admission. As many as 65 percent deemed unnecessary– Signs of Overtreatment: How to Avoid Unnecessary Care (USA Today)
• Patients who see a primary care provider save 33 percent over those who only see specialists– Journal of Family Practice
• Good primary health care makes health systems more inclusive and improves performance– Organization for Economic Cooperation and Development

Why Measure Primary Care Spending?
• Primary Care is the foundation of a high-quality, sustainable health care system because it improves value for healthcare dollars.
• However, proportion of revenues dedicated to primary care is poorly understood. – International and inter-state comparisons (OECD, Commonwealth Fund) are speculative based on
payment rates, investments in PC workforce, etc.– Commonwealth Fund’s state report card ranks CA 22/51 in Access, 35/51 in Prevention, but does not
track PC spend (https://www.commonwealthfund.org/publications/fund-reports/2019/jun/2019-scorecard-state-health-system-performance-deaths-suicide)

Why Measure Primary Care Spending?
• “…poor access to primary care has contributed to inadequate prevention and management of chronic diseases, delayed diagnoses, incomplete adherence to treatments, wasteful overuse of drugs and technologies, and coordination and safety problems.” - International Comparison Reflects Flaws and Opportunities for Better U.S. Health Care, Commonwealth Fund, 2017 (https://interactives.commonwealthfund.org/2017/july/mirror-mirror/)

How is Primary Care Spending Measured?
Defining “Primary care”:
• Who are primary care providers?
• What are primary care services?
• What is a primary care setting?

How is Primary Care Spending Measured?
OregonClaims-based payments • All Payer All Claims Database, including health
care claims and encounter data, services rendered, provider specialty and practice address.
Non-claims-based payments• Payments to incentivize efficient care delivery,
reward quality and cost savings goals, and build primary care infrastructure and capacity.
Oregon HMO Market Penetration: 40.2 percenthttps://www.beckershospitalreview.com/finance/hmo-volume-market-penetration-for-all-50-states.html

How is Primary Care Spending Measured?
ColoradoMulti-Payer Share of Primary Care Spend Report
Center for Improving Value in Health Care (CIVHC)
Establish baseline rates of the share of total health care expenditures going toward primary care and to track changes over the period 2010 through 2017.

Primary Care Spending in Medicare
Primary Care Spending in the Fee-for-Service Medicare PopulationAuthors: Cheryl Damberg, PhD; Rachel Reid, MD, MS; Mark W. Friedberg, MD, MPP
Published Online: April 15, 2019. doi:10.1001/jamainternmed.2018.8747

Without an All Payer Claims Database?
Milbank Spending Report
• Voluntary reporting was challenging to obtain.
• Analysts required detailed guidance and multiple rounds of submission to produce the requested data.
• https://www.milbank.org/publications/standardizing-measurement-commercial-health-plan-primary-care-spending/

Challenges
• Tracking spending in a managed care environment.o Colorado – 16.6 percento Rhode Island – 32.6 percento Massachusetts – 34.2 percento Oregon – 40.2 percent
• Return to Oregon’s definition of “non-claims based data”:o “Payments to primary care providers or provider organizations intended to
motivate efficient care delivery, reward achievement of quality or cost-savings goals, and build primary care infrastructure and capacity”
• Must remain sufficiently flexible to capture all that plans do, while keeping the collection meaningful.

Resources
• Patient Centered Primary Care Collaborative – Primary Care Investmenthttps://www.pcpcc.org/topic/primary-care-investment
• Oregon Health Authority – Primary Care Spendinghttps://www.oregon.gov/oha/HPA/ANALYTICS/Pages/Primary-Care-Spending.aspx
• Colorado All Payer Claims Databasehttps://www.civhc.org/wp-content/uploads/2019/01/2018-CO-APCD-Annual-Report-incl.-Appendices.pdf

COVERED CALIFORNIA’S HEALTHCARE EVIDENCE INITIATIVE (HEI)
November 21, 2019 Meeting of the Healthcare Payments Data (HPD) Review Committee
Isaac Menashe – Deputy Director, Evaluation and ResearchPolicy, Eligibility & Research Division, Covered California

COVERED CALIFORNIA USES FOR HPD DATA
28
Covered California has identified a range of use cases for the proposed Health Payments Database (HPD), as detailed in our April submission to the Review Committee.*These uses span from operational analytics focused on Marketplace members while in coverage with Covered California, to analyses that would help Covered California align its Qualified Health Plan contracting strategies with system reform efforts in use by large purchasers and other state entities.
* See Covered California cover letter to OSHPD HPD from April 17, 2019: https://oshpd.ca.gov/ml/v1/resources/document?rs:path=/Public-Meetings/Documents/HPD/CoveredCA-Supplementary-Panel-Materials.pdf

EXAMPLE 1 – EVALUATION OF NETWORK VALUE
29
Covered California’s quality strategy (as embodied in “Attachment 7” of its contract with Qualified Health Plans) includes as a core requirement that “Networks are Based on Value” (A7 section 1.02).
Evaluation Question: What are the major cost drivers in different networks? Which providers are “outlier poor performers” on either cost or quality? And how does Covered California network value compare to existing networks for large employer plans?
Challenge Under Current State:Covered California’s currently available data lacks cost information, and in many cases, sufficient sample sizes to make valid measurements for many providers. Additionally, an imperative for a measurement strategy is neutral and consistent reporting and analysis across providers and issuers.

EXAMPLE 1 – EVALUATION OF NETWORK VALUE
30
HPD Value Added:
With detailed cost information, and the ability to pool the coverage experience of members across commercial (and public) market segments, the HPD would provide a robust source on which to measure cost and quality among facilities and, potentially, provider groups, and to assess the overall value of Covered California networks.
Actionable:
Identification of network cost trends is immediately actionable by Covered California and its participating Issuers through the QHP Certification process. Additionally, with an operational HPD and alignment on the appropriate measurement strategy, the HPD could become a key source of data for the quality improvement strategy of reducing the presence of “outlier poor performers.”

EXAMPLE 2 – COVERAGE TRANSITIONS
31
Each year, over one third of the Covered California individual market turns over, with the vast majority transitioning to a new source of coverage: among those leaving, two-thirds move to job-based coverage or Medi-Cal.
Other Coverage 33%
Uninsured4%
Still Covered63%
Thirty-Seven percent of the
Covered Californiaindividual market turns over each
year.
Source of Coverage Among DisenrolledEmployer-sponsored insurance 43%
Medi-Cal 27%
Off-exchange plan 11%
Plan from another source 3%
Medicare 3%
Military coverage 1%
Coverage source unknown 1%
Uninsured 10%
Insurance status unknown 1%
Total 100%
California’s Health Care Coverage Transitions: Current Source of Coverage for 2017 Members, As Reported on 2018 Member Survey
Estimated from Covered California’s enrollment data and March 2018 Member Survey (n=1,283).

EXAMPLE 2 – COVERAGE TRANSITIONS
32
Evaluation Question: How can Covered California help ensure optimal care continuity for members who transition between sources and systems of coverage? And are certain subgroups in particular need of support?
Challenge Under Current State:No systematic way to link Covered California experience to experience in other sources of coverage. Each such linkage entails both legal agreements and non-trivial data initiatives to ensure data from each entity can be compared in a consistent way.

EXAMPLE 2 – COVERAGE TRANSITIONS
33
HPD Value Added:Pre-establish the legal and data framework for following a member across sources of coverage and systems of care.
Actionable:Gaps for transitioning members may be able to be addressed through state policy (including interventions by Covered California).

DATA USAGE AND QUALITY CONSIDERATIONS
34
As a potential user of HPD data, Covered California anticipates several critical aspects of usage that could have critical impacts on the viability of some use cases:
• Time to Information
• Data Blending
• Direct Analytic Support
• Data Updates or Augmentation
For any use case, Covered California reiterates the importance of attention to data quality and completeness, and that a priority from the start include:
• Allowed cost information
• Provider identification

Adding Race/Ethnicity into a Common Data Set
Marc N. Elliott
Talk delivered to the Office of Statewide Health Planning and Development
“Healthcare Payments Data Review Committee Meeting”
November 21, 2019
35
Outline
1. Adding Race/Ethnicity (r/e) to an All-Payer Database2. Using the RAND Bayesian Improved Surname Geocoding (BISG) tool to
address missing r/e data3. Applications
36

Motivation for this Talk
• One important goal of this effort is to ensure the data can be used to measure and monitor disparities, and drive quality improvements to address r/e disparities in access, utilization, and clinical quality
• Challenge: r/e information and other socioeconomic/demographic information may be missing or incomplete hindering the ability to examine and reduce disparities
37

Building Race/Ethnicity into the Common All Payers Database
• Assembly Bill 1810: OSHPD is authorized to develop a proposal to implement a statewide Healthcare Cost Transparency Database, which will include data on healthcare payments.
• Imputing r/e and other sociodemographic and economic variables from Census data can be done centrally, by OSHPD, and then distributed to potential end users
• Build this capability at front end so each end user of the APCD does not have to construct this– Address privacy concerns and associated liabilities
38

Race/Ethnicity Data Are Essential for Monitoring Quality, Coverage, Cost, and Access
• The Affordable Care Act requires all federal data collection efforts to obtain information on race, ethnicity, sex, primary language, and disability status
• The gold standard for r/e measurement is self-report • Subject to nonresponse• Sometimes only imperfect administrative information is available
• Missing r/e data create barriers to monitoring and improving quality, coverage, cost, and access
• Surnames and residential addresses are widely available, and can help impute r/e in a cost-effective, validated approach
39

40
Example of a CMS Administrative Race/Ethnicity Data Problem
• CMS’s Office of Minority Health wanted to compare HEDIS clinical quality of care measures by r/e
• CMS only had administrative r/e based on the Social Security Administration form that only allowed Black/White/Other before 1980• Measured Black vs. not Black well• Often missed Hispanic, Asian/Pacific Islander (API) and misclassified as white or Other
• We developed a Medicare-specific algorithm to use surname and address to make HEDIS comparison by race/ethnicity possible• National and plan-level data appear on CMS’ Website https://www.cms.gov/About-CMS/Agency-
Information/OMH/research-and-data/statistics-and-data/stratified-reporting.html]• Led to a Health Equity Summary Score to promote Quality Improvement (Agniel et al. 2019)

Using the RAND Bayesian Improved Surname Geocoding (BISG) tool to address missing r/e data
• Newer indirect estimation methods like RAND’s produce accurate estimates of r/e disparities when direct r/e is lacking
• The most well-validated and widely-used new method is RAND’s BISG
41
Race/Ethnicity Estimation Project
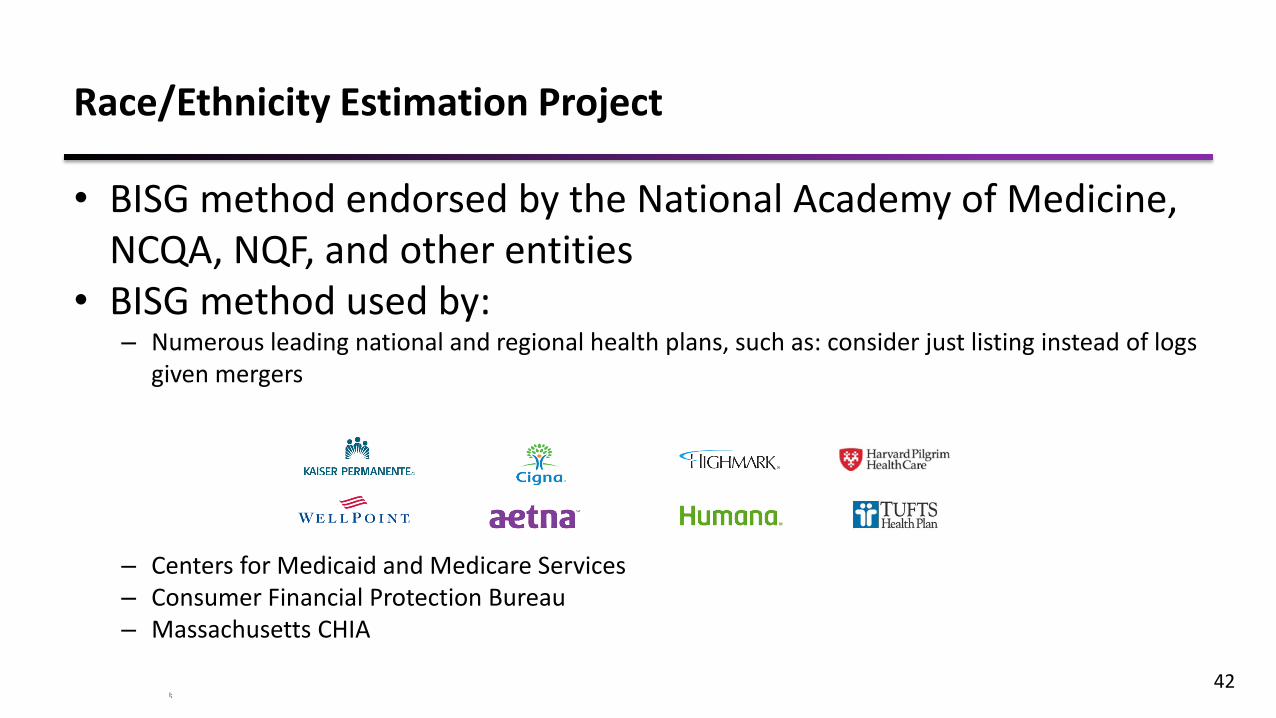
• BISG method endorsed by the National Academy of Medicine, NCQA, NQF, and other entities
• BISG method used by:– Numerous leading national and regional health plans, such as: consider just listing instead of logs
given mergers
– Centers for Medicaid and Medicare Services– Consumer Financial Protection Bureau– Massachusetts CHIA
l;42

BISG Method – Inputs Needed
43
• From Administrative Files– Members last name– Members residential address or geocode (to Block Group level)– Optional: Self-reported or other reliable direct source of R/E data if available
• From Census Files: – Census Surname List– Census Demographic file (to Block Group level)
• Algorithm– Member surname/Census list generate “prior probability” of r/e group– Member neighborhood Census provides r/e neighborhood composition– Bayesian methods combine both types of information for final estimate
BISG Method – Outputs
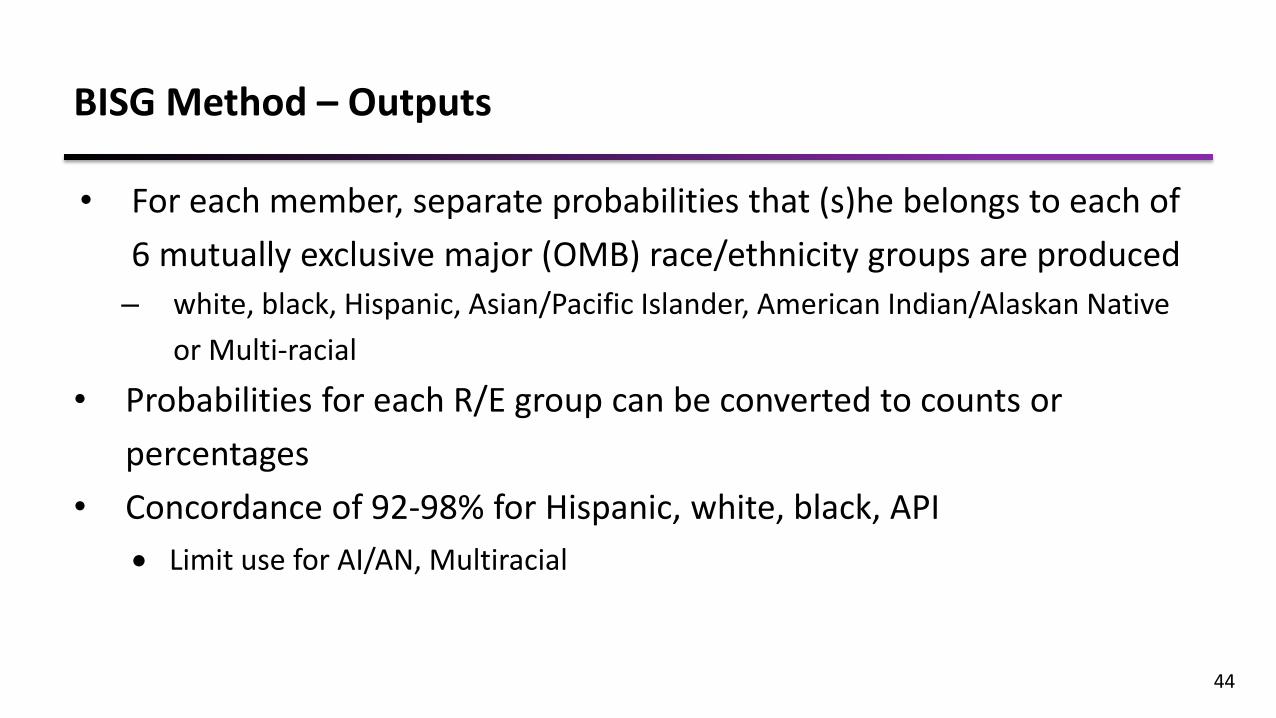
• For each member, separate probabilities that (s)he belongs to each of 6 mutually exclusive major (OMB) race/ethnicity groups are produced
– white, black, Hispanic, Asian/Pacific Islander, American Indian/Alaskan Native or Multi-racial
• Probabilities for each R/E group can be converted to counts or percentages
• Concordance of 92-98% for Hispanic, white, black, API• Limit use for AI/AN, Multiracial
44

Surnames Can Be Linked to Race/Ethnicity Probabilities
• 2010 US Census surname database contains surnames listed by 100 or more individuals along with r/e percentages
• The list of 151,671 unique surnames covers 89.8% of U.S. population
name rank countPct._white
Pct._black
Pct._api
Pct._aian
Pct._multirace
Pct._Hispanic
SMITH 1 2,376,206 73.35 22.22 0.4 0.85 1.63 1.56JOHNSON 2 1,857,160 61.55 33.8 0.42 0.91 1.82 1.5WILLIAMS 3 1,534,042 48.52 46.72 0.37 0.78 2.01 1.6BROWN 4 1,380,145 60.71 34.54 0.41 0.83 1.86 1.64JONES 5 1,362,755 57.69 37.73 0.35 0.94 1.85 1.44MILLER 6 1,127,803 85.81 10.41 0.42 0.63 1.31 1.43DAVIS 7 1,072,335 64.73 30.77 0.4 0.79 1.73 1.58GARCIA 8 858,289 6.17 0.49 1.43 0.58 0.51 90.81RODRIGUEZ 9 804,240 5.52 0.54 0.58 0.24 0.41 92.7WILSON 10 783,051 69.72 25.32 0.46 1.03 1.74 1.73
45

Enrollee Residential Addresses Can Also Be Linked to Race/Ethnicity Information
• Enrollee addresses are “geocoded” to identify each enrollee’s census block group
46
Block groupn_
whiten_
blackn_
apin_
aiann_
2pracen_
Hispanic110010053012 955 41 90 2 34 70110010052012 576 101 34 1 12 60overall 197,312,110 37,910,674 15,140,999 2,253,108 5,610,074 50,477,594

We Combine Both Sources of Information
• Initial probabilities based on surname are “updated” using information on block group r/e
47
Six surname-based probabilities(“prior” probabilities)
Block group level race/ethnicity tabulations
Bayes’ Theorem
Six “posterior” probabilities
Enrollee White Black API AIAN Multi Hispanic001 0.21 0.68 0.02 0.07 0.01 0.01

Race/Ethnicity Probabilities Can Be Used In Many Analytic Contexts
• Descriptive statistics of how many in each r/e group– % enrollment by r/e by plan, state, overall
• Weighting to compare something by r/e– % who were screened for colorectal cancer for each group
• Regression Analysis– Include r/e in a statistical model that looks at the association of r/e with costs
48

Example Uses of Self-Reported and BISG Estimates
49
Example Use Cases Self-Report or Other Direct Source BISG Estimate
Racial/ethnic composition of a patient population X X
Racial/ethnic differences in care quality and outcomes X X
Community-level outreach and interventions X X
Comparative effectiveness of interventions X X
Classification of individuals; race/ethnicity in electronic medical records X —

Some Previous Applications of RAND’s BISG Tool• Massachusetts Center for Health Information and Analysis (CHIA)
– R/e imputations were added to state’s All-Payer Claims Database– 5 years of data, 240 million cases
• Health Net– R/e imputations were conducted to identify quality gaps, support quality improvement
• CMS Office of Minority Health (https://www.cms.gov/About-CMS/Agency-Information/OMH/research-and-data/statistics-and-data/stratified-reporting.html)– Stratified reporting of quality measures for each Medicare Advantage contract by r/e
• Exchanges
50

51
CMS Application:National versus plan-specific r/e disparities
• Public reporting of HEDIS measure disparities at the national level– Inform CMS, plans, providers about quality improvement efforts
typically needed– Inform patients in communicating with their providers/plans
about types of care where disparities exist • Public reporting of HEDIS measure disparities at the plan
level– Inform CMS, plans, and providers to focus plan-specific quality
improvement efforts– Inform patients in communicating with their providers/plans
about types of care where disparities exist – May inform plan choice

CMS Application: Developing a Health Equity Summary Score to Incentivize Excellent Care to At-Risk Groups (Agniel et al. 2019)
• We created an equity summary score Medicare Advantage health plans based on HEDIS and CAHPS scores for beneficiaries with social risk factors (i.e., dually eligible for Medicare and Medicaid or r/e minority status),
• We considered:– Current levels of care– Within-plan improvement– Nationally-benchmarked improvement for those with SRFs
• R/e minority groups examined– Hispanic– Black– API– White
52

CMS Application: Measuring racial/ethnic differences in voluntary disenrollment from Medicare plans
Overall
Unadjusted disenrollment
rate
Adjusted disenrollment
rate
Difference of adjusted
disenrollment rate from whites
White 7.7 8.5 --API 8.7 9.2 0.7***Black 10.0 10.2 1.7***Hispanic 13.5 12.3 3.8***
*** p < 0.001 for all comparisons
We linked voluntary disenrollment information to MBISG 2.0.
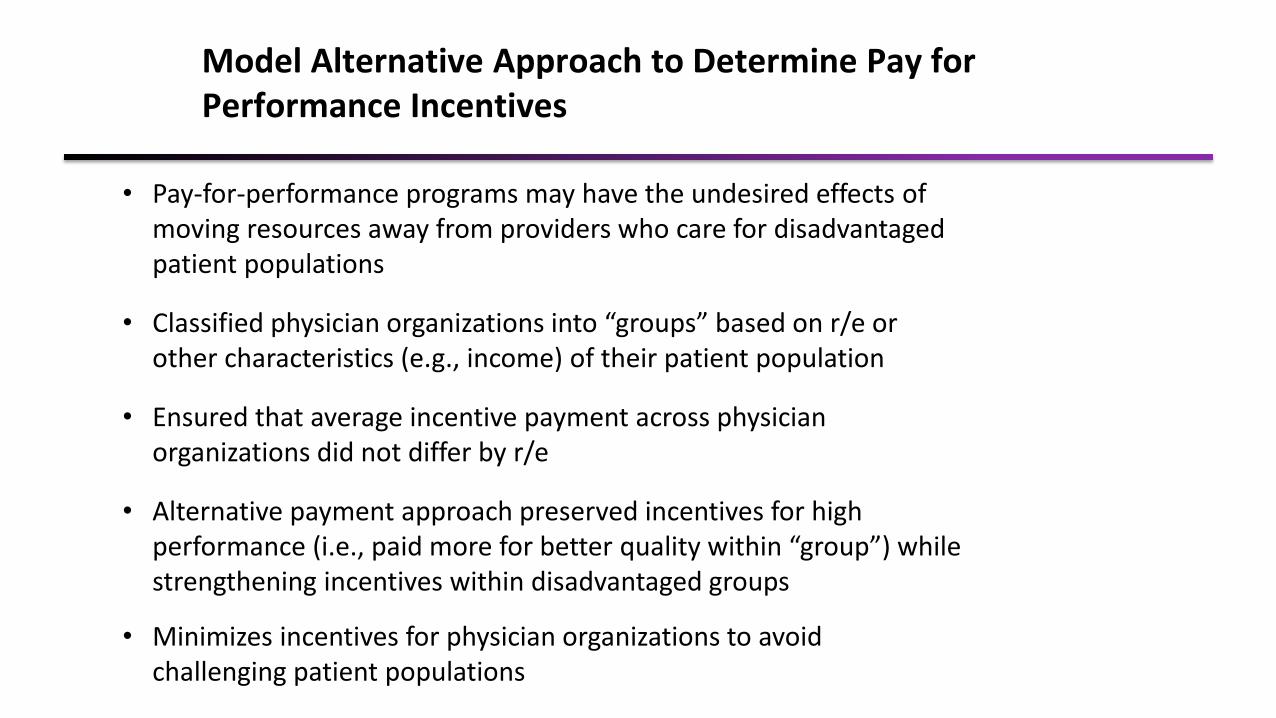
Model Alternative Approach to Determine Pay for Performance Incentives
• Pay-for-performance programs may have the undesired effects of moving resources away from providers who care for disadvantaged patient populations
• Classified physician organizations into “groups” based on r/e or other characteristics (e.g., income) of their patient population
• Ensured that average incentive payment across physician organizations did not differ by r/e
• Alternative payment approach preserved incentives for high performance (i.e., paid more for better quality within “group”) while strengthening incentives within disadvantaged groups
• Minimizes incentives for physician organizations to avoid challenging patient populations

BREAK

The Limitations of Claims Data for Distinguishing Physician Performance
at the Micro Level
OSHPD Healthcare Payments Database Review CommitteeNovember 21, 2019
Terry Hill, MD, FACP
Physician Advisor, Hill Physicians Medical Group

What evidence can distinguish physicians by quality (or efficiency)?
Claims data Clinical data (extracted manually or electronically from patient charts) Patient-reported data (satisfaction, complaints, patient-reported outcomes) Traditional peer review (systematic chart reviews and interviews) Knowledge testing (e.g., board exams) Direct observation (e.g., proctoring, the UCSD PACE program) Education and training Practice setting (e.g., university)
What evidence is good enough for quality improvement, P4P, public reporting, network selection, hiring/firing?
57
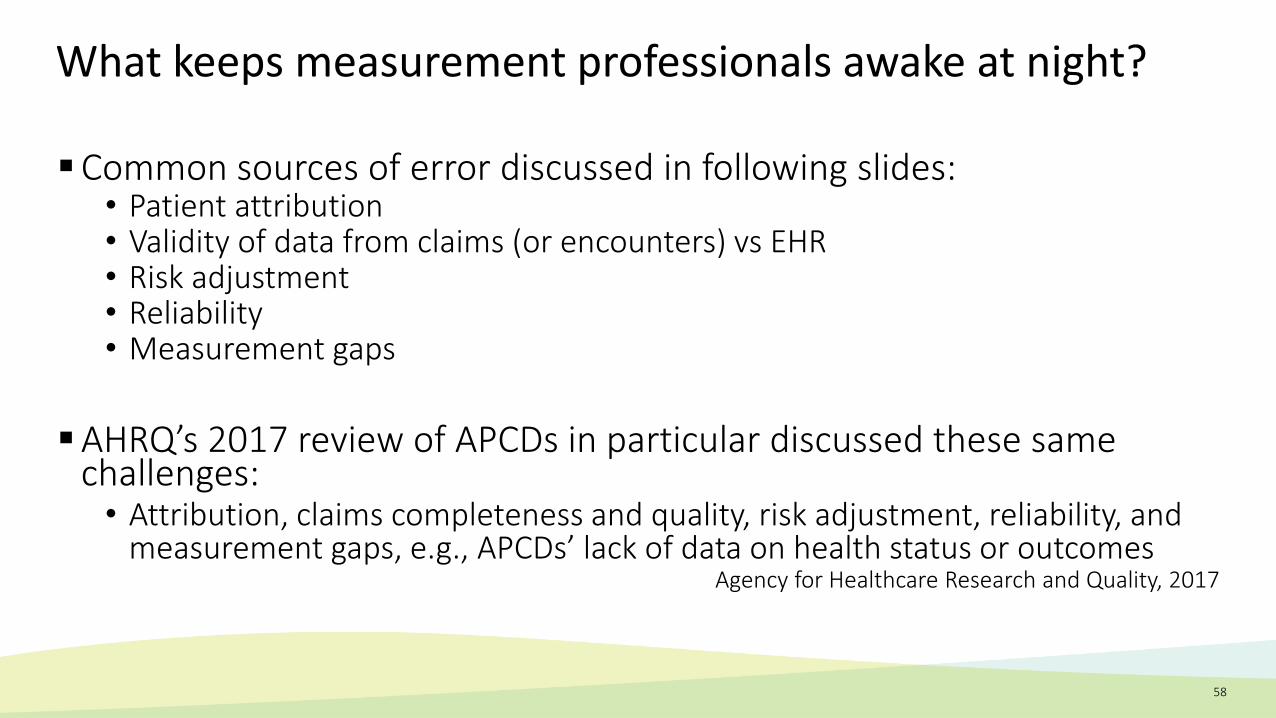
What keeps measurement professionals awake at night?
Common sources of error discussed in following slides:• Patient attribution• Validity of data from claims (or encounters) vs EHR • Risk adjustment• Reliability• Measurement gaps
AHRQ’s 2017 review of APCDs in particular discussed these same challenges:
• Attribution, claims completeness and quality, risk adjustment, reliability, and measurement gaps, e.g., APCDs’ lack of data on health status or outcomes
Agency for Healthcare Research and Quality, 2017
58

Attribution of patient to physician is a non-trivial task Attribution of responsibility for a patient to a physician can occur:
• ex ante, before the measurement period• ex post, at the end of the measurement period, based on the patient’s
visits or costs, etc Patient and physician may be aware of the attribution, as in managed care,
or unaware, as in traditional FFS Medicare analyses Claims-based assignment algorithms yield wildly varying results
• Misattribution of the PCP of record varies from 14% to 75%• Misattribution is more likely for vulnerable populations
DuGoff, Med Care 2018
ProPublica’s Surgeon Scorecard assigned cases to non-surgeons and to surgeons of the wrong subspecialty
Friedberg, Rand Health Q 201659

Claims/encounters yield different pictures than EHRs Claims identified only 75% of diabetics confirmed by EHR in 2007 study
Tang, J Am Med Inform Assoc 2007
Somewhat less under-identification in 2018 study, but for those patients:• HbA1c testing was under-recognized by claims• Lipid testing was grossly under-recognized by claims
Laws, Health Serv Res 2018
Diabetics managed via eHealth coordinated care may be excluded from denominators because they do not generate a claim, thus penalizing innovative care delivery approaches
McCoy, Health Serv Res 2016
Claims-based algorithms used to identify poor performance of breast cancer detection on mammograms were good enough for quality improvement but not for public reporting
Hubbard, Stat Med 2015
Of the 108 MIPS quality measures that CMS used in 2017, 36% were derived from claims and 64% were derived from clinical registries
60

We have consensus that we should risk adjust for social determinants (but no consensus how) After adjusting for sex, race/ethnicity, dual eligibility, disability, rurality, and
neighborhood disadvantage, 20.3%, 19.5%, and 11.4% of Medicare Advantage plans improved by one or more quintiles on diabetes, cholesterol, and blood pressure measures, respectively.
Durfey, Health Aff 2018
In a homogenous primary care organization with 22 medical centers, sociodemographic factors accounted for as much as 25% to 50% of the observed variance in selected HEDIS measures.
Hu, Am J Med Qual 2018
Other limitations:• “Using only claims data to risk-adjust fails to capture severity of illness….• “Intermediate outcome measures with fixed cutoffs…, such as hemoglobin A1c control of <7.0,
have proven problematic. The best treatment goal for one person may be inappropriate for another.”
Damberg, J Gen Intern Med 2016
61

Reliability (signal/noise) depends on denominator size and the variation across a measure
Inadequate reliability leads to misclassification of physicians by HEDIS measures• Even reliabilities > 0.90 can produce misclassification rates of > 10% • Reliabilities > 0.70 can produce misclassification rates of > 20%
Adams, Health Serv Res 2017 And to misclassification for physician cost profiling
• In a study based on 44% of Massachusetts residentso Reliabilities ranged from 0.05 for vascular surgery to 0.79 for gastroenterology and ENTo 59% of physicians had cost-profile scores with reliabilities of less than 0.7o 22% of physicians would be misclassified as lower- vs higher cost
Adams, N Engl J Med 2010 For readmission rates, variation is insufficient for distinctions among physicians
• There is almost no significant variation in readmission rates by PCP• The denominator required to detect differences in readmission rates far exceeds the number
of admissions generated by individual PCPsSingh, Ann Intern Med 2019
62

PCPs were ranked in the top, middle, and lower thirds in four domains:• Cancer screening, diabetic management, patient satisfaction, and ambulatory costs• 81% of those getting a top score also got a low score• Only 6% were consistent
Even if measures were reliable, physician performance varies across domains
63
“Conjoining measures might both deny accolades and mask poor practice”Parkerton, Med Care 2003

Measurement gaps: Measuring what matters most is challenging
“Many common reasons for which patients seek care, including fever, cough, headache, shortness of breath, earache, rash, and throat symptoms, were not reflected by the quality measures“
Kanzaria, JAMA 2015
“We have few measures to assess: • diagnosis errors… • providers’ ability to skillfully manage complex patients with varying combinations of
multiple clinical and psychosocial problems”Berenson, Urban Institute 2013
We have no way to measure the quality of physicians’ conversations about end-of-life care
64

Humility and caution are warranted
Key Issue 1: The Process of Measuring and Reporting on the Health Care System’s Performance is Error Prone and Lacks Standards
• “Publicly reporting a measure whose reliability and validity are unknown poses risks… and raises potential ethical concerns, such as imposing unjust financial and reputation harm on physicians and provider organizations, misinforming patients about the risks and benefits associated with a treatment option, and guiding patients to riskier rather than to safer care”
Pronovost, National Academy of Medicine 2017
Missteps can harm the measurement cause• E.g., as occurred with ProPublica’s Surgeon Scorecard and CHPI
An example of good governance and prudence:• IHA’s Technical Measurement Committee recommended abandoning the effort to measure efficiency using
episodes of care• Not only for physicians, but also for organizations, patient volumes did not permit reliable measurement of
episode efficiencyRobinson, Health Aff 2009
65

California Maternal Quality Care Collaborative: creatively leveraging data for meaningful results “While US maternal mortality has worsened in the 2010s, by 2013 California’s rate had been cut in half to
a three-year average of 7.0 maternal deaths per 100,000 live births” Among the success factors:
• Enthusiastic state agency and private partners• A Maternal Data Center with over 95 percent of California births combining claims and clinical EHR
data supporting rapid-cycle improvement• Protection from legal discovery and public attack• Flexibility: “since quality improvement topics change”
66Main, Health Aff 2018

Adams JL, Mehrotra A, Thomas JW, McGlynn EA. Physician cost profiling--reliability and risk of misclassification. N Engl J Med. 2010;362:1014-1021 Adams JL, Paddock SM. Misclassification Risk of Tier-Based Physician Quality Performance Systems. Health Serv Res. 2017;52:1277-1296 Agency for Healthcare Research and Quality. All-Payer Claims Databases Measurement of Care: Systematic Review and Environmental Scan of Current Practices and Evidence. Rockville,
MD; June 2017 Berenson R, Pronovost P, Krumholtz H. Achieving the potential of health care performance measures: timely analysis of immediate health policy issues. Urban Institute; 2013 Damberg CL, Baker DW. Improving the Quality of Quality Measurement. J Gen Intern Med. 2016;31 Suppl 1:8-9 DuGoff EH, Walden E, Ronk K, Palta M, Smith M. Can Claims Data Algorithms Identify the Physician of Record? Med Care. 2018;56:e16-e20 Durfey SNM, Kind AJH, Gutman R, et al. Impact Of Risk Adjustment For Socioeconomic Status On Medicare Advantage Plan Quality Rankings. Health Aff. 2018;37:1065-1072 Friedberg MW, Bilimoria KY, Pronovost PJ, Shahian DM, Damberg CL, Zaslavsky AM. Response to ProPublica's Rebuttal of Our Critique of the Surgeon Scorecard. Rand Health Q.
2016;6(1):4 Hu J, Schreiber M, Jordan J, George DL, Nerenz D. Associations Between Community Sociodemographics and Performance in HEDIS Quality Measures: A Study of 22 Medical Centers in a
Primary Care Network. Am J Med Qual. 2018;33:5-13 Hubbard RA, Benjamin-Johnson R, Onega T, Smith-Bindman R, Zhu W, Fenton JJ. Classification accuracy of claims-based methods for identifying providers failing to meet performance
targets. Stat Med. 2015;34:93-105 Kanzaria HK, Mattke S, Detz AA, Brook RH. Quality measures based on presenting signs and symptoms of patients. JAMA. 2015;313:520-522 Laws MB, Michaud J, Shield R, McQuade W, Wilson IB. Comparison of Electronic Health Record-Based and Claims-Based Diabetes Care Quality Measures: Causes of Discrepancies. Health
Serv Res. 2018;53 Suppl 1:2988-3006 Main EK, Markow C, Gould J. Addressing Maternal Mortality And Morbidity In California Through Public-Private Partnerships. Health Aff. 2018;37:1484-1493 McCoy RG, Tulledge-Scheitel SM, Naessens JM, et al. The Method for Performance Measurement Matters: Diabetes Care Quality as Measured by Administrative Claims and Institutional
Registry. Health Serv Res. 2016;51:2206-2220 Parkerton PH, Smith DG, Belin TR, Feldbau GA. Physician performance assessment: nonequivalence of primary care measures. Med Care. 2003;41:1034-1047 Pronovost PJ, Austin JM, Cassel CK, et al. Fostering transparency in outcomes, quality, safety, and costs. Vital Directions for health & health care: An initiative of the National Academy of
Medicine. Washington, DC: National Academy of Medicine; 2017 Robinson JC, Williams T, Yanagihara D. Measurement of and reward for efficiency In California's pay-for-performance program. Health Aff. 2009;28:1438-1447 Singh S, Goodwin JS, Zhou J, Kuo YF, Nattinger AB. Variation Among Primary Care Physicians in 30-Day Readmissions. Ann Intern Med. 2019;170:749-755 Tang PC, Ralston M, Arrigotti MF, Qureshi L, Graham J. Comparison of methodologies for calculating quality measures based on administrative data versus clinical data from an electronic
health record system: implications for performance measures. J Am Med Inform Assoc. 2007;14:10-15
67
References

Health Net Encounter Data Improvement Program
Healthcare Payments Data Review Committee
November 21, 2019

69
Healthcare Payments Data Review Committee | November 21st, 2019
HealthNet’s Encounter Data Improvement Program
Program Goal:Mitigate barriers to the timely collection and submission of complete and accurate encounter data; and strengthen the data collection and reporting infrastructure.
Health Net’s Community and Infrastructure Investment Program has committed $50 million over five years to improve encounter data
reporting in California

70
Healthcare Payments Data Review Committee | November 21st, 2019
CA DHCS Reporting Requirements
Encounter data is playing an increasing role in Medi-Cal managed careplan rate setting, provider payment distribution, and quality scoring.
Rate Setting & Encounter Data Stoplight Reporting
DHCS will increase encounter use in rate development starting in SFY2020-21
Directed Payments
Directed Payments will utilize encounter data for Physician Directed Payments (Prop 56) and Hospital Directed Payments programs, such as the Designated Public Hospital (DPH) Quality Incentive Program; DPH Enhanced Payment Program; and Private Hospital Directed Payment Program.
Improving HEDISScores
Health plans must meet the 50th
national percentile for HEDISmeasures, calculated in part using encounter data. Performance below the 25th percentile will trigger an “improvement plan” by DHCS.

71
Healthcare Payments Data Review Committee | November 21st, 2019
Delivery System Observed Challenges
Provider Organizations (POs), Independent Practice Associations (IPAs) & Managed Services Organizations
(MSOs)Encounter Data Reporting Challenges: Lack of awareness of encounter data significance High staff turnover and limited training in proper coding and
encounter data submission processes Reliance on antiquated or rigid EHR systems, or paper-based
submissions Lack of timely or actionable feedback on rejection reports at
each submission level Uneven data standards, requirements and communication
across clearinghouses and MCPs
CMS
Billing EHREncounters
Encounters
Encounters
Clearinghouse
Clearinghouse
Encounters
Encounters
DHCS
MCPs
IPAs/MSOs
POs

72
Healthcare Payments Data Review Committee | November 21st, 2019
Managed Care Plan Observed Challenges
Managed Care Plans (MCPs)Encounter Data Reporting Challenges: Incomplete submissions from contracted IPAs and
providers Unclear DHCS submission standards (e.g. local codes)
and inaccurate coding cross-walks Lack of DHCS transparency/feedback on edits/rejections
CMS
Billing EHREncounters
Encounters
Encounters
Clearinghouse
Clearinghouse
Encounters
Encounters
DHCS
MCPs
IPAs/MSOs
POs

73
Healthcare Payments Data Review Committee | November 21st, 2019
DHCS and CMS Observed Challenges
Department of Health Care Services (DHCS) & Centers for Medicare & Medicaid Services (CMS)
Encounter Data Reporting Challenges: Lack of CMS guidance leads to incomplete and unclear
standards and state requirements (per GAO review) Long lag times for encounter completeness/quality
feedback from CMS to DHCS and DHCS to MCPs Limited understanding of downstream technical
challenges associated with submitting encounter data Governing a tremendously complex encounter data
ecosystem without complete visibility, especially into intermediaries
CMS
Billing EHREncounters
Encounters
Encounters
Clearinghouse
Clearinghouse
Encounters
Encounters
DHCS
MCPs
IPAs/MSOs
POs

74
Healthcare Payments Data Review Committee | November 21st, 2019
Cross-Cutting Ecosystem Challenges
Cross-Cutting Issues Poor Communication: Lack of
guidance on encounter reporting expectations, rules, and code changes
Limited Incentives: for reporting complete, accurate and timely encounter data,
Lack of Traceability: To trace data quality issues to the source of the problem
CMS
Billing EHREncounters
Encounters
Encounters
Clearinghouse
Clearinghouse
Encounters
Encounters
DHCS
MCPs
IPAs/MSOs
POs
Communication, Feedback, & Traceability
Payments & Incentives

75
Healthcare Payments Data Review Committee | November 21st, 2019
Technology & Technical AssistanceSupport outreach and deliver technical assistance to improve encounter data reporting capabilities
GovernanceEstablish data and program governance to coordinate and prioritize improvement initiatives, oversee changes to standards, policies and processes, and support communication and collaboration
Data StandardizationEstablish and update standardized encounter data code sets, specifications, and vocabularies to improve data quality, completeness and timeliness
Three Work Groups Have Been Established

76
Healthcare Payments Data Review Committee | November 21st, 2019
Work Plan
HealthNet and Manatt’s work plan includes an environmental assessment, two summits and three work groups to address challenges and develop solutions
Phase 1: Project Kick-off
Phase 2: Environmental Scan
Phase 3: Stakeholder Summit
Phase 4:Three Workgroups
Phase 5: 2nd Stakeholder Summit
Phase 6: Final Report
May Jun. Jul. Feb.Jan.Dec.Nov.Oct.Sep.Aug.
Three workgroups will develop and present recommendationsat the summit in Spring 2020

THE POWER OF DATA 11/21/1965 School Districts138 Bargaining Units1 County Government3 College Entities$1 Billion in Annual HC Purchase

Vision: Our members are engagedand empowered advocates for their own well-being
W hy We D o W h a t We D o
Mission: Through collaborative partnerships, we provide health resources that are effective, affordable and of the highest quality and value
#CenteredAroundYou78

VEBA’s P h i l o s o p h y
1. Give members visibility to cost and quality.
2. Create incentives to utilize high value providers.
#CenteredAroundYou79
3. Use competition to drive cost savings &innovation.
Using CA Office of PatientAdvocate data, VEBA mapsproviders on a cost-qualitymatrix to determine thevalue of care delivered.
VEBA realized cost savingsof more than $100 millionby both improving unitcost and getting ourmembers better qualitycare.
VEBA’s next product and
generation innovation
strategy includes shared-risk Centers of Excellence,enhanced access to mentalhealth services, & captivefacilities.

P e r f o r m a n c e HMO – San D i e g o• PHMO design based on a balance of cost and
quality metrics• Overtime, Network 3 medical groups havebecome
available in more affordable networks, like Alliance• Alliance network allowed for a lower-cost option
for accessing Scripps and UCSD• San Diego based-districts were giventhe
choice to eliminate Network 3 over thepast two enrollment periods
• Many districts took advantage and no longerofferN3
• For 2020, Network 3 will no longer be an optionfor districts/bargaining units in San Diego
• If no election, the default for these memberswillbe the Alliance 20/30plan
Note: Network 3 will continue to be available todistrictsoutside San Diego
Excerpt from 2014 OE Materials
#CenteredAroundYou80
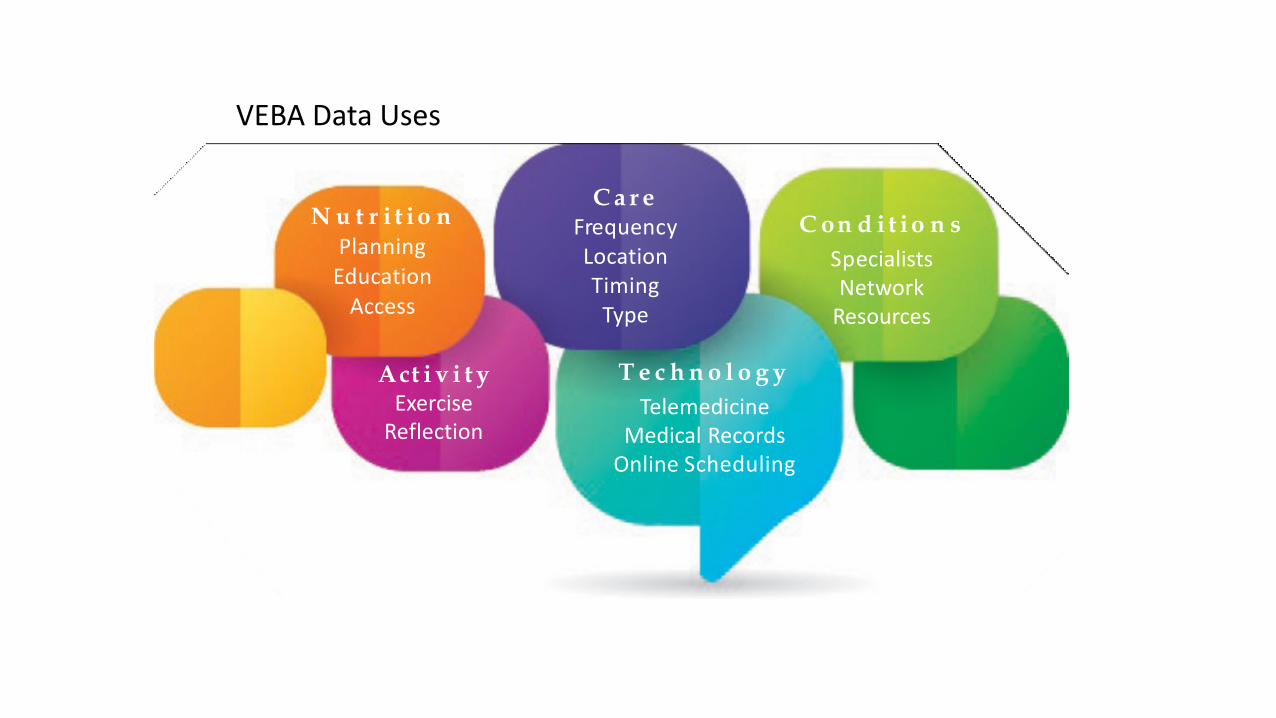
C a r e Frequency Location Timing
Type
C on d i t i o n sSpecialists Network
Resources
T e c h n o l o g yTelemedicine
Medical Records Online Scheduling
N u t r i t i o n Planning
Education Access
Act i v i t y Exercise
Reflection
VEBA Data Uses

W h a t t h i s means Sympt o ms/D iseases
Diabetes COPDObesity Stroke Cancer Suicide
#CenteredAroundYou82
B e h a v iors
Heavy Drinking Opioids Use Smoking Overeating
S t r e s s
Toxic – Daily Financial Environmental Social
M e n t a l H e a l t h
DepressionBi-Polar Disorder Anxiety Disorder
T r a u m a
Divorce Imprisonment Domestic Violence Death of Loved One Violence in theHome Suicide
Abuse
Physical Emotional
A d d r e s s i n g U n d e r l y i n g C o s t D r i v e r s
• We often know what to do –but why don’t we do it?
• Stress, anxiety and trauma reduce our ability to effectively manage our significant health issues
• Rolling out new tools and resources for members to deal with the true drivers of health care costs

Data Has Allowed:
• Customizing Networks• Better Income Distribution to Providers• Identifying Cost Trends• Improve Efficiency• Keeping Members Healthy• Prediction Capability• Error Minimization• Real Time Alerts
• Compliance Tracking• Enhancing Patient Engagement• Informed Strategic Planning• Staffing Allocations


Technical Workgroup Report:Summary of APCD-CDLTM Feedback
Ted Calvert, Consultant, OSHPD
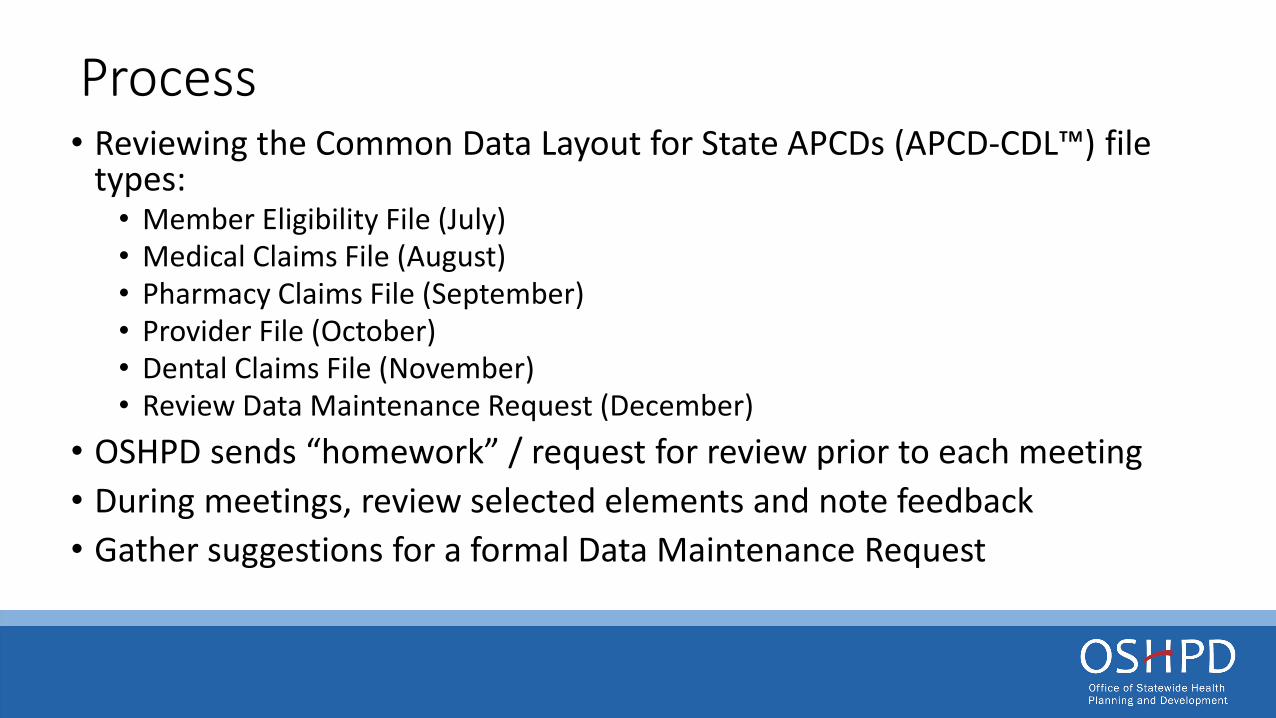
Process• Reviewing the Common Data Layout for State APCDs (APCD-CDL™) file
types:• Member Eligibility File (July) • Medical Claims File (August)• Pharmacy Claims File (September)• Provider File (October)• Dental Claims File (November)• Review Data Maintenance Request (December)
• OSHPD sends “homework” / request for review prior to each meeting• During meetings, review selected elements and note feedback• Gather suggestions for a formal Data Maintenance Request

Recurring Themes• Health plans and insurers must pull data from several internal systems to
prepare APCD-like data• There’s considerable variation in:
• Availability of data (e.g., completeness) at the element-by-element level• Availability is often determined upstream and is not in the submitter’s control
• Interpretation of data element definitions• Use of the APCD-CDLTM helps but is not a cure-all
• Includes relevant data elements to support analysis (vs. adjudicating claims)• Provides definitions and references to other standards• Continued adoption will reduce reporting burden of national plans• Ongoing communications between submitters and OSHPD are necessary and critical

Preview of Likely Changes to be Requested• General requests:
• Add even more references to underlying standards (e.g., HIPAA transaction elements)• Clarify which elements are expected to always be populated (e.g., dates of service, admission
date on inpatient facility records) vs. “when available” (e.g., Social Security Number)• Note that OSHPD will still need to develop more specific data quality thresholds and feedback
mechanisms
• Examples of specific requests:• Add a new data element, Rendering Provider Street Address • In definitions or documentation, further clarify what’s expected in the financial fields for
encounters covered under a capitated arrangement (e.g., FFS equivalent in Allowed Amount)• Use NDC codes rather than drug names in the Compound Drug Name field• Expand length of Provider Middle Name or Initial on the Provider file to 25 characters to
match same field on other files

Selected APCD-CDLTM Financial Fields• Trailer: Control Total of Paid Amount • Eligibility File:
• Total Monthly Premium• Medical & Dental Claims Files:
• Charge, Plan Paid, Allowed Amounts • Withhold Amount • Co-Pay, Coinsurance, Deductible Amounts • Other Insurance Paid Amount• COB/TPL Amount• Payment Arrangement Type Flag
(Cap, FFS, %Charges, DRG, P4P, GP, Other, BP)

Selected APCD-CDLTM Financial Fields, cont.• Pharmacy Claims File:
• Charge, Plan Paid, Allowed Amounts• Sales Tax Amount• Ingredient Cost/List Price• Postage Amount Claimed• Dispensing Fee• Co-Pay, Coinsurance, Deductible Amounts• COB/TPL Amount• Other Insurance Paid Amount• Member Self-Pay Amount• Payment Arrangement Type Flag (Cap, FFS, %Charges, Other)

Public Comment

Upcoming Review Committee Meeting :
December 19, 2019

Technology Alternatives
• Technology options to receive, store, and structure data
•Technology options to incorporate other data sets for research
•Technology options to analyze data and publish reports
Overflow Month
•Opportunity to catch up on topics not captured in past months
Governance: Administrative Plan for Operating the Database
•Considerations for effectively governing a data management system
•Opportunities to leverage existing data governance structures
Sustainability
•Discussion on associated costs of the database
•Role of fees for data usage or data submission
•Recommended business plan elements to fund the operations of the database
Close Out
•Review of final Review Committee recommendations
•Next Steps
October November December January February
Review Committee Meeting Topics
93

Appendix
94

EXAMPLE 3 – BENEFIT DESIGN EVALUATIONS
95
Covered California currently requires plans to submit products according to standardized Patient-centered Benefit Designs, developed with input from a diverse and collaborative stakeholder process.These benefit designs have included key features designed to improve the patient experience with Covered California coverage, and to incentivize access and high-value care, with features such as:• Bronze plans with 3 visits outside the deductible• Caps on Specialty Drug co-pays (2016)• … and additional modifications each year

EXAMPLE 3 – BENEFIT DESIGN EVALUATIONS
96
Evaluation Question: What is the impact of __ change to the benefit design on utilization, member cost share, total cost of care, and quality of care (where applicable)?Challenge Under Current State:Benefit design changes are implemented uniformly across all QHP products.HPD Value Added:Create comparison groups from other California market segments (e.g. small group) that did not experience the change in benefit design.Actionable:Findings would inform future revisions to the benefit designs.
* A similar analytic approach has been used, e.g. using the MarketScan database,: Gibson, et al. (2011) “Value-Based Insurance Plus Disease Management Increased Medication Use And Produced Savings,” Health Affairs, Vol. 30, No. 1: https://doi.org/10.1377/hlthaff.2010.0896

EXAMPLE 3B – NEW INTERVENTION EVALUATIONS
97
Beyond its work on benefit designs, Covered California is continually working with issuers and stakeholders to identify new product features or outreach strategies that may improve access to, and quality of, care, all while lowering cost.(For example, in 2017 Covered California required all PPO and EPO products to assign a Primary Care Physician (PCP) to all members upon enrollment.)As with benefit design changes, such interventions often must be imposed uniformly across the Covered California market (for operational or legal reasons). The HPD would provide a unique data asset to allow more rigorous assessments of the impacts of these changes on care.
* A similar analytic approach has been used, e.g. using the MarketScan database,: Gibson, et al. (2011) “Value-Based Insurance Plus Disease Management Increased Medication Use And Produced Savings,” Health Affairs, Vol. 30, No. 1: https://doi.org/10.1377/hlthaff.2010.0896

DATA USAGE CONSIDERATIONS
98
As a potential user of HPD data, Covered California anticipates several critical aspects of usage that could have critical impacts on the viability of some use cases:
• Time to Information: Many of Covered California’s core use-cases are focused on results that could inform operational decisions: the timeframe for data availability and project execution will be important considerations for some use cases.
• Data Blending: Covered California may frequently seek to bring its own pre-defined study population to the HPD data, including additional administrative or other data (e.g. application characteristics specific to its enrollees; or campaign-specific information about consumer engagement in their plan choice decisions). Will the data governance and information security framework of the HPD allow this in a secure but practical way?

DATA USAGE CONSIDERATIONS
99
• Direct Analytic Support: How will state agencies (or any users) access the technical expertise of the team that builds and maintains the HPD to assist in data analysis? If these resources are contractors of OSHPD, would HPD users be able to contract directly with these vendors, or only access as mediated by OSHPD team?
• Data Updates or Augmentation: If, despite the best planning, certain data elements are not available in the core data layouts for the HPD, will there be mechanisms to update the HPD with that information, or to enable analysis that incorporates that data through separate ad-hoc feeds?

DATA QUALITY CONSIDERATIONS
100
For any use case, Covered California reiterates the importance of attention to data quality and completeness, and that a priority from the start include:
• Allowed cost information comprised of the insurer / payer paid amount and the consumer cost share amounts. Given the California market, a fee-for-service equivalent amount for capitated services also is essential.
• Provider identification accomplished via the individual practitioner National Provider Identifier (NPI); a comprehensive facility identifier (e.g., OSHPD identifier); the one-to-many roll-up of practitioners to medical practices; and the organization of facility and practitioner identifiers to show the composition of delivery system entities like Accountable Care Organizations (ACOs). To provide detailed analysis in patterns in care, it is essential to identify the individual (rendering) provider, and not rely only the tax ID, for example.

References
Martino, S. C., Weinick, R. M., Kanouse, D. E., Brown, J. A., Haviland, A. M., Goldstein, E., ... & Elliott, M. N. (2013). Reporting CAHPS and HEDIS data by race/ethnicity for Medicare beneficiaries. Health Services Research, 48(2pt1), 417-434.Elliott, M. N., Morrison, P. A., Fremont, A., McCaffrey, D. F., Pantoja, P., & Lurie, N. (2009). Using the Census Bureau’s surname list to improve estimates of race/ethnicity and associated disparities. Health Services and Outcomes Research Methodology, 9(2), 69.Haas, A., Elliott, M. N., Dembosky, J. W., Adams, J. L., Wilson-Frederick, S. M., Mallett, J. S., ... & Haviland, A. M. (2019). Imputation of race/ethnicity to enable measurement of HEDIS performance by race/ethnicity. Health Services Research, 54(1), 13-23.Agniel, D., Martino, S.C., Burkhart, Q. et al. (2019) Journal of General Internal Medicine.Damberg C, Elliott MN, Ewing B. (2015) “Pay-for-Performance Schemes that Use Patient and Provider Categories Would Reduce Payment Disparities” Health Affairs 34(1): 134-142.
101
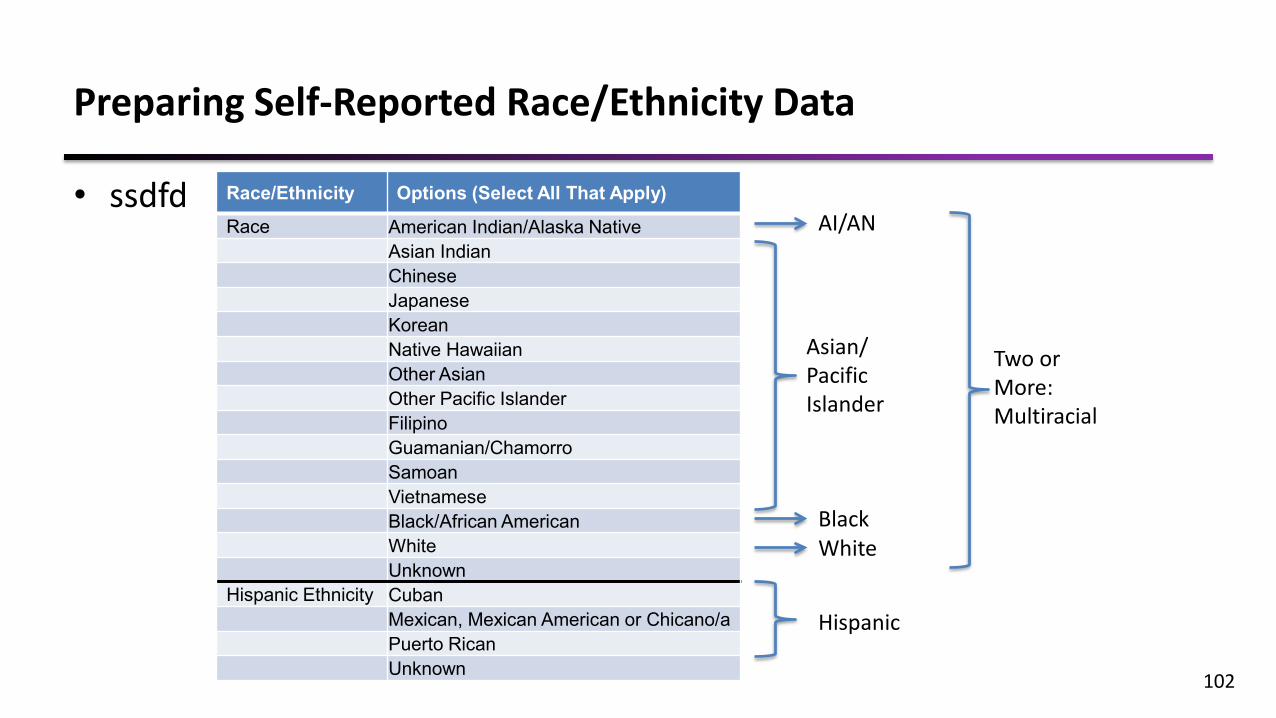
Preparing Self-Reported Race/Ethnicity Data
• ssdfd
102
Race/Ethnicity Options (Select All That Apply)
Race American Indian/Alaska NativeAsian IndianChineseJapaneseKoreanNative HawaiianOther AsianOther Pacific IslanderFilipinoGuamanian/ChamorroSamoanVietnameseBlack/African AmericanWhiteUnknown
Hispanic Ethnicity CubanMexican, Mexican American or Chicano/aPuerto RicanUnknown
AI/AN
WhiteBlack
Asian/PacificIslander
Hispanic
Two or More: Multiracial

Rules for Categorizing Self-Reported Race/Ethnicity into 6 Mutually Exclusive Groups
1. Hispanic ethnicity +/- other races -> Hispanic2. Non-Hispanic respondents who reported two or more races were classified as
multiracial, with the exception of those who selected two or more from among the following options (but no other race): “Asian Indian”, “Other Indian”, “Chinese”, “Japanese”, “Korean”, “Native Hawaiian”, “Other Asian”, “Other Pacific Islander”, “Filipino”, “Guamanian or Chamorro”, “Samoan”, “Vietnamese.” These enrollees were classified as API.
3. Non-Hispanic respondents who reported exactly one race were classified as AI/AN, API, black, or white, according to their response.
103

Geocoding Enrollee Residential Addresses
• Goal: Identify each enrollee’s census block group• Requires geocoding software (e.g., ArcGIS)• Software identifies X,Y coordinates using the most
precise geographic information possible:– Full address– 9-digit zip code– 5-digit zip code
• Software then links coordinates to a single block group
104

Formatting Enrollee Surnames
• Goal: Enable merging of enrollee names with Census surname dataset• Examples:
– Mrs. Kim -> KIM– Smith Jr. -> SMITH– Wilson III -> WILSON– Davis Ph.D. -> DAVIS– Beck-Sullivan -> BECKSULLIVAN– De La Luz -> DELALUZ
105

Generating Preliminary Race/Ethnicity Probabilities
• Apply Bayes’ Theorem to generate 6 posterior probabilities
106
p(Black|surname s, blkgrp b) =
p(Black|surname s)*p(blkgrp b|Black)
p(AIAN|surname s)*p(blkgrp b|AIAN) +p(API|surname s)*p(blkgrp b|API) + p(Black|surname s)*p(blkgrp b|Black) +p(Hispanic|surname s)*p(blkgrp b|Hispanic) +p(White|surname s)*p(blkgrp b|White) +p(Multiracial|surname s)*p(blkgrp b|Multiracial)
Illustrative calculation for 1 of the 6 probabilities:

Overview of Improvement of Algorithm to Create MBISG 2.0 (Haas et al. 2019)• Improves the three currently used data elements of the existing algorithm within
the Bayesian framework– Address– Surname– CMS administrative variable
• Incorporates additional data elements and more flexible modeling• Turns CMS administrative classification into a vector of r/e probabilities using
previous self-reported data from a national survey of Medicare beneficiaries, poststratified to CMS enrollment files
• Independently calculates a vector of BISG r/e probabilities from name, address • Uses similar Bayesian approach to integrate these 2 estimates, 3 information
sources• Substantially improves the original CMS variable
107

Race/Ethnicity Probabilities Are Recommended
• Probability-based imputations exhibited excellent calibration and discrimination
• Classification-based imputations underestimated prevalence for non-White groups
• In most applications, probability-based estimates should suffice– Example: Re-enrollment campaign targeted to Hispanic
enrollees:• Disseminate information to enrollees with probability of Hispanic
ethnicity 0.8 and above• Disseminate information to enrollees with probability of Hispanic
ethnicity in the highest decile 108

Proportion Belonging to a Specific Racial/Ethnic Group
Surname AI/AN Asian Black Hispanic White Multiracial
Learner 0 0.1 0.1 0.15 0.65 0
Lee 0 0.5 0.35 0.0 0.15 0
Lopez 0.05 0.0 0.1 0.65 0.2 0
109
Census Surname list provides probabilities that person with that last name belongs to each of 6 R/E groups
John Lee, 1501 Eastern Blvd, Montgomery, AL 36117*
Example:
Based on 270 million US citizens >99% of all surnames
NOTE: *Name, address, and numbers in the table are hypothetical.

Probability of Belonging to a Specific Racial/Ethnic Group
Block Group AI/AN Asian Black Hispanic White Multiracial
1012 0 0.1 0.3 0.1 0.5 0
1223 0 0.05 0.6 0.20 0.15 0
1056 0 0.1 0.3 0.2 0.4 0
110
Census Block Group files provides proportions of residents belonging to each R/E Group in a neighborhood
John Lee, 1501 Eastern Blvd, Montgomery, AL 36117
Example:
Block groups have an average of 1,000 residents
NOTE: *Name, address, and numbers in the table are hypothetical.
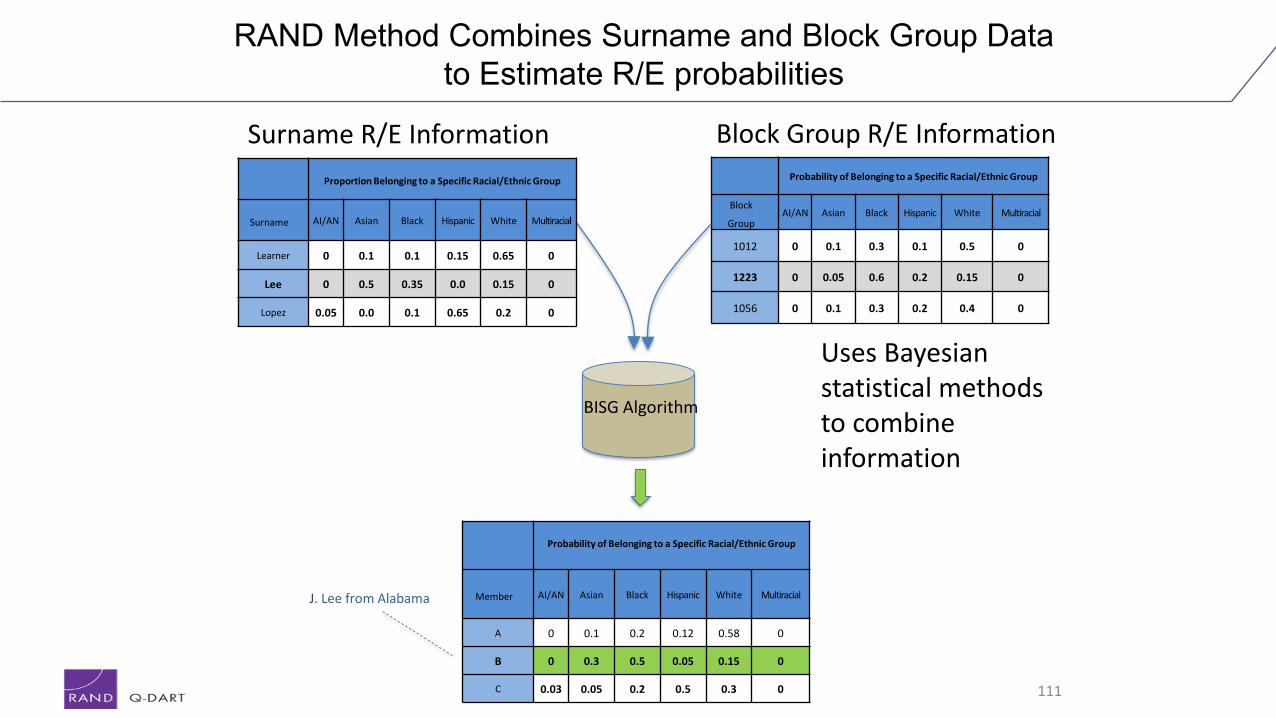
RAND Method Combines Surname and Block Group Data to Estimate R/E probabilities
Probability of Belonging to a Specific Racial/Ethnic Group
Block
GroupAI/AN Asian Black Hispanic White Multiracial
1012 0 0.1 0.3 0.1 0.5 0
1223 0 0.05 0.6 0.2 0.15 0
1056 0 0.1 0.3 0.2 0.4 0
111
Surname R/E Information Block Group R/E Information
BISG Algorithm
Uses Bayesian statistical methods to combine information
Probability of Belonging to a Specific Racial/Ethnic Group
Member AI/AN Asian Black Hispanic White Multiracial
A 0 0.1 0.2 0.12 0.58 0
B 0 0.3 0.5 0.05 0.15 0
C 0.03 0.05 0.2 0.5 0.3 0
Proportion Belonging to a Specific Racial/Ethnic Group
Surname AI/AN Asian Black Hispanic White Multiracial
Learner 0 0.1 0.1 0.15 0.65 0
Lee 0 0.5 0.35 0.0 0.15 0
Lopez 0.05 0.0 0.1 0.65 0.2 0
J. Lee from Alabama

Probability of Belonging to a Specific Racial/Ethnic Group
Member AI/AN* Asian Black Hispanic White Multiracial
A 0 0.1 0.6 0.2 0.1 0
B 0 0 0.1 0.7 0.2 0
C 0 0.5 0.1 0 0.4 0
D 0 0 0.1 0.4 0.5 0
E 0 0 0.2 0.2 0.6 0
F 0 0 0.2 0.1 0.6 0.1
G 0.1 0.6 0 0.2 0.1 0
H 0 0 0.1 0.5 0.3 0.1
I 0 0 0.0 0.2 0.8 0
J 0 0 0.7 0.2 0.1 0
Sum 0.1 1.2 2.1 2.7 3.7 0.2
Mean 0.01 0.12 0.21 0.27 0.37 0.02
112
Individual probabilities can be converted into group counts and proportions (or percentages)
Sum = Count Mean = Proportion or Percent if Multiplied by 100

Available R/E data can be combinedwith BISG probability estimates
113
Probability of Belonging to a Specific Racial/Ethnic Group
Member AI/AN* Asian Black Hispanic White Multiracial
A 0 0 1 0 0 0
B 0 0 0 1 0 0
C 0.1 0.5 0.1 0 0.3 0
D 0.1 0 0.3 0 0.6 0
E 0 0 0 0 1 0F 0 0 0.3 0 0.7 0
G 0 0 0 0 1 0
H 0.1 0 0 0.9 0 0
I 0 0 0.5 0.5 0 0
J 0 1 0 0 0 0
.
Sum 0.3 1.5 2.2 2.4 3.6 0
Mean 0.03 0.15 0.22 0.24 0.36 0
Sum = Count; Mean = Proportion or Percent if Multiplied by 100
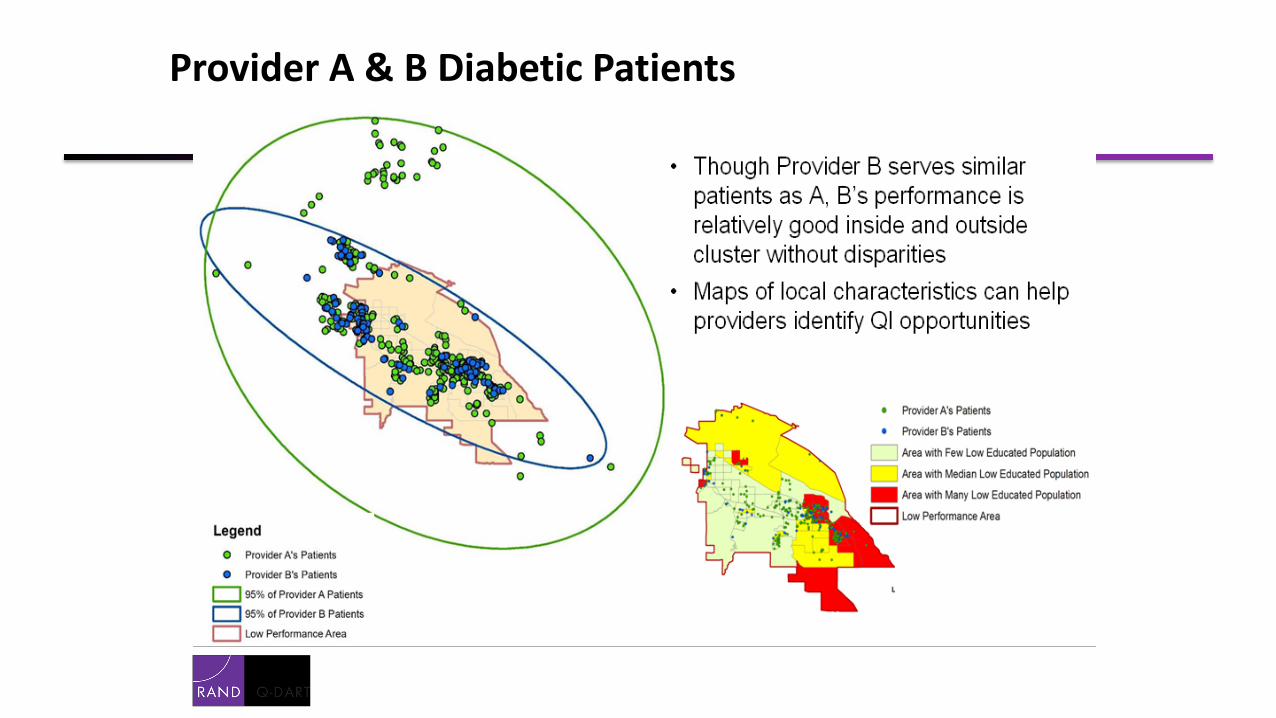
Provider A & B Diabetic Patients

How might cost-effectiveness vary depending on intervention approach and targeting?
• Target all with simple intervention (mailing)?
• Tailor interventions depending on subgroup (mailing + intensive)?
• Intensive intervention vulnerable subgroup only (intensive)?
White/OtherHispanic – affluentHispanic - poor

RAND Corporation Generating Indirect Estimates of Race/Ethnicity
• Disparities in quality and outcomes are well documented but not well understood
• Measurement of disparities is limited by difficulties collecting R/E in claims data
• Indirect estimation methods can provide robust estimates when R/E lacking
• BISG method is robust, well validated, indirect R/E method that makes efficient use of information available and produces unbiased R/E estimates
116
Why Estimate Race/Ethnicity?
IntroductionGenerating Indirect Estimates
Results

RAND Corporation Generating Indirect Estimates of Race/Ethnicity
• Inputs from APCD Files– Member last name– Member residential address (or geocode)– Optional: Self-reported R/E data if available
• Census Files needed– Census Surname List– Census Demographic file (to Block Group level)
• Algorithm– Member surname/Census list generate “prior probability” of R/E group– Member neighborhood Census provides R/E neighborhood composition– Bayesian methods combine both types of information for final estimate
117
Overview of the Algorithm
IntroductionGenerating Indirect Estimates
Results

RAND Corporation Generating Indirect Estimates of Race/Ethnicity
IntroductionGenerating Indirect Estimates
Description of BISG
What are the data sources?
Generating and Using Language Indirect EstimatesRAND Corporation Generating Indirect Estimates of Race/Ethnicity
• Original health plan or state agency data– Last name and Address from the APCD 4.0
– Optional: self-reported R/E data as available
• Census Surname List (surname_yes & surname_no)– Contains 151,671 surnames listed by 100 or more individuals– Each surname has set of probabilities for each R/E group– Account for about 89.9% of the population
• GeoDemographic (new_race_counts_cen10 & new_race_counts_tract_cen10 & new_race_totals_cen10 & national)– Block Group/Tract population counts for six R/E categories– County identifiers, the first five digits of the FIPS code
118

RAND Corporation Generating Indirect Estimates of Race/Ethnicity119
Estimated R/E (%) by Selected Insurance Types
N=9,718,647
IntroductionGenerating Indirect Estimates
Results
55%
72%80%
91%81%
53%
81%75% 78% 78%
89%
20%
12%7%
3%
6%
27%
8%10% 7% 7%
4%
12%
9% 6%2%
3%7%
4% 8% 8% 8%3%9%
5% 5% 3% 8% 10%6% 5% 5% 5% 4%
0%
10%
20%
30%
40%
50%
60%
70%
80%
90%
100%
Black
API
Hispanic
White

RAND Corporation Generating Indirect Estimates of Race/Ethnicity
84% 84%
57%62%
85%
5% 5%
24%21%
5%6% 6%
7% 7%
5%4% 5%
9% 8%4%
0%
10%
20%
30%
40%
50%
60%
70%
80%
90%
100%
Blue Cross Blue Shield ofMassachusetts*
Harvard Pilgrim HealthCare
MassHealth*/HealthSafety Net (Org 11541)
Neighborhood HealthPlan*
WellPoint, Inc. (now calledAnthem)
Black
API
Hispanic
White
120
Figure based on Massachusetts residents with medical coverage included in 2013 APCD Member Eligibility File
APCD 3.0: Estimated R/E (%) by Selected Plans
IntroductionGenerating Indirect Estimates
Results
N=6,893,521

RAND Corporation Generating Indirect Estimates of Race/Ethnicity
• An accurate “test” should be able to distinguish between those who do and don’t belong to a group of interest
• The ability of the algorithm to correctly classify individual members R/E or concordance can be summarized with a C- statistic.*
• A C-statistic of 0.9 is considered excellent
* A C-statistic is also a measure of the area under an ROC curve which is commonly used to help assess the performance of a diagnostic test.
121
Assessing Accuracy
ValidationUsing the Indirect Estimates
Next steps
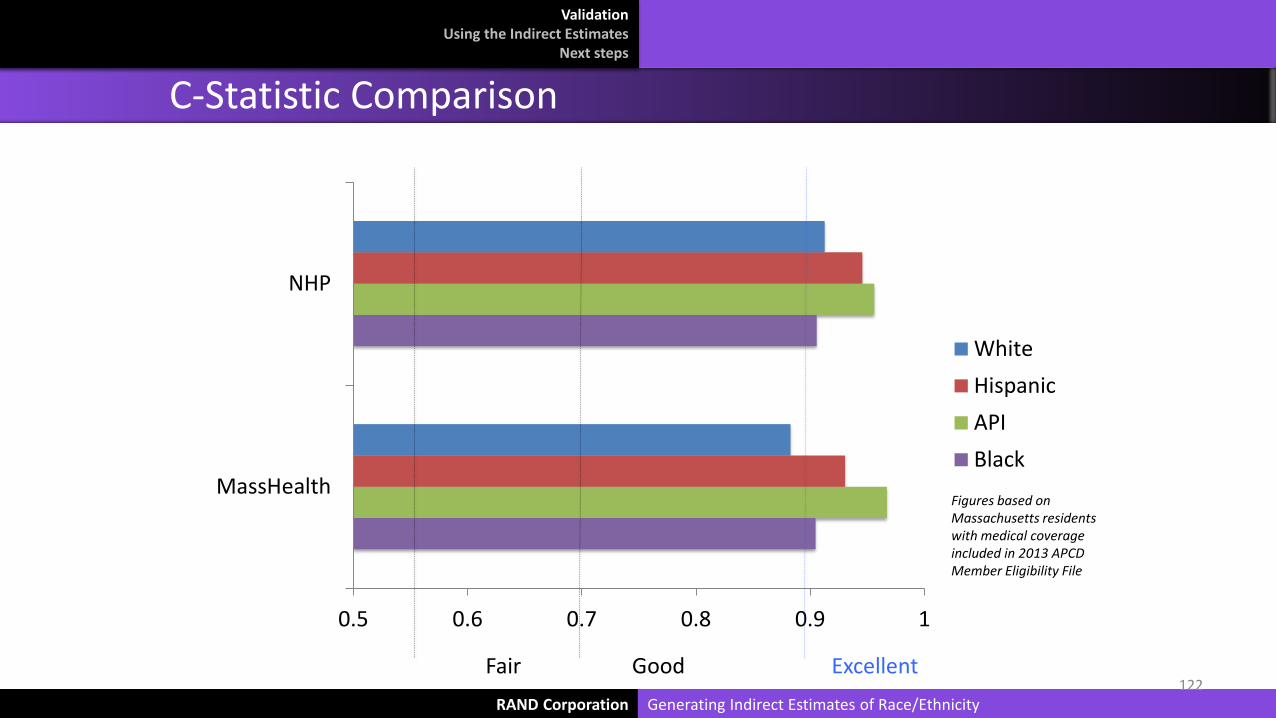
RAND Corporation Generating Indirect Estimates of Race/Ethnicity
0.5 0.6 0.7 0.8 0.9 1
MassHealth
NHP
WhiteHispanicAPIBlack
122ExcellentGoodFair
C-Statistic Comparison
ValidationUsing the Indirect Estimates
Next steps
Figures based on Massachusetts residents with medical coverage included in 2013 APCD Member Eligibility File

RAND Corporation Generating Indirect Estimates of Race/Ethnicity
• GIS mapping in MA• Compare or combine with case mix files• Estimate SES and other social determinants
– For example: income, education, or language based on Census derived neighborhood information
123
Additional Uses and Complementary Approaches
ValidationUsing the Indirect Estimates
Next steps
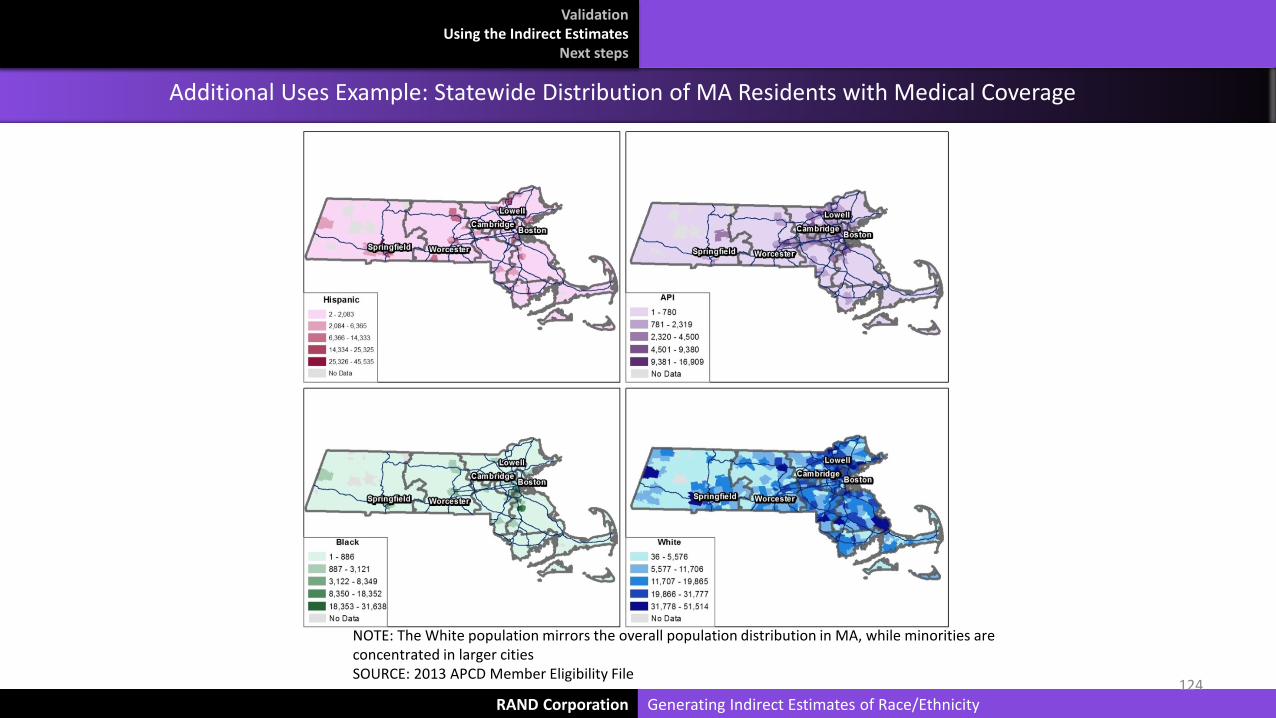
RAND Corporation Generating Indirect Estimates of Race/Ethnicity124
NOTE: The White population mirrors the overall population distribution in MA, while minorities are concentrated in larger cities SOURCE: 2013 APCD Member Eligibility File
Additional Uses Example: Statewide Distribution of MA Residents with Medical Coverage
ValidationUsing the Indirect Estimates
Next steps

Additional sources of IE literature• Stephen F. Derose, Richard Contreras, Karen J. Coleman, Corinna Koebnick, and Steven J. Jacobsen. “Race and
Ethnicity Data Quality and Imputation Using U.S. Census Data in an Integrated Health Sysetm: The Kaiser Permanente Southern California Experience. Medical Care Research and Review, 70(3): June 2013, 330-345.
• Dzifa Adjaye-Gbewonyo, Robert A. Bednarczyk, Robert L. Davis, and Saad B. Omer. “Using the Bayesian Improved Surname Geocoding Method (BISG) to Create a Working Classification of Race and Ethnicity in a Diverse Managed Care Population: A Validation Study.” Health Services Research, 49(1): February 2014, 268-283.
• High-Value Health Care Project. “Indirect Estimation of Race and Ethnicity: An interim strategy to measure population-level health care disparities.” Engleberg Center for Health Care Reform at Brookings, March 2010.
• Marc Elliot. “Measuring Racial/Ethnic Disparities via Indirect Estimation: An overview.” Presentation at American Public Health Association, 7 November 2010.
• Marc N. Elliott, Peter A. Morrison, Allen Fremont, Daniel F. McCaffrey, Philip Pantoja, and Nicole Lurie. “Using the Census Bureau’s surname list to improve estimates of race/ethnicity and associated disparities.” Health Services Outcomes Research Methodology, 9(2): June 2009, 69-83.
• Marc N. Elliott, Peter A. Morrison, Allen Fremont, Daniel F. McCaffrey, Philip Pantoja, and Nicole Lurie. “Erratum to: Using the Census Bureau’s surname list to improve estimates of race/ethnicity and associated disparities.” Health Services Outcomes Research Methodology, 9(4): December 2009, 252-253.
• Kevin Fiscella and Allen M. Fremont. “Use of Geocoding and Surname Analysis to Estimate Race and Ethnicity.” Health Research and Educational Trust, 41(4): August 2006, 1482-1500.
• Phillip Pantoja. “Generating Calibrated Indirect Estimates of Race/Ethnicity.” RAND Corporation, December 2009.
• Joel Weissman and Romana Hasnain-Wynia. “Advancing Health Care Equity Through Improved Data Collection.” New England Journal of Medicine, 364(24): 16 June 2011, 2276-2277.
Generating and Using Language Indirect EstimatesRAND Corporation Generating Indirect Estimates of Race/Ethnicity125
ValidationUsing the Indirect Estimates
Next steps