Embed Size (px)
Citation preview

Healthcare Investments and ExitsHealthcare Investments and Exits Accelerate in 1H 2021Biopharma | HealthTech | Dx/Tools | Device
Follow @SVB_Financial Engage #SVBHealthcare
3 Market Highlights
5 Healthcare Investments
21 Healthcare SPAC Activity
23 Healthcare Exits
33 Healthcare Outlook: 2021 and Beyond
Table of Contents
2HEALTHCARE INVESTMENTS AND EXITS | MID-YEAR REPORT 2021
66%
Funding and Investment Continue Torrid PaceVenture capital fundraising boomed in 1H 2021 fueled by venture healthcare’s rapid response to the pandemic. Year-to-date, VC healthcare fundraising exceeded 2020’s full-year record ($16.8B) by 30%. Many venture firms raised opportunity funds to double down on previous investments, and we saw private equity (PE) and hedge funds create private capital funds to invest in later-stage venture rounds.
Buoyed by great IPO performance and big M&As in 2020, investment into companies spiked to $47B in 1H 2021, more than double 2020’s first-half pace and close to 2020’s full-year record.
Series A biopharma investment dollars almost doubled 1H 2020, while the number of deals grew by a third. Overall, the sector saw increased mezzanine (mezz) crossover activity in biopharma with 83 likely to IPO†(LIPO) financings in 1H 2021, indicating that investors believe the IPO window will remain open.
In healthtech, we saw a surge of invested capital in 1H 2021, partially driven by hedge funds and growth PE firms coming down market. This was highlighted by large round sizes and lofty valuations, including 28 private financings with $1B+ valuations. The increased adoption of virtual/hybrid care models, resulting from COVID-19 lockdowns and reduced access to in-person care, has supercharged the alternative care space and accounted for a large percentage of the healthtech dollar increase.
With support from a strong IPO market and multiple $1B+ private M&A in 2020, dx/tools investment in 1H 2021 is on pace for another record. R&D tools dominated the number of deals and total dollars. COVID-19 dx tests investment continued.
Reversing a three-year downward trend, Series A device activity was up significantly with dollars and deals far ahead of 2020’s mid-year numbers. Overall, invested dollars in the sector were close to year-end 2020 numbers, led by non-invasive monitoring, neurology and imaging.
Healthcare Investments: Mid-Year 2021
†The LIPO (Likely to IPO) List tracks Top 15 Crossover funded mezzanine deals ($40M+) as a proxy for IPO sentiment and pipeline.*SVB Market Stats composed of US-based VC-backed healthcare companies that raised at least $4M in financing in 2020.**Mega rounds defined as round size of $50M or more. 2021 statistics represent SVB commercial bank clients and are compiled through 6/30/21. Source: PitchBook and SVB proprietary data.
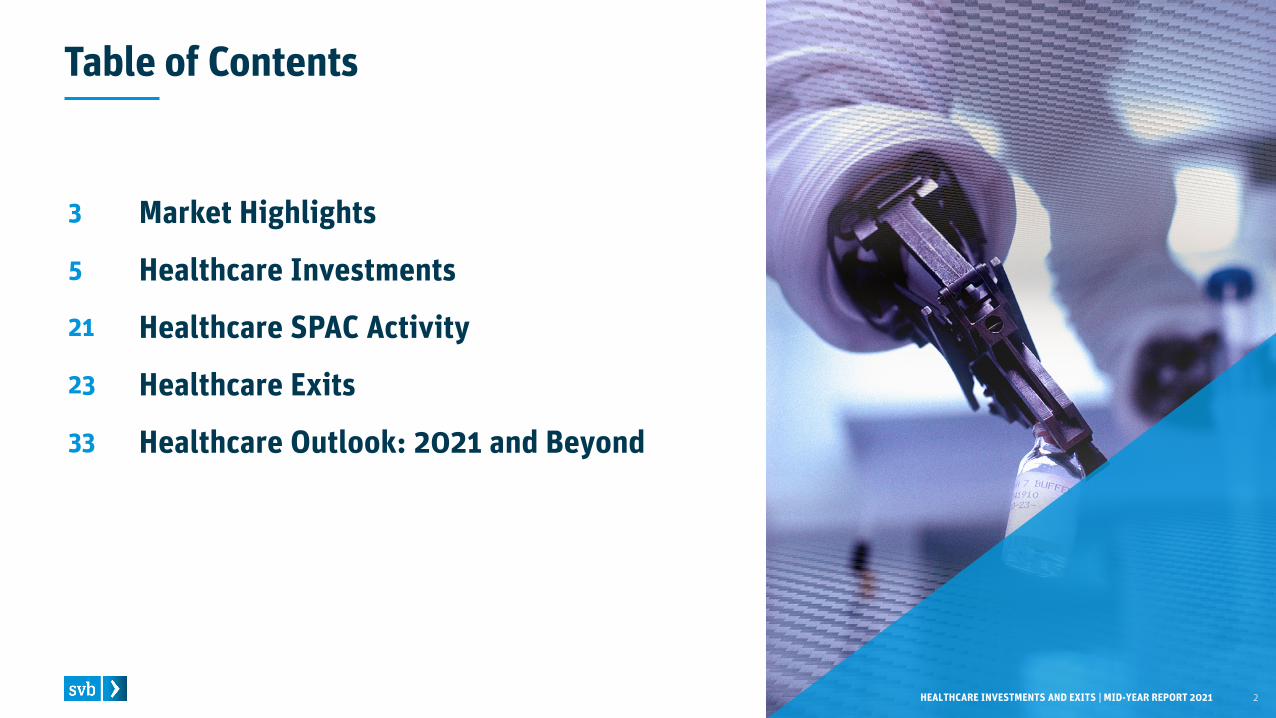
SVB US Market Stats*
of all VC-backed US healthcare companies that raised rounds since 2020 have a banking relationship with SVB.
52%
of all VC-backed US healthcare companies that raised mega-rounds** in 2021 have a banking relationship with SVB.
3HEALTHCARE INVESTMENTS AND EXITS | MID-YEAR REPORT 2021
The number of venture healthcare IPOs in 1H 2021 (81) was close to 2020’s full-year pace (111). Post-IPO performance for the class of 2021 has been mixed, however, with good performance for dx/tools and device but lower for biopharma and healthtech. M&A activity was up for all sectors except biopharma. There were 12 completed de-SPACs** involving venture-backed healthcare companies since 2020 (10 in 1H 2021). These de-SPACs showed significant step-ups from the last venture round (average 1.9x) but have traded down in the public market.
In biopharma, the IPO market was the driving force for exits. 1H 2021 IPOs (50) are on pace to break 2020’s full-year record (84), although post-IPO performance has been muted. There were 12 $1B+ market caps at IPO, helping to propel exit values far ahead of 1H 2020’s pace. Private M&A continues to focus on early-stage companies (four of seven pre-clinical), with quick times to exit and strong exit multiples.
An uptick in healthtech IPOs and SPAC** mergers has solidified a true exit pathway for investors to realize gains. It also serves as an indicator that the sector is gaining broader visibility and acceptance by institutional public equity investors. Private M&A in 1H 2021 was headlined by the $2.1B acquisition of Iora Health.
Dx/Tools continued to showcase a strong exit environment, with IPOs and M&As already ahead of full-year record numbers. IPOs since 2019 continue to show excellent Post-IPO performance. In M&A, we noted recent biopharma IPOs acquiring private R&D tools companies.
Device M&A and IPOs in 1H 2021 approached full-year 2020 numbers. While median pre-money valuations and dollars raised were lower, post-IPO performance remained strong. Since 2019, device has the best post-IPO performance in venture healthcare. In M&A, we have seen small and mid-cap public companies emerge as new acquirers. Private acquisitions were led by two large non-invasive monitoring deals.
VC-Backed Companies Leverage Open IPO Window
Healthcare Exits: Mid-Year 2021
*IPO statistics represent SVB US IPO commercial bank clients. IPO defined as all private, global, venture-backed IPOs raising at least $25M in proceeds. **Special Purpose Acquisition Company (SPAC) merger defined as when SPAC has announced an agreement to merge with aventure-backed healthcare company. Source: PitchBook, Capital IQ and SVB proprietary data.
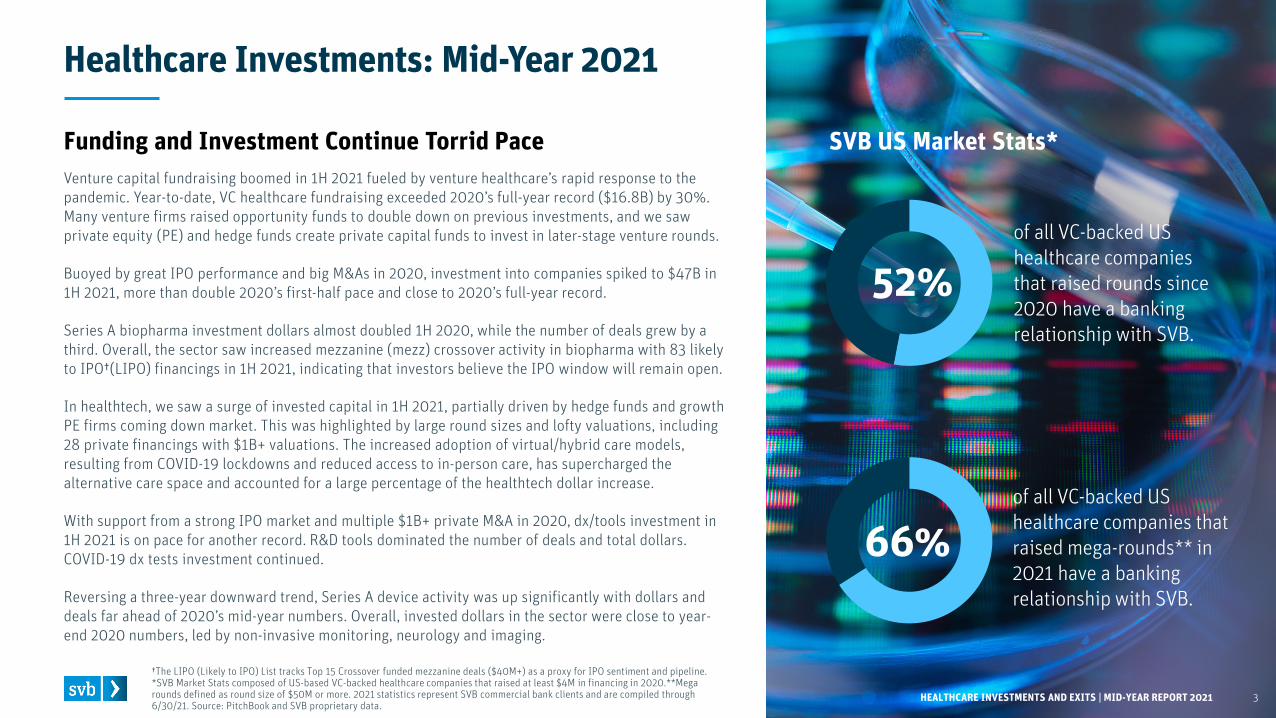
SVB US IPO Market Stats*
HEALTHCARE INVESTMENTS AND EXITS | MID-YEAR REPORT 2021
of all VC-backed healthcare IPOs in the past three years have a banking relationship with SVB*.
64%
4

Healthcare Investments US and Europe
HEALTHCARE INVESTMENTS AND EXITS | MID-YEAR REPORT 2021 5
HEALTHCARE INVESTMENTS AND EXITS | MID-YEAR REPORT 2021 6
Healthcare VC Fundraising Hits New Record at Mid-Year
*SPAC stands for special purpose acquisition company. **Notable funds based on largest estimated allocation to venture healthcare. US Healthcare Venture Capital Fundraising defined as an approximation of healthcare investment dollars to be invested by firms that historically invest in +50% US companies. Source: PitchBookand SVB proprietary data.
Notable Funds** Closed in 1H 2021 with Allocations to Healthcare
$3.7B $3.6B $3.9B
$6.1B$7.5B $7.2B
$9.1B $9.6B$10.7B
$16.8B
$21.8B
2011 2012 2013 2014 2015 2016 2017 2018 2019 2020 1H 2021
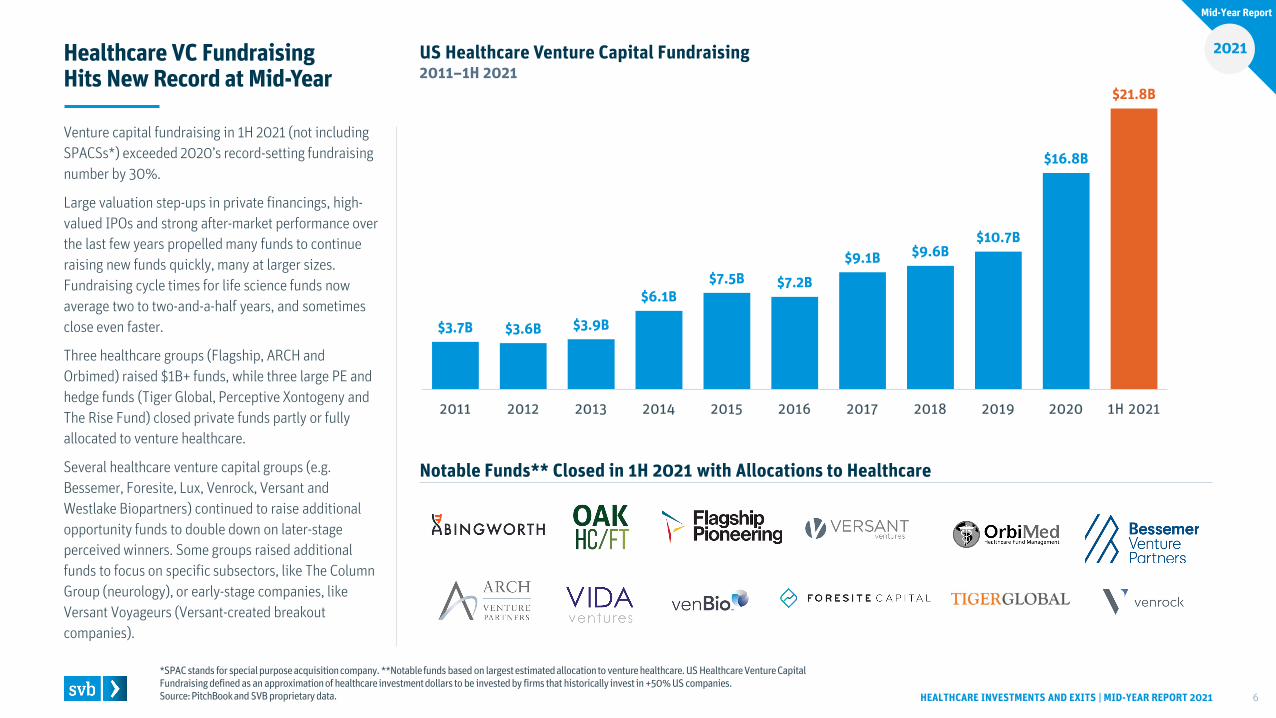
Venture capital fundraising in 1H 2021 (not including SPACSs*) exceeded 2020’s record-setting fundraising number by 30%.
Large valuation step-ups in private financings, high-valued IPOs and strong after-market performance over the last few years propelled many funds to continue raising new funds quickly, many at larger sizes. Fundraising cycle times for life science funds now average two to two-and-a-half years, and sometimes close even faster.
Three healthcare groups (Flagship, ARCH and Orbimed) raised $1B+ funds, while three large PE and hedge funds (Tiger Global, Perceptive Xontogeny and The Rise Fund) closed private funds partly or fully allocated to venture healthcare.
Several healthcare venture capital groups (e.g. Bessemer, Foresite, Lux, Venrock, Versant and Westlake Biopartners) continued to raise additional opportunity funds to double down on later-stage perceived winners. Some groups raised additional funds to focus on specific subsectors, like The Column Group (neurology), or early-stage companies, like Versant Voyageurs (Versant-created breakout companies).
Mid-Year Report
2021US Healthcare Venture Capital Fundraising2011–1H 2021
VC Dollars and Deals by Healthcare SectorsUS and Europe
HEALTHCARE INVESTMENTS AND EXITS | MID-YEAR REPORT 2021 7
Stratospheric 1H Investments Led by HealthTech, Biopharma
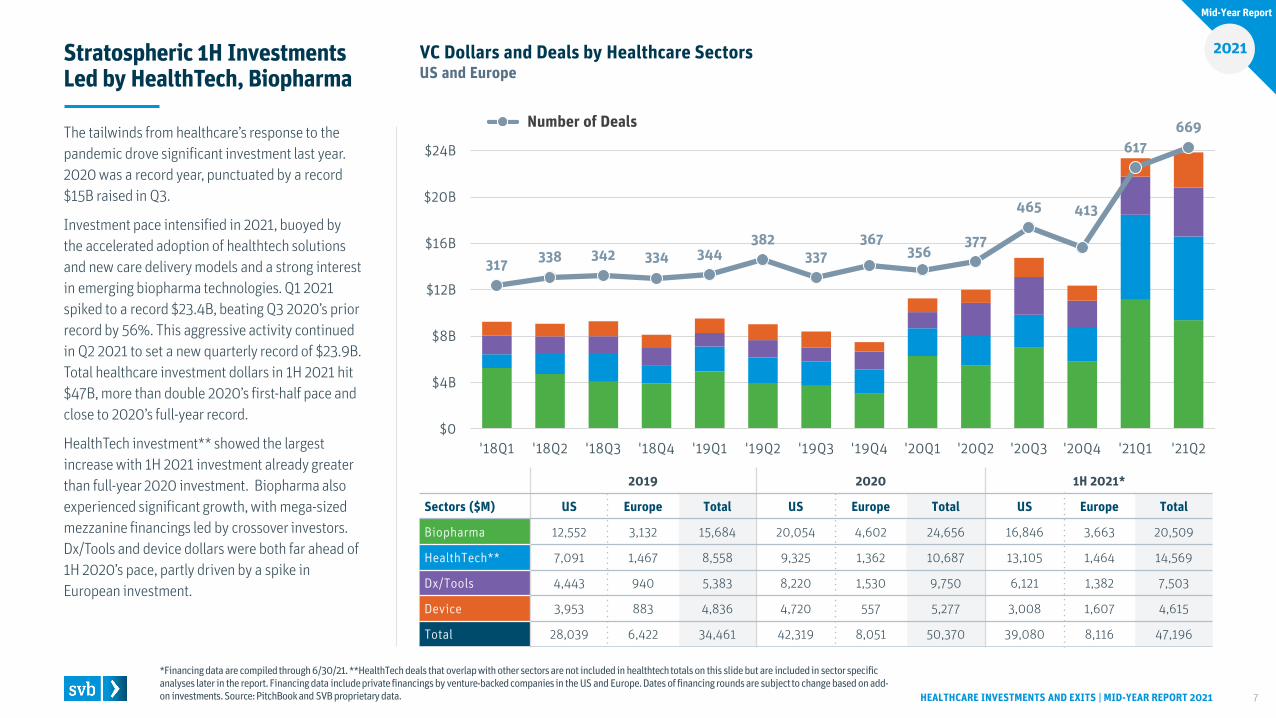
The tailwinds from healthcare’s response to the pandemic drove significant investment last year. 2020 was a record year, punctuated by a record $15B raised in Q3.
Investment pace intensified in 2021, buoyed by the accelerated adoption of healthtech solutions and new care delivery models and a strong interest in emerging biopharma technologies. Q1 2021 spiked to a record $23.4B, beating Q3 2020’s prior record by 56%. This aggressive activity continued in Q2 2021 to set a new quarterly record of $23.9B. Total healthcare investment dollars in 1H 2021 hit $47B, more than double 2020’s first-half pace and close to 2020’s full-year record.
HealthTech investment** showed the largest increase with 1H 2021 investment already greater than full-year 2020 investment. Biopharma also experienced significant growth, with mega-sized mezzanine financings led by crossover investors. Dx/Tools and device dollars were both far ahead of 1H 2020’s pace, partly driven by a spike in European investment.
*Financing data are compiled through 6/30/21. **HealthTechdeals that overlap with other sectors are not included in healthtechtotals on this slide but are included in sector specific analyses later in the report. Financing data include private financings by venture-backed companies in the US and Europe. Dates of financing rounds are subject to change based on add-on investments. Source: PitchBookand SVB proprietary data.
2019 2020 1H 2021*
Sectors ($M) US Europe Total US Europe Total US Europe Total
Biopharma 12,552 3,132 15,684 20,054 4,602 24,656 16,846 3,663 20,509
HealthTech** 7,091 1,467 8,558 9,325 1,362 10,687 13,105 1,464 14,569
Dx/Tools 4,443 940 5,383 8,220 1,530 9,750 6,121 1,382 7,503
Device 3,953 883 4,836 4,720 557 5,277 3,008 1,607 4,615
Total 28,039 6,422 34,461 42,319 8,051 50,370 39,080 8,116 47,196
Number of Deals
Mid-Year Report
2021
317 338 342 334 344382
337367
356377
465 413
617669
$0
$4B
$8B
$12B
$16B
$20B
$24B
'18Q1 '18Q2 '18Q3 '18Q4 '19Q1 '19Q2 '19Q3 '19Q4 '20Q1 '20Q2 '20Q3 '20Q4 '21Q1 '21Q2

8
9
12
26
39
46
7
8
15
20
29
37
6
8
12
28
46
44
4
13
6
26
35
34
2018 2019 2020 1H 2021
Series A Biopharma DealsUS and Europe
HEALTHCARE INVESTMENTS AND EXITS | MID-YEAR REPORT 2021 8
Strong 1H Series A Activity Led by Large Platform Deals
*This company overlaps with the healthtechsector and is included in both sets of sector specific analyses. Financing data are compiled through 6/30/21. Series A includesfirst-time investments from institutional or corporate venture investment in the US and Europe and any first-round investments equal to or greater than $2M, regardless of investor. Dates of financing rounds are subject to change based on add-on investments. Source: PitchBookand SVB proprietary data.
Biopharma
2018 2019 2020 1H 2021
US / Europe 131 / 43 116 / 43 127 / 57 107 / 45
Total 174 159 184 152Number of Investments
Total Funding ($M)
Corporate Investments
US / Europe $4,392 / $768 $3,062 / $637 $4,001 / $1,275 $3,944 / $753
Total $5,160 $3,699 $5,276 $4,697
US / Europe 26% / 26% 32% / 33% 35% / 17% 33% / 22%
Series A Deals and (Dollars) by Top Indications Largest 1H 2021 Series A Deals
($1.4B, $959M, $1.3B, $1.1B)
($1.3B, $895M, $1.4B, $2.2B)
($549M, $151M, $879M, $335M)
($137M, $100M, $139M, $352M)
($540M, $188M, $241M, $209M)
Oncology
Platform
Neurology
Orphan/Rare
Auto-Immune
Anti-Infective
Company went public
($551M, $831M, $350M, $100M)
Series A activity more than doubled 1H 2020 dollars, and nearly matched 2020’s full-year investment.
Platform Series A dollars in 1H 2021 shot past its full-year 2020 investment and doubled 1H 2021 oncology investment. This increase was led by huge platform technology deals from Treeline Biosciences ($735M), Centessa Pharmaceuticals ($250M), AmplifyBio($200M), and Eikon Therapeutics ($148M).
Orphan/rare Series A deals and dollars extended its notable decline from 2019 as investors appear to be backing away from new investments. After a spike in investment in 2020, neurology dollars were also down in 1H 2021.
Anti-infective Series A activity was significantly up in both deals and dollars versus the past three years. Of the top five financings, four focused on COVID-19 assets and three deals were headquartered in Europe.
Pre-money valuations in Series A biopharma have continued to climb. For smaller deals (<$15M), the median pre-money valuation grew 63% ($13M in 1H 2021 versus $8M in 1H 2020 ). For larger deals ($15M+), there was an even larger increase of 65% ($41M in 1H 2021 versus $25M in 1H 2020).
*
$18.0B$15.7B
$24.7B
$20.5B
2018 2019 2020 1H 2021
Total Dollars and (Deals) US and Europe
32
35
55
100
116
23
44
49
78
124
38
38
73
106
162
27
15
53
91
125
2018 2019 2020 1H 2021
Platform $2,500M post
Neurology $2,000M post
Anti-Infective $1,735M post
Platform $1,575M post
Platform $1,200M post
Anti-Infective $1,086M post
Platform $1,085M post
Oncology $800M post
Platform $780M post
Oncology $700M post
Biopharma Deals and (Dollars) by Top IndicationsUS and Europe
HEALTHCARE INVESTMENTS AND EXITS | MID-YEAR REPORT 2021 9
Oncology, Platform Dollars Up as Crossovers Remain Active
**The LIPO (Likely to IPO) List tracks Top 15 Crossover funded private mezzanine deals ($40M+) as a proxy for IPO sentiment and pipeline. †Only includes private post-money values from publicly disclosed 2021 financings in PitchBook. *This company overlaps with the healthtechsector and is included in both sets of sector specific analyses. Financing data are compiled through 6/30/21. Financing data include private financings by venture-backed companies in the US and Europe. Dates of financing rounds are subject to change based on add-on investments. Source: PitchBookand SVB proprietary data.
LIPO** Round + IPO in 1H 2021
($5.4B, $6.0B,$7.7B, $6.9B)
($5.2B, $3.2B, $6.6B, $6.9B)
($1.5B, $968M, $2.4B, $1.7B)
($1.7B, $2.0B, $2.3B, $521M)
($727M, $856M, $1.2B, $1.4B)
Oncology
Platform
Neurology
Orphan/Rare
Anti-Infective
(458)(435)
(559)
Biopharma
1H 2021 Highest Valued Private Companies†
Company has since gone public
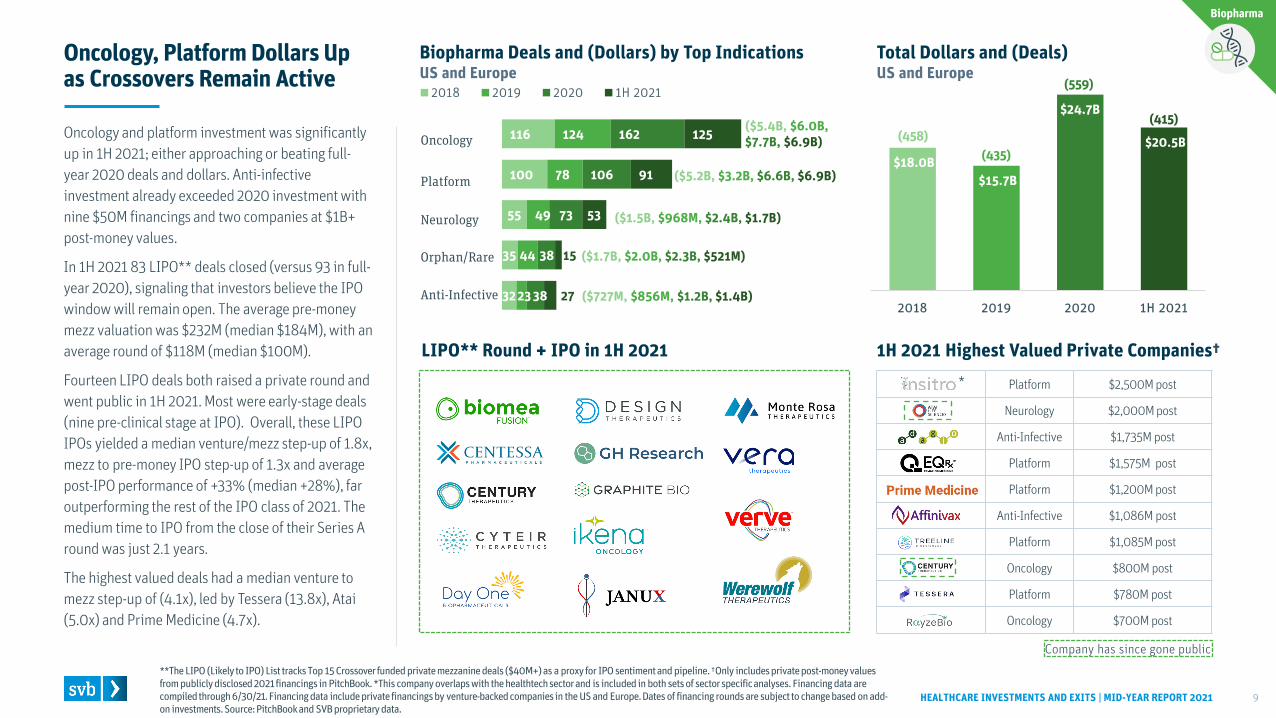
(415)Oncology and platform investment was significantly up in 1H 2021; either approaching or beating full-year 2020 deals and dollars. Anti-infective investment already exceeded 2020 investment with nine $50M financings and two companies at $1B+ post-money values.
In 1H 2021 83 LIPO** deals closed (versus 93 in full-year 2020), signaling that investors believe the IPO window will remain open. The average pre-money mezz valuation was $232M (median $184M), with an average round of $118M (median $100M).
Fourteen LIPO deals both raised a private round and went public in 1H 2021. Most were early-stage deals (nine pre-clinical stage at IPO). Overall, these LIPO IPOs yielded a median venture/mezz step-up of 1.8x, mezz to pre-money IPO step-up of 1.3x and average post-IPO performance of +33% (median +28%), far outperforming the rest of the IPO class of 2021. The medium time to IPO from the close of their Series A round was just 2.1 years.
The highest valued deals had a median venture to mezz step-up of (4.1x), led by Tessera (13.8x), Atai(5.0x) and Prime Medicine (4.7x).
*
$942M
$166M $115M$42M $37M $25M $15M $8M $6M
13
5
14
34
28
2
7
7
Single Indication Multiple Indications Stealth
Oncology Musculo-skeletal Neurology Cardio-
vascularAuto-
Immune Renal Metabolic Urology/Gynecology
Anti-Infective
Series A Platform: Top Approaches**US and Europe, 2019 – 1H 2021
HEALTHCARE INVESTMENTS AND EXITS | MID-YEAR REPORT 2021 10
Series A Platform: Scientific Approaches, Indication Focus
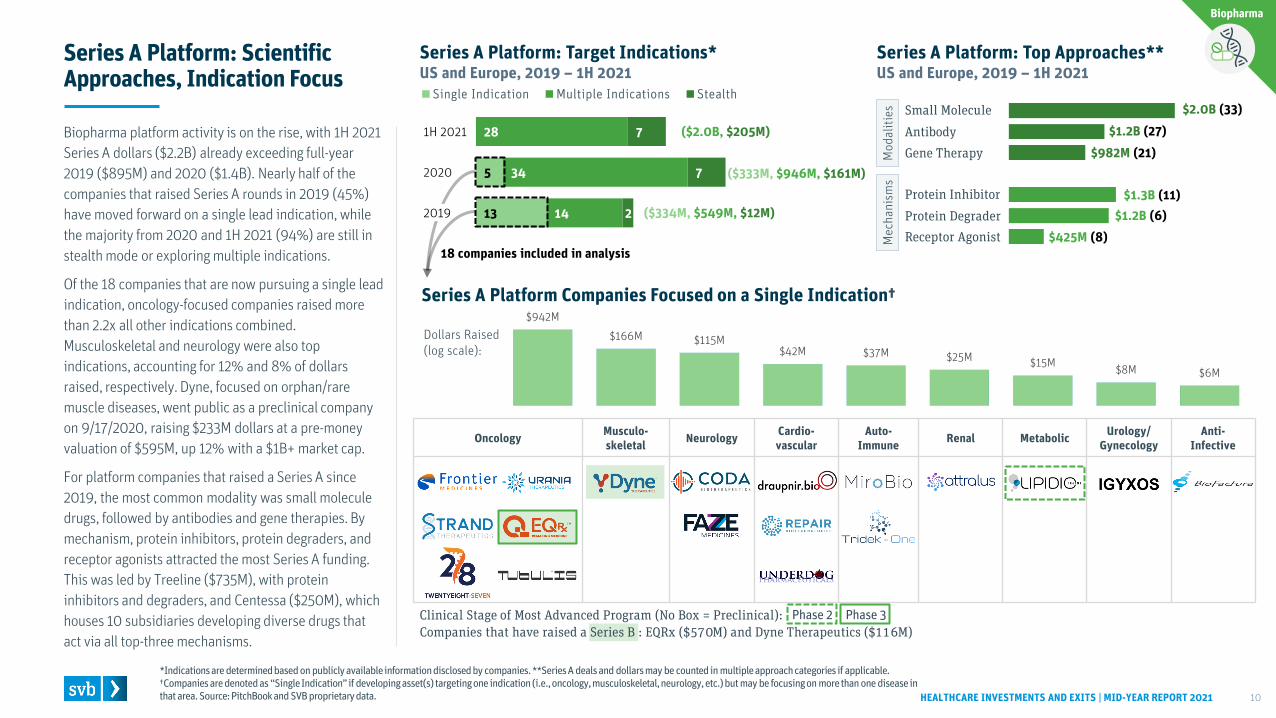
Biopharma platform activity is on the rise, with 1H 2021 Series A dollars ($2.2B) already exceeding full-year 2019 ($895M) and 2020 ($1.4B). Nearly half of the companies that raised Series A rounds in 2019 (45%) have moved forward on a single lead indication, while the majority from 2020 and 1H 2021 (94%) are still in stealth mode or exploring multiple indications.
Of the 18 companies that are now pursuing a single lead indication, oncology-focused companies raised more than 2.2x all other indications combined. Musculoskeletal and neurology were also top indications, accounting for 12% and 8% of dollars raised, respectively. Dyne, focused on orphan/rare muscle diseases, went public as a preclinical company on 9/17/2020, raising $233M dollars at a pre-money valuation of $595M, up 12% with a $1B+ market cap.
For platform companies that raised a Series A since 2019, the most common modality was small molecule drugs, followed by antibodies and gene therapies. By mechanism, protein inhibitors, protein degraders, and receptor agonists attracted the most Series A funding. This was led by Treeline ($735M), with protein inhibitors and degraders, and Centessa ($250M), which houses 10 subsidiaries developing diverse drugs that act via all top-three mechanisms.
*Indications are determined based on publicly available information disclosed by companies. **Series A deals and dollars may be counted in multiple approach categories if applicable. †Companies are denoted as “Single Indication” if developing asset(s) targeting one indication (i.e., oncology, musculoskeletal, neurology, etc.) but may be focusing on more than one disease in that area. Source: PitchBookand SVB proprietary data.
Series A Platform Companies Focused on a Single Indication†
Biopharma
Series A Platform: Target Indications*US and Europe, 2019 – 1H 2021
($2.0B, $205M)
($333M, $946M, $161M)
($334M, $549M, $12M)
Antibody
Small Molecule
Gene Therapy
Protein Inhibitor
Protein DegraderReceptor Agonist
$2.0B (33)$1.2B (27)
$1.3B (11)
$982M (21)
$1.2B (6)$425M (8)
18 companies included in analysis
Dollars Raised (log scale):
Mec
hani
sms
Mod
aliti
es
Phase 3Phase 2Clinical Stage of Most Advanced Program (No Box = Preclinical):Companies that have raised a Series B : EQRx ($570M) and Dyne Therapeutics ($116M)
1H 2021
2020
2019
Venture Capital Investor Corporate Investor Later-Stage/Crossover Investor
26 27 57
25 14 43
18 12 42
15 11 37
12 9 35
11 8 31
10 7 25
9 6
24
23
Number of Deals Across All Rounds(US and Europe, 2020–1H 2021)
HEALTHCARE INVESTMENTS AND EXITS | MID-YEAR REPORT 2021 11
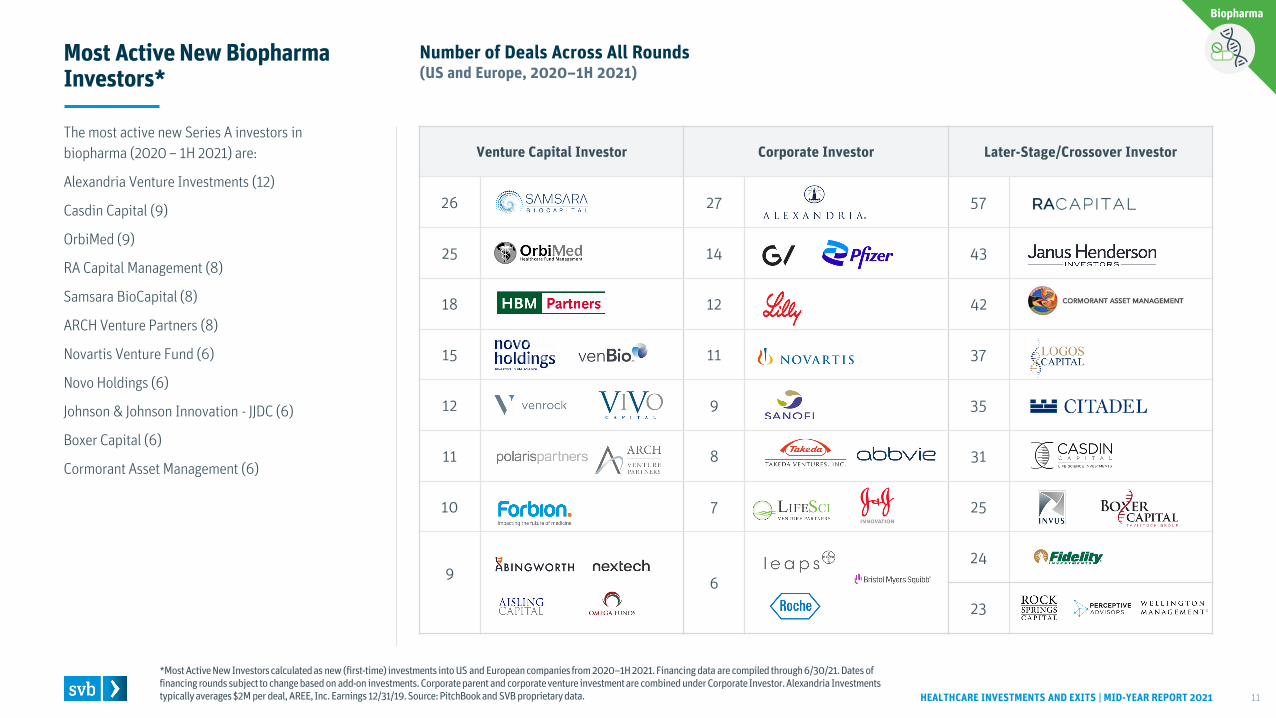
Most Active New Biopharma Investors*
The most active new Series A investors in biopharma (2020 – 1H 2021) are:
Alexandria Venture Investments (12)
Casdin Capital (9)
OrbiMed (9)
RA Capital Management (8)
Samsara BioCapital (8)
ARCH Venture Partners (8)
Novartis Venture Fund (6)
Novo Holdings (6)
Johnson & Johnson Innovation - JJDC (6)
Boxer Capital (6)
Cormorant Asset Management (6)
*Most Active New Investors calculated as new (first-time) investments into US and European companies from 2020–1H 2021. Financing data are compiled through 6/30/21. Dates of financing rounds subject to change based on add-on investments. Corporate parent and corporate venture investment are combined under Corporate Investor. Alexandria Investments typically averages $2M per deal, AREE, Inc. Earnings 12/31/19. Source: PitchBookand SVB proprietary data.
Biopharma
9
17
18
50
62
5
24
24
64
69
5
14
30
58
61
14
26
17
63
83
2018 2019 2020 1H 2021
Series A HealthTech DealsUS and Europe
HEALTHCARE INVESTMENTS AND EXITS | MID-YEAR REPORT 2021 12
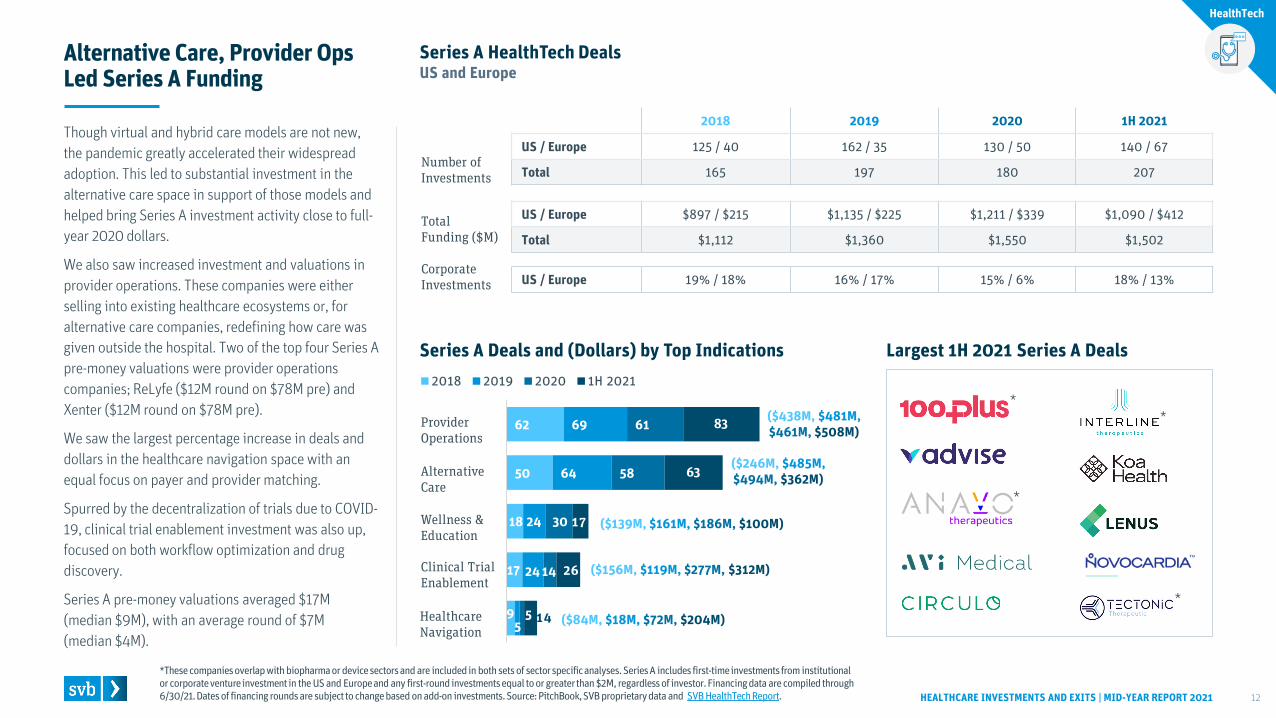
Alternative Care, Provider Ops Led Series A Funding
Though virtual and hybrid care models are not new, the pandemic greatly accelerated their widespread adoption. This led to substantial investment in the alternative care space in support of those models and helped bring Series A investment activity close to full-year 2020 dollars.
We also saw increased investment and valuations in provider operations. These companies were either selling into existing healthcare ecosystems or, for alternative care companies, redefining how care was given outside the hospital. Two of the top four Series A pre-money valuations were provider operations companies; ReLyfe ($12M round on $78M pre) and Xenter ($12M round on $78M pre).
We saw the largest percentage increase in deals and dollars in the healthcare navigation space with an equal focus on payer and provider matching.
Spurred by the decentralization of trials due to COVID-19, clinical trial enablement investment was also up, focused on both workflow optimization and drug discovery.
Series A pre-money valuations averaged $17M (median $9M), with an average round of $7M (median $4M).
*These companies overlap with biopharma or device sectors and are included in both sets of sector specific analyses. Series A includes first-time investments from institutional or corporate venture investment in the US and Europe and any first-round investments equal to or greater than $2M, regardless of investor. Financing data are compiled through 6/30/21. Dates of financing rounds are subject to change based on add-on investments. Source: PitchBook, SVB proprietary data and SVB HealthTechReport.
2018 2019 2020 1H 2021
US / Europe 125 / 40 162 / 35 130 / 50 140 / 67
Total 165 197 180 207Number of Investments
Total Funding ($M)
Corporate Investments
US / Europe $897 / $215 $1,135 / $225 $1,211 / $339 $1,090 / $412
Total $1,112 $1,360 $1,550 $1,502
US / Europe 19% / 18% 16% / 17% 15% / 6% 18% / 13%
Series A Deals and (Dollars) by Top Indications
HealthTech
Provider Operations
Alternative Care
Wellness & Education
Clinical Trial Enablement
Healthcare Navigation
Largest 1H 2021 Series A Deals
($246M, $485M,$494M, $362M)
($438M, $481M,$461M, $508M)
($139M, $161M, $186M, $100M)
($156M, $119M, $277M, $312M)
($84M, $18M, $72M, $204M)
*
*
*
*
26
45
48
133
180
29
54
65
169
217
26
58
77
190
198
37
73
43
175
199
Healthcare Navigation
Clinical Trial Enablement
Wellness & Education
Alternative Care
Provider Operations
2018 2019 2020 1H 2021
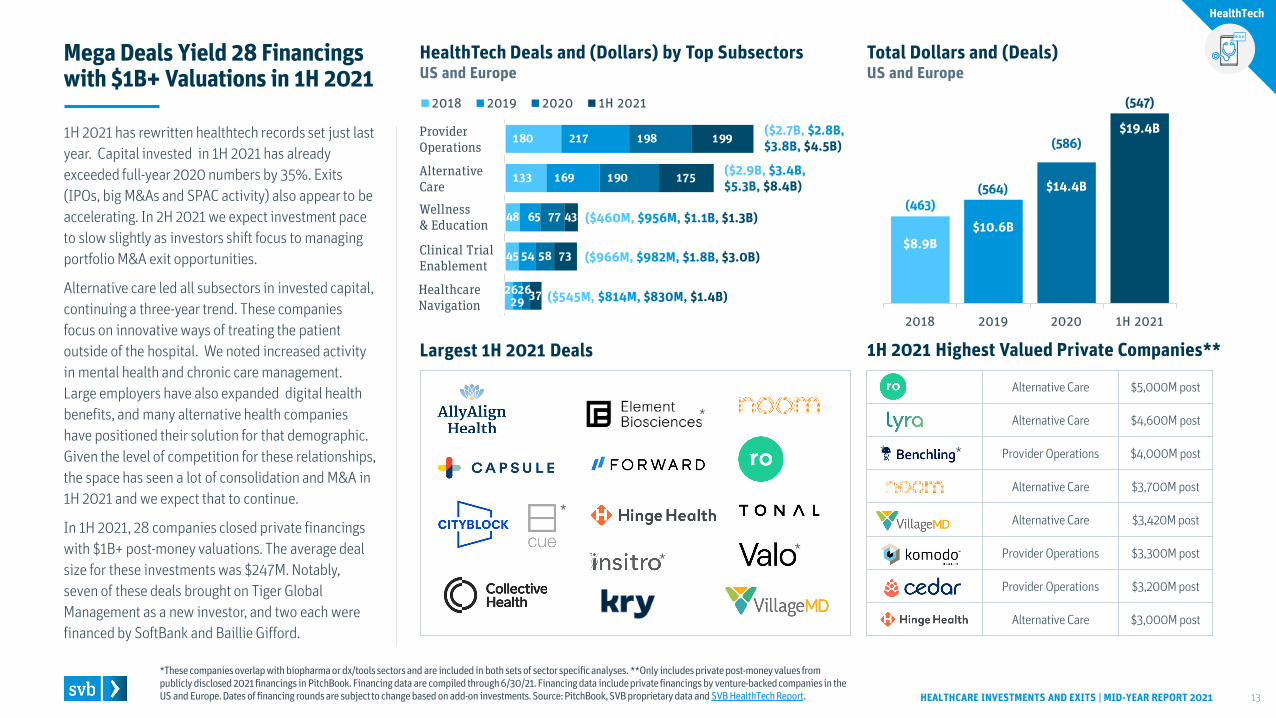
1H 2021 has rewritten healthtech records set just last year. Capital invested in 1H 2021 has already exceeded full-year 2020 numbers by 35%. Exits (IPOs, big M&As and SPAC activity) also appear to be accelerating. In 2H 2021 we expect investment pace to slow slightly as investors shift focus to managing portfolio M&A exit opportunities.
Alternative care led all subsectors in invested capital, continuing a three-year trend. These companies focus on innovative ways of treating the patient outside of the hospital. We noted increased activity in mental health and chronic care management. Large employers have also expanded digital health benefits, and many alternative health companies have positioned their solution for that demographic. Given the level of competition for these relationships, the space has seen a lot of consolidation and M&A in 1H 2021 and we expect that to continue.
In 1H 2021, 28 companies closed private financings with $1B+ post-money valuations. The average deal size for these investments was $247M. Notably, seven of these deals brought on Tiger Global Management as a new investor, and two each were financed by SoftBank and Baillie Gifford.
$8.9B$10.6B
$14.4B
$19.4B
2018 2019 2020 1H 2021
HealthTech Deals and (Dollars) by Top SubsectorsUS and Europe
HEALTHCARE INVESTMENTS AND EXITS | MID-YEAR REPORT 2021 13
Mega Deals Yield 28 Financings with $1B+ Valuations in 1H 2021
*These companies overlap with biopharma or dx/tools sectors and are included in both sets of sector specific analyses. **Only includes private post-money values from publicly disclosed 2021 financings in PitchBook. Financing data are compiled through 6/30/21. Financing data include private financings by venture-backed companies in the US and Europe. Dates of financing rounds are subject to change based on add-on investments. Source: PitchBook, SVB proprietary data and SVB HealthTechReport.
Provider Operations
Alternative Care
Wellness & Education
Clinical Trial Enablement
Healthcare Navigation
(463)(564)
(586)
HealthTech
Total Dollars and (Deals) US and Europe
Alternative Care $5,000M post
Alternative Care $4,600M post
Provider Operations $4,000M post
Alternative Care $3,700M post
Alternative Care $3,420M post
Provider Operations $3,300M post
Provider Operations $3,200M post
Alternative Care $3,000M post
Largest 1H 2021 Deals 1H 2021 Highest Valued Private Companies**
($2.7B, $2.8B,$3.8B, $4.5B)
($2.9B, $3.4B,$5.3B, $8.4B)
($460M, $956M, $1.1B, $1.3B)
($966M, $982M, $1.8B, $3.0B)
($545M, $814M, $830M, $1.4B)
(547)
**
*
* *
*
Venture Capital Investor Corporate Investor Later-Stage/Crossover Investor
24 12 22
11 11 12
10 8 8
9 6 7
8 5
6
5
7 4
Number of Deals Across All Rounds(US and Europe, 2020–1H 2021)
HEALTHCARE INVESTMENTS AND EXITS | MID-YEAR REPORT 2021 14
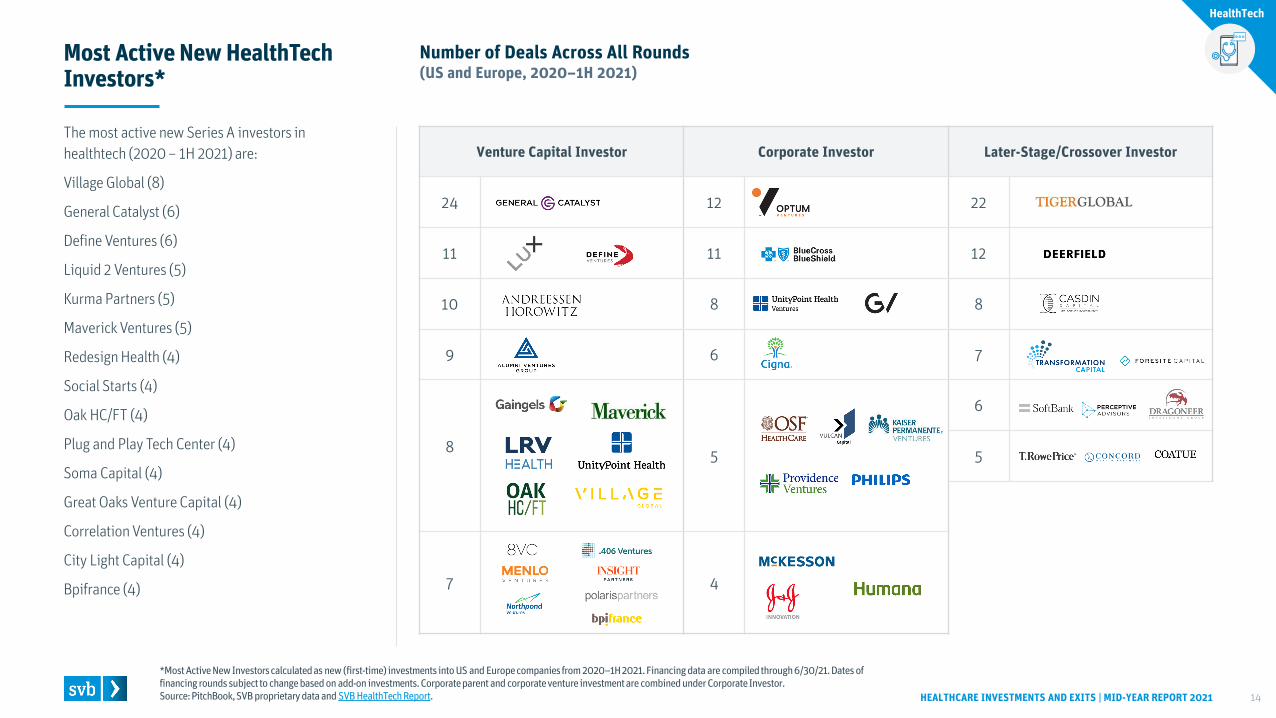
Most Active New HealthTechInvestors*
The most active new Series A investors in healthtech (2020 – 1H 2021) are:
Village Global (8)
General Catalyst (6)
Define Ventures (6)
Liquid 2 Ventures (5)
Kurma Partners (5)
Maverick Ventures (5)
Redesign Health (4)
Social Starts (4)
Oak HC/FT (4)
Plug and Play Tech Center (4)
Soma Capital (4)
Great Oaks Venture Capital (4)
Correlation Ventures (4)
City Light Capital (4)
Bpifrance (4)
*Most Active New Investors calculated as new (first-time) investments into US and Europe companies from 2020–1H 2021. Financing data are compiled through 6/30/21. Dates of financing rounds subject to change based on add-on investments. Corporate parent and corporate venture investment are combined under Corporate Investor. Source: PitchBook, SVB proprietary data and SVB HealthTechReport.
HealthTech
($191M, $197M,$269M, $162M)
28
22
28
23
25
40
23
24
35
20
24
28
2018 2019 2020 1H 2021
Series A Dx/Tools DealsUS and Europe
HEALTHCARE INVESTMENTS AND EXITS | MID-YEAR REPORT 2021 15
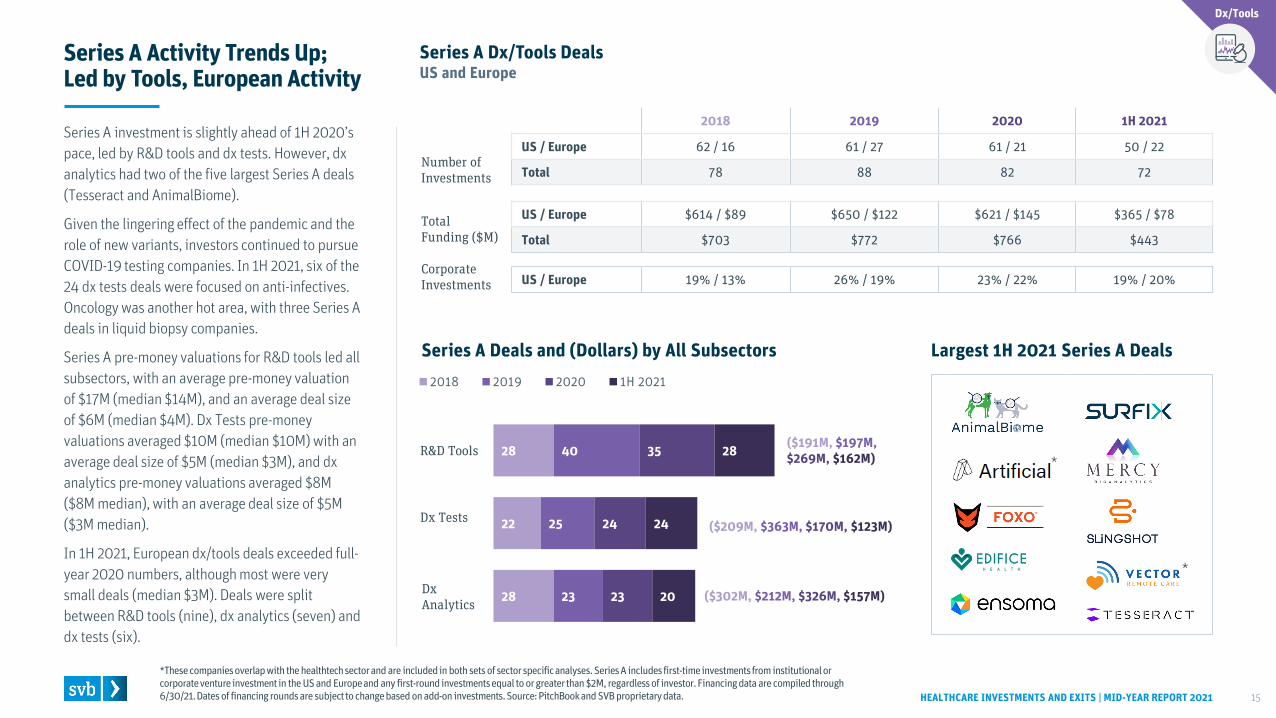
Series A Activity Trends Up; Led by Tools, European Activity
Series A investment is slightly ahead of 1H 2020’s pace, led by R&D tools and dx tests. However, dx analytics had two of the five largest Series A deals (Tesseract and AnimalBiome).
Given the lingering effect of the pandemic and the role of new variants, investors continued to pursue COVID-19 testing companies. In 1H 2021, six of the 24 dx tests deals were focused on anti-infectives. Oncology was another hot area, with three Series A deals in liquid biopsy companies.
Series A pre-money valuations for R&D tools led all subsectors, with an average pre-money valuation of $17M (median $14M), and an average deal size of $6M (median $4M). Dx Tests pre-money valuations averaged $10M (median $10M) with an average deal size of $5M (median $3M), and dx analytics pre-money valuations averaged $8M ($8M median), with an average deal size of $5M ($3M median).
In 1H 2021, European dx/tools deals exceeded full-year 2020 numbers, although most were very small deals (median $3M). Deals were split between R&D tools (nine), dx analytics (seven) and dx tests (six).
*These companies overlap with the healthtechsector and are included in both sets of sector specific analyses. Series A includes first-time investments from institutional or corporate venture investment in the US and Europe and any first-round investments equal to or greater than $2M, regardless of investor. Financing data are compiled through 6/30/21. Dates of financing rounds are subject to change based on add-on investments. Source: PitchBookand SVB proprietary data.
2018 2019 2020 1H 2021
US / Europe 62 / 16 61 / 27 61 / 21 50 / 22
Total 78 88 82 72Number of Investments
Total Funding ($M)
Corporate Investments
US / Europe $614 / $89 $650 / $122 $621 / $145 $365 / $78
Total $703 $772 $766 $443
US / Europe 19% / 13% 26% / 19% 23% / 22% 19% / 20%
Dx/Tools
R&D Tools
Dx Tests
Dx Analytics
Series A Deals and (Dollars) by All Subsectors Largest 1H 2021 Series A Deals
($302M, $212M, $326M, $157M)
($209M, $363M, $170M, $123M)
*
*
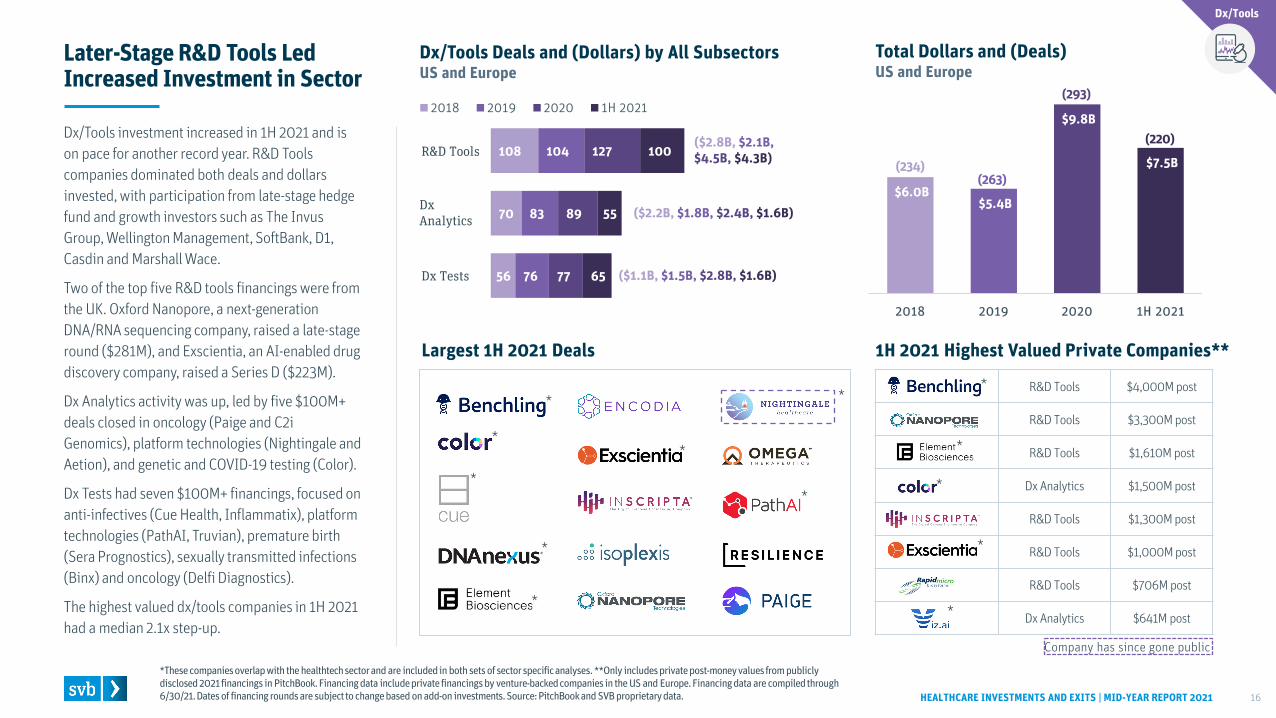
Dx/Tools investment increased in 1H 2021 and is on pace for another record year. R&D Tools companies dominated both deals and dollars invested, with participation from late-stage hedge fund and growth investors such as The InvusGroup, Wellington Management, SoftBank, D1, Casdin and Marshall Wace.
Two of the top five R&D tools financings were from the UK. Oxford Nanopore, a next-generation DNA/RNA sequencing company, raised a late-stage round ($281M), and Exscientia, an AI-enabled drug discovery company, raised a Series D ($223M).
Dx Analytics activity was up, led by five $100M+ deals closed in oncology (Paige and C2i Genomics), platform technologies (Nightingale and Aetion), and genetic and COVID-19 testing (Color).
Dx Tests had seven $100M+ financings, focused on anti-infectives (Cue Health, Inflammatix), platform technologies (PathAI, Truvian), premature birth (Sera Prognostics), sexually transmitted infections (Binx) and oncology (Delfi Diagnostics).
The highest valued dx/tools companies in 1H 2021 had a median 2.1x step-up.
Total Dollars and (Deals) US and Europe
56
70
108
76
83
104
77
89
127
65
55
100
2018 2019 2020 1H 2021
$6.0B$5.4B
$9.8B
$7.5B
2018 2019 2020 1H 2021
Dx/Tools Deals and (Dollars) by All SubsectorsUS and Europe
HEALTHCARE INVESTMENTS AND EXITS | MID-YEAR REPORT 2021 16
Later-Stage R&D Tools Led Increased Investment in Sector
*These companies overlap with the healthtechsector and are included in both sets of sector specific analyses. **Only includes private post-money values from publicly disclosed 2021 financings in PitchBook. Financing data include private financings by venture-backed companies in the US and Europe. Financing data are compiled through 6/30/21. Dates of financing rounds are subject to change based on add-on investments. Source: PitchBookand SVB proprietary data.
R&D Tools
Dx Analytics
Dx Tests
(234)(263)
(293)
Dx/Tools
Largest 1H 2021 Deals 1H 2021 Highest Valued Private Companies**
R&D Tools $4,000M post
R&D Tools $3,300M post
R&D Tools $1,610M post
Dx Analytics $1,500M post
R&D Tools $1,300M post
R&D Tools $1,000M post
R&D Tools $706M post
Dx Analytics $641M post
Company has since gone public
($2.8B, $2.1B,$4.5B, $4.3B)
($2.2B, $1.8B, $2.4B, $1.6B)
($1.1B, $1.5B, $2.8B, $1.6B)
(220)
*
*
*
**
*
*
*
*
*
*
*
*
Later-Stage/Crossover Investor
11
10
9
5
4
3
Corporate Investor
7
5
3
Venture Capital Investor
11
7
6
5
4
3
Number of Deals Across All Rounds(US and Europe, 2020–1H 2021)
HEALTHCARE INVESTMENTS AND EXITS | MID-YEAR REPORT 2021 17
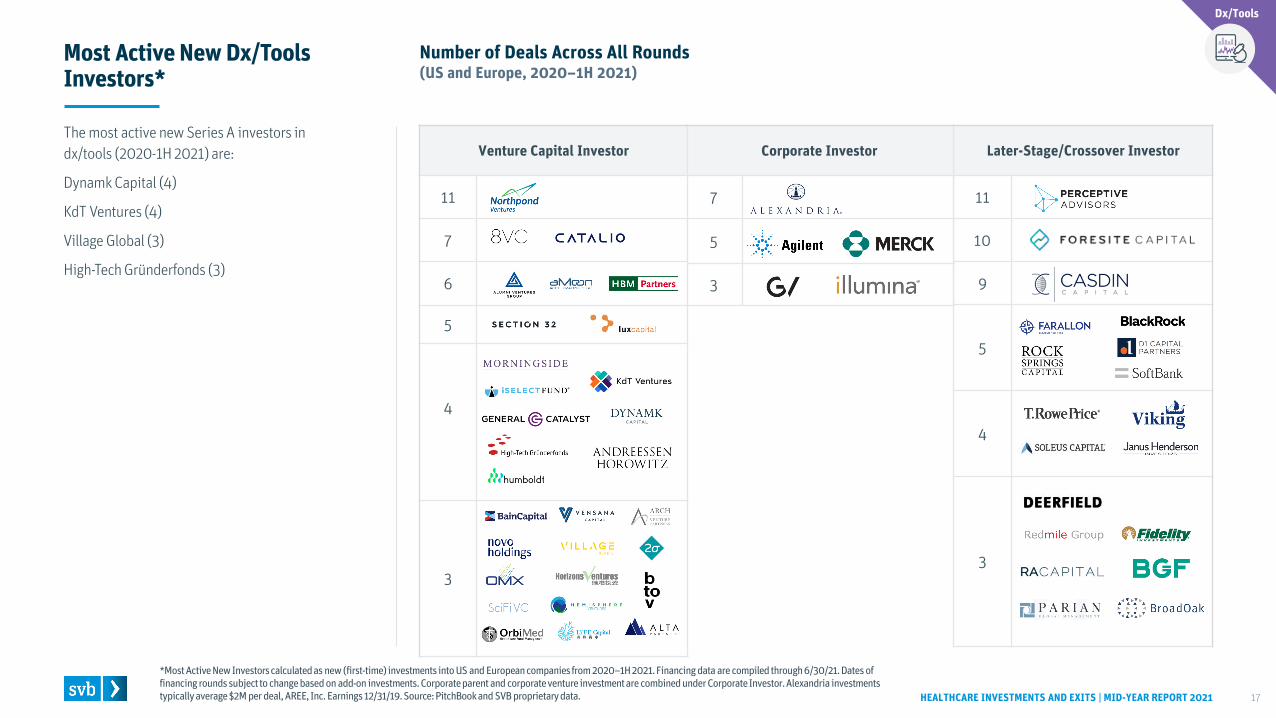
Most Active New Dx/Tools Investors*
The most active new Series A investors in dx/tools (2020-1H 2021) are:
Dynamk Capital (4)
KdT Ventures (4)
Village Global (3)
High-Tech Gründerfonds (3)
*Most Active New Investors calculated as new (first-time) investments into US and European companies from 2020–1H 2021. Financing data are compiled through 6/30/21. Dates of financing rounds subject to change based on add-on investments. Corporate parent and corporate venture investment are combined under Corporate Investor. Alexandria investments typically average $2M per deal, AREE, Inc. Earnings 12/31/19. Source: PitchBookand SVB proprietary data.
Dx/Tools
6
8
9
10
4
10
6
7
10
9
9
13
3
7
9
7
9
8
3
7
6
9
14
9
2018 2019 2020 1H 2021
Series A Device DealsUS and Europe
HEALTHCARE INVESTMENTS AND EXITS | MID-YEAR REPORT 2021 18
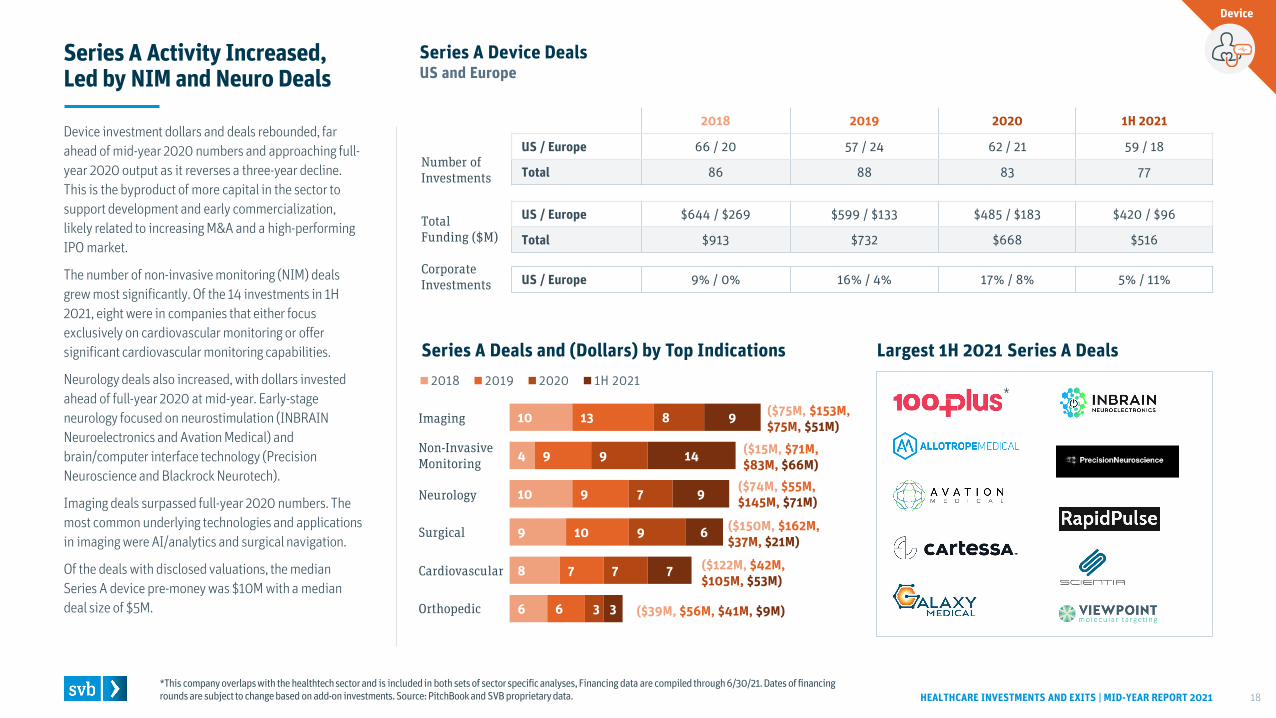
Series A Activity Increased, Led by NIM and Neuro Deals
Device investment dollars and deals rebounded, far ahead of mid-year 2020 numbers and approaching full-year 2020 output as it reverses a three-year decline. This is the byproduct of more capital in the sector to support development and early commercialization, likely related to increasing M&A and a high-performing IPO market.
The number of non-invasive monitoring (NIM) deals grew most significantly. Of the 14 investments in 1H 2021, eight were in companies that either focus exclusively on cardiovascular monitoring or offer significant cardiovascular monitoring capabilities.
Neurology deals also increased, with dollars invested ahead of full-year 2020 at mid-year. Early-stage neurology focused on neurostimulation (INBRAIN Neuroelectronics and Avation Medical) and brain/computer interface technology (Precision Neuroscience and Blackrock Neurotech).
Imaging deals surpassed full-year 2020 numbers. The most common underlying technologies and applications in imaging were AI/analytics and surgical navigation.
Of the deals with disclosed valuations, the median Series A device pre-money was $10M with a median deal size of $5M.
*This company overlaps with the healthtechsector and is included in both sets of sector specific analyses, Financing data are compiled through 6/30/21. Dates of financing rounds are subject to change based on add-on investments. Source: PitchBookand SVB proprietary data.
2018 2019 2020 1H 2021
US / Europe 66 / 20 57 / 24 62 / 21 59 / 18
Total 86 88 83 77Number of Investments
Total Funding ($M)
Corporate Investments
US / Europe $644 / $269 $599 / $133 $485 / $183 $420 / $96
Total $913 $732 $668 $516
US / Europe 9% / 0% 16% / 4% 17% / 8% 5% / 11%
Series A Deals and (Dollars) by Top Indications Largest 1H 2021 Series A Deals
Imaging
Non-Invasive Monitoring
Neurology
Surgical
Cardiovascular
Orthopedic
Device
($122M, $42M,$105M, $53M)
($75M, $153M,$75M, $51M)
($150M, $162M,$37M, $21M)
($74M, $55M,$145M, $71M)
($15M, $71M,$83M, $66M)
($39M, $56M, $41M, $9M)
*
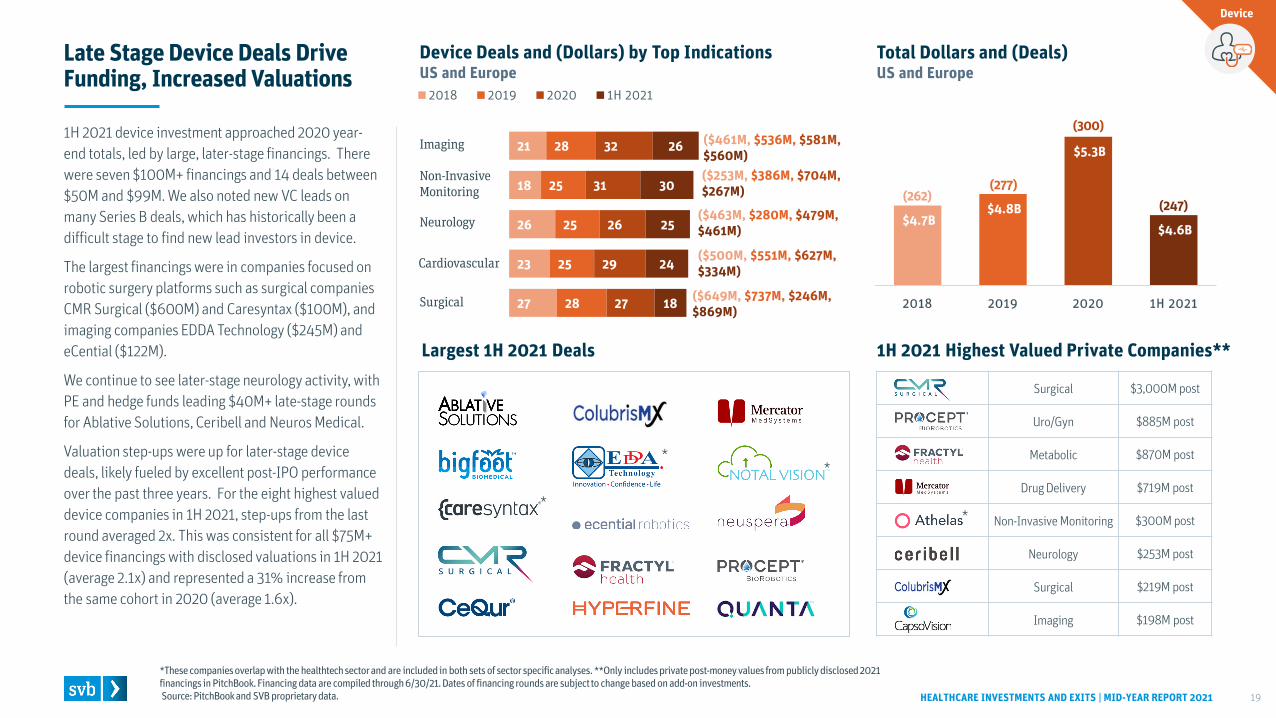
1H 2021 device investment approached 2020 year-end totals, led by large, later-stage financings. There were seven $100M+ financings and 14 deals between $50M and $99M. We also noted new VC leads on many Series B deals, which has historically been a difficult stage to find new lead investors in device.
The largest financings were in companies focused on robotic surgery platforms such as surgical companies CMR Surgical ($600M) and Caresyntax ($100M), and imaging companies EDDA Technology ($245M) and eCential ($122M).
We continue to see later-stage neurology activity, with PE and hedge funds leading $40M+ late-stage rounds for Ablative Solutions, Ceribell and Neuros Medical.
Valuation step-ups were up for later-stage device deals, likely fueled by excellent post-IPO performance over the past three years. For the eight highest valued device companies in 1H 2021, step-ups from the last round averaged 2x. This was consistent for all $75M+ device financings with disclosed valuations in 1H 2021 (average 2.1x) and represented a 31% increase from the same cohort in 2020 (average 1.6x).
27
23
26
18
21
28
25
25
25
28
27
29
26
31
32
18
24
25
30
26
2018 2019 2020 1H 2021
$4.7B$4.8B
$5.3B
$4.6B
2018 2019 2020 1H 2021
Surgical $3,000M post
Uro/Gyn $885M post
Metabolic $870M post
Drug Delivery $719M post
Non-Invasive Monitoring $300M post
Neurology $253M post
Surgical $219M post
Imaging $198M post
Device Deals and (Dollars) by Top IndicationsUS and Europe
HEALTHCARE INVESTMENTS AND EXITS | MID-YEAR REPORT 2021 19
Late Stage Device Deals Drive Funding, Increased Valuations
*These companies overlap with the healthtechsector and are included in both sets of sector specific analyses. **Only includes private post-money values from publicly disclosed 2021 financings in PitchBook. Financing data are compiled through 6/30/21. Dates of financing rounds are subject to change based on add-on investments.Source: PitchBookand SVB proprietary data.
Imaging
Non-Invasive Monitoring
Neurology
Cardiovascular
Surgical
(262)(277)
(300)
Device
Total Dollars and (Deals) US and Europe
Largest 1H 2021 Deals 1H 2021 Highest Valued Private Companies**
($500M, $551M, $627M, $334M)
($463M, $280M, $479M, $461M)
($461M, $536M, $581M, $560M)
($649M, $737M, $246M, $869M)
($253M, $386M, $704M, $267M)
(247)
*
**
*
Number of Deals Across All Rounds(US and Europe, 2020–1H 2021)
HEALTHCARE INVESTMENTS AND EXITS | MID-YEAR REPORT 2021 20
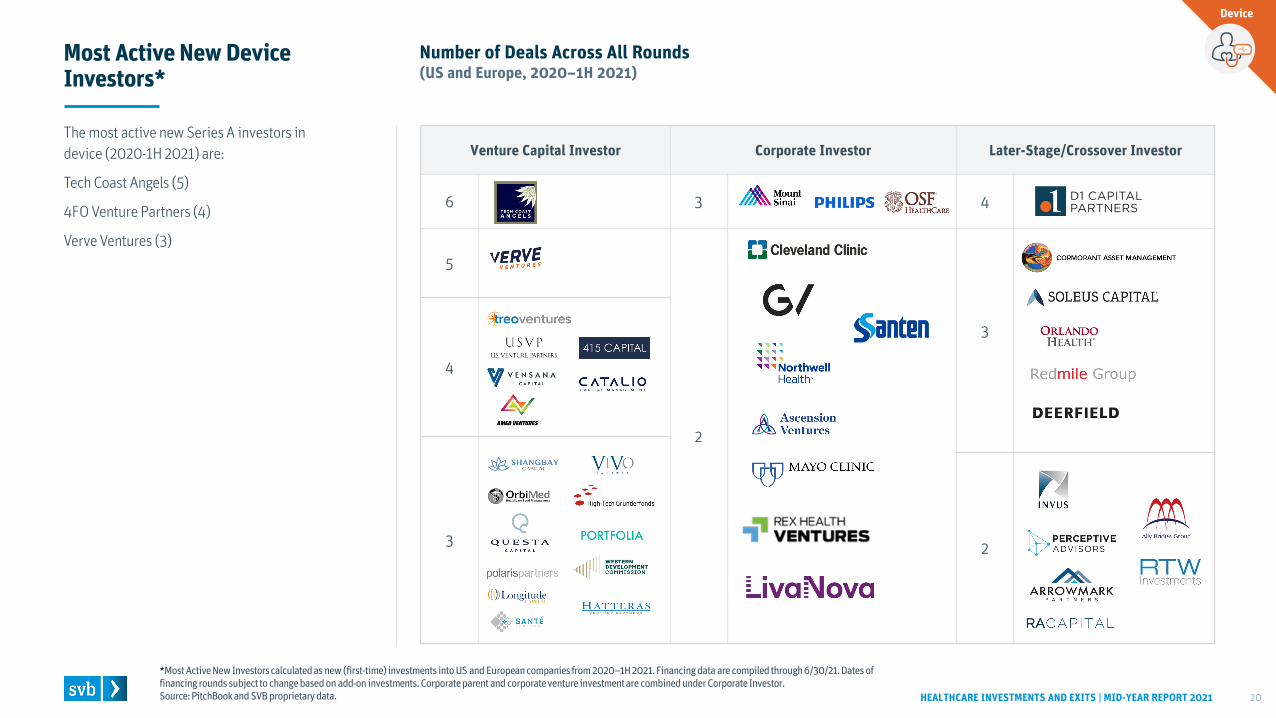
Most Active New Device Investors*
The most active new Series A investors in device (2020-1H 2021) are:
Tech Coast Angels (5)
4FO Venture Partners (4)
Verve Ventures (3)
*Most Active New Investors calculated as new (first-time) investments into US and European companies from 2020–1H 2021. Financingdata are compiled through 6/30/21. Dates of financing rounds subject to change based on add-on investments. Corporate parent and corporate venture investment are combined under Corporate Investor. Source: PitchBookand SVB proprietary data.
Device
Venture Capital Investor Corporate Investor Later-Stage/Crossover Investor
6 3 4
5
2
3
4
3 2

Healthcare SPAC ActivityGlobal
HEALTHCARE INVESTMENTS AND EXITS | MID-YEAR REPORT 2021 21
D) Completed De-SPACs by Implied Value,Performance(Global, 2020-1H 2021)
A) De-SPAC and IPO Performance by Sector (Global, 2020-1H 2021)
HEALTHCARE INVESTMENTS AND EXITS | MID-YEAR REPORT 2021 22
Venture-Backed Healthcare: De-SPAC Analysis
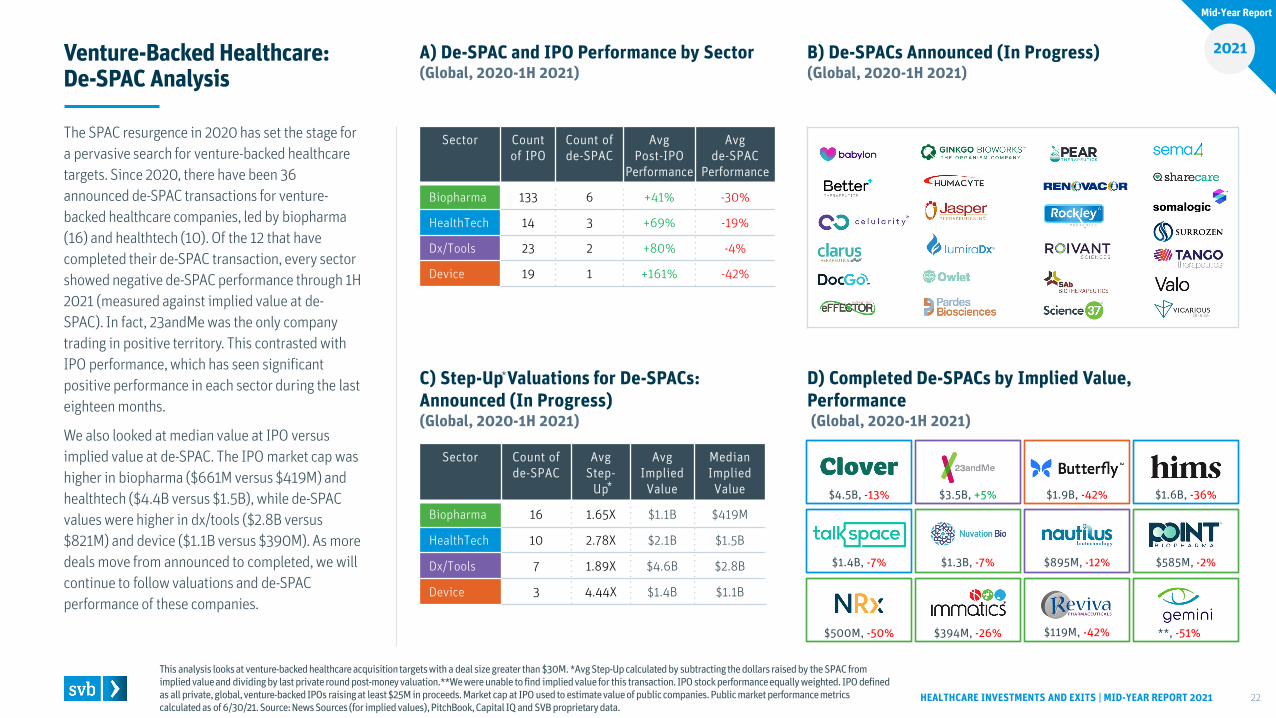
The SPAC resurgence in 2020 has set the stage for a pervasive search for venture-backed healthcare targets. Since 2020, there have been 36 announced de-SPAC transactions for venture-backed healthcare companies, led by biopharma (16) and healthtech (10). Of the 12 that have completed their de-SPAC transaction, every sector showed negative de-SPAC performance through 1H 2021 (measured against implied value at de-SPAC). In fact, 23andMe was the only company trading in positive territory. This contrasted with IPO performance, which has seen significant positive performance in each sector during the last eighteen months.
We also looked at median value at IPO versus implied value at de-SPAC. The IPO market cap was higher in biopharma ($661M versus $419M) and healthtech ($4.4B versus $1.5B), while de-SPAC values were higher in dx/tools ($2.8B versus $821M) and device ($1.1B versus $390M). As more deals move from announced to completed, we will continue to follow valuations and de-SPAC performance of these companies.
This analysis looks at venture-backed healthcare acquisition targets with a deal size greater than $30M. *Avg Step-Up calculatedby subtracting the dollars raised by the SPAC from implied value and dividing by last private round post-money valuation.**We were unable to find implied value for this transaction. IPO stock performance equally weighted. IPO defined as all private, global, venture-backed IPOs raising at least $25M in proceeds. Market cap at IPO used to estimate value of public companies. Public market performance metrics calculated as of 6/30/21. Source: News Sources (for implied values), PitchBook, Capital IQ and SVB proprietary data.
B) De-SPACs Announced (In Progress)(Global, 2020-1H 2021)
C) Step-Up Valuations for De-SPACs: Announced (In Progress)(Global, 2020-1H 2021)
Biopharma
Sector Count of IPO
Count of de-SPAC
Avg Post-IPO
Performance
Avg de-SPAC
Performance
Biopharma 133 6 +41% -30%
HealthTech 14 3 +69% -19%
Dx/Tools 23 2 +80% -4%
Device 19 1 +161% -42%
Sector Count of de-SPAC
Avg Step-
Up
Avg Implied Value
Median Implied Value
Biopharma 16 1.65X $1.1B $419M
HealthTech 10 2.78X $2.1B $1.5B
Dx/Tools 7 1.89X $4.6B $2.8B
Device 3 4.44X $1.4B $1.1B
*
$1.4B, -7%
$500M, -50%
$1.3B, -7%
$394M, -26%
$1.9B, -42%
$895M, -12%
$4.5B, -13%
$585M, -2%
**, -51%
$3.5B, +5% $1.6B, -36%
$119M, -42%
*
Mid-Year Report
2021

Healthcare M&A and IPO ActivityGlobal
HEALTHCARE INVESTMENTS AND EXITS | MID-YEAR REPORT 2021 23
22
20
14
15
15
19
7
43
28
31
55
50
84
50
Private M&A IPO
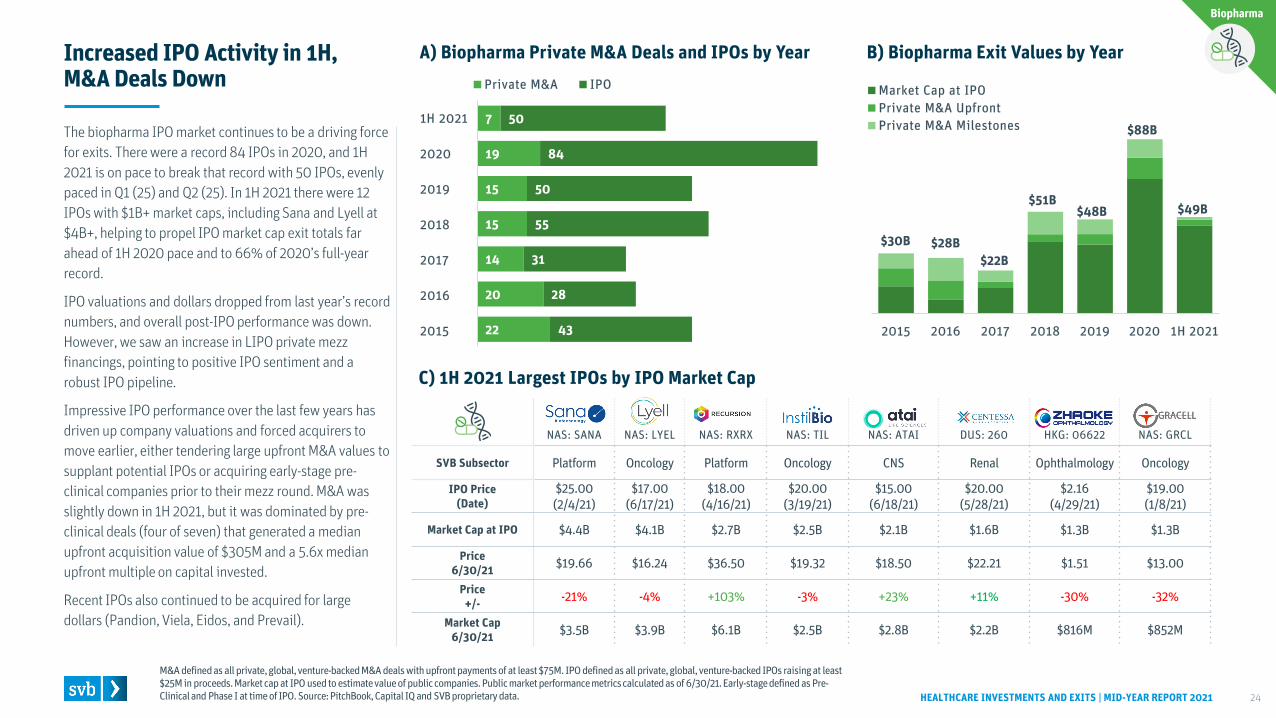
NAS: SANA NAS: LYEL NAS: RXRX NAS: TIL NAS: ATAI DUS: 260 HKG: 06622 NAS: GRCL
SVB Subsector Platform Oncology Platform Oncology CNS Renal Ophthalmology Oncology
IPO Price (Date)
$25.00(2/4/21)
$17.00(6/17/21)
$18.00(4/16/21)
$20.00(3/19/21)
$15.00(6/18/21)
$20.00(5/28/21)
$2.16(4/29/21)
$19.00(1/8/21)
Market Cap at IPO $4.4B $4.1B $2.7B $2.5B $2.1B $1.6B $1.3B $1.3B
Price 6/30/21 $19.66 $16.24 $36.50 $19.32 $18.50 $22.21 $1.51 $13.00
Price+/- -21% -4% +103% -3% +23% +11% -30% -32%
Market Cap6/30/21 $3.5B $3.9B $6.1B $2.5B $2.8B $2.2B $816M $852M
2015 2016 2017 2018 2019 2020 1H 2021
Market Cap at IPOPrivate M&A UpfrontPrivate M&A Milestones
A) Biopharma Private M&A Deals and IPOs by Year
HEALTHCARE INVESTMENTS AND EXITS | MID-YEAR REPORT 2021 24
Increased IPO Activity in 1H, M&A Deals Down
M&A defined as all private, global, venture-backed M&A deals with upfront payments of at least $75M. IPO defined as all private,global, venture-backed IPOs raising at least $25M in proceeds. Market cap at IPO used to estimate value of public companies. Public market performance metrics calculated as of 6/30/21. Early-stage defined as Pre-Clinical and Phase I at time of IPO. Source: PitchBook, Capital IQ and SVB proprietary data.
C) 1H 2021 Largest IPOs by IPO Market Cap
B) Biopharma Exit Values by Year
1H 2021
2020
2019
2018
2017
2016
2015
$28B$22B
$51B$48B
$88B
$30B
Biopharma
$49B
The biopharma IPO market continues to be a driving force for exits. There were a record 84 IPOs in 2020, and 1H 2021 is on pace to break that record with 50 IPOs, evenly paced in Q1 (25) and Q2 (25). In 1H 2021 there were 12 IPOs with $1B+ market caps, including Sana and Lyell at $4B+, helping to propel IPO market cap exit totals far ahead of 1H 2020 pace and to 66% of 2020’s full-year record.
IPO valuations and dollars dropped from last year’s record numbers, and overall post-IPO performance was down. However, we saw an increase in LIPO private mezz financings, pointing to positive IPO sentiment and a robust IPO pipeline.
Impressive IPO performance over the last few years has driven up company valuations and forced acquirers to move earlier, either tendering large upfront M&A values to supplant potential IPOs or acquiring early-stage pre-clinical companies prior to their mezz round. M&A was slightly down in 1H 2021, but it was dominated by pre-clinical deals (four of seven) that generated a median upfront acquisition value of $305M and a 5.6x median upfront multiple on capital invested.
Recent IPOs also continued to be acquired for large dollars (Pandion, Viela, Eidos, and Prevail).
4
5
5
5
5
2
7
7
5
6
2
8
4
2
7
5
3
5
9
10
1
1
1
1
1
Pre-Clinical
Phase I
Phase II
Phase III
US Commercial
A) Biopharma Private M&A Deals by Stage
HEALTHCARE INVESTMENTS AND EXITS | MID-YEAR REPORT 2021 25
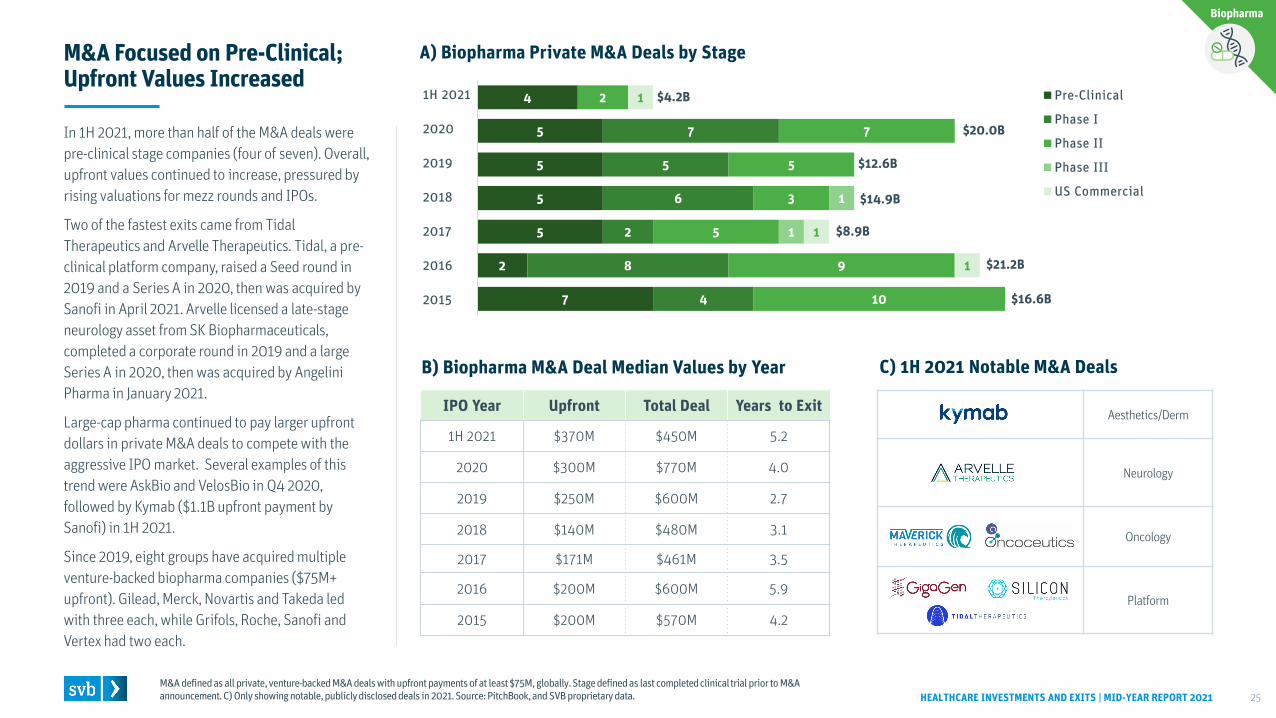
M&A Focused on Pre-Clinical; Upfront Values Increased
M&A defined as all private, venture-backed M&A deals with upfront payments of at least $75M, globally. Stage defined as last completed clinical trial prior to M&A announcement.C) Only showing notable, publicly disclosed deals in 2021.Source: PitchBook, and SVB proprietary data.
B) Biopharma M&A Deal Median Values by Year C) 1H 2021 Notable M&A Deals
1H 2021
2020
2019
2018
2017
2016
2015
IPO Year Upfront Total Deal Years to Exit
1H 2021 $370M $450M 5.2
2020 $300M $770M 4.0
2019 $250M $600M 2.7
2018 $140M $480M 3.1
2017 $171M $461M 3.5
2016 $200M $600M 5.9
2015 $200M $570M 4.2
Biopharma
$16.6B
$21.2B
$8.9B
$14.9B
$12.6B
$4.2B
Aesthetics/Derm
Neurology
Oncology
Platform
$20.0BIn 1H 2021, more than half of the M&A deals were pre-clinical stage companies (four of seven). Overall, upfront values continued to increase, pressured by rising valuations for mezz rounds and IPOs.
Two of the fastest exits came from Tidal Therapeutics and Arvelle Therapeutics. Tidal, a pre-clinical platform company, raised a Seed round in 2019 and a Series A in 2020, then was acquired by Sanofi in April 2021. Arvelle licensed a late-stage neurology asset from SK Biopharmaceuticals, completed a corporate round in 2019 and a large Series A in 2020, then was acquired by Angelini Pharma in January 2021.
Large-cap pharma continued to pay larger upfront dollars in private M&A deals to compete with the aggressive IPO market. Several examples of this trend were AskBio and VelosBio in Q4 2020, followed by Kymab ($1.1B upfront payment by Sanofi) in 1H 2021.
Since 2019, eight groups have acquired multiple venture-backed biopharma companies ($75M+ upfront). Gilead, Merck, Novartis and Takeda led with three each, while Grifols, Roche, Sanofi and Vertex had two each.
A) IPO Median Pre-Money Valuations
HEALTHCARE INVESTMENTS AND EXITS | MID-YEAR REPORT 2021 26
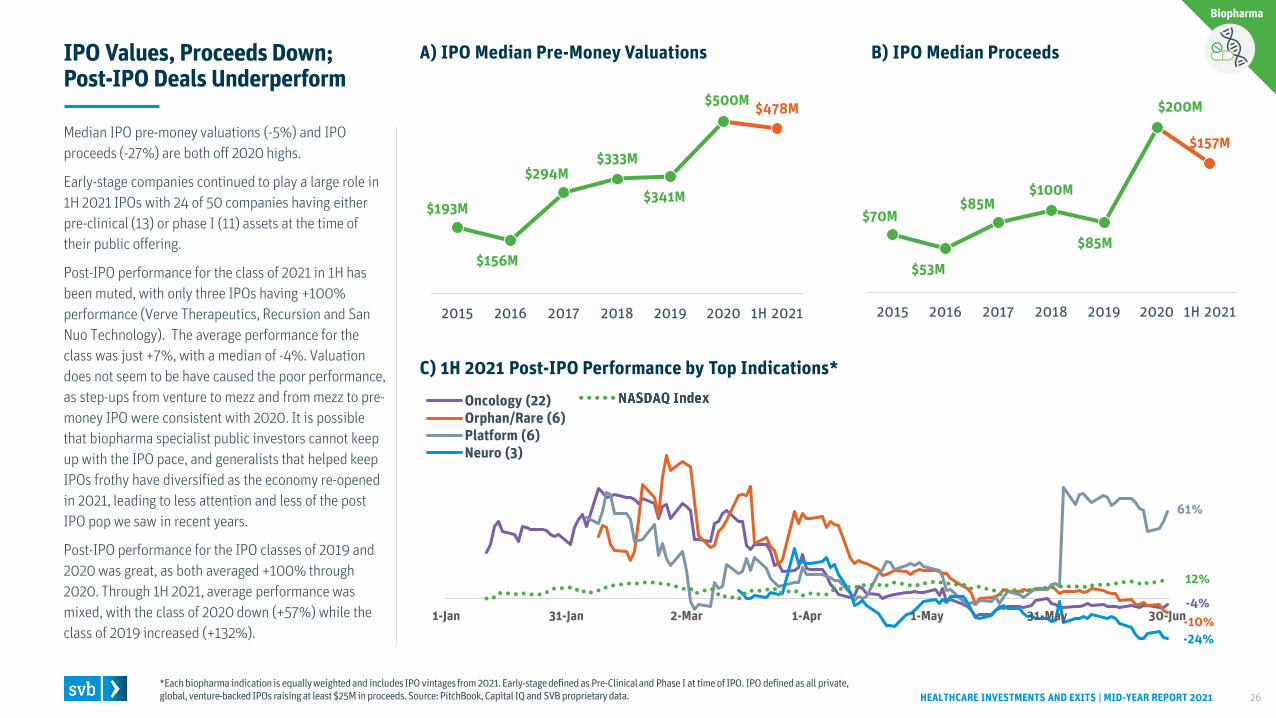
IPO Values, Proceeds Down; Post-IPO Deals Underperform
*Each biopharma indication is equally weighted and includes IPO vintages from 2021. Early-stage defined as Pre-Clinical and Phase I at time of IPO. IPO defined as all private, global, venture-backed IPOs raising at least $25M in proceeds. Source: PitchBook, Capital IQ and SVB proprietary data.
C) 1H 2021 Post-IPO Performance by Top Indications*
B) IPO Median Proceeds
Biopharma
61%
-4%-10%-24%
Median IPO pre-money valuations (-5%) and IPO proceeds (-27%) are both off 2020 highs.
Early-stage companies continued to play a large role in 1H 2021 IPOs with 24 of 50 companies having either pre-clinical (13) or phase I (11) assets at the time of their public offering.
Post-IPO performance for the class of 2021 in 1H has been muted, with only three IPOs having +100% performance (Verve Therapeutics, Recursion and San Nuo Technology). The average performance for the class was just +7%, with a median of -4%. Valuation does not seem to be have caused the poor performance, as step-ups from venture to mezz and from mezz to pre-money IPO were consistent with 2020. It is possible that biopharma specialist public investors cannot keep up with the IPO pace, and generalists that helped keep IPOs frothy have diversified as the economy re-opened in 2021, leading to less attention and less of the post IPO pop we saw in recent years.
Post-IPO performance for the IPO classes of 2019 and 2020 was great, as both averaged +100% through 2020. Through 1H 2021, average performance was mixed, with the class of 2020 down (+57%) while the class of 2019 increased (+132%).
$193M
$156M
$294M$333M
$341M
$500M $478M
2015 2016 2017 2018 2019 2020 1H 2021
$70M
$53M
$85M$100M
$85M
$200M
$157M
2015 2016 2017 2018 2019 2020 1H 2021
1-Jan 31-Jan 2-Mar 1-Apr 1-May 31-May 30-Jun
Oncology (22)Orphan/Rare (6)Platform (6)Neuro (3)
12%
NYSE: DOCS NAS: ALHC OM: PTRK NAS: MOVE TSE: CARE NYSE: BHG HLSE: HEALTH NYSE: OSCR TSX: MNOW
SVB Subsector Provider Operations Insurance Provider
OperationsWellness & Education
Alternative Virtual Care Insurance Wellness &
Education Insurance Medication Management
IPO Price (Date)
$26.00 (6/24/21)
$18.00 (3/26/21)
$4.65 (6/18/21)
$5.00 (3/23/21)
$9.62(3/30/21)
$18.00(6/24/21)
$8.00 (3/19/21)
$39.00 (3/3/21)
$5.41 (3/9/21)
Price 6/30/21 $58.20 $23.37 $5.01 $5.09 $9.20 $17.16 $6.84 $21.50 $1.49
Price+/- +124% +30% +8% +2% -4% -5% -14% -45% -72%
Market Cap6/30/21 $10.4B $4.4B $78M $167M $610M $10.7B $410M $4.5B $32M
2015 2016 2017 2018 2019 2020 1H 2021
Market Cap at IPOPrivate M&A Total
B) HealthTech Exit Values by Year
8
24
37
75
77
69
44
3
2
2
7
7
9
Private M&A IPO IPO
A) HealthTech Private M&A Deals and IPOs by Year
HEALTHCARE INVESTMENTS AND EXITS | MID-YEAR REPORT 2021 27
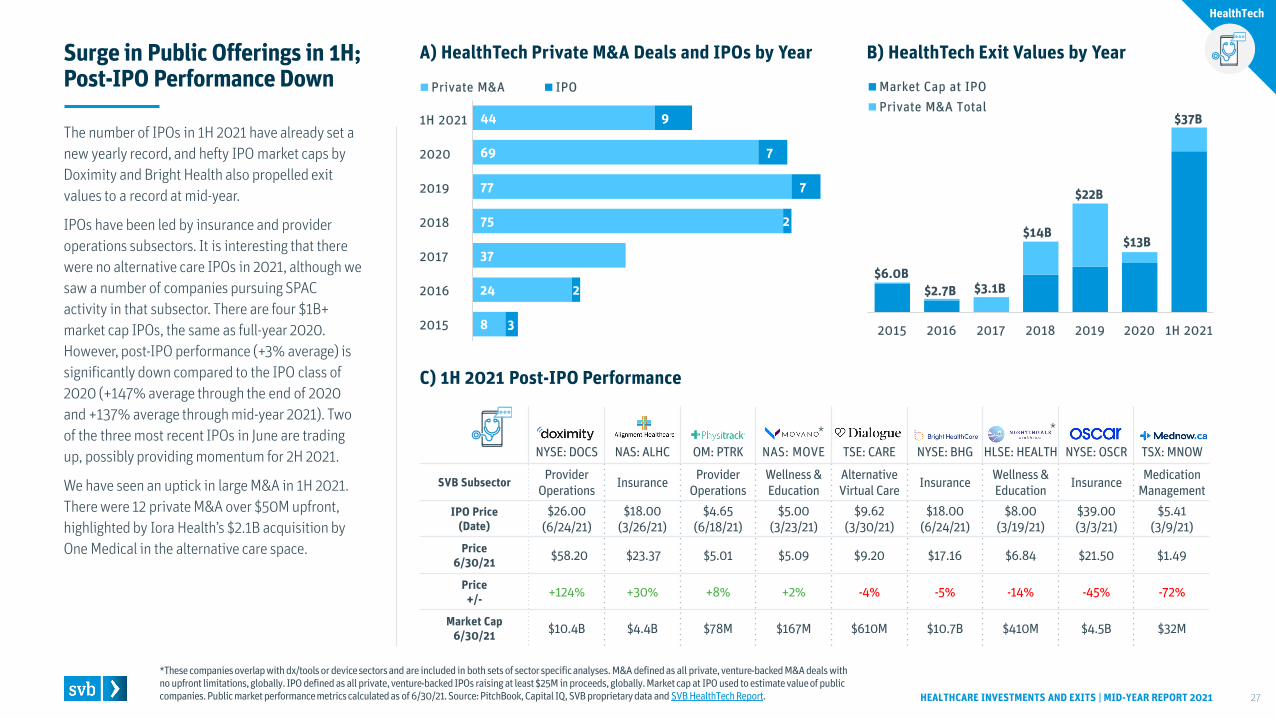
Surge in Public Offerings in 1H; Post-IPO Performance Down
*These companies overlap with dx/tools or device sectors and are included in both sets of sector specific analyses. M&A defined as all private, venture-backed M&A deals with no upfront limitations, globally. IPO defined as all private, venture-backed IPOs raising at least $25M in proceeds, globally. Market cap at IPO used to estimate value of public companies. Public market performance metrics calculated as of 6/30/21. Source: PitchBook, Capital IQ, SVB proprietary data and SVB HealthTechReport.
C) 1H 2021 Post-IPO Performance
1H 2021
2020
2019
2018
2017
2016
2015
$2.7B $3.1B
$14B
$22B
$13B
$6.0B
HealthTech
$37BThe number of IPOs in 1H 2021 have already set a new yearly record, and hefty IPO market caps by Doximity and Bright Health also propelled exit values to a record at mid-year.
IPOs have been led by insurance and provider operations subsectors. It is interesting that there were no alternative care IPOs in 2021, although we saw a number of companies pursuing SPAC activity in that subsector. There are four $1B+ market cap IPOs, the same as full-year 2020. However, post-IPO performance (+3% average) is significantly down compared to the IPO class of 2020 (+147% average through the end of 2020 and +137% average through mid-year 2021). Two of the three most recent IPOs in June are trading up, possibly providing momentum for 2H 2021.
We have seen an uptick in large M&A in 1H 2021. There were 12 private M&A over $50M upfront, highlighted by Iora Health’s $2.1B acquisition by One Medical in the alternative care space.
* *
5
16
21
29
31
36
23
1
2
4
27
23
12
11
2
2
7
4
11
3
1
2
5
6
4
4
3
1
4
3
8
2
3
1
1
3
6
4
1
1
1
Provider Operations
Alternative Care
Wellness & Education
Clinical Trial Enablement
Medication Management
Healthcare Navigation
Insurance
A) HealthTech Private M&A Deals by Subsectors
HEALTHCARE INVESTMENTS AND EXITS | MID-YEAR REPORT 2021 28
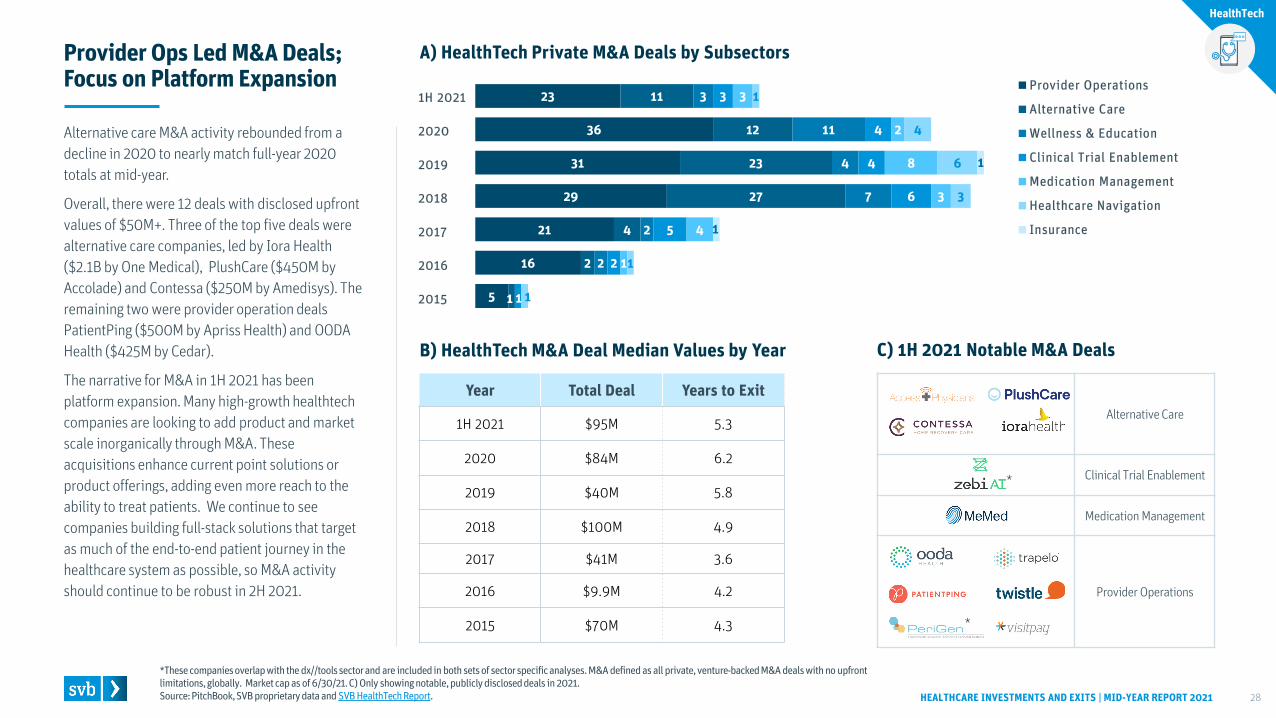
Provider Ops Led M&A Deals; Focus on Platform Expansion
*These companies overlap with the dx//tools sector and are included in both sets of sector specific analyses. M&A defined as all private, venture-backed M&A deals with no upfront limitations, globally. Market cap as of 6/30/21. C) Only showing notable, publicly disclosed deals in 2021.Source: PitchBook, SVB proprietary data and SVB HealthTechReport.
B) HealthTech M&A Deal Median Values by Year C) 1H 2021 Notable M&A Deals
1H 2021
2020
2019
2018
2017
2016
2015
HealthTech
Alternative Care
Clinical Trial Enablement
Medication Management
Provider Operations
Year Total Deal Years to Exit
1H 2021 $95M 5.3
2020 $84M 6.2
2019 $40M 5.8
2018 $100M 4.9
2017 $41M 3.6
2016 $9.9M 4.2
2015 $70M 4.3
Alternative care M&A activity rebounded from a decline in 2020 to nearly match full-year 2020 totals at mid-year.
Overall, there were 12 deals with disclosed upfront values of $50M+. Three of the top five deals were alternative care companies, led by Iora Health ($2.1B by One Medical), PlushCare ($450M by Accolade) and Contessa ($250M by Amedisys). The remaining two were provider operation deals PatientPing ($500M by Apriss Health) and OODA Health ($425M by Cedar).
The narrative for M&A in 1H 2021 has been platform expansion. Many high-growth healthtechcompanies are looking to add product and market scale inorganically through M&A. These acquisitions enhance current point solutions or product offerings, adding even more reach to the ability to treat patients. We continue to see companies building full-stack solutions that target as much of the end-to-end patient journey in the healthcare system as possible, so M&A activity should continue to be robust in 2H 2021.
*
*
2015 2016 2017 2018 2019 2020 1H 2021
Market Cap at IPOPrivate M&A UpfrontPrivate M&A Milestones
A) Dx/Tools Private M&A Deals & IPOs by Year
HEALTHCARE INVESTMENTS AND EXITS | MID-YEAR REPORT 2021 29
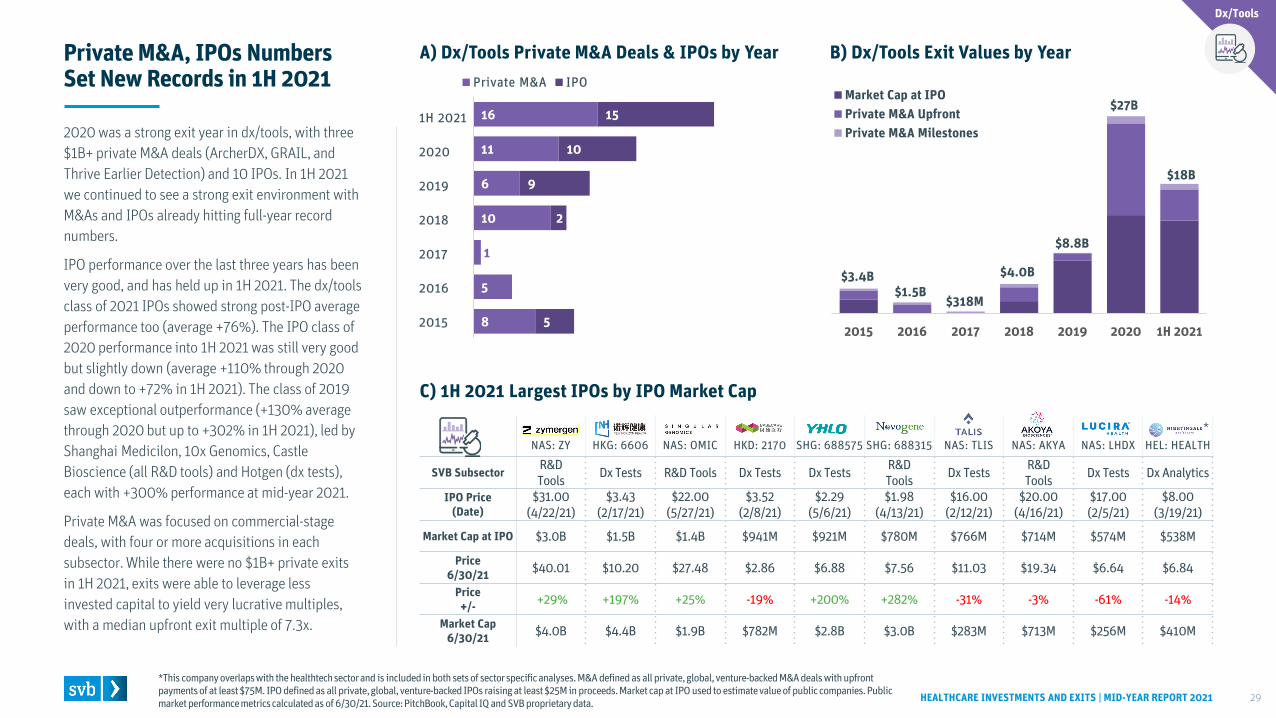
Private M&A, IPOs Numbers Set New Records in 1H 2021
*This company overlaps with the healthtechsector and is included in both sets of sector specific analyses. M&A defined as all private, global, venture-backed M&A deals with upfront payments of at least $75M. IPO defined as all private, global, venture-backed IPOs raising at least $25M in proceeds. Market capat IPO used to estimate value of public companies. Public market performance metrics calculated as of 6/30/21. Source: PitchBook, Capital IQ and SVB proprietary data.
B) Dx/Tools Exit Values by Year
1H 2021
2020
2019
2018
2017
2016
2015
$1.5B$318M
$4.0B
$8.8B
$27B
$3.4B
NAS: ZY HKG: 6606 NAS: OMIC HKD: 2170 SHG: 688575 SHG: 688315 NAS: TLIS NAS: AKYA NAS: LHDX HEL: HEALTH
SVB Subsector R&D Tools Dx Tests R&D Tools Dx Tests Dx Tests R&D
Tools Dx Tests R&D Tools Dx Tests Dx Analytics
IPO Price (Date)
$31.00(4/22/21)
$3.43(2/17/21)
$22.00(5/27/21)
$3.52 (2/8/21)
$2.29(5/6/21)
$1.98(4/13/21)
$16.00(2/12/21)
$20.00(4/16/21)
$17.00(2/5/21)
$8.00 (3/19/21)
Market Cap at IPO $3.0B $1.5B $1.4B $941M $921M $780M $766M $714M $574M $538M
Price 6/30/21 $40.01 $10.20 $27.48 $2.86 $6.88 $7.56 $11.03 $19.34 $6.64 $6.84
Price+/- +29% +197% +25% -19% +200% +282% -31% -3% -61% -14%
Market Cap6/30/21 $4.0B $4.4B $1.9B $782M $2.8B $3.0B $283M $713M $256M $410M
Dx/Tools
C) 1H 2021 Largest IPOs by IPO Market Cap
$18B
2020 was a strong exit year in dx/tools, with three $1B+ private M&A deals (ArcherDX, GRAIL, and Thrive Earlier Detection) and 10 IPOs. In 1H 2021 we continued to see a strong exit environment with M&As and IPOs already hitting full-year record numbers.
IPO performance over the last three years has been very good, and has held up in 1H 2021. The dx/tools class of 2021 IPOs showed strong post-IPO average performance too (average +76%). The IPO class of 2020 performance into 1H 2021 was still very good but slightly down (average +110% through 2020 and down to +72% in 1H 2021). The class of 2019 saw exceptional outperformance (+130% average through 2020 but up to +302% in 1H 2021), led by Shanghai Medicilon, 10x Genomics, Castle Bioscience (all R&D tools) and Hotgen (dx tests), each with +300% performance at mid-year 2021.
Private M&A was focused on commercial-stage deals, with four or more acquisitions in each subsector. While there were no $1B+ private exits in 1H 2021, exits were able to leverage less invested capital to yield very lucrative multiples, with a median upfront exit multiple of 7.3x.
8
5
1
10
6
11
16
5
0
0
2
9
10
15
Private M&A IPO
*
5
7
4
6
4
5
7
3
2
4
3
4
1
1
R&D Tools
Dx Test
Dx Analytics
Dx Analytics
Dx Tests
R&D Tools
A) Dx/Tools Private M&A Deals by Indications
HEALTHCARE INVESTMENTS AND EXITS | MID-YEAR REPORT 2021 30
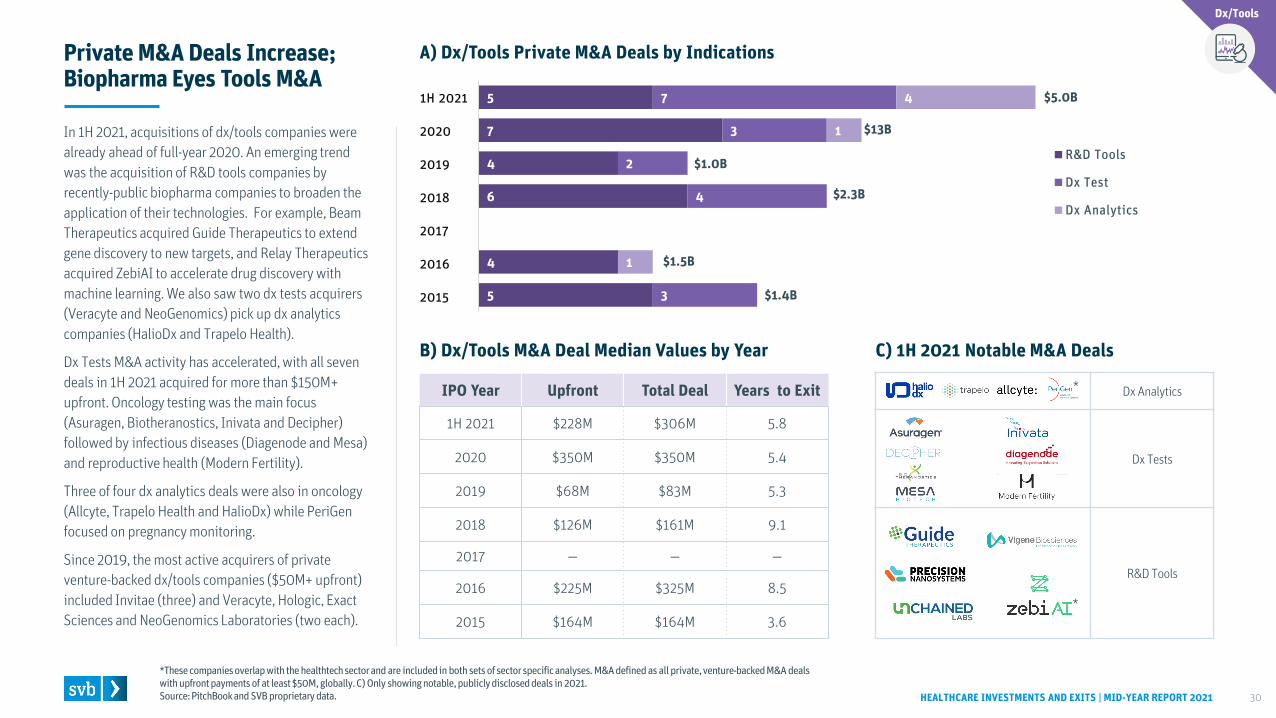
Private M&A Deals Increase; Biopharma Eyes Tools M&A
*These companies overlap with the healthtechsector and are included in both sets of sector specific analyses. M&A defined as all private, venture-backed M&A deals with upfront payments of at least $50M, globally. C) Only showing notable, publicly disclosed deals in 2021. Source: PitchBookand SVB proprietary data.
B) Dx/Tools M&A Deal Median Values by Year
$1.4B
$1.5B
$2.3B
$1.0B
1H 2021
2020
2019
2018
2017
2016
2015
IPO Year Upfront Total Deal Years to Exit
1H 2021 $228M $306M 5.8
2020 $350M $350M 5.4
2019 $68M $83M 5.3
2018 $126M $161M 9.1
2017 — — —
2016 $225M $325M 8.5
2015 $164M $164M 3.6
Dx/Tools
C) 1H 2021 Notable M&A Deals
$13B
$5.0B
In 1H 2021, acquisitions of dx/tools companies were already ahead of full-year 2020. An emerging trend was the acquisition of R&D tools companies by recently-public biopharma companies to broaden the application of their technologies. For example, Beam Therapeutics acquired Guide Therapeutics to extend gene discovery to new targets, and Relay Therapeutics acquired ZebiAI to accelerate drug discovery with machine learning. We also saw two dx tests acquirers (Veracyte and NeoGenomics) pick up dx analytics companies (HalioDx and Trapelo Health).
Dx Tests M&A activity has accelerated, with all seven deals in 1H 2021 acquired for more than $150M+ upfront. Oncology testing was the main focus (Asuragen, Biotheranostics, Inivata and Decipher) followed by infectious diseases (Diagenode and Mesa) and reproductive health (Modern Fertility).
Three of four dx analytics deals were also in oncology (Allcyte, Trapelo Health and HalioDx) while PeriGenfocused on pregnancy monitoring.
Since 2019, the most active acquirers of private venture-backed dx/tools companies ($50M+ upfront) included Invitae (three) and Veracyte, Hologic, Exact Sciences and NeoGenomics Laboratories (two each).
*
*
19
12
14
20
17
16
14
21
3
3
8
8
11
9
Private M&A IPO
2015 2016 2017 2018 2019 2020 1H 2021
Market Cap at IPOPrivate M&A UpfrontPrivate M&A Milestones
C) 1H 2021 Post-IPO Performance
A) Device Private M&A Deals & IPOs by Year
HEALTHCARE INVESTMENTS AND EXITS | MID-YEAR REPORT 2021 31
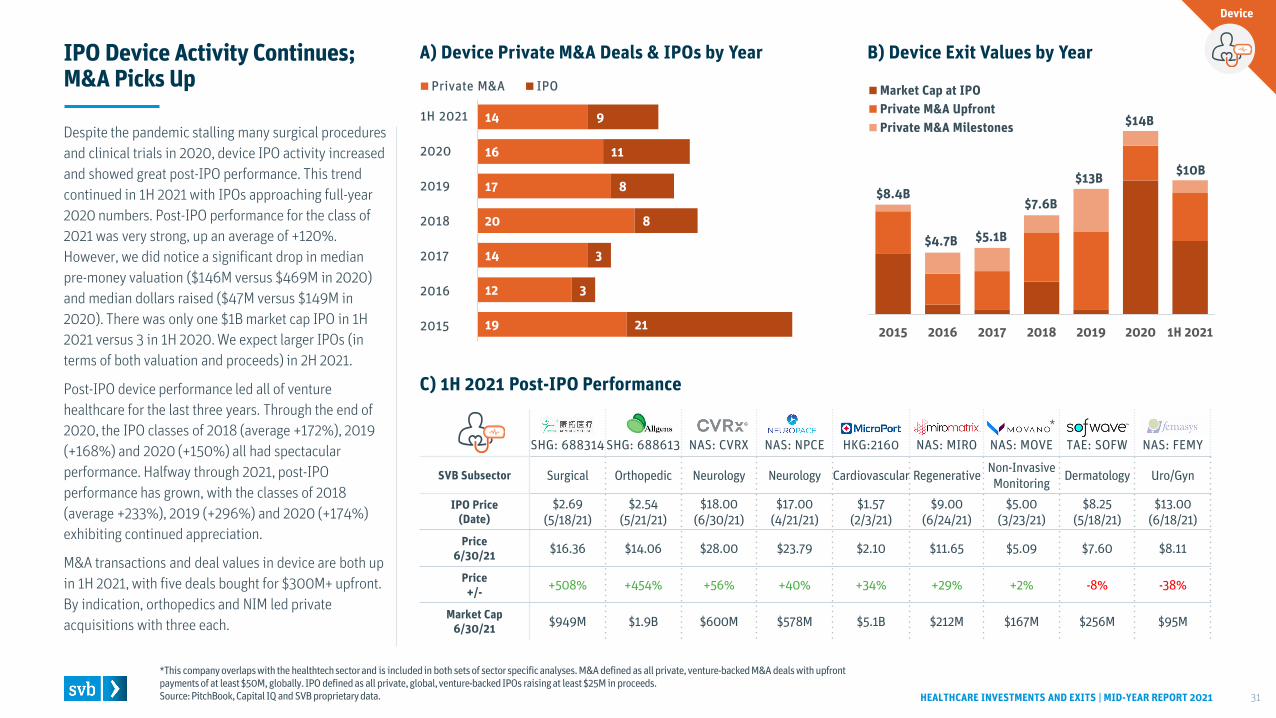
IPO Device Activity Continues; M&A Picks Up
*This company overlaps with the healthtechsector and is included in both sets of sector specific analyses. M&A defined as all private, venture-backed M&A deals with upfront payments of at least $50M, globally. IPO defined as all private, global, venture-backed IPOs raising at least $25M in proceeds.Source: PitchBook, Capital IQ and SVB proprietary data.
B) Device Exit Values by Year
1H 2021
2020
2019
2018
2017
2016
2015
$4.7B $5.1B
$7.6B
$13B
$14B
$8.4B
SHG: 688314 SHG: 688613 NAS: CVRX NAS: NPCE HKG:2160 NAS: MIRO NAS: MOVE TAE: SOFW NAS: FEMY
SVB Subsector Surgical Orthopedic Neurology Neurology Cardiovascular Regenerative Non-Invasive Monitoring Dermatology Uro/Gyn
IPO Price (Date)
$2.69(5/18/21)
$2.54 (5/21/21)
$18.00(6/30/21)
$17.00(4/21/21)
$1.57 (2/3/21)
$9.00(6/24/21)
$5.00(3/23/21)
$8.25(5/18/21)
$13.00(6/18/21)
Price 6/30/21 $16.36 $14.06 $28.00 $23.79 $2.10 $11.65 $5.09 $7.60 $8.11
Price+/- +508% +454% +56% +40% +34% +29% +2% -8% -38%
Market Cap6/30/21 $949M $1.9B $600M $578M $5.1B $212M $167M $256M $95M
Device
$10B
Despite the pandemic stalling many surgical procedures and clinical trials in 2020, device IPO activity increased and showed great post-IPO performance. This trend continued in 1H 2021 with IPOs approaching full-year 2020 numbers. Post-IPO performance for the class of 2021 was very strong, up an average of +120%. However, we did notice a significant drop in median pre-money valuation ($146M versus $469M in 2020) and median dollars raised ($47M versus $149M in 2020). There was only one $1B market cap IPO in 1H 2021 versus 3 in 1H 2020. We expect larger IPOs (in terms of both valuation and proceeds) in 2H 2021.
Post-IPO device performance led all of venture healthcare for the last three years. Through the end of 2020, the IPO classes of 2018 (average +172%), 2019 (+168%) and 2020 (+150%) all had spectacular performance. Halfway through 2021, post-IPO performance has grown, with the classes of 2018 (average +233%), 2019 (+296%) and 2020 (+174%) exhibiting continued appreciation.
M&A transactions and deal values in device are both up in 1H 2021, with five deals bought for $300M+ upfront. By indication, orthopedics and NIM led private acquisitions with three each.
*
2
2
3
3
4
5
3
5
2
2
3
1
4
11
9
13
15
8
7
10
CE Mark
Non-Approved
US Commercial
A) Device Private M&A Deals by Indications
HEALTHCARE INVESTMENTS AND EXITS | MID-YEAR REPORT 2021 32
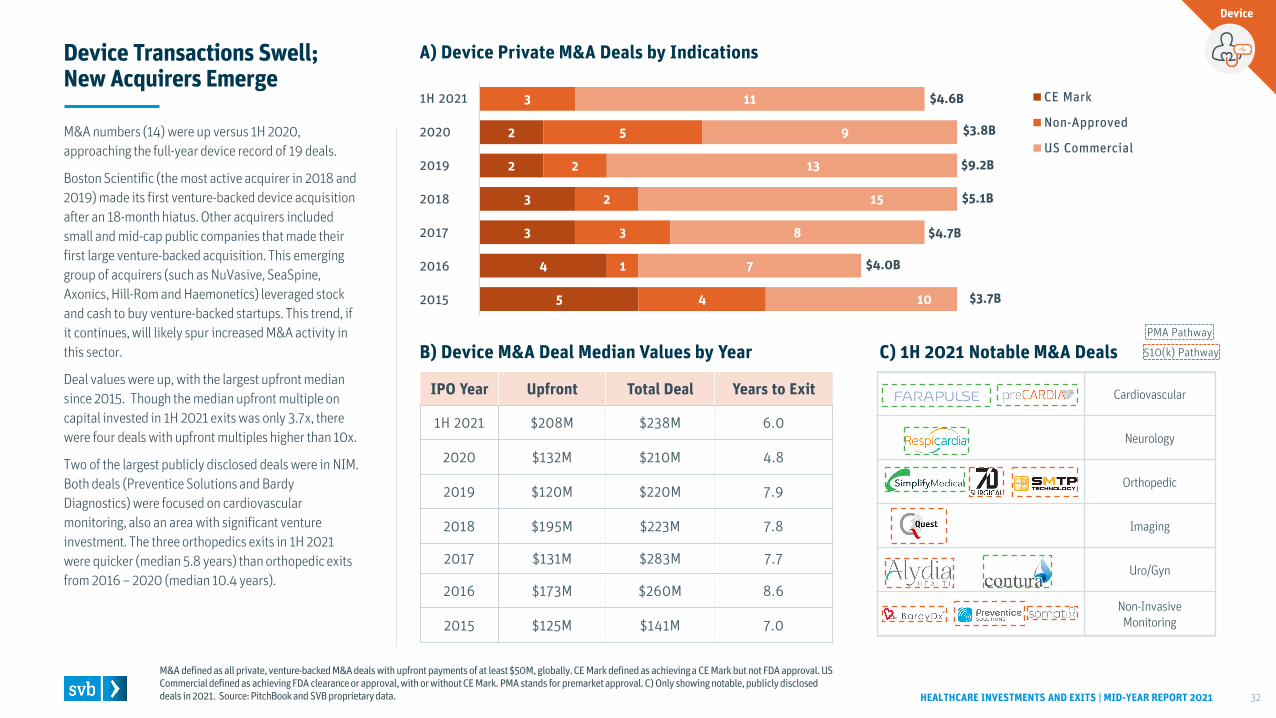
Device Transactions Swell; New Acquirers Emerge
M&A numbers (14) were up versus 1H 2020, approaching the full-year device record of 19 deals.
Boston Scientific (the most active acquirer in 2018 and 2019) made its first venture-backed device acquisition after an 18-month hiatus. Other acquirers included small and mid-cap public companies that made their first large venture-backed acquisition. This emerging group of acquirers (such as NuVasive, SeaSpine, Axonics, Hill-Rom and Haemonetics) leveraged stock and cash to buy venture-backed startups. This trend, if it continues, will likely spur increased M&A activity in this sector.
Deal values were up, with the largest upfront median since 2015. Though the median upfront multiple on capital invested in 1H 2021 exits was only 3.7x, there were four deals with upfront multiples higher than 10x.
Two of the largest publicly disclosed deals were in NIM. Both deals (Preventice Solutions and BardyDiagnostics) were focused on cardiovascular monitoring, also an area with significant venture investment. The three orthopedics exits in 1H 2021 were quicker (median 5.8 years) than orthopedic exits from 2016 – 2020 (median 10.4 years).
M&A defined as all private, venture-backed M&A deals with upfront payments of at least $50M, globally. CE Mark defined as achieving a CE Mark but not FDA approval. US Commercial defined as achieving FDA clearance or approval, with or without CE Mark. PMA stands for premarket approval. C) Only showing notable, publicly disclosed deals in 2021. Source: PitchBookand SVB proprietary data.
B) Device M&A Deal Median Values by Year C) 1H 2021 Notable M&A Deals
$3.7B
$4.0B
$5.1B
$4.7B
$9.2B
$3.8B
1H 2021
2020
2019
2018
2017
2016
2015
PMA Pathway
510(k) Pathway
IPO Year Upfront Total Deal Years to Exit
1H 2021 $208M $238M 6.0
2020 $132M $210M 4.8
2019 $120M $220M 7.9
2018 $195M $223M 7.8
2017 $131M $283M 7.7
2016 $173M $260M 8.6
2015 $125M $141M 7.0
Device
Cardiovascular
Neurology
Orthopedic
Imaging
Uro/Gyn
Non-Invasive Monitoring
$4.6B
HEALTHCARE INVESTMENTS AND EXITS | MID-YEAR REPORT 2021 33
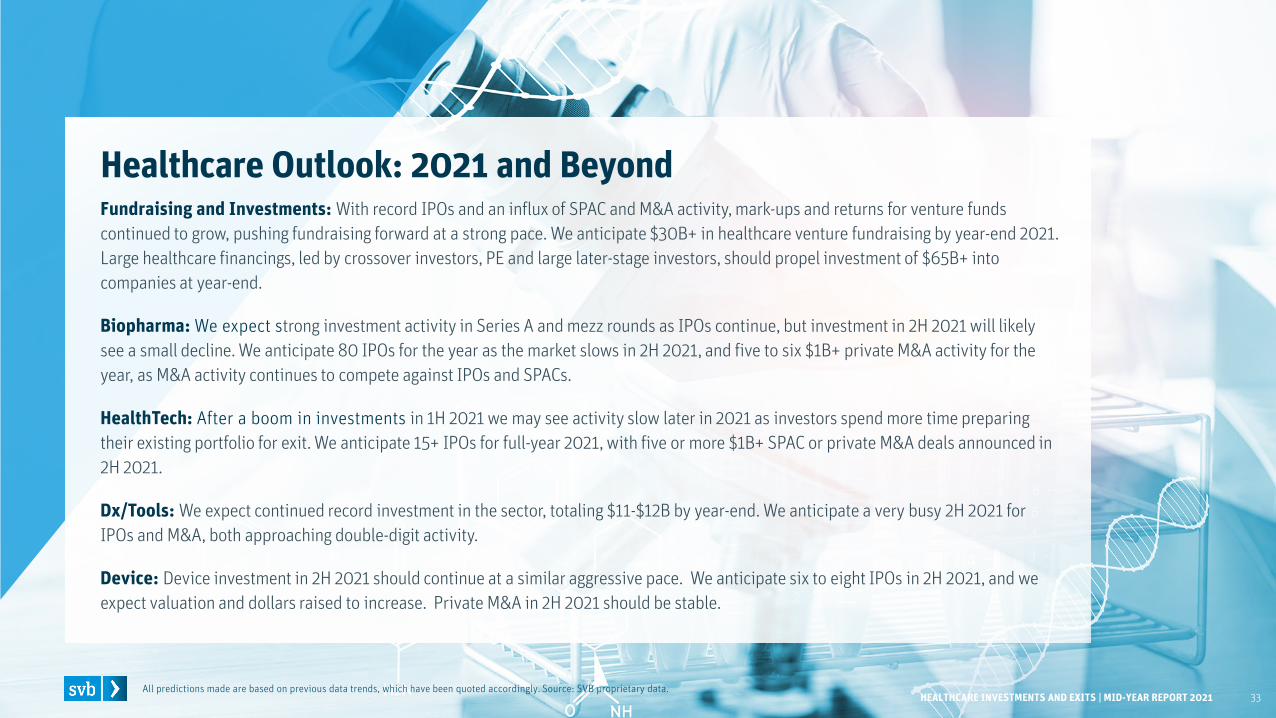
Healthcare Outlook: 2021 and Beyond
All predictions made are based on previous data trends, which have been quoted accordingly. Source: SVB proprietary data.
Fundraising and Investments: With record IPOs and an influx of SPAC and M&A activity, mark-ups and returns for venture funds continued to grow, pushing fundraising forward at a strong pace. We anticipate $30B+ in healthcare venture fundraising by year-end 2021. Large healthcare financings, led by crossover investors, PE and large later-stage investors, should propel investment of $65B+ into companies at year-end.
Biopharma: We expect strong investment activity in Series A and mezz rounds as IPOs continue, but investment in 2H 2021 will likely see a small decline. We anticipate 80 IPOs for the year as the market slows in 2H 2021, and five to six $1B+ private M&A activity for the year, as M&A activity continues to compete against IPOs and SPACs.
HealthTech: After a boom in investments in 1H 2021 we may see activity slow later in 2021 as investors spend more time preparing their existing portfolio for exit. We anticipate 15+ IPOs for full-year 2021, with five or more $1B+ SPAC or private M&A deals announced in 2H 2021.
Dx/Tools: We expect continued record investment in the sector, totaling $11-$12B by year-end. We anticipate a very busy 2H 2021 for IPOs and M&A, both approaching double-digit activity.
Device: Device investment in 2H 2021 should continue at a similar aggressive pace. We anticipate six to eight IPOs in 2H 2021, and weexpect valuation and dollars raised to increase. Private M&A in 2H 2021 should be stable.

HEALTHCARE INVESTMENTS AND EXITS | MID-YEAR REPORT 2021 34
Authors
Jonathan NorrisManaging [email protected]@jonnysvb
Raysa BousleimanSenior AssociateHealthcare [email protected]
Beatriz AtsavapraneeHealthcare [email protected]
Jonathan Norris spearheads strategic relationships with many healthcare VC firms and serial entrepreneurs. In addition, he helps SVB Capital through sourcing and advising on limited partnership allocations and direct investments.
Jonathan speaks at major investor and industry conferences about healthcare VC trends. He has 20+ years of banking experience working with healthcare companies and VC firms.
Jonathan earned a B.S. in business administration from the University of California, Riverside, and a J.D. from Santa Clara University.
Raysa Bousleiman is responsible for conducting data-driven analyses on the global innovation economy that SVB serves. In this role, she supports global research efforts that explore investment, fundraising, and exit dynamics in the venture ecosystem.
Prior to SVB, Raysa worked as a healthcare consultant focusing on health systemsrevenue cycle management and operations.
Raysa graduated from the University of Southern California with honors, receiving a B.S. in human biology.
Beatriz Atsavapranee analyzes data on healthcare venture investments and exits to identify emerging trends and synthesize key takeaways. She also produces deep dives into specific technical areas across a range of subsectors.
Outside of SVB, Beatriz is a Ph.D. candidate at Stanford University. She has more than six years of experience developing new biomedical technologies, from peptide-based therapeutics to microfluidic and bioinformatics tools.
Beatriz earned a B.S. in bioengineering from the California Institute of Technology.
HEALTHCARE INVESTMENTS AND EXITS | MID-YEAR REPORT 2021 35
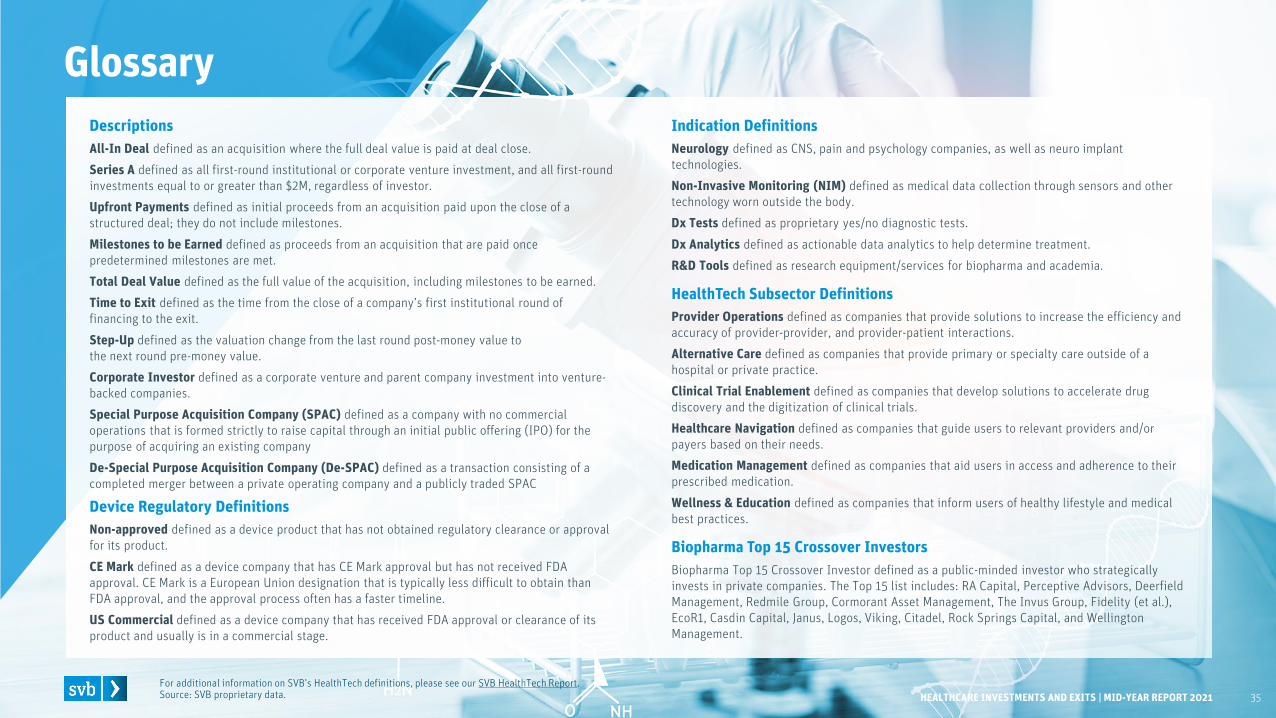
Glossary DescriptionsAll-In Deal defined as an acquisition where the full deal value is paid at deal close.
Series A defined as all first-round institutional or corporate venture investment, and all first-round investments equal to or greater than $2M, regardless of investor.
Upfront Payments defined as initial proceeds from an acquisition paid upon the close of a structured deal; they do not include milestones.
Milestones to be Earned defined as proceeds from an acquisition that are paid once predetermined milestones are met.
Total Deal Value defined as the full value of the acquisition, including milestones to be earned.
Time to Exit defined as the time from the close of a company’s first institutional round of financing to the exit.
Step-Up defined as the valuation change from the last round post-money value to the next round pre-money value.
Corporate Investor defined as a corporate venture and parent company investment into venture-backed companies.
Special Purpose Acquisition Company (SPAC) defined as a company with no commercial operations that is formed strictly to raise capital through an initial public offering (IPO) for the purpose of acquiring an existing company
De-Special Purpose Acquisition Company (De-SPAC) defined as a transaction consisting of a completed merger between a private operating company and a publicly traded SPAC
Device Regulatory DefinitionsNon-approved defined as a device product that has not obtained regulatory clearance or approval for its product.
CE Mark defined as a device company that has CE Mark approval but has not received FDA approval. CE Mark is a European Union designation that is typically less difficult to obtain than FDA approval, and the approval process often has a faster timeline.
US Commercial defined as a device company that has received FDA approval or clearance of its product and usually is in a commercial stage.
Indication DefinitionsNeurology defined as CNS, pain and psychology companies, as well as neuro implant technologies.
Non-Invasive Monitoring (NIM) defined as medical data collection through sensors and other technology worn outside the body.
Dx Tests defined as proprietary yes/no diagnostic tests.
Dx Analytics defined as actionable data analytics to help determine treatment.
R&D Tools defined as research equipment/services for biopharma and academia.
HealthTech Subsector DefinitionsProvider Operations defined as companies that provide solutions to increase the efficiency and accuracy of provider-provider, and provider-patient interactions.
Alternative Care defined as companies that provide primary or specialty care outside of a hospital or private practice.
Clinical Trial Enablement defined as companies that develop solutions to accelerate drug discovery and the digitization of clinical trials.
Healthcare Navigation defined as companies that guide users to relevant providers and/or payers based on their needs.
Medication Management defined as companies that aid users in access and adherence to their prescribed medication.
Wellness & Education defined as companies that inform users of healthy lifestyle and medical best practices.
Biopharma Top 15 Crossover InvestorsBiopharma Top 15 Crossover Investor defined as a public-minded investor who strategically invests in private companies. The Top 15 list includes: RA Capital, Perceptive Advisors, Deerfield Management, Redmile Group, Cormorant Asset Management, The Invus Group, Fidelity (et al.), EcoR1, Casdin Capital, Janus, Logos, Viking, Citadel, Rock Springs Capital, and Wellington Management.
For additional information on SVB’s HealthTech definitions, please see our SVB HealthTech Report.Source: SVB proprietary data.
HEALTHCARE INVESTMENTS AND EXITS | MID-YEAR REPORT 2021 36
Disclaimers This material including, without limitation, to the statistical information herein, is provided for informational purposes only. The material is based in part on information from third-party sources that we believe to be reliable but which have not been independently verified by us, and for this reason, we do not represent that the information is accurate or complete. The information should not be viewed as tax, investment, legal or other advice, nor is it to be relied on in making an investment or other decision. You should obtain relevant and specific professional advice before making any investment decision. Nothing relating to the material should be construed as a solicitation, offer or recommendation to acquire or dispose of any investment or to engage in any other transaction. All non-SVB named companies listed throughout this document, as represented with the various statistical, thoughts, analysis and insights shared in this document, are independent third parties and are not affiliated with SVB Financial Group. Any predictions are based on subjective assessments and assumptions. Accordingly, any predictions, projections or analysis should not be viewed as factual and should not be relied upon as an accurate prediction of future results.
Silicon Valley Bank, an authorized foreign bank branch under the Bank Act (Canada).
SPD, SHANGHAI PUDONG DEVELOPMENT BANK, and 浦发银行有限公司 are trademarks, separately and in combination, of Shanghai Pudong Development Bank, Ltd. in China, and are used under license. SPD Silicon Valley Bank is a Sino-U.S. joint-venture bank of Silicon Valley Bank, the California bank subsidiary and commercial banking operation of SVB Financial Group, and Shanghai Pudong Development Bank.
Silicon Valley Bank is not licensed to undertake banking business in Denmark or to undertake any other regulated activity in Denmark.
Silicon Valley Bank is registered in England and Wales at Alphabeta, 14-18 Finsbury Square, London EC2A 1BR, UK under No. FC029579. Silicon Valley Bank is authorized and regulated by the California Department of Financial Protection and Innovation and the United States Federal Reserve Bank; authorized by the Prudential Regulation Authority with number 577295; and subject to regulation by the Financial Conduct Authority and limited regulation by the Prudential Regulation Authority. Details about the extent of our regulation by the Prudential Regulation Authority are available from us on request.
Silicon Valley Bank Germany Branch is a branch of Silicon Valley Bank. Silicon Valley Bank, a public corporation with limited liability (Aktiengesellschaft) under the laws of the U.S. federal state of California, with registered office in Santa Clara, California, U.S.A. is registered with the California Secretary of State under No. C1175907, Chief Executive Officer (Vorstand): Gregory W Becker, Chairman of the Board of Directors (Aufsichtsratsvorsitzender): Roger F Dunbar. Silicon Valley Bank Germany Branch with registered office in Frankfurt am Main is registered with the local court of Frankfurt am Main under No. HRB 112038, Branch Directors (Geschäftsleiter): Christian Hoppe, Dayanara Heisig.
Silicon Valley Bank and SVB Financial Group UK Limited are not licensed in Ireland to undertake banking business in Ireland or to undertake any other regulated activity in Ireland. SVB Financial Group UK Ltd is registered in England and Wales at Alphabeta, 14-18 Finsbury Square, London EC2A 1BR, UK under No. 5572575.
SVB Israel Advisors Ltd. is a subsidiary of SVB Financial Group. Neither SVB Israel Advisors nor SVB Financial Group is licensed to conduct banking business or provide other financial services in Israel and neither engages in unlicensed banking activities. Banking services are provided by Silicon Valley Bank, a member of FDIC. Silicon Valley Bank is not supervised by the Supervisor of Banks in the Bank of Israel but by the US Federal Reserve Bank and the California Department of Financial Protection and Innovation (DFPI).
If you no longer wish to receive marketing communications from SVB Financial Group or Silicon Valley Bank, you may unsubscribe. Read about our Privacy Policy. If you have any questions or concerns about our privacy policies, please contact us by email [email protected].
© 2021 SVB Financial Group. All rights reserved. SVB, SVB FINANCIAL GROUP, SILICON VALLEY BANK, MAKE NEXT HAPPEN NOW and the chevron device are trademarks of SVB Financial Group, used under license. Silicon Valley Bank is a member of the FDIC and the Federal Reserve System. Silicon Valley Bank is the California bank subsidiary of SVB Financial Group (Nasdaq: SIVB).
About Silicon Valley BankFor nearly 40 years, Silicon Valley Bank has helped innovators, enterprises and their investors move bold ideas forward, fast. SVB provides targeted financial services and expertise through its offices in innovation centers around the world. With commercial, international and private banking services, SVB helps address the unique needs of innovators.
See complete disclaimers on previous page.
© 2021 SVB Financial Group. All rights reserved. SVB, SVB FINANCIAL GROUP, SILICON VALLEY BANK, MAKE NEXT HAPPEN NOW and the chevron device are trademarks of SVB Financial Group, used under license. Silicon Valley Bank is a member of the FDIC and the Federal Reserve System. Silicon Valley Bank is the California bank subsidiary of SVB Financial Group (Nasdaq: SIVB).
#SVBHealthcare @SVBFinancialGroupSilicon Valley Bank@SVB_Financialwww.svb.com


![Trends in Healthcare Investments and Exits 2018...Sep 30, 2017 · [B]: Non-invasive monitoring, orthopedic and neuro companies made up 68% of all Series A funding over the past two](https://img.pdfslide.us/doc/110x75/5f83d011bac08b18f36030df/trends-in-healthcare-investments-and-exits-sep-30-2017-b-non-invasive.jpg)