Embed Size (px)
Citation preview

Healthcare Challenges and Your Career
Presenter:
Ernie Schmid, MSHP 97, FACHE
October 29, 2010
1

Part OneEnvironmental Observations
2
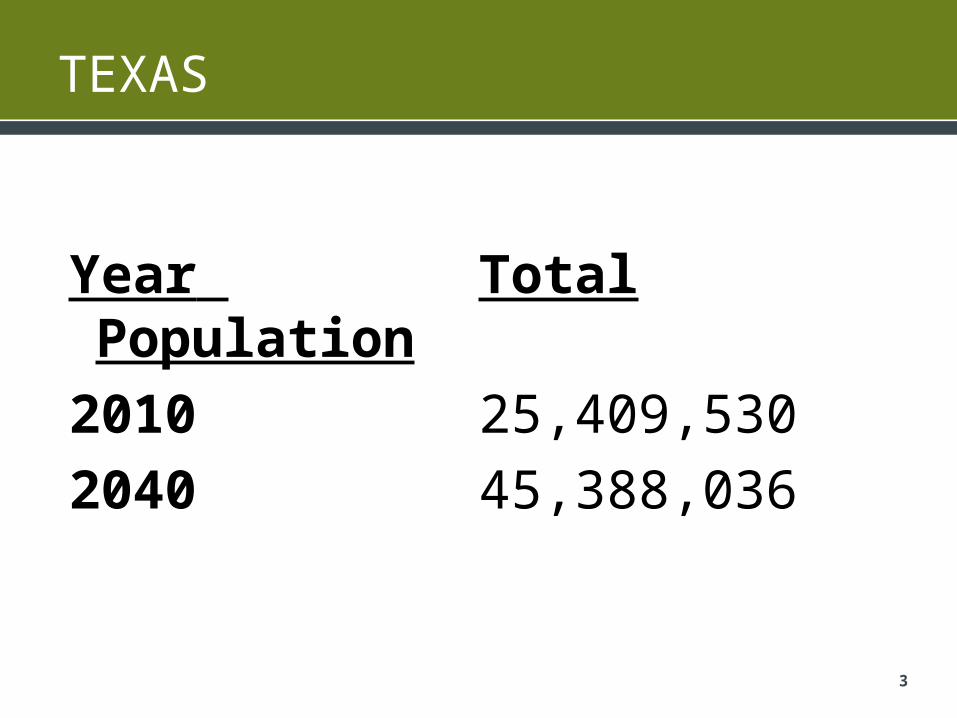
TEXAS
Year Total Population
2010 25,409,530
2040 45,388,036
3
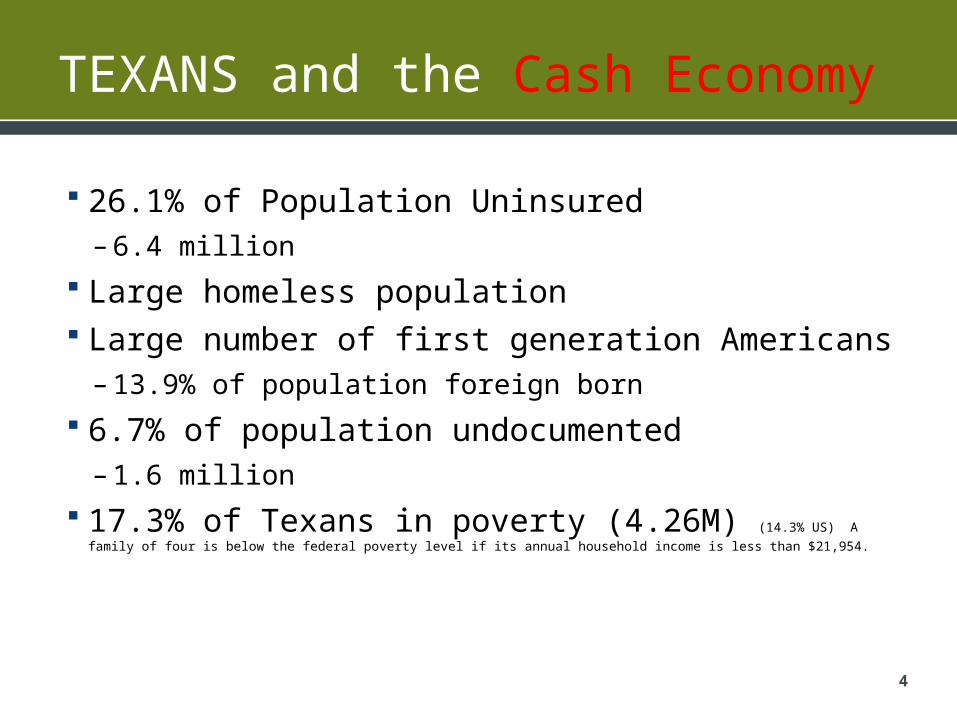
TEXANS and the Cash Economy
26.1% of Population Uninsured– 6.4 million
Large homeless population Large number of first generation Americans
– 13.9% of population foreign born
6.7% of population undocumented– 1.6 million
17.3% of Texans in poverty (4.26M) (14.3% US) A family of four is below the federal
poverty level if its annual household income is less than $21,954.
4
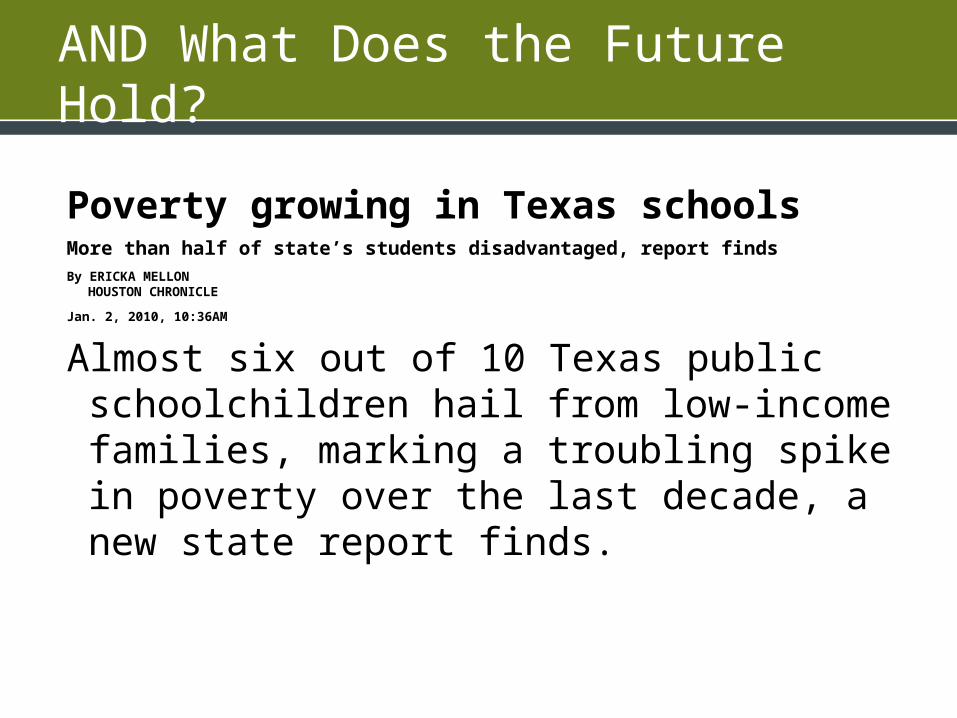
AND What Does the Future Hold?
Poverty growing in Texas schoolsMore than half of state’s students disadvantaged, report findsBy ERICKA MELLON
HOUSTON CHRONICLE
Jan. 2, 2010, 10:36AM
Almost six out of 10 Texas public schoolchildren hail from low-income families, marking a troubling spike in poverty over the last decade, a new state report finds.
AND What Does the Future Hold?
In 2009,Texas ranked sixth in the percentage of people in poverty, behind Mississippi (23.1 percent), Arizona, Arkansas, Georgia and the District of Columbia.
6

US Income Distribution
http://www.census.gov/prod/2010pubs/p60-238.pdf7
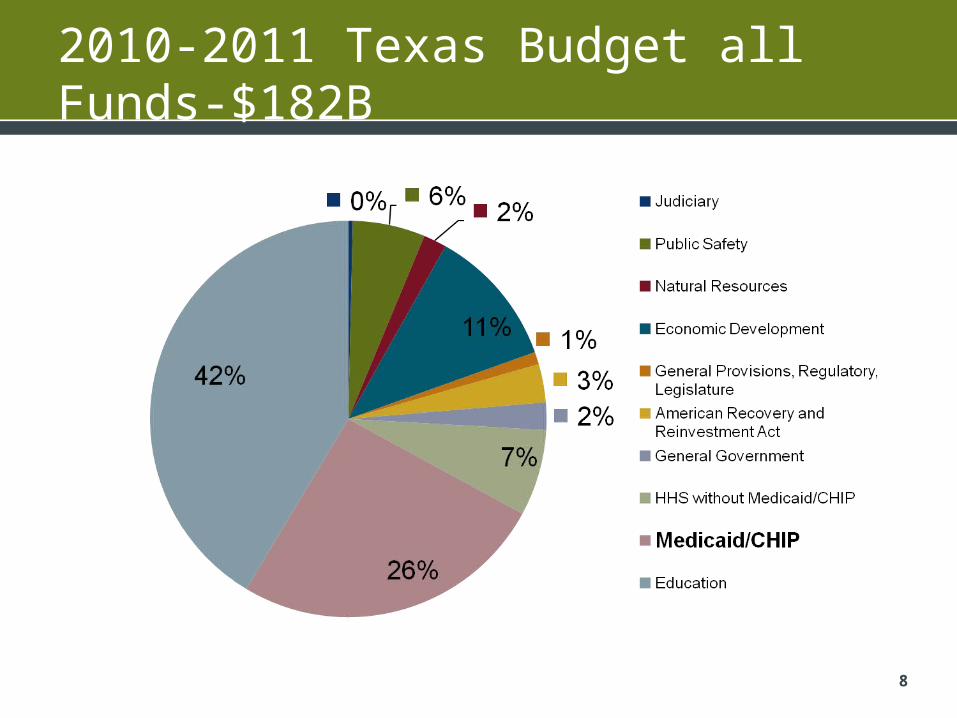
2010-2011 Texas Budget all Funds-$182B
8

Reform and State Budget Over Ten Years
Adds 2.3 M Texans to Medicaid rolls Cost $27 B in GR
9

Current Government Sponsored Health Care
6.4 million uninsured 3.2 million Medicaid Beneficiaries 2.7 million Medicare Beneficiaries .537 million CHIP Participants
At a minimum half the state’s population relies upon government for health care
10

600 TEXAS Hospitals
11

81,000 Hospital Beds
Hospital Beds by Ownership 2007
41%
42%
12%5%
For Profit
Not for Profit
Public
State
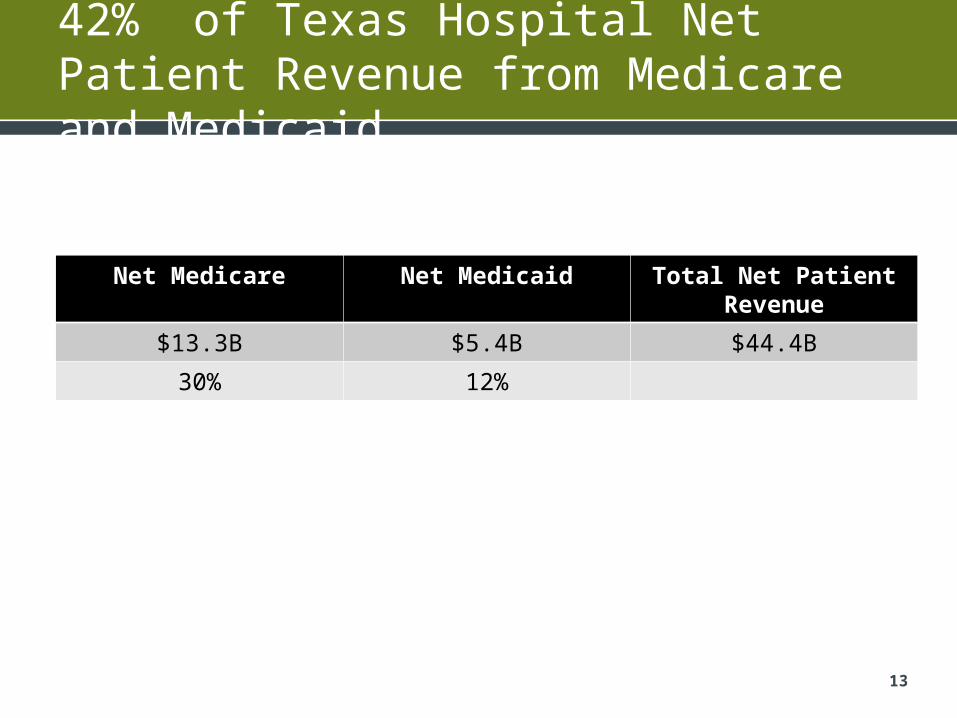
42% of Texas Hospital Net Patient Revenue from Medicare and Medicaid
Net Medicare Net Medicaid Total Net Patient Revenue
$13.3B $5.4B $44.4B
30% 12%
13
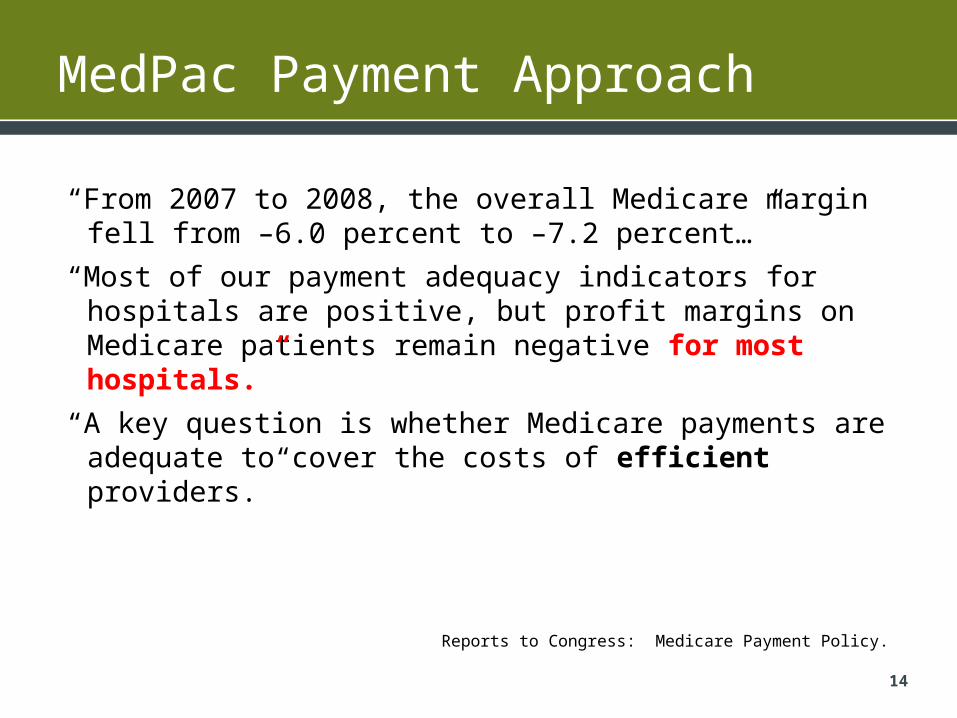
MedPac Payment Approach
“From 2007 to 2008, the overall Medicare margin fell from –6.0 percent to –7.2 percent…”
“Most of our payment adequacy indicators for hospitals are positive, but profit margins on Medicare patients remain negative for most hospitals.”
“A key question is whether Medicare payments are adequate to cover the costs of efficient providers.”
Reports to Congress: Medicare Payment Policy.
14

Medicaid Payments to Texas Hospitals
15
2007 Medicaid Hospital Payment SourcesAll Funds

Government does not pay for all services it mandates
In 1986, Congress enacted the Emergency Medical Treatment & Labor Act (EMTALA) to ensure public access to emergency services regardless of ability to pay. – hospitals must provide a medical screening examination
– Hospitals are then required to provide stabilizing treatment for patients with Emergency Medical Conditions
– If a hospital is unable to stabilize a patient within its capability, or if the patient requests, an appropriate transfer should be implemented.
16

Private or Public?
Government sees hospitals/providers as private enterprises but treat them like public utilities.
Government and providers see each other as bad business partners.
“In 2008, the weighted average of the operating and capital payment updates was roughly 3 percent. (Medicare inpatient costs per discharge increased 5.5 percent in 2008-speakers addition) However, inpatient payments per discharge increased by 4.5 percent. The difference between the update and payment growth was primarily due to reported increases in case mix. “ MedPac March 2010
17
Part TwoReform in Texas
18

REFORM: Quality-Price-Access
19
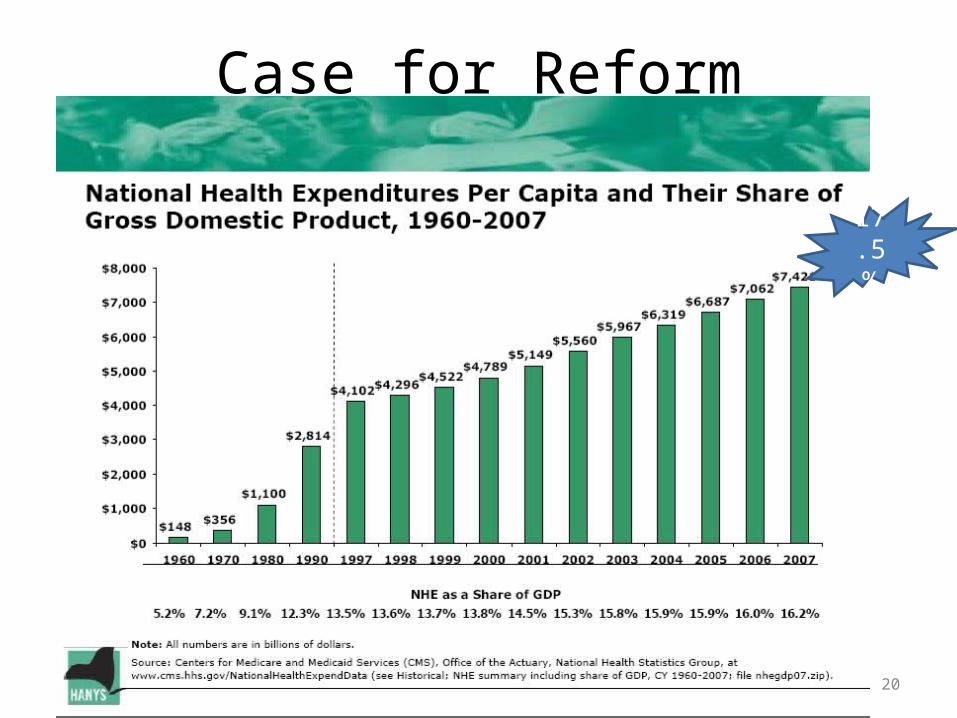
Case for Reform
20
17.5%

Access: Senate Finance
Original Agreement Chairman’s Mark
Coverage all persons in US (including undocumented)
94% 91%
Coverage of all legally residing in US
97% 94%
Left without coverage 18 million 25 million
Hospital reductions $155 billion $155 billion
Reduced uncompensated care
$171 billion $140-$152 billion
21
Access
Medicaid Expansion– State funding
– Eligibility systems
Insurance Subsidy computation—need and subsidy always unsynchronized
Funding during gaps in coverage
22

Access Continued
Coverage goals
–Will goals be reached in Texas?
–What if they are not? Rural provisions support current favorable
provisions but they are not transformative
23
Price
US administrative costs 31% of health care expenditures (16.7% in Canada)
– Stimulus invests $19 B for HIT
Uninsured cause cost shifting?
– 1.6 m undocumented and others who will remain uninsured in Texas
– 25 million uninsured in US-----cost shifting still necessary, but is it possible?
– Future of disproportionate share and UPL payments?
Unsustainable price increases
– Demand will increase in short run
24

Price Continued
Payments– Super MedPac or (IMAC) Independent Medicare
Advisory Commission---base closing model
– Exchanges; negotiated rated or rate setting?
US per capita spending highest among industrial nations– Spending disparities
– Physician referral and ownership
– Liability reform
– End of life care
25

Price: Contributions in Billions—Taxes Roll Downhill
RX $ 80
Medical Device Tax $ 40
Hospital cuts $ 155
Insurance tax $ 60
Lab Tax $ 8
Medicare Advantage $120
Individual Mandates $150
Employer mandates $200
Other $100
Total $90026
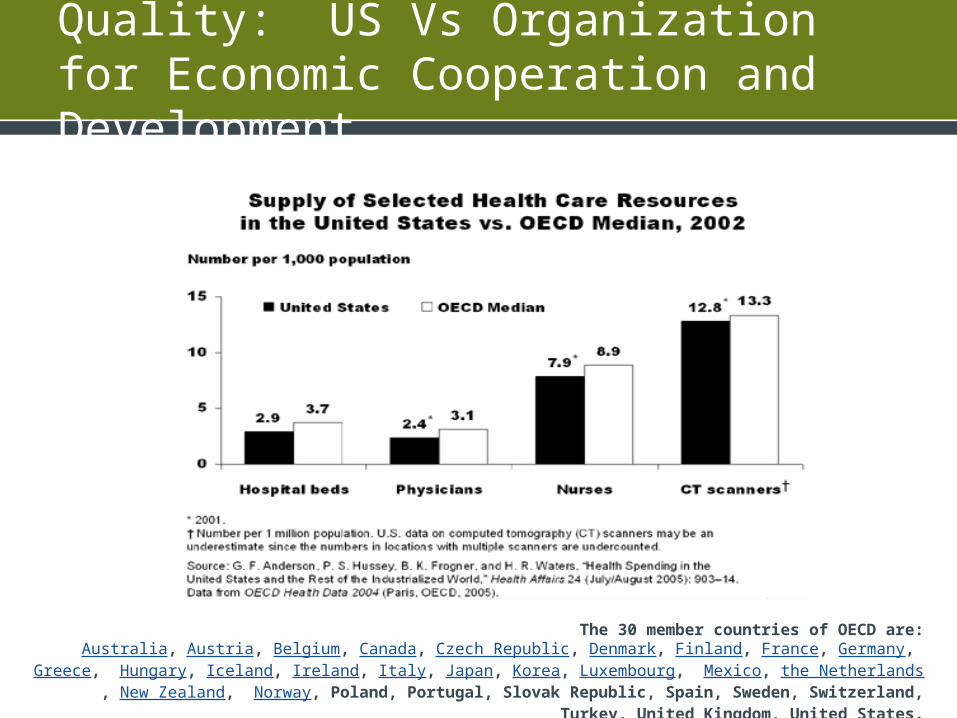
Quality: US Vs Organization for Economic Cooperation and Development
The 30 member countries of OECD are:Australia, Austria, Belgium, Canada, Czech Republic, Denmark, Finland, France, Germany, Greece, Hungary, Iceland, Ireland, Italy, Japan, Korea, Luxembourg, Mexico, the Netherlands, New Zealand, Norway, Poland, Portugal, Slovak
Republic, Spain, Sweden, Switzerland, Turkey, United Kingdom, United States. 27
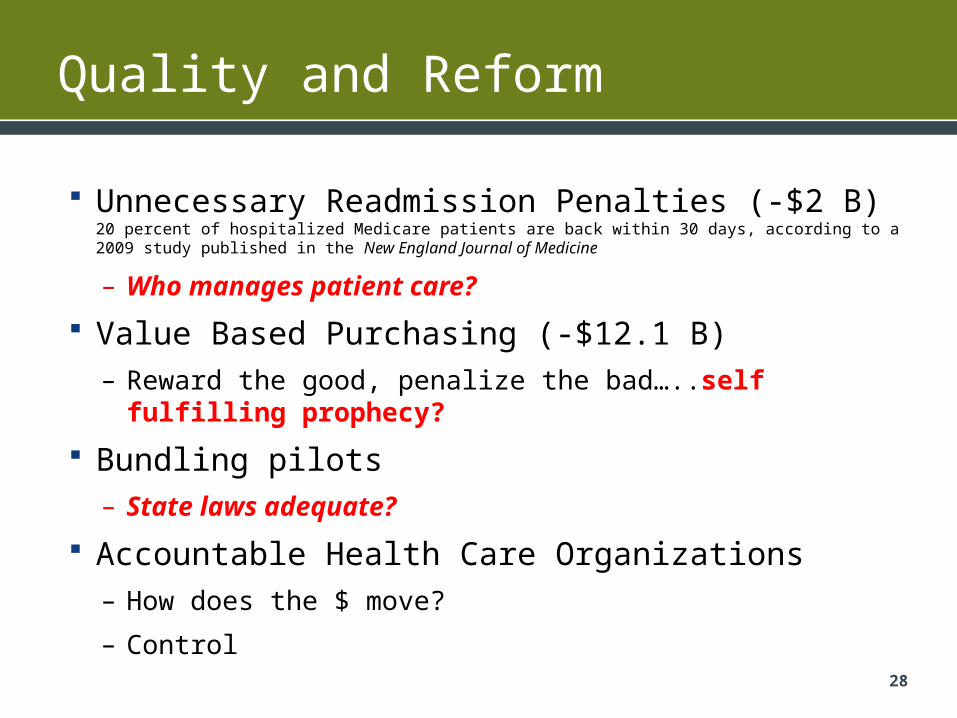
Quality and Reform
Unnecessary Readmission Penalties (-$2 B) 20 percent of
hospitalized Medicare patients are back within 30 days, according to a 2009 study published in the New England Journal of Medicine
– Who manages patient care?
Value Based Purchasing (-$12.1 B)– Reward the good, penalize the bad…..self fulfilling prophecy?
Bundling pilots– State laws adequate?
Accountable Health Care Organizations– How does the $ move?
– Control
28

AND for Texas?
– Will increase in hospital beds keep up with demand?
Where are the investment dollars?
– Will Texas have enough health care workers?
– How will Texas laws need to change?
Corporate practice of medicine prohibition?
Charity care expectations?
– How many Texans will be left uninsured?
– Will State and Local government spend more on health care?
Is tax system adequate for the new demands?
– How will the delivery system change?
Impact on ownership types?
What will happen in rural Texas?
Hospital/Physician incentives aligned?
Access improved. Price and Quality, a work in progress.
29
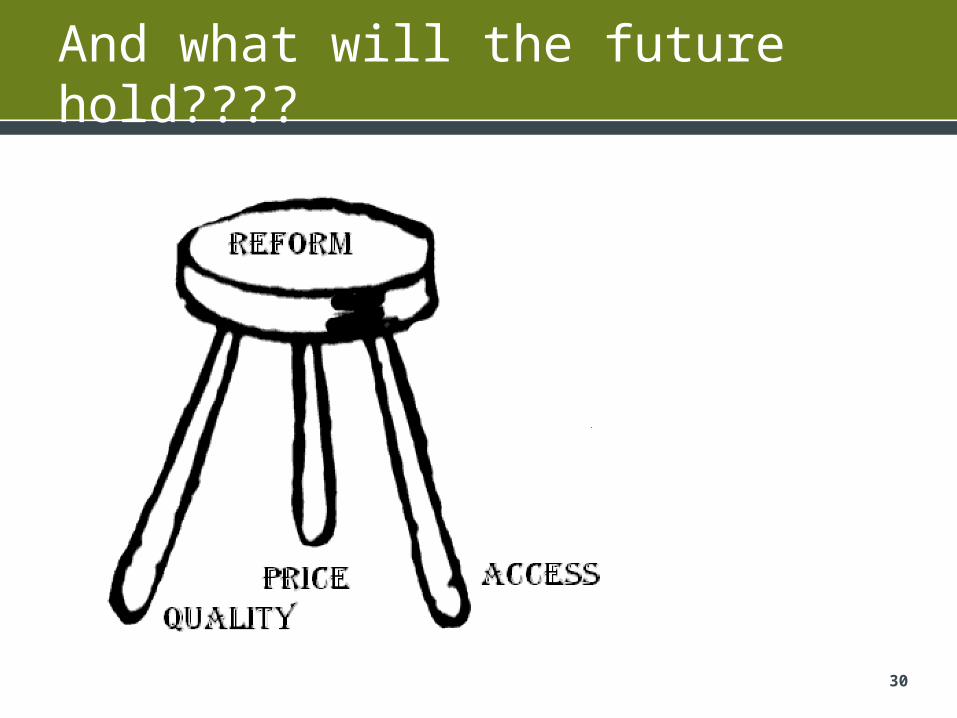
And what will the future hold????
30