Embed Size (px)
Citation preview
Healthcare Associated Infection
(HAI) in Massachusetts Acute Care Hospitals
July 1, 2008 – June 30, 2009
A report by the Executive Office of Health and Human Services
Department of Public Health
April 2010
Massachusetts Department of Public Health Healthcare Associated Infection Report April 14, 2010
1

Questions about this report should be directed to: Eileen McHale, Healthcare Associated Infection Plan Coordinator
99 Chauncy Street Boston, MA 02111
Massachusetts Department of Public Health Healthcare Associated Infection Report April 14, 2010
2

Acknowledgments The Massachusetts Department of Public Health would like to acknowledge the work done by infection prevention professionals throughout the Commonwealth to address the issue of healthcare associated infections. This report is the result of collaboration between healthcare providers, the Bureau of Infectious Diseases Control and Response, the Bureau of Health Care Safety and Quality, the Betsy Lehman Center for Patient Safety and Medical Error Reduction, and many community partners. The Technical Advisory Group has also provided valuable direction and guidance to the Department as we continue in our efforts to reduce healthcare associated infections.
Massachusetts Department of Public Health Healthcare Associated Infection Report April 14, 2010
3

Executive Summary The effects of preventable healthcare associated infections (HAIs) on patients and families, and the associated cost to the healthcare system, have become a prominent national healthcare issue. This report provides the background and history of the Massachusetts Department of Public Health (MDPH) efforts to address the serious public health issue of HAI, data related to HAI in Massachusetts acute care hospitals, and a summary of current and planned work. HAIs are infections that patients acquire during the course of receiving medical treatment for other conditions within a healthcare setting. Massachusetts acute care hospitals have been required to report specific HAI measures to MDPH since July of 2008. Seventy-three hospitals have provided data for this report. One goal of the report is to help consumers better understand HAIs and the work being done to prevent their occurrence. Some of the data highlight individual hospitals and allow comparison of infection rates to national rates. The data is not designed to compare individual hospitals to one another, but is intended to be used over time to monitor trends and to develop targeted improvement strategies. MDPH will use the data to identify issues and to inform public health policy. The selection of measures presented in this report was guided by recommendations of the Centers for Disease Control and Prevention (CDC) who emphasized the importance of considering frequency, severity and preventability of HAIs and the ability to detect and report them accurately. The initial measures that best meet these criteria are central venous catheter blood stream infections (CLABSIs) and surgical site infections (SSIs). Additional measures will be collected from health care providers over time. This is the first report containing hospital-specific data. In future years, additional measures will be reported at the hospital level. This data is self-reported and MDPH will be working with hospitals and the CDC to develop an ongoing program for validating the data. This is the next step in ensuring standardization across hospitals for optimal interpretation. In an effort to raise awareness, promote transparency for healthcare consumers and motivate hospitals to prioritize infection prevention, several states require reporting of selected HAIs to their health authorities and some make this information available to the public. It is important to keep in mind that the goal of public reporting is to influence and improve the quality of care provided in the Commonwealth. To assist the reader with some of the technical terms and abbreviations in this report, we have included a Glossary of Terms and Acronyms, found in Appendix A.
Massachusetts Department of Public Health Healthcare Associated Infection Report April 14, 2010
4

Introduction This report presents information about healthcare associated infections (HAIs) reported by Massachusetts acute care hospitals to the National Healthcare Safety Network (NHSN) during the period July 1, 2008 – June 30, 2009. NHSN is a U.S. Centers for Disease Control and Prevention (CDC) monitoring system that uses consistent national measures. Participation in NHSN allows facilities to monitor HAI internally, and to measure results against national infection rates established by the CDC. NHSN was the reporting system recommended by the HAI 2008 Expert Panel and Massachusetts acute care hospitals were required by regulation to enroll in NHSN by April 1, 2008. HAIs are infections that patients acquire during the course of receiving medical treatment for other conditions within a healthcare setting. HAIs can result from unintentional exposure to bacteria, viruses, fungi or spores caused by transmission from contaminated healthcare workers’ hands, environmental surfaces, patient to patient contact, or staff failure to consistently use accepted prevention practices. They can also be part of the patient’s underlying disease and a biologic problem not related to the health care itself. The information contained in this report represents hospital specific data for the following HAI measures:
Central line associated blood stream infections(CLABSI) in adult intensive care units (ICUs); Central line associated blood stream infections (CLABSI) in pediatric intensive care units (PICUs); Central line associated blood stream infections (CLABSI) in neonatal intensive care units (NICUs); Surgical site infections (SSI) related to hip arthroplasties and; Surgical site infections (SSI) related to knee arthroplasties.
The report also provides aggregate information that does not identify hospitals for:
Surgical site infections (SSI) related to coronary artery bypass graft procedures (CABG); and Surgical site infections (SSI) related to hysterectomies.
Details about each of these measures are provided with the data. This report provides the first hospital specific reporting and analysis of HAIs for acute care hospitals in Massachusetts and offers an overview of the multi-faceted effort underway to address the complex issue of HAI. Seventy-three hospitals provided data for the reporting period of July 1, 2008 through June 30, 2009. A listing of all of the reporting hospitals is in Appendix B. MDPH epidemiologists responsible for data analysis create and review detailed quality assurance reports for each hospital and send the reports to hospitals bi-monthly. The epidemiologists work with hospitals to resolve any issues with the data. Hospital staff have the opportunity to review the hospital’s own data and make the necessary corrections in NHSN as directed. This process provides ongoing guidance to improve the accuracy of the self-reported HAI data. Individual hospitals treat different types of patients and provide different levels and types of care therefore not all hospitals collect and report data for all of the selected measures. The intent of public reporting is to raise awareness, to provide consumers with information to guide healthcare decision-making and to encourage health care providers to reduce the occurrence of HAI. MDPH is committed to not only collecting, analyzing and reporting HAI data but also to providing support for HAI prevention and training activities.
Massachusetts Department of Public Health Healthcare Associated Infection Report April 14, 2010
5
Background In 1999 the Institute of Medicine (IOM) published To Err is Human – Building a Safer Health System, a groundbreaking report that raised awareness of the problems associated with the quality of healthcare in the United States.1 In addition to identifying the significant harm to patients and financial costs associated with medical errors, it highlighted healthcare associated infection (HAI) as an important problem affecting the American healthcare system. This document received widespread attention from the public, the healthcare industry, and state and federal policy-makers and has resulted in an increased focus on improving quality and safety in healthcare including efforts to address HAI. Scope of the Problem The CDC estimates that nearly two million patients develop one or more HAIs which contribute to 99,000 deaths annually 2, making HAI one of the leading causes of death in the United States. Four types of infection account for more than 80% of all infections acquired in the healthcare setting:
catheter associated urinary tract infections (CAUTI); surgical site infections (SSI); ventilator associated pneumonia (VAP) and; central line associated blood stream infections (CLABSI).
These infections not only have a negative personal impact on patients and their families, they are also adding to the nation’s escalating healthcare costs. According to a cost analysis performed in 2007, the annual economic burden of HAI in Massachusetts ranges from $200 to $400 million annually.3 A recent CDC report estimates the U.S. direct medical cost of treating HAI ranges from $35.7 billion to $45 billion annually.4 While the economic burden for healthcare systems and individuals is large, the most difficult cost to measure is the substantial impact these infections have on patients and their families. History of Prevention and Control of HAI in Massachusetts The prevention and control of HAI is a national priority and many individuals, state and federal government agencies, providers, and private organizations are working to meet this healthcare challenge. MDPH is the agency responsible for monitoring diseases and environmental, occupational or chronic conditions throughout the state. State law provides the health department with the legal and regulatory authority to conduct surveillance and investigate the causes of communicable and other infectious disease outbreaks (105 CMR 300). Massachusetts hospitals are also actively involved in HAI reduction activities intended to make care better and safer for patients. All hospitals licensed by MDPH are required to have a hospital-wide program for the prevention, control, and investigation of infectious diseases. These programs are managed by nurses, physicians, medical technologists, and other professionals who have acquired special training in infection control or epidemiology. Since the 1970’s, hospitals have been collecting and analyzing data on HAI and on healthcare practices that have been shown to reduce the risk of HAI. Hospitals routinely collect this data
1 National Academy of Science, Institute of Medicine. To Err is Human: Building a Safer Health System. Kohn L, Corrigan J, Donaldson M, eds. 1999. 2 Klevens RM, Edwards JR, Richards CL Jr. et al. Estimating Health Care-Associated Infections and Deaths in U.S. Hospitals, 2002. Public Health Rep. 2007; 122: 160-6. www.cdc.gov/ncidod/dhqp/pdf/hicpac/infections_deaths.pdf 3 http://www.mass.gov/Eeohhs2/docs/dph/patient_safety/haipcp_final_report_pt1.pdf http://www.mass.gov/Eeohhs2/docs/dph/patient_safety/haipcp_final_report_pt2.pdf 4 http://www.cdc.gov/ncidod/dhqp/pdf/Scott_CostPaper.pdf
Massachusetts Department of Public Health Healthcare Associated Infection Report April 14, 2010
6

to track internal performance, analyze institution-specific quality improvement, monitor trends within their facilities and target interventions for prevention and control. In Massachusetts’ landmark Health Reform Law, Chapter 58 of the Acts of 2006, a provision directed the MDPH Division of Health Care Quality to develop a Statewide Infection Prevention and Control Program. Program development was guided by an HAI Expert Panel that conducted a comprehensive assessment of the key issues surrounding HAI and formulated a substantial set of evidence-based recommendations and best practice guidelines including the public reporting of HAI measures by hospitals. Following the recommendations of the Expert Panel, the Public Health Council adopted an amendment to hospital licensure requiring acute care hospitals to report specific HAI related data beginning July 1, 2008. A preliminary report of four months of aggregate data was released by MDPH in April 2009.5 Chapter 58 also established the Health Care Quality and Cost Council (HCQCC), a mandated entity charged with identifying statewide goals for improving health care quality, containing health care costs, and reducing racial and ethnic disparities in health care. The Council receives input and advice from an Advisory Committee that includes representation from consumers, business, labor, health care providers, and health plans. Among the Council’s specific strategies is the public reporting of HAIs and serious reportable events. MDPH Commissioner John Auerbach serves as a member of the Council. A timeline of the development of the Massachusetts Infection Prevention and Control Program and the reporting and monitoring of HAIs is found in Appendix C. HAI Expert Panel Beginning in 2006, in collaboration with the Betsy Lehman Center for Patient Safety and Medical Error Reduction, MDPH brought together a panel of experts and key stakeholders to make recommendations for a statewide infection prevention and control program, including the potential reporting of HAI measures by hospitals. With the assistance of JSI Research and Training Institute, six Task Groups and an ad hoc pediatric subcommittee, involving additional local and national experts, reviewed available evidence and developed specific proposals for prevention and reporting of HAI. The final report of the Expert Panel was presented to MDPH and the Lehman Center on January 31, 2008. The information in this report provided the framework for the Statewide Infection Prevention and Control Program. The full report and recommendations can be found at www.mass.gov/dph/dhcq The HAI Expert Panel Report: Prevention and Control of Healthcare-Associated Infections in Massachusetts was also published by the Agency for Health Research and Quality’s National Guideline Clearinghouse™ (NGC)6. The NGC is a public resource for evidence-based clinical practice guidelines. Technical Advisory Group Following completion of the work of the HAI Expert Panel, an aggressive program to implement the recommendations began. In addition to the broad dissemination of the evidence-based recommendations and the adoption of mandatory reporting, a multidisciplinary HAI Technical Advisory Group (TAG) was established to advise MDPH on all aspects of the statewide HAI Prevention and Control Program. The TAG initially met in April 2008, and is chaired by the State Epidemiologist. The group’s membership also includes hospital epidemiologists, infection preventionists, consumers and advocates, quality improvement professionals, representatives of insurers, and the hospital association. The TAG has provided ongoing guidance on all HAI issues including the results of reports and surveys, the application of surveillance and
5 http://www.mass.gov/Eeohhs2/docs/dph/quality/healthcare/hai_prelim_report.pdf
Massachusetts Department of Public Health Healthcare Associated Infection Report April 14, 2010
7
6 www.guideline.gov

control methods and the presentation of the results to healthcare providers and the public. The TAG meets quarterly and all meetings are open to the public. A full listing of TAG members and affiliations can be found in Appendix D. Data Reporting Process In 2008, licensure regulations for acute care hospitals were revised to incorporate requirements for reporting of HAI to MDPH and the Betsy Lehman Center (105 CMR 130.1701). Beginning July 1, 2008, hospitals were mandated to report central line associated blood stream infections (CLABSI) and surgical site infections (SSI) occurring as a result of selected orthopedic, cardiac and gynecological procedures to MDPH and the Betsy Lehman Center. The primary platform for data submission is the CDC’s NHSN. A preliminary aggregate report of NHSN data, representing the first 4 months of CLABSI and SSI reporting, was released by MDPH April 2009.7 In summary, the data are submitted to NHSN, quality assurance reports are created by MDPH epidemiologists and reviewed with the hospitals, and the hospitals may make corrections. In the next phase of Massachusetts’ HAI work, there will be an additional data validation process, involving chart review and additional work with hospitals in detecting HAI. National Healthcare Safety Network (NHSN) All infections reported to NHSN must meet the standard definition of an HAI: A localized or systemic condition resulting from an adverse reaction to the presence of an infectious toxin(s) and there must be no evidence that the infection was present or incubating at the time of admission to the care setting. Clinical evidence may be derived from direct observation of the infection site or review of information in the patient chart or other clinical records.8 Participation in NHSN requires a considerable commitment by each hospital. Qualified infection preventionists (IPs) conduct HAI surveillance. IPs are professionals trained in nursing, microbiology, epidemiology or medical technology who have obtained additional education in infection prevention and control. Data entry can only be performed by NHSN users who have completed training on the CDC definitions and surveillance methodology and all protocols must be followed exactly. This provides a rigorous national and state standard of consistent collection of comparable data. Once data is entered it is immediately available to hospitals, NHSN, and MDPH for viewing, analysis and editing. Hospitals are authorized to view only their own facility or group specific information. When collecting HAI data, facilities must enter information on all of the required procedures not just procedures resulting in infection. This means detailed information must be reported for every patient undergoing a procedure under surveillance in a hospital not just the small number of patients who develop infections. Although not originally established as a system for mandatory reporting, twenty one states are currently using or planning to use NHSN to fulfill these requirements. CDC made NHSN available to all United States healthcare facilities at no charge in June, 2007 and is currently collecting data from more than 2400 facilities in all fifty states.
7 http://www.mass.gov/Eeohhs2/docs/dph/quality/healthcare/hai_prelim_report.pdf 8 http://www.cdc.gov/nhsn/PDFs/pscManual/2PSC_IdentifyingHAIs_NHSNcurrent.pdf
Massachusetts Department of Public Health Healthcare Associated Infection Report April 14, 2010
8

Additional HAI Reporting In addition to reporting specific HAI measures to MDPH through NHSN, there are two data collection initiatives underway that utilize alternative systems for data submission. All acute care Massachusetts hospitals are currently collecting a uniform set of data on influenza vaccination rates of hospital personnel and have participated in a methicillin-resistant Staphylococcus aureus (MRSA) point prevalence survey for patients in intensive care units. Influenza Vaccination Reporting Influenza (the flu) is a contagious respiratory illness caused by influenza viruses. The most effective method of preventing influenza virus infection and its potentially serious complications is to immunize. The majority of health care workers have not been vaccinated against seasonal flu in the past, despite the recommendation of numerous professional agencies and organizations including the CDC, the National Foundation for Infectious Diseases (NFID), the Infectious Diseases Society of America (IDSA) and The Joint Commission. According to the CDC, only 44% of health care workers received influenza vaccine during the 2006-2007 season.9 Influenza vaccination provides protection for workers in health care settings and reduces risk in the patients they care for. To gain a better understanding of the current rate of vaccine coverage and to evaluate the merit of this measure for public reporting, during the 2008-09 influenza season, MDPH required acute care hospitals to report their success in providing influenza vaccine to health care workers to the Betsy Lehman Center for Patient Safety. Data were reported at two time points, January 31, 2009 and March 31, 2009. The information was used to assess the reliability of the measure and the comparability across hospitals. Rates submitted for individual hospitals during this period were not made public but were used to inform policy changes implemented during the 2009-2010 influenza season. Slight modifications were made to the methodology for collecting this data for the 2009-2010 influenza season. Acute care hospitals are now required, pursuant to regulations promulgated in the fall of 2009, to report seasonal influenza vaccination rates of hospital personnel to MDPH no later than April 15, 2010. Analysis of this data will be made available to the public in a report to be issued by the fall of 2010. Methicillin-resistant Staphylococcus aureus (MRSA) Point Prevalence MRSA is a type of Staphylococcus aureus (“staph”) bacteria that is resistant to some kinds of antibiotics. There has been increasing attention to MRSA from healthcare professionals and the media. Experts in the field agree that understanding the burden of MRSA is important when trying to decide how to try to prevent or control it in a facility. Point prevalence surveys measure the proportion of people in a specific group who have a disease or condition at a particular time. It provides a snapshot of the disease at a point in time. Point prevalence surveys are valuable tools that hospitals can use to estimate their overall MRSA problem. As part of the Infection Prevention and Control Program, MDPH required all acute care hospitals to complete a one day collection of MRSA nasal cultures during the week of September 15-19, 2008 for patients in ICUs and report the information to the Betsy Lehman Center for Patient Safety. The preliminary findings from the first survey did not signal a need for procedural changes, but following consultation with the TAG, it was recommended that the survey be repeated to provide a second round of data collected. Neonatal intensive care units (NICUs) were excluded from the second screening survey due to low MRSA rates observed in the 2008 survey. All acute care ICUs excluding NICUs were required to report MRSA
9
CDC Prevention and Control of Influenza: Recommendations of the Advisory Committee on Immunization Practices (ACIP), 2009.MMWR 2009; 58(Early Release):1-52
Massachusetts Department of Public Health Healthcare Associated Infection Report April 14, 2010
9
point prevalence conducted on a single day during the week of September 14-18, 2009 to MDPH. Analysis of this data is underway and a brief report will be issued by fall 2010. Massachusetts Data: July 1, 2008 – June 30, 2009 Using this Data – Important Information to Consider It is important to consider the following when reviewing the data presented in this report:
The overall quality and safety of a hospital should not be determined by the single measure of HAI. Many factors contribute to a hospital’s quality of care.
Age, underlying illnesses, and severity of disease place some patients at higher risk for infection. This data should not be used to compare hospitals. Results are affected by the types of patients
treated in a hospital, the variety of services provided by the hospital, the intensity of surveillance efforts, and the interpretation of surveillance criteria, all of which can differ from hospital to hospital and make comparisons misleading.
Hospitals that treat more complex patients with greater risk for infection may have higher rates. Sometimes high rates are based on small numbers, so both the number and the rate should be
reviewed. The term “expected infections” is used in some of the data tables. This is a statistical term that
predicts the number of infections a hospital would have, if that hospital had exactly the same infection rate as the national average.
A higher rate of infection may indicate a true problem or simply better surveillance. A lower rate may reflect fewer infections, fewer high risk patients, or different levels of infection surveillance.
Data submission was evaluated for completeness and accuracy, but, a formal process for data validation was not possible for this reporting period. An initiative to develop, pilot test and implement a statewide validation plan is currently under development and will be described in greater detail later in the report.
A glossary is included as Appendix A to help in understanding some of the abbreviations and terms
in this report. NHSN definitions are used throughout this report. It should be noted that NHSN’s definition of a major teaching hospital is different from definitions used in other contexts.10 Standardized Infection Ratio (SIR) The standardized infection ratio (SIR) is a measure that is used to compare how a single hospital’s rates of infection compare to a ‘gold standard’. In this case, that standard is the national rates reported by CDC in their annual report. The SIR compares the actual number of events at each hospital to an expected number of events. The expected number of events is calculated based on the national average rates of infection multiplied by the number of days people had a central line at the hospital or how many surgeries the hospital performed. If the SIR is 1, there is no difference between the number of events at the location in question and the national average. If the number is less than 1, there were fewer events at that location than expected, and if the number is above 1 there were more events at that location than expected.
10 http://www.cdc.gov/nhsn/PDFs/dataStat/2009NHSNReport.PDF
Massachusetts Department of Public Health Healthcare Associated Infection Report April 14, 2010
10

The national average rates of infection are reported separately, or stratified, according to locations where a person is being cared for or characteristics of the patient or the surgery such as how long the surgery took to perform or how sick a person was before they had the surgery, as these characteristics change the risk of someone getting an infection. The tables below are similarly stratified to provide a proper comparison. The SIR is calculated as:
Actual Number of Infections Expected Number of Infections
Standardized Infection Ratio (SIR) = This is a standard ratio that can be used to compare hospital performance over time. It is not designed to explicitly compare hospitals to one another. How do we evaluate the SIR: Statistical Significance and Confidence Intervals? As mentioned above, we use the SIR to compare Massachusetts hospitals to the national averages. A SIR of 1 would indicate that a hospital is doing the same as the national average. However, what does an SIR of 1.7 mean? Looking at the interpretation above, the hospital has more events than expected, but is it a lot more? To answer this question, we use statistical testing to determine if that difference has meaning or if the variation may be due to chance. Throughout the data section the terms “statistically significant” or “statistically different” will appear to indicate when the number of infections is different in a meaningful way from the number expected on the basis of the national average rate applied to the number of procedures or catheter days. We use these tests because the national average is really an estimate. NHSN does not capture every infection in every hospital in the United States. In addition, while we try to account for some things that put a patient more at risk for infection, the system does not capture every detail about every person. Each patient and location has a different set of risks that cannot fully be accounted for in the calculation of the SIR. Statistics provide us with some tools to interpret variability. We are able to calculate a range for the SIRs for which we are 95% confident that the true value would fall into if we could take everything into account. We call this a 95% confidence interval. If the value 1 falls within this range, we say that the actual value is not statistically significantly different. If the range does not include 1 then the actual value is statistically significantly different from 1. The 95% confidence interval is largely based on the underlying sample, in this case, the number of central line days or the number of surgeries in a given location. With a larger sample, the confidence interval is narrower because the estimate is based on more observations. The goal of all hospitals in Massachusetts is zero infections. Some hospital locations have reported no infections during this initial reporting period. There could be many explanations for why other hospitals have reported one or more infections. It may not be due to any different infection control methods used, but rather because of the different types of patients, the conditions for which they are treated, and specialized levels of care required. It is also important to note that the data included in this report was collected over a relatively short time period, and that even a single infection makes a significant impact on the rates reported. One of the next steps for our program is to work with hospitals on validating the data and help them to continue to improve their processes for identifying and reporting infections.
Massachusetts Department of Public Health Healthcare Associated Infection Report April 14, 2010
11

Hospital Characteristics Seventy-eight Massachusetts hospitals reported data to NHSN in the reporting period, and selected results from the seventy-three acute care sites are reported here. (Hospitals not included in this report do not meet the definition of acute care hospitals; they are state, non-acute facilities or specialty care centers). Most acute care hospitals reporting are general hospitals; two are children’s hospitals and one is an orthopedic specialty hospital. The hospitals nearly all operate as not-for-profit; 6 are owned and operated by for-profit organizations (8%). Forty-four percent of the hospitals had at least limited teaching status, with 26% being major teaching hospitals. A major teaching hospital is defined here as a facility that is an important part of the teaching program of a medical school and where the majority of medical students rotate through multiple clinical services. This is an NHSN definition and is different from definitions often used in other contexts.11 Nearly half of the hospitals have fewer than 100 beds; 10 have more than 300. Table 1. Number of Hospitals by Bed Size
Bed Size Category Number of Hospitals
<100 beds 31
100-199 beds 21
200-299 beds 10
300+ beds 11 A smaller number of beds will result in a smaller number of patient days, which impacts the rates of infection calculated. One additional infection at a hospital with a smaller number of beds will have a much greater impact on infection rate than one additional infection at a larger hospital. This is important to keep in mind when looking at a hospital’s data. Infection Preventionists (IPs) IPs play a critical role in preventing infections and are part of the team that analyzes the root cause of HAI. As their name suggests, infection preventionists are staff members at hospital facilities, both inpatient and outpatient, who oversee infection prevention and control efforts. They are most commonly nurses, but can also have backgrounds in other areas such as microbiology. Although the infection prevention and control program guides the effort, reducing the risk of HAIs is a hospital-wide responsibility, requiring teamwork and a multidisciplinary approach. Preventing HAIs must be a hospital priority and part of the overall institutional commitment to improvement including senior leadership involvement to ensure the allocation of resources to address HAIs. The expert panel reviewed infection preventionist staffing and noted that the number of beds per infection preventionist at that time was higher than a recent national report’s suggested ratio of 125 beds per infection control preventionist. Particularly in the larger hospitals, the number of beds per infection preventionist remains higher than these recommendations.
11 http://www.cdc.gov/nhsn/PDFs/dataStat/2009NHSNReport.PDF
Massachusetts Department of Public Health Healthcare Associated Infection Report April 14, 2010
12

Table 2: Beds per 1 Full Time Equivalent (FTE) of Infection Preventionists by Bed Size Category
Beds per 1 FTE Infection Preventionist Bed size category
Mean Median Minimum Maximum
<100 beds 43 30 7 99
100-199 beds 132 149 28 189
200-299 beds 216 234 101 270
300+ beds 203 164 99 343 Central Line Associated Blood Stream Infection (CLABSI) A central venous catheter (CVC), sometimes known as a central line, is a special type of flexible tube that is placed into a large vein in the chest, arm, neck or groin and ends at or close to the heart or one of the great vessels. In newborns, the umbilical artery or vein is considered a great vessel. CVCs are used to administer fluids, nutrition, chemotherapy, antibiotics, blood and blood products, to monitor the cardiovascular system, for hemodialysis or to draw blood. They are an essential part of caring for a critically ill person, but their use also potentially places patients at increased risk for serious infections. Central line associated bloodstream infections (CLABSI) are bloodstream infections occurring in a patient that had a central line within the 48 hour period before the development of the infection.12 They are sometimes also referred to as a central venous bloodstream infections, or CVC-BSI. CDC provides definitions of three different types of CLABSI, called Criterion 1, Criterion 2, and Criterion 3. An estimated 248,000 bloodstream infections occur in U.S. hospitals each year.13 The cost to the healthcare system is approximately $25,000 per episode.14 CLABSIs can be prevented through proper insertion and care of the central line. All Massachusetts acute care hospitals are required to monitor and report CLABSIs occurring in all patients receiving treatment in ICUs. Patients requiring intensive care are usually sicker, require complex treatment and are at highest risk for HAI. 15 There are many different types of ICUs, each with different types of patients. Not all hospitals have each type of ICU. Examples include medical, cardiac, trauma, and neurosurgical. Each type of ICU differs in how frequently they use central lines, which contributes to risk for infection; greater use of central lines means more opportunity for infections to occur in that ICU. Identifying and classifying CLABSIs can be complex and relies upon the healthcare provider to interpret signs, symptoms, and test results. The definitions and some simple examples follow. Real-life cases are often more complicated. A summary of the definitions can also be found in Appendix E.
12 http://www.cdc.gov/nhsn/PDFs/pscManual/4PSC_CLABScurrent.pdf 13 Klevens RM, Edward JR, et al. Estimating Health Care-Associated Infections and Deaths in U.S. hospitals, 2002. Public Health Reports 2007; 122:160-166. 14 Centers for Disease Control and Prevention. Guidelines for the Prevention of Intravascular Catheter-Related Infections. MMWR Morb Mortal Wkly Rep. 2002; 51(RR- 10):3–36.
Massachusetts Department of Public Health Healthcare Associated Infection Report April 14, 2010
13
15 Klevens RM, Edward JR, et al. Estimating Health Care-Associated Infections and Deaths in U.S. hospitals, 2002. Public Health Reports 2007; 122:160-166.
In a criterion 1 infection, the patient has a recognized “true” pathogen cultured from one or more blood cultures and the organism cultured from blood is not related to an infection at another site. For example: Mr. Smith is a patient in Hospital A’s surgical intensive care unit (ICU) and has a central line in place. Blood is drawn and tested. The results show an infection caused by an organism called Staphylococcus aureus, which is a true pathogen. Mr. Smith does not have infection at any other body site. Mr. Smith’s case meets all of the requirements for a criterion 1 CLABSI. Criterion 2: The patient has at least one of the following signs or symptoms: fever >38°C (>100.4°F), chills, or hypotension and signs and symptoms and positive laboratory results are not related to an infection at another site, with a common skin microorganism (i.e., diphtheroids [Corynebacterium spp.], Bacillus [not B. anthracis] spp., Propionibacterium spp., coagulase-negative staphylococci [including S. epidermidis], viridans group streptococci, Aerococcus spp., Micrococcus spp.) is cultured from two or more blood cultures drawn on separate occasions. For example: Ms. Doe is in Hospital B’s medical ICU. She has a central line in place. She has a fever of 101oF (38. 3°C). Blood is drawn and tested. The results show Staph coag negative in the blood. This organism is normally found on the skin, but has the potential to cause infections. In order to see if this might be a criterion 2 infection, one day later more blood is drawn and tested. The second blood sample also finds Staph coag negative. She has no other infections at other sites. Ms. Doe now meets the definition of a criterion 2 infection. As you can see, Ms. Doe has an organism in her blood that is normally found on the skin. She was required to have two blood cultures, in order to be sure that the blood sample was not contaminated when it was being collected. Criterion 3 characteristics are similar to criterion 2 infections, but apply only to patients less than 1 year of age. The patient must have has at least one of the following signs or symptoms: fever (>100.4oF core), hypothermia (96.8oF core), apnea, or bradycardia. The signs and symptoms and positive laboratory results are not related to an infection at another site and common skin contaminant (i.e., diphtheroids [Corynebacterium spp.], Bacillus [not B. anthracis] spp., Propionibacterium spp., coagulase-negative staphylococci [including S. epidermidis], viridans group streptococci, Aerococcus spp., Micrococcus spp.) is cultured from two or more blood cultures drawn on separate occasions. In this report, criterion 1 CLABSIs are presented separately, as well as part of the total CLABSI reporting. The initial recommendation of the HAI Expert Panel was to report criterion 1 for public reporting, as the definition is the most easily applied across hospitals and there is less room for mis-classification of infections. When Massachusetts CLABSI rates are compared to national rates, they are statistically lower in the most common types of ICUs, both in an all-criteria comparison and a criterion 1 only comparison.
Massachusetts Department of Public Health Healthcare Associated Infection Report April 14, 2010
14
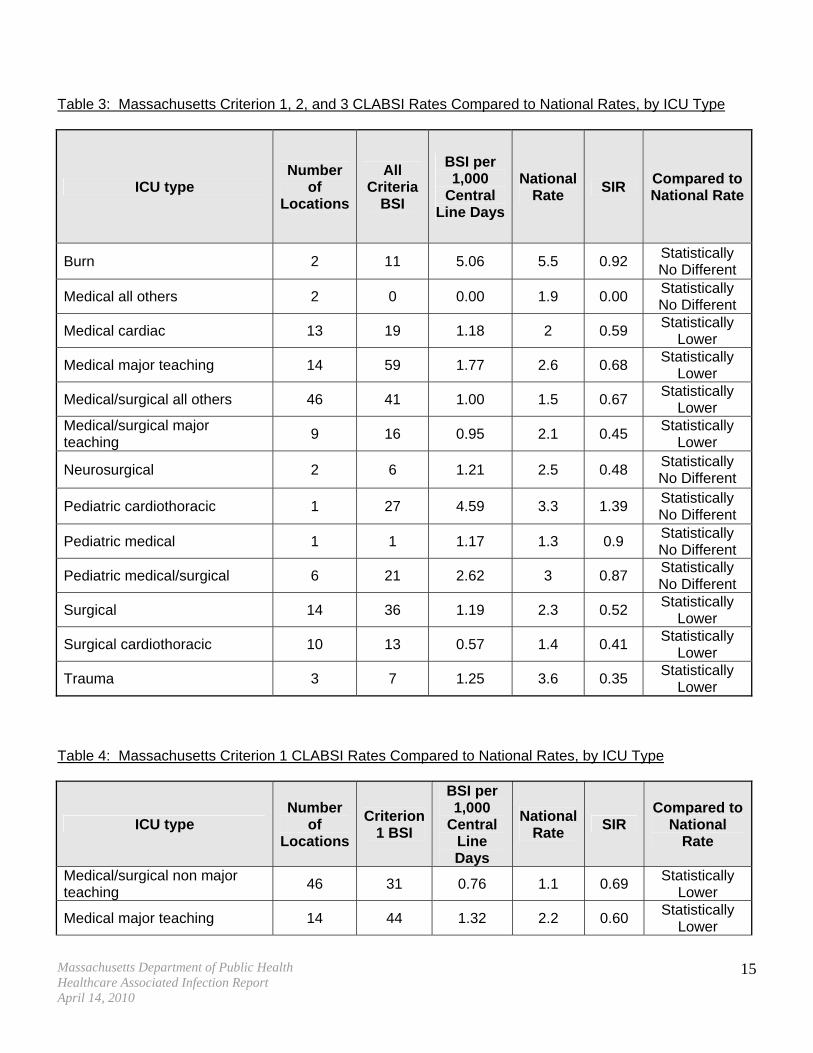
Table 3: Massachusetts Criterion 1, 2, and 3 CLABSI Rates Compared to National Rates, by ICU Type
ICU type Number
of Locations
All Criteria
BSI
BSI per 1,000
Central Line Days
National Rate
SIR Compared to National Rate
Burn 2 11 5.06 5.5 0.92 Statistically No Different
Medical all others 2 0 0.00 1.9 0.00 Statistically No Different
Medical cardiac 13 19 1.18 2 0.59 Statistically
Lower
Medical major teaching 14 59 1.77 2.6 0.68 Statistically
Lower
Medical/surgical all others 46 41 1.00 1.5 0.67 Statistically
Lower Medical/surgical major teaching
9 16 0.95 2.1 0.45 Statistically
Lower
Neurosurgical 2 6 1.21 2.5 0.48 Statistically No Different
Pediatric cardiothoracic 1 27 4.59 3.3 1.39 Statistically No Different
Pediatric medical 1 1 1.17 1.3 0.9 Statistically No Different
Pediatric medical/surgical 6 21 2.62 3 0.87 Statistically No Different
Surgical 14 36 1.19 2.3 0.52 Statistically
Lower
Surgical cardiothoracic 10 13 0.57 1.4 0.41 Statistically
Lower
Trauma 3 7 1.25 3.6 0.35 Statistically
Lower Table 4: Massachusetts Criterion 1 CLABSI Rates Compared to National Rates, by ICU Type
ICU type Number
of Locations
Criterion 1 BSI
BSI per 1,000
Central Line Days
National Rate
SIR Compared to
National Rate
Medical/surgical non major teaching
46 31 0.76 1.1 0.69 Statistically
Lower
Medical major teaching 14 44 1.32 2.2 0.60 Statistically
Lower
Massachusetts Department of Public Health Healthcare Associated Infection Report April 14, 2010
15

ICU type Number
of Locations
Criterion 1 BSI
BSI per 1,000 Compared to
National SIR Central National
Rate Line Rate Days
Surgical 14 10 0.33 1.9 0.17 Statistically
Lower
Medical cardiac 13 12 0.74 1.6 0.47 Statistically
Lower
Surgical cardiothoracic 10 11 0.49 1.1 0.44 Statistically
Lower Medical/surgical major teaching
9 10 0.59 1.6 0.37 Statistically
Lower
Pediatric medical/surgical 6 16 2.00 2.4 0.83 Statistically No Different
Trauma 3 3 0.54 3.1 0.17 Statistically
Lower
Burn 2 10 4.60 4.8 0.96 Statistically No Different
Medical all others 2 0 0.00 1.5 0.00 Statistically No Different
Neurosurgical 2 4 0.81 1.9 0.42 Statistically No Different
Pediatric cardiothoracic 1 24 4.08 2.9 1.41 Statistically No Different
Pediatric medical 1 0 0.00 1.2 0.00 Statistically No Different
CLABSI Rates Table 5 shows the hospital-specific SIRs for criterion 1, 2 and 3 bloodstream infections in specific types of ICUs, by hospital. Only the rates that are significantly different from the national rates are shown. All other hospitals had ICUs with infection rates not significantly different from the national rates (confidence interval of SIR includes 1.00). SIRs are calculated with the expected number of infections based on hospitals and ICUs of the same type (bed size, teaching status, etc; medical, surgical, medical-surgical, etc.)16.
Actual Number of Events Expected Number of Events
Standardized Infection Ratio (SIR) =
Massachusetts Department of Public Health Healthcare Associated Infection Report April 14, 2010
16
16 All ‘national data’ for comparison is from the “National Healthcare Safety network (NHSN) report: Data summary for 2006 through 2008, issued December 2009” www.cdc.gov/nhsn/PDFs/dataStat/2009NHSNReport.pdf

Table 5: Criterion 1, 2 and 3 CLABSI Infection Rates Significantly Different From National Rates17
Hospital ICU type
BSI Rate per 1,000 Central
Line Days (A)
National Rate for
Comparable ICU (B)
SIR (A/B)
Compared to National
Rate
Boston Medical Center Medical cardiac 0.32 2.0 0.16 Statistically
Lower
Boston Medical Center Surgical 0.56 2.3 0.25 Statistically
Lower
Boston Medical Center Trauma 0.90 3.6 0.25 Statistically
Lower Brigham and Women's Hospital
Surgical cardiothoracic 0.18 1.4 0.13 Statistically
Lower Brigham and Women's Hospital
Surgical 0.97 2.3 0.42 Statistically
Lower Massachusetts General Hospital
Medical cardiac 0.49 2.0 0.24 Statistically
Lower Massachusetts General Hospital
Surgical cardiothoracic 0.23 1.4 0.16 Statistically
Lower Massachusetts General Hospital
Neurosurgical 0.00 2.5 0.00 Statistically
Lower Massachusetts General Hospital
Surgical 0.41 2.3 0.18 Statistically
Lower
Saint Vincent Hospital Medical/surgical major teaching
0.00 2.1 0.00 Statistically
Lower UMass Memorial Medical Center
Medical major teaching 1.42 2.6 0.55 Statistically
Lower UMass Memorial Medical Center
Surgical 0.54 2.3 0.23 Statistically
Lower A table showing a comparison of all BSI rates for all hospitals and ICU types to national rates is in Appendix G. Table 6 shows the hospital-specific SIRs for criterion 1 bloodstream infections in specific types of ICUs. Only the rates that are significantly different from the national rates are shown. All other hospitals had ICUs with infection rates not significantly different from the national rates (confidence interval of SIR includes 1.00). SIRs are calculated with the expected based on hospitals and ICUs of the same type (bed size, teaching status, etc; medical, surgical, medical-surgical, etc.)
Massachusetts Department of Public Health Healthcare Associated Infection Report April 14, 2010
17
17 Locations with <=12.5 patient days or central line days are excluded from the analysis (this results in one location being excluded)

Table 6: Criterion 1 CLABSI Infection Rates Significantly Different From National Rates18,19
Hospital ICU type
Criterion 1 BSI
Rate per 1,000
Central Line Days
(A)
National Rate (B)
SIR (A/B)
Compared to National
Rate
Boston Medical Center Surgical 0.28 1.9 0.15 Statistically
Lower Brigham and Women's Hospital
Surgical cardiothoracic 0.18 1.1 0.16 Statistically
Lower Brigham and Women's Hospital
Medical major teaching 0.71 2.2 0.32 Statistically
Lower Brigham and Women's Hospital
Surgical 0.19 1.9 0.10 Statistically
Lower
Caritas Carney Hospital Medical/surgical non major teaching
5.12 1.1 4.65 Statistically
Higher
Lahey Clinic Medical major teaching 0.68 2.2 0.31 Statistically
Lower
Lahey Clinic Surgical 0.48 1.9 0.25 Statistically
Lower Massachusetts General Hospital
Medical cardiac 0.24 1.6 0.15 Statistically
Lower Massachusetts General Hospital
Neurosurgical 0.00 1.9 0.00 Statistically
Lower Massachusetts General Hospital
Surgical 0.20 1.9 0.11 Statistically
Lower
Saint Vincent Hospital Medical/surgical major teaching
0.00 1.6 0.00 Statistically
Lower UMass Memorial Medical Center
Medical major teaching 1.20 2.2 0.55 Statistically
Lower UMass Memorial Medical Center
Surgical 0.00 1.9 0.00 Statistically
Lower UMass Memorial Medical Center
Trauma 0.00 3.1 0.00 Statistically
Lower Massachusetts hospital infection rates generally compare well with national rates. Only one Massachusetts hospital had a higher infection rate than the national rate. The statistical methods used, and tests of statistical significance, are only intended for comparisons of a hospital to the national rate, not of one hospital to another. A table showing criterion 1 BSI rates for all hospitals and ICU types to national rates is in Appendix H.
18 Locations with <=12.5 patient days or central line days are excluded from the analysis (this results in one location being excluded)
Massachusetts Department of Public Health Healthcare Associated Infection Report April 14, 2010
18
19 All ‘national data’ for comparison is from the “National Healthcare Safety Network (NHSN) report: Data summary for 2006 through 2008, issued December 2009” www.cdc.gov/nhsn/PDFs/dataStat/2009NHSNReport.pdf

Central Line Utilization Without taking into account a hospital’s use of central lines, looking at a hospital’s infection data can be misleading. The use of central lines varies among different types of ICUs. The following chart shows the number of days central lines were used in different types of ICUs, compared to the total number of patient days, which gives the central line utilization ratio.
= Central Line Utilization RatioTotal Central Line Days
Total Patient Days Hospitals with higher central line utilization ratios use central lines more than hospitals with lower ratios. This can be due to a variety of factors, including the types of patients cared for in that hospital unit. With more line days, there are more chances for their patients to get an infection. Appendix I contains hospital-specific central line utilization ratios. Table 7: Central Line Utilization Ratio by ICU Type – Massachusetts Acute Care Hospitals
Type of ICU
Number of Hospitals With This ICU Type
Total Central Line Days (A)
Total Patient Days (B)
Central Line Utilization Ratio (A/B)
Medical/Surgical, non major teaching
46 40,809 103,053 0.40
Medical major teaching 14 33,327 50,530 0.66
Surgical 14 30,280 46,756 0.65
Medical cardiac 13 16,120 30,185 0.53
Surgical cardiothoracic 10 22,613 28,769 0.79
Medical/surgical major Teaching
9 16,921 31,954 0.53
Pediatric medical/surgical 6 8,003 17,684 0.45
Trauma 3 5,586 11,081 0.50
Burn 2 2,172 2,317 0.94
Medical, not major teaching 2 1,871 3,919 0.48
Neurosurgical 2 4,968 11,813 0.42
Pediatric cardiothoracic 1 5,877 7,964 0.74
Pediatric medical 1 855 2,965 0.29
Pathogens causing CLABSIs Pathogens are the microorganisms that cause infection. They can be viruses, bacteria, or other microorganisms. A few key pathogens have been identified as the causes of most of the CLABSIs occurring in Massachusetts hospitals. Nearly half of the infections are caused by coagulase negative Staphylococcus (CoNS) and Enterococcus spp. Although CoNS is identified as the most common
Massachusetts Department of Public Health Healthcare Associated Infection Report April 14, 2010
19

pathogen for CLABSI, it is important to know that CoNS is normally found on the skin and could contaminate the blood sample when it is drawn. Table 8: Pathogens Identified as Causing Reported Bloodstream Infections – All Criteria
Pathogen Number of Infections
Percent of Total Infections
Coagulase–negative Staphylococcus 85 33% Enterococcus sp. 44 17% Gram-negative bacteria 43 17% Yeasts 38 15% Methicillin-resistant Staphylococcus aureus (MRSA) 20 8% Staphylococcus aureus (not MRSA) 14 6% Multiple organisms 8 3% Lactobacillus sp. 2 1% Bacillus sp. 1 0% Fungi (not yeast) 1 0% Streptococci (other than Enterococcus sp.) 1 0%
Total 257 100% Neonatal Intensive Care Units (NICUs) Neonatal intensive care units (NICUs) care for premature or seriously ill newborns. Additional specific measures are collected for NICUs, including birth weight, to help better reflect the potential reasons for differences in infection rates. NICU type is a self-designated categorization chosen by hospitals when they first joined NHSN. This designation was based on definitions of NICU level provided by CDC that were found to be interpreted differently by different hospitals, and that have since been clarified. According to the updated CDC definitions, and according to MDPH regulations, all NICUs listed in this report are considered level III. For the NHSN definitions of NICU levels, see Appendix J. As with other types of ICUs, it is important to consider the central line utilization ratio. Without taking into account the hospital’s use of central lines, looking at a hospital’s infection data can be misleading. Hospitals using central lines more frequently have more opportunity for a CLABSI to occur. Total Central Line Days
Total Patient Days Central Line Utilization Ratio = Table 9: Neonatal Intensive Care Unit (NICU) Central Line Utilization
Hospital NICU type Central
Line Days (A)
Patient days (B)
Central Line Utilization Ratio (A/B)
Beth Israel Deaconess Medical Center Level II/III 1,908 13,657 0.14
UMass Memorial Medical Center Level II/III 2,285 12,381 0.18
Baystate Medical Center Level III 1,980 7,203 0.27
Massachusetts Department of Public Health Healthcare Associated Infection Report April 14, 2010
20

Hospital NICU type Central
Line Days (A)
Central Line Patient
Utilization days (B)
Ratio (A/B) Boston Medical Center Level III 875 4,386 0.20
Brigham and Women’s Hospital Level III 2,144 17,333 0.12
Children’s Hospital Boston Level III 2,884 7,340 0.39
Massachusetts General Hospital 20 Level III 949 2,708 0.35
South Shore Hospital Level III 669 2,433 0.27
St. Elizabeth’s Medical Center Level III 474 3,536 0.13
Tufts Medical Center Level III 3,704 11,666 0.32 The central line utilization ratios in NICUs range from 0.12 to 0.39. This may reflect the seriousness of the patient’s conditions and types of treatments patients require or the variations may be due to differences in NICU infant populations, so this information should not be used to compare hospitals to one another. Since all patient days are the denominator, Massachusetts NICUs have large variability around which types of babies they admit (e.g. some NICUs admit all well infants <36 weeks gestation, or well infants with a peripheral IV for antibiotics while other NICUs never admit infants in these categories if the babies are well). Obviously this would affect device utilization if the patient days are increased by adding well infants who never require a central line. Table 10 shows the SIR for NICUs in individual hospitals.
Standardized Infection Ratio (SIR) = Actual Number of BSI per 1,000 central line days
Expected Number of BSI per 1,000 central line days
In this case, the SIR is the actual number of criterion 1, 2 and 3 BSI divided by the expected number of all Criterion BSI per 1,000 central line days, based on national averages. Table 10: Neonatal Intensive Care Unit (NICU) Criteria 1, 2 and 3 BSI SIRs
Hospital NICU type
Criterion 1, 2 and 3 BSI per 1,000 Central
Line Days
Number of
Infections(A)
Expected Number
of Infections
(B)
SIR (A/B)
Compared with
National Rate
Beth Israel Deaconess Medical Center
Level II/III
2.62 5 6.09 0.82 Statistically No Different
UMass Memorial Medical Center Level II/III
3.06 7 5.91 1.19 Statistically No Different
Baystate Medical Center Level III 0.51 1 4.12 0.24 Statistically No Different
Massachusetts Department of Public Health Healthcare Associated Infection Report April 14, 2010
21
20 Please note MGH did not report NICU data via NHSN until January 2009. The hospital reported the occurrence of two CLABSIs during the period of 7-08 through 12-08.

Criterion 1, Expected
Hospital NICU type
2 and 3 BSI Number Compared Number
SIR per 1,000 Central
Line Days
of with of
Infections(A)
Infections (B)
(A/B) National Rate
Boston Medical Center Level III 5.71 5 1.71 2.92 Statistically No Different
Brigham and Women’s Hospital Level III 3.26 7 4.5 1.56 Statistically No Different
Children’s Hospital Boston Level III 0.69 2 5.84 0.34 Statistically No Different
Massachusetts General Hospital21
Level III 0 0 1.77 0.00 Statistically No Different
South Shore Hospital Level III 0 0 1.22 0.00 Statistically No Different
St. Elizabeth’s Medical Center Level III 0 0 0.96 0.00 Statistically No Different
Tufts Medical Center Level III 3.51 13 7.88 1.65 Statistically No Different
Criteria 1, 2,and 3 BSIs are shown by birth weight in Appendix K. Table 11: Neonatal Intensive Care Unit (NICU) Criterion 1 BSI SIR
Hospital NICU type
Criterion 1 BSI per 1,000
Central Line Days
Number of
Infections (A)
Expected Number
of Infections
(B)
SIR (A/B)
Compared with
National Rate
Beth Israel Deaconess Medical Center
Level II/III
2.62 5 4.81 1.04 Statistically No Different
UMass Memorial Medical Center Level II/III
1.75 4 5.35 0.75 Statistically No Different
Baystate Medical Center Level III 0.51 1 5.30 0.19 Statistically No Different
Boston Medical Center Level III 2.29 2 2.19 0.91 Statistically No Different
Brigham and Women’s Hospital Level III 1.87 4 5.79 0.69 Statistically No Different
Massachusetts Department of Public Health Healthcare Associated Infection Report April 14, 2010
22
21 Please note MGH did not report NICU data via NHSN until January 2009. The hospital reported the occurrence of two CLABSIs during the period of 7-08 through 12-08.

Hospital NICU type
Criterion 1 BSI per 1,000
Central Line Days
Number of
Infections (A)
Expected Number
of Infections
Compared SIR with
(B)
(A/B) National Rate
Children’s Hospital Boston Level III 0 0 7.46 0.00 Statistically
Lower
Massachusetts General Hospital22
Level III 0 0 2.34 0.00 Statistically No Different
South Shore Hospital Level III 0 0 1.58 0.00 Statistically No Different
St. Elizabeth’s Medical Center Level III 0 0 1.27 0.00 Statistically No Different
Tufts Medical Center Level III 3.24 12 10.16 1.18 Statistically No Different
Only Children’s Hospital’s SIR is significantly different than the national rate, and it is statistically lower. Criterion 1 BSIs are shown by birth weight group in Appendix L. Pathogens CLABSIs in NICUs resulted from the following organisms. Table 12: Pathogens Identified in NICU CLABSI
Pathogen Number of Infections
Percent of Total Infections
Staphylococcus aureus (not MRSA) 15 38% Coagulase-negative Staphylococcus 12 30% Yeasts 5 13% Enterococcus 3 8% Gram–negative bacteria 3 8% Methicillin-resistant Staphylococcus aureus (MRSA) 2 5%
Total 40 102%23 Nearly 70 percent of CLABSIs in NICUs are caused by Staphylococcus aureus and coagulase-negative Staphylococcus sp.
22 Please note, MGH did not report NICU data via NHSN until January 2009. The hospital reported the occurrence of two CLABSIs during the period of 7-08 through 12-08.
Massachusetts Department of Public Health Healthcare Associated Infection Report April 14, 2010
23
23 Does not total 100% due to rounding

Surgical Site Infections (SSIs) Surgical site infections (SSIs) are infections that are directly related to an operative procedure. SSIs develop within thirty days after an operation or within one year if an implant was placed and the infection appears to be related to the surgery.24 Some SSIs are less serious and only involve the skin or subcutaneous tissue. Other SSIs may be deeper and are more significant. Deep incisional and organ/space SSIs result in the greatest personal cost for patients and families, and additional financial burden on the health care system. For this reason, acute care hospitals are required to report to MDPH deep incisional HAIs and infections that affect body organs or spaces. For more detail about of how SSIs are classified, please see Appendix M. More than half of SSIs are not identified until patients are discharged from the hospital and patients with infection do not always return to the same hospital where the original surgery was performed. Making identification of SSIs even more complex is that infections associated with implants can occur a considerable time after surgery (up to one year). To identify infections after discharge and prevent underestimations of SSIs, hospital infection control programs routinely conduct a process known as post discharge surveillance. Although there is no standard way to obtain this information, hospitals use various approaches, including review of data sources for re-admission and emergency room visits, to improve the detection of SSIs. All patients who experience infections may not be re-admitted or go to the hospital’s emergency department, so there may be some infections that will not be identified by the hospital’s reporting system. For this report, HAIs related to coronary artery bypass graft (CABG) surgery (both with and without the harvest of a blood vessel in the lower extremity) and hysterectomy (both vaginal and abdominal) are reported in the aggregate. In the next annual report, the MDPH anticipates having hospital-specific data for these measures. Important data note: CABG and hip and knee arthroplasty HAIs The CABG, hip arthroplasty and knee arthroplasty SSI data represent 7 months of surgical procedures, as in these cases, there has been a full year of follow-up for SSIs with implant. Once the year of observation has occurred for all procedures done between July 2008 and June 2009 and appropriate data analysis has been performed, the MDPH will post data on all of the CABG procedures and hip and knee arthroplasty HAIs through June 2009. This is currently anticipated to be available in September 2010. Coronary artery bypass graft (CABG) CABG surgery, commonly called “bypass surgery”, improves blood flow to the heart. This procedure is one treatment used for people with narrowing and blockage of the heart arteries. During CABG surgery, a healthy vein or artery usually taken from the patient’s own blood vessels in the leg, arm or chest is connected or grafted to the blocked coronary artery. The graft allows blood to go around or “bypass” the blocked section of the coronary artery creating a new route to deliver oxygen and nutrients to the heart muscle. The wires used to close the incision stay in the patient’s body permanently and for the purpose of NHSN are considered an implant. Procedures with implants are monitored for infection for one year.
Massachusetts Department of Public Health Healthcare Associated Infection Report April 14, 2010
24
24 Mangram AJ, Horan TC, Pearson ML, Silver LC, Jarvis WR, the Hospital Infection Control Practices Advisory Committee. Guideline for the Prevention of Surgical Site Infection, 1999. Infect Control Hosp Epidemiol. 1999; 20:247-278. http://www.cdc.gov/ncidod/dhqp/pdf/guidelines/SSI.pdf
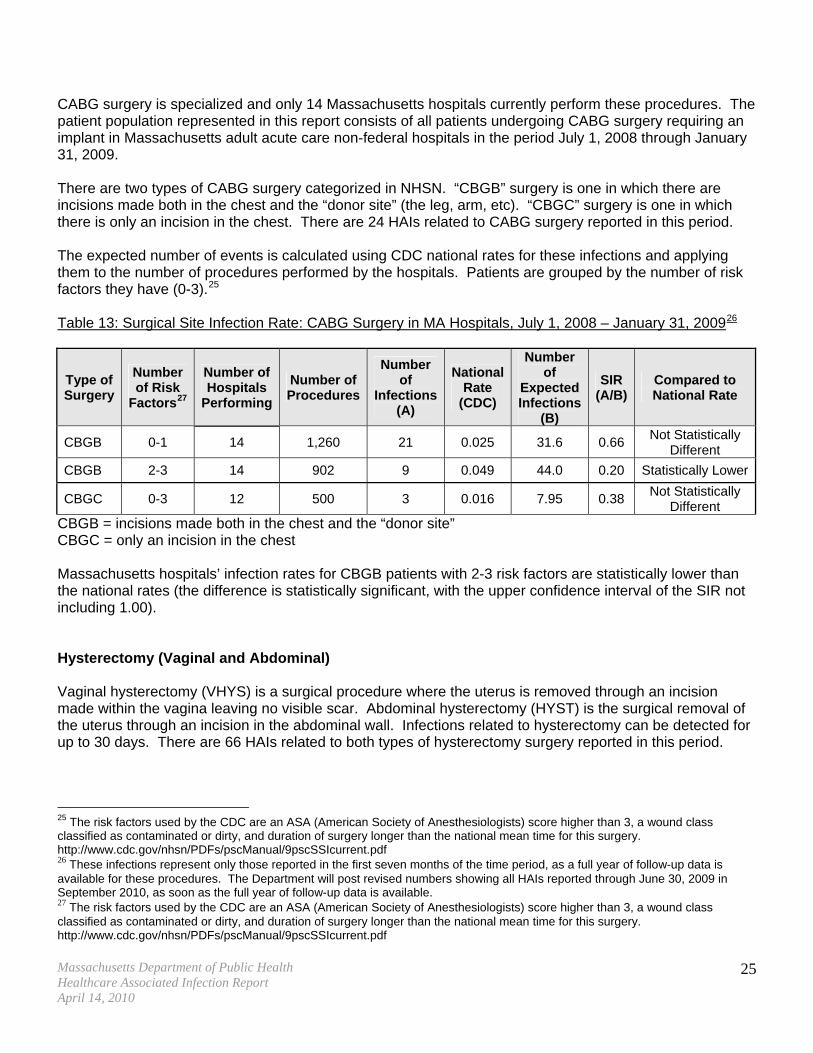
CABG surgery is specialized and only 14 Massachusetts hospitals currently perform these procedures. The patient population represented in this report consists of all patients undergoing CABG surgery requiring an implant in Massachusetts adult acute care non-federal hospitals in the period July 1, 2008 through January 31, 2009. There are two types of CABG surgery categorized in NHSN. “CBGB” surgery is one in which there are incisions made both in the chest and the “donor site” (the leg, arm, etc). “CBGC” surgery is one in which there is only an incision in the chest. There are 24 HAIs related to CABG surgery reported in this period. The expected number of events is calculated using CDC national rates for these infections and applying them to the number of procedures performed by the hospitals. Patients are grouped by the number of risk factors they have (0-3).25 Table 13: Surgical Site Infection Rate: CABG Surgery in MA Hospitals, July 1, 2008 – January 31, 200926
Type of Surgery
Number of Risk
Factors27
Number of Hospitals
Performing
Number of Procedures
Number of
Infections (A)
National Rate
(CDC)
Number of
Expected Infections
(B)
SIR (A/B)
Compared to National Rate
CBGB 0-1 14 1,260 21 0.025 31.6 0.66 Not Statistically
Different
CBGB 2-3 14 902 9 0.049 44.0 0.20 Statistically Lower
CBGC 0-3 12 500 3 0.016 7.95 0.38 Not Statistically
Different CBGB = incisions made both in the chest and the “donor site” CBGC = only an incision in the chest Massachusetts hospitals’ infection rates for CBGB patients with 2-3 risk factors are statistically lower than the national rates (the difference is statistically significant, with the upper confidence interval of the SIR not including 1.00). Hysterectomy (Vaginal and Abdominal) Vaginal hysterectomy (VHYS) is a surgical procedure where the uterus is removed through an incision made within the vagina leaving no visible scar. Abdominal hysterectomy (HYST) is the surgical removal of the uterus through an incision in the abdominal wall. Infections related to hysterectomy can be detected for up to 30 days. There are 66 HAIs related to both types of hysterectomy surgery reported in this period.
25 The risk factors used by the CDC are an ASA (American Society of Anesthesiologists) score higher than 3, a wound class classified as contaminated or dirty, and duration of surgery longer than the national mean time for this surgery. http://www.cdc.gov/nhsn/PDFs/pscManual/9pscSSIcurrent.pdf 26 These infections represent only those reported in the first seven months of the time period, as a full year of follow-up data is available for these procedures. The Department will post revised numbers showing all HAIs reported through June 30, 2009 in September 2010, as soon as the full year of follow-up data is available. 27 The risk factors used by the CDC are an ASA (American Society of Anesthesiologists) score higher than 3, a wound class classified as contaminated or dirty, and duration of surgery longer than the national mean time for this surgery. http://www.cdc.gov/nhsn/PDFs/pscManual/9pscSSIcurrent.pdf
Massachusetts Department of Public Health Healthcare Associated Infection Report April 14, 2010
25

Table 14: Surgical Site Infection Rate: Hysterectomy Surgery in MA Hospitals, July 1, 2008 – June 30, 2009
Type of Surgery
Number of Risk
Factors28
Number of Hospitals
Performing
Number of Procedures
Number of
Infections (A)
National Rate
(CDC)
Number of
Expected Infections
(B)
SIR (A/B)
Compared to National Rate
HYST 0 60 3,204 16 0.011 35.2 0.45 Statistically Lower
HYST 1 57 2,181 20 0.022 48.0 0.42 Statistically Lower
HYST 2-3 38 395 6 0.041 16.0 0.38 Statistically Lower
VHYS 0 55 1,399 10 0.007 10.2 0.98 Not Significantly
Different
VHYS 1-3 56 1,052 14 0.012 12.2 1.15 Not Significantly
Different HYST = Abdominal Hysterectomy VHYS = Vaginal Hysterectomy Massachusetts hospital deep tissue and organ space SSI rates for abdominal hysterectomy were statistically lower than the national rate; rates for vaginal hysterectomy procedures were not significantly different. Hip and Knee Arthroplasty Hip arthroplasty is surgery to the hip joint where the diseased or damaged hip joint is removed and replaced with an artificial implant called a prosthesis. Knee arthroplasty is a surgical procedure where the diseased or damaged part of the knee is removed and replaced with a prosthesis. There are 78 HAIs related to hip and knee arthroplasty reported during their reporting period (July 2008 through January 2009).
28 The risk factors used by the CDC are an ASA (American Society of Anesthesiologists) score higher than 3, a wound class classified as contaminated or dirty, and duration of surgery longer than the national mean time for this surgery. http://www.cdc.gov/nhsn/PDFs/pscManual/9pscSSIcurrent.pdf
Massachusetts Department of Public Health Healthcare Associated Infection Report April 14, 2010
26

Table 15: Surgical Site Infection Rate: Hip and Knee Arthroplasty, July 1, 2008 – January 31, 200929
Type of Surgery
Number of Risk
Factors30
Number of Hospitals
Performing
Number of Procedures
Number of
Infections (A)
National Rate
(CDC)
Number of
Expected Infections
(B)
SIR (A/B)
Compared to National Rate
HPRO 0 62 1,874 5 0.007 12.56 0.40 Statistically Lower
HPRO 1 66 2,959 21 0.014 42.61 0.49 Statistically Lower
HPRO 2-3 57 800 14 0.024 19.20 0.73 Not Statistically
Different
KPRO 0 57 2,970 8 0.006 17.23 0.46 Statistically Lower
KPRO 1 65 3,297 17 0.010 32.64 0.52 Statistically Lower
KPRO 2-3 61 960 13 0.016 15.36 0.85 Not Statistically
Different HPRO = Hip Arthroplasty KPRO = Knee Arthroplasty These rates and SIRs are calculated on the basis of data available as of the writing of this report. Revised rates and SIRs will be posted when further data are available (see footnote 29). These updated rates and SIRs will almost certainly be somewhat different from those reported here, as more complete information will be available at that time. Massachusetts hospital deep infection SSI rates are statistically below the rates that would be expected for both hip and knee arthroplasty, based on national rates for these procedures (the upper confidence interval of the SIR not including 1.00. Only the knee and hip arthroplasty SSI rate for patients with 2-3 risk factors were not statistically significantly different from the national rate. Hip Arthroplasty HAIs Table 16: Hip Arthroplasty Surgical Site Infections Compared to Expected Infections
Hospital Name Total
Surgeries
Total Infections
(A)
Expected Infections
(B)
SIR (A/B)
Compared to National Rate
Anna Jaques Hospital 45 2 0.57 3.51 Not Statistically
Different
Berkshire Health Systems 86 3 1.09 2.75 Not Statistically
Different
29 These infections represent only those reported in the first seven months of the time period, as a full year of follow-up data is not available for these procedures. The Department will post revised numbers showing all HAIs reported through June 30, 2009 in September 2010, as soon as the full year of follow-up data is available. 30 The risk factors used by the CDC are an ASA (American Society of Anesthesiologists) score higher than 3, a wound class classified as contaminated or dirty, and duration of surgery longer than the national mean time for this surgery. http://www.cdc.gov/nhsn/PDFs/pscManual/9pscSSIcurrent.pdf
Massachusetts Department of Public Health Healthcare Associated Infection Report April 14, 2010
27

Total Expected Total SIR Compared to
Hospital Name Surgeries
Infections Infections (A) (B)
(A/B) National Rate
Beth Israel Deaconess Medical Center
143 3 1.81 1.66 Not Statistically
Different
Boston Medical Center 93 2 1.18 1.69 Not Statistically
Different
Brigham and Women's Hospital 323 2 4.09 0.49 Not Statistically
Different
Holyoke Medical Center 31 1 0.39 2.55 Not Statistically
Different
Lahey Clinic 203 1 2.57 0.39 Not Statistically
Different
Lowell General Hospital 52 2 0.66 3.04 Not Statistically
Different
Massachusetts General Hospital 274 2 3.47 0.58 Not Statistically
Different
Merrimack Valley Hospital 23 1 0.29 3.43 Not Statistically
Different Metro West Medical Center- Framingham Hospital
21 2 0.27 7.52 Not Statistically
Different Metro West Medical Center- Leonard Morse Hospital
32 1 0.41 2.47 Not Statistically
Different
New England Baptist Hospital 1,092 1 13.83 0.07 Statistically
Lower
Newton-Wellesley Hospital 265 2 3.36 0.59 Not Statistically
Different North Shore Medical Center - Salem Hospital
107 2 1.35 1.48 Not Statistically
Different Northeast Hospital – Beverly Hospital
110 1 1.39 0.72 Not Statistically
Different
Quincy Medical Center 53 1 0.67 1.49 Not Statistically
Different
Saint Vincent Hospital 163 4 2.06 1.94 Not Statistically
Different Southcoast Health Systems -Charlton Hospital
99 2 1.25 1.59 Not Statistically
Different
St. Elizabeth's Medical Center 38 1 0.48 2.08 Not Statistically
Different
UMass Memorial Medical Center 312 3 3.95 0.76 Not Statistically
Different
Winchester Hospital 60 1 0.76 1.32 Not Statistically
Different Only New England Baptist had hip arthroplasty SSI infection rates that were statistically different from the national data, statistically lower. Hospitals not listed in this chart did not report any infections during this reporting period.
Massachusetts Department of Public Health Healthcare Associated Infection Report April 14, 2010
28

Some hospitals performed hip arthroplasty surgery and had no SSIs during the reporting period. The number of surgeries performed and the expected number of infections based on national rates is found in Table 17. The number of procedures performed by these hospitals ranged from 1 to 262. Table 17: Hospitals with No Hip Arthroplasty Infections. July 2008 – January 2009
Hospital Name Total
Surgeries
Total Infections
(A)
Expected Infections
(B)
SIR (A/B)
Compared to National Rate
Baystate Medical Center 262 0 3.32 0.00 Not Statistically
Different
South Shore Hospital 143 0 1.81 0.00 Not Statistically
Different
Cape Cod Hospital 125 0 1.58 0.00 Not Statistically
Different
Mount Auburn Hospital 125 0 1.58 0.00 Not Statistically
Different Southcoast Health Systems -- St. Luke's Hospital
90 0 1.14 0.00 Not Statistically
Different
Falmouth Hospital 83 0 1.05 0.00 Not Statistically
Different
Caritas Holy Family Hospital 81 0 1.03 0.00 Not Statistically
Different North Shore Medical Center - Union Hospital
81 0 1.03 0.00 Not Statistically
Different
Jordan Hospital 65 0 0.82 0.00 Not Statistically
Different Caritas Good Samaritan Medical Center
62 0 0.79 0.00 Not Statistically
Different
Tufts Medical Center 62 0 0.79 0.00 Not Statistically
Different
Cooley Dickinson Hospital 57 0 0.72 0.00 Not Statistically
Different
Caritas Norwood Hospital 53 0 0.67 0.00 Not Statistically
Different
Emerson Hospital 53 0 0.67 0.00 Not Statistically
Different Hallmark Health Corp- Melrose-Wakefield
53 0 0.67 0.00 Not Statistically
Different
Milford Regional Hospital 43 0 0.54 0.00 Not Statistically
Different
Brockton Hospital (Signature) 41 0 0.52 0.00 Not Statistically
Different
Sturdy Memorial Medical Center 40 0 0.51 0.00 Not Statistically
Different
Faulkner 36 0 0.46 0.00 Not Statistically
Different
Saints Memorial Medical Center 35 0 0.44 0.00 Not Statistically
Different
Massachusetts Department of Public Health Healthcare Associated Infection Report April 14, 2010
29

Hospital Name Total
Surgeries
Total Expected SIR Compared to
Infections Infections (A) (B)
(A/B) National Rate
Morton Hospital and Medical Center
32 0 0.41 0.00 Not Statistically
Different Nthern Berkshire Health Sys (North Adams Reg Hos)
32 0 0.41 0.00 Not Statistically
Different
St. Anne's Hospital 31 0 0.39 0.00 Not Statistically
Different
Mercy Medical Center 30 0 0.38 0.00 Not Statistically
Different Beth Israel Deaconess Medical Center Needham
28 0 0.35 0.00 Not Statistically
Different
Marlborough Hospital 28 0 0.35 0.00 Not Statistically
Different
Lawrence General Hospital 24 0 0.30 0.00 Not Statistically
Different Cambridge Health Alliance - Cambridge Hospital
23 0 0.29 0.00 Not Statistically
Different
Caritas Carney Hospital 23 0 0.29 0.00 Not Statistically
Different
Franklin Medical Center 23 0 0.29 0.00 Not Statistically
Different
Health Alliance Hospital 21 0 0.27 0.00 Not Statistically
Different
Lawrence Memorial Hospital 20 0 0.25 0.00 Not Statistically
Different
Milton Hospital 20 0 0.25 0.00 Not Statistically
Different Southcoast Health Systems -- Tobey Hospital
16 0 0.20 0.00 Not Statistically
Different Cambridge Health Alliance - Whidden Memorial Hospital
11 0 0.14 0.00 Not Statistically
Different
Heywood Hospital 9 0 0.11 0.00 Not Statistically
Different
Noble Hospital 9 0 0.11 0.00 Not Statistically
Different
Wing Memorial Hospital 8 0 0.10 0.00 Not Statistically
Different
Harrington Memorial Hospital 7 0 0.09 0.00 Not Statistically
Different
Martha's Vineyard Hospital 7 0 0.09 0.00 Not Statistically
Different
Nashoba Valley Medical Center 6 0 0.08 0.00 Not Statistically
Different
Fairview 5 0 0.06 0.00 Not Statistically
Different Cambridge Health Alliance -Somerville Hospital
2 0 0.03 0.00 Not Statistically
Different
Massachusetts Department of Public Health Healthcare Associated Infection Report April 14, 2010
30

Hospital Name Total
Surgeries
Total Expected SIR Compared to
Infections Infections (A) (B)
(A/B) National Rate
Northeast Hospital - Addison Gilbert
2 0 0.03 0.00 Not Statistically
Different
Athol Hospital 1 0 0.01 0.00 Not Statistically
Different Knee Arthroplasty HAIs Table 18: Knee Arthroplasty Surgical Site Infections Compared to Expected Infections New England Baptist Hospital’s rate was significantly different from the expected, statistically lower (the upper confidence interval of the SIR not including 1.00). St. Vincent Hospital’s rate was significantly different from the expected, statistically higher.
Hospital Name Total
Surgeries
Total Infections
(A)
Expected Infections
(B)
SIR (A/B)
Compared to National Rate
Anna Jaques Hospital 36 1 0.32 3.11 Not Statistically
Different Beth Israel Deaconess Medical Center
159 2 1.42 1.41 Not Statistically
Different
Brigham and Women's Hospital 451 2 4.03 0.50 Not Statistically
Different
Brockton Hospital (Signature) 55 1 0.49 2.04 Not Statistically
Different Cambridge Health Alliance - Cambridge Hospital
28 1 0.25 4.00 Not Statistically
Different
Caritas Holy Family Hospital 108 1 0.96 1.04 Not Statistically
Different
Falmouth Hospital 153 1 1.37 0.73 Not Statistically
Different
Lahey Clinic 288 2 2.57 0.78 Not Statistically
Different
Lowell General Hospital 76 3 0.68 4.42 Not Statistically
Different
Massachusetts General Hospital 274 2 2.45 0.82 Not Statistically
Different Metro West Medical Center- Leonard Morse Hospital
59 1 0.53 1.90 Not Statistically
Different
Mount Auburn Hospital 173 1 1.54 0.65 Not Statistically
Different
New England Baptist Hospital 1,320 4 11.78 0.34 Significantly
Lower
Massachusetts Department of Public Health Healthcare Associated Infection Report April 14, 2010
31

Total Expected Total SIR Compared to
Hospital Name Surgeries
Infections Infections (A) (B)
(A/B) National Rate
Newton-Wellesley Hospital 193 1 1.72 0.58 Not Statistically
Different
Noble Hospital 26 1 0.23 4.31 Not Statistically
Different North Shore Medical Center - Salem Hospital
159 1 1.42 0.70 Not Statistically
Different
Quincy Medical Center 50 1 0.45 2.24 Not Statistically
Different
Saint Vincent Hospital 206 6 1.84 3.26 Significantly
Higher
South Shore Hospital 153 1 1.37 0.73 Not Statistically
Different Southcoast Health Systems -- Charlton Hospital
160 1 1.43 0.70 Not Statistically
Different Southcoast Health Systems -- St. Luke's Hospital
136 2 1.21 1.65 Not Statistically
Different
Tufts Medical Center 51 1 0.46 2.20 Not Statistically
Different
Winchester Hospital 131 1 1.17 0.86 Not Statistically
Different Some hospitals performed knee arthroplasty surgeries and had no SSIs during this time period. The number of surgeries performed and the expected number of infections based on national rates is found in Table 19. Table 19: Hospitals with No Knee Arthroplasty Infections July 2008 – January 2009
Hospital Name Total
Surgeries
Total Infections
(A)
Expected Infections
(B)
SIR (A/B)
Compared to National Rate
Baystate Medical Center 377 0 3.37 0.00 Not Statistically
Different
UMass Memorial Medical Center 290 0 2.59 0.00 Not Statistically
Different Northeast Hospital - Beverly Hospital
176 0 1.57 0.00 Not Statistically
Different
Boston Medical Center 138 0 1.23 0.00 Not Statistically
Different
Cape Cod Hospital 135 0 1.21 0.00 Not Statistically
Different
Faulkner 128 0 1.14 0.00 Not Statistically
Different
Jordan Hospital 128 0 1.14 0.00 Not Statistically
Different
Massachusetts Department of Public Health Healthcare Associated Infection Report April 14, 2010
32

Hospital Name Total
Surgeries
Total Expected SIR Compared to
Infections Infections (A) (B)
(A/B) National Rate
Berkshire Health Systems 112 0 1.00 0.00 Not Statistically
Different Caritas Good Samaritan Medical Center
99 0 0.88 0.00 Not Statistically
Different
North Shore Medical Center - Union Hospital
89 0 0.79 0.00 Not Statistically
Different
Morton Hospital and Medical Center
86 0 0.77 0.00 Not Statistically
Different
Mercy Medical Center 72 0 0.64 0.00 Not Statistically
Different
Cooley Dickinson Hospital 58 0 0.52 0.00 Not Statistically
Different
Marlborough Hospital 58 0 0.52 0.00 Not Statistically
Different
Milford Regional Hospital 57 0 0.51 0.00 Not Statistically
Different
St. Elizabeth's Medical Center 57 0 0.51 0.00 Not Statistically
Different
Saints Memorial Medical Center 55 0 0.49 0.00 Not Statistically
Different Hallmark Health Corp- Melrose-Wakefield
53 0 0.47 0.00 Not Statistically
Different
Caritas Norwood Hospital 52 0 0.46 0.00 Not Statistically
Different
Health Alliance Hospital 51 0 0.46 0.00 Not Statistically
Different
Sturdy Memorial Medical Center 51 0 0.46 0.00 Not Statistically
Different
Emerson Hospital 48 0 0.43 0.00 Not Statistically
Different
Heywood Hospital 48 0 0.43 0.00 Not Statistically
Different
Holyoke Medical Center 46 0 0.41 0.00 Not Statistically
Different
Milton Hospital 44 0 0.39 0.00 Not Statistically
Different Nthern Berkshire Health Sys (North Adams Reg Hos)
36 0 0.32 0.00 Not Statistically
Different
Merrimack Valley Hospital 32 0 0.29 0.00 Not Statistically
Different Southcoast Health Systems -- Tobey Hospital
29 0 0.26 0.00 Not Statistically
Different
Caritas Carney Hospital 25 0 0.22 0.00 Not Statistically
Different
Massachusetts Department of Public Health Healthcare Associated Infection Report April 14, 2010
33

Hospital Name Total
Surgeries
Total Expected SIR Compared to
Infections Infections (A) (B)
(A/B) National Rate
St. Anne's Hospital 23 0 0.21 0.00 Not Statistically
Different
Harrington Memorial Hospital 18 0 0.16 0.00 Not Statistically
Different Metro West Medical Center- Framingham Hospital
18 0 0.16 0.00 Not Statistically
Different
Lawrence Memorial Hospital 14 0 0.13 0.00 Not Statistically
Different
Fairview 13 0 0.12 0.00 Not Statistically
Different Beth Israel Deaconess Medical Center Needham
12 0 0.11 0.00 Not Statistically
Different
Franklin Medical Center 12 0 0.11 0.00 Not Statistically
Different
Nashoba Valley Medical Center 11 0 0.10 0.00 Not Statistically
Different
Baystate Mary Lane 7 0 0.06 0.00 Not Statistically
Different
Lawrence General Hospital 6 0 0.05 0.00 Not Statistically
Different
Wing Memorial Hospital 6 0 0.05 0.00 Not Statistically
Different Cambridge Health Alliance -Somerville Hospital
4 0 0.04 0.00 Not Statistically
Different
Cambridge Health Alliance - Whidden Memorial Hospital
3 0 0.03 0.00 Not Statistically
Different
Martha's Vineyard Hospital 3 0 0.03 0.00 Not Statistically
Different Northeast Hospital - Addison Gilbert
2 0 0.02 0.00 Not Statistically
Different Time to Detection The time it takes to detect an SSI varies greatly, depending on the type of event. For knee arthroplasty, the average time to detection was nearly 104 days (approximately 3 ½ months). To identify infections after discharge and prevent underestimations of SSIs, hospital infection control programs routinely conduct a process known as post discharge surveillance. Although there is no standard way to this information, hospitals use various approaches, including review of data sources for re-admission and emergency room visits, to improve the detection of SSIs. All patients who experience infections may not be re-admitted or go to the hospital’s emergency department, so there may be some infections that will not be identified by the hospital’s reporting system.
Massachusetts Department of Public Health Healthcare Associated Infection Report April 14, 2010
34

Table 20: Detection of Surgical Site Infections
Range of Days to Detection Procedure Events
Average Detection
(days) Minimum Maximum
When Detected
During Admission 5 Post-Discharge Surveillance 1 CBGB 30 34.63 5 183
Readmission 24During Admission 2 Post-Discharge Surveillance 0 CBGC 3 29 10 50
Readmission 1 During Admission 3 Post-Discharge Surveillance 3 VHYS 24 11.21 1 22
Readmission 18During Admission 2 Post-Discharge Surveillance 7 HYST 42 11.24 1 28
Readmission 33During Admission 0 Post-Discharge Surveillance 3 KPRO 38 122.6 1 353
Readmission 35During Admission 13Post-Discharge Surveillance 1 HPRO 40 57.6 1 324
Readmission 36 Additional Data Race/Ethnicity Data Understanding and preventing racial and ethnic disparities in healthcare is a high MDPH priority. The established federal NHSN system has limited ability to collect race and ethnicity data, as those data elements are not required for participation. In order to meet the Massachusetts requirement for submission of data on race and expanded ethnicity, beginning January 1, 2009, all acute care hospitals were mandated to submit this information using custom NHSN fields. Each hospital was required to manually set up and enter all data in the specified custom fields using the MA Division of Health Care Finance and Policy codes. While the initial focus of the quality assurance reports has been to ensure the accuracy of HAI measures at the facility level, the addition of a data manager to the program will assist efforts to evaluate submission of race and ethnicity data.
Massachusetts Department of Public Health Healthcare Associated Infection Report April 14, 2010
35

Current Status of HAI Activities in Massachusetts Sharing of Best Practices The HAI Expert Panel recommended a comprehensive set of evidence based prevention guidelines or “best practices” for implementation in Massachusetts hospitals31. “Best practices” are strategies, activities or approaches that have been shown through research and evaluation to be effective in reducing the risk of HAI. Infection Prevention Unit Activities To actively support the use of the evidence-based best practices, MDPH implemented an Infection Prevention Unit within the Division of Health Care Quality. For its first project, MDPH infection preventionists (IP) with extensive HAI experience developed a detailed on-site survey tool for individual hospital infection prevention programs to use to look at their current programs. The IPs conducted site visits in each acute care hospital to encourage an open discussion on current practices and innovative programs at the hospital. In addition, they provided guidance on implementation of best practices, collection and submission of HAI data, and they addressed programmatic concerns. In April 2010, the IPs will begin unannounced infection prevention and control focused surveys of all acute care hospitals. They will conduct reviews to verify compliance with regulations, associated guidelines and relevant best practices. If hospitals do not meet established standards for infection prevention they will be required to submit a written plan to MDPH to identify the corrective actions to be taken to address deficient practices. Education and Training Support for Hospitals Before NHSN reporting began, hospitals completed user specific CDC/NHSN training. Additional technical assistance and training on NHSN enrollment procedures, standard definitions and reporting measures has been provided for all hospitals. Ongoing support for hospitals is provided by MDPH staff in consultation with CDC. Massachusetts Coalition for the Prevention of Medical Errors MDPH supports the Massachusetts Coalition for the Prevention of Medical Errors (the Coalition) collaborative programming designed to help hospitals in their work to prevent healthcare associated infections (HAIs). Working with the Massachusetts Hospital Association (MHA), MDPH, and the Betsy Lehman Center for Patient Safety, the Coalition’s goal has been to enlist 100% of acute care hospitals, and accelerate progress in infection prevention in those hospitals by sharing local and national best practices, tools and resources, and implementation strategies, as well as maintaining top leadership support. The Coalition has held a number of seminars for professionals on infection prevention and approaches for promoting quality improvement. All hospitals participated in one or more of these trainings. Programs were also developed to ensure senior hospital leadership involvement in this initiative. As a result of these focused meetings senior leaders from all hospitals signed a letter of commitment prioritizing infection prevention for their facility. To promote the sharing of effective strategies the Coalition has published and distributed a collection of 34 successful prevention projects reported by 24 hospitals.32
31 http://www.mass.gov/Eeohhs2/docs/dph/patient_safety/haipcp_final_report_pt1.pdf http://www.mass.gov/Eeohhs2/docs/dph/patient_safety/haipcp_final_report_pt2.pdf
Massachusetts Department of Public Health Healthcare Associated Infection Report April 14, 2010
36
32 http://www.macoalition.org/Initiatives/docs/09-27_MACoalition_booklet_web.pdf

The Massachusetts Neonatal Quality Improvement Collaborative Mass NeoQIC is a statewide quality improvement organization representing neonatologists from all 10 level 3 neonatal intensive care units (NICUs) in Massachusetts. NICUs provide care for newborn infants with extreme prematurity or who are critically ill or require surgical intervention. MassNeoQIC has approached MDPH to work with them in their efforts to reduce preventable infections. MDPH staff will collaborate with MassNeoQIC in identification of best practices, reporting of NICU measures of infection and utilization of the data to improve the care of our smallest and most vulnerable patients. Consumer Targeted Information The Partnership for Healthcare Excellence is a broad-based coalition with participants from every segment of the health care community whose aim is to educate and motivate consumers to improve the safety and effectiveness of their own healthcare. Membership includes consumer associations, disease and advocacy organizations, doctors and insurers, business groups, labor, public health advocates and other health care leaders. In efforts to raise awareness and address the steps consumers can take to reduce infection, MDPH supported public information campaigns conducted by the Partnership for Healthcare Excellence. The Partnership produced a fact sheet accessible online that provides concrete actions to help prevent infection. The fact sheet is also available in Spanish, Portuguese, Vietnamese and Cambodian.33
National Efforts to Address HAI HAI as an emerging public health issue has received increasing attention from the public, healthcare providers, the media and legislators. Although there are many state, federal and private agencies working to prevent the occurrence of HAI, until recently a coordinated national effort had not been developed. In January 2009, the U.S. Department of Health and Human Services (HHS) published an Action Plan to Prevent Healthcare-Associated Infections.34 The overall goal of the plan is to improve the coordination of federal activities and resources to accelerate and maximize their impact on reducing HAI. The plan establishes five year national goals and outlines an integrated approach to improve the management of HAI initiatives. It identifies prioritized areas for prevention and includes recommendations for research, and the enhanced use and quality of the metrics and supporting systems needed to assess progress towards meeting the targets. Meeting the challenge of HAI prevention will also require effective collaboration with national, state public and private sector partners. American Recovery and Reinvestment Act of 2009 The American Recovery and Reinvestment Act (ARRA) of 2009, Public Law 111-5 was signed into law on February 17, 2009. The primary purpose of this funding is to promote economic stimulus, maximize job creation, and job retention. In February 2009, the US Department of Health and Human Services (HHS) appropriated $40 million to state health departments for efforts to prevent HAI. In August, 2009, the Center for Disease Control and Prevention announced the award of a $1.5 million grant to Massachusetts to carry out activities to meet the expectations described in the U.S. Department of Health and Human Services 2009 Action Plan to Prevent Healthcare-Associated Infections. This one time only funding to be distributed over a two year period will complement existing state efforts to address HAIs and support the following activities:
33 http://www.partnershipforhealthcare.org/patients_and_caregivers/preventing_infection/ 34 http://www.hhs.gov/ophs/initiatives/hai/infection.html
Massachusetts Department of Public Health Healthcare Associated Infection Report April 14, 2010
37

Massachusetts Department of Public Health Healthcare Associated Infection Report April 14, 2010
38
Coordination and Reporting of State HAI Prevention Efforts
MDPH will enhance efforts to coordinate and implement HAI prevention activities and report on progress toward reductions in selected HHS Action Plan Targets. Designation of a dedicated Coordinator who will focus on HAI prevention and development and implementation of the State HAI Plan are new activities under the ARRA funding.
Detection and Reporting of HAI Surveillance Data Support for this initiative includes plans to improve the quality of the recently implemented NHSN-based reporting system with data cleaning and validation activities. MDPH is working with JSI Research and Training Institute, Inc., to develop and implement a sustainable system of data validation. In addition, there will be time-phased expansion of metrics tracked in order to ultimately assess progress on 5 of 7 HHS Action Plan Targets. This expansion will be facilitated by enhanced capacity for electronic laboratory reporting (ELR).
Establishing a Prevention Collaborative MDPH has partnered with the Massachusetts Coalition for the Prevention of Medical Errors to conduct two collaborative initiatives targeting reductions in central line associated blood stream infection (CLABSI), and multi-drug resistant organisms (MDROs). The comprehensive infection prevention training is intended to promote measureable progress toward the national prevention targets outlined in the HHS Action Plan to Prevent HAIs.
Massachusetts State HAI Action Plan The 2009 ARRA bill required states receiving funds to certify that they would submit a plan to reduce HAIs to the Secretary of Health and Human Services (HHS) no later than January 1, 2010. As directed, MDPH presented the Massachusetts State HAI Prevention Plan to HHS on December 30, 2009. The adoption of a formal plan identifies state level long range prevention targets and is consistent with national five year HHS goals and objectives. The plan was created with input from the TAG. Implementation of the recommendations detailed in the Plan will be reviewed on an ongoing basis. Additional goals, objectives and activities will be developed as areas of need are identified. The plan is available for review on the following website. www.mass.gov/dph/dhcq To see what other states are planning please access the following clickable map. http://www.cdc.gov/HAI/recoveryact/map.html