Embed Size (px)
Citation preview
HEALTH, WORKPLACE, AND ENVIRONMENT: CULTIVATING CONNECTIONS
October 17, 2013
Worker Health = Economic Health
Health, Workplace, and Environment: Cultivating Connections Conference
University of Connecticut Storrs Campus 17 October 2013
John Howard National Institute for Occupational Safety and Health
U.S. Department of Health and Human Services Washington, D.C.
Overview • Economic Health
• Worker Health
• Social Costs
• Wellness Wars
• TWHTM
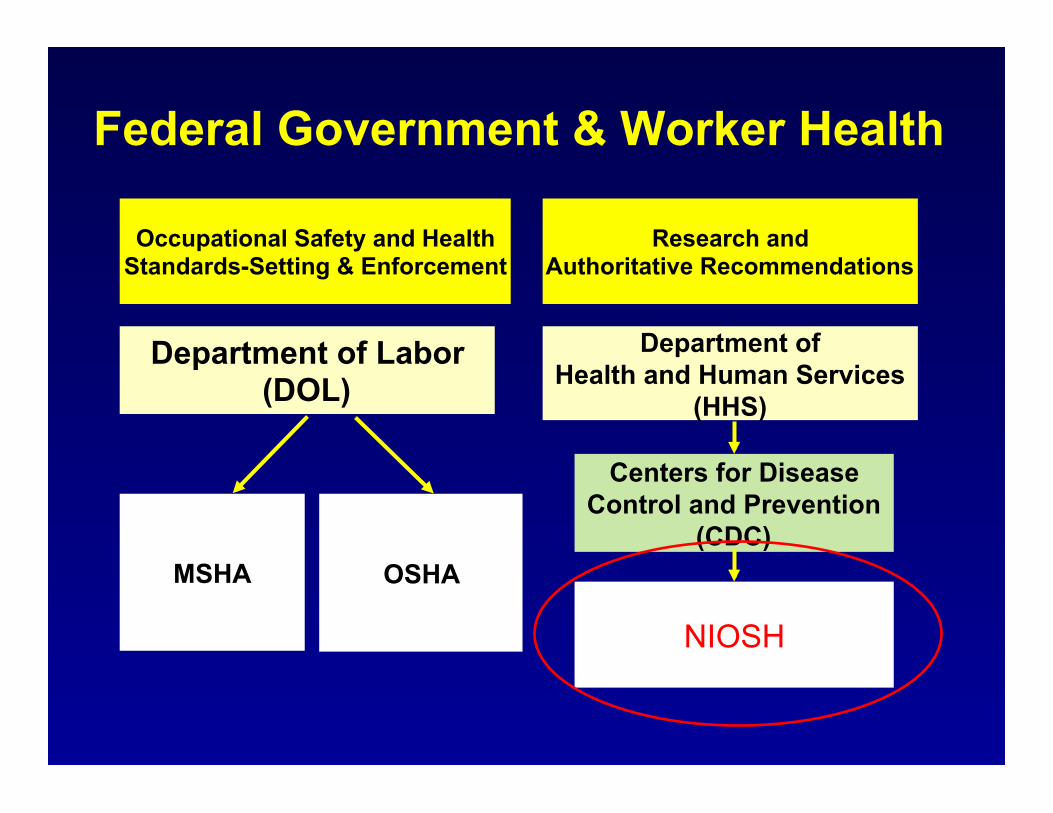
Federal Government & Worker Health
MSHA
Department of Health and Human Services
(HHS)
Department of Labor (DOL)
OSHA
Research and Authoritative Recommendations
Centers for Disease Control and Prevention
(CDC)
NIOSH
Occupational Safety and Health Standards-Setting & Enforcement
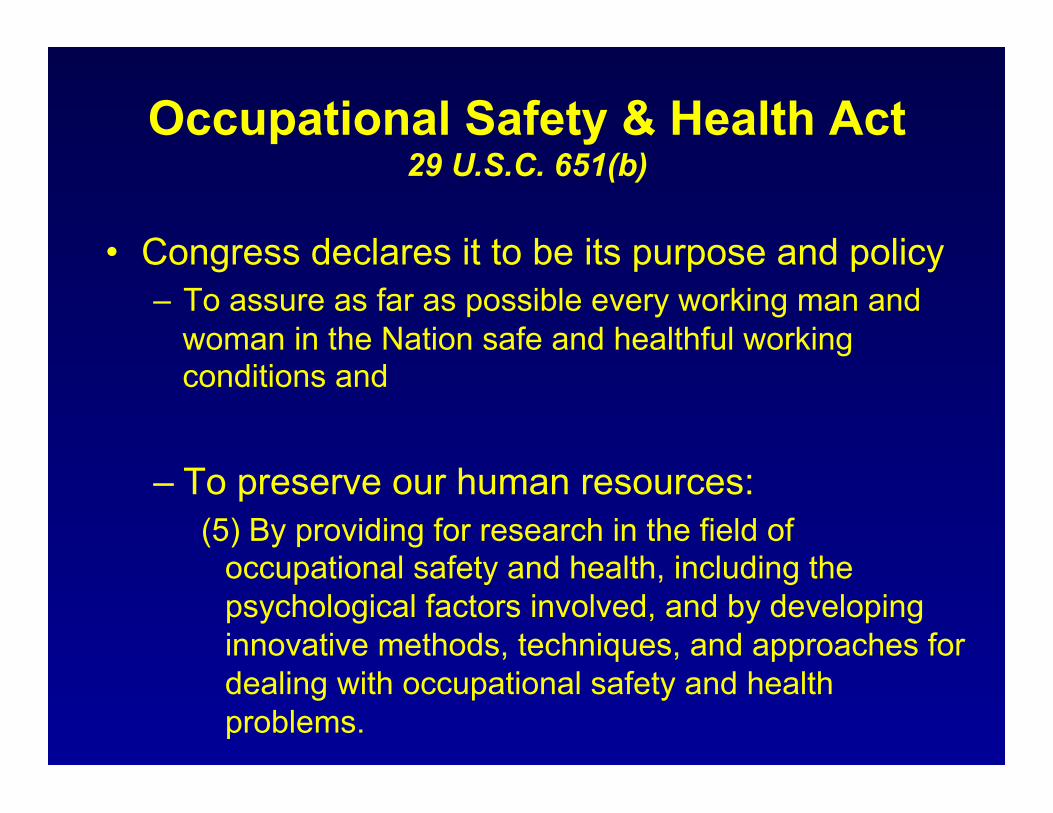
Occupational Safety & Health Act 29 U.S.C. 651(b)
• Congress declares it to be its purpose and policy – To assure as far as possible every working man and
woman in the Nation safe and healthful working conditions and
– To preserve our human resources: (5) By providing for research in the field of
occupational safety and health, including the psychological factors involved, and by developing innovative methods, techniques, and approaches for dealing with occupational safety and health problems.
Who is responsible for health of the workforce?
• Workers? • Employers? • Food Producers and Food Purveyors? • Healthcare providers? • Healthcare insurers? • Workers’ compensation insurers? • Government? • Nobody? • Everybody?
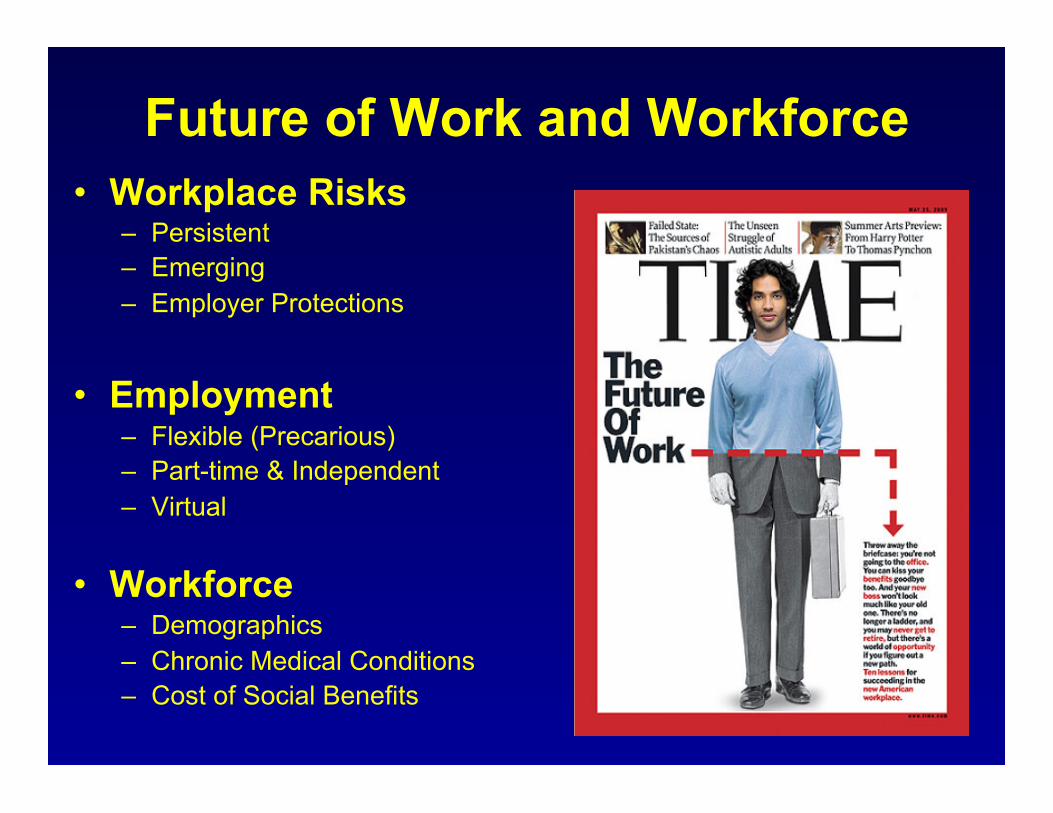
Future of Work and Workforce • Workplace Risks
– Persistent – Emerging – Employer Protections
• Employment – Flexible (Precarious) – Part-time & Independent – Virtual
• Workforce – Demographics – Chronic Medical Conditions – Cost of Social Benefits
What Makes Countries Rich?
• Long run economic growth determines our standard of living
• Long run economic growth hinges on a
country’s productive potential.
• Greg Ip, The Little Book of Economics: How the Economy Works in the Real World (2013)
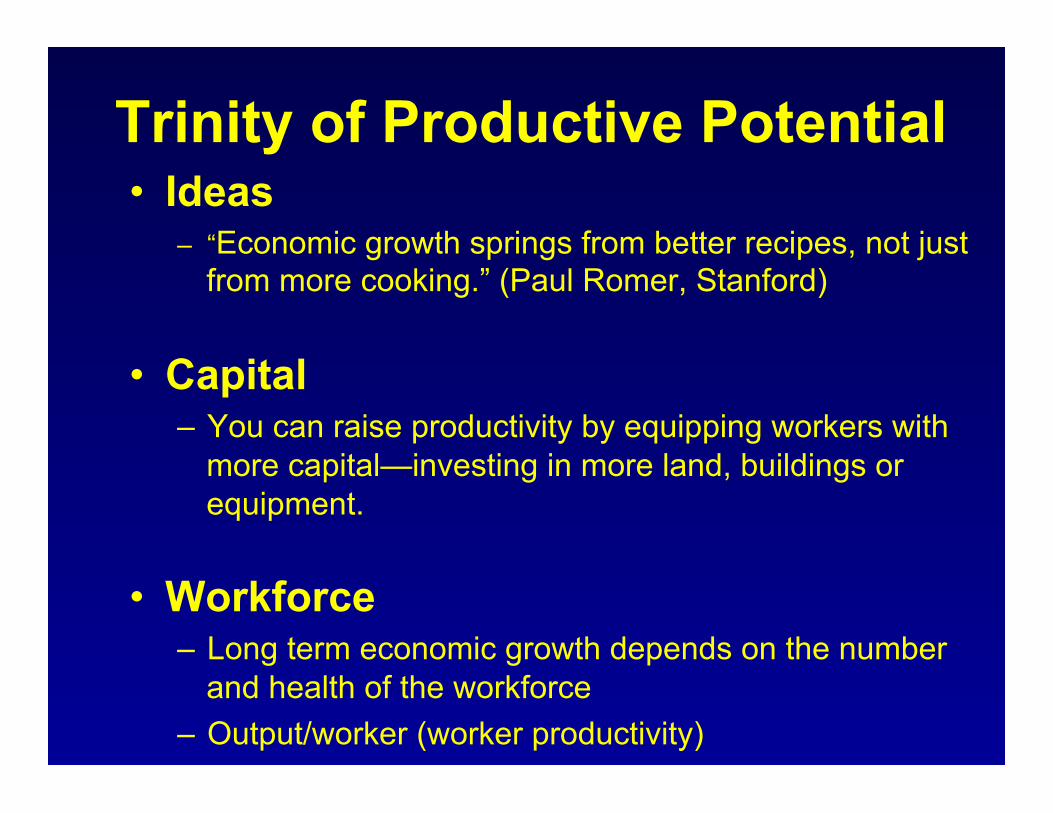
Trinity of Productive Potential • Ideas
– “Economic growth springs from better recipes, not just from more cooking.” (Paul Romer, Stanford)
• Capital – You can raise productivity by equipping workers with
more capital—investing in more land, buildings or equipment.
• Workforce – Long term economic growth depends on the number
and health of the workforce – Output/worker (worker productivity)
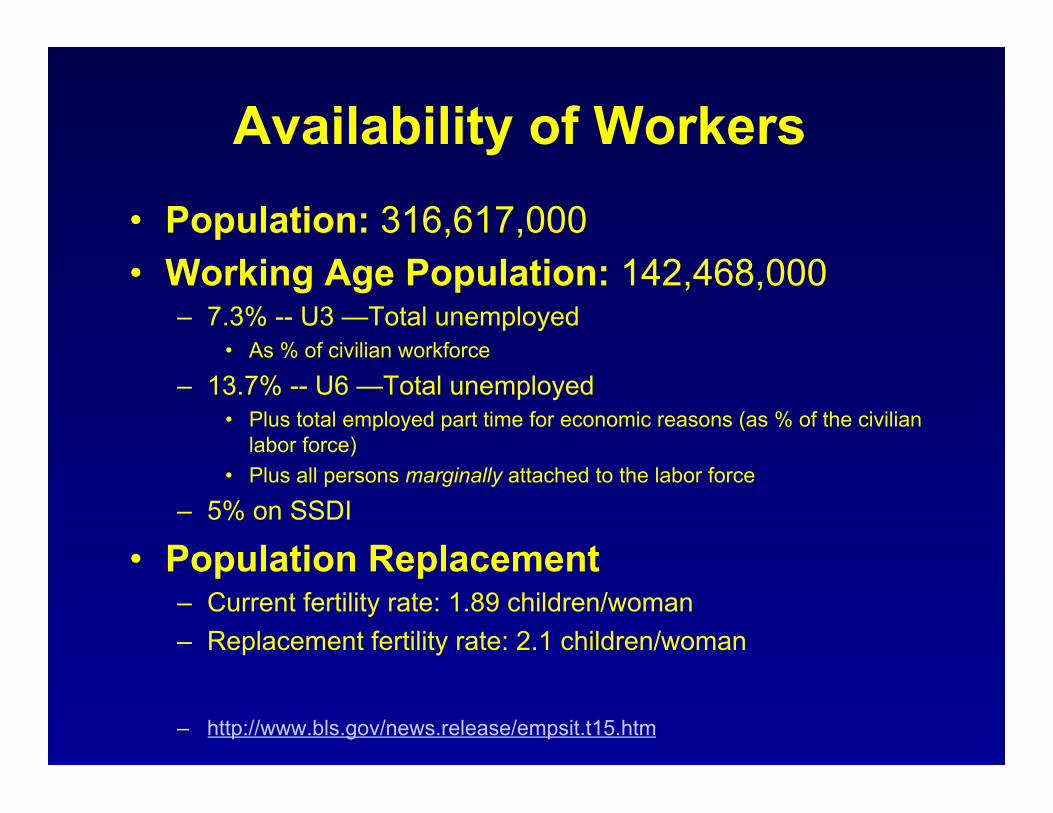
Availability of Workers • Population: 316,617,000 • Working Age Population: 142,468,000
– 7.3% -- U3 —Total unemployed • As % of civilian workforce
– 13.7% -- U6 —Total unemployed • Plus total employed part time for economic reasons (as % of the civilian
labor force) • Plus all persons marginally attached to the labor force
– 5% on SSDI • Population Replacement
– Current fertility rate: 1.89 children/woman – Replacement fertility rate: 2.1 children/woman
– http://www.bls.gov/news.release/empsit.t15.htm

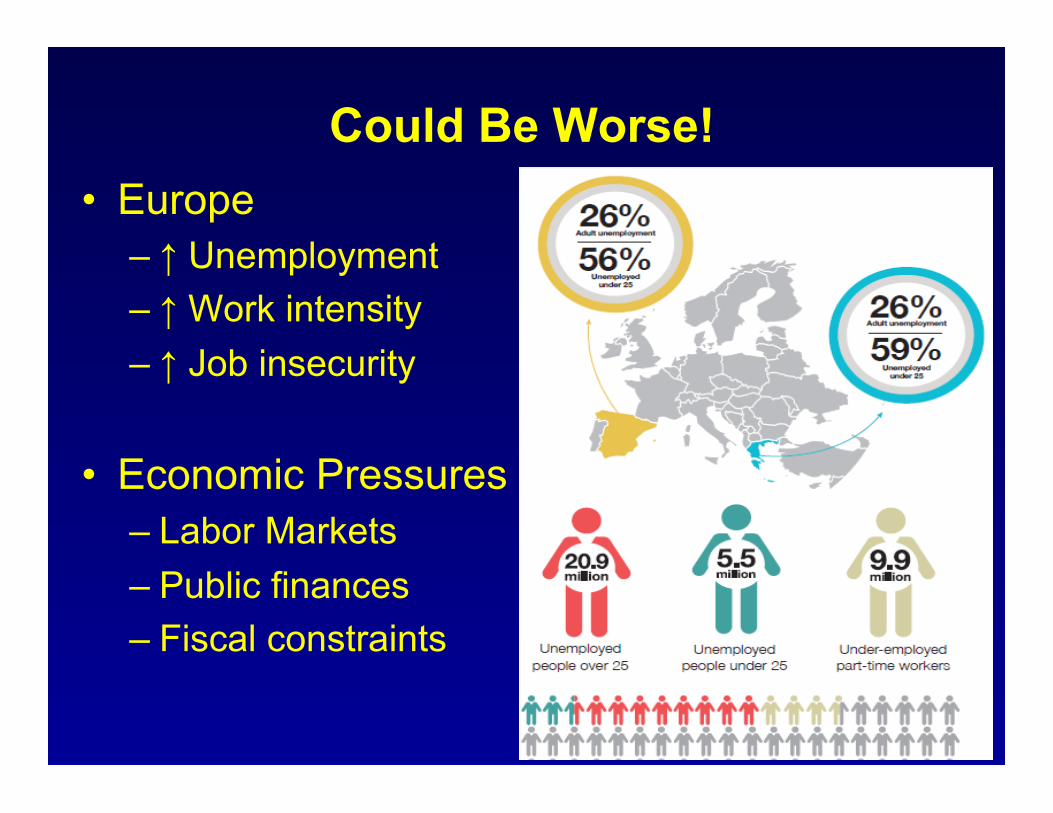
Could Be Worse! • Europe
– ↑ Unemployment – ↑ Work intensity – ↑ Job insecurity
• Economic Pressures – Labor Markets – Public finances – Fiscal constraints
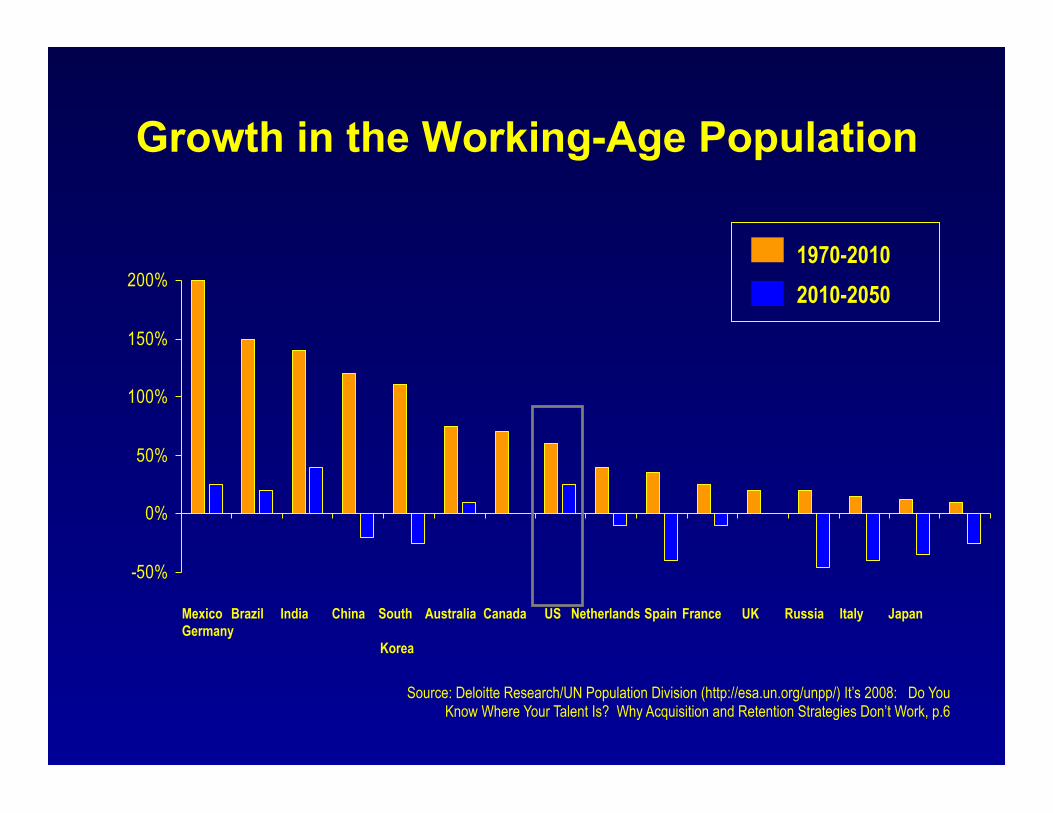
Growth in the Working-Age Population
Source: Deloitte Research/UN Population Division (http://esa.un.org/unpp/) It’s 2008: Do You Know Where Your Talent Is? Why Acquisition and Retention Strategies Don’t Work, p.6
-50%
0%
50%
100%
150%
200%
Mexico Brazil India China South Australia Canada US Netherlands Spain France UK Russia Italy Japan Germany
Korea
1970-2010 2010-2050
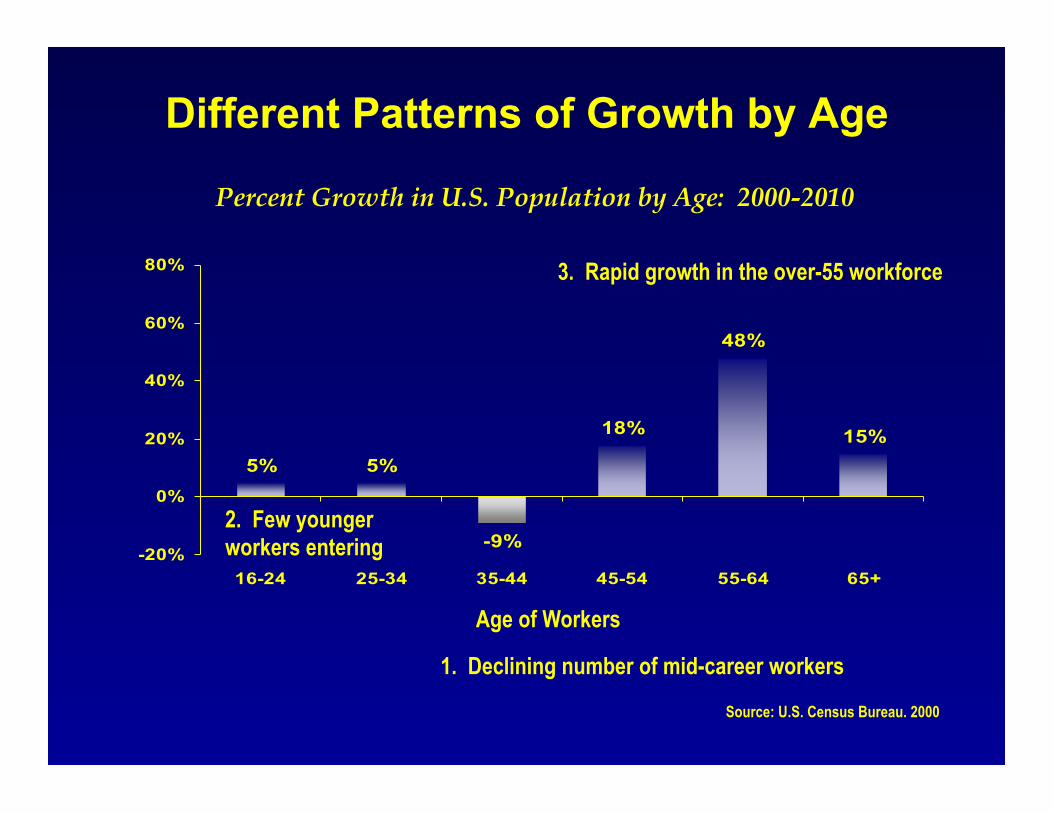
5% 5%
-9%
18%
48%
15%
-20%
0%
20%
40%
60%
80%
16-24 25-34 35-44 45-54 55-64 65+
Age of Workers
Percent Growth in U.S. Population by Age: 2000-2010
Different Patterns of Growth by Age
1. Declining number of mid-career workers
2. Few younger workers entering
3. Rapid growth in the over-55 workforce
Source: U.S. Census Bureau. 2000
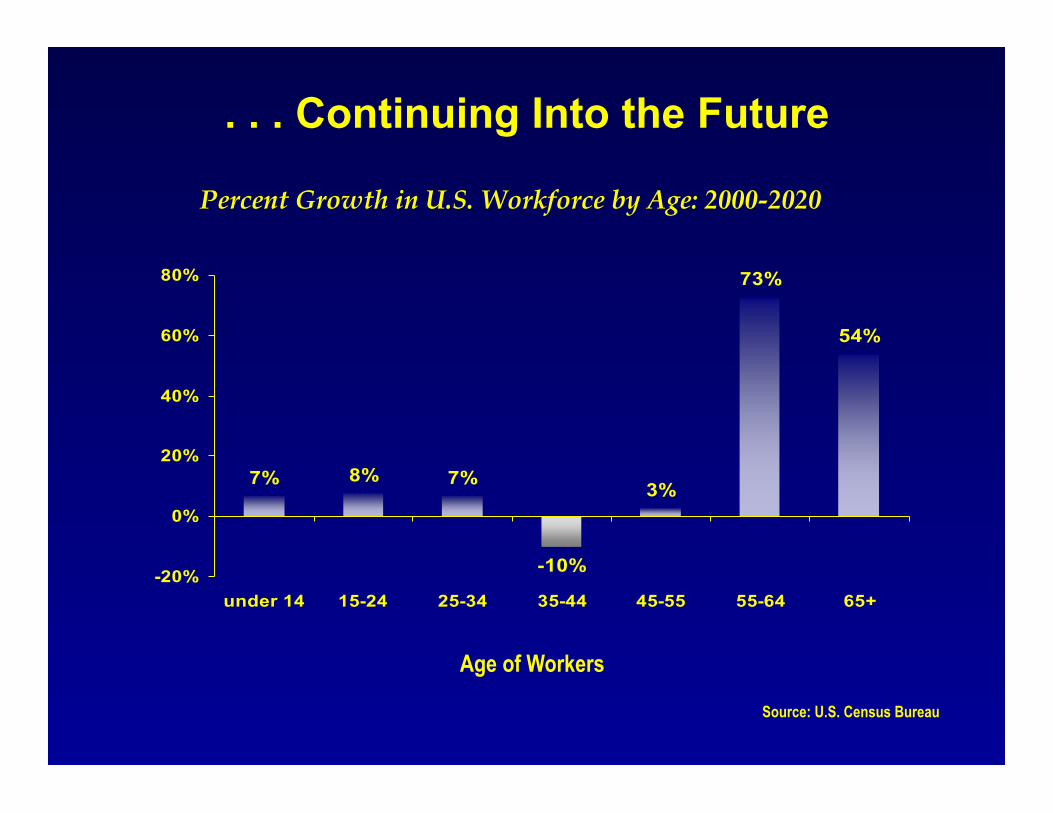
. . . Continuing Into the Future
Age of Workers
Percent Growth in U.S. Workforce by Age: 2000-2020
7% 8% 7%
-10%
3%
73%
54%
-20%
0%
20%
40%
60%
80%
under 14 15-24 25-34 35-44 45-55 55-64 65+
Source: U.S. Census Bureau
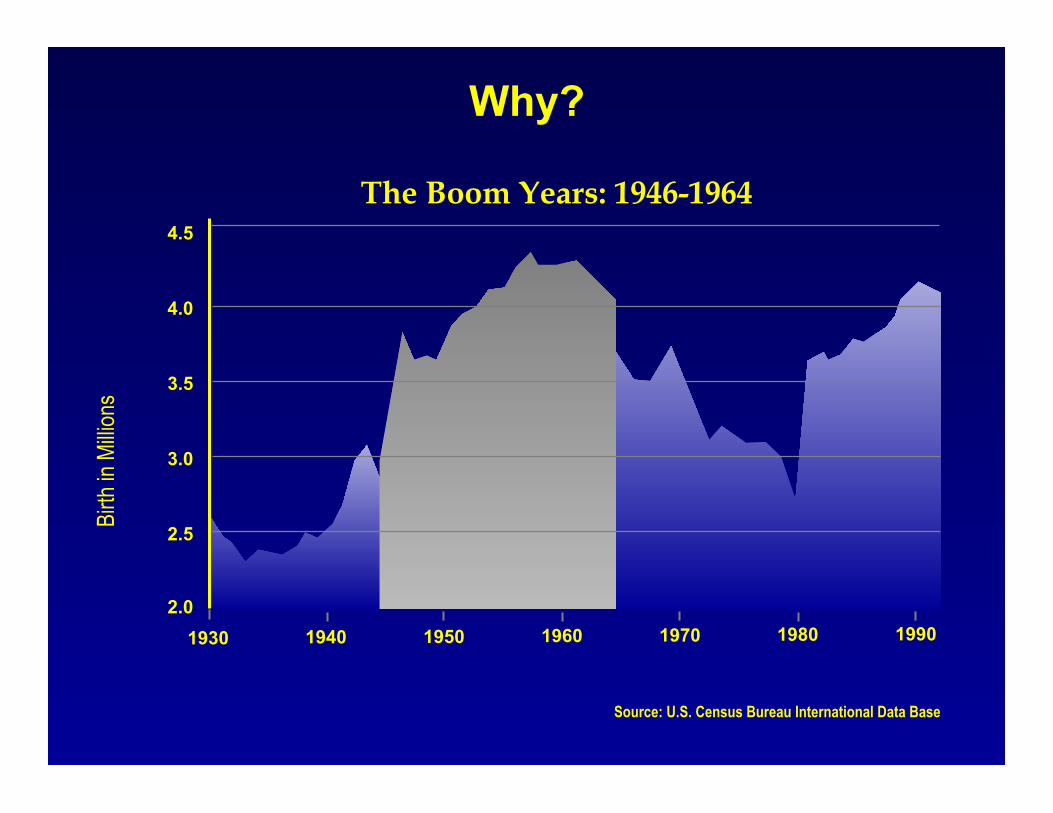
Why?
Source: U.S. Census Bureau International Data Base
1930 1940 1950 1960 1970 1980 1990
4.5
4.0
3.5
3.0
2.5
2.0
Birth
in M
illion
s
The Boom Years: 1946-1964
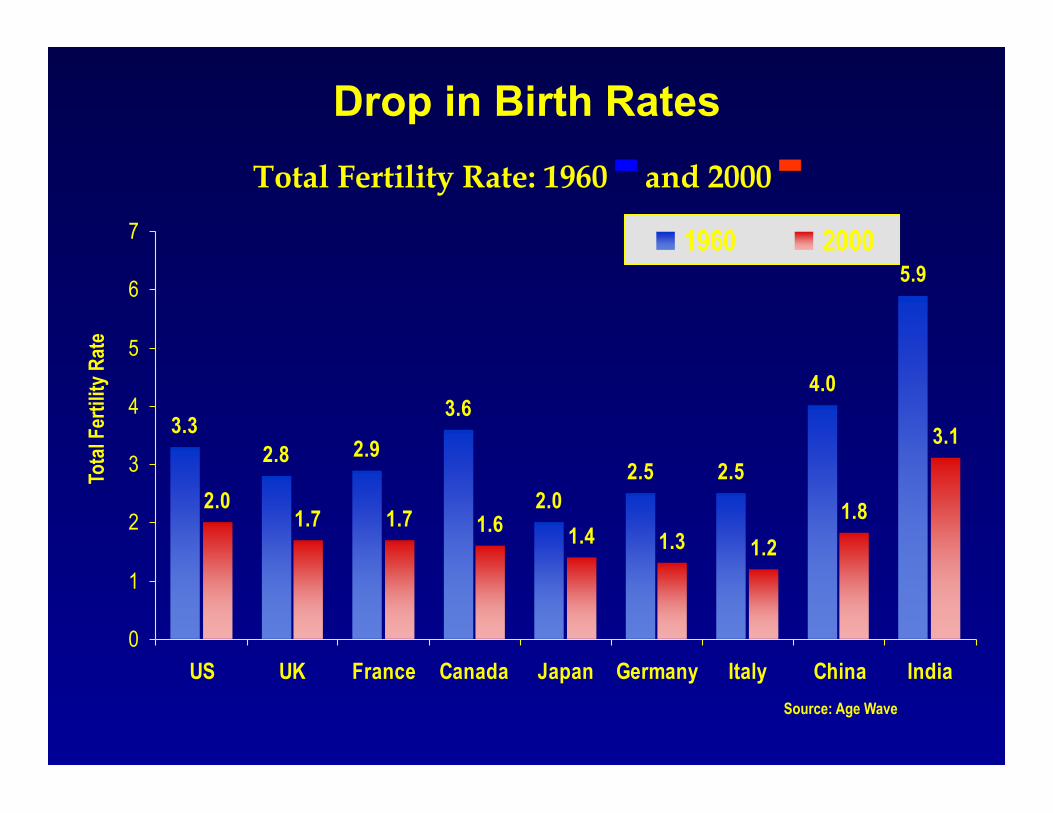
Drop in Birth Rates
Source: Age Wave
Tota
l Fer
tility
Rat
e
3.32.8 2.9
3.6
2.02.5 2.5
4.0
5.9
2.01.7 1.7 1.6 1.4 1.3 1.2
1.8
3.1
0
1
2
3
4
5
6
7
US UK France Canada Japan Germany Italy China India
1960 2000
Total Fertility Rate: 1960 ▀ and 2000 ▀
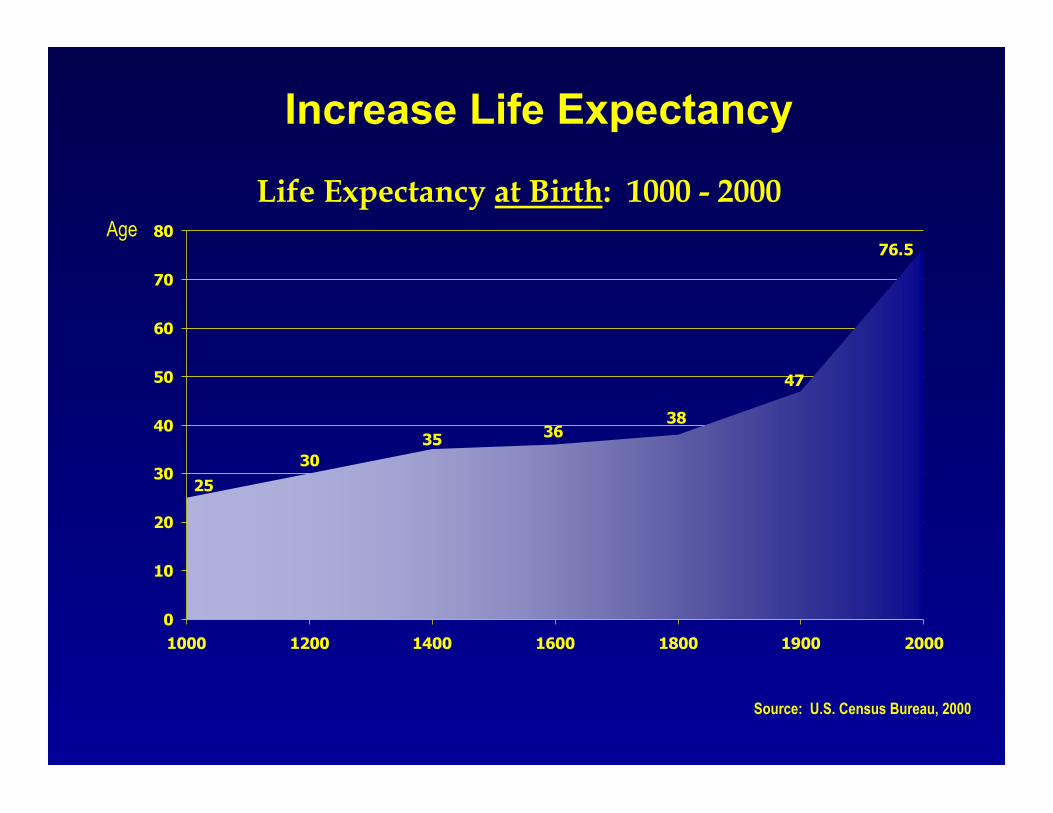
Increase Life Expectancy
Source: U.S. Census Bureau, 2000
Life Expectancy at Birth: 1000 - 2000 Age
76.5
47
383635
3025
0
10
20
30
40
50
60
70
80
1000 1200 1400 1600 1800 1900 2000
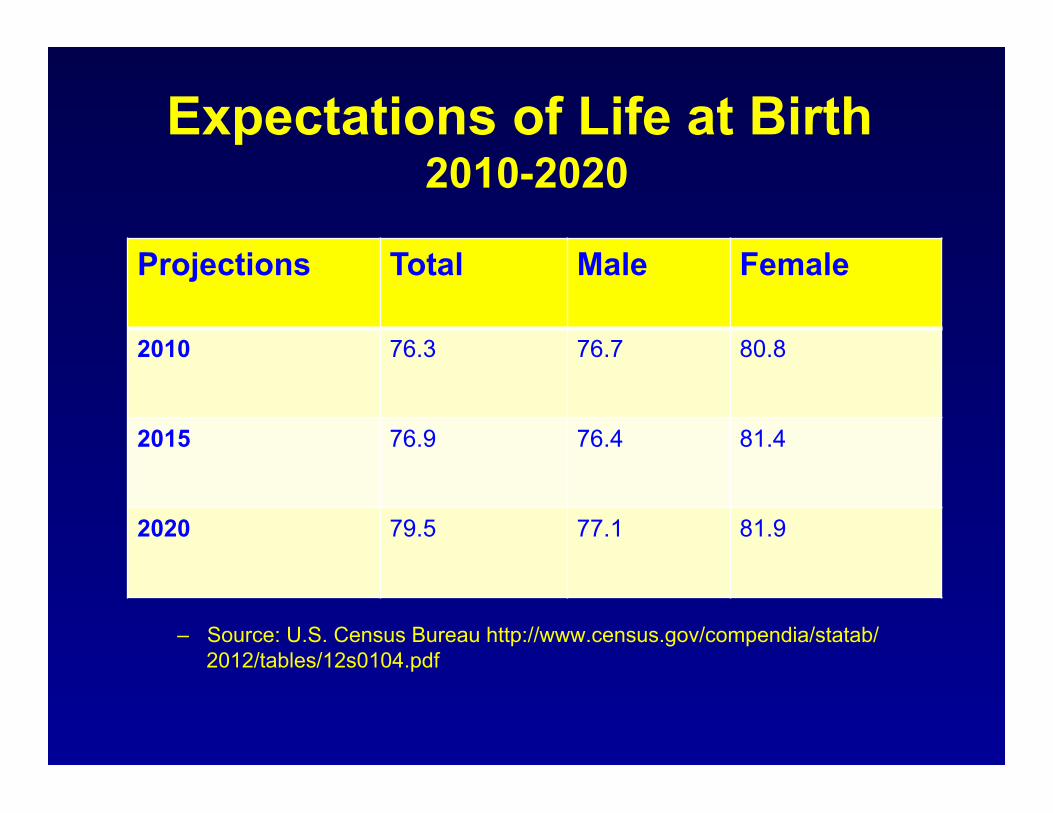
Expectations of Life at Birth 2010-2020
– Source: U.S. Census Bureau http://www.census.gov/compendia/statab/2012/tables/12s0104.pdf
Projections Total Male Female
2010 76.3 76.7 80.8
2015 76.9 76.4 81.4
2020 79.5 77.1 81.9
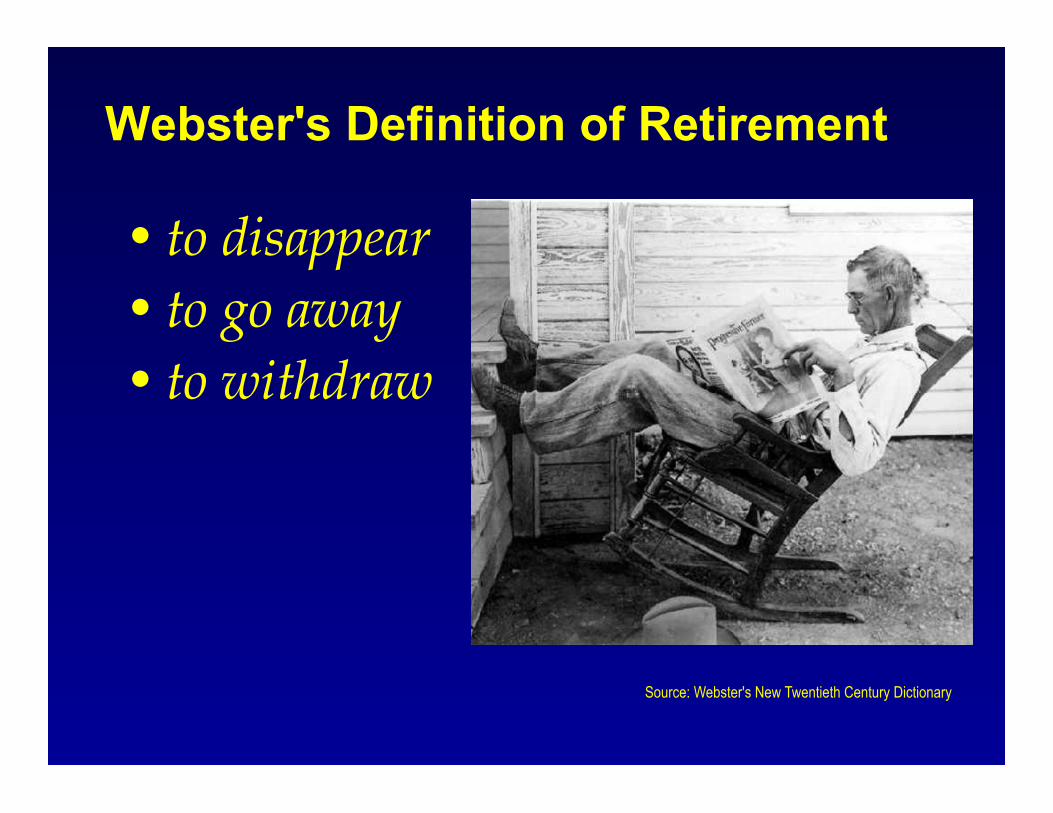
• to disappear • to go away • to withdraw
Source: Webster's New Twentieth Century Dictionary
Webster's Definition of Retirement
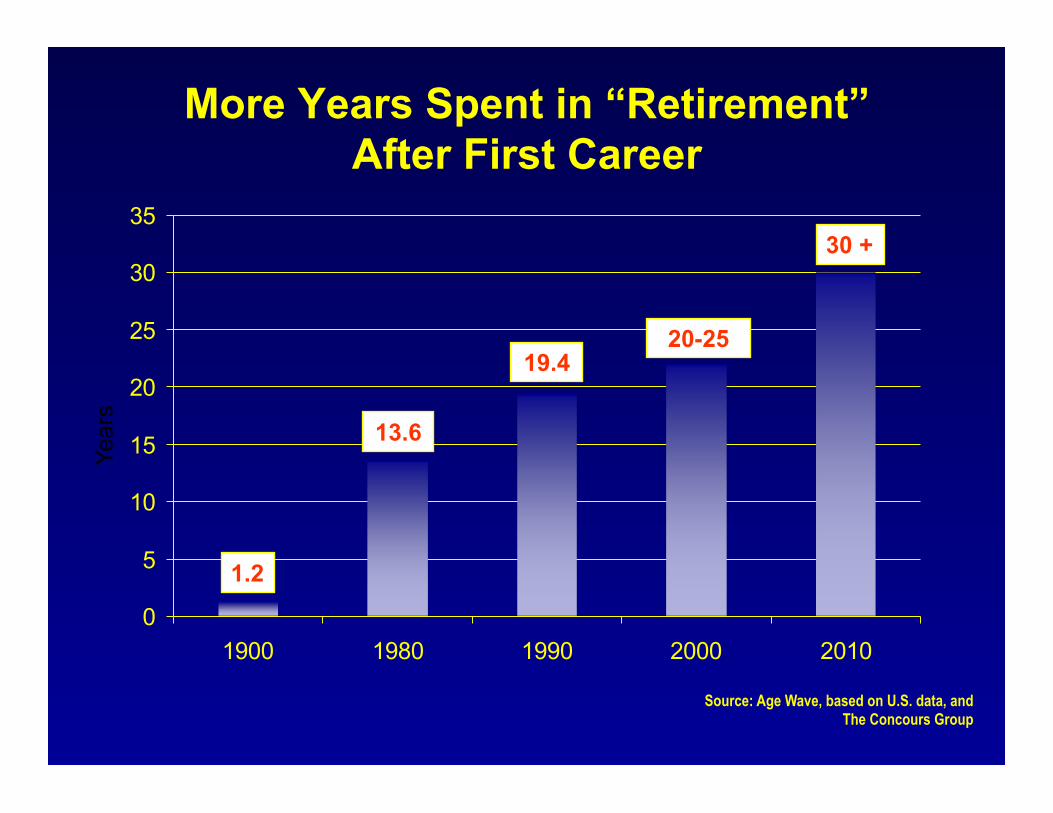
More Years Spent in “Retirement” After First Career
0
5
10
15
20
25
30
35
1900 1980 1990 2000 2010
13.6
19.4 20-25
1.2
Year
s
Source: Age Wave, based on U.S. data, and The Concours Group
30 +
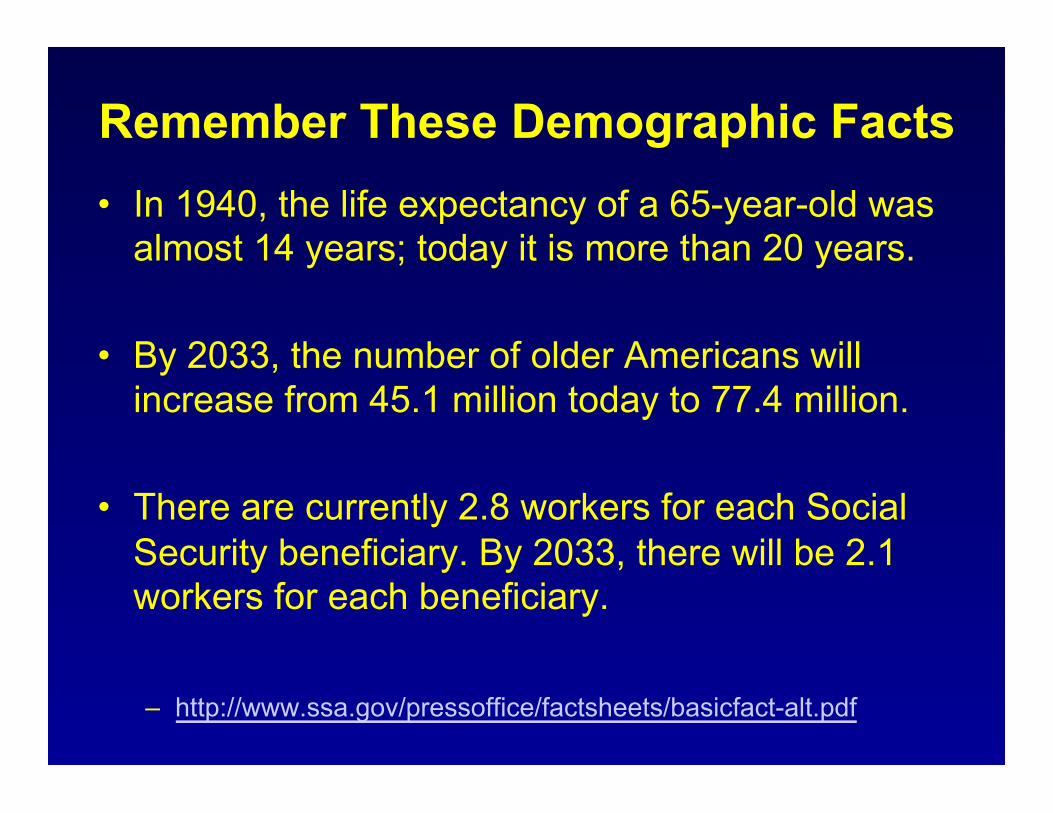
Remember These Demographic Facts • In 1940, the life expectancy of a 65-year-old was
almost 14 years; today it is more than 20 years.
• By 2033, the number of older Americans will increase from 45.1 million today to 77.4 million.
• There are currently 2.8 workers for each Social Security beneficiary. By 2033, there will be 2.1 workers for each beneficiary.
– http://www.ssa.gov/pressoffice/factsheets/basicfact-alt.pdf

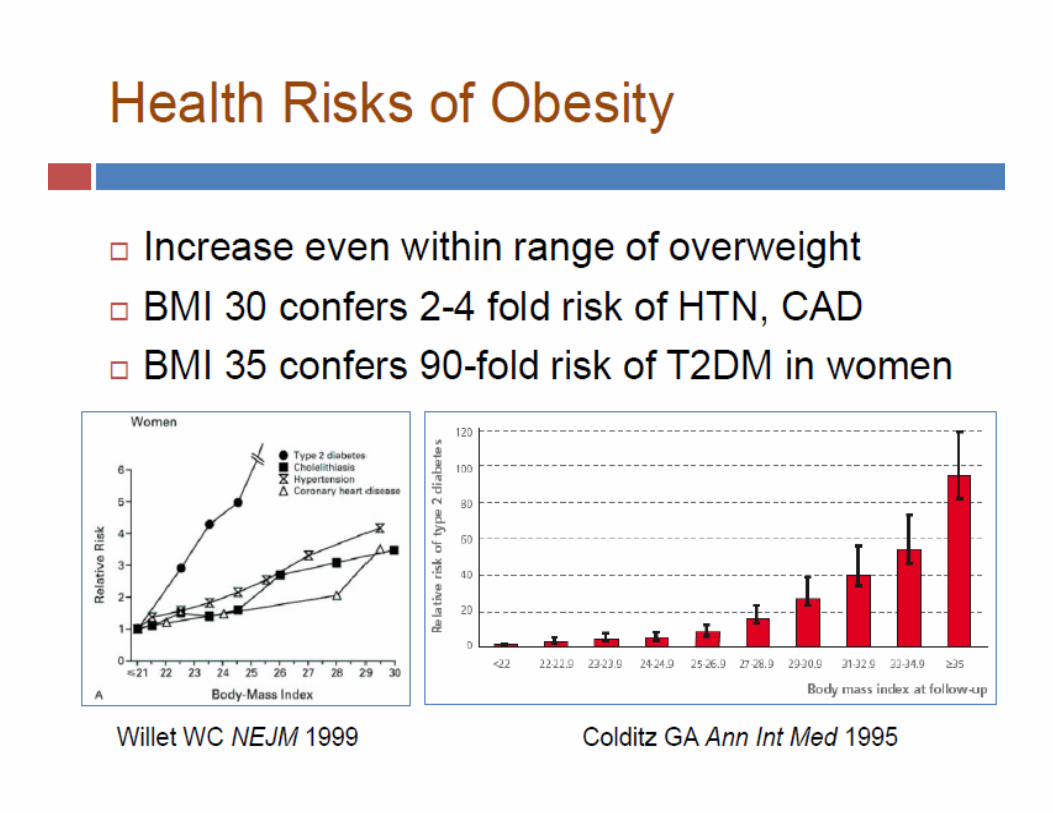
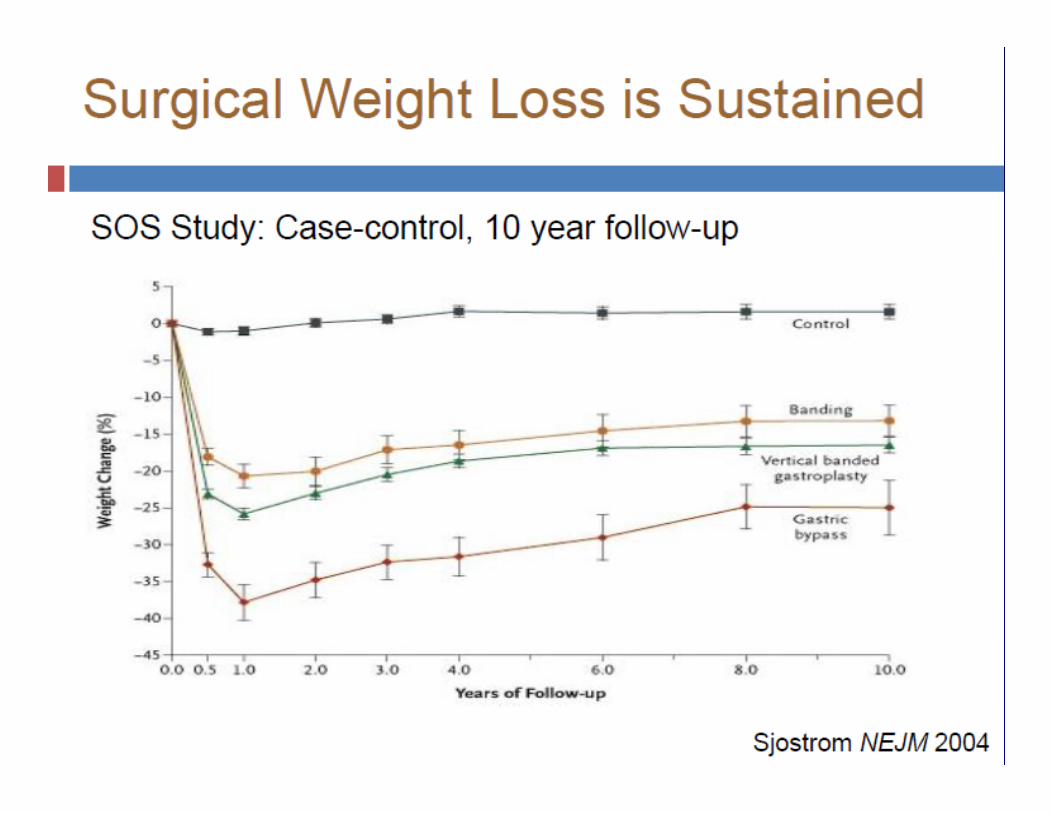
Selected Workforce Health
• Obesity
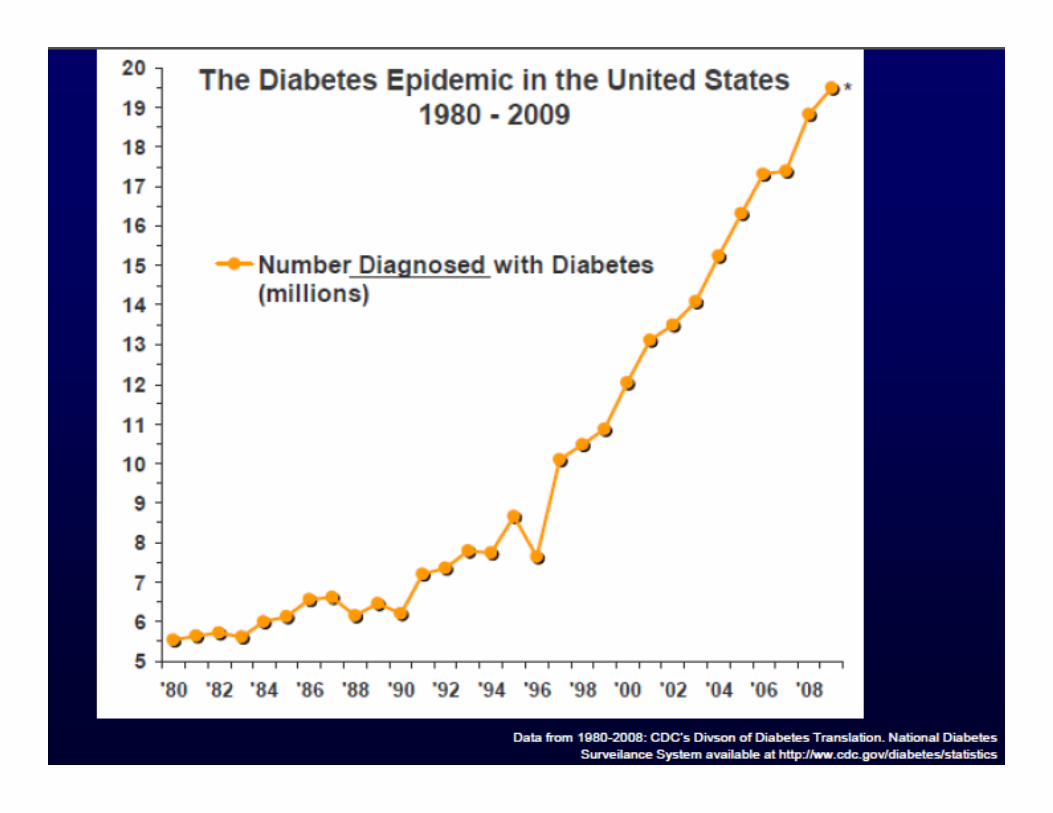
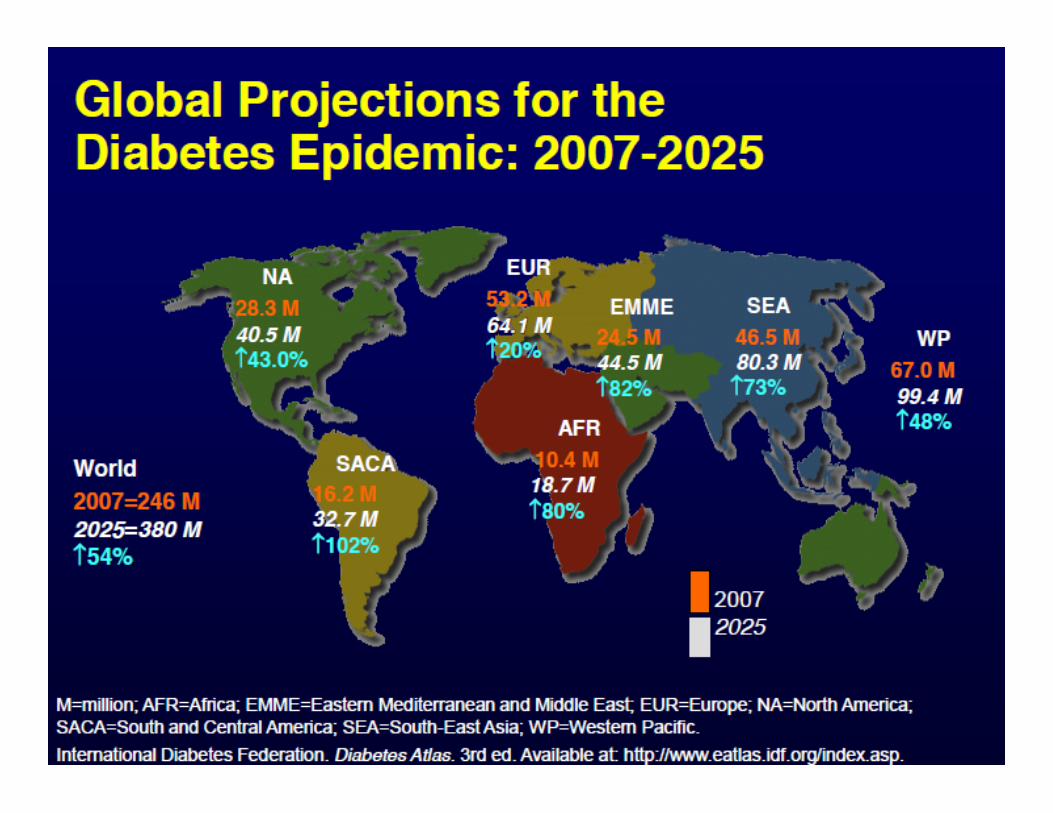
• Diabetes Mellitus
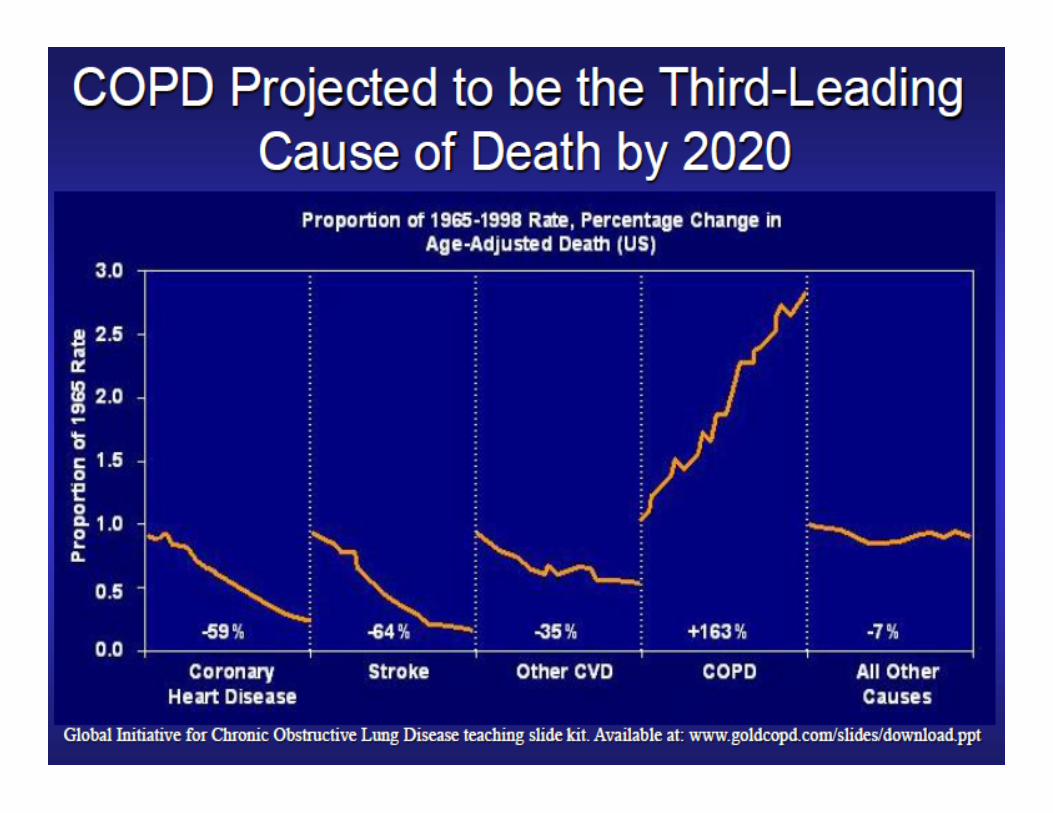
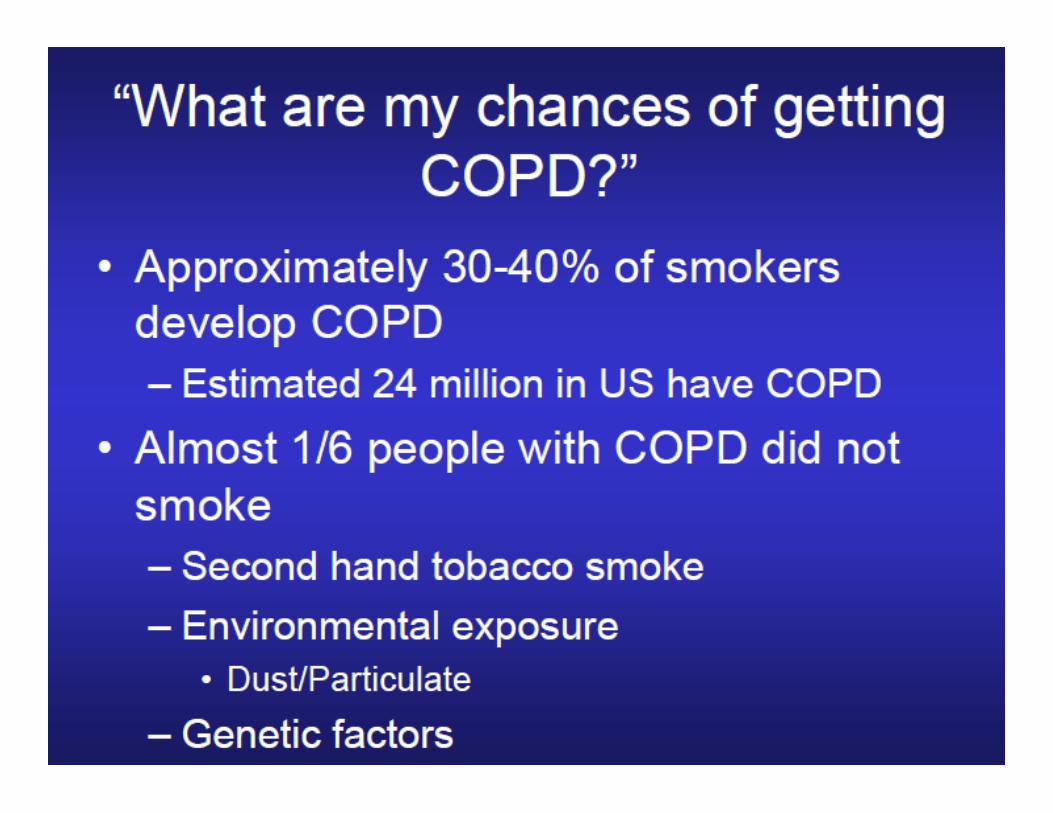
• COPD
• Age
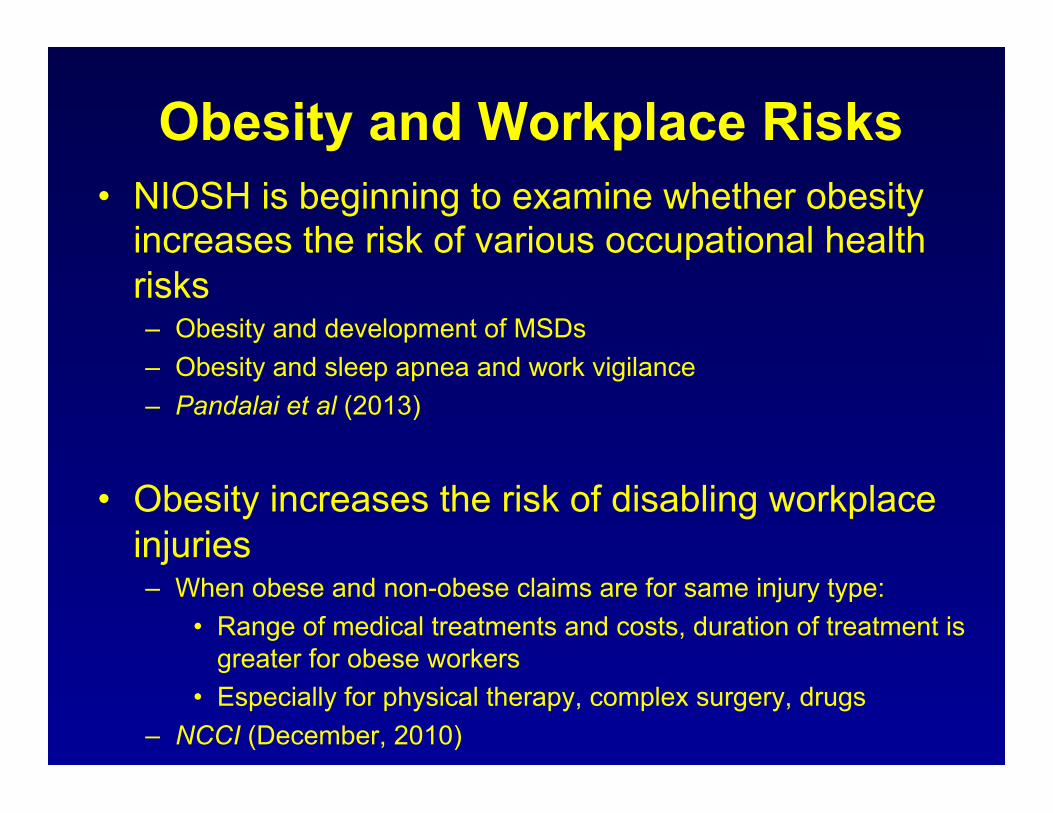
Obesity and Workplace Risks • NIOSH is beginning to examine whether obesity
increases the risk of various occupational health risks – Obesity and development of MSDs – Obesity and sleep apnea and work vigilance – Pandalai et al (2013)
• Obesity increases the risk of disabling workplace injuries – When obese and non-obese claims are for same injury type:
• Range of medical treatments and costs, duration of treatment is greater for obese workers
• Especially for physical therapy, complex surgery, drugs – NCCI (December, 2010)
Health Challenged Young Workers
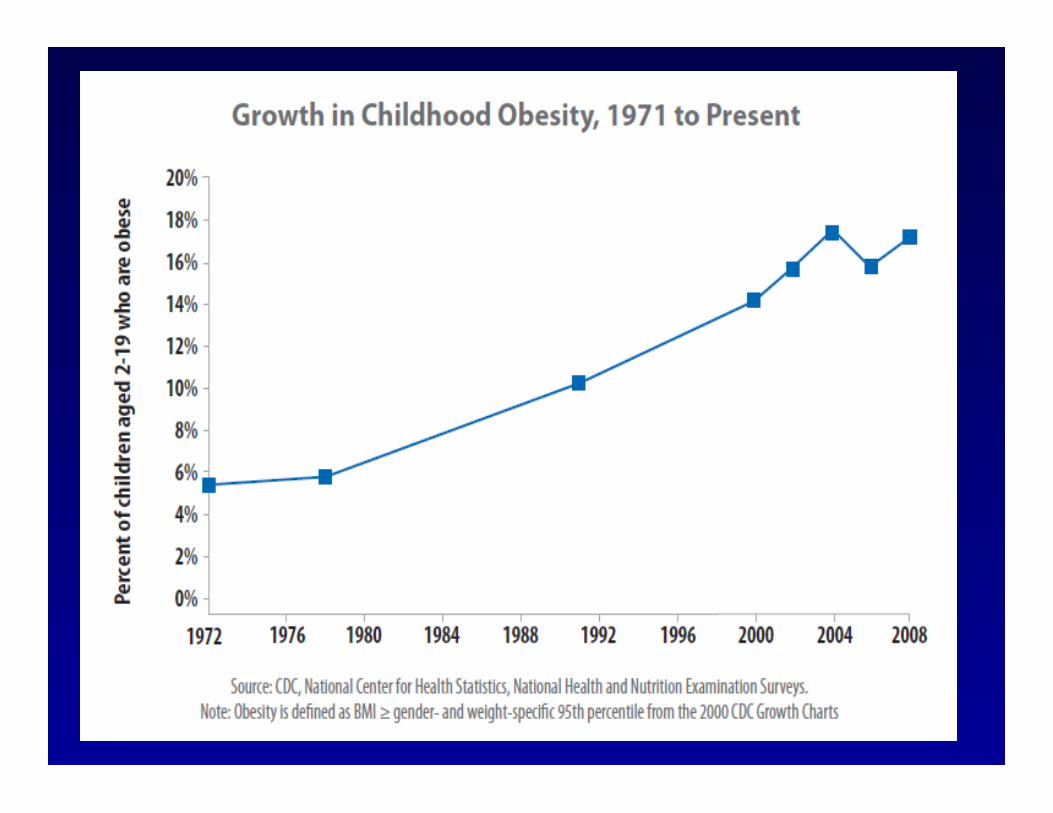
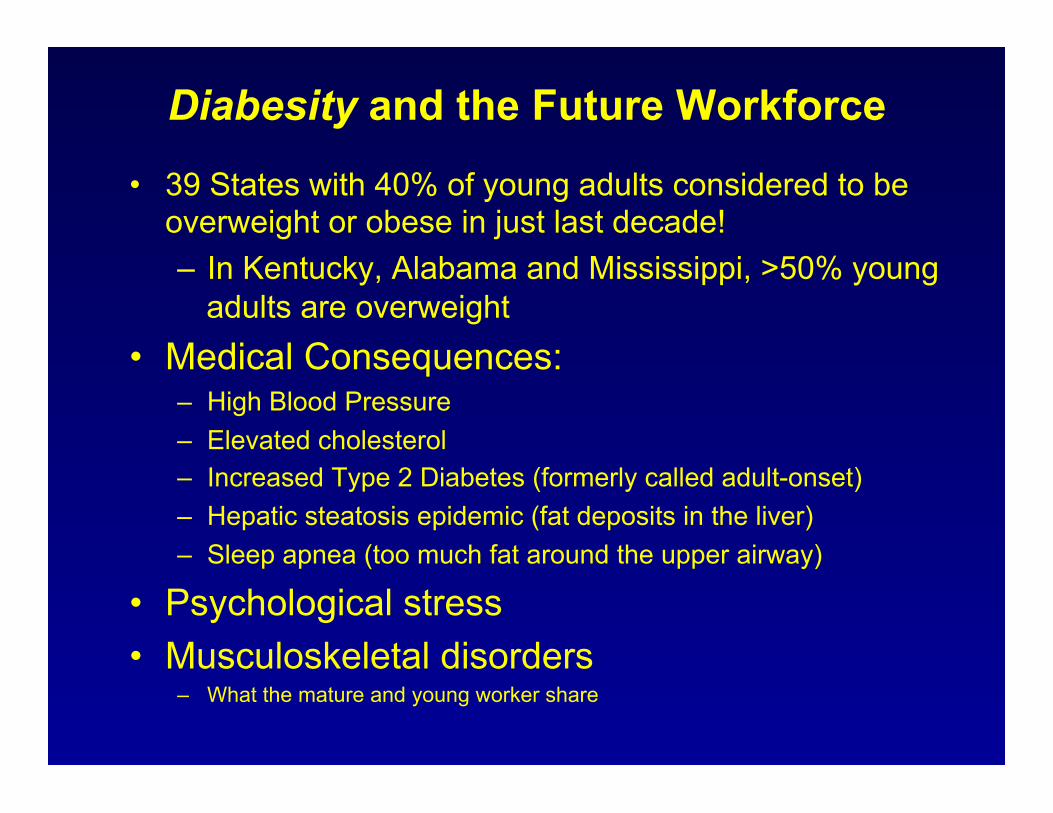
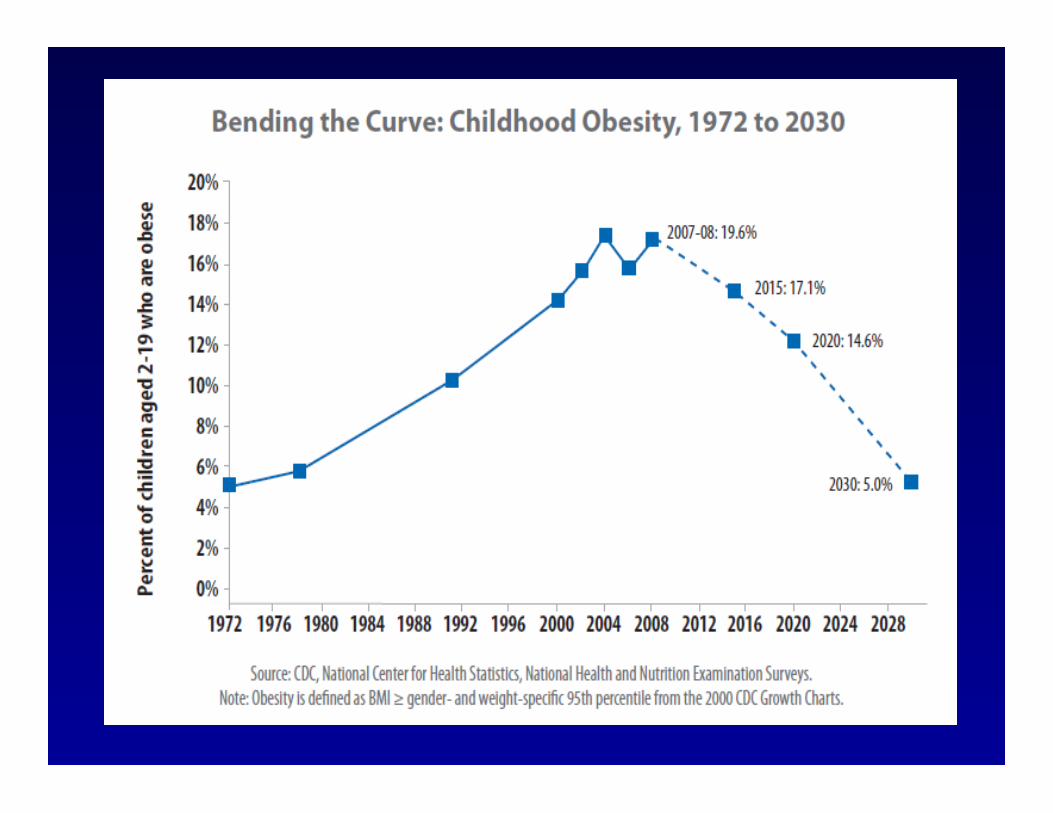
Diabesity and the Future Workforce
• 39 States with 40% of young adults considered to be overweight or obese in just last decade! – In Kentucky, Alabama and Mississippi, >50% young
adults are overweight • Medical Consequences:
– High Blood Pressure – Elevated cholesterol – Increased Type 2 Diabetes (formerly called adult-onset) – Hepatic steatosis epidemic (fat deposits in the liver) – Sleep apnea (too much fat around the upper airway)
• Psychological stress • Musculoskeletal disorders
– What the mature and young worker share
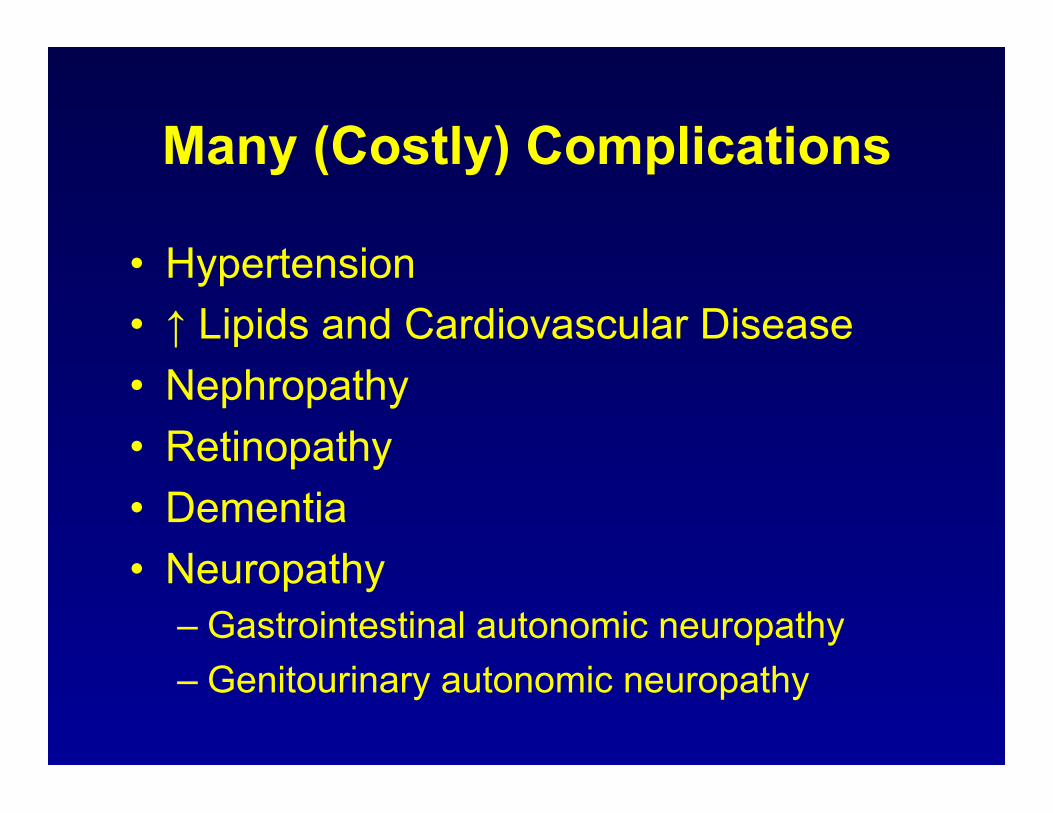
Many (Costly) Complications
• Hypertension • ↑ Lipids and Cardiovascular Disease • Nephropathy • Retinopathy • Dementia • Neuropathy
– Gastrointestinal autonomic neuropathy – Genitourinary autonomic neuropathy
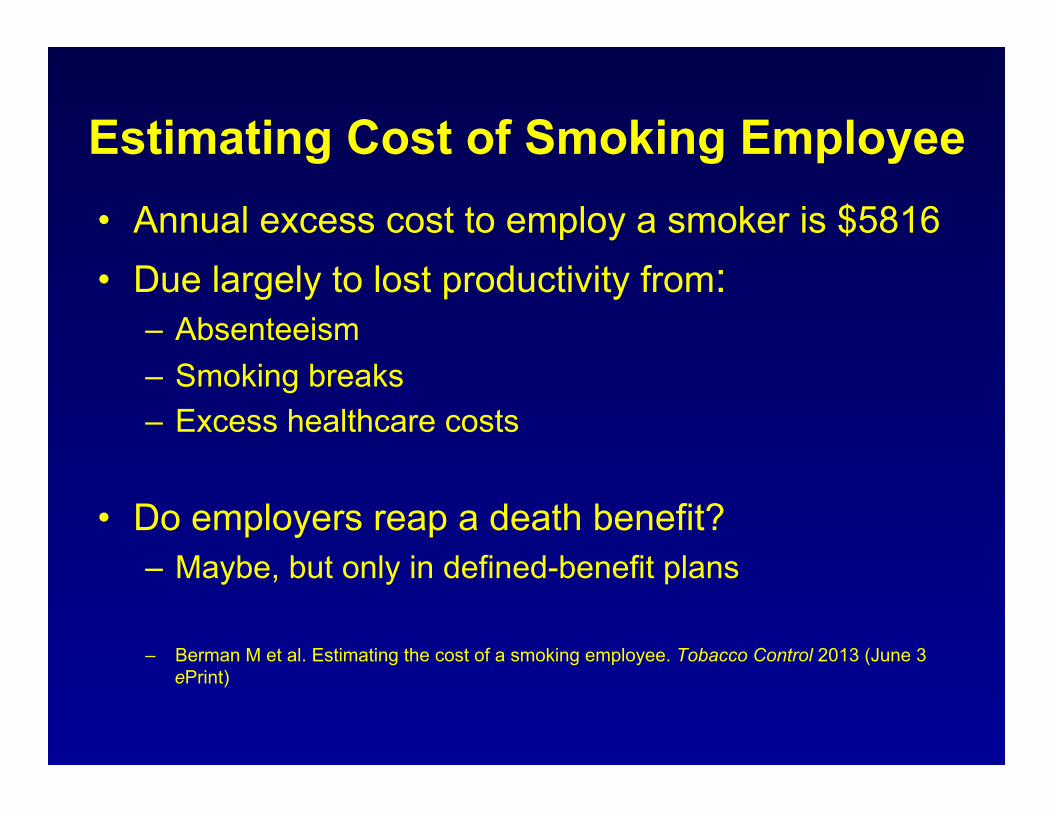
Estimating Cost of Smoking Employee • Annual excess cost to employ a smoker is $5816 • Due largely to lost productivity from:
– Absenteeism – Smoking breaks – Excess healthcare costs
• Do employers reap a death benefit? – Maybe, but only in defined-benefit plans
– Berman M et al. Estimating the cost of a smoking employee. Tobacco Control 2013 (June 3 ePrint)
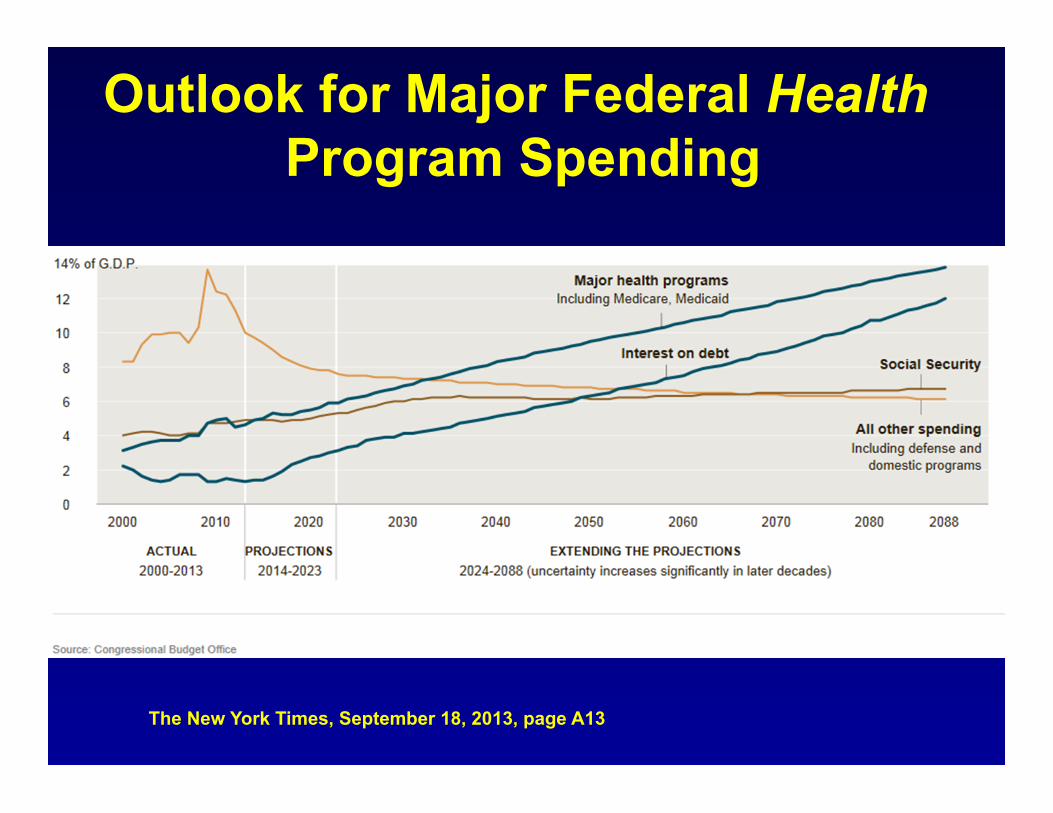
Outlook for Major Federal Health Program Spending
The New York Times, September 18, 2013, page A13
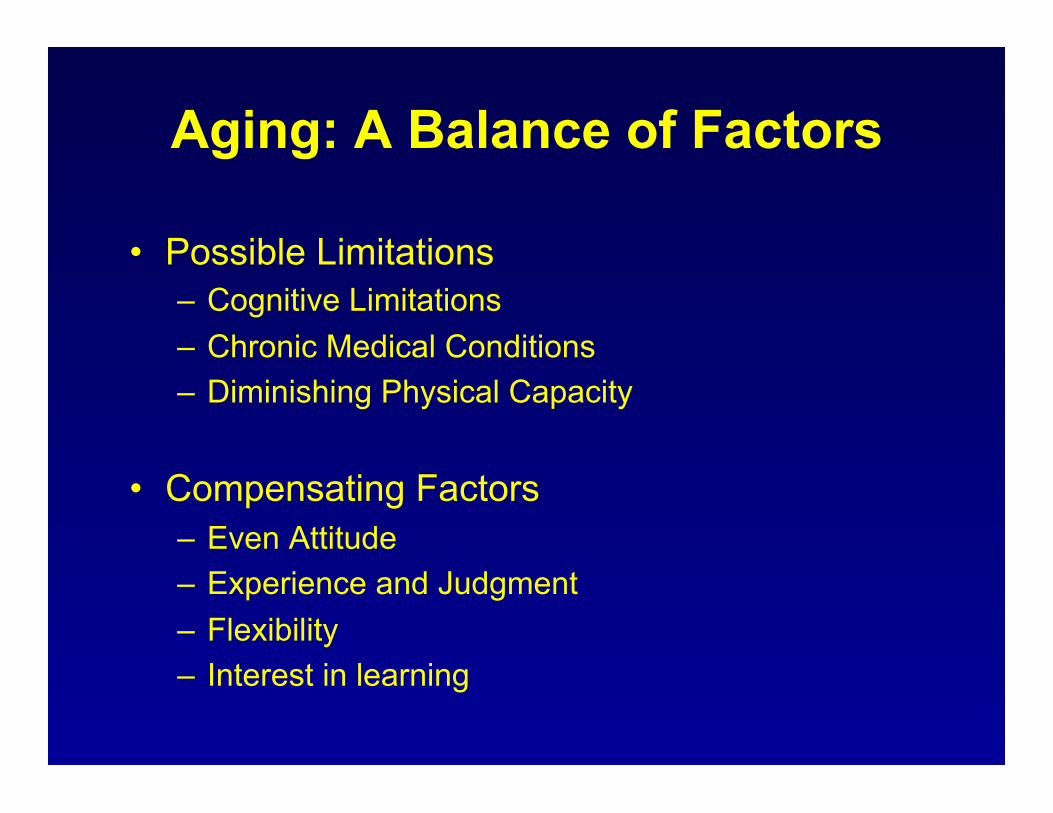
Aging: A Balance of Factors
• Possible Limitations – Cognitive Limitations – Chronic Medical Conditions – Diminishing Physical Capacity
• Compensating Factors – Even Attitude – Experience and Judgment – Flexibility – Interest in learning
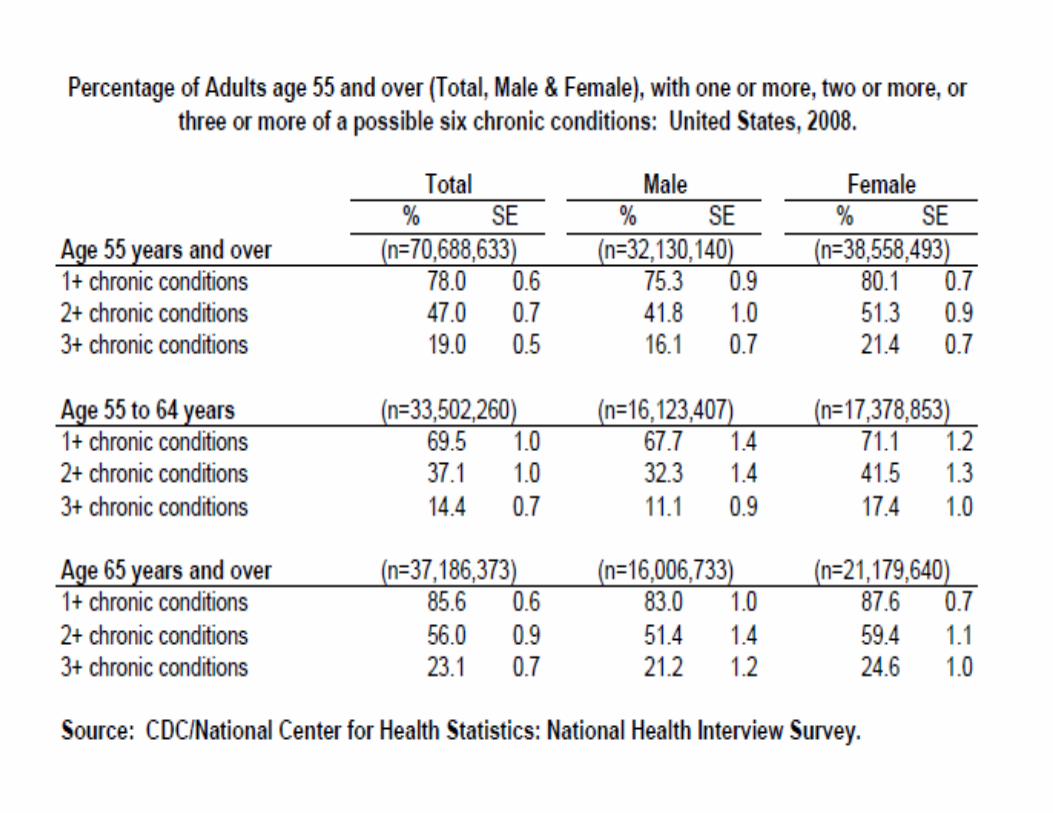
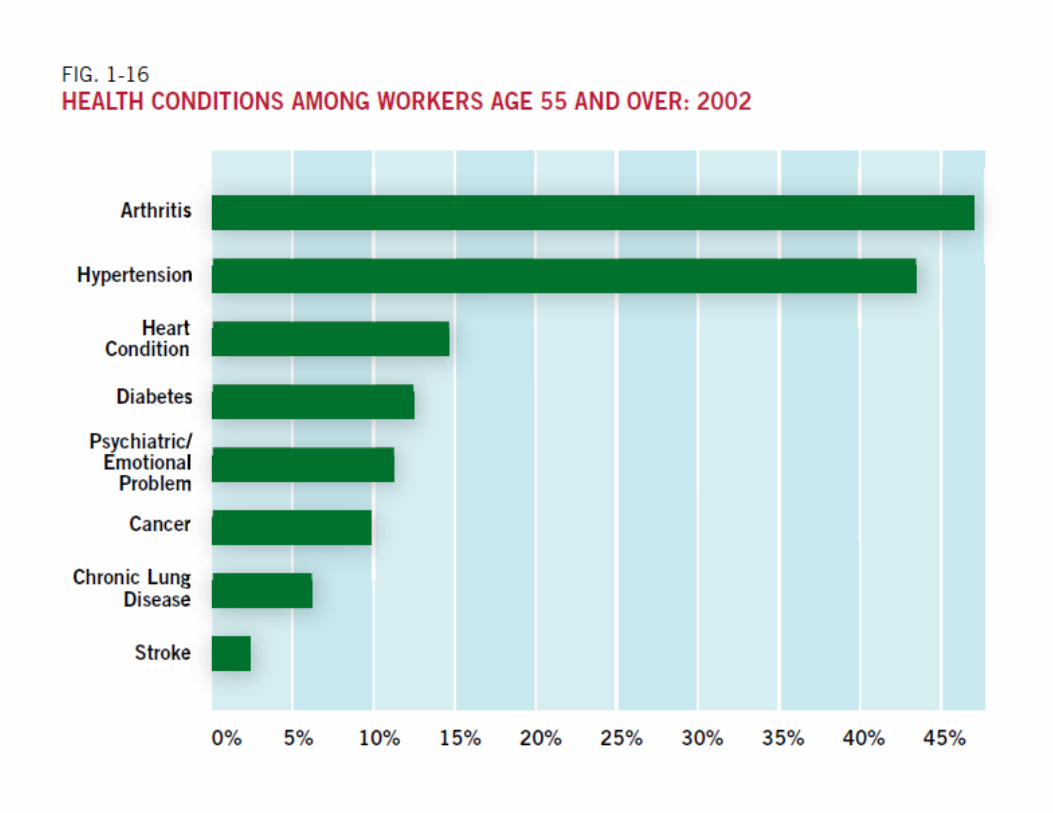
Age and Chronic Medical Conditions
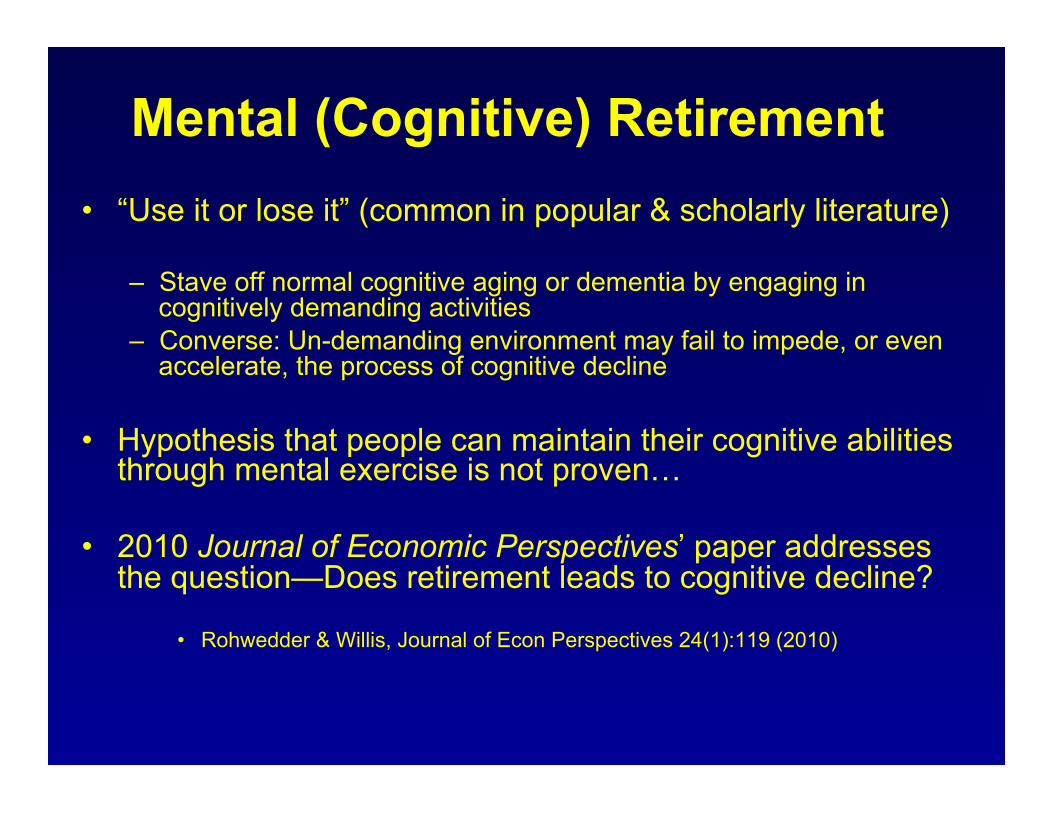
Mental (Cognitive) Retirement • “Use it or lose it” (common in popular & scholarly literature)
– Stave off normal cognitive aging or dementia by engaging in cognitively demanding activities
– Converse: Un-demanding environment may fail to impede, or even accelerate, the process of cognitive decline
• Hypothesis that people can maintain their cognitive abilities through mental exercise is not proven…
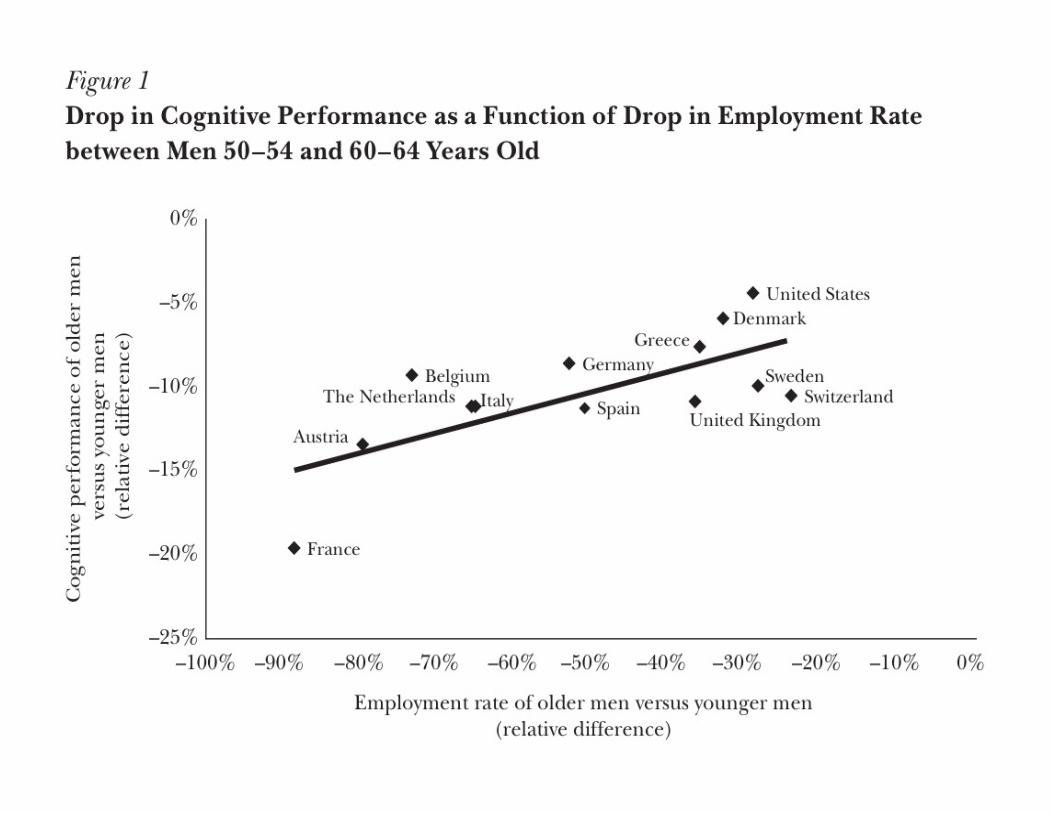
• 2010 Journal of Economic Perspectives’ paper addresses the question—Does retirement leads to cognitive decline?
• Rohwedder & Willis, Journal of Econ Perspectives 24(1):119 (2010)
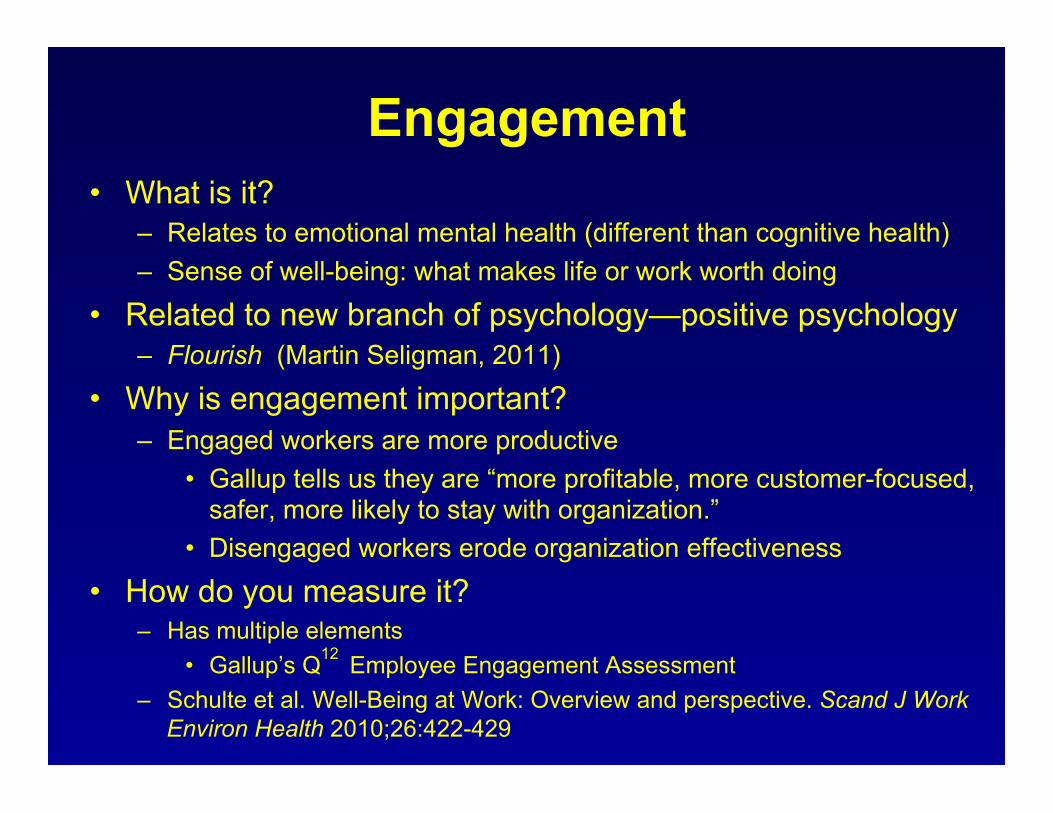
Engagement • What is it?
– Relates to emotional mental health (different than cognitive health) – Sense of well-being: what makes life or work worth doing
• Related to new branch of psychology—positive psychology – Flourish (Martin Seligman, 2011)
• Why is engagement important? – Engaged workers are more productive
• Gallup tells us they are “more profitable, more customer-focused, safer, more likely to stay with organization.”
• Disengaged workers erode organization effectiveness • How do you measure it?
– Has multiple elements • Gallup’s Q12 Employee Engagement Assessment
– Schulte et al. Well-Being at Work: Overview and perspective. Scand J Work Environ Health 2010;26:422-429

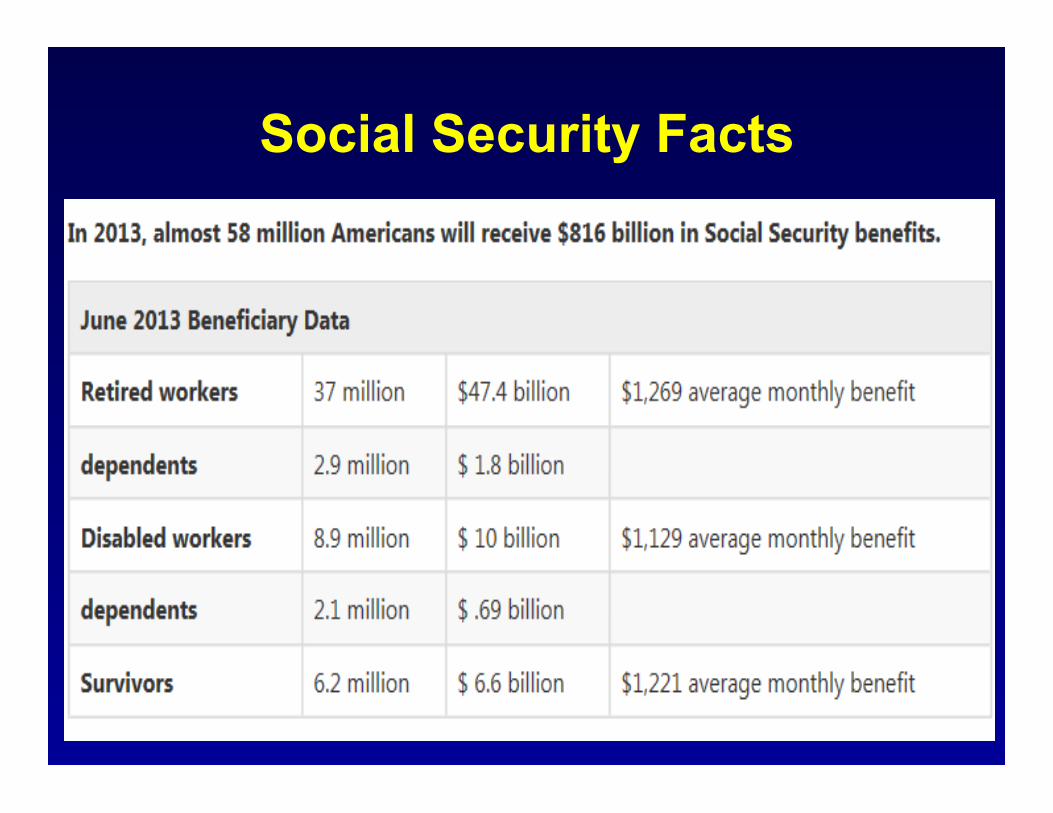
Social Security Facts
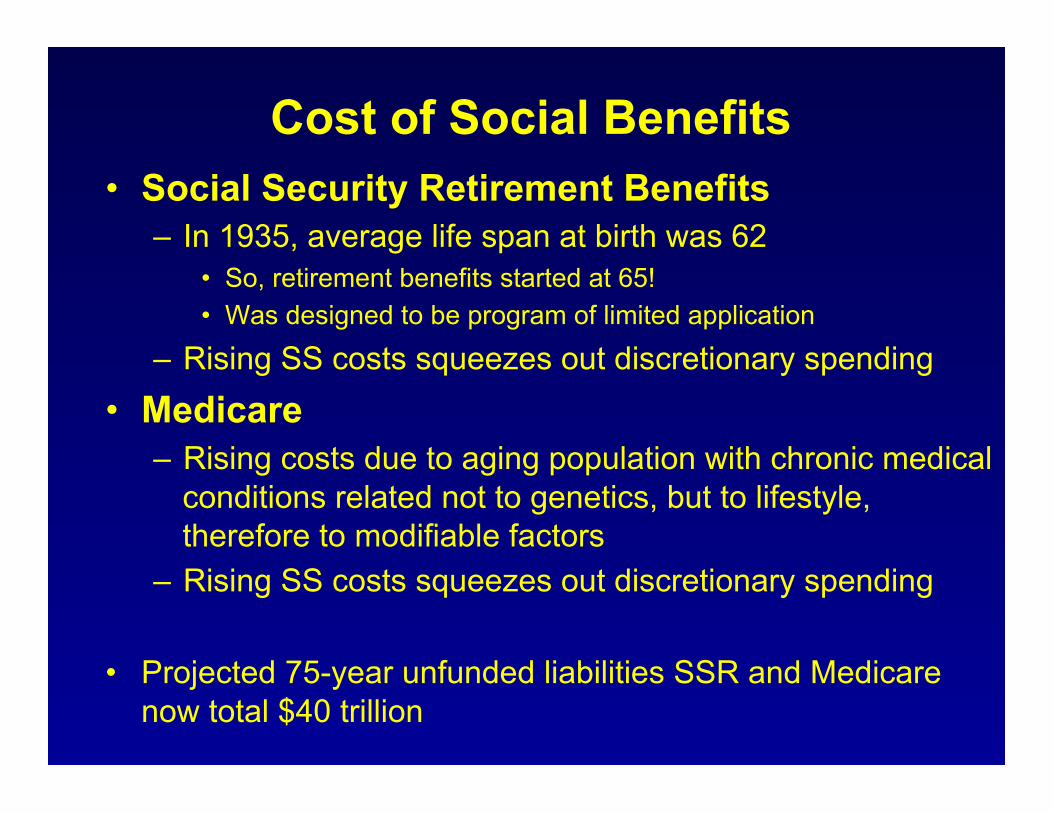
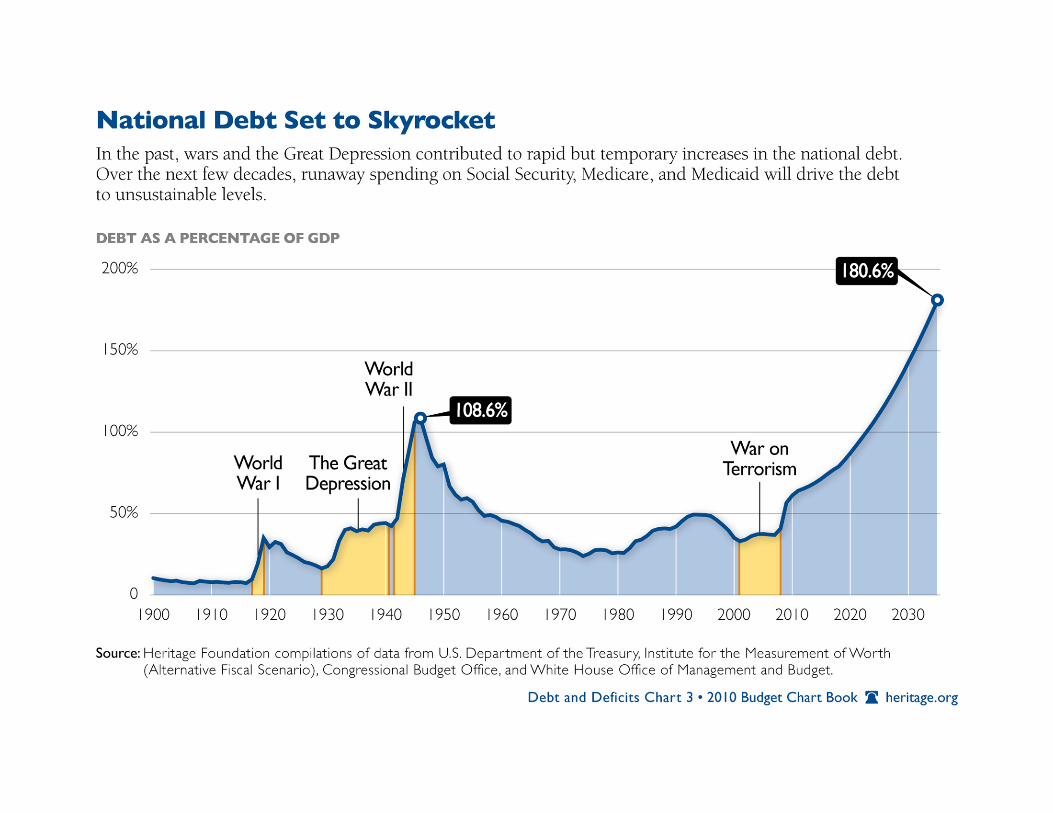
Cost of Social Benefits • Social Security Retirement Benefits
– In 1935, average life span at birth was 62 • So, retirement benefits started at 65! • Was designed to be program of limited application
– Rising SS costs squeezes out discretionary spending
• Medicare – Rising costs due to aging population with chronic medical
conditions related not to genetics, but to lifestyle, therefore to modifiable factors
– Rising SS costs squeezes out discretionary spending
• Projected 75-year unfunded liabilities SSR and Medicare now total $40 trillion
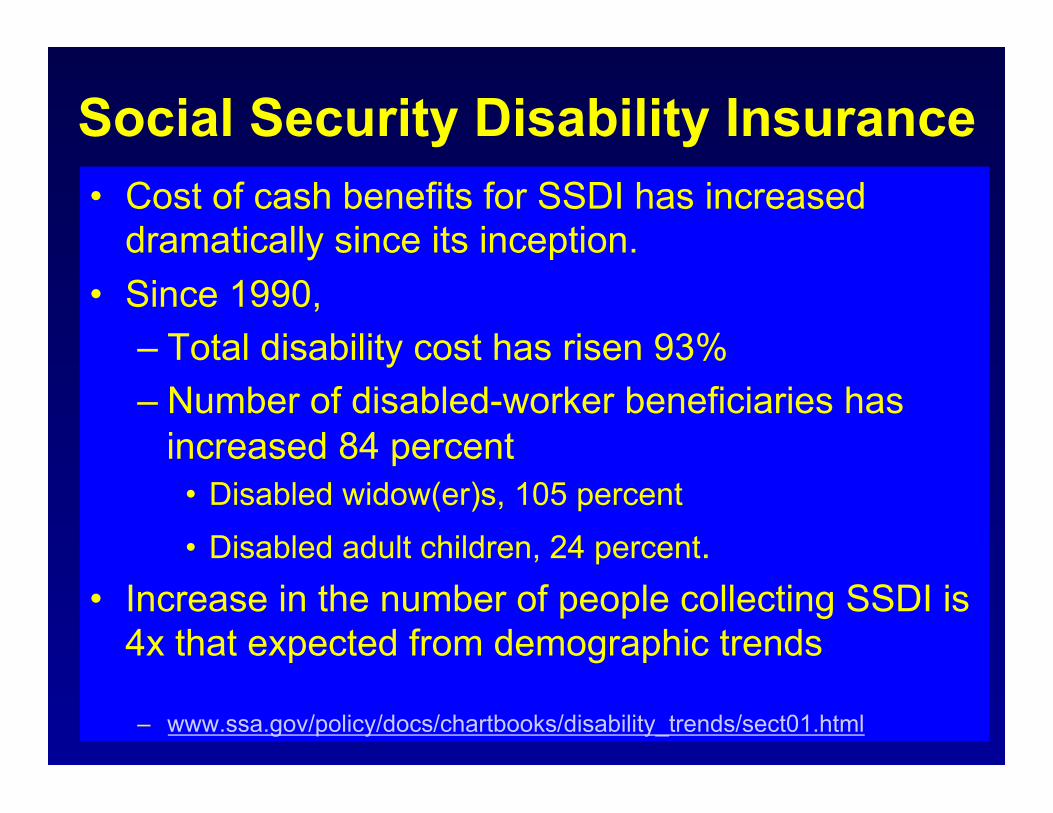
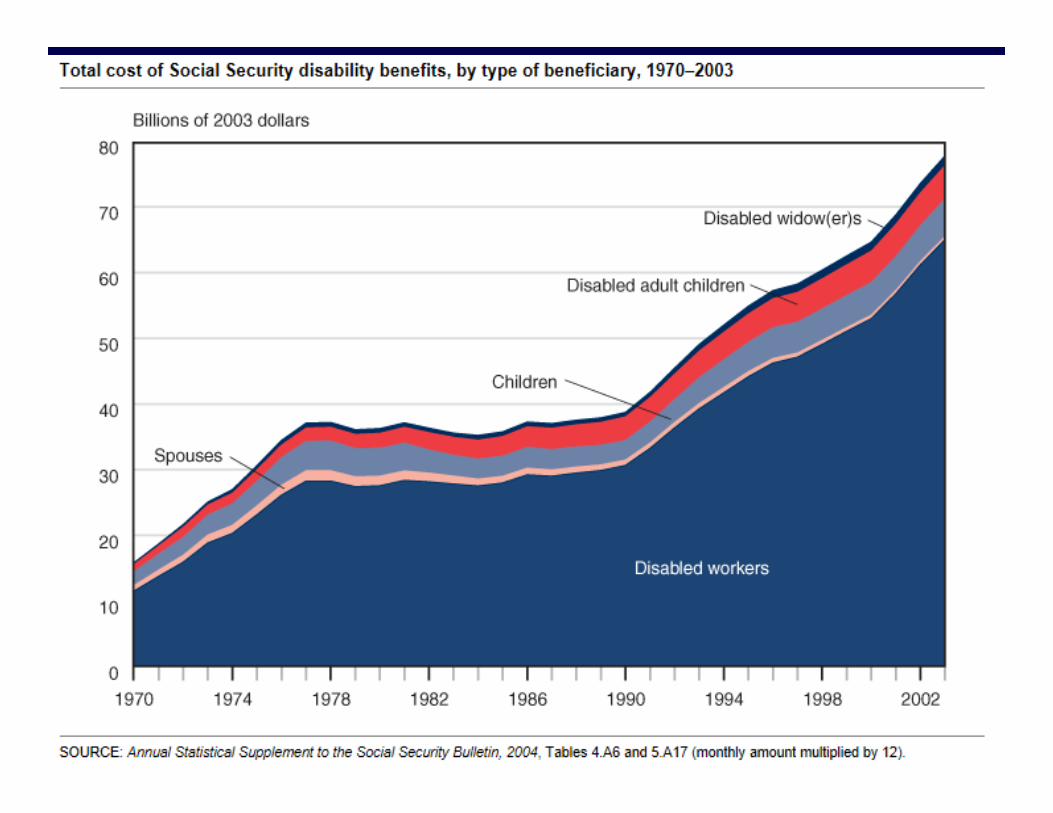
Social Security Disability Insurance • Cost of cash benefits for SSDI has increased
dramatically since its inception. • Since 1990,
– Total disability cost has risen 93% – Number of disabled-worker beneficiaries has
increased 84 percent • Disabled widow(er)s, 105 percent
• Disabled adult children, 24 percent. • Increase in the number of people collecting SSDI is
4x that expected from demographic trends
– www.ssa.gov/policy/docs/chartbooks/disability_trends/sect01.html
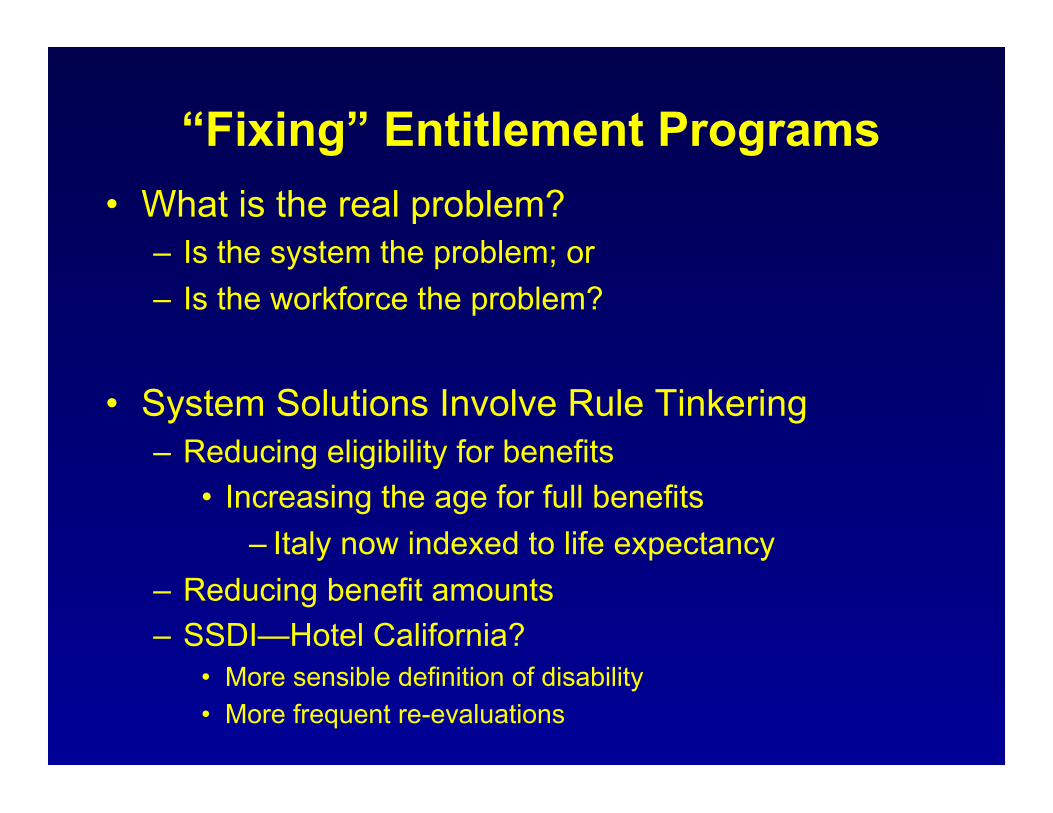
“Fixing” Entitlement Programs • What is the real problem?
– Is the system the problem; or – Is the workforce the problem?
• System Solutions Involve Rule Tinkering – Reducing eligibility for benefits
• Increasing the age for full benefits – Italy now indexed to life expectancy
– Reducing benefit amounts – SSDI—Hotel California?
• More sensible definition of disability • More frequent re-evaluations

Is There Another Fix? • Healthier workforce
• SSDI—Not disabled during working lives • SSA—Extend working life • Medicare—Healthier @ 65 years
• Present value of disability-insurance benefits, plus Medicare costs, per new disabled worker, is > $300,000
• $300 billion = cost of 1m new disabled-worker awards in last 12 months
• Boskin (WSJ, July 15, 2013)
Keeping Healthy: While Working &
Aging Productively
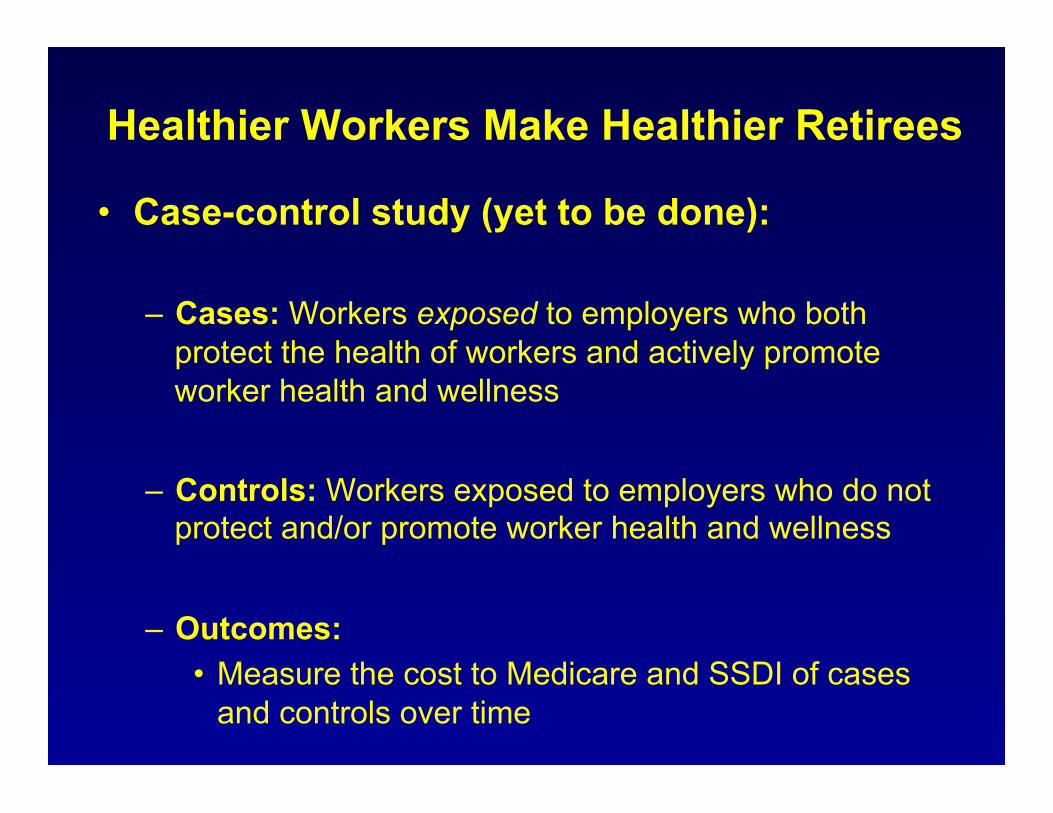
Healthier Workers Make Healthier Retirees
• Case-control study (yet to be done):
– Cases: Workers exposed to employers who both protect the health of workers and actively promote worker health and wellness
– Controls: Workers exposed to employers who do not protect and/or promote worker health and wellness
– Outcomes: • Measure the cost to Medicare and SSDI of cases
and controls over time

Employment-Based Wellness Programs • Have been in use for a long time
• Can be divided into two general categories:
• Participatory wellness – Do not require worker to meet a health-related standard to
obtain a reward or do not offer a reward at all – Complies with non-discrimination requirements as long as
participation is made available to all similarly-situated workers regardless of health status
– No limit on financial incentives
• Health-contingent – Require workers to satisfy a standard related to a health factor
to obtain a reward – Activity-only wellness
» No requirement to attain a specific health outcome – Outcome-based wellness
» Requires worker to attain a specific health outcome
Along Comes the ACA • ACA encourages WWPs related to group health coverage
for plan years after 1 January 2014
• Concerns: – A type of stealth health status underwriting? – Paternalistic? – Wellness self-touting big industry? – Time-consuming obligations? – Employer invests, what’s the return on that investment? – Discrimination against the unhealthy?
• Regulations on that implement ACA’s nondiscrimination requirements for health-contingent WWPs (June 3, 2013)
• WWPs are just one prevention tool found in the ACA, but they have attracted the most attention of late
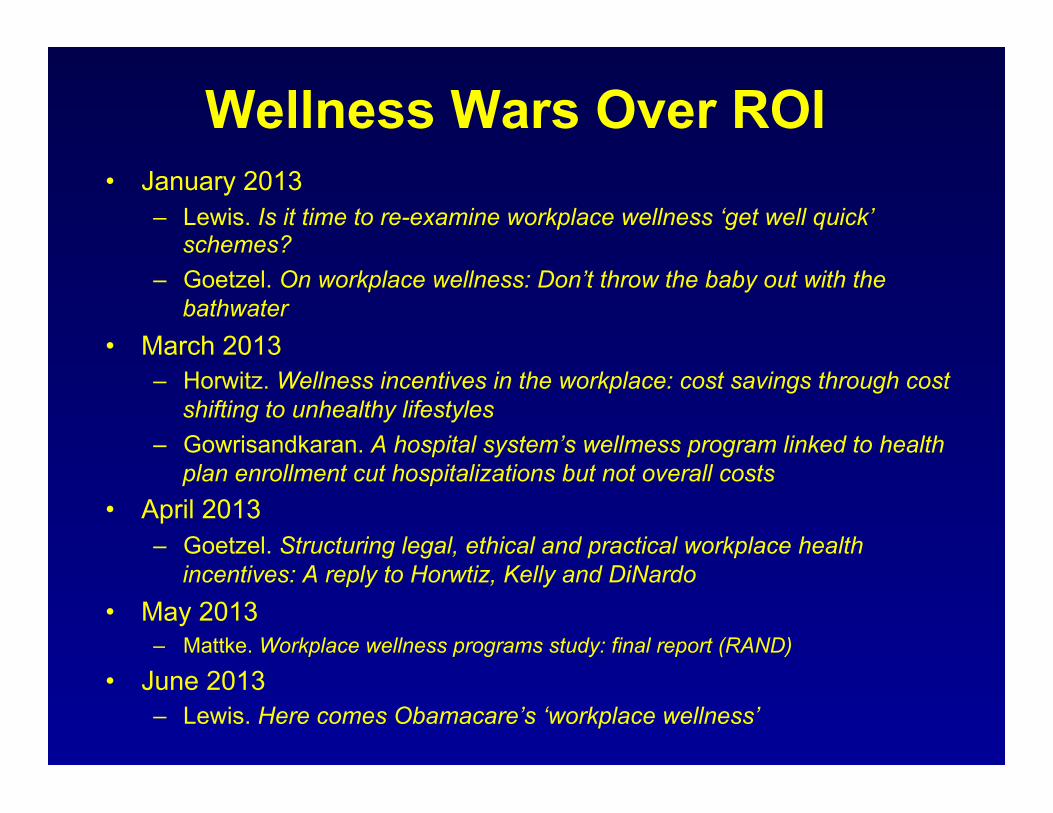
Wellness Wars Over ROI • January 2013
– Lewis. Is it time to re-examine workplace wellness ‘get well quick’ schemes?
– Goetzel. On workplace wellness: Don’t throw the baby out with the bathwater
• March 2013 – Horwitz. Wellness incentives in the workplace: cost savings through cost
shifting to unhealthy lifestyles – Gowrisandkaran. A hospital system’s wellmess program linked to health
plan enrollment cut hospitalizations but not overall costs • April 2013
– Goetzel. Structuring legal, ethical and practical workplace health incentives: A reply to Horwtiz, Kelly and DiNardo
• May 2013 – Mattke. Workplace wellness programs study: final report (RAND)
• June 2013 – Lewis. Here comes Obamacare’s ‘workplace wellness’

Scientific Evidence • Hierarchy of Types of Evidence
– Opinion, testimony, anecdote, small study, large study, prospective – Studies conforming to rules of science & whose limitations are
clearly identified
• NIOSH TWHTM – Supports scientific research & critical discourse on wellness – Interested in funding science to determine sound public policy
• Wellness Wars Discussion on Return on Investment: – Nature of return, timeframe for measurement depends on who is
doing the investing – If measuring population health changes, ROI may have to be
measured not in months or years, but in decades – For example, if smoking cessation and lowering risk of lung cancer is
a goal of wellness…for former smokers, the risk of lung cancer takes several decades to match that of a lifetime non-smoker

Total Worker HealthTM
Comprehensive organizational strategy for the Nation that:
Integrates occupational health protection with wellness promotion to advance worker well-being in life and work.
Total Worker HealthTM: Strategic Goals
• Help reverse alarming trends in population health by concentrating on the proportion of Americans who are workers.
• Develop an evidence-based prevention framework for total worker health—using an integrated approach to protection and promotion (well-being).
• Promote and fund scientific research into what programs work best for which employers, establishments, workers
• Promote understanding of total worker health to the worker, the worker’s family, the employer & the insurer, and in doing so ensure the economic growth of the Nation
Who is responsible for worker health?
• Worker? • Employer? • Manufacturers? • Healthcare provider? • Health insurers? • Workers’ compensation insurers? • Government? • Nobody? • Everybody?
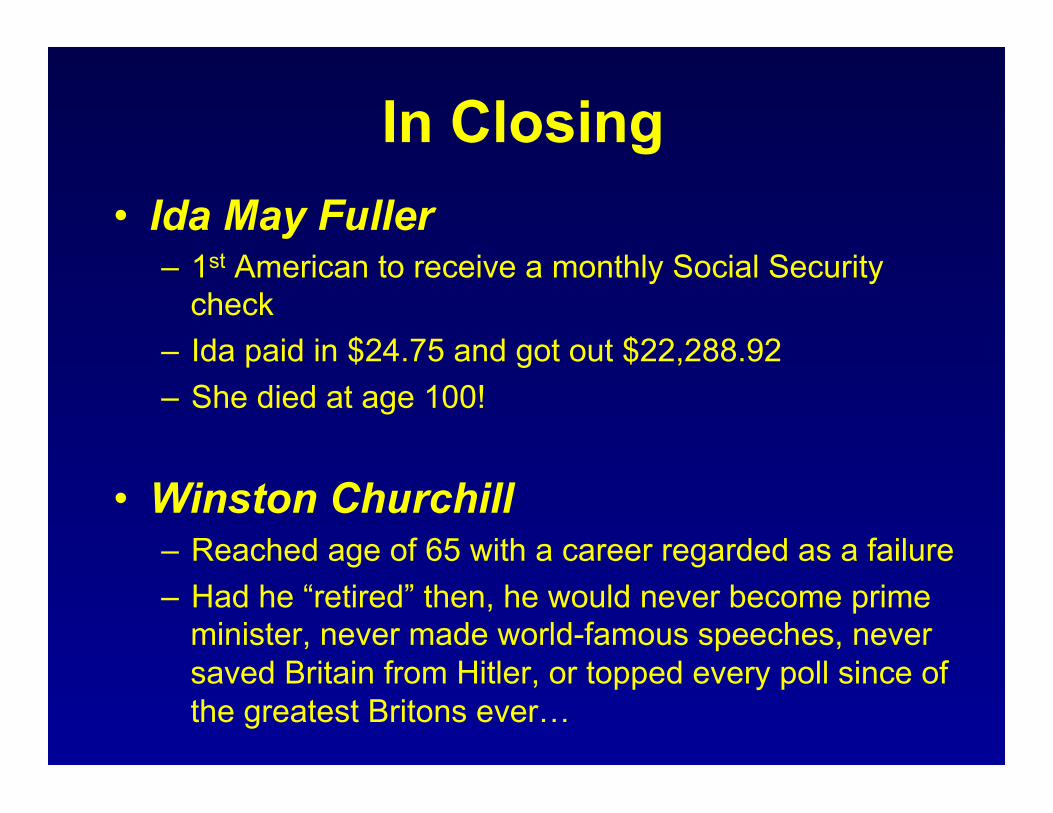
In Closing • Ida May Fuller
– 1st American to receive a monthly Social Security check
– Ida paid in $24.75 and got out $22,288.92 – She died at age 100!
• Winston Churchill – Reached age of 65 with a career regarded as a failure – Had he “retired” then, he would never become prime
minister, never made world-famous speeches, never saved Britain from Hitler, or topped every poll since of the greatest Britons ever…

References • Baicker K et al. Workplace welllness programs can generate savings. Hlth
Affairs 2010;29(2):1-8 • Berman M et al. Estimating the cost of a smoking employee. Tobacco Control
2013 (June 3 ePrint) • Dychtwald K, Erickson T, Morison, B. It’s Time to Retire Retirement, Harvard
Business Review (March 2006). • Gallup Consulting. Employee Engagement: What’s Your Engagement Ratio?
Available at http://www.gallup.com/strategicconsulting/121535/Employee-Engagement-Overview-Brochure.aspx
• GAO. Older Workers: Enhanced Communication among Federal Agencies Could Improve Strategies for Hiring and Retaining Experienced Workers. GAO-09-206 (February 24, 2009).
• GAO. Older Workers: Some Best Practices and Strategies for Engaging and Retaining Older Workers. GAO-07-433T (February 28, 2007)
• Gowrisankaran G. et al. A hospital system’s wellness program linked to health plan enrollment cut hospitalizations but not overall costs. Hlth Affairs 2013;32(3):477-485
• Horwitz J. Wellness incentives in the workplace: cost savings through cost shifting to unhealthy workers. Hlth Affairs 2013;32(3):468-476
References • Ip G. The Little Book of Economics. John Wiley & Sons (2013). • IRS/DOL/EBSA/HHS. Incentive for Nondiscriminatory Wellness Programs in
Group Health Plans. 78 Fed. Reg. 33158 (June 3, 2013). • Jackson K, et al. Amylin deposition in the brain: A second amyloid in
Alzheimer’s disease? Annals of Neurology. Published online June 22, 2013; DOI: 10.1002/ana.23956. - See more at: http://www.nia.nih.gov/announcements/2013/07/amylin-deposits-brain-may-link-dementia-and-diabetes#sthash.xunbGJMB.dpuf
• Johnson, R. et al. Older Workers on the Move: Recareering in Later Life (2009), AARP Public Policy Institute.
• Loeppke R et al. Advancing workplace health protection and promotion for an aging workforce. JOEM. 2013;55(5):500-506.
• Mattke S et al. Workplace Wellness Programs Study. RAND Health, 2013. Available at http://www.rand.org/pubs/research_reports/RR254.html
• National Institute on Aging. Growing Older in America: The Health and Retirement Study. Available at http://www.nia.nih.gov/ResearchInformation/ExtramuralPrograms/BehavioralAndSocialResearch/HRS.htm
• National Research Council. Health and Safety Needs of Older Workers, National Academies Press (2004).
References • O’Donnell MP. Editor’s Notes. Am J Health Promotion 2013;28(1): iv-vi. • Pandalai SP et al. Conceptual heuristic models of the interrelationships between
obesity and the occupational environment. Scand J Work Environ Health 2013;39(3):221-232.
• Report of the Taskforce on the Aging of the American Workforce (2008). Available at http://www.aging.senate.gov/letters/agingworkforcetaskforcereport.pdf
• Rohwedder S. & Willis RJ. Mental retirement. Jo Econ Perspectives 2010;24(1):119.
• Rotman D. How Technology is Destroying Jobs. MIT Technology Review. 2013;116(4):28-35.
• RW Johnson et al. Work Impediments at Older Ages (2006). Available at http://www.urban.org/UploadedPDF/311313_work_impediments.pdf
• Seligman MEP. Flourish: A Visionary New Understanding of Happiness and Well-Being. New York: Free Press (2011).
• Social Security Administration. Trends in Social Security and Supplemental Security Income Disability Programs. Available at http://www.ssa.gov/policy/docs/chartbooks/disability_trends/sect01.html
• Solving the Problem of Childhood Obesity Within a Generation (2010) Available at http://www.letsmove.gov/tfco_fullreport_may2010.pdf