Embed Size (px)
Citation preview

R ating for individual health plans in calendar year 2016 will have many details to be considered for the first time. To highlight this, an April 2014 Congressional Budget Office (CBO) report projected several significant shifts: a) exchange enrollment is
expected to grow from 13 million in 2015 to 25 million in 2016; b) the annual, national aver-age benchmark premium is expected to increase by over 10 percent (from $3,900 to $4,400 per year); and c) exchange plans are expected to have broader provider networks than in years past. These all are interrelated, as will be explained later in this article. In the mean-time, off-exchange, nongroup plan enrollment is projected to be flat from 2015 to 2016.1
As indicated by this projected climb in enrollment and premium, there is much to consider. In broad terms, actuaries will have to monitor the regulatory environment for expected as well as unexpected guidance. They will have to try to make sense of newly available infor-mation. Most importantly, they will need to anticipate how the newly insureds will access the health care system differently over time, compared to what was observed in 2014.
ISSUE 76 OCTOBER 2014
Health Watch
CONTINUED ON PAGE 4
Ideas to Consider for the Individual Health Market in 2016
By Jeff Rohlinger
1 Ideas to Consider for the Individual Health Market in 2016By Jeff Rohlinger
2 Letter from the EditorBy Valerie Nelson
3 Chairperson’s Corner By Donna Kalin
8 Health Insurer Financial Reporting Post-ACA: What Is the Current Thinking?By Nancy Hubler
12 The ACA Exchange and Medicare Part D: A Comparison of Financial RiskBy Kurt Wrobel
18 Opportunities and Challenges for Physician-Led ACOs—A Recap of the ACO Learning Network WorkshopBy Julian Whitekus
20 Medicaid NewsBy the Medicaid Subgroup
22 Highlights from the 2014 Health MeetingBy Kristi Bohn, Joanne Fontana andRebecca Owen
25 Capturing the Impact of the National Economy on Humana’s Claim Trends to Improve Forecast AccuracyBy Jen Kilgore Coriell

Published by the Health Section Council of the Society of Actuaries.
This newsletter is free to section members. Current issues are available on the SOA website (www.soa.org).
To join the section, SOA members and non-members can locate a membership form on the Health Section Web page at http://www.soa.org/health/
2014 Section Leadership Donna Kalin, ChairpersonAndrea Bykerk Christopherson, Vice Chairperson Troy Holm, Secretary/TreasurerTheresa Bauer, Council MemberKara Clark, Council MemberEric Goetsch, Council MemberNancy Hubler, Council MemberOlga Jacobs, Council MemberJulia Lambert, Council MemberValerie Nelson, Council MemberMichelle Roark, Council MemberGreger Vigen, Council Member
Editorial Board Members Valerie Nelson, Editor-in-Chief [email protected]
J. Patrick Kinneyph: [email protected]
Jeff Miller ph: [email protected]
SOA Staff Karen Perry, Publications Managerph: 847-706-3527 f: [email protected] Mike Boot, Staff Partner [email protected]
Julissa Sweeney, Graphic Designer ph: 847.706.3548 f: [email protected]
This publication is provided for informational and educational purposes only. The Society of Actuaries makes no endorsement, representation or guarantee with regard to any content, and disclaims any liability in connection with the use or misuse of any information provided herein. This publication should not be construed as professional or financial advice. Statements of fact and opinions expressed herein are those of the individual authors and are not necessarily those of the Society of Actuaries.
©2014 Society of Actuaries. All rights reserved.
ISSUE 76 OCTOBER 2014
Health Watch
2 | October 2014 | Health Watch
H ello! I’m Valerie and the new editor for Health Watch. I want to thank Kurt Wrobel for his time and dedi-
cation to serving as the editor and wish him well in his next endeavors. However, he is not taking a break from writing just yet as he has contributed an article on the finan-cial similarities and differences between the Affordable Care Act (ACA) health plans and Medicare Part D plans.
This edition of Health Watch also features two articles that cover some upcoming activi-ties that will be near and dear to many of us: pricing for the 2016 individual market and expectations for the 2014 ACA financial settlements.
Jeff Rohlinger writes our cover article on pricing considerations for the 2016 individual market. While we have learned a lot over the last two pricing cycles, Jeff is able to tell us about more change and uncertainty that will need to be accounted for in the 2016 pricing cycle.
Earlier this year, the Society of Actuaries (SOA) Health Section Council and Financial Reporting Section Council released a survey to get an understanding of the current actuarial thinking on how to estimate the various 2014 ACA financial settlements. Nancy Hubler provides a review of this survey.
The SOA Health Section has many active subgroups. Two subgroups have articles fea-tured in this edition of Health Watch. The subgroups are a great forum for people with like backgrounds to discuss current trends and solutions. From the Payment and System Reform Subgroup, Julian Whitekus contrib-utes a review of physician-led ACOs that were discussed at the ACO Workshop held in the spring. And the Medicaid Subgroup gives us a national perspective on what is happen-ing in that market.
Also featured is a recap of the 2014 Health Meeting by Kristi Bohn, Joanne Fontana, and Rebecca Owen.
Finally, Jen Kilgore Coriell, who is an econo-mist, writes an interesting article on how she has studied economic impacts on health care trends at Humana.
Letter from the EditorBy Valerie Nelson
Valerie Nelson, FSA, MAAA, is an executive director and actuary at Blue Cross/Blue Shield of Illinois. She can be reached at [email protected].

Health Watch | October 2014 | 3
M y term as chair of the Society of Actuaries (SOA) Health Section Council ends this month, and
Andrea Bykerk Christopherson will next take over the position. Council members whose terms expire this fall in addition to me include Nancy Hubler, Valerie Nelson and Greger Vigen. A special thanks to each of these lead-ers for their work with the Health Section. I would also like to thank the Health Section Council and the friends of the council for their hard work this year. Thanks to their efforts, the council’s accomplishments include:
• A successful Health Meeting in San Francisco with record-breaking attendance of over 1,000 attendees
• Sponsorship of 18 sessions at the October Annual Meeting
• The debut of the Canadian Health Actuary Seminar in May
• The Dental Special Interest Group, which started this year
• Many webinars and podcasts for health actuaries on the go
• Boot camps each November on rotating topics important to health actuarial practice
• Med School for Actuaries and our Payment Reform seminars, which have been well-received
• Several research projects completed and others begun
• Three issues of Health Watch offering a wide array of interesting articles.
My three years on the council have been busy and interesting, and the future for the Health Section Council promises more of the same. The health industry is in the midst of extraor-dinary times. The environment is dynamic and complicated. The council has greatly stepped up efforts in research, basic education and continuing education to prepare health actuar-ies for their future roles and opportunities over the course of their careers. The Health Section Council is continually striving to help our pro-fession make sure we can sustain and maintain our place in this new environment.
The Health Section Council expects to have a busy year, with more ideas for projects than the available resources and time will permit us to do. As you know, our efforts rely on volunteers, and we never seem to have as many volunteers as we need. I encourage you to contribute in whatever way interests you. If you would like to get involved with the work of the Health Section (running for the Health Section Council, presenting at a meeting or seminar, coordinating meeting and seminar sessions, writing a Health Watch article, etc.) or if you just want to learn about these oppor-tunities, please fill out the volunteer interest form found on the SOA Health Section web-site (http://www.soa.org/professional-interests/health/hlth-detail.aspx) or contact any member of the Health Section Council.
Chairperson’s Corner By Donna Kalin
Donna Kalin, FSA, MAAA, is principal and consulting actu-ary at Milliman, Inc. in New York, N.Y. She can be reached at [email protected].

4 | October 2014 | Health Watch
Ideas to Consider for the Individual Health Market in 2016 | FROM PAGE 1
As in years past, regulatory guidance may bring delays to scheduled guidance, or bring modifica-tions to guidance already released. As a result, the discussion below of scheduled, effective regula-tions should be treated as preliminary. Here is some of the regulatory guidance that could occur for 2016:
1. Updated actuarial value (AV) calculator, or underlying continuance data. This is important because plan designs are required to have benefits that cover 60 percent, 70 percent, 80 percent or 90 percent of total expected essential health benefit (EHB) costs +/- 2 percent. When costs are trended forward and utilization data is updated, it is likely that the updated AV calculator will show AV results with values that fall outside of the de minimis range. Existing plan ben-efits will have to be modified accordingly. In the final rule for the 2015 Notice of Benefit and Payment Parameters,2 they note that “where the trend factor is cumulatively more than 5 percent different from the previ-ous time the AV calculator was updated, we would implement the trend factor.” The AV calculator was not updated for 2015 due to trend, so it is likely that this threshold will be reached in 2016 and, at the least, trend will be applied to the underlying continu-ance data.
2. States may be allowed to revisit their EHB benchmark plans. In the Final Rule for 2013 Standards Related to Essential Health Benefits,3 the Centers for Medicare & Medicaid Services (CMS) relate that they are “currently reviewing all options for updating EHB in 2016 and anticipating additional guidance in the future on enforce-ment of EHB requirements and updating EHB.” As with the AV calculator update, an update to one’s respective EHB benchmark plan may require change to plan designs of existing plans in order to continue to comply with EHB requirements.
3. Small employer rating requirements apply to groups up to size 100 in 2016. Previously, most states applied small group rating requirements only to groups up to size 50. The rating rules specific to small group that would now apply to groups up to size 100 are many and varied. No comprehensive list is presented here, but some examples include rating by state-specific rating areas or prescribed age factors, and benefit designs that conform to metal level.4
4. Employer mandate delayed until 2015. Currently a phase-in year is prescribed for 2015, and full requirements are scheduled to be in place for 2016.5 As scheduled employer reporting rules strengthen, many employers may question their role in providing health insurance to their employees.
Any impacts to the employer market should be eval-uated with possible implications for the individual market. Will more employers pay the penalty or continue to provide coverage? Will more employers move to provide self-insured coverage instead?
In addition to the emerging regulatory requirements in the backdrop, there will also be much newly available information to consider. Information such as renewal enrollment data, new enrollment in 2015, the data collection reports, and 2014 claim experience will potentially aid actuaries in deter-mining effective rating actions for 2016.
By the time we price for 2016, the open enrollment period for 2015 is slated to be completed.6 This enrollment period will be invaluable to observe market forces in action that pertain to this newly developed market. Questions that will be answered include:
• How much do renewal rate increases, as opposed to rate levels, impact enrollment?7
• Is there an increasing awareness of provider networks evident in marketing results?
• What renewal (outreach) activities appear to be most effective?

Health Watch | October 2014 | 5
Besides renewal activities, carriers will be interested to know what was most effective in attracting the newly insured (as of 2015), as well as the members migrating from group health coverage.
Besides renewal enrollment data, financial results pertaining to the 3Rs are beginning to become clear. Issuers are supposed to have completed their 2014 edge server submissions of reinsurance and risk adjustment data and submitted by April 30.2
However, earlier submissions and reports by CMS are intended to be available by then.
With regard to risk adjustment, the importance of market-wide information that will allow insurers to adequately understand the impact of the payment transfers when pricing for 2016 and beyond cannot be overstated. This information will be available for the first time, and will inevitably lead many insur-ers to substantially revisit their pricing and enroll-ment results. These comments were recognized in the Final Notice of 2015 Benefit and Payment Parameters, with CMS noting that they will provide more details on this content in future guidance or future rules, where appropriate.2
With regard to reinsurance, the impact to one’s own financial results is self-evident. Unlike the risk adjustment program, the reinsurance program is phasing out. 2016 is the last year intended for the reinsurance program to stabilize premiums in this still-developing market. This is true for the risk corridor program as well (though the risk corridor program is more of a “backstop” against adverse events and not an allowable rating factor). Insurers should be considering the impact that the absence of these stabilizing programs will have on their 2017 rate levels, when setting their 2016 rates.
Also newly available during the pricing process for 2016 will be the 2014 experience data for the newly insured. It is estimated that at least 8 million enrolled in the exchange (not considering who paid or not), and millions more enrolled in plans off the exchange.8 Obviously, many of these are newly insured, and are embedded in your population. However, it will not be straightforward in project-
ing this experience to expected 2016 circumstances.When considering 2014 data, one should consider this is merely the initial year in a new marketplace. There are many reasons to assume that 2014 expe-rience will not resemble the marketplace in future years. Differences may include:
• Pent-up demand of previously uninsured mem-bers will have been addressed in earlier years.
• Suppressed demand of previously uninsured members will have been addressed with an increasing awareness of how to optimally access the health care system.
• The impact of transitional policies.• Varying impact of members insured for part of
the year.• First enrollment opportunity that many will
have beyond their 2014 tax returns.• Accounting for the predicted CBO shift of
insureds if it were to happen.
For those newly insured members in 2014, we would have expected pent-up demand reflected in those results. Where that occurs, we would expect the initial intensity of utilization of services to subside, certainly by 2016. On the other hand, we could have expected suppressed demand reflected for other newly insureds. For example, confusion around the enrollment and eligibility processes for some exchanges9 could have inhibited usage in the early days of their enrollment. Additionally, many others who had never before had insurance likely had a learning process in their early days in a plan. One might expect their utilization levels would increase to reflect optimal understanding of how to access the health care system by 2016.
For transitional plans, their experience is reflected in 2014 as non-ACA compliant plans. For those states that adopted a transitional policy, most are allowing them to continue through 2017. However, several of them may permit them to continue only into 2015 or 2016.10
As for members insured for part of 2014, there are several reasons why they may not have been covered for the entirety of 2014. There are those
CONTINUED ON PAGE 6
Jeff Rohlinger, FSA, MAAA, is an actuary at Health Partners in Bloomington, Minn. He can be reached at [email protected].

6 | October 2014 | Health Watch
who enrolled, then curtailed enrollment for the remainder of the year upon utilizing their intended services for the year.11 There are those who waited until the end of the enrollment period, to minimize the amount of time to be enrolled in a health plan without incurring an individual mandate penalty. On the other hand, there are those who enrolled later in the year due to changing personal circum-stances, such as a change in Medicaid eligibility. Lastly, there are many who encountered technical difficulties in enrolling for 2014. These people may have wanted 12 months of coverage, but were unable to do so.
The timing of 2014 tax returns could play a signifi-cant role in 2016 enrollment in a number of ways. First, the 2014 tax returns are the first time that people are scheduled to pay a penalty to the Internal Revenue Service (IRS) because of a lack of qualify-ing coverage in 2014. In conjunction with paying the penalty, many may realize that the penalty for 2016 is intended to be much larger than it was in 2014. In 2014, the penalty is max (1 percent of your taxable income or $90 per person per household). In 2016, the penalty is max (2.5 percent of your tax-able income, or $695 per person per household).12
Additionally, for those receiving premium subsi-dies in 2014, the reconciliation of their premium subsidies that they received, to what the IRS calcu-lates they should have received, will result in addi-tional payment either to or from the IRS upon filing their 2014 returns. Perhaps by 2016, we could see significant shifts in how the premium subsidies are determined and in how they are administered as a result of any necessary regulatory responses after this initial tax year cycle.
Lastly, there are those enrollment scenarios pro-jected by the CBO, as described at the outset of this article. The CBO predicts that exchange plans will begin to become closer in price to employer plans. They predict that “many plans will not be able to sustain provider payment rates that are as low or networks that are as narrow as they appear to be in 2014.” While still lower than employer plans, they expect the gap to narrow in 2016. As a result, pre-mium costs would then rise. The benchmark pre-
mium would rise by over 10 percent. (Note that this doesn’t necessarily equate to 10 percent average premium increases: The benchmark plan is the sec-ond-lowest silver plan on the market, so it’s more a reflection of what plans are available for purchase at a lower cost in the market.) This increase in pre-mium will lead to a significant increase in subsidies available to people who enroll in exchange plans. The CBO projects an annual subsidy increase of almost 14 percent from 2014 to 2015, for those who will receive a premium subsidy. This increased attractiveness in plans with premium subsidies (as well as the awareness of the penalties) the report explains, will lead to exchange enrollment to grow substantially in 2016.1
There are certainly other possible reasons for dis-similar experience for 2016, such as changes in pro-vider delivery models to meet demands of a chang-ing insured population (more evening and weekend clinic hours, perhaps?), or a changing face of insurer marketplaces (insurers coming and going). It is recommended to consider those assumptions that seem reasonable for your particular state and your particular marketplace as you project your 2014 experience into the 2016 rating period.
In many ways, 2016 marks the end of the initial phase of the ACA. As noted in the oft-cited CBO report, they project that plans’ characteristics will stabilize after 2016, as well as the numbers of sub-sidized insureds on the exchange. If that turns out to be the case, then 2016 is of the utmost importance for determining the market position of your plans in your respective market as the ACA enters a more stable phase in future years.
In the meantime, there is much that is yet to unfold. There is significant regulatory guidance that could impact the insured population for 2016 and which plans they can buy. There is much new information that will prove insightful when developing rates reasonable in relation to the benefits provided. However, it will be important to realize that the experience for 2016 will not necessarily just be an extension of what we have seen so far.
It is recommended to consider those assumptions that
seem reasonable for your particular state and your particular marketplace as you
project your 2014 experience into the 2016 rating period.
Ideas to Consider for the Individual Health Market in 2016 | FROM PAGE 5

Health Watch | October 2014 | 7
ENDNOTES
1 “Updated Estimates of the Effects of the Insurance Cov-erage Provisions of the Affordable Care Act, April 2014” (Banthin, Masi, Molloy, Percy of Congressional Budget Office):http://www.cbo.gov/sites/default/files/cbofiles/attachments/45231-ACA_Estimates.pdf.
2 Final Notice of 2015 Benefit and Payment Parameters: http://www.gpo.gov/fdsys/pkg/FR-2014-03-11/pdf/2014-05052.pdf.
3 2014 Standards Related to EHB Benefits: http://www.gpo.gov/fdsys/pkg/FR-2013-02-25/pdf/2013-04084.pdf.
4 45 CFR 155.20.5 IRS Final Regulations Implementing Employer Shared
Responsibility for 2015: http://www.irs.gov/uac/News-room/Questions-and-Answers-on-Employer-Shared-Responsibility-Provisions-Under-the-Affordable-Care-Act.
6 Market Rules for 2015 and Beyond: http://www.cms.gov/CCIIO/Resources/Regulations-and-Guidance/Downloads/508-CMS-9949-F-OFR-Version-5-16-14.pdf.
7 “Cumulative Anti-Selection Theory” (Bluhm). Society of Actuaries, Transactions, Vol. XXXIV.
8 “Health Insurance Marketplace: Summary Enroll-ment Report for the Initial Annual Open Enrollment Period”: http://aspe.hhs.gov/health/reports/2014/Mar-ketPlaceEnrollment/Apr2014/ib_2014Apr_enrollment.pdf.
9 “Many LI Doctors Confused by NY Health Exchange Plans” (Ochs, Newsday, Feb. 19, 2014): http://www.mdeverywhere.com/many-li-doctors-confused-by-ny-health-exchange-plans/.
10 “The Extended ‘Fix’ for Cancelled Health Insurance Policies: Latest State Action” (Lucia, Corlette, Williams; Commonwealth Fund June 10, 2014): http://www.com-monwealthfund.org/publications/blog/2014/jun/adop-tion-of-the-presidents-extended-fix.
11 “Analysis of Individual Health Insurance Coverage in Massachusetts Insurance Before and After the July 1, 2007 Merger of the Small Group and Nongroup Mar-kets” (Welch, Giesa): http://www.mass.gov/ocabr/docs/doi/companies/adverse-selection-report.pdf.
12 Individual Mandate and Related Information Require-ments under ACA (Mach, Scales, Mulvey), Congressional Research Service July 15, 2013.

8 | October 2014 | Health Watch
risk (less-healthy) population than the statewide average. Under this program, money is transferred from issuers with low-risk enrollees to issuers with higher-risk enrollees in order to equalize the differences in cost related to differences in risk. The transfer payments in the program take place at the state level and apply to ACA-compliant plans in the individual markets, inside and outside of exchanges.
Fifty-seven percent of respondents plan to accrue for risk adjustment settlement amounts during the calendar year. Of those who plan to accrue during the year, 41 percent plan to spread the estimate evenly throughout the year while 64 percent said they would not try to account for seasonality throughout the year.
When asked how they plan to develop estimates for the settlement amounts several respondents indicated they would be using statewide risk adjust-ment studies, some of which are being performed by consulting firms. Others indicated they would be doing some modeling of their own or using original pricing estimates.
The majority (55 percent) indicated “other,” when asked if they anticipated setting up a receivable or payable amount at year-end for individual risk adjustment. This is likely a byproduct of the lack of information available with respect to the market average risk score at the time the survey was sent out; however, 29 percent anticipate setting up a receivable.
Respondents were then asked to rate their ability to develop the estimate from a low of “I have no idea/early stage discussion” to “We have a well-thought-out, detailed implementation plan.” No one rated themselves as having no idea, while 36 percent answered “N/A.” Not surprisingly, only 3 percent said they have a well-thought-out plan. The remain-ing 61 percent of respondents were spread fairly evenly among the other available response levels.
We then asked respondents if the states in which they do business intend to gather data during the year to help with the estimation of market average risk scores and which states were planning to do so. Only 22 percent (eight respondents) indicated
O ur pricing actuary colleagues recently completed their second round of rate filings for individual and small group
policies subject to the full implementation of the Affordable Care Act (ACA). In 2014 valuation actuaries will have their turn. Valuation actuaries have had to deal with medical loss ratio (MLR) accruals for the past couple of years, but in 2014 several other aspects of the ACA are driving the need for valuation actuaries to consider establishing additional payables or receivables during 2014 or at year-end.
In June 2013, the American Academy of Actuaries Health Practice Financial Reporting Committee issued a white paper called “Financial Reporting Implications Under the Affordable Care Act.” This paper discussed the impact of the 3Rs (risk adjust-ment, reinsurance and risk corridors) on insurers’ financial statements. As each of these programs includes a retrospective settlement process, finan-cial statements may need to include estimates of amounts payable or receivable. Even in the case where an actuary concludes that the amounts related to any of these programs are not material, how the actuary arrived at that conclusion will need to be documented.
The health insurance providers (HIP) fee and cost-sharing reductions (CSRs) and their potential impacts on insurer financial statements were also discussed in the white paper.
The Society of Actuaries Health Section Council and Financial Reporting Section Council jointly developed a survey to gauge how actuaries are pro-gressing with respect to these new potential assets or liabilities. The survey was sent to the members of the Health Section and the Financial Reporting Section. Fifty responses were received. The major-ity (over 80 percent) of respondents indicated that they worked for a health insurance company or a health subsidiary of a diversified parent. Almost half (48 percent) of the respondents indicated that their company covered over 1 million lives.
RISK ADJUSTMENT—INDIVIDUALThe risk adjustment program is designed to financially protect issuers that enroll a higher-
Health Insurer Financial Reporting Post-ACA: What Is the Current Thinking?By Nancy Hubler
Nancy Hubler, ASA, MAAA, is director, Corporate Actuarial at Cambia Health Solutions in Seattle, Wash. She can be reached at [email protected].

Health Watch | October 2014 | 9
CONTINUED ON PAGE 10
that states were planning to provide information. California, Massachusetts, New York (although this is really for pricing purposes), Utah and Florida were the states mentioned.
RISK ADJUSTMENT—SMALL GROUPSimilar to the individual risk adjustment program, the small group risk adjustment program is designed to financially protect issuers that enroll a higher-risk (less-healthy) population than the statewide average. Under this program, money is transferred from issuers with low-risk enrollees to issuers with higher-risk enrollees in order to equalize the differ-ences in cost related to differences in risk. The trans-fer payments in the program take place at the state level and apply to ACA-compliant plans in the small group markets, inside and outside of exchanges.
Forty-seven percent of respondents plan to accrue for risk adjustment settlement amounts during the calendar year. Of those who plan to accrue during the year, 47 percent plan to spread the estimate evenly throughout the year while 82 percent said they would not try to account for seasonality throughout the year.
Similar to the responses for individual risk adjust-ment, several respondents indicated they would be using statewide risk adjustment studies, some of which are being performed by consulting firms. Others indicated they would be doing some model-ing of their own.
The majority (56 percent) indicated “other,” when asked if they anticipated setting up a receivable or payable amount at year-end for small group risk adjustment. Twenty-six percent anticipate setting up a receivable, while 18 percent anticipate setting up a payable. The high level of uncertainty is not sur-prising considering the lack of information available with respect to the market average risk score at the time the survey was sent out.
Respondents were then asked to rate their ability to develop the estimate from a low of “I have no idea/early stage discussion” to “We have a well-thought-out, detailed implementation plan.” As for indi-vidual, no one rated themselves as having no idea while 37 percent answered “N/A.” Five percent said
they have a well-thought-out plan. The remaining 58 percent of respondents were spread fairly evenly among the other available response levels, leaning a little more toward the uncertain end of the scale.
TRANSITIONAL REINSURANCEThe transitional reinsurance program is a temporary program that will only be in operation for 2014 to 2016. Individual, small group, large group and self-funded or third-party-administered (TPA) plans will all be required to pay into the reinsurance program; however, only ACA-compliant individual plans (on and off the exchange) will receive reinsurance pay-ments.
The reinsurance contributions, collected from insured customers, will be based on premium paid in 2014. Many customers renew throughout the year; therefore, some of their annual premium would be paid in 2013 and some would be paid in 2014. Respondents were asked if they included an amount for the transitional reinsurance contribution in their 2013 premium rates that carried over into 2014, and 64 percent indicated that they did.
When asked if they plan to accrue for reinsurance settlement amounts during the year, 77 percent indicated that they would make an accrual. Of those who plan to accrue throughout the year, 34 percent plan to spread the accrual out evenly throughout the

10 | October 2014 | Health Watch
year and 41 percent plan to account for seasonality in their accrual.
When asked if they will apply a valuation allowance against the full reinsurance estimate to account for the possibility that there may not be enough money in the program to fund the entire liability, 45 percent indicated they would not, 34 percent indicated they would, and 21 percent responded “other.” Some respondents elaborated. The decision may depend on market information or what is developing in the company’s own experience, and some plan to dis-cuss this option with their outside auditors.
Respondents were also asked if their accrual would be offset by an estimate of an amount for claims to be denied. A large majority (82 percent) said they would not include an offset for claims to be denied.
When asked to explain how they will handle unpaid claim reserves for large claims at the end of the calendar year, some respondents indicated that they will run a separate lag analysis for large claims or that standard large claim reserving methods will be used. Some plan to look at specific claims where possible. One respondent noted that we have until March 31, 2015 to pay claims run-out for services with discharge dates in 2014, and they plan to work to reduce open claims as much as possible. One indicated they will likely use a seriatim calculation applying truncated completion factors. Finally, one respondent said they will estimate the reinsurance receivable using accumulated claims as of year-end and an estimation of completion for them, and then compare that to an estimated percentage of total claims that are expected to be reimbursed.
RISK CORRIDORThe risk corridor program is a temporary program that will only be in operation for 2014 through 2016 and applies only to Qualified Health Plans (QHPs) for individual and small group business. Large group, grandfathered, extended policies, and self-funded or TPA plans will not participate in the risk corridor program. The goal of risk corridors is to temporarily dampen gains and losses, due to mispricing of plans by having insurers pay to or receive funding from the federal government. The program compares “allowable costs” (claims costs)
with target amounts that are determined from premiums less allowable administrative (non-medical) costs.
Survey respondents were asked if they plan to accrue for risk corridor settlement amounts during the calendar year. Forty-eight percent said they would not and 52 percent said they would. Of those who said they would, 59 percent said they would spread the estimate evenly throughout the year.
Methodologies to be used include:• Forecast results relative to target amount.• According to federal formula.• Based on claims and estimates for reserves,
reinsurance, risk adjustment and CSR.• Sensitivity analysis shows stability in loss
position that government will reimburse X percent of losses. This will be used until closer to year-end, when all components can be estimated for a detailed calculation. The X percent factor will also be changed when year-to-date (YTD) financial results change enough to warrant it.
When asked to rate their ability to develop appro-priate estimates, 17 percent said they have no idea or are in early stage discussions and, at the other extreme, only 5 percent feel they have a detailed implementation plan in place. Twenty-two percent did not give a rating. The rest tended to rate them-selves toward the lower end of the capability range.
Fifty-three percent of respondents indicated they will have individual off-exchange products that qualify for risk corridor provisions. When asked how many such plans they will have, responses ranged from “small number” to 48, and included the following comments:
• “All of our plans are QHPs.” • “Almost all of our plans are substantially simi-
lar on- and off-exchange.” • “Where we offer plans on-exchange, we offer
those same plans off-exchange.”
Of those who are offering individual off-exchange products that qualify for risk corridor provisions only 35 percent indicated they were required to do so.
Health Insurer Financial Reporting Post-ACA | FROM PAGE 9
Promulgation of standards or safe harbors would be helpful, as would
wide dissemination of data on emerging
experience, risk scores, reinsurance
claims, etc.

Health Watch | October 2014 | 11
Under the “simplified methodology,” QHP issuers calculate the value of the CSRs provided by using a formula based on certain summary cost-sharing parameters of the standard plan, applied to the total allowed costs for each policy. Note that these survey questions were asked before the final rules were issued, which materially altered the “simpli-fied method” for some issuers, so responses may be different now that the methodology is more clearly defined.
When the survey was done the percentage of respon-dents who planned to use the standard methodology and the percentage that planned to use the simplified methodology were split about 50/50.
Sixty-four percent of respondents plan to collect advance payment credits. When asked how they plan to set up a payable for potential overpayments, sev-eral indicated they had not made a determination yet or did not believe there would be an overpayment. One respondent shared this formula: deferred liabil-ity account = advanced payment less estimated CSR. Another indicated that they will compare a vendor’s estimate from re-pricing to payments monthly.
Finally, we asked for any additional feedback respondents wanted to share and received the fol-lowing comments:
• Promulgation of standards or safe harbors would be helpful, as would wide dissemination of data on emerging experience, risk scores, reinsurance claims, etc.
• Answers to many of the questions may be dif-ferent if my view is to answer for 2014 finan-cials vs. say 2015 financials. 2015 will have more clarity.
I want to thank all the actuaries who took the time to fill out this survey. There are still a lot of unan-swered questions and no clear guidance on many of the issues addressed in this survey. Hopefully, by sharing your current thinking, we will come closer to consistent methodology for many of these items.
Thirty-three percent of respondents indicated they will have small group off-exchange products that qualify for risk corridor provisions. Fifty-eight per-cent of those offering such products indicated that they are required to do so.
HIP FEEThis fee is imposed on certain insurers providing health insurance coverage, including commercial coverage as well as Medicare Advantage, Medicare Part D and Medicaid. The fee applies beginning in 2014, but only if the covered insurers’ aggregate net premiums written in the preceding calendar year exceed $25 million. Self-insured groups, government entities, some non-profit organizations and voluntary employee beneficiary associations (VEBAs) are not subject to this fee.
Two-thirds of respondents indicated that they included an estimate of the HIP fee in their 2013 rates that carry over into 2014. Comments that respondents shared include: • “All health insurer fees were billed beginning
1/1/14, regardless of renewal date.”• “Our rate filings reflected this.”• “Since it is based on 2013 premiums it should
be called a 2013 tax rather than a 2014 tax ... this has created lots of accounting and rating issues.”
CSR PAYMENTSFor individual members whose income is below 250 percent of the federal poverty level (FPL), there exist variants of silver products available through the exchanges for which the federal gov-ernment will subsidize a portion of the member cost-sharing amounts. The government will pay insurers an estimated monthly amount to cover this portion. There exist two different methods for estimating the amount, as defined in the Federal Register.
Under the “standard methodology,” QHP issuers calculate the cost sharing for each claim twice—once using the cost-sharing structure that would have been in place if the individual were not eligible for CSR, and again using the reduced cost-sharing structure in the applicable plan variation for which the individual is eligible.

individuals with lower costs can selectively remain outside of the risk pool.
While the Medicare Part D program enrolled a rela-tively broad senior population, the ACA exchanges have features that could lead to enrollment that is a much more narrow slice of the risk pool in relation to the Part D program. The specific factors that could contribute to a more narrow risk pool include:
Transitional plans. While the Medicare Part D program did not offer a choice between an exist-ing fully underwritten plan and one offered under the Part D program for most participants, the ACA exchange program allowed this additional choice in half the states. By allowing this choice, individuals with lower expected costs could rationally choose the lower-cost option—typically their existing fully underwritten individual plan—and completely avoid the ACA risk pool. Because the original ACA premi-ums were developed assuming broad participation among those who were healthy and already had indi-vidual insurance, the originally developed premiums offered in the ACA exchange have the potential to underestimate the true costs of the program.
Total out-of-pocket premium costs to the member. The Medicare Part D program provides an implicit subsidy for all participants, as well as a more gen-erous subsidy for lower-income participants that eliminates the member premium and a vast majority of the cost sharing. This subsidy, combined with a benefit package that only includes drugs, produces an aggregate premium that is much lower than a typi-cal premium for a comprehensive medical policy. The ACA exchange, on the other hand, does not sub-sidize all participants and the overall premium for the comprehensive policy (medical and pharmacy) has the potential to be much higher. The net effect is that this premium difference could be significant enough to lower participation in the ACA exchange program as consumers respond to the higher overall premium by not enrolling in the program.
Buyer characteristics. The eligible members among the programs differ significantly—the Medicare Part D program is primarily designed for seniors, while the ACA exchange is designed for the entire non-senior population who needs individual coverage.
A s we wait for the initial financial results on the Affordable Care Act (ACA) exchanges, many policymakers are making a com-
parison between the Medicare Part D program and the ACA exchanges. In drawing this comparison, the policymakers have suggested that the ultimate performance of the ACA exchange will mirror the relatively successful financial results in the Medicare Part D program. As I will discuss in this article, although the two programs share common elements, several features inherent in the programs make any meaningful financial forecast of the ACA exchange using the Medicare Part D experience very difficult.
THE SIMILARITIES AND DIFFERENCES BETWEEN THE PROGRAMSAt first blush, the initial rollout of the Medicare Part D program has many similarities with the ACA exchanges. These features include no indi-vidual underwriting, no historical experience at the beginning of the program, online enrollment within a defined open enrollment period through an exchange, similar financial risk protections offered by the government, penalties for not participat-ing, and a subsidy for low-income individuals. While these similarities can provide a meaningful comparison for some aspects of the program, these features are not sufficient to use the Medicare Part D program as a means to predict the financial suc-cess of the ACA exchange program. The factors contributing to this challenge include:
• The uncertainties in predicting the ultimate risk pool in the ACA exchanges
• The potential cost variability at the health plan level
• The differences in the risk adjustment method-ologies used in the two programs.
RISK POOL UNCERTAINTYConsistent with any actuarial analysis, one of the most important prerequisites in estimating the cost for a population is understanding who will be included in the risk pool. If the underlying popu-lation varies from the initially assumed risk, the results could differ significantly—particularly if
12 | October 2014 | Health Watch
The ACA Exchange and Medicare Part D: A Comparison of Financial RiskBy Kurt Wrobel
Kurt J. Wrobel, FSA, MAAA, is chief actuary at Geisinger Health Plan in Danville, Pennsylvania. He can be reached at [email protected].

Health Watch | October 2014 | 13
than the Medicare Part D program. Several features in each program contribute to this difference, includ-ing:
Reinsurance subsidy. The Medicare Part D program provides unlimited reinsurance protection, while the ACA reinsurance provides protection up to $250,000 for the first three years of the program and then no protection beginning in 2017. In both cases, the reinsurance begins after a defined threshold has been met. This difference in financial risk protection can produce much higher costs and risk for insurance organizations in the ACA exchanges relative to the Part D program—particularly if an insurance organi-zation attracts sicker individuals.
Magnifying inadequate premiums through mem-ber migration. As discussed above, a higher overall premium level can be a powerful incentive for a low-utilizing member to avoid participating in the ACA exchange. In a similar fashion, a higher overall premium level could also create a powerful incen-tive to switch to the plan offering the most attractive benefits at a particular premium level. Given the structure of the ACA exchange, this incentive could be significant for both unsubsidized and subsidized plans. While the unsubsidized plan could offer a sig-nificant out-of-pocket differential for higher-income participants, a subsidized plan could create a signifi-cant percentage differential in premiums in a given year and over time that could prompt switching to lower-cost plans.
The following example from a Milliman brief-ing paper “The Proposed Federal Exchange Auto-Enrollment Process: Implications for Consumers and Insurers” by Susan Pantely and Paul Houchens highlights this issue. In the chart below, the authors highlighted the premium and subsidy level offered to an exchange participant at 150 percent of the federal poverty limit. Consistent with ACA policy, the subsidy level in this example is based on the second-lowest silver plan premium—in this case, the maximum expenditure individual is 4 percent of a household’s income or $57. The resulting subsidy amount ($268) can then be applied to all the plans to produce a higher or lower net premium.
As one would expect, the willingness to purchase an insurance product will depend on the prob-ability that an individual will incur claims and use the insurance product. Because the exchange is designed for a population that includes the young and healthy, we can reasonably expect lower par-ticipation and greater uncertainty regarding the ultimate risk pool in the ACA exchange relative to the Medicare Part D program.
Penalty differences. The Medicare Part D program has a financial penalty that increases each year that a senior does not enroll in the program. In contrast, the ACA exchange has a small immediate financial penalty for not enrolling in the exchange that does not accumulate and is much smaller than the total cost of the unsubsidized premium for almost all participants other than those with high incomes. As a result, an individual’s cost benefit calculation is much different between the programs—for the Medicare Part D program, an individual has a more compelling incentive to purchase insurance imme-diately while the prospective exchange member has a greater incentive to avoid purchasing insur-ance until it is needed and save on the more costly exchange premium.
HEALTH PLAN COST VARIABILITYIn addition to differences among the risk pools, the expected total costs for the ACA exchange popula-tion will be much more variable for health plans
CONTINUED ON PAGE 14

14 | October 2014 | Health Watch
The ACA Exchange and Medicare Part D | FROM PAGE 13
ACA Component Plan 1 Plan 2 Plan 3
Full Premium $300 $325 $350
Subsidy Amount (based on the second-lowest silver plan)
$268 $268 $268
Monthly Net Premium $32 $57 $82
% of Income 2.2% 4.0% 5.7%
As highlighted above, a significant percentage differential in actual net premium levels—$32 compared to $57 and $82—could prompt an individual with an income level slightly above the federal poverty limit to choose the lowest-cost plan.
This switching could be magnified over time as some health plans change premium rates to increase market share. The authors highlighted the following example where Plan 3 purposely reduced its premium and Plan 2 maintained its initial rate in an effort to increase market share.
ACA Component Plan 1 Plan 2 Plan 3
Full Premium $320 $325 $295
Percentage Change from 2014 7% 0% -16%
Subsidy Amount (based on the second-lowest silver plan)
$263 $263 $263
2015 Net Premium $57 $62 $32
2014 Monthly Net Premium $32 $57 $82
% Net Premium Change from 2014
78% 9.0% -61%

Health Watch | October 2014 | 15
much greater potential for claims costs to far exceed expected costs. In contrast, the Part D program is much less likely to have claims that far exceed expectations. Similar to the potential variability associated when estimating the risk pool composi-tion, these inherent differences introduce greater risk and increase the probability that an insurance organization will have claims costs that far exceed its original estimates.
RISK ADJUSTMENT PAYMENT DIFFERENCESWhile the preceding discussion highlighted the many structural challenges that could produce great-er variability in the ACA exchange program, the program also offers a risk adjustment program that could mitigate this variability. The ACA exchange program uses an allocation method that compares a health plan’s specific risk score to the overall pool to develop a risk adjustment payment (or cost) that is contributed (or paid to) by other health plans whose risk adjustment also differs from the pool average. This payment methodology uses concur-rent risk scores to develop payments that are made in the middle of the next calendar year after all the claims information, demographics and plan design information are compared among the health plans. The Medicare Part D program, in contrast, uses risk scores that are largely known by the health plan and are based on a member’s historical medical claims. These differences highlight the additional risks asso-
In this case, a member in Plan 1 where the health plan proposed a modest 7 percent increase would still see a large net premium change caused by two factors—an increase in the premium by 7 percent and a reduction in the subsidy caused by a reduc-tion in the second lowest silver plan ($325 to $320). Because the member would see the entire burden of the rate increase and the reduced subsidy, the incen-tive to switch to a lower cost plan would increase significantly.
This migration has the potential to magnify the impact of inadequate premium rates as individu-als move to these plans and increase the losses for insurance organizations. While this dynamic has also occurred with the Part D plans, the relative extent is likely to be less extreme simply because the premium level is much lower and the impact of the subsidy less significant.
Demographic and benefit package differences. The ACA exchange will be more likely to have greater cost variability because the benefit package includes medical and pharmacy benefits as com-pared to one with only pharmacy benefits.
Taken in total, for the ACA exchanges, the claims distribution at the individual health plan level will be much more like a traditional claims probabil-ity distribution (log normal) where there exists a
CONTINUED ON PAGE 16

16 | October 2014 | Health Watch
The ACA Exchange and Medicare Part D | FROM PAGE 15
difficult because the true results are not completely understood until the following year.
Overall, although the risk adjustment in the ACA exchanges has the potential to mitigate the variabil-ity concerns raised in this article, this protection is not as effective at minimizing this risk relative to the Medicare Part D program.
CONCLUSIONFrom a financial risk perspective, the ACA and Medicare Part D programs are much different, and any comparisons between the programs should con-sider the more traditional actuarial considerations that are discussed in this article—uncertainty in pre-dicting the risk pool, total cost variability for health plans, and risk adjustment payment differences. Given the nature of the two programs, the insurance organizations participating in the ACA exchange are much more likely to have volatile claims costs as well as total claims costs that exceed the initial predictions as compared to the Medicare Part D program.
ciated with the ACA program relative the Medicare Part D program, including:
Risk pool estimation risk. While the Part D pro-gram was developed to ensure that the risk scores are calibrated and are largely known to the insurer in the coverage period, the ACA exchange requires a health plan to estimate its own risk score relative to the broader risk pool. As we discussed in the first section of this paper, this risk pool estimate is dif-ficult and subject to more significant error.
Feedback on emerging results. Similar to any business, a health plan needs to understand how its emerging results compare with expected results to make the necessary pricing or operational changes to improve results. Unlike the Medicare Part D pro-gram, however, the ACA exchange does not allow this immediate feedback because the reconcilia-tion process is not completed until the next year. This delay limits an accurate comparison between projected and actual results and makes the pric-ing process for the next calendar year much more
Given the nature of the two programs,
the insurance organizations
participating in the ACA exchange are
much more likely to have volatile claims
costs as well as total claims costs
that exceed the initial predictions
as compared to the Medicare Part D
program.

Health Watch | October 2014 | 17

18 | October 2014 | Health Watch
Opportunities and Challenges for Physician-Led ACOs—A Recap of the ACO Learning Network WorkshopBy Julian Whitekus
E arly high-performance networks have been available in a few locations, but the new version of accountable care organizations
(ACOs) has greatly expanded in recent years. ACOs were popularized by the Brookings Institution and the Dartmouth Medical School efforts between 2006 and 2009, which led to the formation of the first non-Medicare ACO in 2010. Subsequently, the Affordable Care Act established a new volun-tary program called the Medicare Shared Savings Program (MSSP) that allowed for the establishment of ACO contracts with Medicare. ACOs are groups of providers that are responsible for the care of a designated population of patients. As of first quar-ter 2014, the Brookings Institution estimated that there were 610 Medicare and non-Medicare ACOs serving over 20 million members. Of these, 360 are MSSP ACOs serving almost 5 million Medicare beneficiaries in 47 states, and the remaining 250 are non-Medicare ACOs serving nearly 15 million beneficiaries. Based on the first national survey of ACOs, the results of which were published in the June 2014 edition of Health Affairs, physicians appear to be taking an active leadership role in forming ACOs and now outnumber hospital-based ACOs. The survey found that 51 percent of ACOs are physician-led, while an additional 33 percent of ACOs reported that they were jointly led by physicians and hospitals. Only 3 percent of ACOs reported that they were led by hospitals alone.
Physician-led ACOs face a number of challenges, which were discussed recently at the ACO Learning Network Workshop in Washington, D.C. on April 25. Topics included securing capital to invest in infrastructure, transitional care management, patient engagement and population management. A brief summary of the discussion is provided below. This focuses primarily on the physician-led ACOs that are a part of the federal Medicare pro-gram. Physician-led, high-performance networks for Medicare Advantage and commercial popula-tions face somewhat different challenges.
The cost to establish and maintain a federal ACO creates an impediment for many smaller organiza-
tions, most of which are physician-led. They lack the financial resources to support necessary opera-tions, which in turn limits the organization’s ability to grow its membership and, therefore, the level of its participation in the shared savings program. It threatens to undermine the success of ACOs that under-invest in infrastructure (e.g., health informa-tion technology, electronic medical records, hiring additional physicians’ assistants and care managers, etc.), which is necessary to employ best practices and maintain the highest standards of care manage-ment and coordination for its members. For non-federal programs, this cost is sometimes shared by the insurer.
Physician-led ACOs are less apt to include hos-pitals and other types of providers. As a result, physician-led ACOs may face greater challenges than other ACOs in managing transitions between settings of care and managing hospital-based care. Event notification (i.e., Admissions, Discharge and Transfer (ADT) messaging) can and is being used to improve transitional care management. Many ACOs have developed procedures whereby network hospitals send text messages to primary care physi-cians (PCPs) to notify them when their patients are in emergency rooms, admitted to hospitals, and ultimately discharged. Waiting for claim data to implement a treatment protocol is too long. Real-time notification offers ACOs the opportunity to improve care, reduce cost and receive higher pay-ments from the Centers for Medicare & Medicaid Services (CMS) by meeting the time frames required under transitional care management guidelines (e.g., direct contact by telephone or electronic communi-cation with the patient within two business days of discharge, face-to-face visit within 14 calendar days of discharge, etc.). Innovative IT applications can be very helpful in improving patient engagement and getting patients to take actions that are consistent with their doc-tors’ advice. Some plans are achieving a 95 percent engagement success rate using IT portals. Examples of IT portals’ capabilities include:
Julian Whitekus, FSA, MAAA, is vice president at Hannover Life Reassurance Company of America, a member of Hannover Re Group in Orlando, Fla. He can be reached at julian.whitekus@ hlramerica.com.
Health Watch | October 2014 | 19
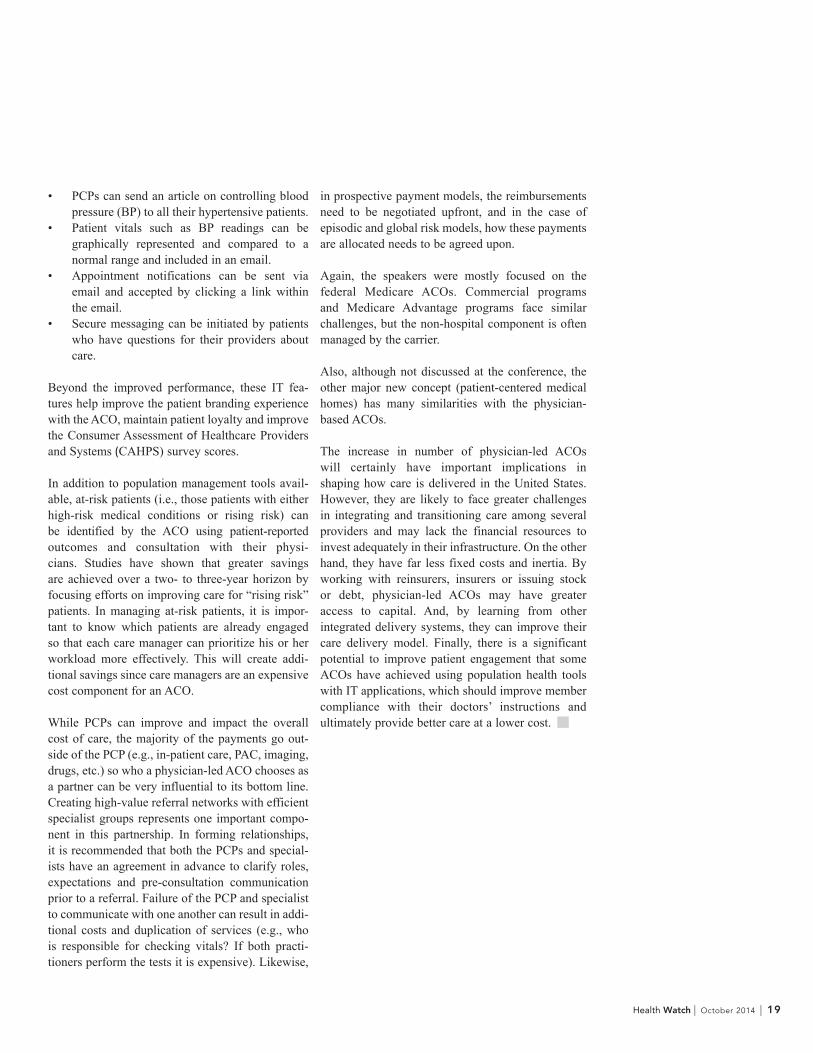
• PCPs can send an article on controlling blood pressure (BP) to all their hypertensive patients.
• Patient vitals such as BP readings can be graphically represented and compared to a normal range and included in an email.
• Appointment notifications can be sent via email and accepted by clicking a link within the email.
• Secure messaging can be initiated by patients who have questions for their providers about care.
Beyond the improved performance, these IT fea-tures help improve the patient branding experience with the ACO, maintain patient loyalty and improve the Consumer Assessment of Healthcare Providers and Systems (CAHPS) survey scores.
In addition to population management tools avail-able, at-risk patients (i.e., those patients with either high-risk medical conditions or rising risk) can be identified by the ACO using patient-reported outcomes and consultation with their physi-cians. Studies have shown that greater savings are achieved over a two- to three-year horizon by focusing efforts on improving care for “rising risk” patients. In managing at-risk patients, it is impor-tant to know which patients are already engaged so that each care manager can prioritize his or her workload more effectively. This will create addi-tional savings since care managers are an expensive cost component for an ACO.
While PCPs can improve and impact the overall cost of care, the majority of the payments go out-side of the PCP (e.g., in-patient care, PAC, imaging, drugs, etc.) so who a physician-led ACO chooses as a partner can be very influential to its bottom line. Creating high-value referral networks with efficient specialist groups represents one important compo-nent in this partnership. In forming relationships, it is recommended that both the PCPs and special-ists have an agreement in advance to clarify roles, expectations and pre-consultation communication prior to a referral. Failure of the PCP and specialist to communicate with one another can result in addi-tional costs and duplication of services (e.g., who is responsible for checking vitals? If both practi-tioners perform the tests it is expensive). Likewise,
in prospective payment models, the reimbursements need to be negotiated upfront, and in the case of episodic and global risk models, how these payments are allocated needs to be agreed upon.
Again, the speakers were mostly focused on the federal Medicare ACOs. Commercial programs and Medicare Advantage programs face similar challenges, but the non-hospital component is often managed by the carrier.
Also, although not discussed at the conference, the other major new concept (patient-centered medical homes) has many similarities with the physician-based ACOs.
The increase in number of physician-led ACOs will certainly have important implications in shaping how care is delivered in the United States. However, they are likely to face greater challenges in integrating and transitioning care among several providers and may lack the financial resources to invest adequately in their infrastructure. On the other hand, they have far less fixed costs and inertia. By working with reinsurers, insurers or issuing stock or debt, physician-led ACOs may have greater access to capital. And, by learning from other integrated delivery systems, they can improve their care delivery model. Finally, there is a significant potential to improve patient engagement that some ACOs have achieved using population health tools with IT applications, which should improve member compliance with their doctors’ instructions and ultimately provide better care at a lower cost.

20 | October 2014 | Health Watch
Medicaid NewsBy the Medicaid Subgroup
Here are a few topics of current interest:
MEDICAID EXPANSION UNDER THE ACAMedicaid expansion has captured a continuous stream of attention in the news, and Medicaid actu-aries are looking at the early results with interest. As of July 2014, there were 27 states (including the District of Columbia) that are expanding, 21 that are not, and three that are still discussing options. As of the time of writing this article, three states are expanding using an alternative method—Iowa, Michigan and Arkansas (with Pennsylvania as a possibility).
The numbers for Medicaid enrollment are sig-nificant. Nearly 7 million people have been added to Medicaid and Children’s Health Insurance Program (CHIP) rolls since last fall. For most states, the rapid expansion meant that enrollment goals exceeded expectations dramatically. As a result, several states are challenged with a backlog of enrollment. The federal government directed six states to provide a method to resolve their backlogs by July; Tennessee has been sued.
The new enrollees are often older than the existing population, use the emergency department, and, as
expected, have pent-up demand that did not show up in the first month of enrollment, but emerged two or three months after the programs began. The pent-up demand was for procedures as well as office visits and screenings. However, since this is Medicaid, and each state is different, there are variations in experi-ence that reflect the nature of the prior program, the demographics of the state, and the timing of the expansion. Some hospitals have noted that they have noticed a reduction in uncompensated care for the same time period, which they attribute to a reduction in the uninsured.
RATING AND RATE REVIEWSMedicaid actuaries have been following a practice note when doing Medicaid rate making; later this year a new actuarial standard of practice (ASOP) will be released that addresses Medicaid rates. The draft was released last spring; comments have been submitted and it is proceeding to a final form.
As the impact of the Affordable Care Act (ACA) fueled expansion increases uncertainty in Medicaid rating, several organizations, including America’s Health Insurance Plans (AHIP), National Association of Medicaid Directors (NAMD) and the American Academy of Actuaries (AAA), have been express-
Health Watch | October 2014 | 21
ing their concern about the process of rate approval by the Centers for Medicare & Medicaid Services (CMS). The letters have discussed the problems with timing, transparency, and the concept of actu-arial soundness. Many of these issues had been raised in the 2010 GAO report on Medicaid rating; there is some expectation that CMS may provide some sort of response this year to that report.
Timing of rate setting is challenging for all parties. The initial rates were developed using the best information available; now the experience for the existing population is so incomplete that the next round of rates is emerging with little new informa-tion. This situation should be familiar to actuaries who have been filing exchange renewal rates, but Medicaid rate setting is complicated by differing covered services, expansion start dates and popula-tion dynamics.
DUALLY ELIGIBLE MEMBERSMembers who are both Medicaid- and Medicare-eligible for coverage, either due to low income or disability, are an especially challenging population. Up until recently, they had two systems that did not integrate well with each other to navigate, and fragmented, uncoordinated care has been endemic. To allay this problem, the ACA included a provi-sion for fully integrated, dual-eligible special needs plans (D-SNPs). The D-SNPs have been in place for long enough for some experience to be emerg-ing. Also, CMS has approved several financial alignment projects to test models of integration between Medicare and Medicaid. Several states have released rates this year after months of discus-sion, and enrollment is ramping up. There is keen interest to see if assumptions about enrollment, relative morbidity and managed care savings were on target.
LONG-TERM SERVICES AND SUPPORTSMedicaid is the largest payer of long-term ser-vices and supports (LTSS) in the country; Medicaid expansion and the move to managed care for popu-lations that had previously been fee-for-service are of interest to Medicaid actuaries. Plans that have accepted capitation for members who use LTSS are facing challenges with finding resources to care for patients, integrating this care with acute care, and
meeting the expectations of both quality and man-aged care cost savings. ACA expansion has added a large number of homeless and post-incarceration members, often with mental health and substance abuse diagnoses (or both), who do not have social networks and who may have serious untreated medi-cal conditions as well, further stretching the system capacity to provide safe, effective and seamless care to members. Figuring out the expected costs of care for these members is another challenge.
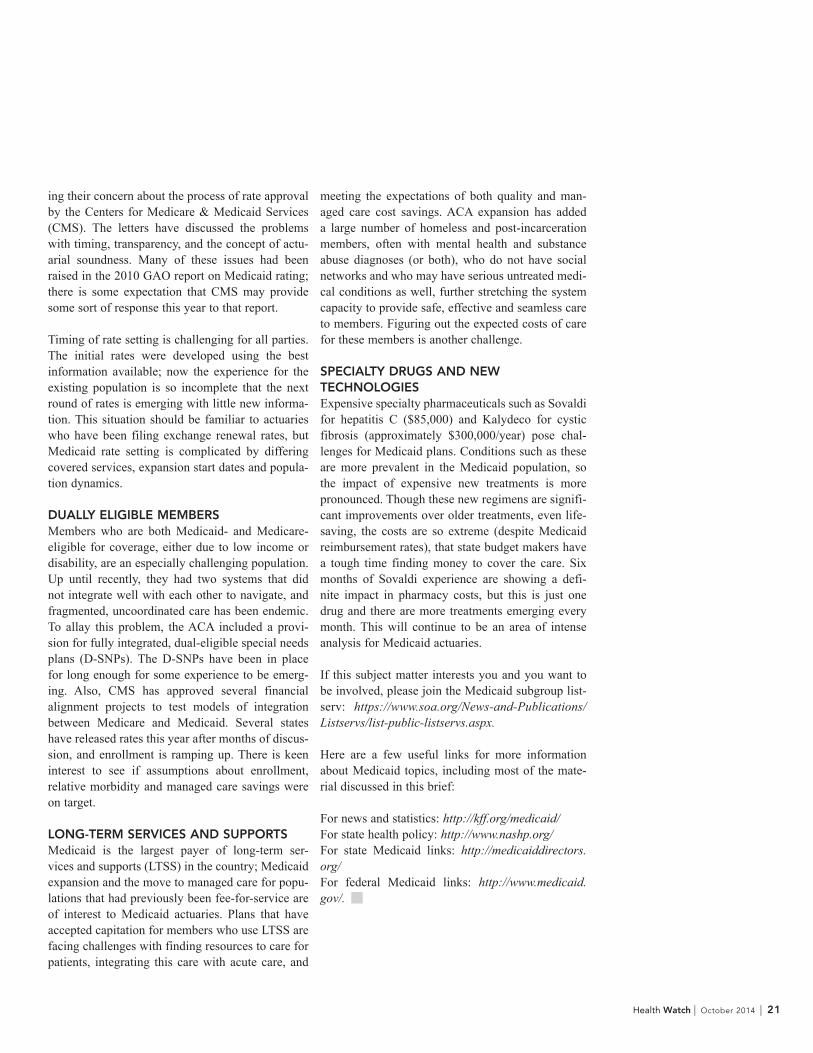
SPECIALTY DRUGS AND NEW TECHNOLOGIESExpensive specialty pharmaceuticals such as Sovaldi for hepatitis C ($85,000) and Kalydeco for cystic fibrosis (approximately $300,000/year) pose chal-lenges for Medicaid plans. Conditions such as these are more prevalent in the Medicaid population, so the impact of expensive new treatments is more pronounced. Though these new regimens are signifi-cant improvements over older treatments, even life-saving, the costs are so extreme (despite Medicaid reimbursement rates), that state budget makers have a tough time finding money to cover the care. Six months of Sovaldi experience are showing a defi-nite impact in pharmacy costs, but this is just one drug and there are more treatments emerging every month. This will continue to be an area of intense analysis for Medicaid actuaries. If this subject matter interests you and you want to be involved, please join the Medicaid subgroup list-serv: https://www.soa.org/News-and-Publications/Listservs/list-public-listservs.aspx.
Here are a few useful links for more information about Medicaid topics, including most of the mate-rial discussed in this brief:
For news and statistics: http://kff.org/medicaid/For state health policy: http://www.nashp.org/For state Medicaid links: http://medicaiddirectors.org/ For federal Medicaid links: http://www.medicaid.gov/.

22 | October 2014 | Health Watch
Highlights from the 2014 Health MeetingBy Kristi Bohn, Joanne Fontana and Rebecca Owen
KEYNOTES The kickoff keynote speaker was Dr. Mark McClellan, the director for Health Care Innovation and Value Initiative at the Brookings Institution. McClellan is the former administrator of the Centers for Medicare & Medicaid Services and the former commissioner of the U.S. Food and Drug Administration. This particular keynote discussed nonstop information tailored to a savvy health actu-arial audience. We heard about where McClellan sees the various U.S. health insurance markets and delivery systems are headed in the future, and much on the subjects of cost mitigation strategies and Washington politics. This session was like drinking from a fire hose—and an embarrassment of riches. The audience was left wondering whether the good doctor ever took a breath!
The lunchtime keynote featured Captain D. Michael Abrashoff—a fantastic speaker and a highlight of the conference for many. He reminded the audience of the importance of empowering staff, considering big and small ideas, and constant communication from leadership. Funny and relevant, the author of It’s Your Ship and It’s Our Ship shared many stories from his time as the captain of the USS Benfold. For example, he shared how an idea from a young enlisted sailor on his crew transformed the experi-ence of nearly the entire fleet. The idea: to replace ships’ iron bolts with stainless steel. This one idea greatly reduced the time that crew spent painting over rust, allowing more time for fulfilling train-ing and academic opportunities. If you missed this speech, we encourage you to read one of his books.
The last keynote was much less formal and featured Geoff Sandler interviewing actuary John Bertko (now with Covered California) about his career and advice to the next generation, as well as insight on working at Consumer Information and Insurance Oversight (CCIIO) during the implementation of many key actuarial aspects of the Affordable Care Act. The informality was appreciated, as it shift-ed away from the oft-used podium-style lecture, allowing the attendees to feel more connected and part of the discussion. Participants felt comfortable sharing their unbiased opinions with the crowd, which worked to stimulate discussion. Most people did not catch this since we have been working so
hard lately—but the setup of the interview spoofed the recent “Between Two Ferns” interview between Zach Galifianakis and President Obama.
SESSION HIGHLIGHTSThe regret of the Health Meeting sessions is there are so many relevant health topics that it’s very hard to choose which to attend, and which smaller set end up highlighted in Health Watch. For those who could not make the meeting in person, many of the sessions are available for purchase on the Society of Actuaries (SOA) website. Below we discuss a few great sessions that we attended. SESSION 24: INTRODUCTION TO LONG-TERM CARERobert Eaton and Vincent Bodnar provided attend-ees with an overview of long-term care (LTC) insurance. This one session gave those who are unfamiliar with this product an idea of what kinds of benefits are provided, the impairment criteria used to determine whether someone is eligible for LTC payouts, who purchases these products, and the most important assumptions used for pricing and valuation. Those who work on employer retiree health valuations will find many similarities in the valuation approach. The presenters discussed the historical circumstances leading to the underpric-ing of these products, including subjects such as assuming higher lapse rates than have occurred, and the struggle LTC insurers face in a low-inter-est-rate environment. The presenters also discussed options that policyholders typically choose when faced with unexpected rate increases.
SESSION 70: TAKE CHARGE OF YOUR TALENTThis interactive session shared fresh insights and proven tools from Don Maruska’s latest book, Take Charge of Your Talent. If you are a recent exam taker, you likely have read Maruska’s other book, How Great Decisions Get Made, because it is a large part of the syllabus for the SOA’s Decision Making and Communication (DMAC) module. Maruska taught attendees how to be good listeners, bosses, friends and coaches, and how we can help ourselves and others stop acting out of fear and rather build confidence from our past successes. If you live near San Francisco or California wine country, you
Kristi Bohn, FSA, MAAA, EA, is director , Actuarial & Regulatory Analysis at the Minnesota Department of Commerce. She can be reached at [email protected].
Joanne Fontana, FSA, MAAA, is actuary at Milliman, Inc. in Windsor, Conn. She can be reached at [email protected].
Rebecca Owen, FSA, MAAA, is health research actuary at the Society of Actuaries in Schaumburg, Ill. She can be reached at [email protected].

Health Watch | October 2014 | 23
might want to contact Maruska for some personal coaching sessions. We encourage you to purchase Maruska’s book; his group session was a real treat.
SESSION 97: DENTAL ACTUARIAL FORUMIn this session, Joanne Fontana, Ben Rayburn, Ruth Ann Woodley and Tom Leibowitz moderated an interactive discussion with attendees regarding top-ics of interest for actuaries working in the dental insurance industry. This was the first live event for the newly formed Dental Subgroup of the SOA’s Health Section, and it was great to see so many den-tal actuaries turn out for the session. Unlike most other sessions at the Health Meeting, this session was designed as an open forum rather than a pre-sentation, with the goal of having dental actuaries meet each other, learn from each other, and estab-lish common ground for the Dental Subgroup’s priorities. Audience participation was lively, with covered topics ranging from provider contracting, to dental cost trends, to the Affordable Care Act. Attendees came from a wide range of profes-sional backgrounds, enabling robust conversations in which attendees could learn from each other. We appreciated the willingness of the attending actuar-ies to share knowledge, discuss best practices, voice concerns and answer each other’s questions, and we hope this is the beginning of a strong presence for the Dental Subgroup.
SESSION 100: PROFESSIONALISM FOR PRICING ACTUARIESIn this session, regulator panelists Annette James from Nevada and Steve Ostlund from Alabama, as well as regulator consultant Jackie Lee, provided their thoughts on actuaries rising to professional-ism standards. Their comments were based on the rate filings they have seen, though in general terms. The thoughts they shared apply to all types of health insurance products. The panelists started out discussing small transgressions that make an actuary’s work product look unprofessional and unchecked, such as typos in the actuarial memo-randum, addressing letters to the wrong state, or addressing letters to a former commissioner. They then moved to bigger items, such as tables with historic values that have inexplicably changed since the prior memorandum; experience data pulled from time frames that are not recent or are unusual
and might seem to suggest misdirection; and attest-ing that one has read state law when it was clear from the actuarial memorandum that the actuary did not know the law. The panelists then moved toward big problems, such as a situation that recently led a retiree welfare actuary to disciplinary action from the Actuarial Board for Counseling and Discipline (ABCD). The regulators responded to excellent, cur-rent questions from the audience as well. This was a great session for actuaries looking for professional-ism continuing education credits, or for actuaries wanting insight to some regulators’ viewpoints on professionalism issues relating to the pricing of health insurance products.
MEDICAID SESSIONSThe Health Meeting had several sessions that dis-cussed facets of Medicaid and how it interacted with companion funding such as Medicare, LTC insur-ance and exchanges. Session 44 covered dual-eligible beneficiaries, and in particular the demonstration programs that knit together Medicare and Medicaid funding to provide seamless, coordinated care for this complex popula-tion. The demonstration programs have not been easy to make operational because of the complica-tions of quality measures, dual funding, the need to create coordination between disparate care delivery vehicles, and the requirement for savings. The sec-ond part of this session focused on one of the tough-est challenges in the care delivery package for dual enrollees—long-term services and supports (LTSS). This is not familiar ground for most Medicaid actu-aries, as these services have tended to be carved out of managed Medicaid, so the presentation was very valuable.
Session 83 covered the pieces of Medicaid expan-sion, starting with a look at those states that chose to expand using an alternate method rather than just expanding their existing Medicaid criteria. These alternatives are closely aligned with the exchanges, and have some characteristics that make us ask if the program is or is not Medicaid. This discussion was followed up by a case study on Oregon Medicaid’s move to managed care and expanded membership,
CONTINUED ON PAGE 24

24 | October 2014 | Health Watch
on the evolution, current state and future hope of quality metrics, and insights from a primary care doctor who has gone “concierge.” The audience would probably concur though that the most fasci-nating parts were learning about brain and spine sur-geries, and also the “cutting” edge of plastic surgery (which is much broader than cosmetic—we talked about transplants (even face) and tumor removals). The photos shared were moving. At one point the audience all applauded for the good work these tal-ented doctors have done.
WE APPRECIATE ALL WHO MADE THIS MEETING GREATMany thanks for the planning of the 2014 Health Meeting go to Valerie Nelson, Olga Jacobs and Nikia Robinson. Also, there were hundreds of ses-sion coordinators, speakers and moderators that made this meeting great. Many thanks to all of you who volunteered your time to support the advance-ment of the profession. In the end, attendance at this meeting broke a record as not only the largest Health Meeting the SOA has ever had, but also the largest conference outside of the annual meeting. We look forward to seeing you at next year’s meeting, which will be held on June 15-17 in Atlanta.
which is both more comprehensive and farther along than many states. The session closed with a presentation on the rating methodologies and the question of actuarial soundness.
The last Medicaid session covered LTC, and in particular publicly funded LTC. Session 93 dealt with the specifics of rate setting for LTSS services and the particular challenges with funding and with risk mitigation/risk sharing for these services. Presenters knit other payers into the presentation, with a discussion of how private LTC is rated and looked at, the way private and public funding of LTC has existed in the past, and how these benefits may develop in the future. The session closed with some sobering truths about the sustainability of the current state of affairs with LTSS, especially as it is currently funded.
A HEALTH MEETING RIDER: MED SCHOOL FOR ACTUARIESI know many of you think, “Med School for Actuaries sounds interesting, but I never have the time.” Well, Med School for Actuaries is fantastic and there is a different mix of topics and speakers each time. The topics this year included much time
Highlights from the 2014 Health Meeting | FROM PAGE 23

Health Watch | October 2014 | 25
Capturing the Impact of the National Economy on Humana’s Claim Trends to Improve Forecast AccuracyBy Jen Kilgore Coriell
F ive years ago, as the United States was start-ing to climb out of one of its worst periods of economic decline, an astute actuary made
the connection between the country’s economic challenges and Humana’s declining claim trends. At the time, claim trends were normalized for an assortment of actuarial influences. These influences were individually quantified, and then removed from the allowed trend. But there was always a portion of the trend that was left over and could not be explained. This remainder trend presented challenges when it came time to make claim trend projections that would serve as input to setting premiums.
Humana began looking for nontraditional explana-tions of this remainder trend. The search intensified when it was noticed that the remainder trend had recently plummeted. Being aware of the crash in real estate values and the subsequent decline in national output (gross domestic product), Humana searched for information about the influence of the economy on claims. But, with claim trend analysis being primarily the domain of the actuarial scienc-es, there wasn’t a lot of material available regarding the impact of the economy.
In fact, newspaper articles, journals and white papers from the mid-’90s revealed a debate over whether or not there even was a relationship between the economy and health care spending. One camp stated that patients will always demand care, regardless of their financial situation. The opposing perspective argued that there must be a relationship to their income; otherwise out-of-pocket require-ments wouldn’t influence the insured’s demand for health care services. Another line of argument came from the evidence of steady employment in the health care sector, which showed that the industry is “recession-proof.” But economists pointed to the phenomenon known as “downward stickiness” of labor markets that can typically be found in highly specialized industries where employers must make long-term commitments in order to compete for employee loyalty.
The charts on page 26 provide more detail on how health care spending trends have responded to economic recessions. This pattern holds true for Medicare and private health spending, as well as hospitals, physicians and clinical providers. Another interesting pattern is that following the start of recessions, within one or two years, health care trends have typically fallen. Concurrently, recessions squeeze the federal budget due to higher outlays and lower receipts. This prompts more aggressive legislation that is aimed at trimming Medicare and Medicaid spending.
Following the atypical severity of the Great Recession, Humana actuarial management agreed that some effect was coming through to impact claim trends and it warranted further study. Actuarial staff began to develop econometric models, and a search was initiated for an economist with experience in modeling and forecasting of health care claim trends.
As background, in the ’90s, I was with an insurer developing and deploying econometric models of claim trends. The models I developed at that time came to be relied upon for tax, strategy and market segment planning as well as investment strategy. But
Recessions have a minimal impact on health care employ-ment, but a significant impact on spending.
Health Care Employment, Spending and the EconomyPer Capita Annual Trends
Jen Kilgore Coriell is corporate economist at Humana. She can be reached at [email protected].
CONTINUED ON PAGE 26
Recessions have a minimal impact
on health care employment, but a
significant impact on spending.
Sources: US Bureau of Labor Statistics, US Department of the Census, and CMS
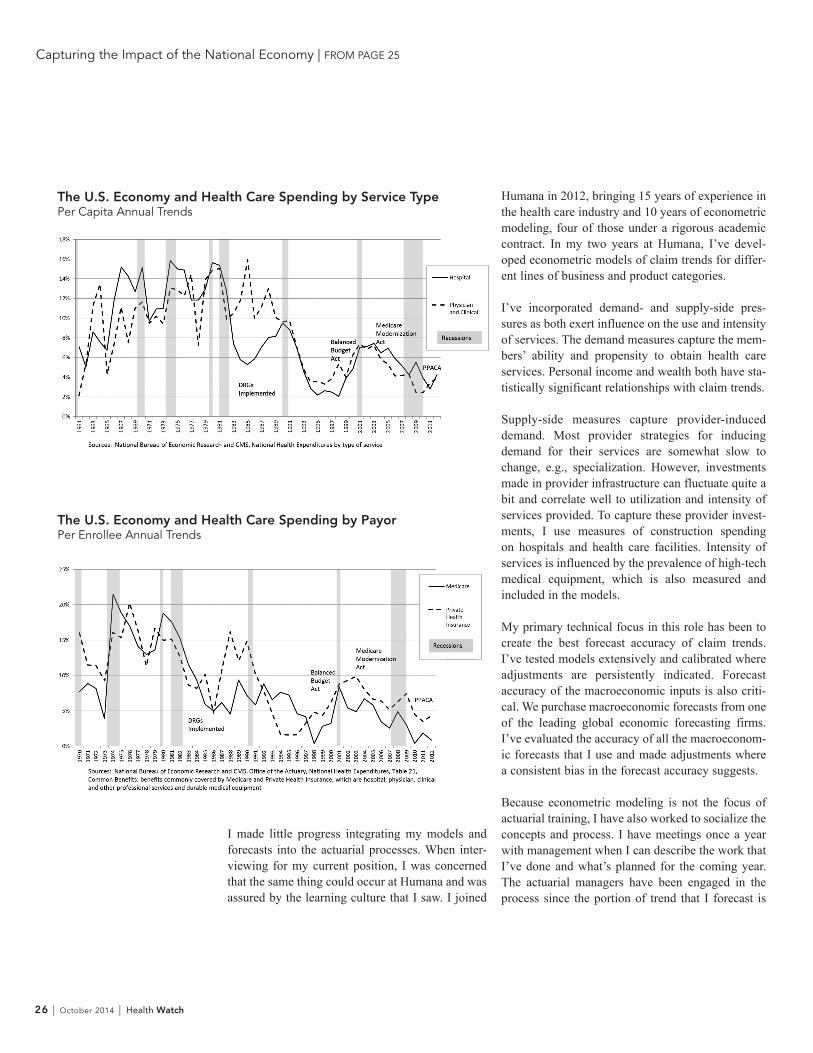
26 | October 2014 | Health Watch
Humana in 2012, bringing 15 years of experience in the health care industry and 10 years of econometric modeling, four of those under a rigorous academic contract. In my two years at Humana, I’ve devel-oped econometric models of claim trends for differ-ent lines of business and product categories.
I’ve incorporated demand- and supply-side pres-sures as both exert influence on the use and intensity of services. The demand measures capture the mem-bers’ ability and propensity to obtain health care services. Personal income and wealth both have sta-tistically significant relationships with claim trends. Supply-side measures capture provider-induced demand. Most provider strategies for inducing demand for their services are somewhat slow to change, e.g., specialization. However, investments made in provider infrastructure can fluctuate quite a bit and correlate well to utilization and intensity of services provided. To capture these provider invest-ments, I use measures of construction spending on hospitals and health care facilities. Intensity of services is influenced by the prevalence of high-tech medical equipment, which is also measured and included in the models.
My primary technical focus in this role has been to create the best forecast accuracy of claim trends. I’ve tested models extensively and calibrated where adjustments are persistently indicated. Forecast accuracy of the macroeconomic inputs is also criti-cal. We purchase macroeconomic forecasts from one of the leading global economic forecasting firms. I’ve evaluated the accuracy of all the macroeconom-ic forecasts that I use and made adjustments where a consistent bias in the forecast accuracy suggests. Because econometric modeling is not the focus of actuarial training, I have also worked to socialize the concepts and process. I have meetings once a year with management when I can describe the work that I’ve done and what’s planned for the coming year. The actuarial managers have been engaged in the process since the portion of trend that I forecast is
I made little progress integrating my models and forecasts into the actuarial processes. When inter-viewing for my current position, I was concerned that the same thing could occur at Humana and was assured by the learning culture that I saw. I joined
Capturing the Impact of the National Economy | FROM PAGE 25
The U.S. Economy and Health Care Spending by Service TypePer Capita Annual Trends
The U.S. Economy and Health Care Spending by PayorPer Enrollee Annual Trends

a substantial part of the total allowed trend. I also provide a detailed memo with each forecast, giving updates on relevant economic news and sources of any changes to the forecast.
But have econometric models and forecasts been incorporated into the appropriate actuarial pro-cesses and used for decision-making? It’s actually a tall order to ask actuarial management to rely on guidance from a field outside of their area of expertise. Making forecasts based on inferential
statistics is very different from using extrapolation and assumptions.
Bottom line: After actuarial adjustments and normal-izations are applied, the claim trends that were previ-ously unexplained are now modeled with economet-ric methods. The actuaries at Humana have come to rely on my econometric forecasts of claim trends for pricing and to develop consensus around corporate-level forecasts.
Health Watch | October 2014 | 27

475 N. Martingale Road, Suite 600Schaumburg, Illinois 60173p: 847.706.3500 f: 847.706.3599 w: www.soa.org
Health Watch
NONPROFIT ORGANIZATIONU.S. POSTAGE
PAIDSAINT JOSEPH, MI
PERMIT NO. 263