Embed Size (px)
Citation preview

THE WORLD BANK
Edited by Gerard M. La Forgia
W O R L D B A N K W O R K I N G P A P E R N O . 5 7
Health System Innovationsin Central AmericaLessons and Impact of New Approaches
33004P
ublic
Dis
clos
ure
Aut
horiz
edP
ublic
Dis
clos
ure
Aut
horiz
edP
ublic
Dis
clos
ure
Aut
horiz
edP
ublic
Dis
clos
ure
Aut
horiz
ed


Edited by Gerard M. La Forgia
W O R L D B A N K W O R K I N G P A P E R N O . 5 7
Health System Innovations inCentral AmericaLessons and Impact of New Approaches
THE WORLD BANK
Washington, D.C.

Copyright © 2005The International Bank for Reconstruction and Development / The World Bank1818 H Street, N.W.Washington, D.C. 20433, U.S.A.All rights reservedManufactured in the United States of AmericaFirst Printing: June 2005
printed on recycled paper
1 2 3 4 5 07 06 05
World Bank Working Papers are published to communicate the results of the Bank’s work to thedevelopment community with the least possible delay. The manuscript of this paper thereforehas not been prepared in accordance with the procedures appropriate to formally-edited texts.Some sources cited in this paper may be informal documents that are not readily available.
The findings, interpretations, and conclusions expressed herein are those of the author(s)and do not necessarily reflect the views of the International Bank for Reconstruction and Devel-opment/The World Bank and its affiliated organizations, or those of the Executive Directors ofThe World Bank or the governments they represent.
The World Bank does not guarantee the accuracy of the data included in this work. Theboundaries, colors, denominations, and other information shown on any map in this work donot imply and judgment on the part of The World Bank of the legal status of any territory orthe endorsement or acceptance of such boundaries.
The material in this publication is copyrighted. Copying and/or transmitting portions orall of this work without permission may be a violation of applicable law. The International Bankfor Reconstruction and Development/The World Bank encourages dissemination of its workand will normally grant permission promptly to reproduce portions of the work.
For permission to photocopy or reprint any part of this work, please send a request withcomplete information to the Copyright Clearance Center, Inc., 222 Rosewood Drive, Danvers,MA 01923, USA, Tel: 978-750-8400, Fax: 978-750-4470, www.copyright.com.
All other queries on rights and licenses, including subsidiary rights, should be addressedto the Office of the Publisher, The World Bank, 1818 H Street NW, Washington, DC 20433, USA,Fax: 202-522-2422, email: [email protected].
ISBN-10: 0-8213-6278-X ISBN-13: 978-0-8213-6278-5eISBN: 0-8213-6279-8ISSN: 1726-5878 DOI: 10.1596/978-0-8213-6278-5
Gerard M. La Forgia is Lead Health Specialist in the Latin America and the Caribbean Regionof the World Bank.
Library of Congress Cataloging-in-Publication Data has been requested.
Contents
Foreword v
Acknowledgments vii
Acronyms and Abbreviations ix
Introduction 1
Monique Vledder and Gerard M. La Forgia
1. Is the Perfect the Enemy of the Good? A Case Study on Large-Scale Contracting for Basic Health Services in Rural Guatemala 9
Gerard M. La Forgia, Patricia Mintz, and Carmen Cerezo
2. Contracting for Basic Health Care in Rural Guatemala—Comparison ofPerformance of the Performance of Three Delivery Models 49
Isabel Danel and Gerard M. La Forgia
3. The San Miguelito Hospital Reform in Panama—Evaluation and Lessons 89
Ricardo Bitrán, Cecilia Má, and Paulina Gómez
4. Contracting Primary Health Care Services—The Case of Costa Rica 109
James Cercone, Rodrigo Briceño, and Varun Gauri
5. The Nicaraguan Social Security Health Insurance Scheme—A Promising Work in Progress 135
John L. Fiedler and Gerard M. La Forgia
6. A New Dimension for Health Reform—The Integrated Community Child Health Program in Honduras 173
Marcia Griffiths and Judith S. McGuire
7. Improving Efficiency and Impact in Health Care Services—Lessons from Central America 197
Maureen Lewis
Contributors 209
iii


v
Foreword
This book, Health System Innovations in Central America, comes at an opportune time.Many countries in Latin America are taking stock of a decade of reform actions
carried out in the health sector. The contents of this book will inspire and providevaluable insights to this evaluation.
The book presents a series of case studies of health systems innovations by the CentralAmerican republics in the 1990s. The cases have a common theme of efforts to improvespecific aspects of health system performance through the introduction of innovative andalternative financial, organizational, or delivery models.
Over the past decades, the Central American countries have made significant progressin improving the health status of their populations. Despite these improvements, severalcountries face major challenges in reaching the Millennium Development Goals for health.Recognizing the need to make their health systems more efficient, equitable, and cost-effective, each country launched innovations to address specific problems or deficienciesin a particular program or function of the health system. The case studies in this bookreport on the results of these experiences, encompassing a range of issues from the expan-sion of primary care to the use of public-private partnerships and the establishment of asocial security-financed delivery system.
The lessons from these case studies are highly relevant for other countries in LatinAmerica and other regions of the world. Ensuring high performance of health care deliv-ery systems is a challenge facing all governments. Dealing with the incentive problemsunderlying public health care delivery to improve productivity, quality, and performanceis a common theme of health sector reforms in many countries. However, the impact ofthese reforms is often hard to establish. The case studies in this book provide an importantopportunity to reflect on lessons learned that are relevant to all countries seeking to intro-duce changes in their health systems.
I congratulate the authors for their groundbreaking work and hope that this report willstimulate discussion and innovation aimed at strengthening health system performance.Such efforts are critical to achieving the Millennium Development Goals for health.
Evangeline JavierDirectorHuman Development DepartmentLatin America and Caribbean Regional Office


vii
Acknowledgments
The papers presented in this volume were commissioned by the World Bank andsupported in part by grants from the Dutch Trust Fund, Development Marketplace,
and the Gates Foundation. I am grateful for this support from each. This volume was twoyears in the making, and many individuals helped it along the way toward publica-tion. First and foremost are the contributors who have a shared concern for improvinghealth system performance in Central America. At the early stage of formulation of theresearch effort, the cogent advice and tireless encouragement from Charles Griffinwere invaluable. Subsequently, the volume would not have been possible without theactive support of Ariel Fiszbein and Evangeline Javier. I also acknowledge the patience andconfidence of Ana-Maria Arriagada, Jane Armitage, Helena Ribe, and Laura Rawlings asthe volume took form.
Special thanks are due to the peer reviewers for the papers: April Harding, BenjaminLoevinsohn, Alexander Preker, Hedi Deman, Roberto Gutierrez, Milla McLachlan, JohnFiedler, and Marcelo Bortman. The papers benefited greatly from the comments and sug-gestions. I would also like to thank Patti Borthwick from Grammarians, Inc., for her rigor-ous editing. Finally, Monique Vledder did an outstanding job coordinating final review andproduction of the volume.


Acronyms and Abbreviations
ACECSA Asociación de Servicios Comunitarios de Salud (Guatemala)ADMSS administradora de servicios de salud (health services administrator
[Guatemala])AIN-C Atención Integral a la Niñez en la Comunidad (Integrated Community
Child Health Program [Honduras])ALOS average length of stayARIs acute respiratory infectionsB balboa (Panamanian currency)BCG Calmette-Guérin bacillusC$ córdobas(s) (Nicaraguan currency)CBGP community-based growth promotion (CBGP)CCSS Caja Costarricense de Seguro SocialCESAMO Centro de Salud con Médico (health center staffed by a doctor
[Honduras])CESAR Centro de Salud Rural (rural health center staffed by a nurse or nurse
auxiliary [Honduras])CLAP Centro Latino-Americano de Perinatologia (Latin American Perinatol-
ogy Center)COMSAIN Programa de Comunicación en Salud Infantil (Honduras)CT cuota técnica (technical quota)DASs directores de áreas de salud (district leaders)DPT diphtheria-pertussis-tetanusEAP economically active populationEMPs empresas médicas previsionales (previsional medical firms)ENSMI Encuesta Nacional de Salud Materno-Infantil (Guatemala)GDP gross domestic productGOG government of GuatemalaHACyA Habilitación, Adjudicación, Certificación y Acreditación (Licensure,
Adjudication, Certification, and Accreditation [Guatemala])HISMA Hospital Integrado San Miguel de Arcángel (Hospital San Miguelito)HPs health postsIMCI integrated management of childhood illnessesINSS Instituto Nicaragüense de Seguridad Social (Nicaraguan Social Security
Institute)IVM Invalidez, Vejez y Muerte (Incapacity, Old Age and Death Insurance
[Nicaragua])LCE Ley de Contrataciones del Estado (Public Contracting Law
[Guatemala])MDGs Millennium Development GoalsMINSA Ministerio de Salud (Ministry of Health [Nicaragua])MOF Ministry of FinanceMOH Ministry of HealthMSP Modelo de Salud Previsional (Previsional Health Model [Nicaragua])
ix

MSPAS Ministerio de Salud Pública y Assistencia Social (Ministry of Health andSocial Assistance [Guatemala])
NGOs nongovernmental organizationsNIR nosocomial infection rateOB/GYN obstetrical and gynecologicalOLS ordinary least squaresORS oral rehydration solutionPBS paquete básico de servicios (package of basic services)PHC primary health carePMSS Projeto de Mejoramento de los Servicios de Salud (Health Services
Strengthening Program [Guatemala])PNC prenatal carePRAF Programa de Asignación Familiar (Honduras)PSS proveedora de servicios de salud (health provider NGO [Guatemala])RFPs requests for proposalsRI régimen integral (integrated regime)RP Riesgos Profesionales (Professional Risks Insurance [Nicaragua])SEM Seguro Enfermedad-Maternidad (Sickness-Maternity Insurance
[Nicaragua])SIAS Sistema Integral de Atención en Salud (Integrated Health Care System
[Guatemala])SNUS Sistema Nacional Único de Salud (Universal National Health System
[Nicaragua])SSI Social Security InstituteTIPS Trials of Improved PracticesUNICEF United Nations Children’s FundUSAID U.S. Agency for International DevelopmentWHO World Health Organization
X Acronyms and Abbreviations
Introduction
Monique Vledder and Gerard La Forgia
This volume presents case studies of recent health system innovations launched bythe Central American republics in the 1990s. The studies report on the perfor-mance of the innovations and the policy environment in which they were devel-
oped, as well as nuts-and-bolts features and processes incorporated into their design andimplementation. Criteria used to select the experiences include: (a) the innovationdeparted from the modus operandi of the traditional public health delivery system; (b) theinnovation was developed and implemented by a government agency that was a majorplayer in the health sector; (c) availability of evaluative or analytic work on performance;(d) accessibility of information on the evolution and process of reform implementation;and (e) evidence that the reform is “here to stay.” Each of the cases reports on a reformthat has been under implementation for at least eight years (as of 2004) and has survivedat least two changes of government.
Similar to developing countries elsewhere, during the 1990s, Central American coun-tries faced pressures to improve the performance of their health systems. In most coun-tries, there was a consensus, often negative, that the systems were failing to live up to theirpotential. Rather than take on system-wide change, each country opted to step into reformthrough launching innovations to address specific problems or deficiencies in a particularprogram, function, or intervention of the system. The studies report on how these experi-ences fared—a hospital in Panama, a nutrition program in Honduras, primary care exten-sion in Guatemala, a subset of hospitals and primary care units in Costa Rica, and a socialsecurity-managed health care program in Nicaragua.
The cases can be characterized as efforts to improve specific aspects of system perfor-mance through alternative financial, organizational, or delivery models. Five involved exper-imentation with health service purchasing through public-private partnerships. One caseentailed a public-community partnership. Harnessing the private sector was an alternative
1

to command-and-control, public sector provision typical of public and social securityhealth systems in Central America. Although the changes intrinsic in these reformsreflected broader political and economic changes taking place in the region—such asdivestiture of state enterprises, opening of markets to competition, and relaxing of gov-ernment controls—the rationale for and context of engagement with the private sector var-ied considerably. As such, an array of strategies emerged over time.
Briefly, each country recognized the need to make their systems more equitable, effi-cient, accessible, and cost-effective. However, the route taken depended on the priorityplaced on each of these goals as well as external pressures. For example, in Guatemala, thegoal to rapidly expand access to primary care was mandated by the 1996 Peace Accords,which ended decades of civil strife, and constituted the main driver of nongovernmentalorganization contracting strategy adopted there. In Costa Rica, cost escalation, user dis-satisfaction, and decreasing production led to partnering with private cooperatives andfirms and the application of performance contracting. In Panama, the reform model, con-sisting of the creation of a purchasing agency and contracting out of hospital services, wasa compromise measure to avoid wasteful overlap between public and social security-managed delivery systems. In Honduras, the search for cost-effective interventions to com-bat persistent child malnutrition buttressed the development of a pioneering and publiclymanaged nutrition program.
Nicaragua presents the only case of a reform emerging from a heated ideologicaldebate. The establishment of a social security-financed delivery system was linked to thetransformation of the centrally planned economy to a market economy in the early 1990s.Nevertheless, the resulting model was a political compromise in which services were pur-chased from both the public and private sectors.
The remainder of this introduction provides a thumbnail sketch of the countries and theirhealth systems to facilitate understanding the context of the reforms that shaped the effortsreported in this volume and shed light on their potential for replication in other settings.
Overview of Social and Health Conditions in Central America
The isthmus of Central America forms a bridge between North and South America. Itincludes the countries of Guatemala, El Salvador, Honduras, Nicaragua, Costa Rica, andPanama and spans 521,500 square kilometers. The region has a population of approxi-mately 36.4 million. Population growth in much of the region remains high because ofcontinuing high birth rates and falling death rates.
Central America contains some of the poorest countries in Latin America as well asa couple of the better off. Table 1 presents summary social and economic indicators. InNicaragua, Honduras, Guatemala, and El Salvador, half of the population lives in poverty.However, the economic situation is very different in countries such as Costa Rica andPanama, which boast of the high per capita income, low unemployment, and more favor-able social development indicators. With the exception of Costa Rica, most of the coun-tries in the region have large income inequalities. Panama and Guatemala, for example,have among the most highly skewed distributions of income in the world.
Traditionally, Central American countries have been reliant on agricultural exportssuch as coffee and bananas to generate a large portion of their gross domestic product
2 World Bank Working Paper
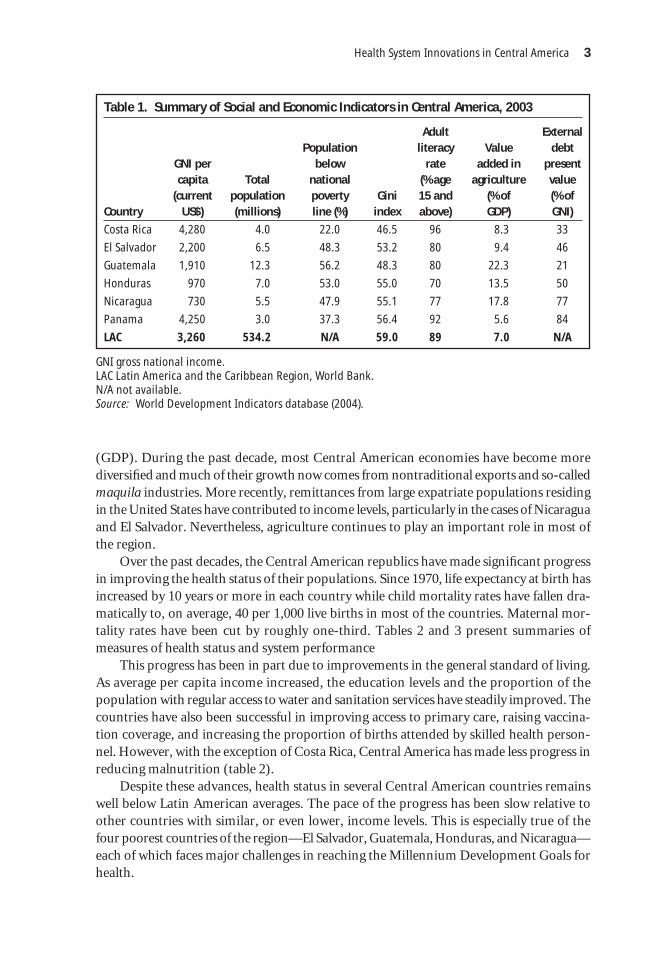
(GDP). During the past decade, most Central American economies have become morediversified and much of their growth now comes from nontraditional exports and so-calledmaquila industries. More recently, remittances from large expatriate populations residingin the United States have contributed to income levels, particularly in the cases of Nicaraguaand El Salvador. Nevertheless, agriculture continues to play an important role in most ofthe region.
Over the past decades, the Central American republics have made significant progressin improving the health status of their populations. Since 1970, life expectancy at birth hasincreased by 10 years or more in each country while child mortality rates have fallen dra-matically to, on average, 40 per 1,000 live births in most of the countries. Maternal mor-tality rates have been cut by roughly one-third. Tables 2 and 3 present summaries ofmeasures of health status and system performance
This progress has been in part due to improvements in the general standard of living.As average per capita income increased, the education levels and the proportion of thepopulation with regular access to water and sanitation services have steadily improved. Thecountries have also been successful in improving access to primary care, raising vaccina-tion coverage, and increasing the proportion of births attended by skilled health person-nel. However, with the exception of Costa Rica, Central America has made less progress inreducing malnutrition (table 2).
Despite these advances, health status in several Central American countries remainswell below Latin American averages. The pace of the progress has been slow relative toother countries with similar, or even lower, income levels. This is especially true of thefour poorest countries of the region—El Salvador, Guatemala, Honduras, and Nicaragua—each of which faces major challenges in reaching the Millennium Development Goals forhealth.
Health System Innovations in Central America 3
Table 1. Summary of Social and Economic Indicators in Central America, 2003
Adult ExternalPopulation literacy Value debt
GNI per below rate added in presentcapita Total national (% age agriculture value
(current population poverty Gini 15 and (% of (% ofCountry US$) (millions) line (%) index above) GDP) GNI)
Costa Rica 4,280 4.0 22.0 46.5 96 8.3 33
El Salvador 2,200 6.5 48.3 53.2 80 9.4 46
Guatemala 1,910 12.3 56.2 48.3 80 22.3 21
Honduras 970 7.0 53.0 55.0 70 13.5 50
Nicaragua 730 5.5 47.9 55.1 77 17.8 77
Panama 4,250 3.0 37.3 56.4 92 5.6 84
LAC 3,260 534.2 N/A 59.0 89 7.0 N/A
GNI gross national income.LAC Latin America and the Caribbean Region, World Bank.N/A not available.Source: World Development Indicators database (2004).

The improvements in health outcomes have also been very uneven, varying enor-mously by income, urban versus rural residence, and ethnicity. For example, in Nicaragua,between 1998 and 2001 the reduction in infant mortality rates in urban areas was nearlytwice that in rural areas and chronic malnutrition fell four times faster in urban than inrural areas. Similar inequalities in health outcomes exist between indigenous and non-indigenous groups. In Guatemala, for example, infant mortality rates decreased four timesfaster among non-indigenous groups than the indigenous rate in the period from 1987 to2001. In short, health problems are increasingly concentrated geographically in rural areas,among the poor, and, in the case of Guatemala, among indigenous populations. The casesfrom Guatemala and Honduras in this volume report on strategies and programs to addressthe health needs of these populations.
4 World Bank Working Paper
Table 3. Selected System Performance Indicators (2002)
Births One-year-olds attended Population immunized Total by skilled with access
against fertility health to safe Country measles (%) rate personnel (%) water (%)
Costa Rica 82 2.3 98.2 95
El Salvador 82 2.9 58.0 77
Guatemala 91 4.5 40.6 92
Honduras 95 3.8 62.0 88
Nicaragua 99 3.8 64.6 77
Panama 95 2.7 90.0 90
LAC 91 2.0 86.0 86
Source: The World Health Report 2004; Latin American data from World Development Indicators (2004).
Table 2. Central America: Health Status Indicators (2002)
Under-five Infant Maternal Stunting Life mortality mortality mortality of children
expectancy per 1,000 live per 1,000 per 100,000 under Country at birth births live births live births five (%)
Costa Rica 77.6 11 10 25 6a
El Salvador 70.1 37 28 150 23a
Guatemala 65.5 56 45 240 49
Honduras 66.1 44 35 110 32.9
Nicaragua 68.7 38 32 230 21
Panama 74.9 25 19 160 18a
LAC 71.0 34 28 193 12
a. Health, Nutrition, and Population statistics, World Bank (1995).Source: The World Health Report 2004 malnutrition data from national surveys; Latin America datafrom World Development Indicators (2004).

Health System Issues
Similar to most Latin American countries, the main actors in the health sector in CentralAmerica are ministries of health (MOHs), social security institutes (SSIs), and the privatesector. The health systems are highly fragmented: an MOH attends to low-income popu-lations; an SSI provides health coverage to mostly salaried, middle-income populations;and the private sector, dominated by fee-for-service solo practitioners, serves all popula-tion groups. The SSIs have commonly enjoyed levels of financing that exceed those of theMOHs. In Panama, for example, the per capita expenditure of the MOH is US$146, ver-sus US$207 of the SSI.
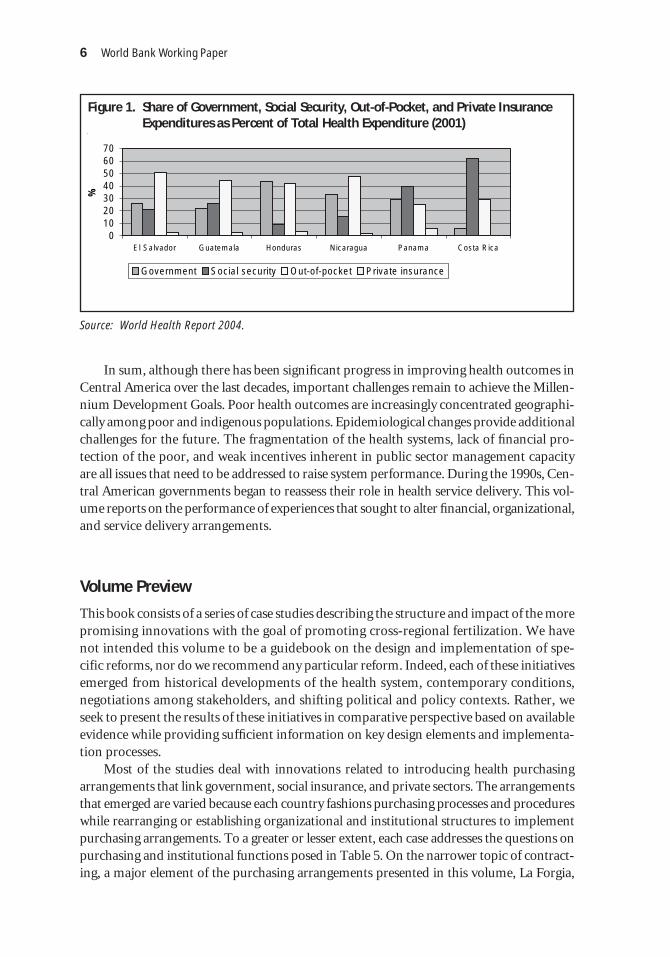
Table 4 shows that total and government per capita spending as well as social insur-ance coverage levels in Costa Rica and Panama dwarf levels observed in the rest of CentralAmerica. The health care systems in El Salvador, Guatemala, Nicaragua, and Hondurascurrently provide inadequate financial protection for the population against the financialconsequences of ill health. This is evidenced by the high levels of out-of-pocket financingof health care (see Figure 1). Significantly, out-of-pocket expenditures as a percentage oftotal health expenditures have been increasing over the years.
Throughout the region, the institutional environment is not conducive to sustainedhealth system performance. In all countries, the MOHs and SSIs provide most care throughfacilities that they own and operate. Input-focused, hierarchical bureaucracies and rigidpublic sector management practices that contribute to diffuse accountability and lack ofincentives for performance characterize these systems. Allocation of resources is based onhistorical budgets; the systems are subject to civil service systems that result in inflexiblehuman resource management; and purchasing of inputs is invariably centralized. Facility,program, and district managers have little decision-making authority on the allocation anduse of resources. In most countries in the region, the fragmented nature of the system con-tributes to duplication of service supply that in turn undermines the effectiveness and effi-ciency of the health system. The case studies from Costa Rica, Panama, and Nicaraguareport on initiatives to integrate service delivery systems of the government, social insur-ance, and private sectors.
Health System Innovations in Central America 5
Table 4. Health Financing in Central America (2001)
Total Per capita Per capita Population expenditure total government covered by
on health expenditure expenditure SSI health Country as % of GDP on health (US$) on health system (%)
Costa Rica 7.2 562 385 74
El Salvador 8.0 376 175 15
Guatemala 4.8 199 96 14
Nicaragua 7.8 158 77 12
Honduras 6.1 153 81 12
Panama 7.0 458 316 60
Source: The World Health Report 2004; social security data from household survey-based estimates.
In sum, although there has been significant progress in improving health outcomes inCentral America over the last decades, important challenges remain to achieve the Millen-nium Development Goals. Poor health outcomes are increasingly concentrated geographi-cally among poor and indigenous populations. Epidemiological changes provide additionalchallenges for the future. The fragmentation of the health systems, lack of financial pro-tection of the poor, and weak incentives inherent in public sector management capacityare all issues that need to be addressed to raise system performance. During the 1990s, Cen-tral American governments began to reassess their role in health service delivery. This vol-ume reports on the performance of experiences that sought to alter financial, organizational,and service delivery arrangements.
Volume Preview
This book consists of a series of case studies describing the structure and impact of the morepromising innovations with the goal of promoting cross-regional fertilization. We havenot intended this volume to be a guidebook on the design and implementation of spe-cific reforms, nor do we recommend any particular reform. Indeed, each of these initiativesemerged from historical developments of the health system, contemporary conditions,negotiations among stakeholders, and shifting political and policy contexts. Rather, weseek to present the results of these initiatives in comparative perspective based on availableevidence while providing sufficient information on key design elements and implementa-tion processes.
Most of the studies deal with innovations related to introducing health purchasingarrangements that link government, social insurance, and private sectors. The arrangementsthat emerged are varied because each country fashions purchasing processes and procedureswhile rearranging or establishing organizational and institutional structures to implementpurchasing arrangements. To a greater or lesser extent, each case addresses the questions onpurchasing and institutional functions posed in Table 5. On the narrower topic of contract-ing, a major element of the purchasing arrangements presented in this volume, La Forgia,
6 World Bank Working Paper
Figure 1. Share of Government, Social Security, Out-of-Pocket, and Private InsuranceExpenditures as Percent of Total Health Expenditure (2001)
010203040506070
El Salvador Guatemala Honduras Nicaragua Panama Costa Rica
%
Government Social security Out-of-pocket Private insurance
Source: World Health Report 2004.

Mintz, and Cerezo present an opera-tional framework in the first chapter.A brief preview of the cases follows.
The first two chapters examinethe performance and process of alarge-scale contracting-out effort inGuatemala to extend basic healthcoverage to rural, and mostly indige-nous, populations. La Forgia, Mintz,and Cerezo provide an in-depth viewof the contracting process in Gua-temala and how it changed over time.The case study provides insights intothe possibilities and limits of contract-ing, particularly in terms of large-scalecontracting in situations of weak insti-tutional capacity. The second chapter by Danel and La Forgia analyzes the comparativeperformance of three service delivery models used to extend basic services in Guatemala:direct contract, mixed contracting, and traditional public models. Based on household andprovider surveys, the evaluation suggests mixed results that depend on contextual factorsaffecting the supply of and demand for services.
In the third chapter, Bitrán, Má, and Gómez present the results of an evaluation ofalternative financial and organizational arrangements applied to the Hospital IntegradoSan Miguel de Arcángel (Hospital San Miguelito, also known as HISMA) in Panama City.This reform is noteworthy because it pooled heretofore separate financial flows from theMOH and SSI, established a jointly funded agency that purchases services on the behalf ofthe MOH and SSI, created an independent governance structure for the hospital, and con-tracted out services to an array of private providers through competitive bidding. Com-pared to two control hospitals, HISMA demonstrated superior performance.
The fourth chapter compares the performance of private providers contracted by theCosta Rican Social Security Institute (CCSS) with providers directly managed by the CCSS.Using a panel data set of ambulatory care outputs, Cercone, Briceño, and Gauri found thatcontracted providers, including cooperatives and private firms, were more efficient thanCCSS direct providers with no apparent reduction in essential services or outcomes.
The fifth chapter analyzes the evolution and performance of a health financing anddelivery scheme introduced by the Nicaraguan Social Security Institute. Fiedler and La For-gia found that the model receives high marks for patient satisfaction, capacity for resolu-tion, cost containment, and increasing available resources in the broader health system.However, several shortcomings were identified, including low population coverage, hid-den subsidies, and weak contract management.
The sixth chapter by Griffiths and McGuire assesses the development, organization,and impact of a community-based public health and nutrition program, Atención Integrala la Niñez en la Comunidad (AIN-C) in Honduras. Unlike the other programs describedin this volume, AIN-C constitutes a public-community partnership. According to theauthors, active community participation is the key ingredient in the program’s success.They present results from two evaluations suggesting that AIN-C is cost effective.
Health System Innovations in Central America 7
Table 5. Major Purchasing Functions
Policy and design Purchasing questions functions
How much Define resource envelopeto buy? Collect and manage money
For whom Define and target beneficiariesto buy?
What to buy? Define benefit packageWhat to exclude?
Whom to buy from? Select and contract providersIn what form?
How to pay? Define price and payment mechanism
Source: Adapted from Preker and others (2001);Figueras, Robinson, and Jakubowski (2005).

In the final chapter, Lewis provides a fitting conclusion to this volume. She examinesthe policy implications and lessons learned from the cases, stressing the importance of howthe innovations altered incentives to improve performance and productivity. Many ofexperiences were successfully launched and later sustained under uncertain policy andinstitutional conditions, suggesting that performance can be attained in difficult policyenvironments. Finally, the cases are also deemed innovative because of the willingness ofpublic authorities to support systematic data collection and evaluation. Without fullunderstanding of results as well as reasons for success and failure, health systems can onlygrope in the dark in terms of raising performance. We hope that the case studies consti-tuting this volume will provide some insight into innovative ways to improve health sys-tem performance.
References
Figueras, J., R. Robinson, and E. Jakubowski, eds. 2005. Purchasing to Improve Health Sys-tem Performance. Berkshire: Open University Press.
Preker, Alexander S., Cristian Baeza, Melitta Jakab, and Jack Langenbrunner. 2001.“Resource Allocation and Purchasing Arrangements that Benefit the Poor andExcluded Groups.” World Bank, Washington, D.C. Processed.
8 World Bank Working Paper

1. This case study is based on fieldwork conducted in 2000 and 2001 in Guatemala. A companionchapter in this volume evaluates the performance of the contracting experience. This case study draws onfield research commissioned to Gestión y Tecnologia en Salud y Desarrollo (GETSA), S.A. It also drawson the work of Nieves and La Forgia (2000) and Mintz, La Forgia, and Savedoff (2001).
CHAPTER 1
9
Is the Perfect the Enemy ofthe Good? A Case Study on Large-Scale Contracting for
Basic Health Services in Rural Guatemala1
Gerard La Forgia, Patricia Mintz, and Carmen Cerezo
Abstract
This case study examines a large-scale contracting effort in Guatemala overa six-year period. In 1997, the government embarked on an ambitious effortto extend basic health coverage to impoverished rural and indigenous popu-lations through the contracting of private, nongovernmental organizations(NGOs). By 2002, the government had signed 160 contracts with 88 NGOsto reach approximately 3 million beneficiaries. Two distinct phases aredescribed for the period under study: a developmental, improvisationalphase during the early years of implementation, and, later, a correction andconsolidation phase. Drawing on the Guatemalan experience, this case studyaims to provide an in-depth analysis of the “nuts and bolts” of contractingpractices, how they have changed over time, and how they have affected thedelivery of services by contracted NGO providers. It also draws lessons forpolicy makers who are considering contracting out the provision of healthservices. The case study complements a companion chapter in this volume onthe impact of contracting on meeting performance targets.

Introduction
Contracting out health services by public agencies is not new. Municipalities in the UnitedStates began contracting out an array of health services and programs in the 1950s (Shulman1982). Beginning in the 1980s, contracting services became increasingly common in otherdeveloped countries, especially the United Kingdom, Finland, New Zealand, Sweden,Australia, and Canada (Vining and Globerman 1999). In general, the experience in devel-oping countries is more recent, with the launching of most initiatives in the 1990s.2 Build-ing upon lessons learned from contract experiences in the developed world, these countriesare also pioneering innovations of their own. Although still dominated by maintenance,catering, security, and laundry services contracts in hospital settings, developing countriesare increasingly seeking to provide a range of health services to poor and underserved pop-ulations through direct contracting with private organizations. Recent experiences includecontracting of: (a) nongovernmental organizations (NGOs) in Afghanistan, Cambodia,Bangladesh, Colombia, India, Mali, and Panama to provide primary clinical, preventive,and reproductive health services; (b) managed care organizations to provide coverage fora comprehensive service plan in Colombia, Estonia, and Nicaragua; and (c) medical coop-eratives and other provider organizations to supply clinical services in Brazil, Costa Rica,and Panama.3
Evaluations of government contracting experiences in developing countries are scarce.Those that do exist focus on the impact of contracting on achieving stated goals related tocoverage, service delivery, and health.4 Although contracting has not been systematicallyexamined or a major focus of available evaluations, some studies have attempted to under-stand how government’s contracting infrastructure (or lack thereof) and processes may affectoverall performance.5 Similar to the experience in developed countries, the contract processitself affects service delivery and therefore performance. In a review of the literature drawnfrom developing countries, Taylor (2003) identifies a number of factors affecting the perfor-mance of contracting out: the supply of public providers and their capacity to manage andsupervise service delivery; contract management and negotiating capacity of the government;payment strategy, including the adequacy and timeliness of payments; confidence in the legaland regulatory framework; transaction costs related to preparing for and implementing con-tracting; and government capability in technical monitoring and evaluation.6
10 World Bank Working Paper
2. Governments in a limited number of developing countries, such as South Africa and Brazil, havehad contractual agreements with private hospitals for decades (see Mills [1998] and World Bank [1994]).
3. For a review of contracting experiences in developing countries, see Mills (1998), Mills andBroomberg (1998), and Bennett (1997). For a database on contracting experiences, see http://www1.worldbank.org/hnp/hsd/documents/ContractDatabase.pdf; for Nicaragua, see Fiedler and La Forgia (inthis volume); for Panama, see Bitrán, Má, and Gómez (in this volume); for Costa Rica, see Cercone andRosenmöller (2000) and Abramson (1999); on contracting of reproductive health services in Colombiaand India, see Rosen (2000) and Abramson (1999).
4. For Cambodia, see Loevinsohn (2002); for Haiti, see Eichler, Auxila, and Pollock (2001); for SouthAfrica, see Mills and others (2004).
5. One exception is Cambodia, which identified several issues related to contracting out, includingweak skills of staff hired by contracted nongovernmental organizations (NGOs), low contract manage-ment capacity of government, and lack of communication between government district authorities andcontracted NGOs (Loevinsohn 2002; Souters and Griffitths 2003). Mills and others (2004) also examinedhow contract design can influence primary care performance in South Africa.
6. See Domberger (1998) for a review of issues affecting contracting out in developed countries.

In 1997, the government of Guatemala (GOG) embarked on an ambitious effort toextend basic health coverage to impoverished rural and indigenous populations throughcontracting with private NGOs. By 2002, the GOG had crafted 160 contracts with 88 NGOsto reach approximately 3 million beneficiaries. Before this effort, the GOG had providedhealth services only through inhouse providers and had not entered into service contracts (ofany kind) with private providers. The Ministry of Health and Social Protection (Ministeriode Salud Pública y Assistencia Social [MSPAS]) contracted with NGOs to deliver a basicpackage of services, giving priority to prevention as well as maternal and child care in ruralareas where publicly managed services were irregular or unavailable.
The magnitude of this effort together with the accelerated scaling-up process were un-precedented among developing countries. The MSPAS developed and expanded the pro-gram by trial and error during a three-year period. In addition to forging the “downstream”infrastructure related to NGO selection, contractual design, payment mechanisms, and infor-mation and monitoring systems, the Guatemalans had to develop the “upstream” institu-tional infrastructure to support service purchasing, including the policy framework,regulatory environment, consensus-building strategies, financial structures and processes,and auditing systems.
This case study focuses on the direct contracting model applied by the government.7
The model entailed the contracting of NGOs to manage and provide a set of services tospecified catchment areas. These NGOs received a per capita payment and were responsi-ble for the procurement of all inputs except vaccinations.
Drawing on the Guatemalan experience, this case study aims to provide an in-depthanalysis of the “nuts and bolts” of contracting practices, how they have changed over time,and how they have affected the delivery of services by contracted NGO providers.8 It alsodraws lessons for policy makers who are considering contracting out the provision of healthservices. The story of Guatemala’s contracting is one of tradeoffs between moving quicklyon the one hand and “checking off all the boxes” of an ideal contracting strategy on theother. It is also an example of the capacity to learn and respond to new information and todevelop new capabilities. The case provides insight on the do’s and don’ts of contractingpractices, scaling-up processes, and creating the institutional capacity to purchase services.
The main message of this case study is that successful contracting is not a question ofgetting it all right. Indeed, if Guatemala had diligently checked off all the boxes and applieda contracting strategy based on best practice, implementation of the large-scale effort mighthave been elusive. Given the lack of experience with service contracting, the time requiredto develop the capacity to implement a more vigorous contracting strategy might have seri-ously compromised achievement of population coverage extension goals set by the GOG.Many of the elements associated with effective contracting were absent during the earlyyears of the program—for example, a transparent and competitive selection process, clearspecification of service responsibilities of contracted providers, use and measurement ofperformance, and development of contracting management and monitoring functions.Failure to address these items probably contributed to less than anticipated performance,
Health System Innovations in Central America 11
7. Government also applied a mixed contracting model. About two-thirds of all contracts entailedthe direct contracting model.
8. Chapter 2 in this volume examines the impact of different contracting models on service deliveryperformance.

as evidenced by the failure of most providers to deliver the full range of services desired bythe GOG and lower than expected population coverage with priority interventions. How-ever, the GOG did enable the contracting process by garnering political and institutionalsupport, establishing a supportive legal and regulatory framework, and developing neces-sary finance management and payment systems. More important, the Guatemalans learnedfrom their mistakes. Three years after the first round of contracts was signed, the GOGbegan a series of in-flight corrections that addressed most of the early shortcomings. Main-taining political and policy support for contracting while adjusting instruments and reshap-ing processes, based on information derived from implementation, led to significantimprovements in contracting and substantially enabled continuity.
The next section begins with a description of the policy context that led to the decisionto contract. It is followed by a section that summarizes the main design features of the con-tracting model as applied in Guatemala. A brief review of a nine-step operational frame-work on contracting, which outlines major aspects of the contracting process, follows, andthe remainder of the study applies the nine-step framework to the Guatemalan experience.Each step is analyzed to compare the “ideal” to what actually occurred in Guatemala. Thecase study concludes with a contracting scorecard and summary of lessons learned.
The results are based on document analysis and in-depth interviews with nearly 30 keyactors and stakeholders. To obtain a balanced assessment of the reality of designing andimplementing contracting out, the following participants were interviewed: (a) currentand former program officials; (b) MSPAS officials at the central, area, and district levels;(c) a sample of NGOs providers under contract with the MSPAS; (d) NGO providers whosecontracts were cancelled; (e) NGO providers that participated in the selection process butwere not awarded contracts; and (f) representatives of donor agencies supporting theMSPAS contracting.
Why Contract? The Political and Policy Context in Guatemala in 1996
In 1996, Guatemala was emerging from a lengthy and bitter civil war. In that year, a newlyelected government instituted talks and Peace Accords were signed, officially ending thecivil strife. These accords specifically contained provisions regarding health improvementin the country, especially in those areas where care was most needed and least available—the rural areas. Specifically, the accords stated:
The Government undertakes to increase the resources it allocates to health. By the year 2000,the Government proposes to step up public spending on health as a proportion of grossdomestic product by at least 50 percent over its 1995 level. This target will be revised upwardsin the light of future developments in State finances.
The system would give priority to efforts to fight malnutrition and to promote environ-mental sanitation, preventive health care and primary health care, especially maternal and childcare. The Government undertakes to allocate at least 50 percent of public health expenditure topreventive care and undertakes to cut the 1995 infant and maternal mortality rate in half by theyear 2000. In addition, the Government undertakes to maintain the certification of eradicationof poliomyelitis, and to eradicate measles by the year 2000.
—article VII, paragraphs c and d, Peace Accords, December 29, 1996
12 World Bank Working Paper

The accords and the need to increase resources directed at rural, largely indigenous,communities demanded a rapid, well-targeted response. The political cycle, with electionsscheduled for 1999, also contributed to the government decision to accelerate basic healthcoverage extension in rural areas, where more than half of the population resided.
Faced with these time constraints, the Minister of Health became convinced thatincreasing the level of services provided internally by the ministry for the targeted popula-tion would take too long. To mount such an effort would require screening, hiring, train-ing, and placing a large number of staff in areas where historically the MSPAS had beenmostly unsuccessful in recruiting and maintaining personnel. Purchasing and providingsupplies to support coverage extension posed additional obstacles. Where MSPAS providersdid exist in remote areas, supply-side constraints related to provision of logistical, equip-ment, and material support were notoriously deficient (Annis 1981; Pebley and Goldman1992; Goldman and Pebley 1994; Cosminsky 1987). Contracting was also envisioned toenable the MSPAS to expand coverage rapidly by facilitating the acquisition of inputsthrough bypassing the traditionally slow and cumbersome government personnel hiringand material procurement systems.
Alternatively, the new MSPAS authorities were aware that an undetermined number ofNGOs, supported by external agencies, were providing health services in rural areas. How-ever, little systematic information existed about the precise number of NGOs, their loca-tion, or the type and volume of services provided. Another enabling factor was a recentlyapproved loan from the Inter-American Development Bank, which included financing fora demonstration project on service contracting.
Epidemiological imperatives also drove the placement of health mandates in the accordsand the ministry’s decision to contract out. Table 1.1 compares health indicators for the poor-est and richest income quintiles (in 1995) and for indigenous and nonindigenous populations(in 1998–99). In the mid-1990s, Guatemala had a population of about 10.5 million, of which
Health System Innovations in Central America 13
Table 1.1. Summary Health Status and Service Indicators, 1995 and 1998–99
Poorest Richest Non- National quintile quintile Indigenous indigenous average
Indicator (1995) (1995) (1998–99) (1998–99) (1995)
Infant mortality 56.9 35.0 56.0 44.0 51.0
Children stunted (%) 64.6 12.1 N/A N/A 49.7
Total fertility rate 8.0 2.4 6.2 4.6 5.1
Diarrhea prevalence 22.8 16.0 13.7 13.1 20.9
DPT3 coverage 54.3 70.8 49.5 65.3 59.4
Births assisted by 9.3 91.5 16.7a 54.8a 34.8trained personnel (%)
Prenatal visit by 34.6 90.0 45.6a 68.0a 52.5trained personnel (%)
DPT diphtheria-pertussis-tetanus.N/A not available.a. Referred to physician or nurse attendance.Source: For 1995, Pan American Health Organization (1999) and Gwatkin and others (2000); for1998–99, Instituto Nacional de Estadística (1999).
about 40 percent were indigenous. Indigenous populations had traditionally resided mainlyin the northern and northwestern highlands, but they had also migrated to the southern coaststo sell their labor to large coffee and sugar growers. Documented health conditions showedhigh national rates of infant mortality (57 per 1,000 live births), high maternal mortality (190per 100,000 live births), and a national life expectancy rate of 65 years. However, all these rateswere at least 20 to 60 percent worse in the rural highland areas, where the program was to betargeted. Diarrhea and acute respiratory infections (ARIs) were the main killers of children,particularly in rural areas. Wide gaps in health service use were also evident. The MSPAS esti-mated that 40 percent of the population had little or no access to basic care, and most wereconcentrated in rural areas, particularly among indigenous groups.
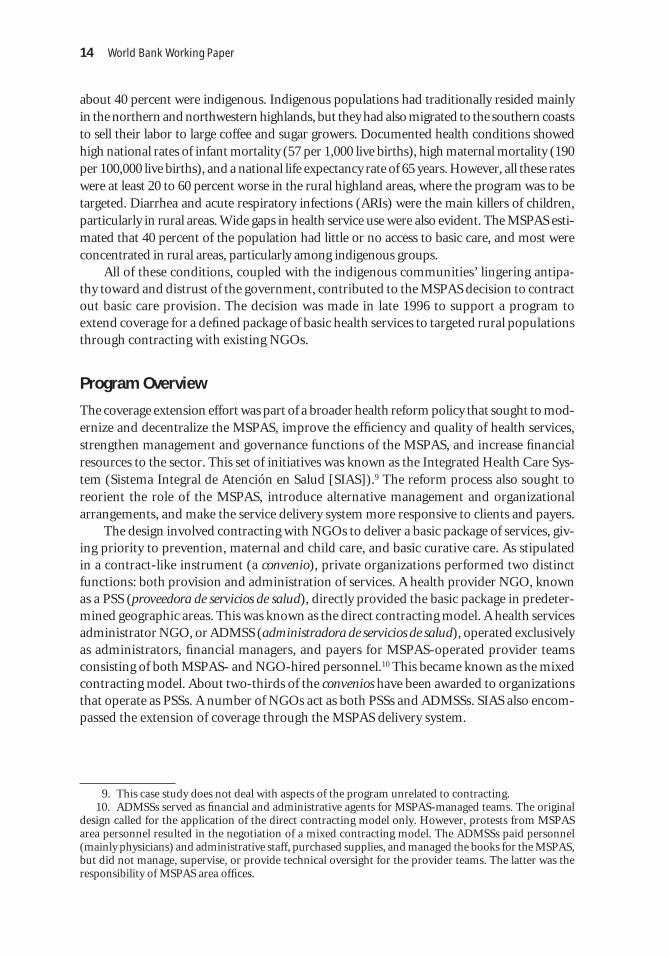
All of these conditions, coupled with the indigenous communities’ lingering antipa-thy toward and distrust of the government, contributed to the MSPAS decision to contractout basic care provision. The decision was made in late 1996 to support a program toextend coverage for a defined package of basic health services to targeted rural populationsthrough contracting with existing NGOs.
Program Overview
The coverage extension effort was part of a broader health reform policy that sought to mod-ernize and decentralize the MSPAS, improve the efficiency and quality of health services,strengthen management and governance functions of the MSPAS, and increase financialresources to the sector. This set of initiatives was known as the Integrated Health Care Sys-tem (Sistema Integral de Atención en Salud [SIAS]).9 The reform process also sought toreorient the role of the MSPAS, introduce alternative management and organizationalarrangements, and make the service delivery system more responsive to clients and payers.
The design involved contracting with NGOs to deliver a basic package of services, giv-ing priority to prevention, maternal and child care, and basic curative care. As stipulatedin a contract-like instrument (a convenio), private organizations performed two distinctfunctions: both provision and administration of services. A health provider NGO, knownas a PSS (proveedora de servicios de salud), directly provided the basic package in predeter-mined geographic areas. This was known as the direct contracting model. A health servicesadministrator NGO, or ADMSS (administradora de servicios de salud), operated exclusivelyas administrators, financial managers, and payers for MSPAS-operated provider teamsconsisting of both MSPAS- and NGO-hired personnel.10 This became known as the mixedcontracting model. About two-thirds of the convenios have been awarded to organizationsthat operate as PSSs. A number of NGOs act as both PSSs and ADMSSs. SIAS also encom-passed the extension of coverage through the MSPAS delivery system.
14 World Bank Working Paper
9. This case study does not deal with aspects of the program unrelated to contracting.10. ADMSSs served as financial and administrative agents for MSPAS-managed teams. The original
design called for the application of the direct contracting model only. However, protests from MSPASarea personnel resulted in the negotiation of a mixed contracting model. The ADMSSs paid personnel(mainly physicians) and administrative staff, purchased supplies, and managed the books for the MSPAS,but did not manage, supervise, or provide technical oversight for the provider teams. The latter was theresponsibility of MSPAS area offices.
The PSSs and ADMSSs received capitated payments in four yearly installments. Theamounts received varied, depending on whether the contract was for an ADMSS or PSS,the number of inhabitants in the assigned catchment area, and considerations for distance.The ADMSSs received a lower capitation rate than the PSSs for two reasons. First, an ADMSScontracted a reduced number of personnel compared to the PSSs (see footnote 10). Second,because most PSSs were assigned to remote areas, they received higher rates to account forelevated transportation costs.
The PSSs were assigned a catchment area containing at least 10,000 inhabitants, usu-ally distributed among dispersed and distant rural hamlets. The payment covered thedirect cost of the basic package plus administrative expenses and expenditures related toinstitutional strengthening. The MSPAS supplied vaccines, but the NGOs were respon-sible for purchasing all other inputs. In 1998, the average per capita payment was approx-imately US$6.25. As of 2002, it had not been adjusted for inflation. The total per capitacost was around US$8.00, including the cost of vaccines that the ministry supplieddirectly to the PSSs.11
Supported by a loan from the Inter-American Development Bank, the plan originallyproposed by the MSPAS involved an initial pilot period with three departments: Escuintla,Alta Verapaz, and Chiquimula. The plan also called for scaling up in a second phase, start-ing in 2000 and drawing on the results of an evaluation of the pilot phase. By the end of 1997,seven NGOs had 14 agreements in these three departments.
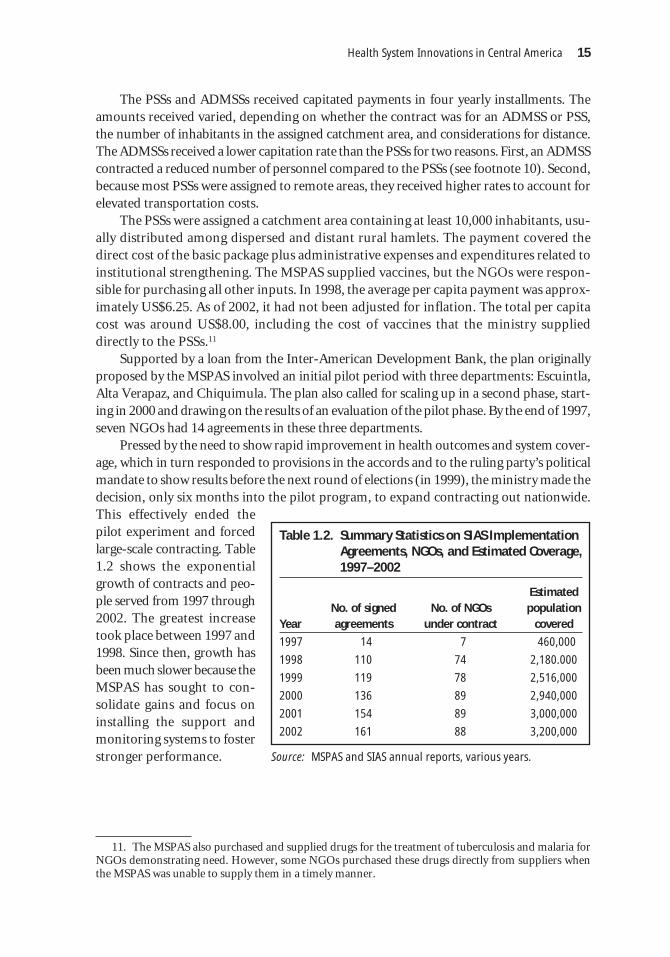
Pressed by the need to show rapid improvement in health outcomes and system cover-age, which in turn responded to provisions in the accords and to the ruling party’s politicalmandate to show results before the next round of elections (in 1999), the ministry made thedecision, only six months into the pilot program, to expand contracting out nationwide.This effectively ended thepilot experiment and forcedlarge-scale contracting. Table1.2 shows the exponentialgrowth of contracts and peo-ple served from 1997 through2002. The greatest increasetook place between 1997 and1998. Since then, growth hasbeen much slower because theMSPAS has sought to con-solidate gains and focus oninstalling the support andmonitoring systems to fosterstronger performance.
Health System Innovations in Central America 15
11. The MSPAS also purchased and supplied drugs for the treatment of tuberculosis and malaria forNGOs demonstrating need. However, some NGOs purchased these drugs directly from suppliers whenthe MSPAS was unable to supply them in a timely manner.
Table 1.2. Summary Statistics on SIAS ImplementationAgreements, NGOs, and Estimated Coverage,1997–2002
EstimatedNo. of signed No. of NGOs population
Year agreements under contract covered
1997 14 7 460,000
1998 110 74 2,180.000
1999 119 78 2,516,000
2000 136 89 2,940,000
2001 154 89 3,000,000
2002 161 88 3,200,000
Source: MSPAS and SIAS annual reports, various years.

Contracting Framework
This section briefly outlines a stylized framework of best practices for the “how” of con-tracting. It draws on experiences in public sector contracting of health services in the UnitedStates and Europe and, to a lesser extent, on experiences in developing countries.12 Theseexperiences range from subcontracting laundry services in a hospital to purchasing compre-hensive health insurance for low-income groups. In countries as diverse as Sweden (whichhas experimented with contracting private administration of hospitals) to the United States(where states are innovating in expanding insurance coverage for the poor through newMedicaid programs), contracting is being adopted as an important instrument for the pub-lic sector to achieve social goals. The framework identifies the distinct steps necessaryto select, execute, and moni-tor a successful contract. As described in Box 1.1, it consistsof nine steps. The steps are similar to “critical” or “successful” contracting features pre-sented by Mills (1998), Mills and Broomberg (1998.), and Taylor (2003). Although theframework is by no means exhaustive, its nine steps provide an analytic basis for assessingthe design and implementation of contracting practices for health services.
16 World Bank Working Paper
Box 1.1. Contracting Framework
1. Assess the feasibility of contracting, including the costs, political consequences, availability ofsuppliers, regulatory framework, and readiness to contract.
2. Gain political and institutional support for contracting, including building public support fromcommunities, organizations, and unions.
3. Define service specifications, including services to be purchased and the target populations tobe served.
4. Select performance measures.
5. Define payment methods and link payment to performance.
6. Select providers and maximize competition in the bidding process.
7. Negotiate and write the actual contract.
8. Monitor and evaluate the contract, and ensure the capacity for contract management.
9. Encourage competition over the long term to avoid monopolistic abuses in contracting.
Source: Mintz, LaForgia, and Savedoff (2001).
Analysis of Guatemala’s Contracting Process
The remainder of this chapter is organized according to the contracting framework pre-sented in Box 1.1. For each step, the salient tasks are identified and described in terms ofbest practice. The discussion centers on practical advice as to the do’s and don’ts pertinentto success at each step. These are summarized in a box at the beginning of each section.Then each step of the Guatemalan direct contracting experience is described—the extentto which specific elements of the stylized framework were applied, modified, or ignored,as well as the consequences of actual practices for service delivery. In several steps where
12. A more indepth description of the framework can be found in Mintz, La Forgia, and Savedoff (2001).

there was a significant change between the early (1997–99) and later (2000–02) phases ofthe project, these phases are described separately. The analysis also includes what was miss-ing in each step.
Step 1: Assess feasibility
Conceptual Framework
Deciding which services to contractout must take into account the fac-tors that can support or inhibit con-tracting (see Box 1.2). The first factorto be considered is cost. What are thetotal costs of providing the servicethrough a contract compared todirect, inhouse provision? Another isthe market of suppliers of the ser-vice(s) to be contracted. Among thefactors that should be considered is the extent of competition in the supply of services. Incomparing the total costs of contracting with the costs of retaining services in the publicsector, it is also important to compare them to the true cost of providing an equivalentquantity and quality of service through direct, inhouse provision.
A second major issue that affects feasibility of contracting is the political context.Specifically, how do political leaders view contracting at the national and local levels, andat the Ministry of Health? At the national level, there needs to be support for market forcesand the involvement of the private sector, including nonprofit organizations, in the con-tracted provision of goods and services previously provided exclusively by the public sec-tor (or not provided at all). These policy considerations also include evaluating thereadiness of the population at large for contracting.
In the public agency itself, there needs to be a commitment to move toward a role thatemphasizes policy, planning, and oversight as opposed to direct provision of all services.Contracting need not replace existing services that are directly administered. Instead, con-tracting can be focused on previously unserved or underserved populations or on servicesthat have not been previously provided. This is commonly the case with basic health andreproductive health services (Rosen 2000).
At the local level, there needs to be recognition of the impact of contracting on spe-cific facilities and local governmental institutions. Whether the local population views thisas a threat to their services or a welcome opportunity to get more and better serviceswill critically affect the degree of acceptance. Local government institutions may also berequired to take on new functions that they are not prepared for. For example, they may beasked to manage new funds or monitor contracts. This can sometimes facilitate and some-times obstruct implementation. Furthermore, local relationships among private providers,NGOs, public facilities, and the local government will also play a role.
A third issue is the availability and quality of suppliers. Who are the available con-tractors, how numerous are they, and do they compete with one another? In general, the
Health System Innovations in Central America 17
Box 1.2. Assessing Feasibility
♦ Evaluate relative costs of administration.
♦ Assess the political readiness for contracting.
♦ Evaluate the market.
♦ Assess the existing regulatory framework.
♦ Evaluate the existing contracting infrastructure.
greater the number of suppliers available, the greater the leverage of the contracting orga-nization for cost, quality, and outputs. In cases where the market of service providers isweak, governments can initiate small-scale experiments in contracting, incrementallyexpanding the number of suppliers. Potential providers may need technical assistance andtraining to raise standards and create capacity to become acceptable contractors.
A fourth component in evaluating contracting feasibility is the presence and sophisti-cation of a supportive regulatory framework. Nearly all governments have laws definingthe procedures of public contracting, but these vary considerably. Unfortunately, mostwere drafted with procurement of goods and infrastructure in mind, and they may not beapplicable to health service contracting.
A final element that will determine the feasibility of contracting is the organization’sability to contract and oversee contracts once they have been awarded. Contract manage-ment is critical to the success of contracting and often requires the establishment of apurchasing unit within the contracting agency. Nonexistent or weak capacity would rec-ommend an incremental approach to contracting through small-scale arrangements. Mov-ing slowly would allow time for the development of institutional capacity.
The Guatemalan Experience
The decision to proceed with contracting was in part a political decision made by MSPASauthorities and in part a contractual obligation specified in a loan financed by the Inter-American Development Bank.13 The matrix of conditionalities stipulated that by the thirdyear of project implementation, projected for 1999, the GOG was to sign at least eight con-tracts with NGO providers in three pilot departments: Alta Verapaz, Chiquimula, andEscuintla. During the preparation of the loan-financed project, known as the PMSS(Health Services Strengthening Program [Programa de Mejoramento de los Servicios deSalud]), the MSPAS explored options for contracting with NGOs in these areas. Consul-tants prepared several reports that provided a basis for decision making by the MSPAS,including legal feasibility analysis, definitions of health care delivery model and servicepackage, and estimated service delivery costs. The last was based on a small sample ofNGOs operating in the three target areas. No market analyses or other feasibility analyseswere conducted in other regions of the country. As mentioned, the idea was to implementand evaluate a pilot program and then, based on progress and results, scale up to otherareas of the country in a subsequent phase.
Organizational capacity to contract was nonexistent, but this was not surprisingbecause the GOG was inexperienced in service contracting. Because the PMSS called for asmall pilot program of contracting out, no feasibility analyses were conducted to assessexpertise, institutional capacity, or data-processing needs for contract management insidethe MSPAS. Expertise was to be built up during pilot implementation.
18 World Bank Working Paper
13. The Health Services Strengthening Program (PMSS) consisted of two loans: an Adjustment Loanfor US$25 million and a Technical Cooperation Loan for US$13.5 million. The Adjustment Loan con-tained conditions oriented toward increasing public health financing and allocative efficiency, extendingbasic coverage and improving the management of public hospitals. The Technical Cooperation Loan pro-vided financing for technical assistance activities to support achievement of the adjustment conditions.Both loans were approved by an outgoing government in December 1995.
The MSPAS performed no formal analysis of the comparative costs of internal ver-sus external contracting. The decision to contract was largely based on the fact that inter-nal resources at MSPAS were inadequate and, when available, difficult to allocate andconvert into service delivery, especially in poorly served rural areas where the MSPASpresence was minimal at best. Also, the NGOs were seen as more likely than the govern-ment to be accepted by indigenous people. Their cost structures, however, were not knownbefore initiation of the contracting process. It is not clear whether increased informationabout internal versus external (“make versus buy”) costs would have changed the deci-sion to contract in Guatemala. It might, however, have provided a benchmark againstwhich to judge the cost of the package of basic services that was later developed andimplemented.
Contracting for basic health services was heavily supported at the highest levels of theMinistry of Health (and the GOG) and given further impetus by the requirements for rapidimprovement of health outcomes created by the Peace Accords and the political cycle inwhich elections were closely followed by the target date (2000) of the health provisionsof the accords. However, the contracting program also faced a number of challenges andvulnerabilities.
First, although political support for the new program was strong, it was greeted at thedistrict and local levels with mistrust and suspicion. Many NGOs distrusted the GOG’sintentions and capacity to implement, especially because there was no precedent of gov-ernment contracting of services. Many NGOs touted their separation from governmentand their ability to provide higher-quality services than the MSPAS. Some were hesitantabout public perception of directly or indirectly supporting any underlying political cam-paign of the government to use SIAS as a springboard to solidify bases of political support.Others were more concerned with well-known government practices of not paying ordelaying payments to suppliers. Still others feared that they would be drawn into corruptprocurement practices that were well known to be plaguing the government.
Second, although many NGOs existed,14 there was little systematic information, byway of market analysis, as to the specific capabilities and capacity of each one. The lack ofa broader market analysis (beyond the sample of NGOs operating in the pilot departments)and the use of prevailing assumptions about NGOs’ capacities and capabilities created aninaccurate assessment of the ability of these contractors to deliver the prescribed services.This led to delivery system problems downstream. Taking the time to do a quick scan ofthe true capabilities of the NGOs in the country would have created a far more realistic pic-ture of capacity and identified areas for development. A structure and a process for the cer-tification or accreditation of NGOs initially did not exist.
Financially, the MSPAS had insufficient resources to support the program, but fundswere buttressed by the PMSS and additional funds were earmarked for the program by theMinistry of Finance (MOF).15 However, getting the funding from the MOF to the MSPASin order to pay NGO providers was a potential impediment to contracting. No paymentmechanism existed, nor was there even a line item in the government budget to allocate
Health System Innovations in Central America 19
14. An earlier MSPAS survey indicated that nearly 200 NGOs were working in the health field inGuatemala.
15. The PMSS did not directly finance the NGO contracts.

public funds to contracted providers. There was no mention of contracting public socialservices in the legal and regulatory framework governing public spending.16
Finally, the infrastructure and regulatory framework for public contracting in the coun-try was extremely weak, according to a legal assessment performed by the MSPAS. Therewas no mechanism for formally contracting (or paying) nonprofit health service providers.Existing contract law focused on commercial businesses and transactions primarily of worksand goods, a problem noted in the framework. This represented another barrier to imple-mentation and took much-needed time away from contract planning and implementation.In general, the lack of a clear regulatory framework to support contracting with NGOs bothrequired innovations and created obstacles to implementation. The MSPAS team reacheda consensus that moving forward with contracting out would require legal reforms.
Step 2: Gain political and institutional support for contracting
Conceptual Framework
Public concerns and political considerations are just as important as economic and legalones. Politics can provide an important source of support for contracting as well as a source of unyielding resistance. At the broadest (and frequently least organized)level are consumers and communities. At a second level are groups that have a specificstake in the process. This in-cludes nonprofit organizations(including NGOs) and privatefirms (including private hospi-tals) that may be awarded con-tracts. It also includes publicsector unions, professional associ-ations, and public employees. Thesection summarizes the key factorsand actors that influence the deci-sion to contract (see Box 1.3).
Level of public support for the contracting strategy. Community support or opposition to acontracting plan can make or break the effort. Before the first contract is signed, thereneeds to be a focused public relations campaign that educates the community and theninvolves them in the decision-making process (for example, development of evaluation cri-teria, selection of finalists). This process involves discussions about the problems or limi-tations of the status quo, and the benefits that can be realized through contracting.
Role of nonprofit organizations and for-profit firms in the contracting process. Private sec-tor trade groups, along with associations of private firms and nonprofit agencies, are obvious but often untapped sources of support for the contracting of services. Theirinterests can balance those of public employees, who generally seek to retain inhouse
20 World Bank Working Paper
16. In preparation for the PMSS, financial flow analyses were performed to determine options toenable the MSPAS to pay private contractors.
Box 1.3. Gain Political and Institutional Support
♦ Analyze what will be necessary to gain public sup-port of contracting.
♦ Evaluate the extent of public sector dominance ofthe service.
♦ Consult with NGOs and other relevant organizations.
♦ Understand the public sector unions and work col-laboratively with union leadership.

provision. To enlist support from these associations, government agencies should considerhow contracting will affect those businesses, their competition, and job creation. Potentialproviders are generally most interested in the transparency of procurement and biddingprocesses and the definition or negotiation of contractual terms. However, they mayobstruct implementation if their perspectives are excluded from the design of both the con-tract and the contracting process.
Presence or absence of a unionized workforce. In general, the possibilities and support forcontracting will be weaker where service delivery is concentrated in public agencies. Therole played by unions is critical to the contracting process. Dealing confrontationally withunions or ignoring them often leads to strikes and rallying of public opinion against thecontracting initiative. By contrast, planning for union participation will improve thechances of success. A policy of no layoffs also can defuse labor opposition. This can be com-bined with assisting workers displaced by contracting with finding jobs in other localitiesand facilities or elsewhere in government.
Prevalence and quality of good information. It is considered best practice to concretelydemonstrate the potential benefits from contracting to the community, NGOs, and unions,and keep them informed of evaluations of the contracting process. This is easier when goodinformation on current costs and levels of service can be made available.
The Guatemalan Experience
Before the institution of SIAS, health care for most Guatemalans with access to services wasprovided by public providers. There was no tradition of the types of public-private part-nership that contracting represents. Consultations with public employees, NGOs, andother stakeholders were considered after the decision to contract and scale up. This madeimplementation more difficult.
District and local branches of the MSPAS saw the contracting program as a threat—to their jobs and their control—a potential first step in “privatizing” the national healthcare delivery system. A major problem was that members of the district leadership (direc-tores de áreas de salud [DASs]) were not involved in either the development of the program,including the identification of services to be covered, or the identification of the NGOs withwhom initial contracts were developed.
Strong opposition from MSPAS area and district personnel cast doubts on the ability ofthe MSPAS to launch the contracting-out proposal. Local personnel questioned why theMSPAS was abandoning cadres of well-trained but underused rural health personnel (ruralhealth technicians). Supported by area authorities, this well-organized group of health work-ers claimed that if they were provided with sufficient inputs and support, they too couldextend services effectively and efficiently. Recognizing that coverage extension could beseverely compromised without area and district support, the MSPAS and area personnelnegotiated a mixed contracting model whereby “administrative NGOs” were contracted tohire additional personnel (to complement MSPAS health workers) and purchase supplies forMSPAS-managed provider teams. This compromise contributed to area and district per-sonnel’s acceptance of NGO direct contracting.
Health System Innovations in Central America 21

Increased early involvement and communication could have substantially improvedprogram effectiveness by eliminating an “us versus them” mindset among MSPAS offi-cials and NGOs at the district level. Under the program design, DASs were to have over-sight of the NGOs. However, because of the resentment between the DASs and the NGOs(as well as the resentment toward the MSPAS for “imposing” the new system), there wereinitial efforts to disrupt service provision by these fledgling organizations. For example, athere were DASs who often held back allocations of supplies and, in some cases, financ-ing to the NGOs.
Partly because of time pressure and partly as a management decision, there was littleinitial consultation with NGOs.17 In addition, there was relatively little communicationoverall with the NGO community. In the early phases of the program, there was limitedunderstanding on the part of NGOs about what the expectations of SIAS, in part becausethe program itself was a work in progress.
These misunderstandings later led to service delivery problems in the rural commu-nities served. More time spent educating NGOs at the beginning about the componentsand expectations of the contract could have ameliorated these difficulties. One umbrellaNGO organization, Asociación de Servicios Comunitarios de Salud (ACECSA), which pro-vided training services to NGOs, strongly resisted the new program and militated againstit publicly. ACECSA came to represent a group of health NGOs that wanted a voice in thedesign and implementation of SIAS. ACECSA, together with some NGOs and donorfinanciers, correctly argued that the NGO sector had not been taken into considerationwhen the contracting model was conceived and launched.
Other groups, however, responded more cautiously. For example, church groups,unions of health workers, and others, although initially skeptical, saw the model as anopportunity to participate in the system. The MSPAS was proactive with the unions, reach-ing out and communicating the potential benefits of contracting. These activities helpeddefuse initial union concerns. Although suspicious of the government’s ability to pay, anumber of large NGOs, wholly dependent on the vagaries of international funding, alsosaw an opportunity in the government’s initiative. They were willing to risk participatingin the government scheme as a means to sustain their operations in Guatemala.
In sum, most of the elements of the framework relevant to gaining support wereaddressed in the Guatemalan case. In some cases, they were addressed poorly, whichslowed implementation and increased distrust, most notably with the DASs and the NGOs.In other cases, efforts were made to reach out to health workers and unions, for instance.Ultimately, over time, the sheer size of the program created momentum for support.
Step 3: Define what will be purchased
Conceptual Framework
Once a decision has been made to contract, and political and labor issues have been consid-ered, the contract needs to be defined. At this stage, the contracting organization determines
22 World Bank Working Paper
17. Seven NGOs were selected by the MSPAS for pilot projects in 1997.

what it will be purchasing (for exam-ple, what goods and services), howmuch (volume) to purchase, andfor whom (the target population)—see Box 1.4. These are the buildingblocks of both the bid solicitationand the subsequent contract, andthey are addressed through a set ofspecifications.18
Specifying the required services can be accomplished in several ways. Most contractsspecify outputs—the specific services that will be purchased. Outputs should be specifiedaccording to the following criteria: (a) completeness (description of all tasks), (b) clarity(unambiguous definition of all terms), (c) measurability (to facilitate contract monitoringand compliance), and (d) focus (congruent with the mission and objectives of the con-tracting agency). Poorly specified services are difficult to monitor or evaluate, but clearlyspecified services foster accountability of the provider (to the purchaser) for the contractedservice.
The services identified in the contract must be measurable and independently verifi-able. In this way, the service measures can be turned into clear, objective, and credible per-formance indicators and can be linked to the contractor’s compensation. It is preferablefor the purchaser to focus more attention on indicators of desired outputs than on processindicators. By doing so, incentives are linked to outputs, or at least to services provided,leaving the contractor with the discretion needed to best achieve the purchaser’s ultimateaims. Output definition involves specifying the scope, expected volume, and number ofbeneficiaries of the contract.19
Although it is preferable to detail outputs rather than focus on resources andprocesses,20 there are occasions on which the latter can be included in specifications. Whenoutputs are ambiguous or not predictable, it is common for specifications to focus insteadon the application of predetermined resources. Nevertheless, first-time contractors ofsocial services are often tempted to define the processes of service delivery together withthe configuration of resources that correspond to these processes. However, specificationsthat focus on the “how” of service delivery may impede contractors from innovating toimprove quality or reduce costs. Contracts defined to purchase a specific cluster of servicesfor a given population should give the providers flexibility to innovate by providing ser-vices in new ways, with different kinds of staff, or by substituting elements of the input mix.If the purchaser specifies the inputs in great detail, then the contractor functions much likean inhouse direct provider and the gains from contracting are lost. By contrast, specifying
Health System Innovations in Central America 23
Box 1.4. Define Services
♦ Specify scope and type of services to be provided.
♦ Define volume of services to be offered.
♦ Define the population to be served.
♦ Stimulate provider innovation.
18. A specification is “what the purchaser seeks to buy and, consequently, what a bidder must beresponsible to in order to be considered for award of a contract” (Council of State Governments andNational Association of Purchasing agents [1983], cited in Marlin [1984, p. 40]). In short, they define thescope of the services that the contractor is to provide.
19. Establishing target populations will vary depending on the specific characteristics of that popula-tion. Geographically isolated and discrete populations are perhaps the easiest to identify and quantify. Inrural and isolated regions, the possibility of leakage toward other groups is minimal.
20. Quality specification is discussed in step 4 in this chapter.

outputs sends a strong signal to contractors to craft low-cost and high-quality ways to pro-vide a service.
The Guatemalan Experience
In developing the package of basic health services (paquete básico de servicios [PBS]),MSPAS leaders worked from epidemiological data for the country and the goals establishedin the Peace Accords to define what would be covered. The objective was to have a maxi-mum impact on infant and maternal mortality and morbidity at a cost that was affordableand sustainable. The final package included the major elements of prenatal care; postnatalmonitoring of mother and infant; well-baby care, including growth and weight monitor-ing; general treatment for common morbidities; and health promotion and sanitation (seeTable 1.3). This was the minimum package of services that an NGO could offer, and it wasdeemed non-negotiable by the MSPAS. Nevertheless, supplementary services could beadded at the discretion of an NGO if alternative financing existed.
The MSPAS also assigned each NGO a catchment area (jurisdicción) consisting of anestimated 10,000 people, based on available census tract data. If the populations were knownto be highly dispersed, a smaller population base was assigned. These catchment areas alsorepresented areas in which the MSPAS had little or no presence. One of the first deliverablesof a contracted NGO was to produce a population census of the catchment area.
24 World Bank Working Paper
Table 1.3. Composition of the PBS Package
Maternal care
Infant and child care
Demand for acute care and disease control
Environmental actions
Prenatal care, birthing, and postpartum care, supplementation, preg-nancy spacing
Immunizations, growth monitoring for children younger than 2, andcontrol of acute respiratory infections, diarrhea, and nutritionaldeficiencies
Cholera, dengue, malaria, tuberculosis, rabies, HIV/AIDS and other sex-ually transmitted diseases, and urgent care
Vector control, zoonosis control, promotion of safe food handling,hygiene and sanitation, and water quality monitoring
This package was developed without local input from MSPAS line personnel or theNGOs, who often criticized SIAS directors for forcing a “one size fits all” health care model.The MSPAS was convinced that it knew the priorities of these rural populations and didnot see the need to consult with local authorities. It focused on pathologies that impactedmortality. This meant, however, that other common and frequently seen pathologies—such as skin infections, gastrointestinal problems (in adults), and musculoskeletal dis-orders—would not be included in the PBS.
In late 1997, within a few months of contracting the first group of seven NGOs, theMSPAS developed a set of normas de atención (medical guidelines) that broadly defined theservices of the PBS but also specified how they would be provided based on national guide-lines. The norms reinforced the “one size fits all” approach, specifying such inputs as thenumber and type of personnel to be contracted and the responsibilities of each. All NGOshad to adopt the MSPAS-mandated personnel structure, training program, materials, and

equipment. The norms also defined outputs in terms of the volume and type of services tobe provided by each team, which were based on estimates of expected number of annualcases of pregnancies and diseases (such as diarrhea, ARI, and so on) in the catchment areas.
Overall, the norms allowed the providers little flexibility in determining how bestto deliver the PBS. According to the MSPAS, many NGOs had little experience in pro-viding the services constituting the PBS and welcomed the guidelines.21 However, someNGOs considered the norms a “straitjacket model” that was not appropriate for all sit-uations. For example, the MSPAS mandated the type and numbers of personnel; forexample, one health promoter for every 20 homes; one physician per 10,000 popula-tion; and the number of household visits per month by team members. NGOs had tofollow the MSPAS program for training personnel and use only MSPAS-prepared train-ing materials and techniques. Not doing so could result in cancellation of the contract.Nevertheless, over time and in light of the heterogeneity of health and geographic con-ditions, the MSPAS began to allow NGOs to part from the PBS and the norms if suffi-ciently justified.
The MSPAS’s failure to involve or inform the NGOs in its design of the PBS, impre-cise service specification, and weak monitoring (discussed later in this chapter) led to lackof clarity on the part of the NGOs as to the volume and frequency of services that they wereexpected to provide. As a result, in the early years of the program (1997 and 1998), mostNGO providers did not consistently provide the interventions specified in the PBS. Eachprovided those services in which it was strongest and most experienced. So, for example,vaccinations would be emphasized but growth and weight control might not. Greaterupfront involvement and communication, along with specific volume and service indica-tors, although appearing to slow down the process, could in fact have ultimately speededand smoothed effective implementation.
Step 4: Measure and ensure performance
Conceptual Framework
Once the services and the population have been identified, performance measures areneeded to provide the benchmarksfor monitoring contract complianceand quality of service provision aswell as fulfillment of the broaderhealth goals sought by the purchas-ing agency. Specification of perfor-mance indicatorsandcorrespondingreporting requirements are part ofthe contract, and they form the basisof an effective contract-monitoringsystem (see Box 1.5).22
Health System Innovations in Central America 25
21. A training guide was developed to train providers in how these norms would be applied.22. Monitoring is discussed in step 8 in this chapter.
Box 1.5. Measure and Ensure Performance
♦ Ensure that the performance measures aredirectly associated with the purchasing agency’shealth objectives.
♦ Select measures that are independently verifiable.
♦ Focus on output and outcome measures.
♦ Be sure to specify the quality standards and cor-responding measures.

First, the purchaser needs to ask whether it can develop performance measures linked tothe public health objectives of which the contracting strategy is one component. Second, isthe measure independently verifiable? Although some measures will be dependent onrecord keeping by contractors, independent sources of information are needed to verifyand validate the results. Such sources might include household surveys, health facility sur-veys, or medical record audits.
The purchaser faces a wide range of potential measures. These can include:
� input measures, such as staff hours worked, number of vaccines supplied, oral rehy-dration solution (ORS) kits provided;
� intermediate or output measures, such as the number of primary care visits, familyplanning classes provided, home visits by community health workers, and techni-cal quality (that is, application of clinical protocols); and
� outcome measures, such as a lower incidence of diarrhea among children, reduc-tions in maternal mortality, and user satisfaction with health services.
Input measures are perhaps the weakest measures of performance because, alone, theygive little information on the result of the contractor’s actions. Output measures areimportant and can correspond closely to the scope and volumes specified in the contract.However, output measures (such as productivity) do not gauge efficacy or quality.
Outcome measures are most directly linked to overarching policy objectives but maybe more difficult to attribute to the particular contractor’s efforts because of long lag timesand multiple determinants. An important outcome measure—often overlooked in thespecifications—is quality. The contract should specify quality standards expected for eachservice or activity. Clinical or technical quality measures for most types of health servicesare increasingly available, and they can be adapted to contractual specifications. Also, con-sumer satisfaction measures are always important in ensuring that the quality of the ser-vices provided is satisfactory to the ultimate recipient.
The Guatemalan Experience
Although service was weakly defined, performance measures were absent, especially inthe early years of the contracting process. When contracting began in early 1997, therewere no performance measures included as part of the convenios between the MSPAS andthe NGOs. The norms of care focused on process but not on outputs or ultimate results.No baseline health or utilization data were collected in the catchment areas.23 Accordingto SIAS norms, contracted NGOs had to comply with three measures: (1) regularly senddemographic, service production, financial, and some epidemiological information tothe MSPAS; (2) provide all the interventions contained in the PBS; and (3) cover theentire population in the assigned catchment area. In practice, the MSPAS only effectivelymonitored and held NGOs accountable for supplying the information specified in thefirst requirement during the first three years of SIAS implementation. As long as the
26 World Bank Working Paper
23. Given that all contracted NGOs had to conduct a household census to establish the population inits catchment area, this was an opportunity to collect other types of data to facilitate setting performancemeasures and subsequent evaluation.

NGOs provided the requiredinformation on a more or lessregular basis, they were in com-pliance with MSPAS contractualrequirements.24
The SIAS program had es-tablished an overarching set ofgoals that it wanted to accom-plish at the outset. Key items areshown in Table 1.4. These met-rics were not, however, initiallylinked to contractual measuresof performance of the NGOs.Therefore, the accountability ofNGOs to move toward meetingprogram—and national—goalsof service provision and mortal-ity reduction was slight. In regional meetings, the MSPAS provided often inconsistentsignals, directing the NGOs to emphasize specific interventions (such as immunizations)of the PBS. In sum, for most NGOs, the “what” and “how” of performance assessment wasunclear at best.
Three years after startup, however, with experience and program expansion, perfor-mance indicators were gradually brought into the contracting process. Supporting thisprocess was a performance-monitoring system, Habilitación, Adjudicación, Certificacióny Acreditación (HACyA (licensure, adjudication, certification, and accreditation), thatannually assesses NGO performance based on a series of metrics related to communityorganization, training, service coverage, and financial management (see Table 1.5).25 Thesestandards also became the threshold for new organizations seeking to enter the program.
The HACyA indicators focused on a subset of PBS interventions—vaccination, growthmonitoring, micronutrient supplements, and prenatal care. This made sense because theywere the key interventions of the PBS and, given the weak capacity of the MSPAS,26 theywere also the activities that the MSPAS would be capable of monitoring. The HACyA sys-tem also assessed financial management performance.27
Thus, over a two- to four-year period, performance measurement in the SIAS programevolved from a somewhat haphazard process to one that gradually moved toward a morefocused and performance-based orientation. Since 2000, the performance indicators havebeen written into the contracts and used to determine contract renewal. However, only theindicators are included. The performance targets for each NGO are not specified, in part
Health System Innovations in Central America 27
24. Performance monitoring is discussed in step 8 in this chapter.25. The ADMSSs were rated on financial management criteria only.26. At this writing (September 2004), only the certification and adjudication aspects of the program
have been implemented.27. As described in step 8, a point system was developed for both technical (community organization,
training, and coverage) and financial management aspects. The combined technical and managementscores determined the type of contract renewal (full renewal, conditional renewal, or cancellation).
Table 1.4. National Goals of the SIAS Program
Measure Specific Five-year Goal
Vaccination coverage in >90% of covered populationchildren under 5
Prenatal care At least 75% of covered population
Coverage for antitetanus At least 75% of covered vaccination in women in populationtheir childbearing years
Growth monitoring of At least 75% of covered children under 2 population
Availability of ORS kits in 100% of families coveredevery home
Presence of medications At least 80% of essential medications (at health postsand NGO-operated services(botiquines básicos)

because of the absence of baseline data. Rather, global targets are used to rate the NGOs oncoverage (see Table 1.4).
As discussed in step 8, the contract assessment system essentially became equivalentto the monitoring system. Performance indicators signaled NGOs as to the MSPAS’s pri-orities related to a subset of PBS interventions. However, despite the turn toward perfor-mance measures, including an increasing focus on outputs and away from processindicators, the role of the HACyA process as it relates to ensuring quality was not discern-able. Another shortcoming is that performance continues to be self-reported. Household-based assessments of provider performance have yet to be implemented.
Step 5: Define the payment system
Conceptual Framework
The choice of payment mechanisms and the linkage of payment to performance are two ofthe greatest drivers in the ultimate success of the contract (see Box 1.6). Payment systemscan consist of standard payment mechanisms as well as incentive payments. Although noone payment mechanism will be appropriate in all cases, there is evidence that whatever
28 World Bank Working Paper
Table 1.5. Indicators for Determining NGO Contract Renewal
Assessment category Indicator
Community organization Number of volunteer community workers selected
Number of community midwives selected
Existence of community census
Existence of community map
Existence of community pharmacies
Training Number of workers trained in at least 6 basic themes: mapping, cen-sus taking taking, ARI, diarrhea, vaccination, and growth promotionmonitoring
Coverage Prenatal care (%)
Iron and folate supplementation for pregnant women (%)
Pregnant women with a 2nd dose of tetanus toxoid (%)
Infants with DPT3(diphtheria, tetanus, and pertussis), polio3, BCG1(Calmette-Guérin bacilli, for tuberculosis), and measles vaccination (%)
Children under 2 with growth monitoring (%)
Children under 2 with iron supplementation (%)
Administrative-financial Complete ledgers of all expenditures
Inventory system up to date
All personnel hired with formal contracts
Monthly financial and bank statements
Quarterly financial execution reports
Evidence that all public financing used for PBS activities (% budgetexecution)

method of payment is selected, linking someportion of it to key performance indicatorsimproves overall performance.
In health service contracting, the rangeof payment mechanisms available to the pur-chasing organization is wide. These can in-clude global budgets, fee for service, capitation,and combinations of these mechanisms. Eachmust be weighed in terms of the incentives ordisincentives they imply for important criteria such as efficiency, quality, volume, andpotential for fraud.
Payments may be increased for good performance or reduced for poor performance.Including incentives in contract specifications signals to the provider which services, activ-ities, and quality standards are of special interest to the purchaser. There are two types ofincentives that have been commonly applied to health service contracting: performancewithholds and bonuses.
Performance withholds are portions of the contractor’s compensation that are heldback by the public agency and released only upon evidence of success in attaining agreed-upon performance goals. There is substantial evidence that relatively modest withholds (aslittle as 5 percent) can encourage significant improvements in contractor performance.
Bonuses are an additional payment, predetermined in the contract, that are paid to thecontractor upon the successful attainment of specific performance indicators. Similar towithholds, it appears that relatively modest sums can significantly improve contractorperformance.
These methods are not necessarily exclusive of one another. A withhold or a bonus canbe tied to overall performance (quantity and quality of all specified services) or applied toa particular subset of services or indicators.
Developing performance measures and selecting a payment method or methods arenecessary but not sufficient conditions for putting in place a complete performance-basedreimbursement system. The power of such a system is that contractors realize financialgains for performing in ways that optimize the results of the program under contract andfurther the health policy goals of the contracting government organization. For this sys-tem to be effective, a subset of performance indicators must be selected, and weighted,through joint discussions with the contracting organization and the contractor(s).
Second, the specific terms of the incentive have to be negotiated between the two par-ties. The incentive should be significant enough to have an impact on the contractor with-out transferring an unmanageable amount of risk and thereby inhibiting the ability toprovide services. Generally, 5 to 10 percent of costs have been shown to be effective as with-holds or bonuses, particularly in early phases. Over time, the share of payment that is at riskcan increase as each party gains experience in the administration of the contract provisions.
The Guatemalan Experience
The MSPAS developed a per capita financing system to pay NGO contractors. For a givencatchment area (the level at which contracts were provided), these data were derived fromestimating each of the budget items associated with providing services, such as salaries of
Health System Innovations in Central America 29
Box 1.6. Define a Payment System
♦ Choose a payment mechanism (suchas fee for service, case rate, or capita-tion) that creates incentives for effi-ciency and quality.
♦ Define systems of performance-basedreimbursement.

health care staff, equipment, medications, training, and overhead. Based on MSPAS spend-ing ledgers, costs were developed for each service element, aggregated, and divided by thepopulation expected to be served under a contract. This amount totaled US$8 per capitaper year, including in-kind distribution of vaccines. The MSPAS permitted a 10 percentadjustment for higher transportation costs for NGOs working in remote areas.
Echoing the level of distrust that existed between the MSPAS and the NGOs duringthe early years of implementation, DASs of the MSPAS saw this as a very high payment andcommented that the NGOs would become wealthy from the program. Contrarily, NGOsand international agencies providing technical assistance to SIAS suggested that the percapita rate was too low for the services provided. Cost data from the NGOs were never col-lected by the MSPAS to assess the appropriateness of the capitated rate or the NGO claimsof “low-balling.”
Further, as of 2002, the per capita rate applied in 1997 had not adjusted for inflation.The MSPAS’s refusal to adjust the rates resulted in five NGOs to dropping out of SIAS in2000 and 2001. According to the representatives from these NGOs, the MSPAS would notconsider their economic proposal even when they presented actual costs. These weremainly local NGOs without access to international and other sources of financing to fill thefunding gap attributed to below-cost MSPAS payments.28
The development of a capitated approach to a defined population for a specified set ofservices made a good deal of sense as a choice of payment, but there were no offsettingincentives to encourage appropriate provision and use of services. Together with the lowpayments, this may have contributed to NGO provision of only a subset of the PBS and alower than expected population coverage.
To make the payment system work, MSPAS financial managers had to create an entirefinancial flow system to enable the channeling of resources (and corresponding manage-ment and auditing systems) from the MOF to the MSPAS and then to the NGOs. This wasno minor feat, given the highly centralized context of government financial management.The MSPAS was fortunate to participate as a pilot ministry in a general reform processto decentralize government financial management. The overall financial reform effortinvolved29 creation of a financial management unit within the MSPAS that was ultimatelyresponsible for paying providers, establishment of the regulatory framework and corre-sponding procedures to permit MSPAS management of the payment system, creation ofbudgetary line items and a financial reporting system for contracted services, and the set-ting up of an open contract system of pooled procurement and decentralized purchasingand delivery of drugs and medical supplies. This system allowed NGOs to purchase directlyfrom approved suppliers at favorable prices negotiated by the MSPAS.
Payments were made quarterly to NGOs. However, the consistency of payments wasa problem because the MSPAS was often late. Because the ADMSSs and PSSs were depen-dent on these payments to purchase supplies and pay staff, this often resulted in emptypharmacies and limited supplies. To alleviate this problem, a more complex arrangement
30 World Bank Working Paper
28. Applying price competition features to the bidding process could address this situation, but wasrejected by both the MSPAS and NGOs. Price competition is discussed in step 6 in this chapter.
29. It is important to note that most of these items were disbursement conditions included in theInter-American Development Bank’s adjustment loan, providing a strong incentive to the MOF andMSPAS to work together.
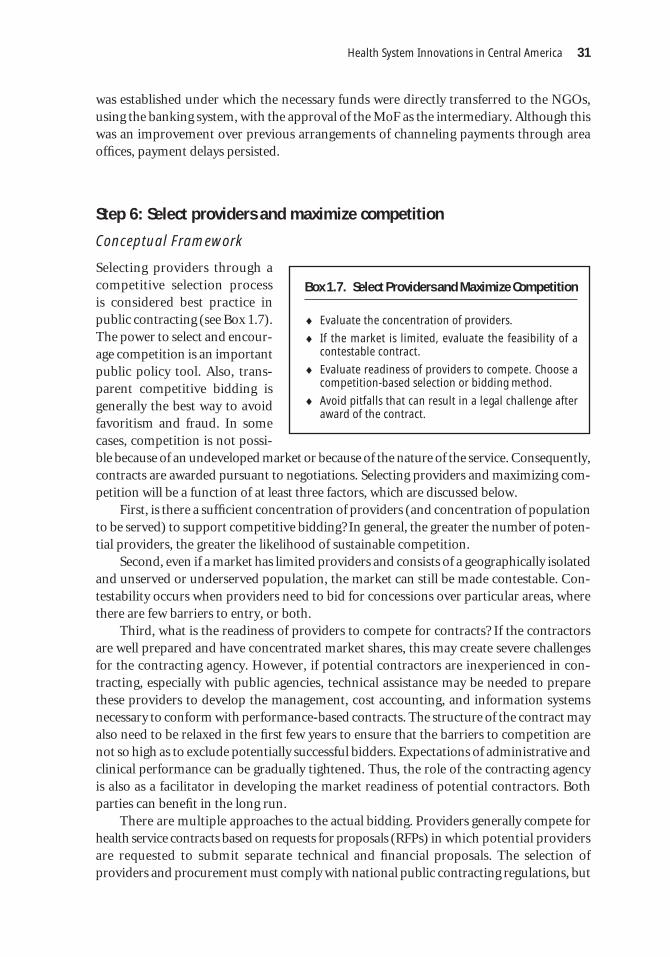
was established under which the necessary funds were directly transferred to the NGOs,using the banking system, with the approval of the MoF as the intermediary. Although thiswas an improvement over previous arrangements of channeling payments through areaoffices, payment delays persisted.
Step 6: Select providers and maximize competition
Conceptual Framework
Selecting providers through acompetitive selection process is considered best practice inpublic contracting (see Box 1.7).The power to select and encour-age competition is an importantpublic policy tool. Also, trans-parent competitive bidding isgenerally the best way to avoidfavoritism and fraud. In somecases, competition is not possi-ble because of an undeveloped market or because of the nature of the service. Consequently,contracts are awarded pursuant to negotiations. Selecting providers and maximizing com-petition will be a function of at least three factors, which are discussed below.
First, is there a sufficient concentration of providers (and concentration of populationto be served) to support competitive bidding? In general, the greater the number of poten-tial providers, the greater the likelihood of sustainable competition.
Second, even if a market has limited providers and consists of a geographically isolatedand unserved or underserved population, the market can still be made contestable. Con-testability occurs when providers need to bid for concessions over particular areas, wherethere are few barriers to entry, or both.
Third, what is the readiness of providers to compete for contracts? If the contractorsare well prepared and have concentrated market shares, this may create severe challengesfor the contracting agency. However, if potential contractors are inexperienced in con-tracting, especially with public agencies, technical assistance may be needed to preparethese providers to develop the management, cost accounting, and information systemsnecessary to conform with performance-based contracts. The structure of the contract mayalso need to be relaxed in the first few years to ensure that the barriers to competition arenot so high as to exclude potentially successful bidders. Expectations of administrative andclinical performance can be gradually tightened. Thus, the role of the contracting agencyis also as a facilitator in developing the market readiness of potential contractors. Bothparties can benefit in the long run.
There are multiple approaches to the actual bidding. Providers generally compete forhealth service contracts based on requests for proposals (RFPs) in which potential providersare requested to submit separate technical and financial proposals. The selection ofproviders and procurement must comply with national public contracting regulations, but
Health System Innovations in Central America 31
Box 1.7. Select Providers and Maximize Competition
♦ Evaluate the concentration of providers.
♦ If the market is limited, evaluate the feasibility of acontestable contract.
♦ Evaluate readiness of providers to compete. Choose acompetition-based selection or bidding method.
♦ Avoid pitfalls that can result in a legal challenge afteraward of the contract.

most public contracting laws in developing countries are oriented toward the purchase ofgoods and works rather than services.
Although specifications and price offers are generally non-negotiable in bidding forstandard goods, RFPs for services generally involve pre- and post-award negotiations onboth technical and price aspects of the winning proposals. This difference in approach isnecessary because of the complexity of defining the services to be provided, the importanceof ensuring quality, and the fact that the contract will create a relationship rather than sig-nify a discrete transaction.
In preparing and conducting the bidding process, public agencies should exercise cau-tion to avoid future litigation or challenges from (losing) bidders. Potential pitfalls includeusing non-neutral consultants in the preparation of bid solicitations, applying service spec-ifications supplied by a particular provider, specifying services and resources that favor aparticular bidder, having informal contacts with bidders, and failing to maintain accurateand complete records of compliance with the procurement process.
If there are multiple bidders who are relatively sophisticated with regard to contractcompliance, then the public purchaser may be able to unilaterally issue a well-specified bidwith terms, measures of performance, and payment mechanisms in the expectation thatthe providers will be able to respond to those terms. If, however, contracting is a relativelynew concept, contracts are of limited dollar value, a monopoly provider dominates themarket, or there are few bidders, then competitive bidding may be difficult to implement.In these cases, services can be procured through negotiation—that is, noncompetitive pro-curement of services.
The Guatemalan Experience
The provider selection process for SIAS underwent a substantial transformation from itsearly days in 1997 to 2002. Among the issues that the MSPAS and SIAS managers had toaddress were who would select providers and what decision criteria would be used in mak-ing the selection.
The initial plan called for a pilot project in three departments that would run for threeyears. Using data that had been gathered by the MSPAS, seven NGOs in the three depart-ments were approached and invited to become the providers of services. Consultantsguided the MSPAS in preparing an initial RFP and evaluation guidelines. Beginning in1997, pilot programs were put in place in Escuintla, Alta Verapaz, and Chiquimula. Theseven selected NGOs also received technical assistance in preparing their proposal. No for-mal assessment of their capacity was performed. All proposals received from the groupswere accepted. Because not every NGO in the departments was included (especially smallerNGOs), there were complaints from some concerning the nontransparency and lack offairness of selection. There was a general perception that the MSPAS was selecting NGOsthat were “friendly” toward the government. Thus, there was no competition amongNGOs in the start-up phase, and there was limited information about NGO quality and ser-vice capability.
Largely as a result of political pressures to show results as well as initial program suc-cess and the large unmet health needs in the country, the GOG made a decision, after onlysix months of operation, to move from a pilot basis to a nationwide program. At this point,in early 1998, the government turned to a process of convening potential NGO contrac-
32 World Bank Working Paper

tors to present the proposed services and jurisdictions to be covered, along with the asso-ciated payments. With the national roll-out came national conferences for a much largergroup of NGOs, in which proposals were developed. By this time, there was considerablymore demand from the NGO community, in part because many of the original fears aboutnonpayment and corruption had been allayed.
The MSPAS continued to apply an open contract or long-list strategy in 1998 and1999, in which any NGO presenting an acceptable proposal and demonstrating a minimaldegree of capacity were contracted. A simple, two-step assessment process was developedin early 1998. The first step consisted in demonstrating at least one year’s experience in ser-vice provision (for a PSS) or project administration (for an ADMSS), legal personality, andfinancial management structure. The second step assessed the NGOs on their capacity toorganize, (financially) manage, and deliver the PBS. Organizational and financial man-agement capacities were the key selection criteria. This second level of review resulted inan overall score for each PSS and ADMSS based on a point system.
Although selection criteria were still ambiguous and led to continuous complaints offavoritism from rejected NGOs, and NGOs were still invited to apply (and selected) in aless than transparent manner, this new, two-step process was a vast improvement over thepreselection process of a year earlier. Many NGOs recognized that the MSPAS was mov-ing toward setting clears rules. The open contract strategy enabled a rapid selection andcontracting process and, therefore, accelerated extension of SIAS coverage.30 Skepticismgave way to eagerness on the part of most of the NGOs to participate in this new program.The number of NGOs wishing to sign agreements grew dramatically as well. Figure 1.1illustrates the rapid growth of contracted NGOs and signed agreements, with 74 NGOssigning 110 agreements in 1998.
The MSPAS continued to improve in the selection process. The MSPAS was sensitiveabout complaints of nontransparency and favoritism, but the market was also becoming
Health System Innovations in Central America 33
30. This strategy did not provide any incentive to the NGOs to exceed the minimal requirements spec-ified by the MSPAS when they were developing their proposals.
Figure 1.1. Growth in NGOs and Contracts, 1997–2002
020406080
100120140160180
1997
1998
1999
2000
2001
2002
No. of NGOs
no. ofContracts
Source: MSPAS/SIAS
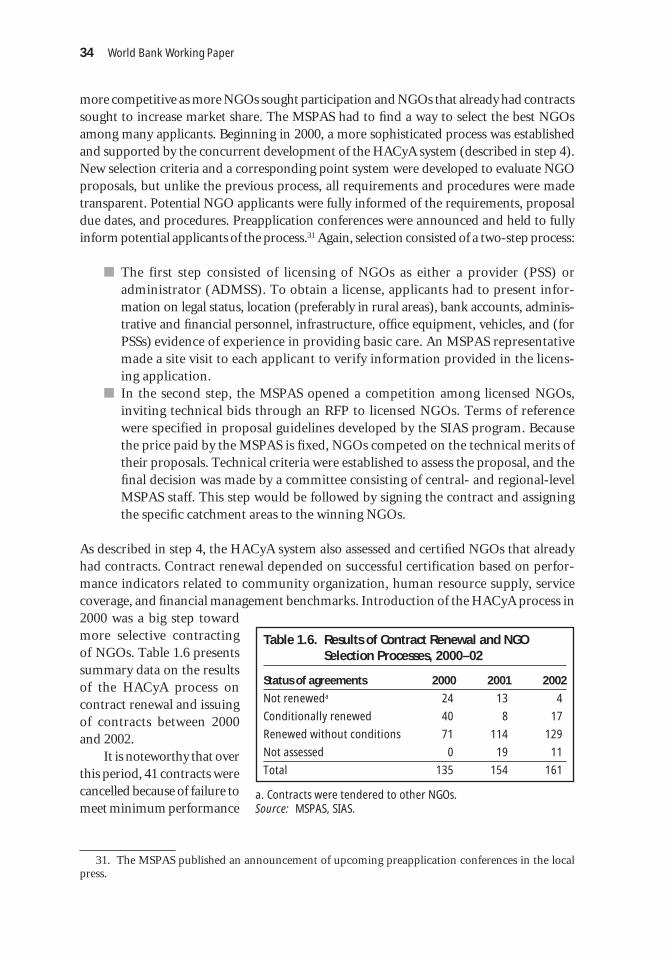
more competitive as more NGOs sought participation and NGOs that already had contractssought to increase market share. The MSPAS had to find a way to select the best NGOsamong many applicants. Beginning in 2000, a more sophisticated process was establishedand supported by the concurrent development of the HACyA system (described in step 4).New selection criteria and a corresponding point system were developed to evaluate NGOproposals, but unlike the previous process, all requirements and procedures were madetransparent. Potential NGO applicants were fully informed of the requirements, proposaldue dates, and procedures. Preapplication conferences were announced and held to fullyinform potential applicants of the process.31 Again, selection consisted of a two-step process:
� The first step consisted of licensing of NGOs as either a provider (PSS) oradministrator (ADMSS). To obtain a license, applicants had to present infor-mation on legal status, location (preferably in rural areas), bank accounts, adminis-trative and financial personnel, infrastructure, office equipment, vehicles, and (forPSSs) evidence of experience in providing basic care. An MSPAS representativemade a site visit to each applicant to verify information provided in the licens-ing application.
� In the second step, the MSPAS opened a competition among licensed NGOs,inviting technical bids through an RFP to licensed NGOs. Terms of referencewere specified in proposal guidelines developed by the SIAS program. Becausethe price paid by the MSPAS is fixed, NGOs competed on the technical merits oftheir proposals. Technical criteria were established to assess the proposal, and thefinal decision was made by a committee consisting of central- and regional-levelMSPAS staff. This step would be followed by signing the contract and assigningthe specific catchment areas to the winning NGOs.
As described in step 4, the HACyA system also assessed and certified NGOs that alreadyhad contracts. Contract renewal depended on successful certification based on perfor-mance indicators related to community organization, human resource supply, servicecoverage, and financial management benchmarks. Introduction of the HACyA process in2000 was a big step towardmore selective contractingof NGOs. Table 1.6 presentssummary data on the resultsof the HACyA process oncontract renewal and issuingof contracts between 2000and 2002.
It is noteworthy that overthis period, 41 contracts werecancelled because of failure tomeet minimum performance
34 World Bank Working Paper
31. The MSPAS published an announcement of upcoming preapplication conferences in the localpress.
Table 1.6. Results of Contract Renewal and NGOSelection Processes, 2000–02
Status of agreements 2000 2001 2002
Not reneweda 24 13 4
Conditionally renewed 40 8 17
Renewed without conditions 71 114 129
Not assessed 0 19 11
Total 135 154 161
a. Contracts were tendered to other NGOs.Source: MSPAS, SIAS.

standards (see Table 1.6). Also, contracts were tendered and later signed with other NGOsapplying a more rigorous, transparent, and apparently competitive selection process. Thecreation of clearer “rules of engagement,” transparency, open communication, and settingof performance standards for issuing and renewal of contracts improved the quality of therequests for proposals and their responses. These factors resulted in a more competitiveenvironment. In fact, by 2001, there were more NGOs seeking agreements with the MSPASthan there was demand.
The government did not implement a full bidding process, as outlined in the frameworksection above. Because the MSPAS fixed the payment, NGOs did not compete on price. ManyNGOs rejected competition and considered it more appropriate for the for-profit sector. Infact, most NGOs would not have participated in SIAS under price competition.
Also, because an NGO had to be licensed for specific municipalities where it had anestablished presence, it was unclear how contestable the contracting process was. The licens-ing process required that each applicant demonstrate a presence in the municipality where itwas seeking to provide services. In effect, the NGOs are licensed for specific municipalities.The extent to which NGOs competed head to head for a specific municipality—or, alter-natively, NGOs located in neighboring municipalities competed for contracts out of theirgeographic jurisdiction—is unknown. However, MSPAS staff who participated in the selec-tion committee claim that for most catchment areas that were bid (because of expansion orcancellation of contract) after 1999, there were at least two candidates. In less remote catch-ment areas, up to eight NGOs applied.
Step 7: Prepare and write the Contract
Conceptual Framework
The final contract is the product of negotiations over the proposal submitted by a particularprovider. If the RFP is well prepared and services are clearly specified, then the contract candraw heavily upon it. Once the type of contract and the process by which it will be developedhave been established, the individual contract components need to be specified. Most termsare placed in three main chapters: respon-sibilities of the contractor, responsibilitiesof the purchaser, and general terms andconditions. Many of the contract compo-nents have been previously mentioned inthis chapter. This section highlights keyprovisions (see Box 1.8).
First, how long will the contract be ineffect? Are there provisions for renewing the contract? Will there be open bidding at the endof the contract period, or can there be a contract extension dependent on good performance?Setting performance standards as a condition for extending the contract can be a strong incen-tive for the contractor to perform well because it can eliminate the need to go through thesometimes arduous contracting process again.
Second, the contract must specify what services will be provided, including frequency,geographic accessibility, and record keeping. The contract should also clearly define the
Health System Innovations in Central America 35
Box 1.8. Prepare and Write the Contract
♦ Decide how much collaboration will beinvolved in development of the contract.
♦ Define contract terms.

population to be served. As discussed in a previous section, it is best that the contract specifythe desired outputs and results, including how, when, and by whom success will be assessed.
Third, the payment section of the contract addresses method and timing. Timing can beregular or paid in discrete sums (for example, quarterly, semiannually, or annually). Manycontractors may not have access to the credit needed to meet expenses on a regular basis if theirpayments come in large discrete sums. This section of the contract also needs to specify if somepayments are linked to performance, and if so, how meeting targets will be verified.
Finally, the contract must define the conditions under which either party can termi-nate the contract as well specify dispute resolutions mechanisms. Contractors need somepredictability in their contracts against unnecessary financial risk, but provisions are alsonecessary for suspending or discontinuing the contract for cause. Such causes can includefailure to perform, fraud, or other forms of corruption.
The Guatemalan Experience
The MSPAS leadership faced an important decision at the outset of the contracting process.Previous to SIAS, there was only one form of contracting, the Public Contracting Law (Leyde Contrataciones del Estado [LCE]), which regulated all commercial contracts. Typical ofcontracting laws elsewhere, the LCE specified standard procurement procedures throughcompetitive bidding, including prequalification of suppliers, bid solicitation, bid evalua-tion, and contractor selection. The MSPAS considered the LCE onerous, more appropri-ate for contracting with for-profit commercial enterprises (to provide services such ascommunications, electricity, construction, and transportation), and inappropriate forsocial services, especially contracted through nonprofit providers. Complying with LCEmandates would involve prohibitively high transaction costs for the NGOs and thereforeseverely limit market supply. For example, most NGOs could not afford LCE mandatesrelated to application fees (estimated at US$9,000) or secure financial guarantees repre-senting 15 percent of contract value.
Applying the LCE provisions would favor for-profit firms that could afford the upfrontfees. Although the extent to which any for-profit firms would be interested in providingbasic care to rural populations is unknown, the MSPAS sought to exclude the for-profitsector from SIAS.32 The LCE also required the contractor to pay taxes on revenues receivedfrom the MSPAS, yet the NGOs possessed nonprofit status.
To enable contracting, the MSPAS had to modify the legal framework as well as cre-ate a contracting instrument that was less burdensome that that specified in the LCE. First,the MSPAS moved to include an article (number 24) in the new Health Law that wasapproved by the Guatemalan Congress in early 1998, permitting the contracting out ofhealth services.33 This was a huge political victory for the MSPAS and essentially provideda green light to scale up the fledgling contracting effort.
36 World Bank Working Paper
32. As mentioned, the MSPAS was very sensitive to criticisms from both inside and outside govern-ment regarding the “privatization” of health care. Authorities also feared that many NGOs would not par-ticipate in a competitive bidding process, particularly if for-profit firms also participated.
33. According to article 24 of the Health Law, “For the purposes of coordinating the provision ofhealth services, the Health Ministry may enter into agreements and contracts with the institutions com-prising the Sector and other institutions related therewith. Likewise, the Sector’s public institutions may,by means of agreements or other legal instruments, enter into service delivery agreements with each otherand with private organizations.”

Second, given the potential bottlenecks, lag times, and lack of flexibility associated withthe LCE combined with the urgency for quickly developing written relationships withNGOs, the MSPAS crafted a new instrument, the convenios, that in effect represented a newregulatory type of contract. Outwardly, the convenio itself appeared similar to the standardcontract. However, through the use of the convenios, the MSPAS sidestepped processes andprocedures relevant to contracting that are specified in the LCE.
This did not go unnoticed. The convenios were challenged in court for being out ofcompliance with the LCE. The MSPAS defended the legality of the instrument, claimingthat it was supported in the 1998 Health Law. A 1999 court decision favored the MSPASposition. Although the legality of the convenios remains an open question, the MSPAS waspermitted to continue applying this instrument. Although they were still in use in 2004,their long-term viability remains to be seen, as did the possibility of challenges by the GOGto convert to the more formal contracts under the LCE.
Table 1.7 compares elements of a stylized contract and contracting process per the LCEwith comparative features of the convenio. The convenio defines the specific services to be cov-
ered, the population (juris-dicción) to be served, and thefinancial amount of the con-tract. The contract also in-cludes sections that addressterms of payment from theMSPAS and conditions forpayment. With the exceptionof features related to com-petitive bidding, posting ofbonds, and performance mea-sures, most of the elementsof a stylized contract wereincorporated into the conve-nio by 2000.
After 2000, especiallywith the onset of the HACyAsystem and as performanceindicators became more inline with overall program ob-jectives, contract terms be-came more explicit. Specificexpectations for results weredeveloped and incorporatedinto contracting. However,as of 2002, the contracts werelacking positive incentivesfor the highest-performingADMSSs and PSSs to receivefinancial remuneration foroutstanding performance.
Health System Innovations in Central America 37
Table 1.7. Comparison of Processes and ProvisionsRelated to an “Ideal” Contract and a Convenio
“Ideal” Contracting and Contract Convenio
Provider selection
Competitive bidding No
Prequalification of providers Yes (after 2000)
Publication: bid notice or call Yes (after 2000)for proposals
Posting of contract performance bond No
Specification clauses (for contractor)
Beneficiaries Yes
Services By service category
Personnel Yes (after 2000)
Performance requirements Partly (after 2000)
Incentives No
Reporting requirements Yes
Responsibilities of the MSPAS
Payment and payment procedures Yes
Performance review procedures Yes (after 2000)
Monitoring procedures Yes, but not specific
Provisions for contract change
Dispute resolution Yes
Unanticipated work or events Yes
Provision for contract duration Yes
Provisions for contract noncompliance Yes
Provisions for contract termination Yes
Authorized signatures Yes
Source: Adapted from Nieves and LaForgia (2000, p. 6, table 1).

Rather, performance indicators were used to exclude, renew, or add new ADMSSs and PSSs.
An important test of the durability of these convenios occurred in 2000, when there wasa leadership change in government. Normally, in Guatemala during a regime change, itwould not be uncommon for existing contracts to be nullified, and the convenios’ ambigu-ous status made that possibility more probable. However, despite a complete turnover inleadership, all the convenios remained intact and the system continues to be refined.
Finally, the SIAS program coordinator, with central MSPAS staff, developed the con-tract. Involvement with potential contractors remained minimal because the expertise toprioritize and cost out services was seen as a capability that existed among the MSPAS andsupporting technical experts.
Step 8: Monitoring compliance and evaluating contract performance
The Conceptual Framework
The decision to contract involves both a new set of operational capabilities and a philo-sophical shift (see Box 1.9). Instead of micromanaging the direct delivery of services (as iscommon in the ministries of health of many developing countries), the contracting agencyis managing through attention to results. This leaves significant discretion to the contrac-tor(s) in deciding how best to achieve these results.
With this new perspective comes a need for new kinds of analysis. Instead of analyz-ing the best way to produce services, the contracting agency has to be able to analyze themarket, evaluate potential contractors, and monitor contract compliance and perfor-mance. Within the overall contract management function, there needs to be the capabilityto monitor results, deploy on-the-ground evaluation teams, and develop protocols foridentifying early warning signs of contract noncompliance, including necessary correctiveactions.
Also, prompt, accurate payment to contractors is essential for the function to be cred-ible and sustainable. A separate fiduciary entity, either within the contracting departmentor through a third party, needsto track contract costs and payments for each and everycontract and work closely withthose monitoring contract com-pliance to ensure that paymentslinked to performance are madeappropriately.
How the contract will ulti-mately be managed depends onthe information that comesfrom monitoring the contract,responses to poor performance,and the internal capabilities thatthe contracting organization
38 World Bank Working Paper
Box 1.9. Monitor Compliance and Evaluate Contract Performance
♦ Make payments to the contractor in a timely manner,as specified in the contract.
♦ Reward excellent performance. Establish formal moni-toring systems.
♦ Communicate regularly with the contractor to solveproblems early and maintain rapport.
♦ Develop an agreed-upon progression of managementactivities to address inadequate performance.
♦ Develop a contracting organization.
♦ Evaluate performance.

must possess or acquire to be successful. Some combination of the following monitoringinstruments can be applied: (a) application of tracking tools to monitor progress andschedules, (b) a reporting and information system to monitor technical performance andcosts, (c) periodic independent assessments to assess specific performance components(such as client satisfaction surveys), (d) on-site inspections, (e) client complaint reportingand management system, and (f) purchaser-contractor monitoring conferences.
It follows that effective contract oversight requires effective reporting and informationsystems that integrate inputs drawn from application of the above instruments. Some formof internal information system is critical to track contracts: their duration, budget, perfor-mance measures, payment system, and payment schedule. This is an area in which techni-cal assistance or the sharing of best practices from other contracting organizations can beessential to avoid unnecessary duplication of efforts.
Finally, managing a contract when the contractor is performing inadequately is not anall-or-nothing activity. Rather, the purchaser needs to be proactive. The purchaser needsto identify risks of noncompliance with performance targets early on to collaborate in solv-ing problems when possible. Only when this fails should the purchaser move toward apply-ing the sanctions set out in the contract or, ultimately, terminate the contract if there issufficient cause. The consequences in each case should be spelled out as clearly as possiblein the contract itself. In cases where there are relatively few contractors, the contractingagency may prefer to work more closely with the provider, giving targeted technical assis-tance. Alternatively, the contracting agency may organize opportunities for similar con-tractors to share experiences and learn from each other’s best practices.
The Guatemalan Experience
Monitoring and evaluating contract compliance has been a challenge to SIAS since itsonset. During the early years, monitoring was sporadic at best. Fearing charges of corrup-tion, initially at least, oversight focused on financial reporting and tracking of use of fundsby NGO contractors. For this purpose, in 1998, a financial management unit was estab-lished inside the MSPAS and financial officers were hired for each district where NGO con-tractors were providing services. The unit developed clear guidelines (with manuals andcorresponding forms) for financial reporting requirements, trained NGO administrativepersonnel, and conducted site visits. Although site visits were irregular because of a smallnumber of staff available, the only aspect of the overall monitoring system that workedconsistently was financial oversight.
The NGOs also had a strong incentive to comply with financial-reporting mandatesbecause these made up the criterion was linked to future payments. For example, ADMSSsand PSSs had to submit quarterly financial reports and provide evidence that at least 75 per-cent of the previous transfer payment had been spent before they could receive another allo-cation. Compliance was high, though some NGOs were denied payments because of delaysin submitting the financial reports or because of inconsistencies in the information reported.In all cases, these inconsistencies were due to neglect and low capacity rather than fraud.
Monitoring of service delivery and coverage was much less developed, particularlyearly on. Monitoring was originally delegated to the district level. Specifically, an area facil-itator (facilitador del área), who in theory reported to the DAS, was responsible for the ongo-ing monitoring of ADMSSs and PSSs. In the beginning, the facilitators used primarily
Health System Innovations in Central America 39

process measures from the medical guidelines in their assessment. They had the authority tohighlight problem areas and, in the most extreme cases, recommend contract cancellation.
The facilitators were inconsistent in their monitoring responsibilities, and the facilitator-based system—as well as the position of facilitator—were gradually eliminated. AlthoughMSPAS area and district officials were responsible for monitoring the NGOs, the facilita-tors tended to be more responsive to the central MSPAS. At the same time, they were toserve as consultants to the NGOs to help them improve the quality of services they pro-vided. In reality, these roles proved to be in conflict, and resulted in weak monitoring ofthe NGOs. Although “on paper” facilitators did have the authority to progressively mon-itor performance (up to recommending that a contract be terminated), it is not clear howwell defined the steps in this process were. Also, all facilitators were physicians and focusedtheir efforts on supporting the NGOs with medical care delivery; most were uninterestedin administrative aspects of the monitoring process. Another weak link in the monitoringprocess was the low capacity of district and area officials to consolidate and analyze themonthly and quarterly statements sent by the PSSs and ADMSSs.34 In sum, monitoring wasmore informal than systematic. From 1997 to 1999, the monitoring system resulted in lit-tle knowledge of real population coverage of PBS activities delivered by the NGOs. TheMSPAS was informed by the facilitators that few NGOs were delivering the entire PBS, butit did not have the data to determine the extent of the situation.
With the implementation of the HACyA process for contract renewal in 2000(described in step 4), the certification process became the main feature of the monitoringsystem. NGO contractors had to supply the MSPAS with reports on technical performanceand resource allocation and use (see Table 1.5). Conducted annually, the assessments con-sisted of a review of data provided by the NGOs and site visits by certification teams. A setof indicators was defined for both technical and financial management aspects, and eachset was scored on a 100-point scale. If the total average (unweighted) score fell below 40for either set of indicators, the contract was not renewed. For NGOs receiving a scorebetween 40 and 79, a conditional renewal was granted in which the MSPAS indicated spe-cific areas of improvement as stipulated in a letter of understanding. The NGOs were givenone year to address the issues raised by the MSPAS. Failure to do so would mean automaticcancellation of the contract.
To support the monitoring and recertification process, the MSPAS created a moni-toring unit to consolidate and analyze HACyA-mandated data on an annual basis. In aneffort to incorporate data from both public and contracted programs by district, a situa-tion room (sala de situación) was also established in each district in 2000. The situationroom was essentially an informal process that depended on the commitment of MSPASdistrict authorities. They were intended as coordinating points for data collection of bothpublicly and NGO-administered health systems, with the goal of creating a network ofbasic statistical data for an entire district. However, as of the most recent internal programevaluation, the effectiveness of this effort had not been established.
Problems continued in the timeliness of payment, despite the intervention of MoF anddirect bank transfers to the NGOs. This caused frequent, if intermittent, operating prob-
40 World Bank Working Paper
34. The monitoring system was ad hoc and caused documentation burdens for district officials. NGOswere mandated to supply, monthly or quarterly, at least eight separate forms on service production, mor-tality, activities, and financial management.

lems for the contractors, and limited availability of medicines, supplies, and equipment atcertain times during the year.
A contracting organization continues to be under development. Strong capacityexisted at the program coordinator level to develop such an organization, but more staffare required to fully implement contract management and monitoring functions. The areaof contracting infrastructure—including market analysis, financial management, andinformation technology—continued to require development. Capacity at the district level,where decisions concerning provider selection and retention were increasingly made, wasmore uneven.
Step 9: Encouraging competition in the long term
The Conceptual Framework
A well-designed contract and corre-sponding monitoring system will notnecessarily lead to continuing bene-fits and savings (see Box 1.10). Com-petition is another key element forthe long-term success of contracting.Costs shift, new suppliers may enterthe market while others leave, andnew technologies may become avail-able. The purchasing organizationshould continuously explore the mar-ket environment for these changes.Competition drives contractors tosearch for better ways to improvequality, increase client satisfaction,and lower costs.
Stimulating a competitive contracting process is no easy task—maintaining it can beeven more challenging. Supplier unavailability, transitional difficulties resulting fromswitching suppliers, service interruption, corruption, and supplier inertia can inhibit thefunctioning of the competitive contracting process. Table 1.8 presents recommended solu-tions to these obstacles to ensuring competition.
Purchasing agencies should regularly assess the state of the competitive environment.This can be accomplished through two measures. The first is a performance review inwhich a single contractor’s performance is compared with others. The second is a biddingtest. Rebidding contracts from time to time provides reliable feedback on whether the pur-chasing agency is paying the best price and provides information on the number of poten-tial suppliers in the market.
The Guatemalan Experience
SIAS’s progressive movement from early 1997, when there was reluctance and skepticismabout contracting with the government, to 2002, when NGOs were clamoring for partici-
Health System Innovations in Central America 41
Box 1.10. Encourage Competition in the Long Term
♦ Create incentives to organize the supply side ofservices in the NGO and private sectors.
♦ In isolated markets, consider the creation of con-testable units of care provision.
♦ Anticipate transitional difficulties.
♦ Establish contingency plans to reduce the lengthof service interruptions. Reduce the risk of cor-ruption and fraud.
♦ Establish formal policies for contracting.
♦ Prevent contractor inertia or fatigue.
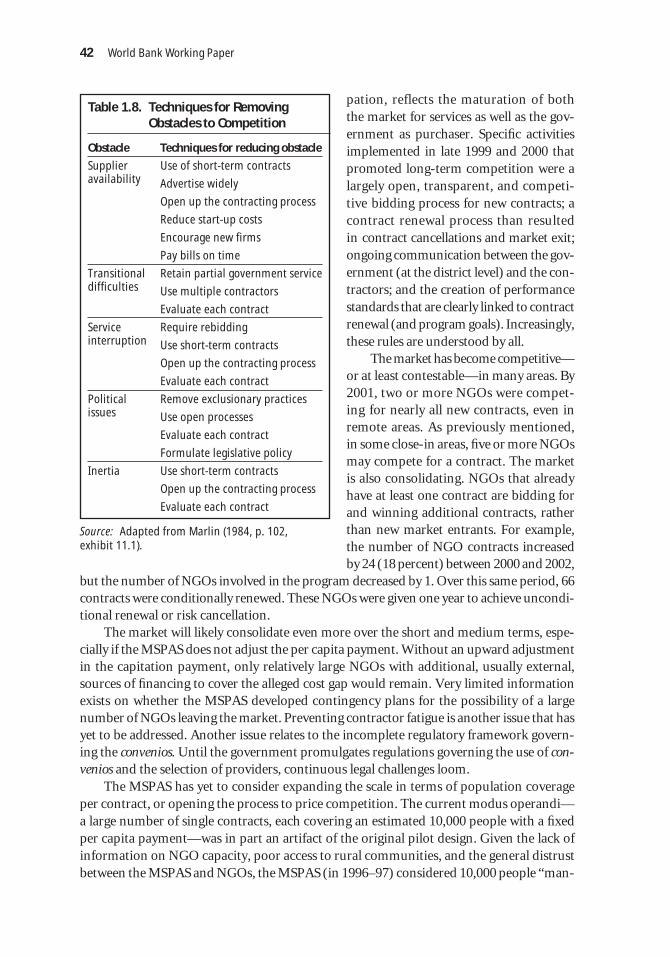
pation, reflects the maturation of boththe market for services as well as the gov-ernment as purchaser. Specific activitiesimplemented in late 1999 and 2000 thatpromoted long-term competition were alargely open, transparent, and competi-tive bidding process for new contracts; acontract renewal process than resultedin contract cancellations and market exit;ongoing communication between the gov-ernment (at the district level) and the con-tractors; and the creation of performancestandards that are clearly linked to contractrenewal (and program goals). Increasingly,these rules are understood by all.
The market has become competitive—or at least contestable—in many areas. By2001, two or more NGOs were compet-ing for nearly all new contracts, even inremote areas. As previously mentioned,in some close-in areas, five or more NGOsmay compete for a contract. The marketis also consolidating. NGOs that alreadyhave at least one contract are bidding forand winning additional contracts, ratherthan new market entrants. For example,the number of NGO contracts increasedby 24 (18 percent) between 2000 and 2002,
but the number of NGOs involved in the program decreased by 1. Over this same period, 66contracts were conditionally renewed. These NGOs were given one year to achieve uncondi-tional renewal or risk cancellation.
The market will likely consolidate even more over the short and medium terms, espe-cially if the MSPAS does not adjust the per capita payment. Without an upward adjustmentin the capitation payment, only relatively large NGOs with additional, usually external,sources of financing to cover the alleged cost gap would remain. Very limited informationexists on whether the MSPAS developed contingency plans for the possibility of a largenumber of NGOs leaving the market. Preventing contractor fatigue is another issue that hasyet to be addressed. Another issue relates to the incomplete regulatory framework govern-ing the convenios. Until the government promulgates regulations governing the use of con-venios and the selection of providers, continuous legal challenges loom.
The MSPAS has yet to consider expanding the scale in terms of population coverageper contract, or opening the process to price competition. The current modus operandi—a large number of single contracts, each covering an estimated 10,000 people with a fixedper capita payment—was in part an artifact of the original pilot design. Given the lack ofinformation on NGO capacity, poor access to rural communities, and the general distrustbetween the MSPAS and NGOs, the MSPAS (in 1996–97) considered 10,000 people “man-
42 World Bank Working Paper
Table 1.8. Techniques for RemovingObstacles to Competition
Obstacle Techniques for reducing obstacle
Supplier Use of short-term contractsavailability Advertise widely
Open up the contracting process
Reduce start-up costs
Encourage new firms
Pay bills on time
Transitional Retain partial government servicedifficulties Use multiple contractors
Evaluate each contract
Service Require rebiddinginterruption Use short-term contracts
Open up the contracting process
Evaluate each contract
Political Remove exclusionary practicesissues Use open processes
Evaluate each contract
Formulate legislative policy
Inertia Use short-term contracts
Open up the contracting process
Evaluate each contract
Source: Adapted from Marlin (1984, p. 102, exhibit 11.1).

ageable” for most NGOs. The catchment area of 10,000 residents remains an arbitrarybenchmark. Although by 2002, most providers already served significantly more people,35
the MSPAS prefers to award multiple contracts to a single provider rather than increasecontract scale. For example, in 2002, several NGOs had been awarded three or four con-tracts. Increasing scale is a politically sensitive issue. MSPAS officials express concern thatcontracts covering a larger number of people would favor larger NGOs with internationalaffiliates and would be detrimental to cultivating a national market. Finally, MSPAS offi-cials suggest that most NGOs would reject price competition and claim that few have infor-mation on costs to develop a price proposal. However, as mentioned above, NGOs arealready competing for new contracts, albeit for an MSPAS-fixed price. Apparently, MSPASauthorities have been reluctant to consider price competition, fearing that it may result insignificantly higher capitation rates that the MSPAS can ill afford to finance.
Conclusion and Lessons Learned
Contracting goes beyond a simple relationship between a purchaser (in this case, a gov-ernment agency) and a provider. In theory, if done strategically as a means of improvingthe quality, access, or both of services to the population, it can ultimately transform themarket for services, creating greater efficiency and rationality in the distribution ofresources and services. Where a sophisticated market is not present, legal and regulatoryframeworks are ambiguous, and contract management and monitoring capacity arenonexistent, accomplishing these goals will take time. These were the conditions underwhich Guatemala boldly launched a large-scale contracting-out effort.
More specifically, when the MSPAS began its contracting program for basic servicesin rural areas, it faced a plethora of obstacles. First, contracting for health services was anuntried process in a system that previously did only direct provision of care. Second, muchof the regulatory framework to support this type of contracting was absent, and a newmodel, the convenio, was created to offer a contract that was timelier and better adapted tothe needs of both the purchaser and the contractor. Third, a large number of health NGOsalready existed in Guatemala, and many worked in rural areas, but the MSPAS was un-familiar with the market, particularly their willingness and capacity to supply the healthservices specified by the MSPAS. Fourth, there was resistance from MSPAS staff and healthworker unions who favored inhouse provision. Fifth, there was estrangement between thegovernment and the NGOs, who were initially suspicious of working with the government.Finally, there was significant distrust of government intentions from the indigenouspeople whom the program largely served.
Recognizing these unfavorable conditions, the original design called for a small pilotproject. Scaling up would occur during a subsequent phase based on the results of aplanned evaluation. However, what began as a small-scale contracting initiative in 1997,with three departments and seven NGOs, rapidly ballooned into a large-scale contractingeffort in 1998—before learning, program modifications, and other early course correctionscould be incorporated. With elections due in late 1999, there was little time or concern for
Health System Innovations in Central America 43
35. For example, a provider survey found that PSSs served an average of 19,400 people (N = 21) inthree departments (provinces), and the ADMSSs served an average of 12,500 (N = 12) (see Danel and LaForgia in this volume).

following best practices in contracting out health services. Driven by political necessitiesrelated to compliance with the Peace Accords and their implications for the political cycle,an often ad hoc process was initiated in which many shortcuts were taken to rapidlyimplement the large-scale effort. Nevertheless, a case can be made that if the MSPAS hadfollowed a more stringent and methodological process of first establishing all the institu-tional conditions supporting the purchasing function and setting up and evaluating smalldemonstration projects, as originally planned in the PMSS pilot, the change of governmentin 2000 might have thwarted the scaling-up process. In the wisdom of hindsight, by 1999,the contracting-out experience had created sufficient momentum, scope, and buy-in byNGOs and donors that the newly elected government (in 2000) had little choice but to sup-port the program.36
Contracting has yielded benefits even though capacity was weak and only under devel-opment. First, a basic package of services for women, infants, and children was developed,based on epidemiological information and targeted particularly toward the poor, ruralpopulation. This was in itself a major accomplishment. Second, as discussed in the com-panion chapter in this volume, services were extended to unserved and underserved pop-ulations, though not to the full extent anticipated. Third, an initially unsophisticatedsystem of contracting and provider selection (for example, the MSPAS’s major and directinvolvement in selection of the initial seven NGOs for the pilot) evolved into a more trans-parent, performance-oriented, and decentralized system of decision making for new andexisting contracts that appears to have been largely successful. Finally, the program demon-strated that at a tumultuous time in the country’s political and social history, a public-private partnership could be forged that would address serious unmet needs for many poorGuatemalans.
As reported in the companion chapter in this volume, the contract-based models per-formed as well as—and often better than—traditional providers (health posts) in terms ofsuch performance measures as population coverage, patient satisfaction, production, pro-ductivity, and coverage for immunizations, prenatal care, and use of ORS. However, thecontracting models, particularly direct contracting, displayed significantly higher unitcosts. How the process of contracting described here affected performance is a difficult call.In general, the design was successful in meeting program objectives: basic care coveragewas extended in a relatively short period (four years) to a large number of distant and dis-persed communities that previously had no or little access to care. However, productionand coverage rates for priority PBS interventions such as immunizations, prenatal care,growth monitoring, ARI care, and use of ORS in the home were lower than anticipated formost NGO (and traditional) providers (but probably higher than before the program’sonset). Providers were inconsistent in delivering the full package of PBS interventions,often emphasizing vaccinations while failing to regularly provide other priority PBS inter-ventions. Greater specification of these priority services in the contract, together with per-formance indicators as well as more vigorous monitoring by the MSPAS, could havecontributed to standardization of services according to MSPAS priorities as well as highercoverage rates for these services. Also, some NGOs claimed that the per capita paymentswere insufficient to cover the full costs of the PBS coverage, which led them to restrict ser-
44 World Bank Working Paper
36. The new government originally criticized the PMSS, suggesting that it would withdraw support.

vice. Failure to conduct a baseline survey to gather health and utilization data handicappedthe capacity of the MSPAS to monitor, evaluate, and compare provider performance.
Turning to the elements of the contracting framework (see box I.1), two distinctphases can be discerned: (1) a developmental, trial-and-error phase between from 1997through 1999 and (2) a phase of correction and consolidation phase between from 2000through 2002.37 Table 1.9 presents a scorecard rating MSPAS performance on each of thesteps of the framework.
37. This second phase had more to do with the maturation of the contracting process than with thechange of government.
Health System Innovations in Central America 45
Table 1.9. Rating of Guatemalan Contracting Experience According to the Conceptual Framework
Steps in the contracting framework 1997–99 2000–02
1. Assess feasibility Moderate N/A
2. Gain political and institutional support Moderate High
3. Define service specifications Low Moderate
4. Select performance measures Low High
5. Define payment methods Moderate Moderate
6. Select providers, maximize competition Low Moderate
7. Negotiate and write the contract High High
8. Monitor and evaluate the contract Low Moderate
9. Encourage competition Low Moderate
N/A not available.
The MSPAS receives good marks for garnering political and institutional support forthe contracting effort and mitigating the effects of health workers’ resistance. It also quicklyrecognized and filled the gaps in the legal and regulatory framework, preparing and ush-ering through Congress a new Health Law that permitted the contracting out of services.The development of robust financial payment, management, and oversight systems toenable the government to budget funds, make payments, and track financial flows wasanother factor enabling implementation and expansion. There has been no evidence ofcorruption or diversion of funds by the NGOs or the MSPAS.
The major challenge in the Guatemalan experience was related to the rapid move fromsmall to large scale. The expansion stressed the still developing contracting capabilities ofSIAS and required prompt and, in some cases, improvisational response. It limited the abil-ity to institutionalize the contracting process or allow for adequate learning by NGOs, localdistricts, and the contracting arm itself.
During the early phase of the PMSS, a number of shortcomings became evident in thefledgling contracting process. Before the decision to scale up, little work was done in assess-ing the NGO market or consulting with them on program design. Although the MSPASdeveloped and costed out the PBS, the costing model was based on MSPAS rather thanNGO costs. The “one size fits all” package of services was probably inappropriate for the

diverse health conditions evident in Guatemala, and it did not account for the many yearsof experience of a number of health NGOs in rural areas. The lack of clear performanceindicators linked to program goals resulted in confusion over what was expected and con-tributed to problems of PSSs and ADMSSs providing the full range of services. There wasno baseline against which to evaluate the performance of PSSs and ADMSSs. The non-transparent selection of NGOs created early doubts about the intentions of the governmentamong the NGO community and the noncompetitive, open contracting process resultedin the selection of several poorly qualified NGOs. Early efforts to monitor compliancefocused on micromanaging process efforts in the organization and delivery of care thatoften had little to do with the outputs or results desired.
By 1999, ambition was giving way to reality. MSPAS staff realized that many mis-takes were being made as a result of the ad hoc nature of decision making and dealingwith problems. The PMSS started to put in place a number of changes that improved thecontracting process in several critical areas: a shift to an open, transparent, and compet-itive selection process; the development of meaningful performance indicators (linkedto desired epidemiological outcomes) that become points of accountability in evaluat-ing new contracts or renewal of existing contracts; development of the contract man-agement function inside the MSPAS; and systematic performance monitoring. Althoughthe PMSS was originally implemented without competition, competition was graduallybrought into contacting process.
Shortcomings remain. Failure to make adjustments in the per capita payment hasalready resulted in market exit of two qualified NGOs. In-depth analysis of NGO costs isneeded to create a standardized cost structure that is more in line with actual costs. Sys-tematic evaluation of performance has yet to be built into the program. The PBS requiresassessment to determine the effectiveness of the defined interventions.
The capacity to learn and to adapt is one of the important lessons from the Guatemalanexperience. Failing to abide by all best contracting practices is not a determinant of failure.The ability to learn from the mistakes and build upon strengths appears to be the key deter-minant of success.
Bibliography
Abramson, Wendy. 1999. “Partnerships between the Public Sector and Non-governmentalOrganizations: Contracting for Primary Health Care Services.” Abt Associates Inc.,Bethesda, Md., financed by the U.S. Agency for International Development.
Annis, Sheldon. 1981. “Physical Access and Utilization of Health Services in RuralGuatemala.” Social Science and Medicine 15(4):515–23.
Bennett, Sara. 1997. “Private Health Care and Public Policy Objectives.” In C. Colclough,ed., Marketizing Education and Health in Developing Countries: Miracle or Mirage?Oxford: Clarenden Press.
Bennett, Sara, and Anne Mills. 1998. “Government Capacity to Contract: Health SectorExperience and Lessons.” Public Administrative and Development 18:307–26.
Brushan, Indu, Sherryl Keller, and Brad Schwartz. 2002. “Achieving the Twin Objectivesof Efficiency and Equity: Contracting Health Services in Cambodia.” ERD Policy Brief 6.Asian Development Bank, Economic and Research Department, Manila.
46 World Bank Working Paper

Cercone, James, and Magdalene Rosenmöller. 2000. “Costa Rica—a New Hospital forHeredia—a Public-Private Partnership for Health Care.” In Magdalene Rosenmöller,ed., Challenges of Health Reform. Barcelona: IESE Business School, University ofNavarra.
Cominsky, Sheila. 1987. “Women and Health Care on a Guatemalan Plantation.” SocialScience and Medicine. 25(10):1163–73.
Deman, Hedi. 2000. “Informe final de la coordinadora del subprograma III: Ampliación yreorientación de los servicios de salud programa mejoramiento.” MSPAS, GuatemalaCity.
Domberger, Simon. 1998. The Contracting Organization—a Strategic Guide to Outsourc-ing. New York: Oxford University Press.
Eichler, R., P. Auxila, and J. Pollock. 2001. “Performance-Based Payment to Improve theImpact of Health Services: Evidence from Haiti.” The Manager 10(2). Available athttp://www1.worldbank.org/hnp/hsd/Contracting.asp (accessed November 2004).
Gestión y Tecnología en Salud y Desarrollo. (GETSA), S.A. 2001. Estudio de caso: El pro-ceso de contratación a gran escala para la prestación de servicios básicos de salud: La expe-riencia de Guatemala. Consultant’s report, Guatemala.City.
Gilson, Lucy, Priti Dave Sen, Shirin Mohammed, and Phare Mujinja. 1994. “The Potentialof Health Sector Non-governmental Organizations: Policy Options.” Health Policy andPlanning 9(1):14–24.
Goldman, Noreen, and Anne Pebley. 1994. “Childhood Immunization and Pregnancy-Related Services in Guatemala.” Health Transition Review 4(1):29–44.
Gwatkin, Davidson R., Shea Rustein, Kiersten Johnson, Rohini P. Pande, and Adam Wagstaff.2000. “Socio-Economic Differences in Health, Nutrition, and Population in Guatemala.”HNP-Poverty Thematic Group of the World Bank. Washington, D.C. Processed.
Instituto Nacional de Estadística (INE). 1999. Guatemala—Encuesta Nacional de SaludMaterno Infantil 1998/99. Guatemala City.
Loevinsohn, Benjamin. 2002. “Contracting for the Delivery of Primary Care in Cambodia:Design and Initial Experience from a Pilot Test.” World Bank, Washington, D.C.Available at http://www1.worldbank.org/hnp/hsd/Contracting.asp (accessed November2004).
Marek, Tonia, Issakha Diallo, Biram Ndiaye, and Jean Rakotosalama. 1999. “SuccessfulContracting of Prevention Services: Fighting Malnutrition in Senegal and Madagas-car.” Health Policy and Planning. World Bank, Washington, D.C.
Marlin, John Tepper. 1984. Contracting Municipal Services—a Guide for Purchase from thePrivate Sector. New York: John Wiley & Sons.
McPake, Barbara, and Elias E. Nglande Banda. 1994. “Contracting out of Health Servicesin Developing Countries.” Health Policy and Planning 9(1):25–30.
Mills, Anne. 1998. “To Contract or Not to Contract? Issues for Low- and Middle-IncomeCountries.” Health Policy and Planning 13(1):32–40.
Mills, Anne, and Jonathan Broomberg. 1998. “Experiences of Contracting: An Overviewof the Literature.” Macroeconomics, Health and Development Series, Technical Paper33. World Health Organization, Geneva.
Mills, Anne, Natasha Palmer, Lucy Gilson, Di McIntyre, Helen Schneider, Edina Sinanovic,and Haroon Wadee. 2004. “The Performance of Different Models of Primary CareProvision in Southern Africa.” Social Science and Medicine 99:931–43.
Health System Innovations in Central America 47
Mintz, Patricia, Gerard Martin La Forgia, and William Savedoff. 2001. “Contracting HealthServices: Getting from Here to There.” World Bank, Washington, D.C.
MSPAS. 1998. Guia para la formulación de propuestas para la prestación y administraciónde servicios básicos de salud. Guatemala.City.
———. 2000. Habilitación, adjudicación, certificación y acreditación. Guatemala City.Nieves, Isabel, and Gerard Martin La Forgia. 2000. “Guatemala—Large-Scale Government
Contracting of NGOs to Extend Basic Health Services to Poor Populations inGuatemala—a Public-Private Partnership for Health Care.” In Magdalene Rosen-möller, ed., Challenges of Health Reform. Barcelona: IESE Business School, Universityof Navarra.
Pan American Health Organization. 1999. Epidemiological Bulletin—Guatemala City. 12(3).Available at http://www.paho.org/English/SHA/prflgut.htm (accessed October 2003).
Pebley, Anne R., and Noreen Goldman. 1992. “Family, Community, Ethnic Identity andthe Use of Formal Health Care Services in Guatemala.” Office of Population ResearchWorking Paper 92-12. World Bank, Washington, D.C.
Rosen, James E. 2000. “Contracting for Reproductive Health Care—a Guide.” HNP-Population and Reproductive Health Working Group, World Bank, Washington, D.C.
Shulman, Martha A. 1982. “Alternative Approaches for Delivering Public Services.” UrbanData Reports. International City Management Association, Washington, D.C.
Souters, R., and F. Griffiths. 2003. “Improving Government Health Services through Con-tract Management: A Case from Cambodia.” Health Policy and Planning 18(1):74–83.
Taylor, Robert F. 2003. “Contracting for Health Services.” In Private Participation in HealthServices. Washington, D.C.: World Bank.
Vining, Aidan, and Steven Globerman. 1999. “Contracting-out Health Care Services: A Conceptual Framework.” Health Policy and Planning 46:77–96.
World Bank. 1994. “Brazil: The Organization, Delivery, and Financing of Health Care inBrazil: Agenda for the 90s.” Report 12655-BR. World Bank, Washington, D.C.
———. 2003. “Making Services Work for Poor People.” In World Development Report2004. Washington, D.C.: World Bank.
48 World Bank Working Paper

38. This chapter is based on field research conducted in 2001. It draws on field research and statisticalanalyses commissioned to GETSA (Gestión y Tecnología en Salud y Desarrollo), S.A. A companion chapterby La Forgia, Mintz, and Cerezo in this volume examines the contracting-out process in Guatemala.
CHAPTER 2
49
Contracting for Basic Health Care in Rural Guatemala—
Comparison of the Performanceof Three Delivery Models38
Isabella Danel and Gerard La Forgia
Abstract
Beginning in 1997, the government of Guatemala extended coverage of a pack-age of basic health services to 3 million people living in rural, impoverished, andprimarily indigenous communities through three different delivery models: con-tracting of nongovernmental organizations (NGOs) to directly provide services(direct model), contracting of NGOs to act as financial managers for the Minis-terio de Salud y Assistencia (Ministry of Health and Social Protection [MSPAS])health service providers (mixed model), and strengthening of health postsoperated by the MSPAS (traditional model). This chapter presents the resultsof household and provider surveys carried out in 2001. The household surveyfound that women and children in catchment areas served by the mixed modelhad significantly better results for many key health indicators when comparedto the traditional model. Results for those served by the direct model were sim-ilar to the traditional model although these communities had only recently begunto receive services and were located much farther from health facilities. Userstended to report greater satisfaction with the new models. The provider surveyfound that the NGO-based models are generally more productive than the tradi-tional model; however, they are more costly, and results on economic efficiencywere mixed. We conclude that mixed and direct provider models are good alter-natives to traditional health services for providing basic services in Guatemala.Contracting basic health care may be an effective strategy to reduce healthinequities in other country contexts where access to health services is inadequate.
Introduction
Governments in developing countries are seeking ways to deliver health services effectivelyand efficiently to populations whose current access to health care is inadequate. There is agrowing body of experience in developing countries with contracting a variety of health ser-vices through nongovernmental organizations (NGOs) that suggests it may be an alternativefor improving health outcomes (Bhushan, Keller, and Schwartz 2002; Eichler, Auxila, andPollock 2001; Marek and others 1999; Palmer 2000; Slack and Savedoff 2001). NGOs havebeen contracted to deliver an array of health services including nutrition services, HIV/AIDSservices, and primary health care. However, evidence showing improved performance ofthese alternative models in delivering primary health care services is still weak. Only a lim-ited number of studies have examined the impact and performance of contracting NGOs todeliver primary health care. Studies from Cambodia and Haiti demonstrated improvementsin some key health indicators particularly immunization rates. (Bhushan, Keller, andSchwartz 2002; Eichler, Auxila, and Pollock 2001). Studies comparing NGOs and publicproviders of primary care show that the former are generally more productive and the resultson efficiency are mixed (Bitrán 1995; Levin and others 1999; Lavadenz 2001; Bhushan, Keller,and Schwartz 2002).
In 1997, following the signing of Peace Accords ending decades of civil war, the govern-ment of Guatemala considered options for rapidly scaling up health services in rural, impov-erished, primarily ethnic communities. It decided that contracting NGOs to deliver primaryhealth care was the mechanism most likely to succeed on the scale and timeframe required.This chapter presents findings from two surveys that assessed the success of that effort bycomparing the performance of the new and traditional models for delivering basic health ser-vices, as well as the allocative and technical efficiency of these models.
The chapter presents background on the three models of care and some of the ques-tions leading to the study that were raised after the contracting process had been under wayfor a number of years. It follows with the objectives of the two surveys carried out, theirmethods, and their findings. It concludes with a discussion of the findings and their policyimplications.
Background
In 1997, the government of Guatemala (GOG) embarked on an ambitious effort to extendbasic health coverage to impoverished rural and indigenous populations through the con-tracting of private, nongovernmental organizations (NGOs). By 2002, the GOG had crafted161 convenios (agreements) with 88 NGOs to reach more than 3 million beneficiaries. Beforethis effort, the GOG (through the health ministry—the Ministerio de Salud y Assistencia(Ministry of Health and Social Protection [MSPAS]) had provided health services onlythrough inhouse providers and had not entered into service contracts of any kind with pri-vate providers.39 The coverage extension effort was part of a broader health reform policythat sought to modernize and decentralize the MSPAS, improve the efficiency and qualityof health services, strengthen management and governance functions of the MSPAS, and
50 World Bank Working Paper
39. The contracting process is analyzed in chapter I in this volume.

increase financial resources of the sector. This set of initiatives was known as the IntegratedHealth Care System (Sistema Integrado de Atención en Salud [SIAS]).
The program’s main objective was to extend a paquete básico de servicios (packageof basic services [PBS]) to rural, indigenous populations with heretofore little or noaccess to health services, giving priority to prevention, maternal and child care, and basic cura-tive care (see Box 2.1). Contract-ing was introduced as a means to rapidly extend services whilemaking the service delivery systemmore responsive to clients and theMSPAS.40
The design involved threefinancial and organizationalarrangements to provide the PBS.These are schematically presentedin Figure 2.1 and the main featuresare summarized in Table 2.1. Thefirst two arrangements, direct andmixed contracting of NGOs, wereintroduced through the SIASprogram. The third arrangement,MSPAS health post (HP)-baseddelivery, already existed. Directcontracting entailed the contract-ing of NGOs, as PSSs (proveedorade servicios de salud [health ser-vices provider]), to provide thePBS directly through outreach ser-vices to predetermined geographiccatchment areas (jurisdicciones)containing about 10,000 inhabi-tants. The PSSs received a capitatedpayment and were responsible forthe purchase of all inputs (exceptfor vaccines, which were sup-plied by the MSPAS). The secondarrangement, a mixed contractingmodel, involved the contracting ofNGOs as health services admin-istrators (administradora de ser-vicios de salud [ADMSSs]), which
Health System Innovations in Central America 51
40. The Peace Accords of 1996, which ended decades of civil strife, were a main driver of the cover-age extension effort. The accords contained provisions for the improvement of health in the country, par-ticularly in underserved rural areas.
Box 2.1. Basic Health Care Package
Maternal care
1. Prenatal care
2. Delivery care
3. Tetanus toxoid
4. Iron and folate supplementation during pregnancy
5. Postpartum care
6. Child spacing: education and referral
Infant and child care
7. Immunizations
8. Care of acute respiratory infections
9. Care of diarrhea, cholera
10. Prevention, treatment of nutritional deficiencies
11. Growth and development monitoring of childrenyounger than two years
Care of illnesses and emergencies
12. Cholera
13. Dengue
14. Malaria
15. Tuberculosis
16. Rabies
17. Sexually transmitted diseases, HIV/AIDS
18. Emergencies (fractures, burns, and so on)
Environmental health
19. Vector control
20. Zoonosis control
21. Sanitation
22. Water quality surveillance
23. Food hygiene
24. Improved household sanitary conditions.

operated exclusively as financial managers for services delivered by MSPAS teams. They alsoreceived a capitated payment. The ADMSSs hired and paid additional personnel, mainlyphysicians and administrative staff, to complement MSPAS staff, purchased supplies, andmanaged the books for the MSPAS. ADMSSs did not supervise or provide technical over-sight; this was the responsibility of MSPAS area offices.41
Both models were designed to enable MSPAS teams to expand coverage rapidly byfacilitating the acquisition of inputs through bypassing the notoriously slow and cum-bersome government personnel hiring and materials procurement systems. About 60 per-cent of the convenios have been awarded to NGOs that operate as ADMSSs. Several NGOsreceived contracts as both ADMSSs and PSSs. Some NGOs hold both ADMSS and PSScontracts.
The third arrangement consisted of the traditional model of publicly financed service deliv-ery in rural areas. Under this arrangement, personnel assigned to MSPAS HPs were responsi-ble for delivering the PBS within the facilities’ catchment area. Similar to other facilities andservices operated directly by the MSPAS, the HPs were financed through budgetary allocationsmanaged at the area level.
For the most part, PSS and ADMSS providers were assigned catchment areas where therewas little or no MSPAS presence and where communities had no regular access to health care.42
By design, PSSs were generally assigned catchment areas in remote regions with deficient
52 World Bank Working Paper
Figure 2.1. Delivery Models: Direct, Mixed, and Traditional
M S P A S
P S S
A D M S S
M S P A SH P s
M S P A St e a m s
BENEFI
CIARIES
P e r c a p i t a
V a c c i n e sp e r s o n n e l
P e r s o n n e ls u p p l i e sd r u g sv e h i c l e s
P e r c a p i t a
D r u g sv e h i c l e s
B a s i c
s e r v i c e s
B a s i c
s e r v i c e s
B a s i c
s e r v i c e s
P e r s o n n e ls u p p l i e s
v a c c i n e s
41. The mixed model resulted from a political compromise between MSPAS authorities and localhealth workers. Originally, the MSPAS was interested only in direct contracting. However, resistance fromarea and district MSPAS personnel threatened the viability of this proposal. The mixed model emergedas a negotiated solution to secure their support for direct contracting.
42. The direct and mixed models were seen as more rapid means to extend services than the tradi-tional MSPAS. The MSPAS was constrained by onerous hiring practices, weak logistical systems, and anti-quated and protracted procurement practices. Further, recruiting and maintaining professional personnelto provide care in remote areas had proven difficult.
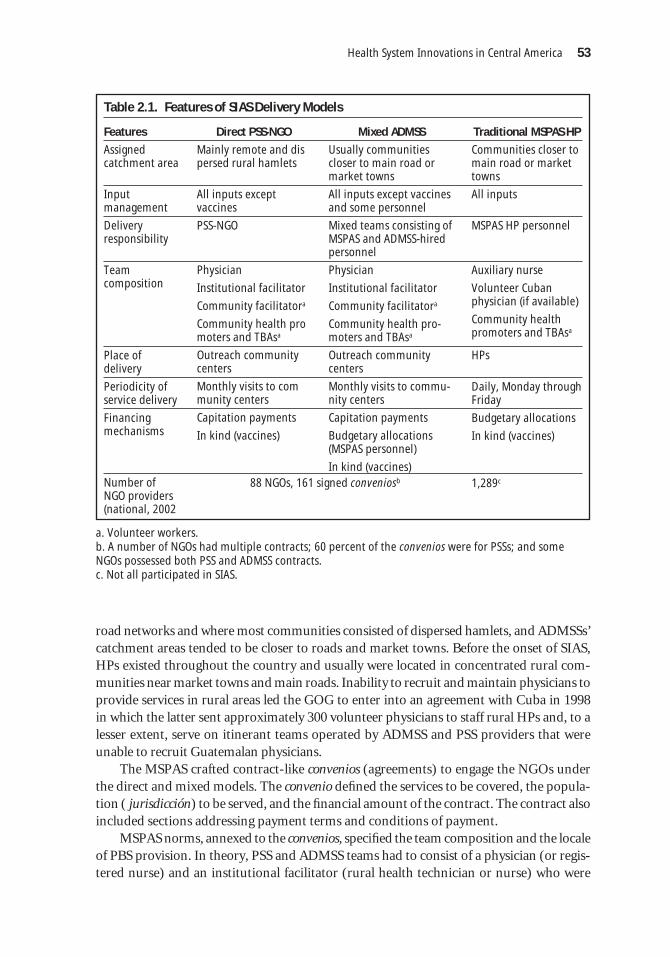
road networks and where most communities consisted of dispersed hamlets, and ADMSSs’catchment areas tended to be closer to roads and market towns. Before the onset of SIAS,HPs existed throughout the country and usually were located in concentrated rural com-munities near market towns and main roads. Inability to recruit and maintain physicians toprovide services in rural areas led the GOG to enter into an agreement with Cuba in 1998in which the latter sent approximately 300 volunteer physicians to staff rural HPs and, to alesser extent, serve on itinerant teams operated by ADMSS and PSS providers that wereunable to recruit Guatemalan physicians.
The MSPAS crafted contract-like convenios (agreements) to engage the NGOs underthe direct and mixed models. The convenio defined the services to be covered, the popula-tion ( jurisdicción) to be served, and the financial amount of the contract. The contract alsoincluded sections addressing payment terms and conditions of payment.
MSPAS norms, annexed to the convenios, specified the team composition and the localeof PBS provision. In theory, PSS and ADMSS teams had to consist of a physician (or regis-tered nurse) and an institutional facilitator (rural health technician or nurse) who were
Health System Innovations in Central America 53
Table 2.1. Features of SIAS Delivery Models
Features Direct PSS-NGO Mixed ADMSS Traditional MSPAS HP
Assigned catchment area
Input management
Delivery responsibility
Team composition
Place of delivery
Periodicity of service delivery
Financing mechanisms
Number of NGO providers (national, 2002
Mainly remote and dispersed rural hamlets
All inputs except vaccines
PSS-NGO
Physician
Institutional facilitator
Community facilitatora
Community health promoters and TBAsa
Outreach communitycenters
Monthly visits to community centers
Capitation payments
In kind (vaccines)
88 NGOs, 161 signed conveniosb
Usually communitiescloser to main road ormarket towns
All inputs except vaccinesand some personnel
Mixed teams consisting ofMSPAS and ADMSS-hiredpersonnel
Physician
Institutional facilitator
Community facilitatora
Community health pro-moters and TBAsa
Outreach communitycenters
Monthly visits to commu-nity centers
Capitation payments
Budgetary allocations(MSPAS personnel)
In kind (vaccines)
Communities closer tomain road or markettowns
All inputs
MSPAS HP personnel
Auxiliary nurse
Volunteer Cubanphysician (if available)
Community healthpromoters and TBAsa
HPs
Daily, Monday throughFriday
Budgetary allocations
In kind (vaccines)
1,289c
a. Volunteer workers.b. A number of NGOs had multiple contracts; 60 percent of the convenios were for PSSs; and someNGOs possessed both PSS and ADMSS contracts.c. Not all participated in SIAS.

responsible for providing the PBS.43 Their teams also contained up to eight communityfacilitators—volunteer workers who lived in the communities, received a small stipend, andassisted the institutional facilitator and medical teams, but were not responsible for serviceprovision. The community facilitator played a key liaison role between the outreach teamsand the communities, apprising the community of the pending arrival of the outreach teamsand organizing the work of other volunteer health workers (see next paragraph)). The workof the community facilitators, combined with local knowledge of the presence of a physi-cian on the outreach teams, stimulated demand for PSS and ADMSS services.
The PSSs and ADMSSs were also responsible for recruiting and paying a small stipendto community-based traditional birth attendants (TBAs) and community health promot-ers, as well as training all personnel. Providers also were to establish one or more commu-nity centers where itinerant teams were to provide services on predetermined dates. Thesecenters were existing structures made available by community groups44 and located withinone hour’s walk from the communities they served. Teams were expected to provide care atthe centers at least once a month, and volunteer health workers were responsible for mak-ing monthly household visits. Nurse auxiliaries and, when available, volunteer Cuban physi-cians were responsible for providing the PBS at MSPAS HPs. As discussed in the nextsection, HPs represented a facility-based delivery model, compared to the outreach-basedmodel of the PSSs and ADMSSs.
The NGOs received capitated payments in four yearly installments. The amountsreceived varied depending on the type of contract (ADMSS or PSS), number of inhabitantsin their assigned geographic area, and distance considerations. ADMSSs received a lower cap-itation rate than the PSSs for two reasons. First, as described earlier, an ADMSS contractedwith a reduced number of personal compared to a PSS. Second, because most PSSs wereassigned to remote areas, they received higher rates to account for higher transportation costs.The capitation payment covered the direct cost of the basic package plus administrativeexpenses, as well as expenditures related to institutional strengthening. In 2001, the averageper capita payment was approximately US$6.25. The total per capita cost was about US$8.00,including the cost of vaccines that the Ministry of Health supplied directly to all providers.45
In 2001, the MSPAS spent US$14.2 million on capitated transfers to ADMSSs and PSSs.However, we estimate that the MSPAS spent an additional US$7.1 million on SIAS foradministration, in-kind transfers (vaccines), supervision, HPs, and training of MSPAS per-sonnel. Taken together, in that same year, the MSPAS directed about 13 percent of its totalbudget to coverage extension through SIAS. PSS and ADMSS providers were financedthrough capitation payments and in-kind payments for vaccines. However, consonant withthe nature of the mixed model, ADMSSs benefited from budgetary allocations that paid forMSPAS personnel assigned to their provider teams. HPs were funded through line-itembudgetary allocations managed by area administrative units.
54 World Bank Working Paper
43. Rural health technicians were specially trained health workers who provided preventive activitiessuch as well-baby checkups, vaccinations, and community health promotion. If physicians were unavail-able, NGOs hired registered nurses.
44. In some cases, a building, usually a house, was rented, but generally a house was provided free ofcharge. No facilities were constructed.
45. The MSPAS also purchased and supplied drugs for the treatment of tuberculosis and malaria forNGOs demonstrating need in their catchment areas. However, some NGOs reported purchasing thesedrugs directly from suppliers when the MSPAS was unable to supply them in a timely manner.

The MSPAS developed and expanded the program by trial -and error. In addition todesigning the technical content of the extension program, the MSPAS had to create the man-agerial capacity to select providers, specify contractual provisions, negotiate and make con-tracts, issue payments, and monitor performance. These functions were first performed atthe central level but gradually transferred to area offices. The MSPAS also had to negotiatethe creation of a budgetary line item with the Ministry of Finance, as well as procedures andprocesses to guide the transfer of funds to the providers. There were modifications in pro-gram and contracts management between 1997 and 2002.46
Table 2.2 shows the growth of contracts and beneficiaries. The original design called fora three-year pilot period in which a limited number of contracts would be issued. Pressed bythe need to comply with the Peace Accords and the government’s mandate to show resultsbefore the next round of elections (in 1999), the decision was made to rapidly scale up thecoverage extension effort. Public spending on direct transfers to NGOs increased rapidly,from US$8.0 million in 1998 to US$15.6 million in 2002. The population that NGOs werecontracted to serve reached a total of 3.2 million in 2002; all were rural residents, and mostof them were from impoverished indigenous groups.
Health System Innovations in Central America 55
Table 2.2 Summary Statistics on SIAS Implementation Agreements, NGOs, andEstimated Coverage, 1997–2002
No. of signed No. of NGOs Estimated Year agreements under contract population covered
1997 14 7 460,000
1998 110 74 2,180,000
1999 119 78 2,516,000
2000 136 89 2,940,000
2001 154 89 3,000,000
2002 161 88 3,200,000
Source: MPSAS/SIAS annual reports, various years.
46. Contracting procedures and processes are described in detail in chapter I in this volume.
Issues
In 2001, as a result of the lack of quantifiable information and the short implementationperiod, program performance had yet to be assessed. No baseline data were collected at pro-gram onset. In 2001, the MSPAS began collecting data on NGO performance through ananalysis of NGO registers, postconsultation interviews with patients, and community focusgroups in part to establish baseline data to facilitate monitoring and evaluation. However,no information existed on the comparative performance of the three delivery models. Thisstudy aimed to complement the MSPAS’s efforts and methodologies by obtaining robustinformation on the performance of NGO and MSPAS providers as a means to strengthen thequality, efficiency, and coverage of basic health services as well as consolidate the development
of MSPAS institutional capacity to manage contracts, monitor performance, and evaluateresults.
According to unpublished MSPAS documents (MSPAS 2000a, 2000b), the program’smain success was in increased coverage of basic health services, especially immunizationcoverage. For example, they cite that the national child immunization coverage rates formeasles for children 12 to 23 months of age increased from 69 percent in 1996 to 83 percentin 1998.47 Anecdotal evidence suggests that immunization coverage increased significantlyin remote regions. However, it is unknown whether these increases can be attributed solelyto the program or whether the MSPAS-NGO interface through direct and mixed deliverymodels is cost effective for providing PBS coverage on a regular basis. Others claimed thatthe PBS contracted out to NGOs has been only partially implemented. Further, there is nodata comparing the performance of the direct and mixed delivery models with the tradi-tional MSPAS system.
Questions have been raised about the PBS. The MSPAS considered the PBS non-negotiable. However, supplementary services could be provided at the discretion of theNGOs if alternative financing existed. The PBS was developed without local input fromMSPAS line personnel or the NGOs. The latter criticized SIAS for forcing a “one size fits all”care model, claiming that the PBS should include frequently seen pathologies such as skininfections. Also, MSPAS norms allowed providers little flexibility in determining how best todeliver the PBS. All providers had to adopt an MSPAS-mandated personnel structure, train-ing program, materials, and equipment. Some NGOs considered the norms a “straitjacketmodel” that was inappropriate for some situations.
Most NGOs relied solely on MSPAS capitation payments.48 Charging user fees was notpermitted, nor did our research uncover any evidence of such charges. As of 2002, the percapita rate applied in 1997 had not been adjusted for inflation, estimated at nearly 30 per-cent over this period. The failure to adjust the payments contributed to five NGOs with-drawing from SIAS in 2000 and 2001. Others coped through reducing their range ofactivities. Interviews with NGO providers suggest that most provided a subset of PBS-mandated interventions.49
Important differences were observed among the provider models in terms of the teamcomposition, population served, and catchment area location. These contributed to differ-ences in coverage, production, productivity, and costs described elsewhere in this chapter.First, as described previously, by design most PSSs were assigned catchment areas in distantregions where the road network was wanting. Using census data and maps, local MSPAS areaand district officials and central-level SIAS personnel delineated geographic areas where theMSPAS had little or no presence. The areas farthest from a health center (usually located ina market town)50 and possessing a poor road network were generally assigned to PSSs. Anec-dotal evidence suggests that the distance between villages of PSS catchment areas was much
56 World Bank Working Paper
47. National Health Survey data show that measles vaccine coverage for children aged 12–23 monthsincreased from 75 percent in 1995 to 81 percent in 1998–99. Full vaccine coverage increased from 43 per-cent to 60 percent (ENSMI [Encuesta Nacional de Salud Materno-Infantil] 1998–99).
48. Anecdotal evidence suggests that a minority of NGOs had access to additional sources, but it isunclear whether such funds were used to complement SIAS-financed services.
49. Production data collected from the NGOs appear to confirm this statement.50. This was confirmed in the household survey (see Table 2.5).
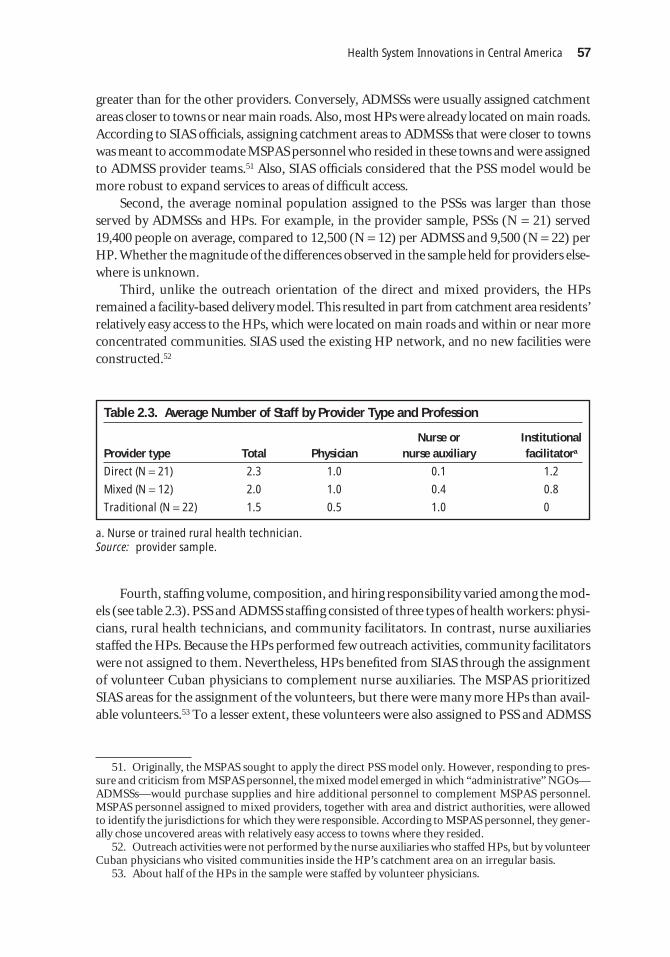
greater than for the other providers. Conversely, ADMSSs were usually assigned catchmentareas closer to towns or near main roads. Also, most HPs were already located on main roads.According to SIAS officials, assigning catchment areas to ADMSSs that were closer to townswas meant to accommodate MSPAS personnel who resided in these towns and were assignedto ADMSS provider teams.51 Also, SIAS officials considered that the PSS model would bemore robust to expand services to areas of difficult access.
Second, the average nominal population assigned to the PSSs was larger than thoseserved by ADMSSs and HPs. For example, in the provider sample, PSSs (N = 21) served19,400 people on average, compared to 12,500 (N = 12) per ADMSS and 9,500 (N = 22) perHP. Whether the magnitude of the differences observed in the sample held for providers else-where is unknown.
Third, unlike the outreach orientation of the direct and mixed providers, the HPsremained a facility-based delivery model. This resulted in part from catchment area residents’relatively easy access to the HPs, which were located on main roads and within or near moreconcentrated communities. SIAS used the existing HP network, and no new facilities wereconstructed.52
Health System Innovations in Central America 57
51. Originally, the MSPAS sought to apply the direct PSS model only. However, responding to pres-sure and criticism from MSPAS personnel, the mixed model emerged in which “administrative” NGOs—ADMSSs—would purchase supplies and hire additional personnel to complement MSPAS personnel.MSPAS personnel assigned to mixed providers, together with area and district authorities, were allowedto identify the jurisdictions for which they were responsible. According to MSPAS personnel, they gener-ally chose uncovered areas with relatively easy access to towns where they resided.
52. Outreach activities were not performed by the nurse auxiliaries who staffed HPs, but by volunteerCuban physicians who visited communities inside the HP’s catchment area on an irregular basis.
53. About half of the HPs in the sample were staffed by volunteer physicians.
Table 2.3. Average Number of Staff by Provider Type and Profession
Nurse or Institutional Provider type Total Physician nurse auxiliary facilitatora
Direct (N = 21) 2.3 1.0 0.1 1.2
Mixed (N = 12) 2.0 1.0 0.4 0.8
Traditional (N = 22) 1.5 0.5 1.0 0
a. Nurse or trained rural health technician.Source: provider sample.
Fourth, staffing volume, composition, and hiring responsibility varied among the mod-els (see table 2.3). PSS and ADMSS staffing consisted of three types of health workers: physi-cians, rural health technicians, and community facilitators. In contrast, nurse auxiliariesstaffed the HPs. Because the HPs performed few outreach activities, community facilitatorswere not assigned to them. Nevertheless, HPs benefited from SIAS through the assignmentof volunteer Cuban physicians to complement nurse auxiliaries. The MSPAS prioritizedSIAS areas for the assignment of the volunteers, but there were many more HPs than avail-able volunteers.53 To a lesser extent, these volunteers were also assigned to PSS and ADMSS

teams unable to recruit local physicians. HPs were also responsible for training and work-ing with community-based, volunteer health promoters and TBAs.54
PSSs recruited and hired all staff. ADMSSs did the same except for the rural health tech-nicians, who were salaried MSPAS staff with several years of experience in rural health ser-vices. If the catchment areas were found to contain more residents than originally estimated,the MSPAS financed the hiring of additional staff on a case-by-case basis. About half thePSSs in the sample hired additional staff to cover their catchment areas, compared to only2 of 12 ADMSSs.55 Also, several PSSs reported paying higher wages to attract personnel towork in remote areas.
All providers were responsible for identifying and training community workers andTBAs, as well as organizing community groups to support health promotion and diseaseprevention activities. However, unlike the PSSs and ADMSSs, HPs did not pay stipends tovolunteer TBAs and community health promoters because of the near-absence of outreachactivities. These workers were also seen as part of an already established MSPAS networkof community volunteers linked to the HPs.
The MSPAS area units were responsible for managing the ADMSS provider teams andHPs. Together with central-level SIAS, area units were also responsible for supervising allproviders.
Objectives of the Study
The overall objective was twofold: (1) to assess the performance of Guatemala’s program toextend coverage of basic health services by comparing key indicators in communities servedby three delivery models—NGOs as direct providers, NGOS as resource administrators forMSPAS providers, and traditional MSPAS providers; and (2) to determine the relative eco-nomic efficiency of NGO and MSPAS providers in delivering basic health services.
Household Survey
Based on a household survey of rural communities served by NGO and MSPAS providers infour departments (Alta Verapaz, Quiché, Totonicapán, and Huehuetenango), comparisonswere made of (a) indicators of the provision of priority PBS interventions, including vaccinecoverage, prenatal care (PNC), vaccination against tetanus, iron and folate supplementationfor pregnant women, knowledge and use of oral rehydration solution (ORS) among womenwhose children have diarrhea, growth-monitoring checkups, and use of carnets (recordcards) for infants; and (b) perceived quality of and satisfaction with care.
58 World Bank Working Paper
54. All three models of the provider sample did not have records of community health agents or TBAsin their catchment areas. Accounting ledgers maintained by the providers lumped together stipend pay-ments for all volunteers, including community facilitators.
55. Recruitment and stability of personnel have been problematic for the PSSs since the program’sonset. At the time of the survey, four PSSs were without physicians. They hired registered nurses as sub-stitutes.

Provider Survey
Based on a survey of production inputs, input prices, and outputs of providers serving thecommunities selected for the household survey, the study compared the efficiency of thethree provider models. An indirect measure of allocative efficiency is gauged through com-paring the service mix of each provider and determining to what extent providers are deliv-ering PBS activities, particularly the high-priority interventions related to immunization,acute respiratory illness (ARI) care, diarrhea care, prenatal care, and well-baby checkups.Technical efficiency was estimated by comparing production and labor productivity of theprovider models. Economic efficiency was analyzed by comparing unit and per capita costsof providing PBS, non-PBS, and priority interventions.
Methods
Household Survey
A household survey was carried out in four departments that had benefited from large-scale contracting: Alta Verapaz, Quiché, Huehuetenango, and Totonicapán. All of thesedepartments have a high concentration of ethnic communities and the first three in par-ticular are largely rural, with dispersed populations living in communities that are far fromhealth services.
Sample size and selection. Sample size was calculated to permit identification of statisti-cal significance with differences in immunization rates for children 12–59 months old of5 percent or greater. One hundred fifty communities were randomly selected to participatein the survey, 50 from each of the three service-provider-type catchment areas (PSS,ADMSS, MSPAS HPs). Selection criteria for communities included: (a) those with a pop-ulation of fewer than 10,000, (b) those where services had been provided for at least twoyears, and (c) those without a health center (with a physician permanently on staff). For thetraditional model, only communities with an HP or those in an HP’s catchment area wereincluded.
All eligible communities in the four departments and their populations were listed byservice provider type. Fifty communities from each provider type were randomly selectedby use of a population proportional to size selection method. Each of the communities wasvisited during one day. Twenty households were randomly selected in each community, andall women in the household between the ages of 15 and 44 were interviewed. If an eligiblewoman was not available, the interviewer returned once later the same day. No other returnvisits were made.
Questionnaire. Questions used were as similar as possible to those used in the 1998–99and 2002 ENSMI surveys so that comparisons could be made with those results. Questionswere included to assess vaccine coverage for children 12 to 59 months of age, use and qual-ity of prenatal care, use of care and satisfaction with care received for diarrhea, respiratoryillness, and growth monitoring for children younger than 2 years.
Health System Innovations in Central America 59

Interviews and data entry. Interviewers were selected for their previous experience withhousehold surveys and their language skills. In most of the households, the interviews tookplace using the language primarily spoken, either Spanish or Mayan. In a few cases where aless common dialect was spoken, translators were required. Data were entered twice andanalyzed by use of Epi-Info software.
Data analysis. The descriptive analysis was carried out by use of Epi-Info.56 A logis-tic regression was carried out by use of LogXact to adjust for significant variations amongthe populations served by the different providers. Variables included in the regressionwere distance from health facility and community size. In the final model, results are strat-ified by department and adjusted values presented because, for some variables, results var-ied considerably by department.
Provider Survey
This study assessed the costs and productivity of 57 providers: 13 ADMSSs-MSPAS, 22 PSSs,and 22 HPs.57 These were the providers responsible for the catchment areas sampled in thehousehold survey. The universe of SIAS providers working in the four departments fromwhich the household survey was drawn consisted of 42 PSSs, 24ADMSSs, and 204 HPs (seeannex table 2.1.1).
Data collection. The study used three methods to obtain total cost and production data.First, providers were asked to keep accurate records of all services and activities delivered, aswell as all inputs used to deliver such services during a three-month period.58This methodwas used to record the daily use of variable inputs such as fuel, supplies, per diem payments,training, and vaccines. Contracted surveyors who made regular visits to the NGOs in situ pro-vided assistance in completing the input survey forms. Prices for inputs were obtained fromprovider ledgers and receipts obtained from the NGOs. In the case of vaccines, which weresupplied by the MSPAS, input prices were supplied by the central ministry. Prices of suppliesfor the HPs were obtained by MSPAS departmental offices.59 The consistency of a subset ofthe data was checked by comparing the completed forms with quarterly financial and pro-duction reports provided to the MSPAS by NGOs.
Second, fixed costs were not measured directly through the survey. These includedpersonnel costs as well as depreciation. Information about spending on salaries and bene-fits was collected from accounting ledgers and divided into two categories: direct provision(for example, doctors, nurses, and so on) and administration (for example, accountants,administrators, and so forth). Depreciation was based on an inventory of equipment, vehi-cles, and buildings. Prices of all equipment and vehicles were obtained from the NGOs and
60 World Bank Working Paper
56. This study provides averages for NGOs and traditional providers that individually may performat widely varying levels. Improving the performance of NGO and traditional providers requires individ-ual assessments of their performance.
57. One PSS and one ADMSS were eliminated because of insufficient production data.58. Because of variations in drug and medical supply purchases, records were kept over a six-month
period.59. The research did not obtain data from MSPAS health centers.

the MSPAS (for HPs), and the cost of the HPs was estimated for the year of construction.Standard straight-line methods were applied, assuming a 5-year useful life for vehicles,equipment, and furniture and 20 years for buildings (according to Guatemalan account-ing standards), with no salvage value. A monthly depreciable cost was assigned for eachitem in the inventory.
Finally, indirect MSPAS costs related to supervision, monitoring, oversight, and finan-cial management of the coverage extension program were estimated and apportioned to eachprovider in the sample. Spending data (executed budgets) were collected from three levels ofthe MSPAS: central institutional,60 central SIAS administration, and area (departmental) pro-gram administration. Based on interviews with MSPAS and program staff, allocation per-centages were crafted to distribute a proportion of total costs to the coverage extensionprogram. Final cost distribution to the providers was based on the funds received by eachprovider as a percent of total provider financing. About 13 percent of area expenditures (ofthe four departments constituting the sample) and 3 percent of central-level spending weredistributed to providers participating in the program.
Data analysis. Weighted average costs were developed to compare specific types ofinterventions. The study assumed that unit costs vary for the different outputs for which theproviders were responsible. For example, it is reasonable to assume that the unit cost of ARIcare, which typically involves a physician consultation and the use of antibiotics, is higherthan the unit cost of a well-baby checkup, which may be administered by a nurse and doesnot involve pharmaceutical inputs. However, observing the specific inputs used for eachtype activity or service was beyond the scope of the study and available financial resources.Rather, the research team gathered a panel of NGO and MSPAS physicians, nurses, and ruralhealth technicians with ample experience in the program to determine the variable inputsfor a subset of outputs. Variable inputs—such as drugs, medical supplies, and the time ofeach member of a provider team—were prorated among the set of nine outputs. Weightswere derived and applied to each provider’s direct costs.61 These weights are presented inTable 2.4. Because MSPAS and HP providers constitute a different personnel mix, separateweights were developed. For example, the average weighted costs for PSS providers werecomputed as follows:
whereAC PSS
i = average cost of output i for PSS provider type,TC PSS
j = total direct cost of PSS provider j,W PSS
i = variable unit cost weight W for output i delivered by PSS provider type, andN PSS
j,i = number of i outputs provided by PSS provider j.
ACTC W
NiPss
jPS
iPSS
j
jPSS
j
= =
=
∑
∑1
21
11
21
,
Health System Innovations in Central America 61
60. Eleven of 35 budgetary activities were identified as supporting SIAS.61. This excludes both provider administrative costs and MSPAS indirect costs.

For the comparative unit and per capita cost analyses, we performed data adjustments. ForHP and ADMSS providers with volunteer physicians,62 we applied the average salary andstipend cost for a physician paid by ADMSSs-MSPAS in the sample. For PSS providers withvolunteer physicians, we applied the average salary and stipend costs for physicians paidby PSS providers without volunteers. Training and transportation costs for the health postswere not discernible from MSPAS accounting ledgers. Because both HPs and ADMSSswere assigned catchment areas close to towns and main roads, we applied ADMSSs’ aver-age costs of these inputs to the HPs.
The nonparametric Kruskal-Wallis test was used to compare the data from the threegroups of providers. This test compares the means of the three groups and assumes thatthe shapes of the three distributions are similar, but does not assume normality.63 Thehypotheses for the comparison of the three independent groups are:
� Ho—the samples come from identical provider groups;� Ha—the samples come from different provider groups.
If Ho was rejected, we applied the multiple comparisons test to determine the differencebetween pairs of provider groups.
Findings
Household Survey
This section presents findings from the household survey comparing performance of thethree provider types based on key indicators of the provision of PBS among people living in
62 World Bank Working Paper
Table 2.4. Weights for Selected Outputs
PSS and Traditional Outputa ADMSS MSPAS HP
ARI treatment 0.115 0.109
Diarrhea treatment 0.083 0.079
Prenatal consultation 0.122 0.124
Iron and folate supplementation 0.050 0.051
Well-baby checkup 0.03 0.002
Child vaccination 0.091 0.089
Vaccination of pregnant women 0.037 0.044
Other PBS interventions 0.307 0.329
Non-PBS interventions 0.188 0.174
Total 1.0 1.0
a. Output is a contact between a patient and the provider for a particular health problem or activityin which an intervention was performed.
62. Ten (of 22) health posts, 3 (of 12) ADMSSs, and 3 (of 21) PSSs reported having volunteer physi-cians at the time of the survey.
63. The test statistic is a function of the ranks of the observations in the combined sample. Given the smallsamples for each provider, and that tests indicated the data structures violated parametric assumption of inde-pendent observations and normality, the nonparametric Kruskal-Wallis is the more appropriate test.

each of their catchment areas. The indicators studied include immunization rates, prenatalcare uptake, use of tetanus toxoid, iron and folate supplementation during pregnancy, preva-lence and care of children with diarrhea and respiratory illnesses, growth monitoring, andsatisfaction with care. Simple descriptive findings are presented first, followed by a summarytable showing odds ratios adjusted for key factors.
Comparability of the three samples. We looked at a number of variables to assess whetherthe three samples were comparable with each other. Table 2.5 presents general sample char-acteristics. Household response rates were more than 90 percent for each of the three catch-ment areas. They were slightly lower for the traditional health services sample. Certainhouseholds did not participate because of refusal (1.0 percent), no women between 15 and44 years of age in the household (1.9 percent), and no one at home (4.5 percent). The inter-view rate for eligible women identified in the households that participated was similar in thethree groups. Individual refusal rates were also low (less than 1 percent), and the main rea-son that an eligible woman did not participate was that she was not at home. The averagenumber of women per household, their average age, and the average number of children perwoman interviewed were similar for the three groups.
The distribution of eligible women by department of residence varied. Traditional anddirect catchment areas were sampled in all four departments, but mixed catchment areaswere sampled only in Alta Verapaz and Quiché because the departments of Huehuetenangoand Totonicapán do not have ADMSS providers.
Health System Innovations in Central America 63
Table 2.5. General Sample Characteristics
Catchment area
Traditional Sample characteristic MSPAS HP Mixed ADMSS Direct PSS
Number of households 939 1,005 1,026in sample
Number of households 854 (91%) 933 (93%) 964 (94%)interviewed
Eligible women 1,114 1,287 1,357
Number of completed 1,060 (95%) 1,217 (95%) 1,278 (94%)interviews
Average number of 1.3 1.3 1.4women per household
Average age of women 28.2 27.6 27.6interviewed
Average number of 1.2 1.2 1.2children younger than five years per woman
Department of residence Distribution of women interviewed (%)
Alta Verapaz 30.2 57.4 38.0
Quiché 20.0 42.6 22.8
Huehuetenango 33.2 0 19.0
Totonicapán 16.5 0 20.1

Sample community characteristics. The number of inhabitants in the communities sam-pled in the three catchment areas was similar (table 2.6). However, communities served bydirect providers tended to be located considerably farther from health facilities (HP or healthcenter) compared to communities served by mixed and traditional providers. Only 10 per-cent of direct provider communities were located within 3 kilometers of a health facility,compared to 22 percent and 35 percent, respectively, of mixed and traditional provider com-munities. Conversely, 56 percent of direct provider communities were more than 10 kilo-meters away (compared to 30 percent and 20 percent among mixed and traditional), and 24 percent were more than 20 kilometers away (data not shown). The quality of the roadsleading to health facilities was also considerably worse in direct provider communities.
All the communities sampled had 95 percent or more Mayan populations. Access towater was similar within the three groups, with communities in the traditional services catch-ment areas having slightly better access to potable water and those in direct provider servicescatchment having slightly worse access. Illiteracy rates are for the entire municipality in whicheach community lies and are similar for all three groups.
Taken together, tables 2.4 and 2.5 demonstrate that, with the exception of distance fromhealth facility and the quality of access roads, the women and their communities were rea-sonably comparable with each other based on the data collected. This is consistent with theSIAS design features, outlined in section 2.2, in which direct providers were generally assignedto more distant communities than mixed and traditional providers.
64 World Bank Working Paper
Table 2.6. Number of Communities Sampled with Given Characteristic, by Provider Type
Provider catchment area
Traditional Mixed Direct Community characteristic MSPAS HP ADMSS PSS
Number of inhabitants
0–600 17 18 17
601–1,200 12 19 13
>1200 19 15 19
Distance to health facility (km)
0–3 17 11 4
4–10 19 31 15
>10 12 10 29
Type of access (roads)
Regular or good 44 46 37
Difficult or bad 4 6 11
Other characteristics
Mayan population (%) 96 95 98
Households with water (%) 77 73 68
Illiteracy (%)a 60 65 62
Total number of communities 48 52 48
a. Illiteracy rates are for the municipality in which each community lies.

Immunization rates. Immunization rates varied considerably among the four depart-ments, with Totonicapán having significantly worse rates (data not shown). Because mixedprovider catchment areas were sampled only in Quiché and Alta Verapaz, immunizationrates are shown for catchment areas served by all three provider types in those two depart-ments only (Table 2.7).64 Immunization rates for all four departments together are shown forcatchment areas for direct and traditional providers because they both included Totonicapán.For the departments of Quiché and Alta Verapaz, children in mixed provider catchment areasconsistently have the best immunization rates. Children who live in direct provider catch-ment areas in Quiché and Alta Verapaz consistently have the lowest immunization rates.However, direct provider and traditional areas have very similar rates when data from all fourdepartments are used.
Health System Innovations in Central America 65
64. Results for the other variables do not vary substantially by department and are therefore shownin the aggregate for all four departments by provider type (catchment area). Apparently there is a longhistory of distrust in the safety of immunizations among the ethnic groups who live in Totonicapán, andrates there are consistently lower than in other departments.
Table 2.7. Immunization Rates (%) among Children 12–59 Months of Agea
Type of immunization All four departments Quiché and Alta Verapaz only
and other Traditional Mixed Direct Traditional Mixed Direct characteristics MSPAS HPs ADMSS PSS MSPAS HPs ADMSS PSS
All vaccines 73.0 NA 74.2 82.0 84.3 74.5
No vaccine 5.2 NA 5.7 3.4 2.7 4.1
DPT3 80.1 NA 80.7 86.5 89.3 81.6
Polio 3 81.0 NA 81.7 86.8 89.5 82.4
Measles 81.7 NA 82.0 86.5 89.6 83.5
BCG 93.0 NA 87.7 93.4 93.0 88.8
Percent with carnet 59.2 NA 53.8 57.1 57.3 51.4
Number of children 860 NA 1,080 396 1,069 686
BCG Calmette-Guérin bacillus.DPT diphtheria-pertussis-tetanus.NA not applicable.a. Information obtained from the carnet or the mother.
Prenatal care. PNC rates did not vary as much by department as did immunization rates.PNC rates (at least one visit) were similar and reasonably high in traditional and mixedprovider catchment areas (86 and 87 percent, respectively) but were lower in direct providerareas (75 percent; see Table 2.8). First trimester care rates were slightly higher for women inmixed provider areas. Among women who had at least one PNC visit, the average numberof visits during the pregnancy was similar in the three groups ranging from 2.8 (directprovider areas) to 3.0 (mixed provider areas). The quality of PNC received, as measured bytetanus toxoid vaccination and iron and folate supplementation, was also highest in mixed

provider catchment areas. Rates for these indicators were higher in traditional catchmentareas compared to direct provider areas.
Diarrhea and respiratory illness among children less than two years old. Prevalence ratesfor diarrhea and respiratory disease in the three months prior to the survey are shown inTable 2.9. Diarrheal prevalence was highest in mixed provider catchment areas and lowest intraditional catchment areas. Women in mixed provider communities were more likely tohave used ORS during their child’s last episode of diarrhea and more likely to say they knewhow to use ORS. Compared to traditional provider communities, women in direct provider
66 World Bank Working Paper
Table 2.8. PNC Use and Services Provided
Catchment area
Traditional Mixed Direct Characteristic MSPAS HP ADMSS PSS
Percentage and number of 1999 63.8 68.7 63.4women who have given birth since July (545) (687) (672)
Women who gave birth
Percentage with at 75.0 86.9 78.0least 1 PNC visit
Average number of PNC visits 2.9 3.0 2.8
Percentage who received 61.9 63.8 55.1tetanus toxoid
Percentage who received iron 57.7 68.0 57.8
Percentage who received folate 52.0 62.4 52.6
Women with more than 1 PNC visit
Percentage with 1st trimester PNC 32.3 35.6 29.1
Table 2.9. Diarrhea and Respiratory Illness Prevalence (in the Last 3 Months), Health Service Use, Knowledge and Use of ORS
Catchment area
Traditional Mixed Direct Characteristic MSPAS HP ADMSS PSS
Number of children < 2 years old 515 595 616
Prevalence of diarrhea in the last 3 months (%) 45.2 55.8 49.7
With diarrhea and received ORS (%) 42.1 51.8 44.8
With diarrhea and received medical care (%) 48.0 53.8 46.0
Prevalence of respiratory illness in the last 3 months (%) 35.5 22.7 33.4
With respiratory illness and received medical care (%) 74.3 77.0 68.4
Women with children < 2 years who say (%) 41.8 54.5 45.6they know how to use ORS
Women with children < 2 years who have ORS in the home (%) 12.6 19.8 12.9

communities were slightly more likely to have used ORS during their child’s last episode ofdiarrhea and to say they knew how to use it. They were just as likely to have it in the house.The percentage of women with children under two years of age who had ORS in the homewas low (less than 20 percent) in all three types of communities. Use of medical care for diar-rhea and respiratory diseases in children was high in all three groups of communities, vary-ing from 46 percent to 54 percent for diarrhea and from 68 percent to 77 percent forrespiratory illness. Children in mixed provider and traditional communities were more likelyto have received medical care during an episode of illness than children in direct providercommunities. Women were more likely to seek medical care for infants with respiratory dis-ease than for those with diarrhea. More than two-thirds of mothers sought care for infantsand children with respiratory illness.
Growth monitoring. MSPAS guidelines in 2001 called for growth (weight and height)monitoring every two months among children younger than two years of age. However, onlya small percentage of children under two in each of the three groups had received growthmonitoring in the three months prior to the survey (3–12 percent), as shown in table 2.10.Among those who did, nearly all were weighed, though children from traditional and directprovider communities were more likely to be weighed than those in mixed provider com-munities (93 percent and 100 percent compared to 86 percent). Children in direct providercommunities were more likely to have their weight noted on their carnet (data not shown).However, fewer children had their height measured during their last checkup (68–81 per-cent). Very few children had their height noted on their carnet.
Health System Innovations in Central America 67
Table 2.10. Growth Monitoring in the Last 3 Months
Catchment area
Traditional Mixed Direct Characteristic MSPAS HP ADMSS PSS
Number of children < 2 years of age 544 639 663
Growth monitored in the last 3 months (%) 3.1 8.3 12.4
Weighed during last checkup (%) 100.0 86.3 96.3
Height measured during last checkup (%) 70.6 68.2 81.0
Adjusted odds ratios. Estimated adjusted odds ratios from the final logistic regres-sion model are summarized in Table 2.11.65 The model includes distance from healthcenter and size of community. Age of mother did not significantly change results andwas not included in the final model. Results are stratified by department to adjust forany differences. The model adjusted for differences in outcomes associated with dis-tance from health facility and community size. The farther women lived from a healthfacility, the worse their health indicators tended to be, whether they received care froma mixed, direct, or traditional provider. Because the majority of women who lived far-
65. Crude odds ratio data are presented Annex Table 2.1.2.

ther than 10 kilometers from a health facility had a direct provider, it was necessary toadjust the results to make a fair comparison. The results were also stratified by depart-ment because of the differences, particularly in immunization coverage, noted bydepartment. The fact that the mixed NGOs did not provide care in Totonicapán, whereimmunization rates are particularly low, contributed to higher coverage; stratifying bydepartment adjusted for this difference.
Table 2.11 summarizes the adjusted odds ratios, comparing indicators from mixedand direct provider communities to those in traditional provider communities. The oddsof receiving each of the vaccines as well as all of the vaccines were significantly better for
68 World Bank Working Paper
Table 2.11. Adjusted Odds Ratio for Key Health Indicators: Mixed and Direct ProviderCommunities Compared to Traditional Communities
Adjusted odds ratioa
Traditional Mixed Direct Characteristics MSPAS HP ADMSS PSS
Children aged 12–59 months with vaccineb
BCG 1.00 1.46c 0.94
DPT3 1.00 1.76c 1.05
Polio3 1.00 1.72c 1.05
Measles 1.00 1.55c 1.05
All vaccines 1.00 1.70c 1.11
Women with history pregnanciesb
At least 1 PNC visit 1.00 1.69c 1.28
First trimester PNC visit 1.00 0.95 0.93
Received tetanus toxoid 1.00 1.53c 0.96
Received iron 1.00 1.73c 1.14
Received folate 1.00 1.43c 1.01
Children younger than 2 years old
Prevalence of diarrhea in the last 3 months 1.00 1.58c 1.21
Diarrhea in the last 3 months and received ORS 1.00 1.55c± 1.23
Diarrhea and received medical care 1.00 1.29 1.05
Prevalence of respiratory illness in the last 3 months 1.00 0.71c 0.99
Respiratory illness and received medical care 1.00 1.14 0.89
Growth monitored in the last 3 months 1.00 3.10c 5.49±
Weighed during last checkup 1.00 0.28 1.84
Height measured during last checkup 1.00 1.04 0.62
Women with children younger than 2 years old
Say they know how to use ORS 1.00 1.67c 1.31c
Have ORS in the home 1.00 1.06 1.06
a. Adjusted for woman’s age, number of pregnancies in the last 5 years (proxy for fecundity), distancefrom health center, and community population.b. Information from the carnet or from the mother when the carnet was not availablec. P<.05 compared to traditional MSPAS HP.

children in mixed provider catchment areas compared to traditional areas. The odds ofbeing vaccinated for children in direct provider catchment areas were very similar to, andnot significantly different from, results in traditional areas.
The odds of PNC use were also greater among women in mixed provider areas comparedto traditional areas. The likelihood of first trimester care was not different for women in thethree types of catchment areas. However, women in mixed provider areas were also signifi-cantly more likely to have received tetanus toxoid, iron, and folate during their pregnancy.Neither the odds of receiving prenatal care, nor of receiving tetanus toxoid or iron and folatesupplementation, were significantly different for women in direct and traditional providercatchment areas.
Diarrhea and respiratory disease prevalence was significantly higher among children inmixed provider communities. Women in mixed provider areas were more likely to use ORSthan were those in traditional areas, and women in mixed and direct provider areas weremore likely to say they knew how to use ORS than women in traditional areas. However, therewere no significant differences in possession of ORS at the time of the interview amongwomen in the three types of catchment areas. Likewise, there was no significant difference inthe odds of using medical care for children less than two years of age who had diarrheal dis-ease or a respiratory illness.
Children in mixed and direct provider areas were significantly more likely to have hadtheir growth monitored compared to those in traditional areas (although, as noted, coveragewas low for all three provider types).
Choice of health services. There was a striking degree of cross-utilization of services bymothers in each of the three groups using services not specifically assigned to them (table2.12). This was particularly true for mothers in traditional health service catchment areas,where only 25 percent of pregnant women, 36 percent of mothers whose children had diar-rhea, 27 percent whose children had respiratory illness, and 24 percent who took children forroutine growth monitoring went to their assigned HP for care. Instead, 23 percent of preg-nant women, 38 percent of children with diarrhea, 42 percent with respiratory illness, and 6 percent who went for growth monitoring received care in community centers and 16, 20,28, and 47 percent, respectively, in health centers.
Cross-utilization also occurred in direct provider communities, but to a much lesserextent, with 38 percent of pregnant women, 67 percent of mothers whose children had diar-rhea, 61 percent of those with respiratory illness, and 83 percent who took children for growthmonitoring receiving care in a community center. Mothers in mixed provider communitiesused community centers and HPs nearly equally. Mothers in mixed provider communitiesand direct provider communities also took themselves and their children to health centersfor pregnancy care (22 and 20 percent, respectively), diarrhea (33 and 14 percent), respira-tory illness (19 and 11 percent), and growth monitoring (20 and 2 percent). The study alsofound that an important percentage of women continue to choose TBAs for their PNC, andthis percentage was highest for women in HP provider areas (35 percent) and lowest (21 per-cent)for women in mixed provider areas.
Satisfaction with care. Satisfaction with care was measured using four indicators (prob-lem resolution; provision of medicines; waiting more than one hour; and friendliness ofservices), as shown in figure 2.2. More than 70 percent of women responded positively to
Health System Innovations in Central America 69

70 World Bank Working Paper
Table 2.12. Choice of Health Services for Women and Children
Catchment area
Traditional Mixed Direct Type of health service used MSPAS HP ADMSS PSS
Women who had prenatal care
In community center (%) 23 35 38
In HP (%) 25 25 10
In health center (%) 16 22 20
At home—TBA (%) 35 21 29
Children who received medical care for diarrhea
In community center (%) 37.7 29.6 67.2
In HP (%) 36.0 27.3 12.7
In health center (%) 20.2 33.0 14.2
Children who received medical care for respiratory illness
In community center (%) 41.5 38.4 61.4
In HP (%) 26.6 28.3 15.8
In health center (%) 27.7 19.2 11.4
Children who were weighed
In community center (%) 5.9 39.2 82.9
In HP (%) 23.5 33.3 6.1
In health center (%) 47.1 19.6 2.4
these questions for all three types of providers. The exceptions were answers to questionsabout traditional providers’ waiting times and friendliness of care for children with respira-tory illnesses. Community centers in ADMSS communities generally received the highestscores for satisfaction. Community centers in both mixed and direct provider communitiesscored particularly well for friendliness of care and waiting times compared to traditionalHPs. Mixed provider services were identified as more likely to resolve problems then theother provider types. However, perception of problem resolution was generally high for allthree providers. By and large, women also said they received the medicine they needed fromall provider types. Although satisfaction rates were generally high, they tended to be betterfor care provided for diarrhea than for care provided for respiratory illness.
Figure 2.2 shows only satisfaction with care received from the assigned provider. Datanot shown reveals that women from traditional areas who cross-utilized community cen-ters consistently rated satisfaction with care received higher than from their assigned healthposts. Women in all three types of catchment areas rated satisfaction with care higher forcommunity centers for all the indicators except for receipt of needed medicines for diar-rhea from direct providers where women rated health posts slightly more positively.
Provider Survey
This section presents findings comparing measures of technical and economic efficiency,including labor productivity and average unit and per capita costs, for each type of provider.

Depending on the analysis, the findings are classified by types of services provided: (a) all ser-vices and activities,66 (b) all services and activities excluding vaccinations,67 (c) PBS inter-ventions (see Annex 2.1), and (d) MSPAS priority interventions (that is, care of ARI, care ofdiarrhea, prenatal care, and well-baby checkups) included in the PBS. Data on total produc-tion and spending by provider and service type are presented in Annex Table 2.1.3.
Service mix, production, and productivity. Table 2.13 displays the distribution of servicevolume by selected interventions reported by the sampled providers. The distribution of ser-vice production is relatively consistent among providers, but some differences are note-worthy, suggesting a need for greater standardization of the PBS. All providers concentratedon the basic service package, including vaccinations, which accounted for more than three-quarters of provision. Vaccinations represented about 40 percent of all outputs for eachprovider, though for the PSSs, vaccinations accounted for a lower share of total outputs thanthe other providers. Differences among the groups were significant for the vaccinations and“other PBS” categories. For both these categories, HPs were significantly different from theother providers. Non-PBS services are higher in the HPs (22 percent of total volume, com-pared to 14 percent for the PSSs and ADMSSs), suggesting that they cater to spontaneousmorbidity demand of the population whereas the PSSs and ADMSSs tend to focus on PBSactivities. Although all providers display low levels of outputs related to the four priorityinterventions (care of ARI, care of diarrhea, PNC, and well-baby checkups), taken together
Health System Innovations in Central America 71
66. Costs for the all services (“all”) category are unweighted, and all other cost data are based onweights presented in Table 2.3.
67. Vaccinations were not part of the routine service provision by the sampled providers, but theywere also given during MSPAS-organized campaigns in which all providers participated (see Annex 2.2).
Figure 2.2. Percent of Women Satisfied with Care Received for Their Children under 2,by Catchment Area of Residence and Type of Illness
88
10099
7281
80
9695
84
9297
91
0 50 100 150
98
66 98
84 98
81
82 90
78
80 77
61
050 100 150
Rec'd medicine
they needed
Waited<= 1 hour
DiarrheaRespiratory Illness
Traditional
Mixed
Direct
Friendlycare
Problem was
resolved
Note: Only satisfaction with care received from the catchment area’s assigned provider is shown.

these activities represent about 25 percent of PSS output volume compared to 15 percentfor ADMSSs and HPs.
Figures 2.3 and 2.4 compare average monthly production and labor productivity foreach provider model for three categories of interventions: “all services,” PBS, and “all ser-vices” except vaccinations.68 Figure 2.3 displays the results for all sampled providers. Foreach category, the differences among the groups and between each pair of providers are sig-nificant (P<.05) in terms of production (average monthly volume of outputs per provider).PSSs demonstrate markedly higher production than the HPs and slightly, but still signifi-cantly, higher production than the ADMSSs. Although the results are similar for produc-tivity (average monthly provider volume per health worker providing care),69 differencesare significant for only the “all services” and PBS categories. PSS personnel provided an aver-age of 568 interventions per month, 10 percent more productive than the HPs. However,PSS personnel were 18 percent more productive for PBS interventions and for interventionsexcluding vaccinations. The differences between ADMSS and HP providers are less marked:the former are 7, 17, and 14 percent more productive for “all,” PBS, and nonvaccination cat-egories, respectively. These differences were found to be significant for the two former cat-egories of interventions.
The presence of a physician on a provider team can be an important determinant ofdemand and therefore drive production. Most PSS and ADMSS teams in the sample includephysicians, and about half of the HPs were staffed with volunteer Cuban physicians.70
72 World Bank Working Paper
68. Because vaccinations represented about 40 percent of all outputs for each provider, and were pro-vided during national campaigns as well during regular visits, removing vaccination outputs provides abetter estimate of services regularly provided in the communities constituting providers’ catchment areas.
69. M.D., nurse, auxiliary nurse, and rural health technician.70. Ten of 12 ADMSSs, 16 of 21 PSSs, and 10 of 22 HPs reported having physicians on the delivery teams.
Table 2.13. Percent Distribution of Total Monthly Outputs,a by Provider and ServiceType, 2001b
Type of service of Direct PSS Mixed ADMSS Traditional HP activity (N = 21) (N = 12) (N = 22)
Priority PBS
Care of ARI 9.2 9.2 7.3
Care of diarrhea 3.3 1.7 2.5
PNC 3.6 2.5 2.2
Well-baby checkupc 9.4 1.5 3.4
Vaccinationsd 37.9 38.6 43.2
Other PBS benefitd 22.4 32.5 19.2
Non-PBS benefit 14.2 14 22.2
Total (100%) 28,429 14,231 17,348
a. Contacts between a provider and patient or community member in which a specificservice was provided or activity performed.b. January–March 2001.c. Growth and development monitoring of children under 2 years old.d. P<05 (difference between PSSs, ADMSSs, and HPs).

Health System Innovations in Central America 73
Figure 2.4 compares performance for providers with physicians on the delivery team.Unlike the comparisons of Figure 2.3, differences were not significant for each cat-egory of interventions presented in Figure 2.4. Although average production and pro-ductivity of PSS personnel are higher than those of the other two provider types, dif-ferences between the ADMSSs and HPs are negligible. In fact, productivity of HPpersonnel (538) for the “all interventions” category is actually greater than for ADMSSpersonnel (494).
Comparing the data in Figure 2.3 (full sample of providers) with that of Figure 2.4(subset of providers with M.D. degrees), the presence of a physician on the HP teamincreases production and productivity by more than 40 percent. (PSSs register a marginalincrease in production and productivity, and ADMSSs report a slight decrease.)71 Forexample, the average monthly production per HP is approximately 50 percent higher inHPs with physicians for all categories of interventions (“all services,” PBS, and withoutvaccines). These results are self-evident to the extent that a physician represented an addi-tional member of the team for HPs and was expected to perform outreach visits to com-munities in the HP catchment areas.72 However, the presence of a physician probablystimulated demand—especially in communities that previously had little or no access tophysician services. Comparisons of productivity showed mixed results. HP teams con-taining M.D.s are 7 and 2 percent more productive for “all services” and PBS categories,but 9 percent less productive for interventions if vaccines are excluded. This suggests thathaving a physician on staff may generate greater demand for services at HPs, but this doesnot necessarily result in greater productivity.
71. Because nearly all PSSs and ADMSSs had physicians, it was not possible to compare thoseproviders with and without physicians (see note 33).
72. In the case of PSSs and ADMSSs, nurses or rural health technicians were hired if the providerswere unable to recruit physicians.
Figure 2.3. Average Monthly Production and Productivity By Output Category andProvider Type, 2001
*P<.05 (across groups and between each pair of providers for production).†P<.05 (across groups and between each pair of providers for productivity).
447728
840
6141,020
1,162
7891,186
1,354
0 500 1,000 1,500
Direct
Mixed
Traditional
290 336 352
397 471
486
510 547
568
0200400 600
All*†
PBS*†
Withoutvacci-nation*
Production(outputs per provider)
Productivity(outputs per worker)

74 World Bank Working Paper
Expenditures, unit and per capita costs. This section presents both observed and adjustedcosts derived from the provider survey. Observed costs should be interpreted with caution.First, they do not account for the economic costs of volunteer physicians.73 Second, MSPASledgers did not permit the identification of training and vehicle maintenance costs or stipendpayments to volunteers. Third, 2 of 12 ADMSSs and 2 of 21 PSSs were without physicians atthe time of the survey. Because of the small sample of 12 ADMSSs, the absence of physiciansin 2 of them and the use of Cuban volunteers in another 2 skewed average personnel costsdownward for this category of providers. We performed adjustments to correct some of thesedata gaps for unit, per provider, and per capita costs.74
Cost structures varied among the provider models. Average (unadjusted), per provider,monthly expenditures by the PSSs were about three times greater than those of the ADMSSs,but more than five times higher than those of HP providers, as shown in Table 2.14. IndirectMSPAS cost allocation represents a greater share of total costs for ADMSSs and HPs becausethe MSPAS hired personnel and was responsible for technical oversight of the delivery teamsfor these providers. In relation to direct spending (excluding provider overhead and MSPASindirect costs), Table 2.14 also shows that about one-fifth of PSS and ADMSS spending wentfor training and vehicle maintenance. Higher levels of spending for transportation by PSSsresulted from more difficult access and greater travel distance to and among the communi-ties in their assigned catchment areas. Also, PSSs and ADMSSs had to train a larger numberof new personnel and provide for a wider range of training than other providers. Accordingto NGO informants, high rotation of personnel resulted in elevated training costs, even afterthree years of implementation. ADMSS training costs were less than those of the PSSs becausethe former tapped experienced and tenured MSPAS rural health technicians. As mentioned,HPs’ costs related to direct administration, training, and vehicle maintenance could not beascertained from MSPAS spending ledgers.
Figure 2.4. Average Monthly Production and Productivity by Output Category andProvider Type with Physicians, 2001
609705
890
864966
1,241
1,1321,144
1,437
0 500 1,000 1,500 2,000
Direct
Mixed
Traditional
290 307
339
411 420
484
538 494
561
0200400600
All
PBS
Withoutvacci-nation
Production(output per provider)
Productivity(output per worker)
73. Ten of 22 HPs, 3 of 21 PSSs, and 2 of 12ADMSSs reported volunteers as their staff physicians.74. Adjustments consisted of attributing: (a) the average cost of contracted Guatemalan doctors
reported by the ADMSSs and PSSs to the volunteer Cuban physicians reported for all providers and(b) average costs of ADMSS training and vehicle maintenance to the HPs.

Average monthly PSS personnel costs alone dwarf total monthly spending by HPproviders and are markedly higher than ADMSS personnel spending. We found two reasonsfor this disparity. First, given the larger assigned population,75 PSS teams consisted of moreprofessional personnel than other providers. For example, PSSs reported teams consisting of2.3 nonadministrative personnel on average, compared 2.0 for ADMSSs and 1.5 for the HPs(see table 2.3). Second, PSSs recruited more volunteer community facilitators, incurringhigher outlays for travel stipends than ADMSSs. The former averaged Q13,770 per month,compared to the latter’s monthly expense of Q6,550. We found no evidence of payments tocommunity volunteers working in HP catchment areas.76
PSSs and ADMSSs reported paying above-market salaries and travel stipends to attractpersonnel to work in distant communities, particularly physicians. On average, ADMSSs paidQ6,000 per month for salaries and stipends, compared to Q5,850 for PSSs. In comparison,senior-level MSPAS area and district Directors earned approximately Q6,000 and Q4,500,respectively. Higher PSS and ADMSS spending on drugs and supplies was related to higherlevels of production, which in turn probably was linked to the larger populations residing intheir catchment areas. Regarding the use of drugs and supplies, the ADMSSs were the mostresource intensive, averaging Q7,600 per provider per month, compared to Q6,000 andQ3,000 for PSSs and HPs, respectively.
Health System Innovations in Central America 75
75. As reported in the “Issues” section of this chapter, according to provider registers, PSSs were nom-inally responsible on average for 19,400 people, compared to 12,500 per ADMSS and 9,500 per HP.
76. Nor did we find evidence of ADMSS or PSS payments for other community workers, such as com-munity health promoters or TBAs. However, these providers did finance training for them.
Table 2.14. Percent Distribution of Total and Average Monthly Expenditures (Observed)by Spending Category and Provider Type, January–March 2001
Direct PSS Mixed ADMSSS Traditional HP Expense category (N = 21) (N = 12) (N = 22)
Total spending Q 1,132,079 Q 398,486 Q 206,869
Average per provider spending Q 53,909 Q 33,207 Q 9,403
Distribution (%) 100 100 100
Indirect
Provider overhead 3 4 0a
Central MSPAS overhead 7 13 20
Area MSPAS overhead 3 5 7
Direct
Salaries and stipends 49 34 39
Depreciation 3 2 <1
Training 19 16 0b
Drugs, medical supplies 11 23 32
Utilities, rent <1 <1 2
Vehicle maintenance 5 3 0b
Note: US$1 = Q 7.9.a. Included in indirect costs of area and central MSPAS.b. Spending for these items was not specified in MSPAS ledgers.

Figure 2.5 comparesaverage, monthly costs perprovider by use of observedand adjusted spending data.The adjustments result in a doubling of HP per pro-vider costs (from Q9,400 to Q18,800), and PSS andADMSS costs increasedslightly. Adjusting for theuse of volunteer physiciansin nearly half the HPs con-tributed to the increase incosts. After adjustments, HPcosts per provider are about
one-third and one-half of those for PSS and ADMSS providers, respectively.Survey findings demonstrate large and mostly consistent differences in average unit (per
intervention) costs. Table 2.15 presents the average observed and adjusted unit costs byactivity category and provider type. For all three categories of interventions, theobserved (unadjusted) unit cost differences between PSSs and HPs were significant(P<.05). PSSs have the highest observed unit costs, and HPs have the lowest. For the totaland PBS categories, PSSs have triple the units costs of HPs, but are six times more expen-sive for non-PBS interventions. ADMSSs occupied an intermediate range between the PSSsand HPs, but differences were not statistically significant. Average unit costs for specificactivities follow this trend, except for well-baby checkups.77
76 World Bank Working Paper
Figure 2.5 Average per Provider Costs: Observed andAdjusted (in Q$)
Q0 Q20,000 Q40,000 Q60,000
Traditional
Mixed
Direct
Observed Adjusted
Table 2.15 Average Monthly Unit Costsa by Activity and Type of Provider (in Quetzales),2001
Direct PSS Mixed ADMSS Traditional HPs
Activity Observed Adjusteda Observed Adjusteda Observed Adjusteda
All services 40 40 28 30 12 24
PBS* 38 38 27 28 13 25
Nonbasic package* 53 54 38 40 9 19
Selected activities
Care of ARI* 50 51 35 37 18 35
Care of diarrhea* 102 103 141 151 38 76
PNCb,* 192 195 194 208 93 185
Well-baby checkup* 1 1 5 5 1 2
Vaccinations* 14 14 10 10 4 7
Note: US$1 = Q 7.9.a. Adjusted for volunteer physicians (all providers) and for training and vehicle costs (HPs only).b. Includes cost of iron supplementation.*P≤.05 (differences between each pair of providers for observed and adjusted unit costs).
77. The relatively lower volume of output for PNC and well-baby checkups for ADMSS providersdrove the higher unit costs.

The adjustments reduced the differences among providers, but differences remained sig-nificant (P<.05) and the tendency remained: PSSs displayed significantly higher unit costsfor each category of intervention, and HPs operated with the lowest unit costs. However, PSSsdisplayed significantly lower adjusted unit costs for care for diarrhea, PNC, and well-babycheckups than their ADMSS counterparts, in part because of the low levels of outputobserved for the latter.
Per capita costs of population coverage by provider type are presented in Figure 2.6.Data on nominal coverage are drawn from PSS and ADMSS contracts and HP recordsthat were derived from rapid household surveys that all providers are mandated to con-duct annually. Consonant with the unit cost findings, HPs are the lowest cost provider(P<.05).78
Health System Innovations in Central America 77
78. Also, although not shown in figure II.6, HPs provide more monthly outputs per capita (1.8), com-pared to PSSs (1.5) and ADMSSs (1.1). These results should be interpreted with caution because they arebased on nominal coverage.
79. Drawn from the household survey, adjustments are based on the observed demand for priorityinterventions (ARI care, diarrhea care, PNC, and well-baby checkups) by residents of a specific catch-ment area from the provider assigned to that catchment area. Vaccinations were not included becausethey were provided generally through vertical campaigns and were not part of the regular delivery system(see Box 2.1). Effective population coverage for PSSs was 52 percent, compared to 35 and 26 percent,respectively, for the ADMSSs and HPs.
Figure 2.6 Cost per Capita by Provider Type, Nominal and Effective PopulationCoverage, (Adjusted Costs)
*P = <0.05 (differences between each pair of providers for both nominal and effective coverage).
7.68.5
5.7
2.02.82.8
0 2 4 6Cost per capita (Q)*
Effectivecoverage
Nominalcoverage
Direct
Mixed
Traditional
Adjusting for effective coverage,79 PSSs become the least-cost provider (Q5.7 percapita), followed by HPs (Q7.6) and ADMSSs (Q8.5). The differences among the pairsof providers are statistically significant (P<.05). Nevertheless, because of the lowereffective population coverage by HPs, they provide an average of 4.0 interventions percapita, compared to 2.2 for the ADMSSs and 2.0 for the PSSs. In short, for the popula-tion that the HPs effectively cover, they provide more services per capita than the otherprovider types.

Discussion
The new direct and mixed provider delivery models performed as well as—and, in the caseof mixed providers, often better than—traditional health care services in delivering a basichealth package to rural, indigenous communities that previously had no or limited access tohealth care services. These provider models are generally more productive and display higherlabor productivity than the traditional model. Users also report higher demand for and sat-isfaction with the care received. Results on economic efficiency are mixed, however. Directand mixed model providers have significantly higher unit and per provider costs than theirtraditional counterparts. Yet direct providers display lower per capita costs than the otherproviders when accounting for effective population coverage and the economic costs ofvolunteer physicians, training, and transportation. Mixed providers generally register inter-mediate performance on unit costs, production, and productivity compared to the otherprovider models. These findings suggest that mixed and direct provider models are goodalternatives to traditional health care services for providing a basic package; the findings alsosupport the models’ continued extension to other rural areas of Guatemala that still lackhealth service coverage. These models are viable alternatives as long as the government con-tinues to commit the additional funding required to underwrite their higher costs.
Findings
The household survey found that communities served by mixed providers tended to havebetter performance indicators than those in communities served by traditional and directproviders for immunizations, PNC use, quality of PNC services, and use of ORS during chil-dren’s episodes of diarrhea. Mixed provider communities had significantly better immu-nization and PNC coverage than communities with traditional providers.80 Mixed providercommunities had better outcomes even though these areas had previously not been coveredby regular health services. Both mixed and traditional providers’ catchment areas were com-parable in the sense that they were located close to main roads and towns, and residents hadaccess to providers outside their immediate areas.
After controlling for distance from a health facility, the performance of direct providerswas found to be very similar to that of traditional providers for nearly all indicators measured,which provides evidence that this model is a good alternative to traditional health services forthe basic health care package studied. This is a key finding, considering the more difficult con-ditions of delivering care in the PSS catchment areas where communities were more dis-persed and access more difficult. Although this study did not benefit from baseline data, it islikely that baseline indicators were worse at program onset (in 1997) in areas served by PSSs(and to a lesser extent, ADMSSs) than those in areas served by traditional health services.
Women from all of the three community groups are generally more satisfied with careprovided in community centers of ADMSS and PSS providers than care provided in HPs.Care is considered friendlier, and reported waiting periods are shorter. Problem resolutionand receiving needed medicine is similar to or better than the situation in HPs. However,
78 World Bank Working Paper
80. Some PSSs attributed low levels of vaccination coverage to the MSPAS supply system. Theyreported breakdown of logistics and communications between MSPAS districts and PSSs for the distrib-ution and storage of vaccines. Annex 2.2 describes problems in the distribution chain.

these findings may be related to lower expectations among the women who previously hadno access to care. Distances presumably hindered women from direct provider communitiesfrom using HPs and health centers and may have contributed to increased perceptions of sat-isfaction. Nevertheless, the study also finds that many women served by traditional providers“voted with their feet” and sought services in community centers in catchment areas servedby mixed and direct providers. Furthermore, women from traditional provider areas ratedcommunity centers higher on every indicator of satisfaction with care that was measured.
The provider survey found that PSSs demonstrate the highest costs as well as the highestproduction and labor productivity. They also appear more efficient in terms of effectivepopulation coverage. Contrarily, traditional providers show the lowest costs and levels ofproduction and productivity, and the mixed providers display generally intermediate levels.Having a physician on staff significantly raised the production of HPs, probably in responseto increased demand. However, productivity (output per worker) remained nearly equal tothat of HPs with only a nurse auxiliary.
The PSSs consistently outperformed the ADMSSs on production and productivity mea-sures (despite having a similar team composition and delivery models) while providing ser-vices in more distant, dispersed, and hard-to-access communities. They also did a better ofjob in delivering priority PBS interventions. Several explanations can be proffered regardingPSS performance. First, the higher average production for the PSSs could relate to the greaternumber of people residing in their catchment areas. Second, it is likely that there was pent-up demand among residents of PSS catchment areas, given the difficult access to otherproviders located in or near towns. Third, on average, PSSs had slightly more care-giving per-sonnel than ADMSSs (2.3 versus 2.0). A final explanation contributing to observed produc-tion and productivity may relate to the incentive system inherent in the contract.81 Unlike theADMSSs and HPs, the PSSs were fully responsible for nearly all inputs (except vaccines) aswell as the planning, management, technical oversight, and delivery of contracted services.In contrast, the ADMSSs relied on MSPAS staff, particularly rural health technicians, as wellas MSPAS technical management and oversight.82 The HPs were fully dependent on theMSPAS for supervision as well as all inputs and support activities. Higher productivity mayrelate to superior technical supervision provided by PSS management compared to super-vision of the mixed and traditional providers provided by MSPAS districts. Also, PSSs mayhave been more exacting in registering outputs than other providers. Nonetheless, the PSSswere facing additional pressures. As explained in chapter I in this volume, in 2000, the gov-ernment introduced elements of competition, particularly among direct model NGOs. Con-tract renewal depended on a performance review, and all new contracts were competitivelybid. For example, 24 NGO contracts were not renewed in 2000 because providers failed tomeet minimum performance standards and reporting requirements set by the MSPAS.Another 40 received conditional renewals. The MSPAS also reported that upon tendering thecancelled contracts in 2001, more NGOs submitted bids than there were available contracts.In sum, PSSs faced strong incentives to deliver the PBS to all communities in their catchmentareas as well as maintain production and financial records.
Health System Innovations in Central America 79
81. The higher observed productivity is consistent with other studies comparing the efficiency of pub-lic and private providers (Bitrán 1995; Levin and others 1999; Lavadenz 2001).
82. The ADMSSs were essentially input managers, hiring additional staff and purchasing and distrib-uting other inputs.
Direct providers are costly compared to the mixed and traditional alternatives. Servingdistant villages increased transportation costs and contributed to higher personnel costsbecause PSSs paid above-market salaries as well as travel stipends to attract and retain per-sonnel. For example, on average, PSSs spent nearly as much on transportation as the HPsspent on drugs and supplies. Further, all personnel hired by the PSSs were new to the MSPASsystem, which contributed to higher training costs. The typical PSS provider spent nearly 50 percent more on training alone than traditional providers spent on all inputs. Supervisioncosts were also high because PSSs often had to field and two or more teams to cover the com-munities in their assigned catchment areas. Nevertheless, when accounting for effective pop-ulation coverage and adjusting for the economic costs of volunteer doctors, training, andtransportation (not included in spending ledgers of traditional providers), PSSs are more effi-cient than both traditional and direct providers. In fact, the mixed providers have the highestper capita costs (for effective coverage), but the differences from traditional providers are notsignificant.
Findings Compared to National Data
National immunization rates from ENSMI 2002 were only slightly improved over immu-nization rates from ENSMI 1998–99, with full coverage increasing from 60 to 63 percent.However, these national averages mask substantial improvements during this period forindigenous children, whose full immunization coverage increased from 51 to 61 percent andnearly equaled that of ladino children, whose full coverage rates actually decreased slightlyfrom 65 to 63 percent. One of the questions raised is whether and how much extension ofcoverage contributed to these improved outcomes for indigenous children. Compared toimmunization rates provided by ENSMI 2002, mixed providers performed better than thenational average for every vaccine. Direct providers performed better for DPT3, polio3, andfull coverage but slightly worse for BCG and measles. Compared to national data for indige-nous children, all three groups did better than the national average. This suggests that exten-sion of coverage contributed to the increase in indigenous vaccination rates.
Compared to the national PNC coverage rate of 90 percent, coverage rates were slightlylower for women in mixed provider communities and much lower in direct provider com-munities. However, mixed and traditional communities had better PNC coverage when com-pared with indigenous women nationally (81 percent). First trimester care was lower for allproviders compared to the national average (51 percent) and to indigenous women nation-ally (38 percent). Tetanus toxoid coverage was similar among women who received PNC inmixed provider communities compared with the national average (64 percent) and betterthan for indigenous women nationally (60 percent).
Context and Caveats
Similar to the findings of Mills et al. (2004), interpreting the findings of contracting mod-els requires clarity regarding the contextual conditions related to model features, providerand location selection, and other factors affecting supply and demand.
Provider selection, location, and population coverage varied across models. First,providers were not assigned randomly to the catchment areas. Direct service providers werethe MSPAS’s model of choice for communities located farther from health services and were
80 World Bank Working Paper

assigned a priori to more difficult situations in terms of distance and road access.83 In mostcases, the ADMSS catchment areas were chosen by MSPAS district managers in consultationwith the rural health technicians assigned to ADMSS teams. According to SIAS authorities,there was a tendency to choose catchment areas with which the rural health technicians weresomewhat familiar and where they had easy access to towns where many resided. Second, thecatchment areas of the direct providers were on average geographically larger and more dis-persed, and they contained more population than those assigned to other providers. The gov-ernment decided it could not scale up its provider network in terms of staffing, purchasingand distribution of drugs and supplies, transportation, and training as rapidly as it couldthrough direct contracting of service provision to NGOs (PSSs). Third, the PSSs had to startfrom scratch in terms of recruiting and hiring personnel, training, and knowledge of MSPASnorms and procedures. Because the ADMSS and HP models used MSPAS personnel withample experience in rural health delivery who were clearly knowledgeable about the MSPASsystem, these providers had a clear advantage, at least at the outset. Finally, there were nobaseline measures to assess the degree of improvement that resulted from service provisionvia the new models. It is likely that the more distant, isolated communities served by directprovider NGOs had less access, less coverage, and consequently worse baseline measures atonset than the ADMSS catchment areas located near main roads and towns.
The intrinsic differences in the delivery models and team composition contributed todifferences in performance. The HPs applied a facility-based model rather than the outreach-based model of the other providers. Production was highly dependent on the staffing ofhighly motivated volunteer physicians from Cuba. The HPs performed admirably under theconditions of regular supplies and use of volunteer physicians. It is important that, evenaccounting for the economic costs of volunteer physicians, HPs were the least-cost providerof the group and provided PBS coverage similar to that of the PSSs. Low production wasrelated to a relatively limited number of assigned staff (1.5 per HP) and evidence from thehousehold survey that many residents in the catchment area had access to providers else-where. Few outreach activities were performed (except for vaccinations), thus the HPs didnot benefit from community facilitators who served as a liaison between delivery teams andthe communities for the mixed and direct providers. Though the HPs made use of volunteercommunity health workers and TBAs, the latter were not paid a stipend, as was the case fortheir counterparts working with PSS and ADMSS providers. Again, the stipend was an inputapplied to the outreach model and meant to cover expenses for travel among dispersed ruralhamlets. HPs without physicians displayed very low levels of production and productivity.Given the inability of the MSPAS to recruit and maintain Guatemalan physicians, filling thegap with volunteer foreign doctors was a short-term, but probably unsustainable, solution.
One of the objectives of the household study was to assess the demand for care frompopulations residing in the catchment areas of each of the three delivery models. Resi-dents of traditional and mixed provider catchments had choices unavailable to residentsof direct provider catchment areas. The results demonstrate a considerable amount ofcross-utilization of services such that performance in mixed and traditional providercommunities cannot necessarily be attributed solely to the assigned provider. Women
Health System Innovations in Central America 81
83. Although we tried to control for the greater difficulties in obtaining services at greater distancesby controlling for this in our regression analysis, there may be other factors associated with access besidesdistance that we did not control for.
from traditional provider (HP) catchment areas often used MSPAS health centers as well asdirect and mixed provider-operated community centers to which they have access. Com-munity centers, where care is provided by either direct or mixed providers, are not generallylocated near traditional provider areas, and women had to actively seek them out during themonthly visits by the itinerant teams. Likewise, women in mixed provider communitiesdemanded care from both HPs and health centers to which they had access. As noted, thelocation of mixed model (ADMSS) community centers near main roads and towns facilitatesuse of a range of providers. As expected, women residing in PSS catchment areas displayedsignificantly greater use of PSS-operated community centers. Travel time and distance pro-hibits easy access to other providers. In short, they were less likely to make the effort to go toan HP or health center to fill in needs between monthly provider visits.
Limitations
The research faced several limitations that impeded any definitive statement on identifyingthe superior delivery model. The data were cross-sectional, and there were no before and afterdata available. Although the communities appeared similar on many counts and we tried tocontrol for important differences, we were limited by the variables collected. There may beother explanations for the differences observed that we did not measure. These include basichealth determinants such as income and education, and determinants of quality such as thetraining of the provider (physician, nurse, and so on).
It is worth repeating that the substantial cross-utilization of services by the women fromthe communities studied makes interpretation of the findings difficult, particularly for mixedand traditional providers. Results for communities from one model’s catchment area cannotbe attributed solely to the assigned provider. The results are likely to be diluted, with differ-ences tending toward nil. However, these operational research findings reflect the reality ofmost communities and consumers of health care, and they should be interpreted in this light.
Conclusions and Policy Implications
The findings are important for situations like Guatemala’s, where there is a large populationwithout coverage and a commitment to expanding basic health services quickly and apply-ing the financing to do so. The SIAS model is limited by the types of services it can provide.For example, it is not an appropriate model for curative services of acute illnesses, given thatvisits are made only once a month. However, its focus on preventive services is attractivebecause of the greater cost-effectiveness and benefits of many preventive services and theassurance such a model could provide that services are reaching dispersed or marginalizedpopulations. All providers produced a low volume of PBS priority interventions except forvaccinations, which represented about 40 percent of all outputs for each provider84 whileaccounting for about 13 percent of costs. Clearly, a greater effort is needed to strengthen pro-vision of other PBS interventions across all providers. The overall low volume of outputsobserved for other PBS and priority interventions may relate to the weak monitoring andoversight by the MSPAS.85
82 World Bank Working Paper
84. In 2001, the MSPAS placed high priority on vaccination coverage.85. Monitoring by the MSPAS was more informal than systematic, as described in chapter I in this
volume.

Nevertheless, extension through NGO contracting is expensive. The MSPAS reportedspending US$61 million on contracts with direct and mixed providers between 1998 and2002. Accounting for overhead costs, coverage extension represented approximately 13 per-cent of the MSPAS budget in 2002. Supported by two loans from the Inter-American Devel-opment Bank, as well as grants from several bilateral agencies, financing has been sustainedfor more than eight years. Financial commitment of this magnitude may not be forthcom-ing in the future.
Direct providers are the most productive and expensive, displaying adequate levels of cov-erage but high levels of user satisfaction. The higher productivity and user satisfaction observedin Guatemala is consistent with NGO-contracting experiences elsewhere (Loevinsohn andHarding 2004). The evidence suggests that the mixed and traditional models are also effectivemodels yet display lower costs. However, they are unproven alternatives under the conditionsof the catchment areas where direct providers operated. Traditional providers were also highlydependent on volunteer physicians. In the past, the MSPAS has had difficulties in recruiting,managing, and retaining physicians for rural health services. Whether mixed and traditionalmodels could extend coverage in distant areas more efficiently or with equal or higher levelsof coverage and output than direct providers remains untested.
With the exception of immunizations, only a small portion of some priority PBS inter-ventions is actually being delivered by the three models. The lack of provision of growth mon-itoring is striking, particularly given the high prevalence of chronic (70 percent) and global(30 percent) malnutrition among indigenous children younger than five years old (ENSMI2002). Growth monitoring is an important primary care activity to identify infants and chil-dren at risk. It is not clear how much of the environmental health part of the PBS is providedby community health workers and rural health technicians. There is very limited provision ofthe “care of illnesses and emergencies” part of the package, although with proper supervisionand training, diseases such as malaria and tuberculosis could be identified and treated in thecommunity. Nevertheless, most of the diseases listed under “illnesses and emergencies,” as wellas acute diarrheal and respiratory illnesses among infants and children, often require imme-diate attention and cannot await the appearance of the outreach team. Obtaining better out-comes for these illnesses will require improvements in the referral and counter-referral systemsbetween communities and health services. This is a challenge for any type of outreach model.
Our findings are different from those in other studies in Cambodia and Bangladesh,which showed clear outcome improvements in using NGO services to provide basic pack-ages of care over those provided by traditional providers (Bhushan, Keller, and Schwartz2002; Mahmud 2002). There are many possible explanations, some of which have alreadybeen noted in this chapter: this is not a randomized trial; we are comparing findings at theend of a period of service provision and not before and after; and direct provider NGOs werespecifically selected to provide care in an area where the government did not think it couldrapidly scale up services. In addition, compared to the two countries where other studies havebeen carried out, Guatemala has a relatively well-developed and relatively long-standinghealth care delivery system (as do most countries in Latin America). Guatemala spends moremoney on health care, has a higher number of health professionals, and had much betterbaseline coverage rates for immunization and PNC. For instance, the national immunizationand PNC coverage rates for Cambodia before the intervention were 39 percent and 21 per-cent, respectively. The best rates achieved after the intervention were 40 percent. This com-
Health System Innovations in Central America 83

pares to national baseline coverage in Guatemala (ENSMI 1998–99) of 60 percent forimmunization and 58 percent for PNC. The traditional health services generally performbetter in Latin America and the Caribbean than in other parts of the world (better immu-nization rates, higher PNC coverage, lower infant mortality, and so forth) so the bar is sethigher for alternative models.
Nevertheless, inequities in Latin America and the Caribbean are among the largest inthe world, particularly in Guatemala. The added value that mixed providers supplied wasclearly observed, and direct provider NGOs did nearly as well as the other providers inareas with difficult access where the MSPAS had little or no historical presence. Thus, ourstudy suggests that contracting out services in areas and for population subgroups whosehealth outcomes lag behind those of the general population is an effective strategy toreduce inequities.
Annex 2.1
Annex 2.2 Vaccinations: Problems in the Distribution Chain
The comparatively low performance of PSSs in Quiché and Alta Verapaz (before controllingfor distance) related to vaccination coverage merits special attention. Guatemala used twoapproaches for its vaccination programs. One, a vertical approach used a centralized, top-down system of determining total demand for various vaccines for pregnant women, infants,and young children. The MSPAS conducted three to four annual vaccination campaigns,which were run centrally.
Under this National Immunization Program, the MSPAS was responsible for purchasing—on a large scale and a few times a year—all the vaccines required for that year.It developed its requirements in part based on information provided by the area directors,who had some latitude to modify their requirements based on local circumstances. Thesevaccines were in turn delivered to each district. Each district, in a cascading pattern, providedvaccines to the local health centers, which then passed on the required quantities to HPs.
Districts were also responsible for providing vaccines to PSS and ADMSS providersaccording to their projected requirements. District administrators, however, disputed thevalue of the quantities requested by the PSSs. They contended that there were many un-accounted for losses of vaccines and that it was difficult to monitor their appropriate use.PSSs claimed that the district administrators favored the MSPAS teams, whether affiliatedwith ADMSSs or HPs, and did not regularly communicate to the PSSs when supplies were
84 World Bank Working Paper
Annex Table 2.1.1. Number of Providers: National, Departments, and Sample, 2001–02
Provider type National In 4 sampled departments Sample
PSSa 154b 42 21
ADMSSa 24 12
HP 1,289 204 22
Total 1,443 270 55
a. Number of convenios (several NGOs had more than one contract).b. Number of signed convenios among 89 NGOs (approximately 60 percent were PSSs).Source: MSPAS-SIAS; provider survey.
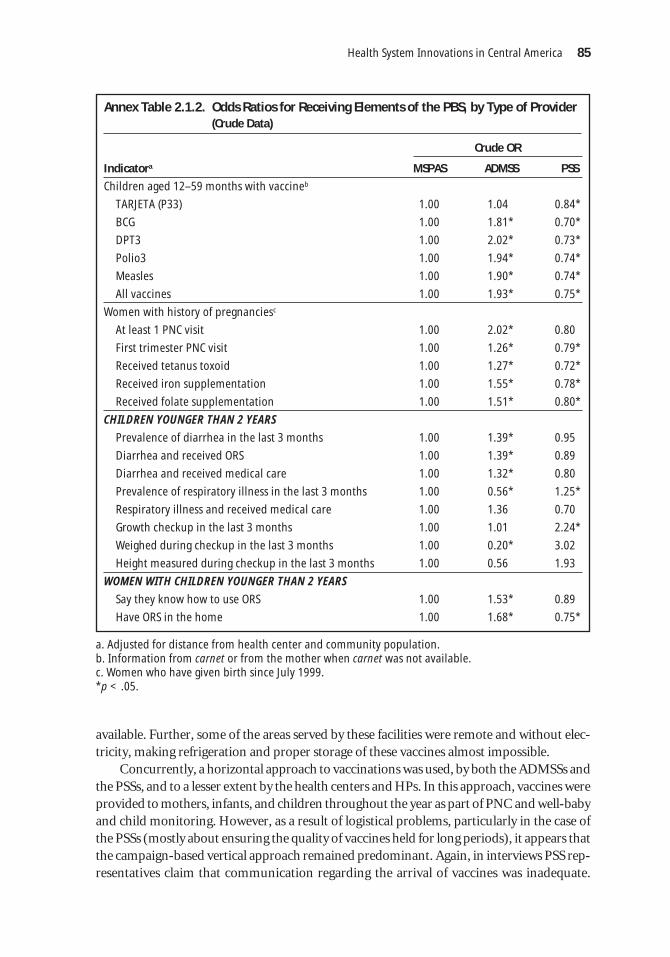
Health System Innovations in Central America 85
Annex Table 2.1.2. Odds Ratios for Receiving Elements of the PBS, by Type of Provider(Crude Data)
Crude OR
Indicatora MSPAS ADMSS PSS
Children aged 12–59 months with vaccineb
TARJETA (P33) 1.00 1.04 0.84*
BCG 1.00 1.81* 0.70*
DPT3 1.00 2.02* 0.73*
Polio3 1.00 1.94* 0.74*
Measles 1.00 1.90* 0.74*
All vaccines 1.00 1.93* 0.75*
Women with history of pregnanciesc
At least 1 PNC visit 1.00 2.02* 0.80
First trimester PNC visit 1.00 1.26* 0.79*
Received tetanus toxoid 1.00 1.27* 0.72*
Received iron supplementation 1.00 1.55* 0.78*
Received folate supplementation 1.00 1.51* 0.80*
CHILDREN YOUNGER THAN 2 YEARS
Prevalence of diarrhea in the last 3 months 1.00 1.39* 0.95
Diarrhea and received ORS 1.00 1.39* 0.89
Diarrhea and received medical care 1.00 1.32* 0.80
Prevalence of respiratory illness in the last 3 months 1.00 0.56* 1.25*
Respiratory illness and received medical care 1.00 1.36 0.70
Growth checkup in the last 3 months 1.00 1.01 2.24*
Weighed during checkup in the last 3 months 1.00 0.20* 3.02
Height measured during checkup in the last 3 months 1.00 0.56 1.93
WOMEN WITH CHILDREN YOUNGER THAN 2 YEARS
Say they know how to use ORS 1.00 1.53* 0.89
Have ORS in the home 1.00 1.68* 0.75*
a. Adjusted for distance from health center and community population.b. Information from carnet or from the mother when carnet was not available.c. Women who have given birth since July 1999.*p < .05.
available. Further, some of the areas served by these facilities were remote and without elec-tricity, making refrigeration and proper storage of these vaccines almost impossible.
Concurrently, a horizontal approach to vaccinations was used, by both the ADMSSs andthe PSSs, and to a lesser extent by the health centers and HPs. In this approach, vaccines wereprovided to mothers, infants, and children throughout the year as part of PNC and well-babyand child monitoring. However, as a result of logistical problems, particularly in the case ofthe PSSs (mostly about ensuring the quality of vaccines held for long periods), it appears thatthe campaign-based vertical approach remained predominant. Again, in interviews PSS rep-resentatives claim that communication regarding the arrival of vaccines was inadequate.

86W
orld Bank Working Paper
Annex Table 2.1.3 Average Monthly Production and Spending,a by Provider and Service Type, 2001
Direct (N = 21) Indirect (N = 12) Traditional (N = 22)
Category and Unadjusted Adjusted Unadjusted Adjusted Unadjusted Adjusted type of expenditures expenditurese expenditures expenditurese expenditures expenditurese
intervetion Outputs (Q) (Q) Outputs (Q) (Q) Outputs (Q) (Q)
PBS 24,391 919,271 932,642 12,234 323,579 347,128 13,506 170,985 341,012
Non-PBS 4,038 212,808 215,903 1,997 74,908 80,359 3,842 35,884 71,567
ARI care 2,612 129,896 131,786 1,314 45,723 49,050 1,273 22,452 44,778
Diarrhea care 927 94,020 95,387 235 33,095 35,503 427 16,284 32,476
PNCb 1,010 194,182 197,006 352 68,351 73,216 389 36,131 72,059
Well-baby checkupsc 2,658 3,058 3,103 218 1,076 1,155 594 466 930
Vaccinationsd 10,784 150,832 153,026 5,471 53,093 56,956 7,500 27,674 55,193
Other PBS services 6,400 347,284 352,335 4,616 122,242 131,139 3,322 67,989 135,576
All 28,429 1,132,079 1,148,545 14,231 398,487 427,487 17,348 206,869 412,578
Note: US$1 = Q7.9.a. Spending includes direct, overhead, and MSPAS administrative costs. Direct costs are weighted according to weights presented in table 2.3, except for the “all”category.b. Includes spending on iron fortification.c. Growth and development monitoring of children younger than 2 years old.d. Vaccinations for children and pregnant women (tetanus toxoid).e. Costs adjusted for volunteer physicians (all providers), training, and vehicle and administrative costs (HPs).Source: provider survey.

There were an undetermined number of instances in which providers had mobilized theircommunities but the supplies never arrived—or contrarily, supplies arrived but the PSSswere not informed.
Bibliography
Bhushan, I., S. Keller, and B. Schwartz. 2002. “Achieving the Twin Objectives of Efficiencyand Equity Contracting Health Services in Cambodia.” Economics and ResearchDepartment Policy Brief Series 6. Asian Development Bank, Manila.
Bitrán, Ricardo. 1995. “Efficiency and Quality in the Public and Private Sectors in Senegal.”Health Policy and Planning 10(3):271–83.
Eichler, R., P. Auxila, and J. Pollock. 2001. “Output-Based Health Care: Paying for Per-formance in Haiti.” Private Sector and Infrastructure Network Note 236. World Bank,Washington, D.C.
ENSMI. 1998–99. Encuesta Nacional de Salud Materno-Infantil 1998–1999. Guatemala City.———. 2002. Encuesta Nacional de Salud Materno-Infantil 2002. Guatemala City.Lavadenz, Fernando. 2001. “Redes públicas, descentralizadas y comunitarias de salud en
Bolivia.” Pan American Journal of Public Health 9(3):182–89.Levin, Ann, Mark McEuren, Vito Tanzi, Gerry Van Dyck, and Nino Sekyere-Boakye. 1999.
“Costs of Maternal Health Care Services in South Kwahn District, Ghana.” Special Ini-tiative Report 20. ABT Associates, Bethesda, MD.
Loevinsohn, Benjamin, and April Harding. 2004. “Contracting for the Delivery of Com-munity Services: A Review of Global Experience.” HNP Discussion Paper. WorldBank, Washington, D.C.
Mahmud, H. 2002. “Mid-Term Health Facility Survey—Urban Primary Health Care Pro-ject. Bangladesh.” Mitra and Associates, Manila.
Marek, T., I. Diallo, B. Ndiaye, and J. Rakotosalama. 1999. “Successful Contracting of Pre-vention Services: Fighting Malnutrition in Senegal and Madagascar.” Health and Policyand Planning 14(4):382–89.
Mills, A., N. Palmer, L. Gilson, D. McIntyre, H. Schneider, E. Snanovic, and H. Wadee.2004. “The Performance of Different Models of Primary Care Provision in SouthernAfrica.” Social Science & Medicine 59:931–43.
Ministerio de Salud y Assistencia (Ministry of Health and Social Protection [MSPAS]).2000a. “Sistema Integral de Atención a la Salud.” Guatemala City. Processed.
———. 2000b. “La modernización de la salud pública en Guatemala.” Guatemala City.Processed.
Palmer, N. 2000. “The Use of Private-Sector Contracts for Primary Health Care: Theory,Evidence and Lessons for Low-Income and Middle-Income Countries.” Bulletin of theWorld Health Organization 78(6):821–29.
Slack, K., and W. Savedoff. 2001. “Public Purchaser-Private Provider Contracting forHealth Services: Examples from Latin America and the Caribbean.” Sustainable Devel-opment Department Technical Papers Series. Inter-American Development Bank,Washington, D.C.
Soderlun, N., P. Mendoza-Aran, and J. Goudge, eds. 2003. The New Public/Private Mixin Health: Exploring the Changing Landscape. Geneva: The Global Forum for HealthResearch.
Health System Innovations in Central America 87


CHAPTER 3
89
The San Miguelito HospitalReform in Panama—
Evaluation and Lessons
Ricardo Bitrán, Cecilia Má, and Paulina Gómez
Abstract
Located in Panama’s San Miguel region, the newly opened Hospital IntegradoSan Miguel de Arcángel (Hospital San Miguelito, also known as HISMA), hasbrought several innovations to that country’s government health sector. A specially created purchasing entity, CONSALUD, pools the regional financialresources of the Ministry of Health (MOH) and the Social Security Institute(SSI) and purchases, or contracts out, services from HISMA using a simple buteffective prospective payment system. HISMA’s board, in turn, purchases oroutsources all medical and support services from outside private firms owned bydoctors, other health professionals, managers, accountants, cleaning and cateringservices, and so on. Thus, HISMA does not have any staff other than its boardand the small group of experts who monitor contractor compliance by outsideproviders. In 2000, one year into its operation, the MOH and the World Banksponsored an evaluation of HISMA. This paper presents the findings from thateffort. The performance of HISMA, measured in terms of technical and economicefficiency, and in terms of quality of care, was compared with that of two controlhospitals run with the traditional approach of historic budgets and fixed staff.These were Chepo Hospital, property of the SSI, and Solano Hospital, property ofthe MOH. The evaluation found that HISMA outperforms the control hospitalsin nearly every aspect: its unit costs of production are for the most part lowerthan those of Chepo and Solano, the productivity of its medical contractors ishigher than that of the medical staff of the control hospitals, and the quality ofcare is considerably superior to that of the controls. Thus, the evaluation of theHISMA model is highly favorable. Unfortunately, the strong resistance seen inPanama to changing the status quo and expanding HISMA’s model attests to thedifficulties, faced in this country and elsewhere in Latin America, of promotingpolicies that favor beneficiaries in an environment dominated by interest groups.

Introduction and Objectives
The management model adopted in 2000 by Panama’s Hospital Integrado San Miguel deArcángel (Hospital San Miguelito [HISMA]) is a revolutionary public policy initiative; draw-ing lessons from this experience can be useful to Panama and to other low- and middle-incomecountries. Located in Panama’s San Miguel region, HISMA combines four innovative features.
First, in San Miguel, the Ministry of Health (MOH) and the Social Security Institute(SSI) pool their financing into CONSALUD, a public entity set up with the specific aim ofenabling public payers of health care to buy services from public and private providers bymeans of innovative purchasing strategies. In turn, CONSALUD purchases hospital ser-vices from HISMA on behalf of the MOH and SSI, and thus pays for the hospital’s financ-ing and recurrent costs.86 Through this arrangement, HISMA became the single commonprovider of hospital services for the beneficiary populations of these two entities in theregion. HISMA’s model contrasts sharply with that found in most developing countries,where institutions such as the MOH and the SSI possess separate health systems for theirrespective beneficiary populations. For efficiency reasons, many such countries aspire tointegrate both systems. In Peru, for example, the independent operation of these institu-tions’ systems implies major inefficiencies, arising from duplication and underutilizationof physical and human resources. In Panama, outside the San Miguel region, the MOH andSSI continue to run their parallel health systems, duplicating and often underusing hospi-tals and ambulatory health care facilities.
Second, CONSALUD purchases hospital services from HISMA on the basis of aprospective payment system, paying HISMA according to previously agreed prices for eachhospital discharge, outpatient surgery, and emergency visit. Thus, HISMA receives fromCONSALUD an amount of revenue that is directly linked to the types and volumes of ser-vices it provides. This financing system is in stark contrast with the system in place in mostpublic hospitals in Latin America. Those providers typically receive a fixed budget thatvaries only marginally year after year, and which is only weakly linked to the volume andtypes of services actually produced.
Third, HISMA is headed by the HISMA board, an administrative entity whose mainresponsibility is to purchase management, medical, and other types of services from exter-nal service companies on behalf of HISMA. Indeed, as opposed to traditional public hospi-tals, HISMA has practically no medical or administrative employees. The services HISMAneeds to function, such as accounting, cleaning, diagnostic procedures, and the diversemedical care services, are not produced by internal personnel, but are instead contractedout by HISMA to third parties. These are external private companies, made up of medicaland nonmedical professionals that supply HISMA with the services it needs. This out-sourcing model solves a common problem faced by health ministries and social securityinstitutions in Latin America: excess personnel that cannot be fired and personnel needsthat cannot be met because of restrictive civil service and other laws.
Fourth, HISMA comanages a network of referrals and counter-referrals with the healthcenters and clinics in its catchment area. This too is an innovation in the regional context,
90 World Bank Working Paper
86. To date, CONSALUD has been used only in the context of the HISMA initiative. Recently therehave been proposals to contract out primary health care services through CONSALUD, but they have notmaterialized.

where formal referrals between ambulatory facilities and hospitals in the public sector arerare or lacking altogether.
Each of these innovations deserves a performance analysis—and so much the more,all of them together—because they constitute a unique experience. This chapter presentsthe findings of an assessment of HISMA’s experience at the end of its first year of opera-tions. The assessment was part of a more comprehensive reform program financed byPanama’s MOH and a loan from the World Bank.
The chapter is organized as follows. The second section presents a brief review of the lit-erature on the issue of hospital reforms and contracting for health services in the public sec-tor of developing countries. The third section contributes further information on the genesisof the CONSALUD-HISMA project and on this model’s characteristics. The fourth sectiondescribes the study’s methodology. The fifth section presents the main findings, and the sixthsection proposes public policy conclusions. All the information presented on the HISMAmodel’s assessment has been drawn from Bitrán and others (2001) unless otherwise indicated.
International Experience
The HISMA model comprises three distinct innovations addressed in the literature onhealth sector reform. The first, hospital autonomization or corporatization, is the policyby which public hospitals are granted greater independence from a central governmentagency (a ministry of health or a social security institute) and can therefore exert more con-trol over matters such as hiring and firing of health personnel and purchasing and sellingof other production inputs and medical services. The second, purchaser-provider split,denotes the policy by which the payer and provider of health services, traditionally mergedas one sole entity in the public sector, are separated into two different entities, giving riseto a contract between purchaser and provider, and a payment system. The third, contract-ing out, denotes two possible situations: one where the public payer, operating under apurchaser-provider split arrangement, decides to purchase hospital or primary care ser-vices from a private provider; and another, outsourcing, where a provider of health ser-vices seeking to improve economic efficiency chooses to buy some of the services it needsfrom outside sources, rather than produce them internally.
In developing countries, the reform of public hospitals lies at the center of the publicpolicy debate on health. In their review of experiences in hospital autonomization, Govin-daraj and Chawla (1996) identified two main justifications for this policy. First, public hos-pitals consume an important part of government health budgets. This limits government’sability to reallocate additional financial resources to pay for other services, such as primarycare and preventive maternity and baby care, which are more cost effective than most hos-pital care and for which there is unmet demand. Second, there is concrete evidence thatpublic hospitals in these countries operate at low efficiency levels, therefore a significantpart of their expenses constitutes a waste of scarce public resources.
These authors’ arguments coincide to some extent with those presented by Over andWatanabe (2003). The latter characterize the political context in which the debate on hos-pital reform takes place (first column of Table 3.1) and recommend politically sensitiveareas that should be tracked through monitoring so as to evaluate hospital performance(second column).
Health System Innovations in Central America 91
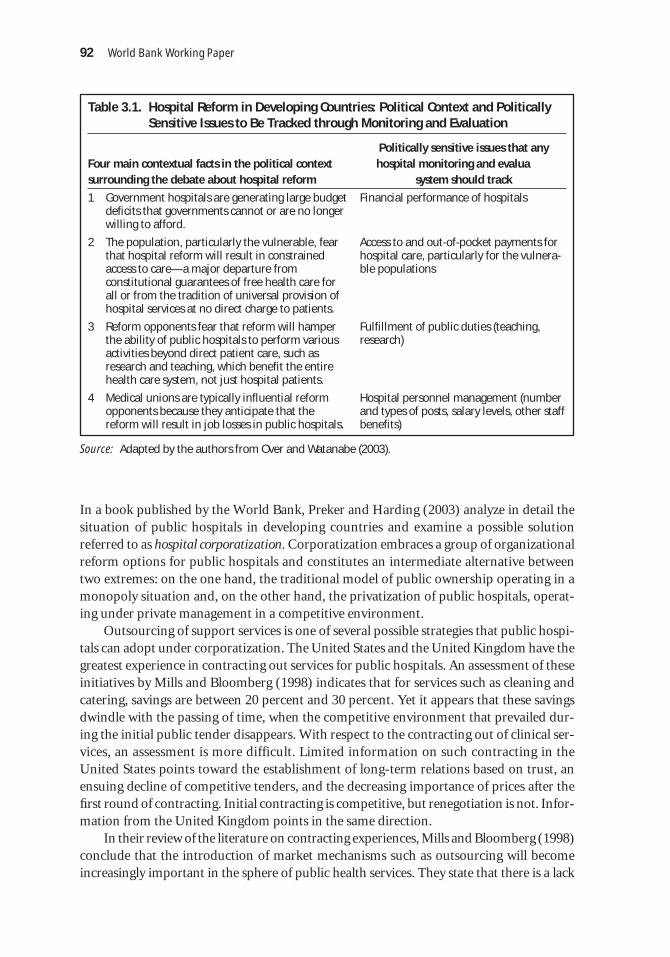
In a book published by the World Bank, Preker and Harding (2003) analyze in detail thesituation of public hospitals in developing countries and examine a possible solutionreferred to as hospital corporatization. Corporatization embraces a group of organizationalreform options for public hospitals and constitutes an intermediate alternative betweentwo extremes: on the one hand, the traditional model of public ownership operating in amonopoly situation and, on the other hand, the privatization of public hospitals, operat-ing under private management in a competitive environment.
Outsourcing of support services is one of several possible strategies that public hospi-tals can adopt under corporatization. The United States and the United Kingdom have thegreatest experience in contracting out services for public hospitals. An assessment of theseinitiatives by Mills and Bloomberg (1998) indicates that for services such as cleaning andcatering, savings are between 20 percent and 30 percent. Yet it appears that these savingsdwindle with the passing of time, when the competitive environment that prevailed dur-ing the initial public tender disappears. With respect to the contracting out of clinical ser-vices, an assessment is more difficult. Limited information on such contracting in theUnited States points toward the establishment of long-term relations based on trust, anensuing decline of competitive tenders, and the decreasing importance of prices after thefirst round of contracting. Initial contracting is competitive, but renegotiation is not. Infor-mation from the United Kingdom points in the same direction.
In their review of the literature on contracting experiences, Mills and Bloomberg (1998)conclude that the introduction of market mechanisms such as outsourcing will becomeincreasingly important in the sphere of public health services. They state that there is a lack
92 World Bank Working Paper
Table 3.1. Hospital Reform in Developing Countries: Political Context and PoliticallySensitive Issues to Be Tracked through Monitoring and Evaluation
Politically sensitive issues that any Four main contextual facts in the political context hospital monitoring and evaluasurrounding the debate about hospital reform system should track
1 Government hospitals are generating large budget deficits that governments cannot or are no longer willing to afford.
2 The population, particularly the vulnerable, fear that hospital reform will result in constrained access to care—a major departure from constitutional guarantees of free health care for all or from the tradition of universal provision of hospital services at no direct charge to patients.
3 Reform opponents fear that reform will hamper the ability of public hospitals to perform various activities beyond direct patient care, such as research and teaching, which benefit the entire health care system, not just hospital patients.
4 Medical unions are typically influential reform opponents because they anticipate that the reform will result in job losses in public hospitals.
Financial performance of hospitals
Access to and out-of-pocket payments forhospital care, particularly for the vulnera-ble populations
Fulfillment of public duties (teaching,research)
Hospital personnel management (numberand types of posts, salary levels, other staffbenefits)
Source: Adapted by the authors from Over and Watanabe (2003).

of information on the concrete impact of outsourcing on costs, efficiency, quality, and otherdimensions of performance, and they point out that the literature has concentrated more onthe promotion of contracting policies than on examining them in detail first. Despite theexistence of successful experiences in contracting, Mills and Bloomberg note that valid crit-icisms persist of the possible impacts of such policies—for example, in terms of health sys-tem equity. Finally, they also note that the existing literature contains little discussion of howto carry out an assessment of these initiatives. The authors consider that the key variable inevaluating contracting experiences in public hospitals is the marginal cost of contracted ser-vices and its comparison to the marginal cost of direct production. However, they recognizethat the measurement of marginal costs in hospitals constitutes a methodological challenge.
In developing countries, the evidence is still scanty and assessments incipient. However,Govindaraj and Chawla (1996) conclude that the outcomes obtained to date, although scarceand preliminary, are not encouraging:
Success with autonomy in public sector hospitals in developing countries has been limited, andthere have been few gains in terms of efficiency, quality of care, and public accountability. . . .it is as much the confused and erroneous ideas of autonomy, as the poor implementation ofthe autonomy measures, which have been responsible for the relative lack of success of theautonomy initiative. (p. 35)
In recent years, the contracting out of primary health care from private providers hasbecome widespread in the developing world. Loevinsohn (2001) documented the experi-ence of Cambodia, a country that developed a large-scale pilot plan to assess the advan-tages of different modalities for the contracting out of primary care. The preliminarylessons drawn from this experience suggest that rewarding providers according to resultsand management autonomy, based on a clearly defined contract with explicit service deliv-ery targets, is an efficient tool for increasing efficiency, effectiveness, and quality.
Eichler, Auxila, and Pollack (2001) reported on their findings from a study about thecontracting out of primary health care by nongovernmental organizations (NGOs) inHaiti. The Haitian experience is important because it exposes problems arising from inad-equate contract design. For example, if the providers are funded to pay for operating costs,they have no incentives to improve productivity, management, and operations, or toincrease coverage and enhance quality. Eichler and her colleagues demonstrate that mod-est economic incentives, equal to approximately 5 percent of the NGO contracts, can exerta significant and positive impact on the behavior and performance of these entities. Fur-thermore, the authors warn against “beginners’ mistakes.” For example, these include notspecifying in the contract what will happen if the specified goals are not attained, or allow-ing the creation of monopolies through contracts handing over geographic zones to onlyone NGO for several years. Finally, they point out the minimum conditions for contract-ing out, such as knowing the beneficiary population and ensuring that the indicators deter-mining payment are relevant, verifiable, and under the NGO’s control.
Genesis of HISMA and Description of the Model
In 1996, the government of Panama started the Health Sector Reform Project, the firstcomponent of which established a new management, organizational, and service provision
Health System Innovations in Central America 93

model in the San Miguel Health Region. The project’s objectives were to modernize hos-pital management, improve integration of the public network of health care providers inthe region (HISMA and ambulatory health care facilities in its catchment area), and over-come efficiency and service quality problems. A strategic alliance between the SSI and theMOH was established as part of the model to finance hospital services, and the necessarylegal entities were created for purchasing (CONSALUD, a private institution) and provid-ing (the HISMA board).
As already noted, a central element in the new hospital management model adoptedby HISMA is contracting out or outsourcing intermediary and final services (see Box 3.1and Figure 3.1). Every three years, HISMA launches a competitive bidding process to con-tract out clinical and ancillary services. Within HISMA, the entity responsible for manag-ing external contracts is the HISMA board. Box 3.1 describes the services contracted outby the HISMA board. Through external contracting, HISMA embarked on an operatingregime wherein its service providers were financed according to their real production, aswas HISMA when it received financing from CONSALUD according to its production.
HISMA began operations in December 1998. For the first time in Panama, MOHhealth services were integrated with those of the SSI. Also for the first time, a public hos-pital in Panama adopted referral and counter-referral systems in coordination with theambulatory health care facilities under its jurisdiction.
In 1999, the MOH and SSI endowed CONSALUD with US$13,500,000.87 CONSALUDfinances HISMA through a regulatory contract controlling the quantity, costs, and quality
94 World Bank Working Paper
Box 3.1. Outsourcing of Services by HISMA
HISMA does not produce services of any kind, whether administrative, medical, or support. Allthese services are purchased by the HISMA board from third parties. In order to do this, it hasestablished controlled purchase contracts with payment conditioned on the outcomes of periodicperformance assessments of each provider contracted. The services contracted out by HISMA arelisted below.
Services Contracted Out by HISMAFinal medical services Intermediary medical General services (purchased from 6 companies services (purchased (purchased from of doctors and nurses) from 5 companies) 3 companies)
Outpatient visits Laboratory Nutrition
Inpatient Diagnostic imaging Dietitian
Vaginal and caesarean deliveries Special procedures Accounting
Surgical interventions Pharmacya Cleaning
Emergency servicesb Security
a. The pharmacy service was assumed by the HISMA board as of April 2000.b. The general emergencies service was assumed by the HISMA board as of January 2001.
87. Panama’s official currency is the balboa (B). The exchange rate in Panama during the periodinvolving the assessment (2000) was (and continues to be as of April 2005) B 1 to US$1. All figures in thischapter are in 2002 dollars.

Health System
Innovations in Central America
95
Figure 3.1. The HISMA Model
Social Security Institute Ministry of Health
CONSALUD
HISMA Board
Financing of CONSALUD through regular budget transfers
Financing of CONSALUD through
regular budget transfers
Fee-for-service (FFS) purchasing of clinical and support services from external service
providers
Financing of HISMA Foundation through payment based on Basic
Service Units, including (a) hospital discharges, (b)
ambulatory surgeries, and (c) emergencies
San Miguel de Arcángel(HISMA) Hospital
Service provision
Private producers offinal clinical services
Private producers of intermediate clinical services
Private producers ofgeneral services

of the services that HISMA produces for CONSALUD. The latter entity finances its ownexpenses through the interest on endowments from the MOH and SSI. These amountedto roughly US$100,000 in 1999.
CONSALUD paid HISMA prospectively on the basis of three broad categories of ser-vices: hospital discharges or hospitalizations, outpatient surgeries, and emergency visits.Prospective payment means that the price paid by CONSALUD to HISMA was establishedprior to provision on the basis of cost studies that yielded the following prices: US$319 perhospital discharge, US$199 per outpatient surgery, and US$40 per emergency visit.
To cap spending, CONSALUD established annual production ceilings for each servicecategory, as follows: 21,630 hospitalizations, 3,996 outpatient surgeries and 85,512 emer-gency consultations. In addition, to finance fixed costs, CONSALUD paid the HISMAboard US$700,000 per month. When production ceilings are trespassed, CONSALUD stillreimburses HISMA but on the basis of a lower unit cost to limit incentives for HISMA toinduce excessive demand.
96 World Bank Working Paper
Table 3.2. HISMA Production Ceilings for 1999 (US$)
Output Output ceilings Cost Global budget
Hospitalizations 21,630 319 6,899,970
Outpatient surgeries 3,996 199 795,204
Emergency visits 85,512 40 3,420,480
Total — — 11,115,654
— Output ceilings were defined separately for the three categories of output, but not for the total.Source: Contract signed between CONSALUD and HISMA (1999).
CONSALUD audits the bills submitted by HISMA before authorizing payments. Whatis more, the HISMA board’s purchases require the previous authorization of the Comp-troller of the Republic.
The external companies contracted by the HISMA board started their contracts inOctober 1998; by 2001, only the nutrition companies had been replaced. Payment of thesecompanies was conditional on a quality assessment of the services delivered according totwo criteria: technical quality and user satisfaction. HISMA hired experts to carry out med-ical and other service audits. These auditors were responsible for conducting periodicassessments of compliance by outside providers with previously defined service specifica-tions, including health care treatment protocols. User satisfaction was measured by meansof monthly surveys of the users of the various services under outsourcing. If the assess-ments showed noncompliance with service specifications or user dissatisfaction, then pay-ments to the contractor were withheld or reduced.
Methodology
Two hospitals similar to HISMA—Chepo Hospital, owned by the SSI, and Nicolás SolanoHospital, the property of the MOH—were selected as a basis of comparison to examineHISMA’s relative performance (see Table 3.3 and Figure 3.2). Both hospitals operate under

Health System Innovations in Central America 97
Table 3.3. General Characteristics of HISMA, Chepo, and Solano Hospitals (1999)
Characteristic HISMA Chepo Solano
Population in 497,000 91,786 252,465catchment area
Beds 216 87 inpatient 172 inpatient
(24 observation) (26 observation)
Doctors 107 67
Nurses 98 55
Nurse assistants 79 62
Doctor hours 816 511 460
Nurse hours 778 520 440
Hospital discharges 12,755 5,270 8,938
Bed occupancy rate 48 72 68
Average length of 3.2 4.0 4.7stay in days
Clinical services ♦ Medicine ♦ Medicine ♦ Medicine
♦ Surgery ♦ Surgery ♦ Surgery
♦ OB/GYN ♦ OB/GYN ♦ OB/GYN
♦ Pediatrics ♦ Pediatrics ♦ Pediatrics
♦ Dentistry ♦ Dentistry
Medical specialties ♦ General surgery
♦ Internal medicine ♦ Internal medicine
♦ Cardiology ♦ Cardiology
♦ Trauma ♦ Trauma
♦ Orthopedics ♦ Orthopedics ♦ Orthopedics
♦ Ophthalmology ♦ Ophthalmology ♦ Ophthalmology
♦ Ear, nose, and throat ♦ Ear, nose, and throat ♦ Eye, ear, and nose
♦ Maxillofacial surgery ♦ Maxillofacial surgery
♦ Pneumology ♦ Pneumology
♦ Psychiatry ♦ Psychiatry
♦ Urology
♦ Plastic surgery
♦ Hematology
♦ Oncology
♦ Dermatology
♦ Allergy-immunology
♦ Gastroenterology
♦ Physiatry
♦ Occupational health
♦ OB/GYN obstetrics and gynecology.

98W
orld Bank Working Paper
Figure 3.2. Health Care Networks, HISMA, and Control Hospitals
Th
ird
leve
l of
care
(nat
ion
al r
efer
ral
ho
spit
als)
San Miguel Health Region
Eastern Panama Health Region
Sec
on
d le
vel o
f ca
re(r
egio
nal
ho
spit
als)
Fir
st le
vel o
f ca
re(a
mb
ula
tory
hea
lth
cen
ters
)
ArnulfoAriasHospital Complex
(SSI)
SantoTomásHospital(MOH)
Children’sHospital(MOH)
NationalCancerHospital(MOH)
PsychiatricHospital(MOH)
HISMAHospital San
Miguel Arcángel(MOH and SSI)
ChepoRegional
Hospital (SSI)
NicolásSolanoHospital (MOH)
8 healthcenters(MOH)
2 polyclinics2 local
primary careunits
(“ULAPS”)(MOH)
9 health centers
1 polyclinic(MOH)
1 polyclinic(SSI)
5 healthcenters11 sub-healthcenters
33 healthposts (MOH)
3 polyclinics2 local
primary careunits
(“ULAPS”)(SSI)
Western PanamaHealth Region
Referral andcounter-referralsystem
the traditional management model common to all public hospitals in Panama. This meansthat they are subject to historical, supply-side budgets that vary only marginally from yearto year and are not adjusted to reflect output; they have medical and other staff on their pay-roll, who in practice they cannot fire or motivate financially to improve quality or produc-tivity, and who produce internally all of the medical services the hospital delivers as well asthe nonmedical services it consumes (for example, accounting, laundry, nutrition). All threehospitals deliver more or less the same kinds of health services to similar populations, andthey are also comparable in terms of complexity and service mix. Small differences in themedical specialties available in the hospitals were deemed marginal in this comparativeanalysis of performance: most of the specialties that differ from hospital to hospital are inter-nal medicine subspecialties that do not involve inpatient care. The presence of an oncolo-gist at Solano Hospital could constitute a major difference in service mix, although tumorsdo not constitute one of the top 10 discharge categories. The three hospitals differ in size,and this was taken into account in the analysis. HISMA is the largest of the three hospitals,with 216 beds and 6 operating rooms; Solano Hospital is second in size, with 172 beds and5 operating rooms; Chepo Hospital is the smallest, with only 87 beds and 2 operating rooms.Other things being equal, HISMA’s larger size could result in relatively lower average costs,because it could spread its fixed costs over a larger volume of output than Chepo or Solano.
The study methodology was a comparative analysis between HISMA’s performanceand that of the two control hospitals. Primary information was collected for the analysisby means of surveys, interviews, and data gathered in the three hospitals as well as in theambulatory facilities in their catchment area. Several secondary sources of informationwere also resorted to. This research addressed two main questions: (1) Does HISMA out-perform the other hospitals? (2) If so, why?
To answer the first question, the researchers constructed the performance indicatorsshown in Table 3.4 and compared them among the three hospitals. These indicators weregrouped into three major categories: output, efficiency, and quality of care. Output indi-cators comprise measures of the volume of production of inpatient and outpatient servicesin the hospitals (for example, annual number of surgical interventions performed). Effi-ciency indicators relate output data with information on the resources required to producethat output (for example, annual number of hospital discharges per bed).
This research assessed three dimensions of quality. Clinical management-related qual-ity was assessed using several indicators, applying an accreditation guideline, applying a usersatisfaction survey, and measuring waiting times and rejection rates. Technical quality is gen-erally measured with two indicators: nosocomial infection rate (NIR) and percentage of com-plications; however, this was not possible because only HISMA kept NIR records for 1999and none of the three hospitals registered readmissions and reinterventions for that year.Quality in terms of user satisfaction was assessed through surveys to explore general stan-dards of care, access, and timeliness; availability of drugs; staff manners with patients; com-fort and hotel amenities; medical quality tracers; and the patient’s overall perception of care.
Findings
Study findings are presented separately for the three performance indicator groups—output,efficiency, and quality.
Health System Innovations in Central America 99

♦ Discharges per bed
♦ Bed occupancy rate
♦ Bed turnover rate
♦ Major surgical interventionsper operating room
♦ Average length of stay in days
♦ Ancillary tests per discharge
♦ Inpatient ancillary tests perdischarge
♦ Imaging exams per discharge
♦ Drug prescriptions per discharge
♦ Cost per outpatient visit
♦ Cost per OB/GYN visit
♦ Cost per pediatric visit
♦ Cost per surgical visit
♦ Cost per surgical discharge
♦ Cost per medical discharge
♦ Cost per OB/GYN discharge
♦ Cost per pediatric discharge
♦ Cost per vaginal delivery
♦ Cost per caesarean delivery
♦ Average length of stay
♦ % caesarean of total births
♦ % live births of total births
♦ Emergency surgery/plannedsurgery index
♦ Death rate
♦ Compliance with accreditationstandards for management
♦ Compliance with accreditationstandards for support services
♦ Compliance with accreditationstandards for clinical services
100 World Bank Working Paper
Table 3.4. Selected Performance Indicators
Output Efficiency Quality
♦ Discharges
♦ Emergency visits
♦ Outpatient visits
♦ Surgical interventions
♦ Emergency visits per discharge
♦ Outpatient visits per discharge
♦ Surgical interventions per discharge
Table 3.5. Summary of Output Performance Indicators
Output indicators HISMA Chepo Hospital Solano Hospital
Discharges 12,755 5,270 8,938
Discharges per hundred population 2.6 5.7 3.5
Emergency visits 112,539 16,805 64,352
Emergency visits per person per year 0.22 0.18 0.25
Outpatient visits 20,652 26,209 17,090
Surgical interventions 6.927 2,256 3,506
Emergency visits per discharge 8.8 3.2 7.2
Outpatient visits per discharge 1.6 5.0 1.9
Surgical interventions per discharge 0.5 0.4 0.4
Output
HISMA’s per capita hospitalization rate of 2.6 percent was the lowest of the three hospi-tals, a finding that may be explained by HISMA’s relatively short life (see output perfor-mance indicators in table 3.5). A comparison of per capita outpatient visit rates among the

three hospitals is not appropriate because of differences in their ambulatory output struc-ture. In particular, Chepo Hospital has a first-class outpatient clinic.
HISMA’s emergency visit rate was 9 percent higher than that of Solano Hospital and30 percent above that of Chepo Hospital. The first-year emergency visit target set forHISMA was 85,521—therefore, the actual number, 112,539, was nearly one-third higher.Although it is not entirely out of line with the rates observed in the other two hospitals, itwas unclear to the researchers why such a high rate took place. HISMA’s output structurewas more surgery intensive than that of the reference hospitals, probably because ofHISMA’s greater ability to perform certain kinds of outpatient surgical procedures.
Efficiency
Technical efficiency. HISMA’s doctor and nurse productivity were the highest of thethree hospitals for emergency visits and surgeries and the second highest for discharges(see Table 3.6). In contrast, HISMA’s total doctor productivity for outpatient visits wasthe lowest, possibly reflecting HISMA’s mandated focus on inpatient care. In fact, HISMAdoes not provide outpatient visits on demand, but only to patients before or after theirhospitalization.
Health System Innovations in Central America 101
88. As can be seen from Table 3.8, production categories were broadly defined, and this could introducesome ambiguity into the interpretation of results as regards efficiency comparisons. Future comparisons ofunit costs of HISMA and control hospitals should try to adjust results for case mix.
Table 3.6. Physician and Nurse Productivity
Output-to-input ratios HISMA Chepo Hospital Solano Hospital
Discharges per physician hour 15.6 11.5 17.5
Discharges per nurse hour 16.4 12.0 17.2
Emergency visits per physician hour 138.0 37.0 126.0
Outpatient visits per physician hour 25.0 57.0 33.0
Total visits per physician hour 163.0 94.0 159.0
HISMA generally exhibited higher technical efficiency, as measured by output-to-inputratios, than the control hospitals (Table 3.7). Yet at the same time, HISMA’s bed occupancyrate was well below that of the control hospitals, partly because of HISMA’s younger age (seeabove) and partly also because of this hospital’s relatively shorter hospital stays of 3.2 days(versus 4.0 in Chepo and 4.7 in Solano).
Economic efficiency. Economic efficiency at the three hospitals was measured on the basisof unit costs (see Table 3.8).88 These were computed as the sum of direct and indirect costs,using a step-down approach to allocate the latter to the various output categories. Directcosts included labor, drugs, surgical materials, and other inputs. Indirect costs includedmanagement, utilities, and various general services. Fixed asset depreciation was notincluded in the unit cost calculation because no accurate information on the market value

of fixed assets could be obtained from Chepo and Solano Hospitals. HISMA’s unit cost ofgeneral outpatient visits was by far the highest of the three hospitals, reflecting HISMA’slower relative productivity and its lack of emphasis on general outpatient care (see above).Much of the difference in costs was ascribed to HISMA’s higher spending on medicines.In contrast, the unit cost of obstetrical and gynecological (OB/GYN) visits was lower inHISMA that in Chepo Hospital, and HISMA’s unit cost of pediatric visits, at US$30, wassimilar to Chepo’s.
102 World Bank Working Paper
Table 3.7. Technical Efficiency Performance Indicators (number of units)
Performance indicators HISMA Chepo Hospital Solano Hospital
Discharges per bed 59 56 52
Bed occupancy rate 48 72 65
Bed turnover rate 68 56 52
Major surgical interventions per operating room 1,154 1,110 560
Average length of stay in days 3.2 4.0 4.7
Ancillary tests per discharge 14.9 143.6 51.0
Inpatient ancillary tests per discharge 4.7 38.5 21.0
Imaging exams per discharge 2.4 11.9 1.6
Drug prescriptions per discharge 26.0 2.2 25.2
Table 3.8. Economic Efficiency Performance Indicators(US$)
Performance indicators HISMA Chepo Hospital Solano Hospital
Cost per general physician outpatient visit 56 27 38
Cost per OB/GYN visit 21 32 NA
Cost per pediatric visit 30 29 NA
Cost per other specialty visit 30 17 37
Cost per surgical discharge 516 900 809
Cost per medical discharge 550 545 778
Cost per OB/GYN discharge 369 211 244
Cost per pediatric discharge 474 495 510
Cost per vaginal delivery 152 265 237
Cost per caesarean delivery 156 439 291
NA not available.
HISMA exhibited lower unit costs of inpatient care than the two other hospitals for allservices except obstetric discharges other than deliveries. For some services, these differ-ences were considerable. For example, at US$516, the average cost of a surgical discharge atHISMA was 60 percent lower than the equivalent cost of US$900 at Chepo and 36 percentlower than Solano’s unit cost of US$809. Likewise, at HISMA, the unit cost of normal deliv-eries was only US$152, a figure that was between 40 and 50 percent below that Chepo and

Solano. Even larger differences were observed for the unit cost of caesarean deliveries,where HISMA’s unit cost of US$156 was about one-third the unit cost at Chepo and one-half that at Solano. HISMA’s higher economic efficiency in the production of surgeries aswell as normal and caesarean deliveries is attributable in part to this institution’s relativelygreater use of operating rooms. In the case of Chepo Hospital, frequent interruptions ofthe power supply occurred, which interfered with good use of resources, and at SolanoHospital, surgical suites were not suitable for deliveries.
In addition to a unit cost analysis, the researchers compared the budget structure of thethree hospitals.89 A budget breakdown for 1999 is shown in figure 3.3. HISMA devoted 51 per-cent of its budget to medical personnel, a proportion that was significantly higher than Chepo’s(41 percent) and also significantly below that of Solano (58 percent). Overall, HISMA devoteda much smaller share of its budget to medical supplies other than drugs than both Chepo andSolano. At the same time, HISMA spent an about equal share of its budget on drugs as Chepo,but both spent significantly more on drugs than Solano Hospital. If the budget shares of drugsand medical supplies are combined, then HISMA allocated to these two items the same shareas Solano Hospital (17 percent). Chepo Hospital, instead, exhibited a considerably highershare of 33 percent, a difference that may largely be interpreted as a combination of small dif-ferences in patient mix, clinical practices, and efficiency in the use of those inputs. Finally, it isnoteworthy that HISMA devoted a greater share of its spending to administration—15 per-cent in total, compared with 11 percent in Chepo and 10 percent in Solano. HISMA’s greater
Health System Innovations in Central America 103
Figure 3.3. Cost Structures
Administrative personnel14%
Administrative expenses1%
General support services5%
Other expenses12%
Medical personnel51%
Other medical supplies5%
Drugs12%
Administrative personnel10%
Administrative expenses1%
General support services5%
Other expenses10%
Medical personnel41%
Other medical supplies19%
Drugs14%
Chepo Hospital Solano Hospital
General support services6%
Administrative personnel9%
Administrative expenses1%
Other expenses9%
Medical personnel58%
Other medical supplies14%
Drugs3%
89. These figures are based on actual spending, also known as the executed budget.

emphasis on administration may reflect that hospital’s greater concern with quality assur-ance. This issue is taken up in the next section.
Quality
This section presents the main study findings concerning health care quality. Ideally, qualityassessment should be an evaluation of three dimensions: quality of inputs, quality ofprocesses, and quality of outcomes. Quality of inputs consists of a comparison between theinputs actually available in the hospital to produce the services it offers and the inputs thatshould be available according to nationally or internationally accepted norms to make deliv-ery of the services offered possible. Gaps between actual and normative availability signal aquality failure. Quality of processes involves contrasting the actual actions carried out bymedical personnel with the normative actions set forth in norms of care. A basic requisite foradequate medical processes is the existence, appropriateness, and use of treatment protocolsand other mechanisms, such medical committees and peer reviews. When such acceptednorms and mechanisms are available in a hospital, the assessment of technical quality con-sists of an evaluation of the degree to which medical personnel comply with them. The lackof such norms and mechanisms signals a basic failure that most likely impedes the deliveryof appropriate medical care. Quality of outcomes encompasses an analysis of both patientsatisfaction and health outcomes, the latter denoting the measurement of the degree to whichpatients’ health status changed as a result of having been in the facility.
The time, resources, and data available precluded a complete analysis of quality in itsthree dimensions. Instead, researchers examined the existence and use of quality assur-ance mechanisms in the three hospitals by administering a detailed accreditation surveyin each facility, and they carried out a survey of randomly selected patients to assess per-ceived quality of care.
Quality assurance. Although the existence of quality assurance processes will not ensurethat quality is good, their absence is a cause of concern—the specialized literature suggeststhat it is most probably a symptom of quality failures. The results of the accreditation sur-vey are shown in Table 3.9 organized by area: management, support services, and clinicalservices. Overall, as shown in Figure 3.4, the two control hospitals barely achieved 50 per-cent of the minimum required compliance needed for accreditation of 70 percent (equiv-alent to 3.5 points in the 0–5 point scale used here). Only HISMA exceeded this minimum,but all three hospitals exhibited accreditation problems. In the two control hospitals,mechanisms aimed at defining, evaluating, and managing expected hospital results (clini-cal, output, and financial) were generally nonexistent or not applied, and this partlyexplains the differences obtained in performance indicators.
User satisfaction. The researchers drew a random sample of patients of several clinicalservices from each hospital and interviewed them to assess their satisfaction with the ser-vices received. The patient satisfaction variables evaluated were: (a) general standards ofcare, (b) access to and timeliness of care, (c) availability of drugs, (d) treatment by profes-sional and nonprofessional staff, (e) physical comfort and hospitality, (6) tracers of med-ical quality, and (7) overall perception of quality. This analysis yielded statisticallysignificant differences at the 5 percent level in patient satisfaction among the three hospi-tals. Further, HISMA exhibited the highest satisfaction scores of the three hospitals and in
104 World Bank Working Paper

all dimensions of perceived quality. As is shown in Table 3.10, more than one-half ofHISMA’s patients who had health insurance reported their overall satisfaction to be “verygood,” and nearly one-half of those uninsured offered the same ranking. Almost no patientsin Chepo Hospital reported to be as highly satisfied, and only between 11 percent and 14 per-cent of Solano Hospital’s did so. Further, nearly all of HISMA’s patients considered qualityto be either “very good” or “good,” whereas the equivalent scores were significantly lower atSolano and Chepo—the latter displaying the lowest degree of favorable satisfaction.
Health outcomes. Ideally, the existence of outcome indicators in all three hospitalswould have made possible a comparative analysis of one key component of quality amongthese institutions. Unfortunately, such information was not available everywhere. Thus, itwas not possible to assess widely used outcome indicators common elsewhere, such as theNIR and the frequency of medical complications from hospitalization. In fact, only HISMAkept NIR records for 1999, and none of the three hospitals kept records of readmissions
Health System Innovations in Central America 105
Table 3.9. Summary of Accreditation Performance Indicators
Chepo Solano Area of accreditation Indicators HISMA Hospital Hospital
Accreditation of Hospital management 4.2 2.2 2.8management Central quality planning and control 3.6 1.6 1.5
Human resources management 4.3 2.2 1.5
Human resources training 3.5 1.5 1.0
Personnel health and safety 2.0 2.3 2.0
Physical plant and sanitation 5.0 2.4 2.1
Installations and equipment 4.3 2.0 1.8
Average 3.8 2.0 1.8
Accreditation of Pathological anatomy 4.3 1.0 2.3support services Blood bank 5.0 1.7 4.3
Radiology 5.0 4.5 3.5
Clinical laboratory 4.8 2.8 3.3
Emergency room 4.3 2.3 3.0
Operating room 5.0 2.0 3.8
Pharmacy 4.3 2.8 2.5
Sterilization 5.0 2.8 2.8
Catering and nutrition 5.0 3.8 3.3
Milk dietetic servicesa 3.3 2.5 2.3
Average 4.6 2.6 3.1
Accreditation of OB/GYN, perinatal and postnatal 4.5 3.0 2.8clinical services Pediatrics 3.8 3.3 3.3
Medicine 4.5 2.8 3.8
Surgery 4.0 2.8 3.0
Average 4.2 3.0 3.2
All accreditation Average 4.2 2.5 2.7
a. Bottle feeding for newborns.

and reinterventions for that year. This omission speaks negatively of quality assurance inall three hospitals, although the mere fact that HISMA had an active NIR committee andheld the corresponding records is considered to be a sign that this institution had a specificconcern for supervising and improving this quality aspect in the institution. Death rates orreadmissions rates were not globally available in the three hospitals; thus, a comparativeassessment from this perspective was not possible.
Conclusions
From a number of perspectives, HISMA performed consistently better than the two controlhospitals, except for population coverage and bed use. In fact, HISMA’s relatively small num-ber of admissions, combined with a shorter average length of stay, left it with 50 percent of its
106 World Bank Working Paper
Figure 3.4. Overall Accreditation Scores
0
10
20
30
40
50
60
70
80
90
100
Managementservices
Support services Clinical services Overall
HISMA
Chepo Hospital
Solano Hospital
Table 3.10. Overall Patient Satisfaction(%)
HISMA Chepo Hospital Solano Hospital
Ranking Insured Uninsured Insured Uninsured Insured Uninsured
Very good 58 47 2 0 11 14
Good 42 51 48 62 64 57
Mediocre 0 2 46 33 25 27
Poor 0 0 3 2 0 0
Very poor 0 0 0 0 0 0
No response 0 0 2 2 0 2
Total 100 100 100 100 100 100

bed capacity idle. This excess capacity should not be a cause of major concern, however, givenHISMA’s relatively short life. Instead, HISMA should explore whether with time its bed capac-ity is appropriately suited to its assigned population. If not, it should evaluate the convenienceof reducing its bed capacity or expanding its reach to other MOH and SSI populations.
As regards efficiency, HISMA outperformed the control hospitals in virtually all aspectstechnical and economic efficiency. In the area of quality, HISMA also did better than Chepoand Solano Hospitals. In this respect, large differences among the three hospitals areworth highlighting. These pertain to the existence of an institutional mission, clinicaland administrative rules and procedures, quality assurance and accreditation systems,and a client orientation.
Although the HISMA reform project has not yet been implemented fully, and not allthe management tools required for full autonomy have been granted to it, HISMA’s boardhas achieved most of its commitments while efficiently delivering good quality care. Studyresults offer strong arguments in favor of strengthening HISMA’s model and expanding itto other, traditionally managed public hospitals such as Chepo and Solano. The strongresistance seen in Panama against changing the status quo and expanding HISMA’s modelattests to the difficulties, faced in this country and elsewhere in Latin America, of promot-ing policies that favor beneficiaries in an environment dominated by interest groups. Addi-tionally, some aspects of the design of the HISMA model may need further consideration:First, CONSALUD is the sole purchaser of the services provided by HISMA, and HISMA,in turn, is the sole provider of health services for the local target population. This situationof a combined monopsony (a market where there is a single buyer) and monopoly powermay be mitigating the potential efficiency gains of this model. Second, further refinementof the current prospective provider payment system might be needed in the future becauseHISMA is paid a flat fee per hospital discharge, outpatient surgery, and emergency visit.This could create incentives on the part of HISMA for “cream skimming” the healthiestpatients within each category.
Bibliography
Bitrán, R., C. Má, P. Gómez, L. de Thomas, y G. de Rojas. 2001. “Evaluación del modeloHISMA y comparación con un modelo tradicional de funcionamiento.” Bitrán y Aso-ciados para el Ministerio de Salud de Panamá y el Banco Mundial, Santiago de Chile.
Eichler, R., P. Auxila, J. Pollack. 2001. “Output-Based Health Care. Paying for Performancein Haiti.” Note 236, Public Policy for the Private Sector. World Bank, Washington, D.C.
Govindaraj, R., and M. Chawla. 1996. “Recent Experiences with Hospital Autonomy inDeveloping Countries—What Can We Learn?” Data for Decision Making Project,Department of Population and International Health, Harvard School of Public Health,Cambridge, Mass.
Harding, A., and A. Preker. 2003. “Private Participation in Health Services.” HumanDevelopment Network; Health, Nutrition, and Population Series; World Bank,Washington, D.C.
Loevinsohn, B. 2001. “Contracting for the Delivery of Primary Health Care in Cambodia:Design and Initial Experience of a Large Pilot Test.” World Bank, Washington, D.C.
Health System Innovations in Central America 107

Mills, A., and J. Bloomberg. 1998. “Experiences of Contracting: An Overview of the Liter-ature.” Macroeconomics, Health and Development Series, Technical Paper 33. WorldHealth Organization, Geneva.
Mills, A., C. Hongoro, and J. Bloomberg. 1997. “Improving the Efficiency of District Hospitals: Is Contracting an Option?” Tropical Medicine and International Health2(2):116–26.
Over, M., and N. Watanabe. 2003. “Evaluating the Impact of Organizational Reforms inHospitals.” In A. Preker and A. Harding, eds., Innovations in Health Service Delivery:The Corporatization of Public Hospitals. Human Development Network; Health, Nutri-tion, and Population Series. Washington, D.C.: World Bank.
Preker, A., and A. Harding. 2003. Innovations in Health Service Delivery: The Corporatiza-tion of Public Hospitals. Human Development Network; Health, Nutrition, and Pop-ulation Series. Washington, D.C.: World Bank.
108 World Bank Working Paper

CHAPTER 4
109
Contracting Primary Health CareServices—The Case of Costa Rica
James Cercone, Rodrigo Briceño, and Varun Gauri
Abstract
This chapter outlines the Costa Rican experience with the introduction of a contracting model and highlights some of the key results evaluating theperformance of the model in comparison to the traditional public model.Using both performance evaluation data from the Caja Costarricense deSeguro Social (CCSS) contracts and a panel data set on clinic-level outputs,the chapter analyzes the development of the primary health care (PHC) contracting model in Costa Rica and compared the performance of healthcooperatives in Costa Rica with traditional, publicly managed clinics in thesocial security system. Under both methods, the contracted providers consis-tently provide better performance than traditional CCSS public clinics. Evencontrolling for catchment area characteristics, time trends, complexity ofclinic, and existence of performance contracts, contracted providers con-ducted significantly more general practitioner visits per capita and signifi-cantly fewer specialist visits per capita than traditional clinics. At the sametime, the per capita rate of emergency visits and first-time patients seen didnot differ from that in the traditional clinics. These measures combinedresulted in 30 percent lower expenditures per capita in contracted providersthan in the traditional clinics.
The findings presented suggest that the contracting model in Costa Rica ispromising. As this chapter shows, cooperation between the sectors has worked wellthere, where contracted providers have been in operation long enough to producereliable results. Clear evidence is shown that the public-private partnershipmodel offers important opportunities to increase provider performance withina sustainable framework.
Over the past 20 years, Costa Rica has achieved remarkable progress in the healthof the population through a universal social security system and annual govern-ment spending in excess of 6 percent. Despite these achievements, Costa Rica

faced considerable pressure to introduce structural changes in the health system to addressrising costs (total health care spending reached nearly 10 percent of gross domestic product(GDP) in 1996), declining quality of public services, and increasing demands for improvedquality and client attention by the system’s users.
To address these challenges, in the late 1980s, the government of Costa Rica beganto formulate long-term strategies to reform the health care system. These reforms builtupon earlier policy decisions to shift all responsibility for health care provision to the CajaCostarricense de Seguro Social (CCSS) and strengthen the regulatory and policy oversightrole of the Ministry of Health. By 1994, the overall diagnosis of problems in the healthsector and the directions for change were clear; however, little progress had been made interms of introducing real change (Miranda 1995; CCSS 1997). Among the main issues thatmotivated the need for change were:
� a health care model based almost exclusively on hospital-level, curative attention,with limited emphasis on an integrated health care model and gaps in coverage;
� health care expenditures that reached nearly 10 percent of GDP and increasing evi-dence of declining returns in terms of production, quality, and satisfaction;
� rising levels of user dissatisfaction, due primarily to waiting lists and poor attention;� a high level of centralization, leading to inefficiency in the provision of services and
a lack of ownership and accountability at the local level;� a rigid normative framework that emphasized ex ante controls rather than
performance-based evaluations in accordance with pre-established goals for pro-duction, quality, and user satisfaction.
In response to these problems, the government of Costa Rica launched an ambitiousreform agenda that aimed to improve access, efficiency, and quality as well as guaranteethe long-term sustainability of the social security institute. One of the key elements of thereform strategy was to increase the participation of the private sector as a provider of ser-vices to the social security institute within a regulated framework. This allowed the CCSSto leverage the investment capacity of the private sector, management experience and flex-ibility, and pay greater attention to clients’ needs. The cooperation between the public andprivate sectors was established in the context of the outsourcing of services to non publicproviders whereby the CCSS maintained its role as the single payer and contracted with pri-vate providers to deliver core services. This strategic partnership between the public andprivate sectors produced significant improvements in coverage, efficiency, and quality ofservices.
This chapter outlines the Costa Rican experience with the introduction of a contract-ing model and highlights some of the key results evaluating the performance of the modelin comparison to the traditional public model. It is divided into four sections. The nextsection provides an overview of the Costa Rican health sector reforms. The second sectionintroduces the main characteristics of the contracting model in Costa Rica. The third sec-tion highlights the comparative performances of the traditional and contracted models.The final section provides conclusions and lessons learned for other countries seeking toimplement contracting models.
110 World Bank Working Paper

The Health Sector Reforms in Costa Rica
Starting in 1994, the government initiated a three-pronged approach to health reform. Themain objective of the reform process was to address the weaknesses in the system throughthe implementation of structural reforms in the organization, financing, and delivery ofservices, with a focus on improving value for money in the social security system. It wasdecided to preserve the universal coverage and public financing role of the social securityinstitute and focus on improving the efficiency and quality of services provided throughCCSS providers.
The reforms used a multidimensional approach to address several of the challengesfacing the health sector. The first dimension of the reforms focused on strengthening primaryhealth care through the implementation of an integrated health care model. The second ele-ment aimed at improving efficiency and quality by introducing new financing mechanismsto link the allocation of resources to health needs and actual production, thereby replacingthe historical budget, and improve efficiency in the collection of social security contributions.The final component introduced reforms at the organizational level to promote the sepa-ration of financing, purchasing, and provision and support the changes in the health careand financing models.
In 1997, the CCSS entered into performance contracts (compromisos de gestión) withseven social security hospitals and five health areas (decentralized primary health care units).The development and implementation of the performance contracts depended on two keyelements. First, the planning and negotiation of the performance contracts required iden-tification of the health needs of the population, analysis of production capacity and relativeperformance, and design of a comprehensive evaluation framework to ensure adequatemonitoring and evaluation of compliance with the performance contracts. Second, theCCSS began to act as a purchaser of health care services, clearly identifying the health needsof the population, designing strategies to improve the population’s health, and establishingclear and concise objectives and indicators for each health provider. At the same time, thesecontracts provided the social security institute with the opportunity to provide incentivesto health providers to implement the integrated health care model and enforce compliancewith the standards and norms that were developed to strengthen primary health care.
The contracts standardized the terms and conditions that providers were expected tofulfill and outlined a series of performance measures to guide the providers toward improvedperformance. The negotiation of the performance contracts changed the dynamic of thecommand and control system that operated under the historical budgeting and planningmodel. (The main clauses of the contract are outlined in Annex 4.1.) There are three keyelements of the contract:
� First, the contract clearly establishes the population to be covered and the types of ser-vices to be delivered. For each type of service, the CCSS has established protocols andguidelines that outline the purchaser’s expectations regarding the provider’s role.
� Second, the contract outlines multiple performance indicators, grouped into fourmain categories related to: (a) provision, which includes coverage rates and com-pliance with protocols; (b) quality, which establishes indicators related to technicaland perceived quality of services; (c) organization of the services, which covers
Health System Innovations in Central America 111

management capacity and its role in managing patients and resources; and (d) billing,which establishes the provider’s role in documenting the cost and volume of servicesprovided.
� Finally, the contract establishes a system for monitoring and evaluation, whichoutlines not only the procedures but also the process by which the providers willbe evaluated. This section also establishes what the incentives, or sanctions, theproviders face will be.
The initial reform efforts focused on improving the performance of public providers, andby the end of the 1990s, it was clear that further innovation would be required to achievethe desired objectives in terms of expanding coverage and improving efficiency and quality.The CCSS was limited by investment and employment constraints that limited the possi-bility of expanding coverage with traditional models in the metropolitan area. Furthermore,the CCSS had established a series of contracts with nonpublic providers that needed to beincorporated into the new regulatory, or contracting, framework established for publicproviders (CCSS 1997). These factors, and the pursuit of greater value for money, forcedthe CCSS to adopt models that emphasized the purchaser-provider split. Under this model,the CCSS, as a purchaser, contracts with the private or nonprofit sector for the delivery ofprimary health care services within a framework that is similar to the conditions the pub-lic sector faces but offering greater management flexibility. This solution was aimed atimproving access, efficiency, quality, and satisfaction with the existing resources and withinthe existing constraints. The remainder of this chapter outlines how the contracting wasintroduced, describes its key characteristics, and evaluates the comparative performanceof the model.
The Emergence of PHC Contracting in Costa Rica
Background
A key part of these reforms was the urgent need to extend access, improve service, and lowercosts by strengthening the primary health care (PHC) system. Despite the successful imple-mentation of the reformed PHC model in nearly 75 percent of the population, the CCSSfaced increasing difficulties in extending the model to urban populations. The main limita-tions were important restrictions on public investment required to build capacity to attendto the nearly 300,000 people without coverage in the metropolitan area, a limitation by theMinistry of Finance on the creation of new staff positions, and hesitance of the middle-classpopulation to use public services. After careful consideration, the CCSS decided that thebest option to extend coverage and improve efficiency without increasing public invest-ment was the use of a contracting model whereby PHC services would be purchased fromthe private sector.
This decision reflects a paradigm shift in the health sector. In the past, policy makersassumed that the state should guarantee access to basic services such as security, health,and education through direct provision of all services. However, this belief evolved, whenfaced with the difficulties and realities of the sector, to a situation where the state is not nec-essarily expected to produce services, but should ensure that they are provided by means
112 World Bank Working Paper
of a third party, retaining responsibility for quality, quantity, and pricing. In the past 10 years, a number of experiences in other sectors in developing countries, and in thehealth sector in developed countries (England 1997; Mills 1998), have contributed toincreased interest in contracting for the provision of PHC. It has been found that con-tracting for services is attractive because it has the potential to:
� ensure an increasing focus on the achievement of measurable results, particularlyif contracts define objectively verifiable outputs and outcomes;
� utilize the private sector’s greater flexibility and generally better management skillsto improve services and responsiveness to consumers;
� increase managerial autonomy and decentralize decision making to managers onthe ground;
� use competition to increase effectiveness and efficiency;� allow governments to focus less on service delivery and more on other roles they
are uniquely placed to carry out, such as planning, standard setting, financing, andregulation (Vining and Weimer 1990).
Following the theoretical models and aiming to develop a practical solution to extend cov-erage of the PHC model to the remaining 25 percent of the population, the CCSS designeda number of contracting models for the provision of PHC services. The aim of the newCCSS model was to increase the capacity of the primary care network and bring essentialservices closer to the population. This involved the CCSS establishing a partnership withprivate entities to provide public services. These services would be offered using publicfacilities but under private management, with the objective of increasing coverage andimproving efficiency.
To achieve this, performance contracts were prepared between the CCSS and privatelymanaged providers. The performance contracts with the private sector retained the figureof the compromiso de gestión, as in the case of public providers, to ensure parity betweenthe public and private models and minimize the tendency to establish different conditionsfor public and private providers. Nearly all of the clauses within the contracts with privateproviders are the same as public contracts. The main difference in the contract is the useof a performance guarantee bond in the private contracts, which guarantees that at least85 percent of the established performance targets are achieved; otherwise, the CCSS can“collect” on the bond and effectively penalize the private providers for underperforming.Public providers do not hand over a performance guarantee to the CCSS but rather “risk”2.5 percent of the budget against low performance.
Purchaser and provider separation was maintained, replacing the old system, whichhad operated under a budget and planning model. In addition, the new model offeredimportant improvements in terms of organizational arrangements, incentive structures,and financial mechanisms, which potentially lead to improved performance. The approvalof a law of decentralization further consolidated efforts to devolve authority and respon-sibility to public providers, allowing clinics to carry out their own administrative contractsfor property and services. The law also established the compromiso de gestión as the legalinstrument to be used for contracting public and private providers. The next section dis-cusses the introduction of the contracting model and its key advantages.
Health System Innovations in Central America 113

How Does the Contracting Model Differ from the Traditional Model?
Costa Rica has been a pioneer in the use of outsourcing to nonpublic providers with theintroduction of a cooperative model as early as 1988. Under this model, the CCSS leased pub-lic clinics to groups of professionals organized under a new legal structure, the cooperative,with the objective of managing the clinic and providing services to the publicly insured pop-ulation. The staff of the new clinic was a combination of former CCSS staff and new staffwho were recruited. Management was provided by former CCSS physicians. This modelhas been the cornerstone of purchaser-provider split reforms that have been recentlyimplemented in Costa Rica. The initial model showed positive results in terms of programcoverage and user satisfaction (Pezza and Barquero Bolaños 1994). Moreover, the use ofprivate providers has not been interpreted as a privatization of services but rather as a toolto obtain public objectives of coverage, universal access, efficiency, and quality within aframework of solidarity (social cohesion and sharing of financial risks). This model appearsto have important benefits over more liberal forms of privatization that have been under-taken in recent years by countries such as Chile (Homedes and Ugalde 2002).
Over the years, the model has evolved to include private providers, the University ofCosta Rica, and other cooperatives. In 2000, the CCSS initiated a new phase of contract-ing out when they issued a request for proposals to provide extended coverage to nearly110,000 people in the metropolitan area. This process allowed the CCSS to stimulate com-petition among the existing providers and improve transparency in the management ofthe process. One of the critical differences in the Costa Rican model is that competitionis generated through improvements in quality and efficiency, rather than by encouragingusers to select their provider. Other countries—such as Croatia (Hebrang and others2003), Estonia (Koppel and others 2003), and Nicaragua (La Forgia and Gutiérrez 2000)—have had success in introducing greater competition through contracting out to privateproviders.
The contracting model has grown to constitute a model of relationships between thepublic sector, as a purchaser of health services, and the nonpublic sector (including theprivate sector, the University of Costa Rica, and cooperatives) as providers of services. Forthe remainder of this chapter, the term PHC contracting will be used to refer to the modelunder which the CCSS contracts with nonpublic providers, describing the relationshipbetween the CCSS and private providers or the contracts with a cooperative entity. Giventhe similarity of the conditions faced by public and nonpublic providers and the model’slongevity, the evolution of PHC contracting in Costa Rica offers an excellent laboratory foranalysis of the comparative performance of the models and highlights key features that arecritical to the design and implementation of a contracting model.
The main objective of the cooperative model is to generate the best possible social well-being of an assigned population with the existing resources. Within the framework of poli-cies promoting increased services and the development of an integrated care scheme,1 thecooperative performs an essential role. Four important areas—regulation, finance, orga-
114 World Bank Working Paper
1. The term integrated care scheme refers to the provision of a complete set of PHC services (includ-ing prevention, cure, rehabilitation, and social services) provided by one primary care provider. Underthis model, the provider also offers all ancillary services, such as pharmacy, laboratory, and diagnostic ser-vices, required for the provision of the PHC package.

nization, and provision—highlight the key differences between traditional public clinicsand cooperatives:
� Regulation: Contracted providers perform their work under the general oversightof the CCSS and the Ministry of Health (MOH) but retain direct governance overtheir resources and business objectives. Service agreements between the providerand the CCSS establish goals for production, coverage, and other performanceindicators related to quality and satisfaction. Through the use of a contract, theCCSS outlines the key regulatory aspects for the contracted provider and establishesthe “rules of the game”. Evaluation of the provider’s performance, which ensuresquality and coverage, is the direct responsibility of the CCSS. The provider mustalso respond indirectly to the regulations and political objectives determined by theCCSS and the MS.
The governance of the contracted provider is established wholly by the providerorganization. In cooperatives, a governing board is established that includes the staffof the cooperative and, in some cases, members of the community; in the private sec-tor clinics, private management boards have been established; and at the Universityof Costa Rica, a joint university board (composed of professors from the School ofPublic Health and staff from the provider level) is established for oversight.
� Financing: The financing function has been fully retained by the CCSS. UnderCosta Rica’s single-payer system, the CCSS is responsible for financing 100 percentof health care services through payroll contributions and government transfers forthe uninsured. The financing of the contracting model retains public financing, andno additional fees are charged by the providers. Since the introduction of the firstcooperative in 1988, three provider payment mechanisms have been used by theCCSS: per capita payment, payment in accordance with the historical budget, andper capita payment through a management agreement. The residual claimant con-dition provides an incentive to develop high levels of productivity and efficiency,and financial risk from bad management is reduced.
� Organization: The internal organization of the contracted providers is entirely up totheir management. In the cooperatives, managers are appointed by an administrativecouncil, which itself is selected every two years by the General Assembly. The modelis guided by Law 4179 of cooperative associations and their reforms. The most impor-tant aspect of this kind of organization is the contribution by all associates to the socialcapital of the company. Periodically, associates receive a share of the profits gener-ated by the cooperative. Alternative management models have been established in theprivate companies and the university operating under the contract model; in mostcases, they separate the administrative structure from the clinical structure, whichprovides a medical director who is subordinate to a general manager.
� Provision: The contracted providers are in charge of managing the provision of ser-vices without interference by the CCSS authorities. In the cooperatives, the CCSSleases the clinic for roughly US$1 per year, and the cooperative is in charge of main-tenance, improvements, and investment. Some equipment is purchased by theCCSS, but most investment is made by the contracted provider, including both fur-niture and instruments.
Health System Innovations in Central America 115

Among the other providers, the facilities are entirely the responsibility of thecontracted provider. In most cases, the private managers have rented space andmade improvements to adapt the facilities to the infrastructure requirements estab-lished by the CCSS (for example, space distribution and equipment). Inputs, suchas drugs and medical supplies, required by the contracted providers are boughtdirectly from the general stores of the CCSS. Prices, determined by the accountingdepartment of the CCSS, are calculated on the basic cost of production or acquisi-tion, plus 15 percent for administrative expenses. When stock is unavailable fromthe CCSS, the contracted providers purchase inputs from the private sector.
The services provided by the contracted providers are identical to the package ofservices provided by the traditional CCSS clinics. The management contract estab-lishes the specific services and coverage rates that the contracted provider must pro-vide, and the performance evaluation process ensures that quality is maintained.
Organizational Behavior: Analyzing the Incentives Facing Contracted Providers
Organizational behavior is a collection of formal or informal rules and administrative pro-cedures for the efficient organization and management of resources. Theoretically, the suc-cess of an organization depends on the response of the administrators and managers to theorganizational structure and incentives they face. The conduct of contracted providers canbe analyzed by looking at managerial autonomy, market exposure, residual claimant sta-tus, human resources, and strategic management.
Managerial autonomy. The reform process began with the decentralization of servicesprovided by the government, which granted all providers greater autonomy to managetheir resources. Unfortunately, public centers have important constraints, both politicaland technical, that have limited the implementation of autonomy. The providers that oper-ate under the contracted model have nearly full autonomy when it comes to making deci-sions in areas such as purchasing, human resources, and general administration. They are,however, limited to minimum standards regarding infrastructure, human resources,equipment, and materials and supplies that are established in the contract. In comparisonwith traditional CCSS clinics, which have only limited autonomy to make decisions inthese areas, the contracted providers have considerably more flexibility in the managementof their resources.
Market exposure. Market exposure is the extent to which clinics face competition. Thecontracting process between the CCSS and the contracted providers has different levels ofcompetition. Contracting between the CCSS and public providers implies zero competitionin terms of price or quality. Populations are assigned geographically and budgets are capi-tated. In the original cooperatives, the populations were also assigned geographically andbudgets were capitated. In the latest round of contracting between the CCSS and the privateproviders, however, competition has been introduced. Populations and geographic areaswere “bid out” to the cooperatives and private providers under a competitive tender process.Providers were forced to compete for a set package of services, with the minimum standardsmentioned above, and finally adjudication was made based on the lowest price per capita.The private providers and cooperatives are also required to provide a guarantee bond in
116 World Bank Working Paper

cash, which is linked to obtaining a minimum level of performance in the contract execu-tion. If the contracted provider does not meet the performance standard of at least 85 per-cent in the performance indicators, then the CCSS, as purchaser, can execute the bond andcollect a penalty of nearly 5 percent of the contract value. Increased market exposure clearlyhas produced improvements for the CCSS in terms of greater value for money.
Although the traditional clinics have low market exposure, the process of negotiatingthe annual management agreements does make them accountable for performance andintroduces a quasi-market situation in which the purchaser is forcing the providers todeliver better quality at a lower price.
Residual claimant condition. The term residual claimant status refers to the extent towhich the organization retains profits that result from improvement in management andassumes losses from bad management. In the traditional clinics, the residual claimant isthe CCSS. Initially, the clinics were able to retain some of the savings, but in recent years,this has been reversed, so the traditional clinics have limited incentive to carry outimprovements. The only incentive they have is the annual performance bonus that is linkedto compliance with contract performance measures. This also stimulates improved per-formance in CCSS clinics. In the case of the private, for-profit, contracted providers, theresidual claimant is the provider, meaning that any improvement in management will betranslated into greater profits and benefits for all employees.
Social functions and public property. One of the fears surrounding privatization is thatthe public sector could retain the production of services that are considered public goodsor that complete a social function of government, and private provision will lead to higherprices and exclusion of some people. The core difference between the contract model andsimple privatization is that the contracting model does not imply a sale of assets to the pri-vate sector to provide a public services, nor does it imply that the public sector is dismiss-ing its responsibility for the provision of core services—rather, it is the use of the privatesector to execute a core public function, under public regulation and with public financ-ing, through the use of a private provider. The services provided by the contracted providerare delivered under the same terms as those pertaining to the public providers, whichensures that the services are available to all free of charge.
Human resources. The management of human resources is an important differentiat-ing factor between the contracted providers and the public providers. In the contractmodel, the clinics are free to hire and fire staff as they see fit. There are no public encum-brances or labor unions to cause obstacles to the management of human resources. Thecontracted providers are also able to pay competitive salaries, which are greater than thesalaries paid by public institutions. The contracted providers have been able to introduceperformance bonuses that link the total staff remuneration to the achievements in perfor-mance indicators established in the contracts. The public institutions have not been ableto introduce incentives or increase flexibility in the management of labor contracts, whichare potentially important elements of overall performance.
Business strategy. The success of an organization is determined by a clear mission andexecution of business strategies to achieve its goals. In general, the mission and vision of
Health System Innovations in Central America 117
the public and private providers is the same—to provide the PHC package of services to theCCSS-insured population with the highest standards of quality in a sustainable framework—and the CCSS as purchaser establishes the terms under which services will be provided. Themain difference is in terms of execution of the strategy. In this case, the contracted providersclearly have greater flexibility in managing resources and obtaining results.
The next section compares the performance of the contracted providers with that oftraditional clinics. The outlined combination of the advantages will translate into signifi-cant improvements in performance by contracted providers.
Evaluating the Impact of Contracting
Four previous comparative evaluations of cooperatives in Costa Rica have been conducted.Herrero, Villalta, and Associates (1992) compared costs between two cooperatives and fiveselected traditional CCSS clinics in 1991, and found that the variances in expenditures andtreatments were higher in the traditional clinics. Their findings, though suggestive, werebased on one year of cross-sectional data and a nonrandom sample. Durán and others (1995)compared expenditures between four cooperatives and four comparator clinics during1990–94 and found that cooperatives had higher levels of expenditures. The nonrandomselection of the comparison clinics, as well as the use of incomplete budget data, might havebiased that analysis. Picado (1999) and Rodríguez (1999) both compared 1992–98 expen-ditures between three cooperatives to those of four traditional CCSS clinics and foundhigher but declining relative expenditures in the cooperatives. Again, sampling issues wereproblematic in those studies.
The performance evaluation of this study focuses on comparing the performance of pub-lic clinics with contracted providers. As indicated in the introduction, both private providersand cooperatives are considered as contracted providers. This evaluation is divided into twolevels of analysis. In the first case, the overall results reported by the CCSS from the annualperformance evaluations carried out by the CCSS purchasing department are examined.This evaluation is based on the performance indicators established in the annual perfor-mance contracts. The second case looks at the evolution of performance over time andestablishes a multivariable framework to compare contracted providers to the CCSS type IIIand type IV clinics, which have relatively the same level of complexity as contracted providers.2
The use of a multivariable framework controls for several potential community-level covari-ates over time and allows more robust results than comparing mean performance on out-come indicators.
Comparative Performance Based on Contracting Arrangements
This section outlines the comparative performance between contracted providers and tra-ditional CCSS providers. Two levels of analysis are undertaken to test the hypothesis that
118 World Bank Working Paper
2. Type III and type IV are levels of medical complexity in Costa Rican facilities. Type III and type IVclinics include family medicine and limited specialty care, such as pediatrics and obstetrics. Two of thecooperatives were type IV and one was type III. The facilities compared to the cooperatives include all tra-ditional CCSS type III and type IV clinics.

contracted providers offer better value for money than traditional clinics. In the first case,evaluation data from the performance contracts for 2002 are used. Here, the evaluated out-comes of nonpublic and public providers are compared. The second level of analysis looksat the comparative performance of the public versus nonpublic providers based on the useof panel data from 1990 to 1999 for output and cost indicators.
Evaluating the performance of contracted providers based on contract evaluations. Thedata used are based on the annual evaluation of contract performance that is carried out bythe CCSS purchasing department. We have selected a subset of 7 indicators from the coreset of 23 indicators that are used to evaluate performance. These indicators provide a cross-set of program indicators evaluated in the contract. A combined indicator was developedto create a coefficient showing the percentage of the target coverage rate achieved by theprovider. Thus, providers that have a higher rate will have obtained a better than expectedoutcome. The indicator is applied to both the contracted providers and the CCSS publicproviders from the metropolitan area. Limiting the comparison to the metropolitan areaprovides a more consistent framework for the evaluation of homogenous populations andclinic structures. Annex 4.2 provides a full list of the indicators evaluated in the contract.The indicators considered include:
� rate of Pap smears for women more than 35 years old;� coverage rate for interventions established for children under 28 days;� coverage rate for interventions established for children under 1 year;� coverage rate for interventions targeted to the elderly;� coverage rate for the diagnosis and treatment of patients with hypertension;� coverage rate for the diagnosis and treatment of patients with diabetes;� coverage rate for prenatal care visits.
The performance indicators evaluate two dimensions. The first dimension is only the absolutecoverage levels for each indicator. For each indicator, a target level is established individuallyfor each provider; each indicator has a set of approximately five key quality indicators that areevaluated to determine if the program is being implemented according to the agreed proto-cols. The final evaluation of performance of all providers is carried out by a combination ofthe absolute and quality-adjusted coverage levels. Figure 4.1 shows the combined coverageand quality coefficients obtained for the providers in the selected programs.3 This evaluationis the same for contracted providers and traditional providers, although the contractedproviders typically have higher target levels than the CCSS clinics. Incentive paymentsare awarded to both types of providers based on these evaluations.
As shown in Figure 4.1, in five of the seven indicators, the contracted providers providebetter performance than the comparator CCSS clinics. In the case of prenatal coverage, thedifference is 20 percentage points in favor of the contracted provider; in the other areas, thedifference is around 10 percent. In the case of elderly care and coverage of children underone year, the CCSS clinics outperform the contracted. However, it is important to note thatthis partially reflects the higher target rates negotiated for contracted clinics.
Health System Innovations in Central America 119
3. The Pap smear rates are not adjusted for quality because an additional indicator, percentage of Papsmears reported positive, is used to measure quality.

Using a multivariable environment to evaluate contracted provider performance.4 Gauri,Cercone, and Briceño (2004) used multivariable analysis to further analyze the performanceof contracted providers in comparison to traditional CCSS clinics. For the analysis, data onall type III and type IV clinics in Costa Rica were available, but clinics for which data wereavailable only for very short periods (two or three years) were excluded, as were those thatwere only recently set up. As a result, 23 observations were dropped, leaving the database with24 type III and type IV clinics, 3 of which are cooperatives. The main source of informationwas the annual statistical bulletin of the CCSS. The data on infant and general populationmortality were taken from specific studies by the Estado de la Nación, developed by the UnitedNations Development Programme (1990–2000), and an infant mortality study by the Insti-tuto Nacional de Estadísticas y Censos (General Department of Statistics and Census) thatcovered several years. The population data, including the demographic structure of the catch-ment areas, were compiled from projections made yearly since the 1984 census by the demo-graphic studies section of the Department of Actuarial and Economic Planning of the CCSS.
The main objective of the empirical analysis was to determine whether health servicesprovided in cooperative clinics in Costa Rica differed from those provided in the tradi-tional public clinics over the same period. To accomplish this, we first examined long-term
120 World Bank Working Paper
4. This section draws on a previous article by Gauri, Cercone, and Briceño (2004), under expressauthorization of Oxford University Press.
Figure 4.1. Comparative Performance of Contracted Providers and CCSS MetropolitanClinics, Selected Performance Indicators
42%
39%
70%
76%
86%
55%
60%
74%
75%
82%
80%
77%
89%
89%
0% 10% 20% 30% 40% 50% 60% 70% 80% 90% 100%
Diabetes
Prenatal care
Hypertension
Elderly care
Children under 1 year
Children under 28days
Pap
Indi
cato
r
Level of achievement
Traditional Contracted providers

trends and descriptive statistics and then modeled health service performance indicatorsusing the general form.
where Y is a vector of health service performance indicators in clinic i at time t, Coop is abinary variable indicating whether or not a clinic is a cooperative, X is a vector of clinic andcommunity characteristics, Z is a set of annual indicator variables, and e is a randomly dis-tributed error term. Panel data sets like this one typically encounter two problems whenestimated using ordinary least squares (OLS): (a) autocorrelation because performanceindicators in adjacent years (and therefore the error terms on adjacent observations) arecorrelated with each other, and (b) heteroskedasticity, or unequal variance in the errors. Toaddress these problems, we used year dummies (the Z term above) to correct for autocorrela-tion and Huber-corrected standard errors to generate estimates robust to heteroskedasticity.It was not possible to use a fixed effect model to correct for heteroskedasticity because two ofthe three clinics were cooperatives for all years in the sample, and the third was a cooper-ative for 7 of the 10 years; consequently, clinic fixed effects would absorb almost all of thevariation in the variable of interest, Coop. A generalized estimating equations model with-out year dummies might have been more efficient than the approach adopted, but becausethe correlation structure of the data was unknown, it might also have yielded substantiallybiased estimates. The reported results are therefore based on OLS estimates with year dum-mies and Huber-corrected standard errors. To reiterate, in the results reported below, thekey parameter of interest is the coefficient on the Coop variable.
Comparing the Historical Outcomes of Contracted Providers with CCSS Traditional Clinics
The four CCSS clinics chosen were Clínica Carlos Durán, Clínica Jiménez Núñez, ClínicaMoreno Cañas, and Clínica Clorito Picado. The contracted providers considered in thispart of the study are COOPESALUD (Clínica de Pavas), COOPESAIN (Clínica de Tibás),and COOPESANA (Clínica de Santa Ana). These three cooperatives are used in this studybecause they were the first to be set up in Costa Rica. COOPESANA figures from 1995onward are employed as well as annual CCSS statistics. Where information was not avail-able on the population in the area of each of the clinics, the figures of the relevant cantonwere used. The projected census from 1984 was used for population figures.
The graphs in Figure 4.2 show trend lines over the decade for cooperatives and tradi-tional CCSS clinics. The figure shows that general medical visits per capita started at thesame level in cooperatives and other clinics, then declined in cooperatives but increased intraditional clinics over the course of the decade. Specialist visits per capita also started atabout the same level and declined in both cooperatives and traditional clinics. Coopera-tives gradually increased their rate of emergency visits per capita over the decade to thepoint that they equaled those in traditional clinics.5 Total laboratory procedures and total
Y Coop X Z eit it it t it= + + +
Health System Innovations in Central America 121
5. Emergency visits include emergency services provided to CCSS members either during normalworking hours or by emergency services after normal working hours. These are provided in the primarycare setting of the cooperative clinic.

medications provided started at lower levels in cooperatives than in traditional clinics andremained lower at the end of the decade (though they did increase in the cooperatives).Real expenditures per capita exhibited significant annual fluctuations, but they both startedand ended the decade lower in cooperatives than in traditional clinics. Table 4.1 shows thatpopulation mortality rates appeared somewhat higher in the areas around the cooperativesthan in the CCSS clinics, and that infant mortality rates appeared comparable between thetwo groups. A t-test, however, found that the average annual infant and general mortalityrates were statistically indistinguishable in the catchment areas of cooperatives and tradi-tional clinics. Similarly, the demographic structure of the populations in cooperativecatchment areas was broadly comparable to that in the catchment areas of the traditional
122 World Bank Working Paper
Figure 4.2. Services Provided Per Capita in Cooperatives and Type III and IV Clinics
0.00
0.10
0.20
0.30
0.40
0.50
90 91 92 93 94 95 96 97 98 99
Em
erg
ency
vis
its
per
cap
ita
Coops Clinics type III and IV
0.50
0.80
1.10
1.40
1.70
2.00
90 91 92 93 94 95 96 97 98 99
To
tal l
abo
rato
ry e
xam
s p
er v
isit
Coops Clinics type III and IV
6,000
7,000
8,000
9,000
10,000
11,000
90 91 92 93 94 95 96 97 98 99
To
tal r
eal e
xpen
dit
ure
of
the
clin
ics
per
per
son
per
yea
r in
cat
chm
ent
area
in r
eal c
olo
nes
Coops Clinics type III and IV
1.00
1.50
2.00
2.50
3.00
3.50
90 91 92 93 94 95 96 97 98 99
To
tal m
edic
ines
pre
scri
bed
per
vis
it
Coops Clinics type III and IV
0.00
0.50
1.00
1.50
2.00
2.50
90 91 92 93 94 95 96 97 98 99Gen
eral
med
ical
vis
its
per
cap
ita
Coops Clinics type III and IV
0.00
0.10
0.20
0.30
0.40
0.50
0.60
0.70
90 91 92 93 94 95 96 97 98 99Sp
ecia
lty
med
ical
vis
its
per
cap
ita
Coops Clinics type III and IV
Source: Authors’ calculations based on constructed database of CCSS statistics.
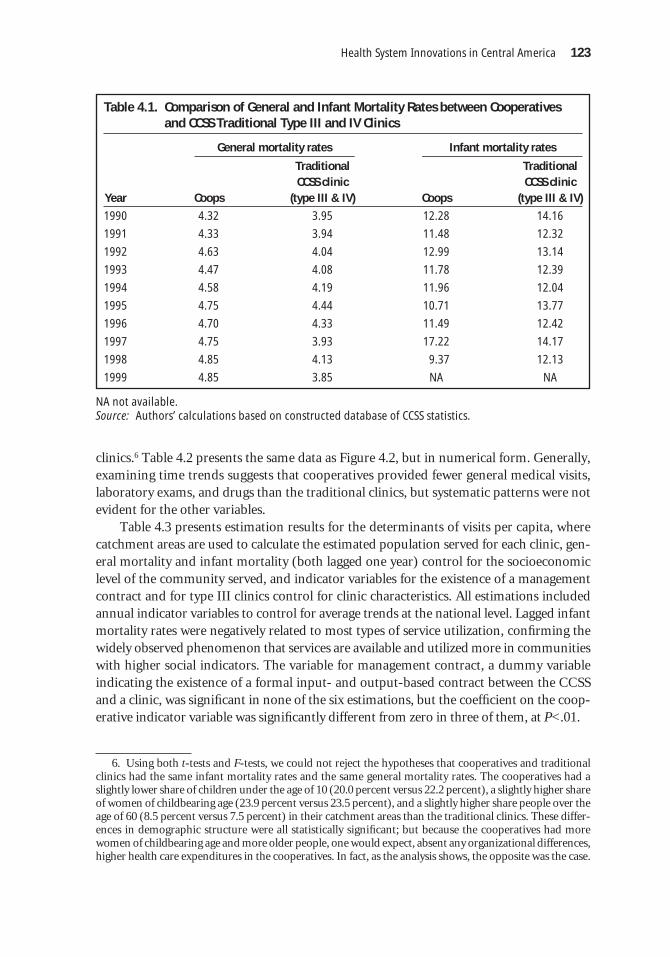
clinics.6 Table 4.2 presents the same data as Figure 4.2, but in numerical form. Generally,examining time trends suggests that cooperatives provided fewer general medical visits,laboratory exams, and drugs than the traditional clinics, but systematic patterns were notevident for the other variables.
Table 4.3 presents estimation results for the determinants of visits per capita, wherecatchment areas are used to calculate the estimated population served for each clinic, gen-eral mortality and infant mortality (both lagged one year) control for the socioeconomiclevel of the community served, and indicator variables for the existence of a managementcontract and for type III clinics control for clinic characteristics. All estimations includedannual indicator variables to control for average trends at the national level. Lagged infantmortality rates were negatively related to most types of service utilization, confirming thewidely observed phenomenon that services are available and utilized more in communitieswith higher social indicators. The variable for management contract, a dummy variableindicating the existence of a formal input- and output-based contract between the CCSSand a clinic, was significant in none of the six estimations, but the coefficient on the coop-erative indicator variable was significantly different from zero in three of them, at P<.01.
Health System Innovations in Central America 123
6. Using both t-tests and F-tests, we could not reject the hypotheses that cooperatives and traditionalclinics had the same infant mortality rates and the same general mortality rates. The cooperatives had aslightly lower share of children under the age of 10 (20.0 percent versus 22.2 percent), a slightly higher shareof women of childbearing age (23.9 percent versus 23.5 percent), and a slightly higher share people over theage of 60 (8.5 percent versus 7.5 percent) in their catchment areas than the traditional clinics. These differ-ences in demographic structure were all statistically significant; but because the cooperatives had morewomen of childbearing age and more older people, one would expect, absent any organizational differences,higher health care expenditures in the cooperatives. In fact, as the analysis shows, the opposite was the case.
Table 4.1. Comparison of General and Infant Mortality Rates between Cooperativesand CCSS Traditional Type III and IV Clinics
General mortality rates Infant mortality rates
Traditional Traditional CCSS clinic CCSS clinic
Year Coops (type III & IV) Coops (type III & IV)
1990 4.32 3.95 12.28 14.16
1991 4.33 3.94 11.48 12.32
1992 4.63 4.04 12.99 13.14
1993 4.47 4.08 11.78 12.39
1994 4.58 4.19 11.96 12.04
1995 4.75 4.44 10.71 13.77
1996 4.70 4.33 11.49 12.42
1997 4.75 3.93 17.22 14.17
1998 4.85 4.13 9.37 12.13
1999 4.85 3.85 NA NA
NA not available.Source: Authors’ calculations based on constructed database of CCSS statistics.

124W
orld Bank Working Paper
Table 4.2. Comparison of Average Service Provision Rates per Capita between Cooperatives and CCSS Type III and IV Clinics: Selected Service Categories
GP visits per capita Specialists visits per capita Emergency visits per capita Lab exams per visit Medicines per visit
Traditional Traditional Traditional Traditional Traditional CCSS clinic CCSS clinic CCSS clinic CCSS clinic CCSS clinic
Year Coops (type III and IV) Coops (type III and IV) Coops (type III and IV) Coops (type III and IV) Coops (type III and IV)
1990 1.45 1.41 0.57 0.54 0.39 0.16 0.81 1.86 1.67 3.04
1991 1.86 1.37 0.63 0.54 0.39 0.17 0.81 1.14 1.77 3.02
1992 1.96 1.35 0.53 0.56 0.44 0.19 0.86 1.19 1.81 3.01
1993 1.89 1.26 0.55 0.52 0.44 0.18 0.92 1.23 1.91 3.06
1994 1.78 1.30 0.53 0.53 0.36 0.34 0.99 1.17 1.85 3.05
1995 1.77 1.33 0.45 0.55 0.39 0.32 0.91 1.21 2.03 3.11
1996 1.78 1.24 0.42 0.57 0.41 0.35 0.94 1.22 2.07 3.00
1997 1.82 1.28 0.44 0.54 0.41 0.40 0.99 1.33 2.11 2.84
1998 1.84 1.25 0.48 0.48 0.43 0.41 0.99 1.34 2.06 2.82
1999 1.84 1.02 0.48 0.32 0.47 0.41 1.10 1.44 2.08 3.08
Source: Author’s calculations based on constructed database of CCSS statistics.
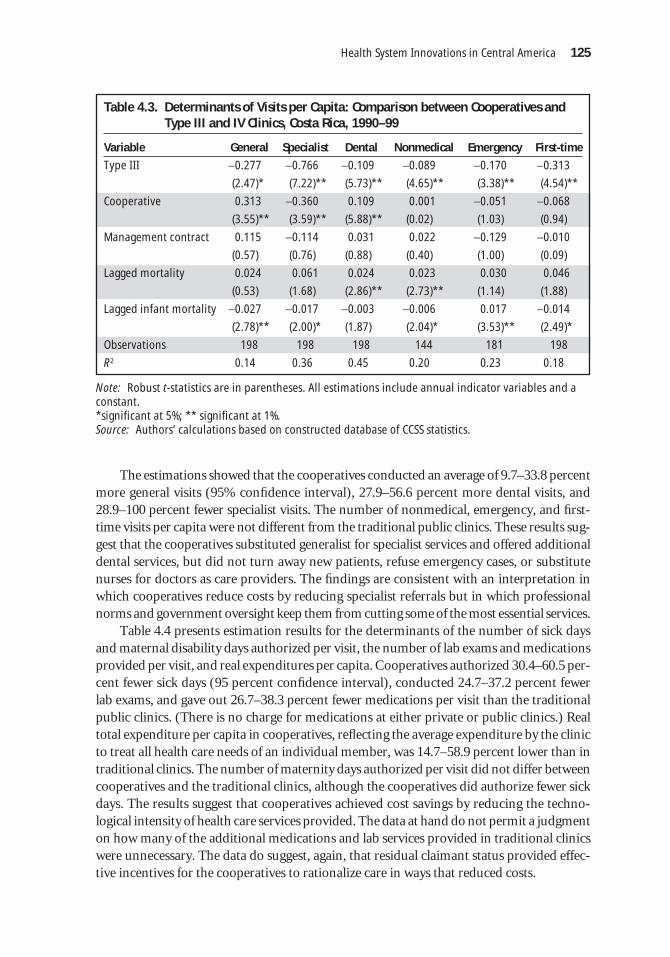
The estimations showed that the cooperatives conducted an average of 9.7–33.8 percentmore general visits (95% confidence interval), 27.9–56.6 percent more dental visits, and28.9–100 percent fewer specialist visits. The number of nonmedical, emergency, and first-time visits per capita were not different from the traditional public clinics. These results sug-gest that the cooperatives substituted generalist for specialist services and offered additionaldental services, but did not turn away new patients, refuse emergency cases, or substitutenurses for doctors as care providers. The findings are consistent with an interpretation inwhich cooperatives reduce costs by reducing specialist referrals but in which professionalnorms and government oversight keep them from cutting some of the most essential services.
Table 4.4 presents estimation results for the determinants of the number of sick daysand maternal disability days authorized per visit, the number of lab exams and medicationsprovided per visit, and real expenditures per capita. Cooperatives authorized 30.4–60.5 per-cent fewer sick days (95 percent confidence interval), conducted 24.7–37.2 percent fewerlab exams, and gave out 26.7–38.3 percent fewer medications per visit than the traditionalpublic clinics. (There is no charge for medications at either private or public clinics.) Realtotal expenditure per capita in cooperatives, reflecting the average expenditure by the clinicto treat all health care needs of an individual member, was 14.7–58.9 percent lower than intraditional clinics. The number of maternity days authorized per visit did not differ betweencooperatives and the traditional clinics, although the cooperatives did authorize fewer sickdays. The results suggest that cooperatives achieved cost savings by reducing the techno-logical intensity of health care services provided. The data at hand do not permit a judgmenton how many of the additional medications and lab services provided in traditional clinicswere unnecessary. The data do suggest, again, that residual claimant status provided effec-tive incentives for the cooperatives to rationalize care in ways that reduced costs.
Health System Innovations in Central America 125
Table 4.3. Determinants of Visits per Capita: Comparison between Cooperatives andType III and IV Clinics, Costa Rica, 1990–99
Variable General Specialist Dental Nonmedical Emergency First-time
Type III −0.277 −0.766 −0.109 −0.089 −0.170 −0.313
(2.47)* (7.22)** (5.73)** (4.65)** (3.38)** (4.54)**
Cooperative 0.313 −0.360 0.109 0.001 −0.051 −0.068
(3.55)** (3.59)** (5.88)** (0.02) (1.03) (0.94)
Management contract 0.115 −0.114 0.031 0.022 −0.129 −0.010
(0.57) (0.76) (0.88) (0.40) (1.00) (0.09)
Lagged mortality 0.024 0.061 0.024 0.023 0.030 0.046
(0.53) (1.68) (2.86)** (2.73)** (1.14) (1.88)
Lagged infant mortality −0.027 −0.017 −0.003 −0.006 0.017 −0.014
(2.78)** (2.00)* (1.87) (2.04)* (3.53)** (2.49)*
Observations 198 198 198 144 181 198
R2 0.14 0.36 0.45 0.20 0.23 0.18
Note: Robust t-statistics are in parentheses. All estimations include annual indicator variables and aconstant.*significant at 5%; ** significant at 1%.Source: Authors’ calculations based on constructed database of CCSS statistics.
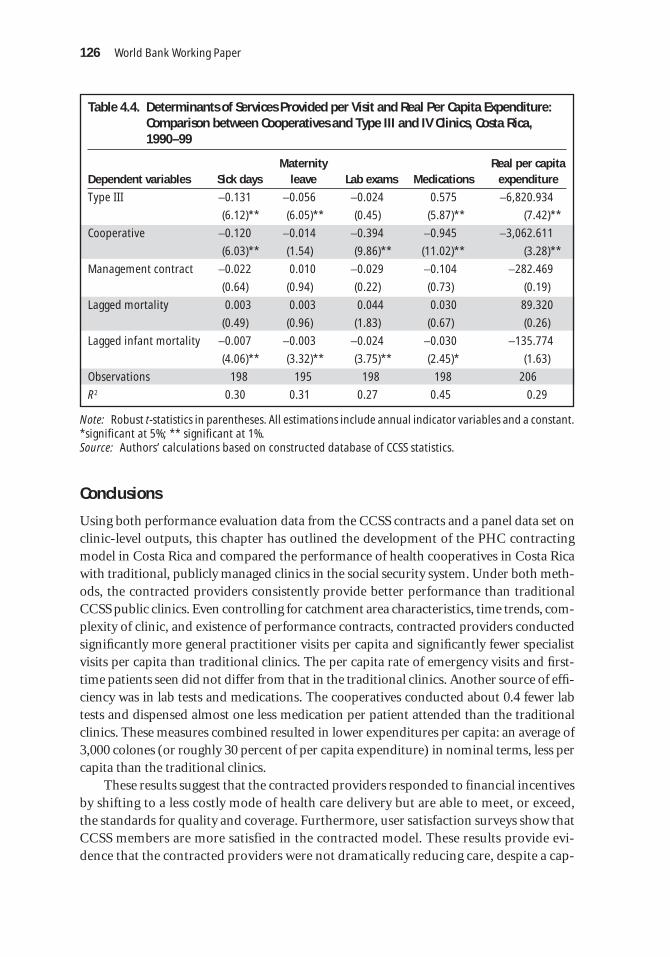
Conclusions
Using both performance evaluation data from the CCSS contracts and a panel data set onclinic-level outputs, this chapter has outlined the development of the PHC contractingmodel in Costa Rica and compared the performance of health cooperatives in Costa Ricawith traditional, publicly managed clinics in the social security system. Under both meth-ods, the contracted providers consistently provide better performance than traditionalCCSS public clinics. Even controlling for catchment area characteristics, time trends, com-plexity of clinic, and existence of performance contracts, contracted providers conductedsignificantly more general practitioner visits per capita and significantly fewer specialistvisits per capita than traditional clinics. The per capita rate of emergency visits and first-time patients seen did not differ from that in the traditional clinics. Another source of effi-ciency was in lab tests and medications. The cooperatives conducted about 0.4 fewer labtests and dispensed almost one less medication per patient attended than the traditionalclinics. These measures combined resulted in lower expenditures per capita: an average of3,000 colones (or roughly 30 percent of per capita expenditure) in nominal terms, less percapita than the traditional clinics.
These results suggest that the contracted providers responded to financial incentivesby shifting to a less costly mode of health care delivery but are able to meet, or exceed,the standards for quality and coverage. Furthermore, user satisfaction surveys show thatCCSS members are more satisfied in the contracted model. These results provide evi-dence that the contracted providers were not dramatically reducing care, despite a cap-
126 World Bank Working Paper
Table 4.4. Determinants of Services Provided per Visit and Real Per Capita Expenditure:Comparison between Cooperatives and Type III and IV Clinics, Costa Rica,1990–99
Maternity Real per capita Dependent variables Sick days leave Lab exams Medications expenditure
Type III −0.131 −0.056 −0.024 0.575 −6,820.934
(6.12)** (6.05)** (0.45) (5.87)** (7.42)**
Cooperative −0.120 −0.014 −0.394 −0.945 −3,062.611
(6.03)** (1.54) (9.86)** (11.02)** (3.28)**
Management contract −0.022 0.010 −0.029 −0.104 −282.469
(0.64) (0.94) (0.22) (0.73) (0.19)
Lagged mortality 0.003 0.003 0.044 0.030 89.320
(0.49) (0.96) (1.83) (0.67) (0.26)
Lagged infant mortality −0.007 −0.003 −0.024 −0.030 −135.774
(4.06)** (3.32)** (3.75)** (2.45)* (1.63)
Observations 198 195 198 198 206
R2 0.30 0.31 0.27 0.45 0.29
Note: Robust t-statistics in parentheses. All estimations include annual indicator variables and a constant.*significant at 5%; ** significant at 1%.Source: Authors’ calculations based on constructed database of CCSS statistics.

itated provider payment model, nor were they discouraging new patients, to reducecosts.
The findings presented suggest that the contracting model in Costa Rica is promising.Internal evaluations and additional survey work provide additional evidence of the model’ssuccess. Sixty-two percent of users surveyed favor the introduction of the private sector inthe supply of services, and 68 percent of users surveyed said that waiting times were low atthe cooperatives (in contrast to 55 percent at the traditional clinics).
To face the challenge of increasing coverage with existing resources, the contractingmodel appears to offer important opportunities for the CCSS to reduce costs and increasequality. As opposed to other experiences where the cost of care under the contracted modelhas increased—such as in Cambodia (Loevinsohn 2003) or in Chile, where the use of pri-vate providers has increased risk selection (Homedes and Ugalde 2002)—the use of con-tracted providers in Costa Rica has been carried out at lower costs than the public modeland with improvements in quality and satisfaction. The public bidding process introducedduring the last phase of contracting has succeeded in lowering the per capita price by morethan 30 percent (lower than the existing cooperatives and the traditional clinics) andimproved access and quality through introducing longer hours and home delivery formedications and lab results, among other improvements (Cercone and Briceño 2001).
The findings presented here have several policy implications for health care provisionin developing countries. First, nonprofit organizations in general, and cooperatives in par-ticular, might, with appropriate incentives and regulatory framework, be able to combineadvantages of public and private approaches to health care provision. Under certain con-ditions, they might be able to maintain accessibility, a sense of mission, and solidarity andefficiency in service provision. Second, Costa Rica’s experiment with cooperatives put inplace service agreements, audits, and performance evaluations to study the effects of thepolicy innovation and ensure that the contracting model was carried out in an appropri-ate regulatory framework. In experiments like this one, these regulations need to provideuseful information for enforcement of provisions but, at the same time, not be so burden-some as to compromise the autonomy of the service providers or increase transaction costs.Third, the contracting model should include performance objectives for quality, coverage,and user satisfaction, and these objectives should be set equal to or higher than the per-formance objectives established for public providers.
The collaboration between the private and public sectors by way of contracting outservices is a strategy used at increasing rates by developing countries to deal with challengesfacing the health sector. These include a rise in coverage, improvements in quality andeffectiveness of services, and a higher level of efficiency. Three critical aspects are tradi-tionally identified in contracting models. The first is identification of clear objectives andtargets, the second is the design of adequate incentives, and the third is the establishmentof monitoring and evaluation systems. To check whether a contracted provider is sustain-able, its value must be useful to society as well as to participants. As this chapter shows, coop-eration between both sectors has worked well in Costa Rica, where contracted providershave been running for long enough to produce reliable results. Clear evidence is shown thatthe public-private partnership model offers important opportunities to increase providerperformance within a sustainable framework.
Health System Innovations in Central America 127

Annex 4.1 Outline of CCSS Performance Contracts
General considerationsChapter 1: Objective
Package of servicesProduction targets
Chapter 2: Management of servicesOrganizationService delivery conditionsInformation systemsContinuous quality improvement
Chapter 3: Control and evaluationEvaluation proceduresMonitoringAnnual evaluation
Chapter 4: FinancingGeneral conditionsBudget limitCapitation rate
Performance indicatorsObjectives, indicators, and methodology for evaluation:
� Delivery of services� Quality� Organization� Equity in resource allocation� Management capacity� Relationship with specialized care� Billing of services
Signatures and protocol
Annex 4.2 Key Indicators Included in Performance Contracts
Provision of Health Services
Comprehensive care: To provide comprehensive health services to the entire popula-tion based on the "Basic Supply of Primary Health Services and Comprehensive CareStandards."
1. Distribution of the population.2. Coverage of first time visits within the year.3. Distribution of population by age and gender.4. Existence of the tri-annual Strategic Health Plan of Action, with social participa-
tion, and based on the Situation Analysis.
128 World Bank Working Paper

5. Coverage of Growth and Development of children under one year old, with qual-ity criteria (1%); Iron Prescription (1%); Early Capture (1%).
6. Coverage of Growth and Development of children of 1 to 6 years old, with qualitycriteria (0.5%).
7. Vaccination coverage with DPT, polio, hepatitis and H. influenza (0.25%).8. Vaccination coverage with MMR (0.25%).9. Care coverage for school-aged children, with quality criteria (0.5%).
10. Percentage of reference of problems of visual acuity in school-aged children (0.5%).11. Plan for the promotion of healthy lifestyles for adolescents (2.5%).12. Individual comprehensive care coverage for adolescents (2.5%).13. Coverage of cervical cancer detection in women from 15 to 34 years old (1%).
� Under 20 years old� From 20 to 35 years old� Coverage of cervical cancer detection in women 35 years and older (1%)� From 35 to 59 years old� 60 years and older
14. Percentage of irregular PAP smears according to quality criteria (0.5%).15. Prenatal care coverage, with quality criteria (1%).16. Application of a Diagnostic Tool on the access to contraception and prevention
methods for STDs and AIDS (0.5%).17. Coverage of people with diabetes, cared for the first time in the year, including
quality criteria (2.5%).18. Coverage of people with hypertension, cared for the first time in the year, includ-
ing quality criteria (2.5%).19. Detection screening for hypertension, in the population aged 20 years and older
(1%).20. Coverage of screening for people 60 years and older, including quality criteria
(1.5%).21. Plan of promotion of healthy lifestyles in people 60 years and older (2.5%).22. Coverage of preventive dental care for children from 2 to 9 years old (1%).23. Coverage of preventive dental care for adolescents from 10 to 19 years old (0.5%).24. Coverage of preventive dental care for pregnant women (1%).25. Evaluation of the dental status of the population (0.5%).26. Establishment of a School for Parents (1.5%).27. Evidence of the establishment of a course on the psychophysical preparation for
giving birth (1.5%).28. Percentages of emergencies (0.66%).29. Percentages of emergency references (0.66%).30. Emergency per inhabitant (0.68%).31. Laboratory tests by outpatient consultation (0.4%).32. Drug prescriptions by outpatient consultation (0.4%).33. Drug prescriptions per inhabitant (0.4%). 34. Waiting time for drug delivery (0.4%). 35. Radiological studies requested by outpatient consultation (0.4%). 36. Evidence of coordination between levels (1.5%).37. Referral levels (1.5%).
Health System Innovations in Central America 129

Quality of Services
To promote and encourage the delivery of quality services, placing special emphasis ontimely access by the population to health services, technical quality, and user andprovider satisfaction, using the continuous improvement approach.
38. Health records with incorporated forms and complete information (2.5%). 39. Current family files (2.5%). 40. External user satisfaction. 41. Comprehensive analysis of a critical area derived from the user satisfaction survey. 42. Study of a tracer entity. 43. Analysis of infant mortality. 44. Compliance with the terms established for sending the biomedical information,
with the defined quality level (2%). 45. Compliance with the terms established for sending the expense reports, with the
defined quality level (2%). 46. Establishment of an Office of the Controller of Health Services (1%). 47. Progressively incorporate pertinent elements to the quality assurance of the
processes of care, as established in the ISO–9000 standards.
Organization
Managerial Function
To develop and strengthen the local managerial function that allows the adequate useof existing resources, meets goals, and obtains a positive impact on the health of the pop-ulation.
To make the administrative systems operational that permit greater self-sufficiency inmanagement.
Second Level of Care
� % of referrals sent to the tertiary level by specialty.� Total of referrals at the tertiary level by specialty times 100/total of consultations
of the area by specialty. � Analyses of the 5 most frequent causes of referrals at the tertiary level, by specialty. � % of referrals served by specialty (1%)� Total of referrals served by specialty times 100/total of consultations of the spe-
cialty (1%). � Analysis of the referred cases at the primary and secondary level by specialty (1%). � Review of the referrals (at the primary and secondary level) prior to being sent to
the tertiary level. � Percentage of counter-referrals from the secondary to the primary level (1%). � Educational activities at the primary level. � Nº of educational activities carried out by a specialist based on the analysis of the
references and inter-consultations and/or the most frequent problems cared forin the clinic (1%).
� Active participation of the specialists in the selected tracer and in the Infant Mor-tality analysis (0.5%).
130 World Bank Working Paper
� Percentage of counter-referrals from the secondary to the primary level (1%). � Total of counter-referrals times 100/total of references. � Analysis of the 5 reference causes from the primary level to the secondary level
(1%). � Analysis of the waiting period by specialty. � Waiting period for care for cases of cytologies with moderate dysplasia and
beyond.� Analysis of the compliance by specialty, of including in the patient’s file: the clin-
ical history, diagnosis, identification of risk and plan of intervention for first timecases by specialty.
� Analysis of the compliance with protocols or standards in addressing the two mostfrequent pathologies by specialty.
Bibliography
Bennett, Sara, McPake, Barbara, Mills, Anne London. 1997. Private Health Providers inDeveloping Countries: Serving the Public Interest? London: Zed Books.
Buglioli, Marisa. 2000. “El gasto no deja de crecer.” Available at www.escenario2.org.uy/numero2/buglioli (accessed March 7, 2005).
Caja Costarricense de Seguro Social (CCSS). 1997. Hacia un nuevo sistema de asignación derecursos. San José, Costa Rica.
Cercone, James, and Rodrigo Briceño. 2001. La cooperación pública y privada en acción: el casode las cooperativas de servicios de salud en Costa Rica. 1988–2000. San José, Costa Rica:Sanigest Internacional.
Chee, Grace. 1998. “Working with Private Providers to Improve the Delivery of PriorityServices.” Partnership for Health Reform. Available at www.phrproject.com (accessedMarch 7, 2005).
Departamento de Estadística, CCSS. Several years. Anuario Estadístico. Dirección Actuar-ial y de Planificación Económica, Presidencia Ejecutiva. San José, Costa Rica.
Durán, Valverde, Fabio Muñoz, Daniel Corea, and Elizabeth Rodríguez Jiménez. 1995.“Una evaluación económica y financiera de las modalidades de gestión de serviciosambulatorios de salud mediante Cooperativas.” Departamento de Estudios Económi-cos, Dirección Actuarial y de Planificación Económica, Presidencia Ejecutiva, CajaCostarricense de Seguro Social, San José, Costa Rica.
Eichler, Rena. 2002. “Adquisición estratégica en Haití para mejorar los sistemas sanitarios:¿Por qué pagar por inversiones cuando se puede pagar por resultados?” Paper presentedat Foro de Europa y las Américas sobre Reforma del Sector Salud, Málaga, May 24–27.
Eichler, Rena, Paul Auxila, and John Pollock. 2001. Performance-Based Payment to Improvethe Impact of Health Services: Evidence from Haiti. Washington, D.C.: World BankInstitute Online Journal.
England, Roger. 1997. Contracting in the Health Sector: A Guide to the Use of Contractingin Developing Countries. London: Institute for Health Sector Development.
Gauri, V., J. Cercone, and R. Briceño. 2004 “Separating Financing from Provision: Evidencefrom 10 years of Partnership with Health Cooperatives in Costa Rica.” Health Policyand Planning 19(5):292–301.
Health System Innovations in Central America 131

Giustu, D., B. Criel, and X. De Bethune. 1997. “Viewpoint: Public versus Private HealthCare Delivery: Beyond the Slogans.” Health Policy and Planning 2(3):192–98.
Hebrang, A., N. Henigsberg, V. Erdeljic, S. Foro, V. Vidjak, A. Grga, and T. Macek. 2003.“Privatization in the Health Care System of Croatia: Effects on General Practice Acces-sibility.” Health Policy and Planning 18(4):421–28.
Herrero, Villalta y Asociados. 1992. Diseño de la estructura de costos y estructura tarifaria paralos servicios contratados con las cooperativas autogestionarias de salud.San José, CostaRica: Comisión de Enlace, Gerencia Financiera y Gerencia Médica, Caja Costarricensede Salud.
Homedes, N., and A. Ugalde. 2002. “Health Services Privatization: The Experiences ofChile and Costa Rica.” Gaceta Sanitaria 16(1):54–62.
Ibern, Pere. 1999. Incentivos y contratos en los servicios de salud. Barcelona: Springer.Instituto Nacional de Estadísticas y Censos (General Department of Statistics and Census).
Various years. Mortalidad infantil y evolución reciente. Boletín Anual. Area de Estadís-ticas Continuas. Unidad de Estadísticas Sociodemográficas. San José, Costa Rica.
Koppel, A., K. Meiesaar, H. Valtonen, A. Metsa, and M. Lember. 2003. “Evaluation of Pri-mary Health Care Reform in Estonia.” Social Science and Medicine 56(12):2461–66.
La Forgia, Gerard, and Roberto Gutiérrez. 2000. “Las dificultades del cambio: el modelode seguridad social nicaragüense en transición.” Paper presented at Foro de Europa ylas Américas sobre Reforma del Sector Salud, San José, Costa Rica, May 24–26.
Lòpez-Casasnovas, Guillem. 2003. El interfaz público privado en sanidad. Barcelona: Masson.Loevinsohn, Benjamin. 2003. “Contracting for the Delivery of the Primary Health Care in
Cambodia: Design and Initial Experience of a Large Pilot Test.” Working Paper. WorldBank, Washington, D.C.
Mills, Anne. 1998. “To Contract or Not to Contract? Issues for Low and Middle IncomeCountries.” Health Policy and Planning 13(1):32–40.
Ministry of Health, Information Center. 2000. “Evolución de la mortalidad infantil enCosta Rica. 1988–1998.” San José, Costa Rica.
Mintz, Patricia, Gerard La Forgia, and William Savedoff. 2001. “Contracting Health Services:Getting from Here to There.” World Bank, Washington, D.C.
Miranda, Guido. 1995. “La salud en Costa Rica.” En Estado de la Nación en Desarrollo HumanoSostenible. San José, Costa Rica: Programa de Naciones Unidas para el Desarrollo.
Musgrove, Phillip. 1996. “Public and Private Roles in Health: Theory and Financing Patterns.”Health, Nutrition, and Population Discussion Paper. World Bank, Washington, D.C.
Newbrander, William, Carlos J. Cuella, and Barbara K. Timmons Barbara K. “The PROS-ALUD Model for Expanding Access to Health Services.” Management Sciences forHealth, Inc., Boston, Mass.
Nieves, Isabel, and Gerard La Forgia. 2000. “Contratación gubernamental de ONG a granescala para extender los servicios básicos de salud a las poblaciones pobres en Guatemala.”Paper presented at Foro de Europa y las Américas sobre Reforma del Sector Salud,San José, Costa Rica, May 24–26.
Ovretveit, John. 1995. Purchasing for Health. Buckingham: Open University Press.Picado, Gustavo. 1999. “Gestión de las cooperativas de salud: Una evaluación con base en
algunos indicadores financieros y de producción.” Documento de Trabajo de la Direc-ción Actuarial y de Planificación Económica. Departamento de Estudios Económicos,Caja Costarricense de Seguro Social, San José, Costa Rica.
132 World Bank Working Paper

Palmer, N., A. Mills, H. Wadee, L. Wilson, and H. Schneider. 2003. “A New Face for PrivateProviders in Developing Countries: What Implications for Public Health?” Bulletin ofthe World Health Organization 81(4):292–97.
Pezza, P. E., and J. F. Barquero Bolaños. 1994. “Clinica Tibas: a public-private partnershipfor health care delivery in Costa Rica.” American Journal of Public Health 84(2):315–16.
Precker, Alexander, and April Harding. 2000. La economía de los roles público y privado ensalud. Washington, D.C.: Health, Nutrition and Population and World Bank.
Puig-Junoy, Jaume. 1999. “Manejando los incentivos de selección de riesgo en las refor-mas a los sectores de salud.” International Journal of Health Planning Management14(4):287–311.
Reich, Michael. 2002. Public-Private Partnerships for Public Health. Harvard Series onPopulation and International Health. Cambridge, Mass.: Harvard University Press.
Rodríguez, Elizabeth. 1999. “Costo financiero de la modalidad de atención de serviciosde salud mediante cooperativas: un análisis de su evolución reciente.” Documento deTrabajo de la Dirección Actuarial y de Planificación Económica. Departamento deEstudios Económicos, Caja Costarricense de Seguro Social, San José, Costa Rica.
Slack, Catherine, and William Savedoff. 2001. “Public Purchaser-Private Provider Contract-ing for Health Services: Examples from Latin America and the Caribbean.” SustainableDevelopment Department Technical Papers Series. Inter-American Development Bank,Washington, D.C.
Taylor, Rob, and Simon Blair. 2002. “Public Hospitals. Options for Reform through Pub-lic-Private Partnerships. Public Policy for the Private Sector.” Note Number 241.World Bank Group, Private Sector and Infrastructure Network. Available at http://rru.worldbank.org/Documents/PublicPolicyJournal/241Taylo-010802.pdf (accessedMarch 7, 2005).
United Nations Development Programme. 1990–2000. Estado de la Nacion. San José, CostaRica.
Vining, Aidan, and Steven Globerman. 1999. “Contracting-Out Health Care Services:A Conceptual Framework.” Health Policy 46(2):77–96.
Vining, A. R., and D. L. Weimer. 1990. “Government Supply and Government ProductionFailure: A Framework Based on Contestability,” Journal of Public Policy 10:1–22.
Widdus, Roy. 2001. “Public-Private Partnerships for Health: Their Main Targets, TheirDiversity, and Their Future Directions.” Bulletin of the World Health Organization79(8):713–20.
World Bank. 1995. Bureaucrats in Business: The Economics and Politics of GovernmentOwnership. New York: Oxford University Press.
Wouters, Anne Marie. 1998. Métodos alternativos de pago a proveedores: incentivos paramejorar la prestación de los servicios de salud. Bethesda, Md.: Partnerships for HealthReform.
Health System Innovations in Central America 133

CHAPTER 5
135
The Nicaraguan Social SecurityHealth Insurance Scheme—
A Promising Work in Progress
John L. Fiedler and Gerard M. La Forgia
Abstract
In 1993, the Nicaraguan Social Security Institute (Instituto Nicaragüense deSeguridad Social [INSS]) introduced a new health care financing and servicesdelivery scheme, the Previsional Health Model (Modelo de Salud Previsional[MSP]). The MSP is a competitive, managed-care model that pays a fixed,monthly capitation fee to certified public and private sector firms to provide adefined, basic package of health services to social security affiliates and theireligible dependents. It constitutes a new approach that marks a decisive breakfrom the INSS’s traditional mode of operation and the way in which mostsocial security health systems in Latin America function. The coverage of the MSP has expanded slowly and is now approaching a half million persons,8 percent of the national population. It provides more than 40,000 hospital-izations and more than 2 million outpatient visits. Provisional health firms(empresas médicas previsionales [EMPs]) provide affiliates an average ofmore than five medical consultations annually, and the affiliates’ hospitalizationrate is 98 per 1,000. In comparison to the Ministry of Health, the outpatientconsultation rate of the EMPs is 10 times higher, their hospitalization rate is30 percent higher, and their hospitalization rate exclusive of births is 60 per-cent higher. Satisfaction surveys testify that the EMPs have achieved generallyhigh levels of satisfaction among both patients and physicians. This chapterprovides a case study of the structure, operations, performance, evolution,and impact of the MSP. The goal is to provide an understanding of the modeland how it was implemented to serve as a model for other countries to con-sider adopting.

In 1993, the Nicaraguan Social Security Institute (Instituto Nicaragüense de SeguridadSocial [INSS]) introduced a new health care financing and services delivery scheme,the MSP. The MSP is a competitive, managed-care model that provides a fixed, monthly
capitation fee to certified public and private sector firms to provide an explicitly defined,basic package of health services to social security affiliates and their eligible dependents.This chapter provides a case study of the structure, operations, performance, evolution,and some measures of impact of the MSP.
The MSP represented a radical shift in how health care is financed, organized, and pro-vided in Nicaragua. The introduction and evolution of the model reflect both contextual fac-tors as well as trends in health system reform evident in the 1990s. We turn first to context.
The MSP became a reality because it was not inserted into, nor did it replace, an exist-ing system. In the early 1990s, the INSS did not possess a direct delivery system. The San-dinista regime (1978–92) had created a unified system in which all financing and inputswere unified. All public funding (including payroll taxes) for health care was channeledthrough a centralized system in which medical facilities were owned and operated by asingle state institution, the Ministry of Health (Ministerio de Salud [MINSA]). MINSAdirectly purchased all inputs, including (salaried) personnel and supplies, through bud-getary allocations. With the end of the Sandinista regime in 1992, the new governmentsought to explore alternative models for social insurance-financed health care more in linewith its focus on developing a market economy. After regaining institutional control overthe use of funds derived from the health portion of the payroll tax, the INSS exploredstrategies, organizational structures, and institutional arrangements with the intent ofestablishing an alternative system. What emerged was a compromise model that repre-sented profound institutional and structural change while retaining direct links to MINSA.This chapter describes the major features of the model, how they changed over time, andtheir impact on performance.
The MSP is a resource allocation and purchasing arrangement that features key healthsystem functions related to financing, risk protection, purchasing, provision, and over-sight. It contains reform elements common to reforms implemented elsewhere in publiclyfinanced and social insurance systems pertaining to the introduction of market mecha-nisms such as competition, contracting, consumer freedom of choice, and partnership withthe private sector (Organisation for Economic Co-operation and Development 1994; Salt-man and Figueras 1997; Slack and Savedoff 2001; Schieber 1997). It is another example ofan emerging managed-care model developed in Latin America (such as Colombia’s HealthPromotion Entities, Uruguay’s Collective Institutions of Medical Assistance, and Argentina’sSocial Works) in which medical care organizations are contracted by payroll tax-financedsocial insurance institutions and receive a capitated payment to provide a defined benefitpackage to specific populations (Medici and others 1997). These organizations generallyfocus on service provision but also assume an insurance function because they are at finan-cial risk for the cost of providing the benefit package.
This chapter first describes the analytic framework used to assess the MSP. The secondsection provides an overview of Nicaragua’s health and the health care delivery system. Itthen describes the MSP’s design, structure, and performance, and assesses its impact onMINSA and the entire health sector. The chapter concludes with a discussion of lessonslearned from this innovative and still evolving program, and considers its potential replic-ability in other countries.
136 World Bank Working Paper

Analytic Framework
This chapter draws on health system frameworks used to analyze insurance systems,resource allocation and purchasing arrangements, and managed care practices (Figueras,Robinson, and Jakubowski 2005; WHO 2000; Preker and others 2001; La Forgia, Griffin,and Bovbjerg 1993; Enthoven 1993). This section presents the major elements of the frame-work with a brief discussion of potential issues relevant to the Nicaraguan and MSP con-texts that are identified in the broader literature on health service purchasing.
Financing
How to raise (and collect) funds effectively and fairly? Similarly to social insurance systemsthroughout the world, the MSP is funded through a mandatory payroll tax. Issues caninvolve: (a) complementary financing or subsidies originating from general governmentrevenues and directed to the social insurance system, contributing to broader systeminequity; (b) the tapping of pension reserves to finance deficits in the health regimen, whichsuggests inefficiencies in the organization and delivery of care; (c) employer evasion, whichthreatens the financial stability of the entire social insurance system; and (d) degree of costsharing with patients to address moral hazard without leaving them unprotected (Jönssonand Musgrove 1997; Mesa-Lago 1992; Baeza 2005).
Benefit Package Definition
What to buy? Ideally, the benefit package must be within the financial means of the over-all system, aligned with broad national health priorities and policies to maximize healthstatus while addressing cost-effectiveness, equity, and consumer preference concerns. Thisis no easy task, in part because of theoretical and methodological obstacles and the absenceof robust data in most countries. In practice, benefit definition is often based on an implicitprocess and does not follow a single method or model (Hauck, Smith, and Goddard 2005).Another benefit design issue relates to moral hazard. Because the insured tend to demandmore services that they would without such coverage, insurance systems may establishexclusions for pre-existing conditions or limit the scope and coverage of services. At thesame time, the package should be sufficiently comprehensive to avoid inequities resultingfrom “service selection” and dumping by providers. In other words, in systems with sepa-rate social insurance and government-financed delivery systems, a truncated benefit pack-age in the former can result in the selective use of the public system for more expensivecare. This amounts to a hidden cross-subsidy from the public system (Puig-Junoy 1999;Lobato 2002).
Membership and Enrollment
For whom to buy? In developing countries, social insurance schemes generally cover com-paratively well-off segments of society while health ministries cover the poor. Issues concernthe inefficiencies and inequities related to multiple-tier or segmented systems’ inadequatecoverage of dependents, as well as competition for scarce inputs, particularly doctors andnurses (Londoño and Frenk 1997; Gwatkin 2005; Inter-American Development Bank 1996;
Health System Innovations in Central America 137

Mesa-Lago 1992). In systems in which potential members select a medical care organiza-tion or provider, they need unbiased information on benefits, providers, co-payments, andso forth to make a meaningful selection. Provider- or employer-based enrollment may leadto distorted information and possible provider risk selection (La Forgia and others 2004;Baeza 2005; Gold, Sparer and Chu 1998; Barry and Connors 1997).
Risk-pooling and Payment Mechanisms
How to distribute the financial burden fairly? How to pay? Risk pooling involves collectingrevenues, grouping high-cost (high-risk) and low-cost (low-risk) individuals, and transfer-ring both revenues and individuals fairly among medical care organizations and providers.Social insurance systems generally form large, compulsory insurance pools consisting of for-mally employed workers. This reduces the probability of adverse selection. However, if therisk pool is fragmented into smaller risk pools—through permitting competition for mem-bers among medical care organizations (that combine insurance and provision functions)or providers, which in turn are also paid on a capitated basis—these organizations have anincentive to adopt risk selection and avoidance strategies, such as enrolling low-risk indi-viduals (Puig-Junoy 1999; Chollet and Lewis 1997; Smith and Witter 2005; Langenbrun-ner and Liu 2005). Although removing the incentive for overprovision, flat-rate capitationpayments create incentives for providers to reduce the volume and quality of care. Calcu-lation of the capitation payment is a data-intensive exercise that is made more difficult bythe weak information environments of many health systems in developing countries.
Contracting Arrangements and Service Provision
From whom to buy? How to contract? Government purchasing of private health servicesis becoming increasingly common throughout the world. At the same time, however, thispractice remains controversial. Although no ideal contracting strategy can be applied to allsituations, contracting works best when the purchaser has the institutional and technicalcapacity to select providers, specify services and outputs, monitor contract compliance,evaluate performance, and maximize competition. A favorable regulatory environment(such as few barriers to market entry) and a sufficient supply of capable providers to stimu-late competition are also considered enabling factors (Taylor 2003; Mills 1998; MontenegroTorres and Baeza 2005; Slack and Savedoff 2001). But the absence of purchasing capacity andenabling factors should not be viewed as a deterrent to contracting (see La Forgia, Mintz, andCerezo in this volume).
Contracts in which full or partial risk is transferred to providers present another set ofissues. These are often known as risk and performance-based contracts and contain mech-anisms (such as withholds, bonuses, carve-outs, and so on) that hold providers account-able for costs, volume, or quality (Kongstvedt 2001a, 2001b). Finally, Palmer and Mills(2003) assert that formalistic competitive contracting may not be appropriate in some low-capacity and resource-poor settings evident in many developing countries. Palmer andMills suggest that in these settings, relational contracting may work best because main-taining the contract is paramount to both parties and thus stimulates “the need to harmo-nize conflict and preserve the relation . . .” (p. 1007).
138 World Bank Working Paper

Management and Oversight
How to ensure results that are reliable and acceptably managed? Purchasing agenciesact as an organizer of providers, guide to enrollees, and monitor of performance toensure the delivery of high-quality care. They hold providers accountable, but need toknow they are getting what they paid for. Important oversight functions include regu-lation (for example, compliance with standards and requirements); consumer advo-cacy, monitoring, and evaluation; and information collection and dissemination. However,these functions are generally weakly developed in health ministries and social insuranceinstitutions (Slack and Savedoff 2001). Also, although utilization control, cost con-tainment, and quality management are essential functions of providers and medicalcare organizations, weak managerial capacity in these areas appears endemic in boththe private and public sectors and thwarts the performance of reform efforts (Mediciand others 1997; Kutzin and others 2001; Mills 1998; Lember 2002). Poor oversight andweak managerial capacity threatens the long-term viability of most resource allocationsand purchasing arrangements, but they are particularly detrimental to ones with a marketorientation (Preker and others 2001).
Overview: Health and the Nicaraguan Health Care System
With a per capita gross domestic product (GDP) of about US$500 in 2000, Nicaragua isthe second-poorest country in the Western Hemisphere. Nearly half of the population of5.2 million lives in poverty. Nicaragua is in the early stages of an epidemiological transi-tion, with elevated levels of infant and maternal mortality (40 per 1,000 live births and 139per 100,000 live births, respectively), a high prevalence of infectious and parasitic diseases,and pervasive malnutrition. Although infant mortality has declined from 83 per 1,000 in1985 to 40, it remains 33 percent above the Central American average. Infant and mater-nal mortality continue to account for the majority of all premature deaths and are due toinfectious diseases, malnutrition, and birth-related mortality. Although Nicaragua devotesa higher share of GDP to health than other countries in the region, it has one of the lowestabsolute levels of per capita spending.
There have been three distinct eras in the recent history of health care services inNicaragua. The first era began in 1957 with the founding of the INSS and lasted until 1979,when the Sandinista government ascended to power. During this era, the INSS owned anetwork of health facilities, had its own staff of health care providers, and was a directprovider of medical care—much like many other social security systems in the region. Dur-ing the second era, the Sandinista government established a single, national health system,Sistema Nacional Unico de Salud (Universal National Health System [SNUS]), and elim-inated the INSS health care system by transferring INSS facilities and personnel to theMINSA. With the establishment of SNUS, INSS beneficiaries experienced a substantialreduction in access to care and in the quality of care they received. Many INSS beneficia-ries and their employers began to decry that their social security contributions had beentransformed into a nonspecific, indirect tax, and enrollment in the program fell as socialsecurity tax evasion grew. Dissatisfaction with MINSA services by the INSS insured con-tributed to widespread evasion of the payroll tax by employers.
Health System Innovations in Central America 139

The third era began in November 1993 and was marked by the introduction of theMSP. The new system was structured so as to separate the functions of financing and healthcare provision. It reintroduced health care services transparently financed by the INSS, butrather than resurrecting its previous role as a direct provider of care, the INSS now con-tracted certified public and private entities—referred to as previsional medical firms(empresas médicas previsionales [EMPs])—to provide a defined set of health care servicesto INSS-insured workers and their dependents in exchange for a monthly fixed fee perinsured worker. Separation of the financing and care functions within the new scheme wasregarded as essential to ensuring that the structure of the system would provide betterincentives to contain costs and provide quality care.Since its founding, the MSP has grown at a faster pace than INSS officials anticipated.Between 1994, the program’s first full year in operation, and 2001:
� The number of INSS affiliates enrolled in an EMP grew by more than fivefold.� The number of new EMPs has tripled.� The number of outpatient visits provided by EMPs increased 16-fold.� The number of EMP-provided hospitalizations increased 28-fold.
In 2002, 16 percent of the labor force participated in the MSP, and 396,000 MSP benefi-ciaries—8 percent of the national population—were enrolled in 48 EMPs and received atotal of 2 million outpatient visits and roughly 39,000 hospitalizations. The MSP hasbecome an important and dynamic component of the health sector of Nicaragua.
The Design and Structure of the MSP
Enrollment Eligibility and Beneficiaries
INSS programs vary by type of benefit, type of worker, and whether the worker’s affiliationis mandatory or voluntary. The basic package of INSS benefits consists of the Incapacity,Old Age and Death Insurance (Invalidez, Vejez y Muerte [IVM]) and the Professional RisksInsurance (Riesgos Profesionales [RP]). More than 99 percent of INSS affiliates participatein both of these programs, the combination of which is referred to as the IVM-RP. TheINSS also has a Sickness-Maternity Insurance (Seguro Enfermedad-Maternidad [SEM]).This is the program that provides medical care services through the MSP. Not all INSS affil-iates participate in the SEM, thus not all INSS affiliates are eligible to participate in theMSP.1 In 2000, 76 percent of INSS affiliates who were enrolled in the IVM-RP also con-tributed to the SEM. Workers who contribute to both the IVM-RP and the SEM are in whatis referred to as the integrated regime (régimen integral [RI]), and only they are eligible toparticipate in the MSP by enrolling in an EMP.
140 World Bank Working Paper
1. Historically (in the pre-1979 era) only those workers who lived in a department where the INSSowned and operated a health facility, and thus had access to INSS care, were required to contribute to theSEM. Under the MSP, this criterion has been reintroduced. Because the location of EMPs extends to newdepartments, so too does the mandate to participate in and contribute to the SEM. The proportion of allINSS affiliates who are in the RI has grown from 63 percent in 1993 to 84 percent in 2002.
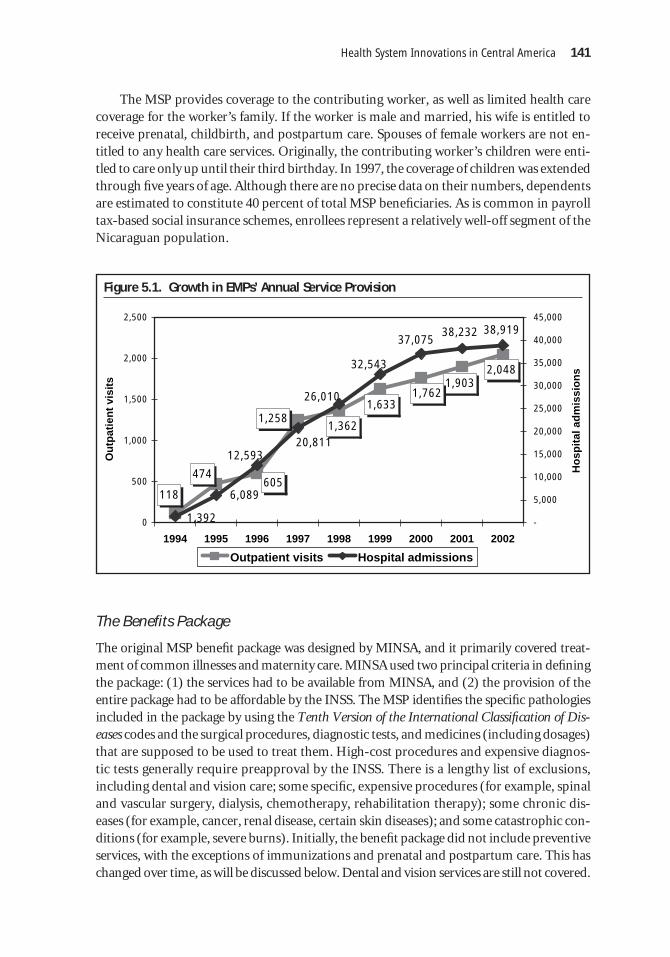
The MSP provides coverage to the contributing worker, as well as limited health carecoverage for the worker’s family. If the worker is male and married, his wife is entitled toreceive prenatal, childbirth, and postpartum care. Spouses of female workers are not en-titled to any health care services. Originally, the contributing worker’s children were enti-tled to care only up until their third birthday. In 1997, the coverage of children was extendedthrough five years of age. Although there are no precise data on their numbers, dependentsare estimated to constitute 40 percent of total MSP beneficiaries. As is common in payrolltax-based social insurance schemes, enrollees represent a relatively well-off segment of theNicaraguan population.
Health System Innovations in Central America 141
Figure 5.1. Growth in EMPs’ Annual Service Provision
1,2581,633
2,0481,903
1,762
1,362
605474
118
1,392
6,089
38,23237,075
20,81112,593
38,919
26,010
32,543
0
500
1,000
1,500
2,000
2,500
1994 1995 1996 1997 1998 1999 2000 2001 2002
Ou
tpat
ien
t vi
sits
-
5,000
10,000
15,000
20,000
25,000
30,000
35,000
40,000
45,000
Ho
spit
al a
dm
issi
on
s
Outpatient visits Hospital admissions
The Benefits Package
The original MSP benefit package was designed by MINSA, and it primarily covered treat-ment of common illnesses and maternity care. MINSA used two principal criteria in definingthe package: (1) the services had to be available from MINSA, and (2) the provision of theentire package had to be affordable by the INSS. The MSP identifies the specific pathologiesincluded in the package by using the Tenth Version of the International Classification of Dis-eases codes and the surgical procedures, diagnostic tests, and medicines (including dosages)that are supposed to be used to treat them. High-cost procedures and expensive diagnos-tic tests generally require preapproval by the INSS. There is a lengthy list of exclusions,including dental and vision care; some specific, expensive procedures (for example, spinaland vascular surgery, dialysis, chemotherapy, rehabilitation therapy); some chronic dis-eases (for example, cancer, renal disease, certain skin diseases); and some catastrophic con-ditions (for example, severe burns). Initially, the benefit package did not include preventiveservices, with the exceptions of immunizations and prenatal and postpartum care. This haschanged over time, as will be discussed below. Dental and vision services are still not covered.

In addition to the medical care benefits, the MSP pays monetary subsidies for maternityand short-term sickness.
MSP Financing and the EMP Contracting and Payment Mechanism
The SEM branch of the INSS is financed by an 8.5 percent payroll tax, known as the tech-nical quota (cuota técnica [CT]). The CT is the source of revenues used to pay for both themedical care and the monetary subsidies received by MSP affiliates who are granted mater-nity or sick leave. The CT is one-half of the total INSS payroll tax.
Health care agencies interested in participating in the MSP must be certified to becomean EMP. To become certified, a would-be EMP must:
� demonstrate its capacity to deliver the benefit package—primarily by meeting INSS-established, minimal qualitative and quantitative human resource and physicalinfrastructure requirements;2
� provide evidence that it is incorporated;� demonstrate its financial viability by (a) performing a market analysis that projects
revenues based on assumptions concerning the number of enrollees the EMP isexpected to garner and (b) meeting a minimum capital requirement, which con-sists of presenting a bank guarantee or providing evidence that it has assets that areequivalent in value to the estimated gross revenues derived from the MSP duringone month;
� agree to allow the INSS to retain a reserve fund of at least 5 percent of the EMP’smonthly total capitation payment in a separate account to protect the EMP againsthigher than expected expenses and bankruptcy;
� agree to provide the basic package of services to all of its enrollees and their eligi-ble dependents;
� agree to pay the economic subsidy that the INSS pays sick and temporarily inca-pacitated, insured workers;
� agree to receive a specified per capita allotment as payment in full for all of the item-ized basic services demanded by the insured and their eligible dependents;
� sign a contract agreeing to these terms.
Most of these EMP requirements are minimally structural, legal, and financial in nature.There are a few process indicators—some service delivery statistics must be reported to theINSS—but no quality or outcome indicators. The contract between the INSS and an EMPis a “take it or leave it” proposition. There are no reinsurance requirements, and no EMPuses reinsurance in managing its financial risks.
The INSS uses an open contracting strategy in certifying EMPs: any organization thatfulfills the requirements of certification is offered a contract. This approach supports INSSgoals of expanding coverage and improving access to care, as well as encouraging the orga-nization of the private provider market.
142 World Bank Working Paper
2. The most important of these requirements is that they must have a specified minimum number ofphysicians and hospital beds per enrollee.

Supervision and Monitoring of the EMPs
INSS responsibilities in implementing the model include certifying would-be EMPs, mak-ing monthly payments to each insured worker’s EMP, and supervising compliance withthe agreement. The INSS employs 20 physician supervisors, roughly half of whom are per-manently stationed in one of the largest EMPs to monitor all MPS-related matters. Theother half makes on-site visits to EMPs, generally in response to an enrollee complaintrelated to being poorly treated or the EMP’s provision of only a portion of a covered ben-efit or refusal to provide treatment. Since 1994, the INSS has made more than 1,200 super-visory visits to EMPs. During these visits, INSS supervisors inspect the physical plant andequipment of the EMP, physicians and patients are interviewed, and medical records arereviewed. EMPs found not to be in compliance with the terms of their contract are subjectto sanctions. There are three categories of sanctions—minor, serious, and severe. Minorinfractions result in either a verbal reprimand or a fine of up to 15 percent of the EMP’stotal monthly capitation revenues. A serious infraction includes a fine plus suspension ofthe contract for one or two months. A severe infraction results in a fine and contract termi-nation. Since the inception of the MSP, the INSS has penalized 25 EMPs for minor infrac-tions. The 25 EMPs that have been involved in minor infractions have received a total of31 verbal reprimands and 22 economic sanctions. Ten EMPs have been charged with seri-ous infractions, and their participation in the MSP was temporarily suspended. Seven EMPcontracts have been terminated for severe violations.
In 1996, the INSS conducted a consumer/patient satisfaction survey to obtain moredetailed information about the operations of the EMPs and more proactively monitor theMSP. The survey was expanded and made a permanent, biannual feature of the MSP in 1998.Surveys were conducted in 1996, 1998, and 2000. (Results of the survey are discussed below.)
Participating in the MSP: Selecting an EMP
INSS affiliates who are in the RI are free to enroll in the EMP of their choice. Enrollees areallowed to switch EMPs once a year. How many actually exercise this right is unknown.The INSS provides brochures that explain the benefits provided by the MSP, but enroll-ment is the responsibility of the individual affiliate. The EMPs recruit and directly enrollclients and later inform the INSS. Many EMPs run marketing campaigns, advertisingthrough billboards, radio and TV spots, and directly in workplaces. According to INSS sur-veys, the EMPs are enrollees’ main source of information on the MSP, including the com-position of benefits.
The MSP’s Performance
Growth in the Coverage of the MSP
There has been significant growth in the number of EMPs, MSP beneficiaries, and EMP-provided services. The growth in the number of beneficiaries has been the result of severalfactors: the restoration of economic growth, growth in the proportion of all INSS affiliateswho were in the RI (and who thus were obligated to contribute to the MSP and therefore wereeligible to participate in it), and growth in the proportion of MSP-eligible workers who chose
Health System Innovations in Central America 143

to participate in the program (by enrolling in an EMP).3 (See Annex Figures 5A.1-5A.4 fordetails.)
Even though there has been substantial growth in the absolute number of MSPenrollees and MSP beneficiaries, their relative numbers—that is, the proportion of the totaleconomically active population (EAP [the labor force]) who were INSS affiliates or MSPenrollees and the total number of MSP beneficiaries as a percentage of the population—has remained relatively modest. As shown in figure 5.2, in 2002, all INSS programs cov-ered about 6 percent of the national population and 17 percent of the workforce, but theRI covered only 13 percent of the workforce, and only 12 percent of the workforce partic-ipated in the MSP.
144 World Bank Working Paper
3. In 2002, 99 percent of all INSS affiliates participated in the MSP. About three-quarters of those whowere not enrolled in the MSP were ineligible because, as municipal workers who are not mandated to par-ticipate and whose employers opted not to contribute, they did not pay into the program. The remainderof INSS affiliates who did not participate in the MSP contribute to the scheme but do not receive any ben-efits because they had not enrolled in an EMP.
Figure 5.2. Relative Measures of the Growth in Coverage of the MSP
14% 14% 14% 15%16%
16%17%
17%
15%
12%
4%
8%
6%
7%
9%
11%12%
<1%
8%
4%
5%4%
7%6%
3%
2%
<1%0%
2%
4%
6%
8%
10%
12%
14%
16%
18%
1993 1994 1995 1996 1997 1998 1999 2000 2001
INSS affiliates as % EAP MSP enrolled as % EAP Beneficiaries as % population
In 1994, only 7 of Nicaragua’s 17 departments had one or more EMPs. Since then, thenumber of EMPs has more than tripled, and the number of departments in which they arelocated has more than doubled. Since 2000, only one department, Madriz, did not have atleast one EMP.
Financial Performance of the MSP
Figure 5.3 presents the annual revenues and expenditures of the INSS unit that managesthe MSP, the SEM branch. (See Annex Figure 5A.1 for a more detailed account of revenues

Health System Innovations in Central America 145
Figure 5.3. Revenues, Expenditures, and Surplus of the INSS Sickness and MaternityInsurance Branch
75
105171
70
197
79
224
97
279
186
361
144
386
258
471
294
571
245
0
100
200
300
400
500
600
700
800
900
Mill
ion
s o
f n
om
inal
có
rdo
bas
1994 1995 1996 1997 1998 1999 2000 2001 2002
Expenditures Surplus
and expenditures.) Each year since the inception of the MSP, the revenues of the SEM haveexceeded its expenditures. It is generally accepted that the relatively low outlays of the MSPare the main driver of the observed surplus of the SEM. Over the entire nine-year period,expenditures constituted 64 percent of revenues. The remaining 36 percent is a surplus.From 1994 until 2001, the cumulative total surplus of the MSP—in its entirety, C$1,293million was transferred to the underfunded pension branch to subsidize chronic deficits.Since the start of 2002, the practice of commingling the funds of these two branches of theINSS has stopped, and the MSP no longer cross-subsidizes the pension branch.
Total payments made to EMPs have annually averaged only 46 percent of total expen-ditures since the program began. The SEM’s other expenditures have been split amongadministrative costs, monetary benefits, and other services and have averaged 11, 6, and1 percent, respectively.
In comparison to spending in the pre-Sandinista direct delivery model, the MSPappears to be a bargain. Comparing two five-year periods, 1974–78 and 1994–98, real perenrollee spending was 39 percent less in the latter era (US$167 compared to US$274). AsTable 5.1 shows, there have been three increases in the capitation rate. None of the threeadjustments that have been made in the per capita payment were based on cost or actuarialanalyses, and the increases have not kept pace with inflation. In real terms, the current nom-inal capitation rate of C$169.93 is equal to 83 percent of the original, 1994 rate of C$97.00.
The Service Delivery Record
As noted, the total number of outpatient visits and hospitalizations provided by the EMPshas grown steadily since the start of this new program. As Figure 5.4 shows, even when the

growing number of beneficiaries is taken into account (by calculating the average num-ber of services provided per beneficiary), the service provision performance of theEMPs is impressive. From 1994 through 1997, the average number of visits and theaverage number of hospital discharges per beneficiary increased each year. Since then,these utilization rates have stabilized. In 2002, the average MSP beneficiary had 5.2 out-patient visits and 10 percent of all EMP beneficiaries had hospitalizations. These arehigh rates of use.
According to the World Health Organization (WHO), the minimum acceptable con-sultation rate for a country is 2.0—that is, on average, each person should have at least two
146 World Bank Working Paper
Table 5.1. MSP Monthly Per Capita Payment to EMPs per Enrolled Worker
In nominal In real (1994) Real 1994 In nominalYear córdobas córdobas level (%) US$
1994 97.00 97.00 100 14.43
1995 97.00 87.44 90 12.88
1996 113.00 91.25 94 13.40
1997 113.00 83.55 86 11.96
1998 113.00 73.91 76 10.68
1999 130.00 76.46 79 11.01
2000 130.00 68.54 71 10.25
2001 169.93 83.46 86 11.33
2002 169.93 80.79 83 12.19
Source: Authors’ calculations; Nicaraguan Central Bank data from the World Bank country data Web site.
Figure 5.4. Evolution of Annual Average EMP Use Per Beneficiary(Affiliates and Eligible Dependents)
5.8 5.6 5.44.9
5.2
6.5
4.7
1.5
3.8
104.2 105.598.2 98.4
108.8
109.0
17.8
47.5
75.4
0
1
2
3
4
5
6
7
1994 1995 1996 1997 1998 1999 2000 2001 2002
Ou
tpat
ien
t vi
sits
per
b
enef
icia
ry
0
20
40
60
80
100
120
Ho
spit
al a
dm
issi
on
s/1,
000
ben
efic
iari
es/y
ear
Outpatient visits Hospital admissions

consultations annually. Table 5.2 provides some points of comparison between the careprovided by the EMPs and that provided by MINSA. As may be seen in the top portion ofthe table, MINSA provides roughly the WHO-recommended minimum annual averagenumber of consultations per person. There is a marked and growing difference betweenthe performance of the MSP and MINSA. In 1995–96, the average number of consultationsper beneficiary of the MSP was roughly twice that of MINSA. Since then, the difference hasincreased, to a factor of three or more.4 The hospitalization rate of MSP enrollees, too, ishigher than MINSA’s. After growing rapidly from 1994 to 1997, it has stabilized at about40 percent above the MINSA level.
Two other differences in the patterns of outpatient care provided by the MSP andMINSA are evident in Table 5.2. The proportion of all visits that are first visits for the treat-ment of a particular illness episode (a crude indicator of the quality of care) is consistentlyabout twice as high in the MSP compared to MINSA, suggesting that the EMPs do a bet-ter job of resolving health problems in a single visit. The other major difference is in theaverage number of prescriptions per visit: the EMPs provide twice as many filled prescrip-tions per outpatient visit.
In assessing these service delivery levels, it is important to consider the nature of thefinancial incentives of the MSP and MINSA. In the MSP, the financing and care provisionfunctions reside in two distinct entities, and the providers—the EMPs—are paid a fixed,capitated rate for providing all covered services to their enrollees. Thus the EMPs haveincentives both to husband their resources, and (to the extent that their enrollees are awareof qualitative differences in the care provided by different EMPs, and resign from thosethey perceive as providing poorer-quality care to enroll in those they regard as goodcare providers) EMP providers are motivated to provide high-quality care. In contrast,MINSA providers are less financially motivated to: (a) be concerned about whether theyare providing too much or too little care or (b) be concerned (beyond their professionalcommitment) with pleasing their patients and providing high-quality care. MINSAproviders are assured of being paid their same salary regardless of how well or howpoorly they perform their jobs. The different incentive structure of the MSP, whichencourages a more patient-focused approach to providing care, motivates caregivers toprovide care more efficiently, and provides for a market-based (as opposed to a morepersonalized and bureaucratic-based) type of accountability. The introduction of anincentive structure that would fundamentally change health care providers’ motivationsand encourage them to be more cost conscious was a key consideration in the design ofthe MSP.
The only notable difference in the two institutions’ provision of inpatient care is that theMSP’s average length of stay is about half of MINSA’s. This is consistent with the incentives
Health System Innovations in Central America 147
4. Experience in other countries suggests that new enrollees in a capitated system commonly havehigher than average utilization rates. Generally, it is thought that such persons have “pent-up” demandfor health care that they satisfy once they have joined the capitated provider. The temporary, abnormallyhigh utilization rate of new enrollees slowly decreases, and after two or three years, it reaches a lower,longer-term utilization level. It is also likely that the track of annual utilization rates of the MSP enrolleesreflects “moral hazard”—that is, the tendency of persons with insurance, and those with more compre-hensive insurance, to use more health care services.

148W
orld Bank Working Paper
Table 5.2. Comparisons of Care Provided by the MSP and MINSA
System Indicator 1994 1995 1996 1997 1998 1999 2000 2001 2002
Outpatient and emergency care
Total visits per beneficiary per year 1.5 3.8 4.7 6.5 5.8 5.6 5.4 4.9 5.2
Proportion of all visits that are first visits NA NA 43 51 47 45 42 40 40
Lab tests per visit 0.6 0.6 0.5 0.4 0.5 0.5 0.5 0.6 0.6
Prescriptions per visit 1.1 1.3 1.8 1.7 2.1 1.9 2.1 2.2 2.2
Emergency visits per beneficiary per year 0.0 0.1 0.2 0.4 0.4 0.5 0.5 0.5 0.5
Percent of all visits that are emergency visits 3% 3% 4% 6% 3% 8% 9% 10% 9%
MINSA Total visits per beneficiary per year 1.7 2.0 2.0 2.0 1.9 1.7 1.8 1.7
Proportion of all visits that are first visits 14.1 11.5 21.3 NA NA NA NA NA NA
Lab tests per visit 1.1 0.6 0.6 0.6 0.6 0.8 0.8 0.9
Prescriptions per visit 1.1 0.9 0.9 0.9 1.0 1.3 1.2 1.2
Emergency visits per beneficiary per year 0.2 0.2 0.2 0.2 0.2 0.2 0.2 0.2
Percent of all visits that are emergency visits 12% 10% 9% 9% 8% 12% 13% 12%
Inpatient care
MSP Admissions per 1,000 beneficiaries per year 18 48 75 109 109 104 105 98 98
Admissions (not including deliveries) per 1,000 beneficiaries 11 31 49 79 82 79 80 75 74
Average length of stay (days) 1.4 1.6 2.5 2.5 2.4 2.5 2.3 2.3 2.3
Proportion of all admissions that are for delivery 37% 36% 35% 28% 24% 24% 24% 24% 25%
Proportion of all deliveries that are by cesarean section — — 42% 46% 44% 46% 47% 47% 48%
MINSA Admissions per 1,000 beneficiaries per year 60 70 60 82 66 73 74 70
Admissions (not including deliveries) per 1,000 beneficiaries 40 40 40 59 47 52 52 48
Average length of stay (days) 4.5 4.5 4.6 4.6 4.5 4.4 4.2 4.3
Proportion of all admissions that are for delivery 33% 43% 33% 28% 29% 29% 29% 32%
Proportion of all deliveries that are by cesarean section 18% 18% 19% 18% 16% 19% 20% 19%
NA not available.Note: MINSA beneficiaries are defined as 80 percent of the national population.Sources: Quintanilla 2001; INSS data; Ubilla, Espinosa, and Bitán 2000; authors’ own calculations.
Health System Innovations in Central America 149
provided by capitation to reduce costs. Roughly three-quarters of EMPs contract with hos-pitals to provide their enrollees with hospital care, and all EMPs require their members toobtain an authorization before being admitted.
EMP Patient Satisfaction
No information is available about the general level of satisfaction of MSP enrollees, butthere are two sources of data on MSP patient satisfaction—the INSS-administered surveysconducted in 1996, 1998, and 2000 under the auspices of the MSP and a one-time surveyundertaken in 1999 of 320 ambulatory patients of 11 EMPs.5 All four surveys found thatthe MSP enrollees were generally satisfied with their EMP-provided care. Patients’ overallimpression was favorable, with 73 percent reporting their level of satisfaction being excel-lent or good. The level of satisfaction with other aspects of care ranged from a high of 90percent being satisfied (good or excellent) with the service to the low of 44 percent beingdissatisfied (fair or poor) with their drug benefit.
Since 1996, when the INSS conducted its first patient satisfaction survey, the surveyinstrument has evolved, with additional questions being added in each round. The 2000version of the questionnaire consisted of 23 questions. For most questions, intervieweesare asked to select from possible response categories of “satisfied,” “fair/more-or-less sat-isfied,” and “dissatisfied.” A summary of results of all of the questions in each of the threerounds of the survey is presented in Table 5.3.
Although the two different types of surveys are not directly comparable, it is note-worthy that the independent 1999 survey posted higher levels of satisfaction than the INSS-conducted survey. As Table 5.3 shows, the results of the 2000 survey show that the EMPsreceived high marks (79 percent or higher) on a number of other measures capturingpatients’ views of EMP care, including how well the physicians treat the patients (item 7 inTable 5.3), the proportion of respondents who reported being treated well in maternity(item 15) or pediatric services (item 18), the proportion of children’s cases that were sat-isfactorily resolved (item 19), and the proportion of patients who reported being treatedwell in admission (item 4).
In contrast, only 59 percent of respondents reported being satisfied with the EMP carethey personally received (item 1). The apparent incongruity between the various servicesfor which EMPs get high marks and the relatively low level of satisfaction seems to reflectbeneficiaries’ judgment that their EMP had been unable to resolve the respondents’ ownpersonal health problem. Other shortcomings of the EMPs appear to be their relatively lowlevels of coverage for children (45 percent) and the relatively high and stable proportion(17 percent) of respondents who said they had to visit another health facility to have their
5. The sample selection methodology of the two surveys differed, and neither sample was representa-tive of all MSP enrollees. The biannual survey has tracked the same 18 EMPs in each of its three waves,and its sample of interviewees is selected from a sample of 131 worksites. Potential interviewees had tohave made at least one visit to their EMP in the preceding six months. The 1999 survey developed a pur-poseful sample of 11 EMPs based on criteria that would ensure highly different EMP characteristics. The11 EMPs were visited, and 30 patients who visited the facility on the day of the survey were interviewed.Neither sample is representative of the total EMP member population, nor of the total MSP-enrolled pop-ulation. Both the way in which the sample was selected and the site of the interview probably result in anupward bias in the level of satisfaction reported in both surveys, especially in the one-time 1999 survey.

150W
orld Bank Working Paper
Table 5.3. Patient Satisfaction with EMP-Provided Care Evolution of INSS-Administered Patient Satisfaction Survey Indicators: 1996, 1998, 2000
Patient satisfaction indicator 1996 1998 2000 1998–2000 change
1 Reported to be satisfied with EMP care — 57% 59% + 2%
2 Reported that the EMP’s care resolved their health problem 70% 62% 61% —
3 Had to obtain consultation from other than their EMP — 17% 17% —
4 Reported that they were treated “well” on admission 80% 82% 83% —
5 Did not encounter problems being admitted — 9% 11% + 2%
6 Waiting time prior to being attended 65 min 60 min 53 min − 7 min
7 Reported they were poorly treated by the physician 7% 4% 4% —
8 Received their complete prescription of medicines — 20% 21% —
9 Had to purchase medicines 50% 16% 16% —
10 Paid for laboratory examinations — 2% 3% —
11 Prenatal care coverage of insureds — 21% 20% —
12 Prenatal care of insured was provided by a obstetrician-gynecologist — 87% 91% + 4%
13 Female beneficiaries received a Pap smear — 57% 63% + 6%
14 Female beneficiaries aware of their right to have a Pap smear — 72% 80% + 8%
15 Beneficiaries reported they were treated “well” in maternity — 90% 86% − 4%
16 Coverage of eligible children — 60% 45% − 15%
17 Children who were attended by a pediatrician — 70% 83% + 13%
18 Insured whose children were attended “well” 71% 78% 79% —
19 Children’s health problems were resolved — 85% 85% —
20 Did not have problems with subsidies — 7% 5% − 2%
21 Satisfaction with knowledge imparted by EMP physician — 9% 38% + 29%
22 Satisfaction with hospital care — — 80% —
23 Obtaining authorization for hospitalization was “easy” — — 87% —
— no change or no significant change.Source: Gerencia General de Salud Provisional–INSS, UCRESEP, CIET International (2000).

problem adequately treated. It may be that some EMPs are discouraging at least some oftheir patients from seeking care. This is one of the negative consequences of the incentivesprovided by capitation, and it is likely to be particularly common in a capitated system inwhich there is little consumer-based policing or competition for clientele and in which norisk adjustments are made in the capitation rate.
In assessing patients’ satisfaction with the MSP, it is important to take into consider-ation the beneficiaries’ relevant benchmarks. First, because the Sandinistas actively dis-couraged private practice between 1979 and 1992, MINSA was very nearly the only sourceof care available when the MSP was introduced in late 1993. MINSA, therefore, is likely thereference point to which EMPs are being compared. Second, the INSS’s RI affiliates hadreceived nothing for their earmarked payroll health taxes for more than a decade. It is likelythat their expectations were low, although these may increase as the program matures.Household health interview surveys provide another source of data and additional insightsinto the nature of the comparison point, MINSA-provided care, that are probably reflectedin the level of satisfaction of EMP patients.
� Although 16 percent of EMP outpatients bought medicines, in 1995, 40 percent ofMINSA patients did not receive any of the medicines they were prescribed and another15 percent received only a portion of them (David and others 1996, Table 7.14). By1998, 50 percent of MINSA patients did not receive any of the medicines they wereprescribed and one-third of those who obtained them paid an average of C$46 forthem (authors’ calculations based on the 1998 Demographic and Health Survey data).
� The mean waiting time in MINSA health centers is 78 minutes, compared to EMPs’53 minutes (Fiedler 1999, Table 6).
� Seventeen percent of EMP patients reported they had to obtain additional carefrom other than their EMP to resolve a health problem, and 7 percent of personswho reported they sought care at a MINSA health center were refused care alto-gether (David and others 1996, Table 7.9). It is not known what proportion ofMINSA patients who were refused care sought care elsewhere.
EMP Providers’ Satisfaction
Focus group discussions with physicians have found that 63 percent are “satisfied” or “verysatisfied” overall with the MSP (Ubilla, Espinosa, and Bitán 2000, table 13). In part, this isbecause it has increased their overall remuneration and, on average, is the source of two-thirds of the total income of physicians participating in the program (see Table 5.4).
The Impact of the MSP
MSP Effects on the Organization and Structure of the Health Sector
One result of the introduction of the MSP has been the increased organization and changes inthe structure of the private health care sector. When the MSP was first introduced, the sectoroverwhelmingly comprised individual private physician’s practices complemented by a hand-ful of small, generally religious-affiliated hospitals. The MSP has added 48 multiphysician
Health System Innovations in Central America 151

EMPs to this mix, and it has encouraged a growing number of small (25-bed) privatehospitals.
Three types of EMPs can be distinguished based on the relationship between the ownersof the EMP and the EMP’s provider network. An EMP may be:
� a vertically integrated entity (that is, a group of physicians who own and operatethe EMP and provide all of the services—outpatient and inpatient—in the benefitpackage);
� exclusively an administrative entity that contracts out all service provision;� an organization that combines in-house and contracted care provision.
About three-quarters of EMPs are the third variety, the “mixed” model. These mixed mod-els most commonly consist of a group of private sector physicians who have come together,formed an outpatient clinic, and subcontracted with a hospital to provide inpatient ser-vices. Especially in the first years of the MSP, when the size of the private sector was sosmall, most of the subcontracted hospitals were perforce MINSA facilities. The trend sincethen, however, has been toward the development of vertically integrated service deliverywith newly developed, small, private hospitals providing most of the EMPs’ care. There arevery few EMPs that exclusively contract out both outpatient and inpatient care.
There is no information on how closely EMPs monitor the provision of care by theirsubcontractors. Hence there is no information on how patient dissatisfaction with inpatientcare may result in resignation from a given EMP, nor has there been an analysis of affiliates’resignation.
Of the 48 EMPs operating in 2002, 20 were in the capital city, Managua, where roughlythree-quarters of all INSS-insured enrollees were located. In nine of the departments in whichthere is at least one EMP, the insured have a choice among two or more EMPs (see table 5.3).The degree of market concentration among EMPs in or outside Managua (that is, the shareof total members enrolled in any single EMP) has continually declined since 1994.
Impacts of the MSP on MINSA: Some Good, Some Not
During the first full year of the MSP, 1994, 2 MINSA facilities participated as EMPs andconstituted 21 percent of all EMPs. A third MINSA facility entered the EMP ranks in 1996.
152 World Bank Working Paper
Table 5.4. Level, Relative Importance, and Growth of Physicians’ Real EMP Incomea
EMP income All other sources Total income EMP income as
Year US$ Percent US$ Percent US$ Percent % of 1994 level
1994 856 65 451 35 1,307 100 100
1995 1,222 71 489 29 1,711 100 143
1996 1,569 71 632 29 2,201 100 183
1997 1,738 67 862 33 2,600 100 203
1998 2,381 63 1,374 37 3,755 100 278
1999 3,517 69 1,596 31 5,113 100 411
a. In 1999 U.S. dollars.Source: Ubilla, Espinosa, and Bitán (2000).

Thereafter the number of MINSA EMPs remained unchanged until 1999, when it jumpedto 8. The following year, 2000, it increased to 10, and the proportion of all EMPs that wereMINSA facilities reached its zenith, 26 percent. That year, MINSA EMPs’ monthly averagenumber of affiliates reached 38,812 (10 percent of all affiliates).
MINSA facilities have benefited financially from participating in the MSP, both asEMPs and as subcontractors providing hospital services to EMPs. In 2000, the MSP paidthe eight MINSA facility-based EMPs nearly C$57 million (US$4.5 million). Although theMINSA EMPs constituted only an annual average of 11 percent of all EMPs, they annuallyearned an average of 23 percent of total capitation payments from 1997 through 2000. Thisis due to the disproportionately large number of affiliates of the two MINSA EMPs thatwere in operation throughout this period.
MINSA facilities have also benefited financially from the MSP by being subcontractedby EMPs to provide inpatient services. Because only a small number of private hospital bedssurvived the Sandinistas’ SNUS, MINSA facilities have always made up the overwhelmingshare of subcontractors in mixed EMP systems. Despite slow but steady growth in the num-ber of small, private hospital EMPs, MINSA facilities still constitute 77 of 91 (85 percent) ofall EMP subcontractors (as of February 2002). The MSP maintains no information aboutthe level of use of EMP subcontractors, the amounts they are paid, the mechanisms by whichthey are paid, or patient satisfaction with their services.
The possibility that a MINSA hospital could become an EMP or that it could be sub-contracted by public or private EMPs to provide MSP care created new incentives forMINSA hospital managers. To be contracted as an EMP or subcontracted by an EMP, theymust provide differentiated services (that is, offer a higher quality of service than that pro-vided to the general public). MSP-derived revenues constitute the first significant financialincentives that most MINSA hospital directors have ever had, and their response to theseincentives has been highly varied. Most MINSA hospitals participating in the MSP earn theequivalent of roughly 5–15 percent of the budget allocations they receive from MINSA, butthe most entrepreneurial MINSA hospital has regularly earned the equivalent of 40–50 per-cent of its MINSA-provided budget. As a result of the new incentive structure the MSP hasintroduced into MINSA hospitals, some of the hospitals have improved their managerialsystems, skills, and the efficiency of their operations, which has probably also contributedto their using their MINSA resources more efficiently. Other MINSA hospital directors,however, have made few or no changes in their management style or systems. They haveresponded to the MSP-derived revenues as if they were a windfall, and have not tried tomore proactively manage this potentially lucrative portion of their hospitals’ operations.
The impact of the MSP on MINSA, however, is not entirely positive. The financialgains from participating in the MSP are not widespread among MINSA facilities oremployees. In fact, only a small proportion of facilities and employees enjoy this supple-mental income. MINSA has not adopted any rules or regulations to govern the use of thesemonies, and the disposition of these monies is reported to vary substantially by facility.Generally, however, it is reported that from one- to two-thirds of the revenues MINSAfacilities garner from their MSP-related activities are used to augment salaries of MINSAphysicians working in MINSA hospitals. (The hospitals are the only type of MINSA facil-ity participating in the MSP.) Inequality in access to this opportunity gives rise to discordand jealousies and undermines the morale and productivity of those MINSA staff who areexcluded from participating in the MSP—the vast majority of them.
Health System Innovations in Central America 153
Another adverse impact of the MSP on MINSA stems from the fungibility of MINSAresources coupled with the enticement of increased facility or personal remuneration orboth. The MSP provides both the opportunity and the motivation for MINSA employeesto devote disproportionate amounts of their resources—including those provided byMINSA—to the treatment of MSP patients in order to attract and maintain MSP enrolleesand EMP subcontracts. To the extent that MINSA personnel do so, it results in MINSAeffectively subsidizing the treatment of MSP enrollees.
Even if the MSP-derived monies are not used to augment MINSA salaries, the fact thatMINSA facilities are paid in cash for participating in the MSP has also probably encouragedMINSA facility directors participating in the MSP to devote disproportionate amounts ofthe ministry’s resources to ensuring that they remain participants. MSP revenues are likelyto be of disproportionately greater importance to MINSA facility directors and administra-tors (relative to MINSA-derived resources) because these revenues constitute most of thefungible resources available to them. For the most part, MINSA resources are distributed inkind, leaving relatively little room for the exercise of discretion and the timely purchase ofthe specific types and quantities of resources that a given facility might need. In contrast,MSP revenues allow MINSA staff to purchase exactly what they feel they need, as opposedto, at best, being able to choose from what is available from MINSA and having to acceptthe uncertainties of when and if it will actually be delivered. Moreover, MSP earnings aremore readily available to meet unanticipated needs as they arise. These important differ-ences are likely to encourage inefficiencies within the MINSA system, because administra-tors are willing to use substantial amounts of existing MINSA resources (for example,personnel time) to obtain a much smaller value of liquid, fungible, MSP-related revenues.Doing this may be economically irrational from the MINSA system’s perspective, but fromthe individual hospital manager’s perspective, it may be entirely rational.
There is yet another piece to the utilization puzzle. When EMP enrollees require ser-vices that are not included in the MSP benefit package, they must either obtain them fromtheir EMP (or another private provider) and pay out of pocket for them, or they mustobtain them from MINSA facilities, where fees are low or nonexistent. The INSS estimatesthat MINSA annually attends 1,500 MSP enrollees who have “complex” cases that areexcluded from the MSP package. In informal discussions with MINSA staff, one often hearsthat these patients—who are likely to be especially expensive to treat—are “dumped” onMINSA and that this is evidence that the MSP is not paying its “full way”—that it is beingsubsidized by MINSA. This is an accurate portrayal.
INSS staff, however, have a very different interpretation—one that is generallycouched in terms of history and the evolution of the MSP. They concede that the MSP isnot a completely independent financial intermediary, but go on to maintain that it has con-tributed mightily to MINSA by allowing MINSA to “off-load” a substantial number ofpatients, saving the ministry a significant amount of money by doing so. This too is anaccurate portrayal of the MSP-MINSA nexus. According to the INSS point of view, for themost part, EMP-provided care is a substitute for MINSA-provided services, reducing theamount of care that the ministry would otherwise have to produce. If one does a simplecounterfactual and assumes that the population-based, MINSA utilization rates would alsocharacterize MSP enrollees if there were no MSP, a rough approximation of the additionalservices MINSA would otherwise have had to provide in 2002 is 540,000 outpatient con-sultations and 25,000 hospitalizations (Fiedler 1999). There is no information about the
154 World Bank Working Paper
cost of MINSA services, thus it is not possible to estimate the ministry’s cost savings attrib-utable to the MSP’s activities—but no doubt, they are considerable.6
The INSS is sensitive to the criticism that it is being subsidized by MINSA and is attempt-ing to address this issue. In 2001, the MSP expanded the basic services package. In 2002, itbegan implementing a phasing-in of the extension of coverage to INSS pensioners, and in2003, it began a feasibility analysis of incorporating informal sector workers. Thus, althoughthe differences between these two perspectives have narrowed as the MSP’s coverage hasgrown, whether the differences will eventually disappear remains to be seen.
The Impact of the MSP on Managerial Practices and the Efficiency of theHealth Sector
Mention has already been made of the financial risk providers (EMPs) incur in a capitatedsystem and of the need to control costs as a means of managing that risk. To the extent thatthey do so, EMPs and the MSP contribute to the improved efficiency of the health sector.Although there is no systematic information on these aspects of their contractual arrange-ments, it is generally thought that most, if not all, of the EMPs pay their subcontractors on afee-for-service basis. This heightens the financial risk of the EMP itself. If the EMPs insteadpaid their subcontractors a capitation fee or a fixed amount per case, they would give the sub-contractors greater incentive to contain their costs. The EMPs reliance on fee-for-servicesubcontracts manifests their as yet relatively unsophisticated approach to management.
EMPs’ contracts with their physicians do not encourage their providers to containcosts either. Nearly all EMP physicians are paid through fixed salaries without retainers,bonuses, or other schemes that stimulate cost containment. The only systematic informa-tion that has been collected on EMPs’ physician payment mechanisms comes from a 1999survey of 46 physicians (Ubilla, Espinosa, and Bitán 2000). That survey found only onephysician who was not exclusively paid a fixed salary. That physician was on a fixed salaryaugmented by incentives. The fact that very few EMPs have yet to introduce variable physi-cian remuneration, or use payment mechanisms that put their hospital subcontractors atrisk, suggests that physicians and hospitals can be encouraged to be more cost consciousthan they have been to date, and it suggests that the EMPs (and thus the MSP and theNicaraguan health sector) still have potential efficiency gains to realize. To the extent thatEMPs encourage their physicians to be cost conscious, they apparently do so by promotingutilization controls through the use of verbal exhortation and peer pressure.7
Health System Innovations in Central America 155
6. This is the minimum amount of care MINSA avoided having to provide, based on national popu-lation-based estimates. In contrast to the general population, MSP enrollees are more likely to (a) live inlocales where they have greater access to care, (b) have higher incomes, and (c) have higher education lev-els, all of which are associated with higher utilization rates in Nicaragua (Fiedler 1999, table 2). If it wereassumed that MSP enrollees would demand the same amount of care from MINSA that they obtainedfrom their EMPs in 2000, these figures would be 3.5 times higher for outpatient visits (1.7 million) and7.3 times higher for hospitalizations (167,000). These two sets of extreme values establish the range withinwhich the actual figures probably lie.
7. The real value of the capitation rate has fallen by more than 20 percent since 1993, which suggests thatthere is growing pressure on EMPs to contain costs, yet there is little evidence that they are attempting todo so systematically. The only common utilization control mechanism used by EMPs is the requirement thatwould-be inpatients obtain preadmission authorization. This has been a requirement of nearly all of theEMPs since the start of the program, however, and has not been a response to their growing financial con-straints. Given that EMP physicians’ real remuneration has increased (see Table 5.2) while the real capi-tation rate has fallen, it may be inferred that average EMP physician productivity has increased.

There are some indications, however, that some EMPs have responded to the incentivesinherent in capitation to provide care more efficiently. For instance, compared to MINSA,EMPs have lower average lengths of stay and economize on the use of laboratory tests (seeitems 9 and 3, respectively, in Table 5.3). The sum of the evidence, however, is ambiguous,because other indicators suggest that the EMPs provide more care or more expensive typesof care than MINSA facilities. For instance, EMPs’ cesarean section rates, use of emergencycare, and number of prescriptions dispensed are higher than those of MINSA (see items 11,5, and 4, respectively in Table 5.3). Other EMPs—a minority—have attempted to reducecosts and avoid risk by reducing the range of eligible services they provide to enrollees(which has prompted the MSP to take disciplinary action against a handful of them).
In some capitated systems, the capitation rate is actuarially adjusted to take intoaccount the variation in expected rates of use and costs due to variation in the mix ofenrollees. In systems where capitation rates are not risk adjusted—such as in the MSP—another approach to managing risk is to attract and retain enrollees who are likely to usebelow-average amounts of health care—that is, the healthy instead of the ill, men insteadof women, and the young instead of the old. The MSP’s policy of charging the EMP withthe responsibility of providing care for not only the affiliated worker, but also his or hereligible dependents, while still paying the same fixed capitation rate per insured worker—independent of the number of eligible dependents—also creates an incentive for EMPs toenroll affiliated workers with smaller families.
Despite the absence of risk adjustment in the MSP, there is little evidence of risk selec-tion by EMPs and only anecdotal evidence of adverse selection by EMP enrollees. Analy-sis of a small sample of patients from 11 EMPs revealed that the demographic profile ofenrollees (age and gender, as well as the number of dependents) varies little among EMPsand appears unaffected by EMP size, years in business, or location or whether it is publicor privately owned (Ubilla, Espinosa, and Bitán 2000, p. 16). However, the small and non-random nature of the sample means that, at present, there can be no unequivocal, generalstatement about EMPs’ risk selection. Moreover, although it would be necessary to per-form more detailed analysis than data presently available permit, a casual review of EMPs’average utilization rates of outpatient and hospital services suggests that the variation inthese rates are neither minor nor random. This is an important issue that the MSP needsto investigate and continually monitor so as not to put EMPs at undue financial risk.
Thus there is mixed evidence about the impact that the MSP has had on the manage-ment practices and efficiency of health care provision in Nicaragua. Moreover, there is evi-dence that the MSP is currently characterized by conditions identified as encouraging orallowing the incentive structure of capitation to adversely affect the quantity and qualityof health care provided, which puts it (and its beneficiaries) at risk of being taken advan-tage of by its member EMPs. The INSS needs to more fully develop some of the MSP’sstructural features and must take a more proactive approach to protecting consumers andpolicing EMPs if the MSP is to fully deliver on its promise.
Modifying the MSP to Better Ensure Quality Care and Spawn More Competition
There are four means by which the negative influences of financial incentives may be keptin check:
156 World Bank Working Paper

� aggressively monitoring the quality of service provision to ensure that covered ser-vices and needed services are not withheld or the quality of care debased;
� monitoring patient satisfaction;� providing consumers with the basic knowledge they need about their rights and
responsibilities in a capitated system; particularly their ability to resign from anEMP that they feel is providing poorer-quality services and enroll in one theybelieve will provide better service;
� providing consumers with the information they need to evaluate and compare theperformances of EMPs so they can make informed choices.
Consumers have a potentially important role to play in monitoring EMPs and fosteringcompetition among them. Their role and their capability to date, however, have not beenadequately cultivated. For instance, what recourse do dissatisfied patients currently have?They can complain to the MSP, which might prompt a visit by the MSP and could resultin some type of sanction, or they can choose to enroll in a different EMP, which would sendan important market signal to the EMP. A recent survey conducted by INSS found, how-ever, that a large proportion (one-third) of enrollees are uninformed or incorrectlyinformed about MSP membership rules, including their right to switch EMPs, and only44 percent could correctly identify their prescription benefit (personal communication,Dr. Jaime Fuentes, MSP Director). The MSP does not maintain information on the fre-quency with which affiliates change their EMP. It is thought, however, not to be a commonoccurrence. This is a fundamental structural weakness of the program and one that mustbe addressed if the MSP is to live up to its full potential as a consumer-focused, competi-tion-based system promoting the efficient provision of quality care.
The MSP has only half-heartedly embraced its role as the monitor and supervisor ofthe EMP care it purchases. Although it collects some service provision data, it does not col-lect all that are needed to fulfill this function. The MSP does require EMPs to report aboutthe health services they provide, and it has conducted three patient satisfaction surveys.However, it has yet to develop a means for monitoring the quality of care, it does not makeadequate use of the data it does collect, and it does not make its monitoring data readilyavailable to consumers. The data submitted to the MSP are published, but they have notbeen made widely available. The information the MSP currently collects could be used bythe INSS to police EMPs—that is, to launch special investigations that might result in anEMP being sanctioned—but to date it has not been used this way.
Similarly, the INSS has instituted consumer satisfaction surveys, but it has not realizedthe full potential of these tools to educate, inform, and empower consumers and promotecompetition among EMPs. Although the intent was to conduct these surveys every twoyears, financial constraints reportedly led to the cancellation of the 2002 round. These sur-veys are not expensive, and they should be carried out annually. Consumers need infor-mation about the quality of care and the satisfaction of EMP users, and they need it in aform in which they can easily incorporate it into their health decision-making processes andthereby force EMPs to be more consumer oriented. As long as the MSP’s consumer advocacycapability remains underdeveloped, the potential for making EMPs more consumer-focused—so that they feel greater need to, and are better able to, compete for clientele—will remain underdeveloped. This is an important issue that needs more MSP atten-tion. The MSP needs to develop structural approaches to collecting and disseminating this
Health System Innovations in Central America 157
information, and it is well past due to begin educating enrollees about their rights and howthey can get the most out of the MSP system.
Another, potentially complementary, means by which to increase EMP competitionwould be to change the way EMPs are contracted. At present, any EMP that fulfills MSPcertification requirements can potentially become a provider of care. Whether or not theydo depends on whether RI affiliates choose to enroll in them. An alternative would be tointroduce competitive bidding or selective contracting to determine which EMPs wouldbe allowed to provide care, or to introduce a more stringent certification process. Somehealth sector analysts maintain that open or noncompetitive contracting provides littleincentive to EMPs to exceed the minimal requirements, and it may be encouraging theoverdevelopment of the market. This, they argue, may be fragmenting the enrollment baseamong an inordinately large number of EMPs, which may compromise their financial via-bility. Alleviating this situation would encourage EMPs to compete more on the basis ofthe quality of care, the type of insured services offered (going beyond the required mini-mum package), and the convenience of access to care they provide than they presently do.
INSS officials maintain that the EMP market is still too immature for this to be a viableapproach. Indeed, at present, only 3 of Nicaragua’s 17 departments have more than one ortwo EMPs, suggesting that the introduction of such a system would be premature—theresimply are not enough EMPs to provide meaningful competition, at least outside Managua.Greater encouragement of the development of EMPs is needed, especially outside Managua.Eventually, selective contracting is likely to be an attractive option, but not yet. When andif it is eventually pursued, it would probably be best to initially confine it to Managua, wherethe EMP market is more mature and EMPs are more numerous, larger, and perhaps betterorganized and managed. Before selective contracting is introduced on a national scale, how-ever, the MSP needs to get its own house in order. It needs to improve its EMP monitoringand public and consumer education functions, which will also improve competition andencourage EMPs to offer more than the basic minimum service package.8
There is no reason to leave the development of EMPs to the market. These are vehi-cles for implementing the MSP. Why not assist them in overcoming their doubts, uncer-tainties, and inexperience? There are several actions that the MSP could undertake to betterensure the continued viability of existing EMPs and encourage the more rapid develop-ment of new EMPs, thereby accelerating the expansion and coverage of the MSP:
� Provide financial and technical assistance for publicity campaigns to� promote understanding of the MSP and catalyze development of new EMPs,
especially outside Managua;� inform workers enrolled in the MSP of their rights;� provide consumers with the information necessary for them to police their EMP
and thereby encourage EMPs to provide higher-quality care and foster EMPcompetition;
� inform the general public of its eligibility to voluntarily affiliate with an EMPfor the sole purpose of purchasing health insurance.
158 World Bank Working Paper
8. Most EMPs in Managua are already expanding their service package to improve their competitiveposition by offering, for instance, free dental checkups or providing free care to children, aged 6 to 10 or6 to 15, who are not covered by the INSS package.

� Aid EMPs and prospective EMPs to overcome administrative bottlenecks by pro-viding them with a set of specially designed software packages to aid them in set-ting up management systems and fulfilling their MSP reporting requirements.
� Develop a reinsurance mechanism or cultivate a reinsurance market for EMPs.� Conduct actuarial analyses of the adequacy of the capitation rate.� Conduct feasibility analyses to examine the possibility of introducing varying cap-
itation rates or changes in the composition of the benefit package to rural and otherareas that will otherwise not be served by EMPs.
Building on Experience: Starting Simply and Learning by Doing
Over the course of the nine years the MSP has been in existence, the structure and opera-tions of the program have changed substantially. The initial design of the system was sim-pler and more restrictive—especially for the consumer. As the program and EMPs havematured, developed greater administrative capability, and learned by doing, several keyoriginal features of the program have been modified to provide more coverage, morechoice, and more flexibility. The most important of these have been:
� The coverage of the MSP was expanded in 1997 by increasing the age limitation foreligible children from less than three years of age to less than six. This resulted inan estimated increase of 16 percent in the number of beneficiaries.
� Initially, the choice of an EMP was tied to the workplace. Once each year, all RI-insured workers at a workplace voted for the EMP of their choice, and everyone hadto enroll in the EMP that won the election. This approach was motivated by thedesire to minimize the administrative requirements that a system based on indi-vidual workers’ choice would entail for both the MSP and the EMPs. Effective Jan-uary 1997, RI-insured workers have been allowed to individually enroll in the EMPof their choice and to change EMPs once a year.
� Originally, RI-insured central government employees were not allowed to choosetheir EMP, but were mandated to enroll in MINSA’s Policlínica Oriental in Managua.As a result, in the second semester of 1994, this EMP had 24,000 enrollees, represent-ing 38 percent of all MSP affiliates. This was a conservative approach that would min-imize the extent to which the private sector would be allowed to participate, whileensuring MINSA some of the benefits of the new system, and it represented a com-promise between the INSS and MINSA’s labor unions. Subsequently, when the“experiment” came to be better understood and opposition to it had waned, cen-tral government workers were extended the right to choose their EMP (effectiveJanuary 1997).9
Health System Innovations in Central America 159
9. When MSP officials were queried as to why most central government employees who work in Man-agua remain enrolled in the Policlínica Oriental, they indicated that most of these workers probably donot know that they now can enroll in the EMP of their choice. This is another example of the low prior-ity that the program has accorded enrollee education and the paucity of communication it has with itsbeneficiaries.

� The first patient satisfaction survey was conducted in 1996. It was also conductedin 1998 and 2000, and it is expected that the survey will be routinely conductedapproximately once every two years. Although the intent was to conduct these sur-veys every two years, financial constraints reportedly led to the cancellation of the2002 round.
� The phasing-in of a more restricted benefit package of care to 27,000 INSS-pensionedelderly nationwide began in 2002.
� In 2001, the benefit package was expanded to include additional illnesses, medi-cines, and diagnostic examinations.
� The introduction of more demanding certification requirements for EMPs wasinitiated in 2002 and completed and evaluated in 2004.10
The litany of modifications in the MSP is not likely to end here. INSS officials report thatthe MSP is currently investigating the possibilities of:
� further expanding the medicines and the diagnostic and special examinationsincluded in the benefit package,
� integrating additional severe illnesses into the benefit package (with the specificintent of reducing the subsidy provided by MINSA),
� extending coverage to portions of the informal sector.
Moreover, there is increasing discussion of the potential for expanding and fundamentallyaltering the role of the MSP in the future. One scenario consists of the MSP eventuallybecoming the administrator of a demand-side subsidy from the government of Nicaraguathat would enable groups not covered by the INSS, including the poor, to “purchase” carefrom an EMP of their choice. The MSP could then become a sister institution of MINSA,focusing on personal health care, especially curative care, while the ministry becomes morespecialized in public health, disease prevention, and health promotion.
Conclusions and Lessons Learned
The introduction of the MSP marked a radical departure from earlier health care deliverysystems in Nicaragua. Contracting out health care provision to third-party entities andpaying them a fixed capitation fee introduced incentives to contain costs and keep con-sumers (patients) satisfied. The outpatient consultation rate of the EMPs considered as agroup is 10 times higher than MINSA’s; their hospitalization rate is 30 percent higher; andtheir hospitalization rate exclusive of births is roughly 60 percent higher. EMPs also appearto provide higher-quality care, as indicated by their ability to resolve a medical problem.Sixty percent of all EMP outpatient visits are first visits, compared to less than 20 percentfor MINSA. The EMPs have achieved generally high levels of satisfaction among bothpatients and their physicians. The system now provides coverage to more than 450,000 per-sons residing in 16 of Nicaragua’s 17 departments. As figure 5.5 shows, the private sector’s
160 World Bank Working Paper
10. The new system resulted in the closure of four EMPs that could not comply with the certificationrequirements.

share of the total health care market has grown rapidly and significantly over the course ofthe 1990s.11 The MSP has contributed significantly to this trend.
The MSP also appears to be effectively containing costs. Given the amount of care it pro-vides, the MSP looks to be a “good deal” for Nicaragua—especially for those Nicaraguanswho are enrolled in the MSP. The cost per beneficiary of the INSS’s pre-Sandinista directdelivery system (in real terms) was 54 percent greater during 1974–78 than during 1994–98(Ubilla, Espinosa, and Bitán 2000).12 In part, this “good deal” reflects the fact that the EMPsresponded to the capitated system’s financial incentives by requiring that hospital admis-
Health System Innovations in Central America 161
Figure 5.5. Evolution of MINSA’s and the Private Sector’s Curative Health Care MarketShares, 1993–98
83%
17%
77%
23%
67%
33%
0%
10%
20%
30%
40%
50%
60%
70%
80%
90%
1993 1996 1998
MINSA Private, commercial
11. In Figure 5.5, private is defined as the “private, commercial” sector, which includes only privatephysicians, private hospitals, and INSS polyclinics. (Sources are for 1993, Fiedler [1994]; for 1996, Davidand others [1996]; and for 1998, authors’ calculations based on the 1998 Living Standards MeasurementSurvey database.)
12. Analyzing the changes observed between the eras before and after the introduction of the MSPis fraught with pitfalls because of changes in the INSS insurance package, technology, and the coveredpopulation’s epidemiological profile. These confounding factors are responsible for at least a part of theobserved changes as well. The magnitude of the relative contributions of these factors cannot be ascer-tained with available data.

sions be preauthorized and reducing the average length of stay (which is about one-halfthat of MINSA facilities).
Despite its considerable accomplishments, there remains considerable room and acompelling need for the MSP to change so as to better fulfill its role and realize its poten-tial. Now more than 10 years old, the program still covers only 8 percent of the populationand 17 percent of the labor force. There is no oversight of the quality of care provided. Thelevel of the capitation payment has been modified four times since the start of the program,but it has never fully recovered its initial real level. The relatively low per capita, when cou-pled with inadequate monitoring of the quality of care and the substantial proportion ofenrollees who are unaware of their rights and benefits in the program, provides fertileground for EMPs to abuse the system. Moreover, there is currently no adequate mechanismby which to determine if EMPs are complying with the terms of their contracts with the INSS.In 2000, a substantial proportion (17 percent) of EMP enrollees report they had to obtaincare elsewhere to resolve their health problem. Furthermore, much of the satisfaction withthe system probably reflects comparisons that physicians and patients alike make with theperformance of MINSA during the Sandinista era. That era was characterized by a nearlynonexistent private sector, few viable options for would-be patients, and poorly paid healthprofessionals. Given this reference point, is 59 percent of enrollees reporting that they are“satisfied” with their EMP good enough? Finally, outside Managua, there are only twodepartments where consumers have a choice between more than one or two EMPs in whichto enroll. As this would suggest, there is still relatively little competition in the market, andEMPs have not devised payment methods to encourage either their physician staffs or theirsubcontracted hospital partners to be cost conscious. As a result, the impact of the MSP onthe efficiency of the health care system has not been as great as might have been expected.
To date, the INSS has played too passive a role in the development of this new market,and, as a result, has put consumers unnecessarily at risk of being provided less care andlower quality of care than might otherwise be the case. The INSS has been content to setup basic guiding rules and parameters to encourage growth of this new market. It has not,however, played an adequately proactive role to ensure that the negative impulses of a cap-itated system have been anticipated and are stemmed. It needs to do so before this nascentsystem accumulates too many negative experiences and its reputation is tarnished. Alreadythere are elements of Nicaraguan society calling for re-establishment of SNUS. There is noreason why Nicaraguans should have to accept a system that is more equitable, but less pro-ductive, less efficient, and less promising.
Replicability Considerations
The MSP presents an important test case of a purchasing model-based reform. The modelwas developed (and continues to evolve) in the market, political, and institutional contextsof Nicaragua. As this case study has demonstrated, the effective implementation of such areform entails a long, steep, and bumpy learning curve. It is noteworthy that the intro-duction of a purchasing model is a viable reform option that merits consideration—evenin small, poor countries with weak institutional capacity and little previous experience withpublic purchasing of health services from the private sector—and should not be regardedas simply an infeasible strategic option in such settings. Important determinants of theprobability of success and ultimately of the degree of effectiveness of the program, how-
162 World Bank Working Paper

ever, include a combination of persistence, the development of technical know-how andthe capacity to negotiate and make incremental changes without departing from the moregeneral, underlying strategic approach.
Different health care market structures provide different sets of obstacles, constraints, andopportunities. The options available to a particular country for introducing a contracting-based, competitive model through which to purchase their social security institute’s orministry of health’s service delivery are dependent upon a host of political and technicalfactors. The most pertinent of the technical considerations are various aspects of the healthcare market structure, most notably the size, composition, degree of organization, andcapacity utilization of the private sector. The politics, institutions, and history of a coun-try are important parameters that will shape what can and will be considered necessary,feasible, and desirable and what is an appropriate pace of reform. Still, there are some com-monalities in terms of the structure of the reform, motivating factors, and market condi-tions, as well as in terms of strategic approaches.
Structure and Sequencing
The basic elements of an MSP-like reform package include:
1. a member identification, enrollment, and tracking system;2. a defined benefit package;3. a capitation payment, with a rate (or risk-adjusted rates) based on actuarial analysis
and a mechanism for regularly, periodically updating the rate(s);4. a system for certifying health care-providing entities or contractors thereof;5. a health services reporting system with specific, identified reporting requirements;6. a consumer advocacy office with a consumer education and marketing department
(in-house, contracted out, or some combination thereof);7. a monitoring and review system with clearly identified and communicated sanctions
for infractions;8. a medical audit capability (in-house, contracted out, or some combination thereof).
There is a logical sequence to setting up most of these components which coincides withtheir ordering above. The sequencing of items 5 through 7 is not likely to be as strictlyadhered to, because work on these items will probably be undertaken concurrently andtheir complete development is likely to be a lengthy process. This is not to suggest that theseitems are of lesser importance. They are critical, and, as the Nicaraguan experience testifies,they can be easily overlooked or slighted, but not without adverse consequences eventuallydeveloping. Also, political or technical considerations may not allow or enable adhering tothis specific sequence, or they may not allow fully addressing a particular component ofthe package, as may eventually prove necessary or desirable. For instance, establishing amedical audit capability—which may involve developing treatment protocols, possiblywith the assistance of the national medical association—is likely to be a lengthy process. Inaddition, some of the activities will change substantively over the course of the roll-out ofthe project. For example, in the initial stages of the reform, it will be essential to have amajor public information campaign run by the consumer advocacy office. Then, after theproject has been established for a year or two, the emphasis may shift to this office perform-ing more of an ombudsman-like function, serving as the key point of contact between the
Health System Innovations in Central America 163

institute and its insured. In this capacity, it will likely maintain a database of performance-related information about EMPs that it will make available to consumers.
Elements of Strategy
In most low- and middle-income countries (and particularly in Latin America and Africa),there is a dearth of knowledge about the private health sector. In most countries, the sector isgenerally relatively unorganized and atomized—that is, single physician practices are the rule,and multiphysician practices the exception. This makes the development and administrationof an MSP-type competitive scheme—one that contracts out to third-party providers—a dif-ficult and slow undertaking, and one that is likely to incur high start-up costs and high fixedcosts of administration. This suggests that it makes sense to start small (for example, only inthe capital city), to have a relatively long planning horizon (5 to 10 years or more), to think ofmeans by which to lessen administrative requirements (which will still constitute a bottleneck),and, in the event that EMP-like structures are to be relied upon, to actively assist them early inthe effort in forming, organizing, and becoming capable of participating in the program.
As has been demonstrated, much of the history of the MSP is a tale of the introduc-tion of a series of incremental changes that together reflect a general strategic approach thatthe INSS has followed in implementing the program. Start simply. See how things work.Keep your eye on the big picture—on where you want to get—and continually assess howchanging circumstances and capabilities allow you to introduce new features. Slowly phasein modifications. This approach enables nurturing the development of greater adminis-trative capacity and being able to develop a more informed understanding of participants’behaviors and their responses to change (both past and proposed), which enables furtherfine-tuning of the approach. This is a good, general, strategic approach that others inter-ested in reforming their health care systems would be wise to follow.
In large part because of its very different health care market structure, the case ofNicaragua is unique. The minuscule private sector circumscribed and made the establish-ment of the social security institute’s purchase of care a more protracted process than islikely to be the case elsewhere. The INSS was forced by default to work with MINSA toimplement the reform simply because the ministry had such an overwhelming presence inthe sector, while the private sector remained small and unorganized. This is not the case inmost other Latin American countries. Other countries, therefore, will have more latitudein deciding if they want their ministry of health to be an active participant in the reform.Although MINSA’s participation in the MSP has created some difficulties because of thelimited nature and unevenness of the participation of its staff and facilities, and has com-plicated the short-term politics of the effort, it would be advisable to encourage the min-istry of health’s participation in other countries as well. This is especially true if keeping thedoor open to eventually extending the reform to incorporate the ministry as well (andthereby creating a single-payer system) is desirable.
Enabling Factors
The case of Nicaragua is unique from another perspective as well. From 1979 until theintroduction of the MSP in late 1993, INSS RI affiliates received nothing for their health-earmarked their payroll taxes. The INSS was able to start at ground zero, and did not haveits choices of a service delivery mechanism constrained by having to fight an entrenched
164 World Bank Working Paper

set of service providers who, for example, with the introduction of the contracting of ser-vices would either have to be put at risk of, or would be directly put out of business by, thenewly contracted service providers. In other countries, it will be much more important toperform an analysis of stakeholders to identify the other key actors that will be involved inor affected by the reform, and to understand what the impact of the reform on them willbe and how they are likely to react to it. This information must be used to shape the reformso as to obviate or at least minimize opposition. Every effort should be made to design thereform in such a way as to make participation in it, at least early on, voluntary for providersand the insured. This will make it more widely acceptable and will lessen the likelihood thatpolitical opposition will coalesce early on and derail the effort.
Few other countries are likely to be able to start at ground zero. Instead, most will con-front the difficult task of having to take into account the current system’s vested interests.Many also have a different set of enabling conditions that provide a different set of oppor-tunities—some of which bode well for the possibility of being able to implement reform.Primary among these beneficial enabling conditions are excess capacity in the private sec-tor (often stemming from an excess supply of private physicians) and widespread dissatis-faction with a wide-ranging and significant number of the key structural aspects of existingsystems.13 The existence of excess capacity means that there is opportunity for keeping thecosts of the reform relatively low—saving the social security institute and perhaps the gov-ernment and general public money, while providing private physicians and health careorganizations with more patients and income. Those are attractive possibilities that willengender substantial political support. In many Latin American countries in particular,great dissatisfaction with the current system has resulted in substantial proportions ofsocial security insured and their employers paying out of pocket for private care eventhough they must continue to pay their health-earmarked social security tax. This level ofdissatisfaction means a significant portion of the general public in these countries is likelyto be keenly receptive to the idea of developing an alternative approach.
In many countries (particularly the Andean countries of Latin America and the Cen-tral American republics), the private sector has been relatively slow to organize and con-solidate because it has historically been crowded out by the combination of free orlow-priced ministry of health services and mandatory enrollment in social security systemswith their own health care delivery systems. The recent transformation of these historicallysmall, fragmented, and inefficient markets has created a large gap in service potential thata competitive scheme like Nicaragua’s MSP can well take advantage of. Indeed, domesticand foreign, multinational, managed care organizations have recently started to recognizethis and have begun making inroads in the Latin America market (Freudenheim andKrauss 1999). Private investors recognize this opportunity, now social security institutes,ministries of health, and governments need to do so, as well.
Health System Innovations in Central America 165
13. Even in many African countries, where there are relatively small numbers of private physicians,demand constraints result in unused private sector capacity (Fiedler and Wight 2003). A 1995 World Banksurvey in El Salvador, for instance, found that (a) private physicians average only 1.2 consultations per hour;(b) 20 percent of physicians reported they could increase the number of private consultations they provideby between 50 and 100 percent, and another 20 percent stated they could increase it by more than 100 per-cent; and (c) private hospitals had an average occupancy rate of only 54 percent (Iunes 1995, pp. 12–13).Similarly, a United States Agency for International Development study in Quito and Guayaquil, Ecuador,found private, for-profit physicians to be operating at only about 2 percent of their service provision capac-ity, and less than one-tenth that of the health sector considered as a whole (Fiedler and Nelson 1996, p. 5).

166W
orld Bank Working Paper
Annex FiguresAnnex Figure 5A.1. Evolution of Real GDP and the Number of INSS Affiliates, 1987–2000
3 . 0 %
5 . 5 %
7 . 4 %
4 . 1 %
5 . 1 %
4 . 8 %
4 . 3 %
3 . 3 %
- 0 . 4 0 %
0 . 4 %
- 0 . 2 %- 1 . 7 %
- 0 . 1 %- 1 2 . 4
- 0 . 7 %
0
5 , 0 0 0
1 0 , 0 0 0
1 5 , 0 0 0
2 0 , 0 0 0
2 5 , 0 0 0
3 0 , 0 0 0
1 9 8 7 1 9 8 8 1 9 8 9 1 9 9 0 1 9 9 1 1 9 9 2 1 9 9 3 1 9 9 4 1 9 9 5 1 9 9 6 1 9 9 7 1 9 9 8 1 9 9 9 2 0 0 0 2 0 0 1 2 0 0 2
No
. o
f IN
SS
aff
ilia
tes
(a
ll p
rog
ram
s)
0
5 0 , 0 0 0
1 0 0 , 0 0 0
1 5 0 , 0 0 0
2 0 0 , 0 0 0
2 5 0 , 0 0 0
3 0 0 , 0 0 0
3 5 0 , 0 0 0
Re
al
GD
P (
mil
lio
ns
of
19
80
có
rdo
ba
s)
R e a l G D P ( l a b e l s = a n n u a l g r o w t h r a t e ) A l l I N S S a f f i l i a t e s

Health System Innovations in Central America 167
Annex Figure 5A.2. The Proportion of All INSS Affiliates Eligible to Participate in theMSP and the Proportion that Participates
63%
1%
64%
27%
67%
43%
68%
53%
69%
49%
72%
56%
75%
67%
76%73%
80%
75%
84%
77%
0%
10%
20%
30%
40%
50%
60%
70%
80%
90%
1993 1994 1995 1996 1997 1998 1999 2000 2001 2002
MSP-eligible as % of all INSS affiliates Participating in MSP as % of all INSS affiliates
Annex Figure 5A.3. Growth in the Number of MSP Beneficiaries, Including EMP-EnrolledINSS Affiliates and Their Eligible Dependents
2,024
78,349
128,128
167,105190,871
238,997
312,190
351,470
417,453427,139
0
50,000
100,000
150,000
200,000
250,000
300,000
350,000
400,000
450,000
1993 1994 1995 1996 1997 1998 1999 2000 2001 2002

168 World Bank Working Paper
Bibliography
Baeza, Cristian. 2005. “Taking Stock of Health Sector Reform in Latin America: Trends andChallenges of Health Sector Reform.” In Beyond Survival: Protecting Households againstthe Impoverishing Effects of Health Shocks. Washington, D.C.: World Bank.
Barry, Patricia, and Sharon Connors. 1997. “Medicaid Managed Care Contracting Guide.”Center for Health Care Strategies, Princeton, N.J.
Chollet, Deborah J., and Maureen Lewis. 1997. “Private Insurance: Principles and Practices.”In George J. Schieber, ed., Innovations in Health Care Financing. Washington, D.C.:World Bank. (Originally published as World Bank Discussion Paper 365.)
David, V., M. Largaespada, M. J. Fredersdorff, and I. M. Fajardo. 1996. “Estudio de demandade servicios de salud en Nicaragua.” Inter-American Development Bank Project con-sultancy report.
Enthoven, Alain C. 1993. “History and Principles of Managed Competition.” Health Affairs12(Suppl):24–48.
Fiedler, John L. 1994. “LSMS/Nicaragua: Self-Reported Health Status and the Use ofHealth Care Services.” World Bank consultancy report. Washington, D.C.
———. 1996a. “A Simulation Model of the Impact of the Social Security Institute’s Pro-grama de Salud Previsional on the Ministry of Health’s Level and Mix of ServicesDelivery and Its Financing Requirements.” Management Sciences for Health consul-tancy report prepared for the Inter-American Development Bank. Boston.
———. 1996b. “The Efficiency, Financing and Role of the Ministry of Health of Nicaragua:A Retrospective and Prospective Analysis.” United States Agency for InternationalDevelopment/Nicaragua Project NEPAI consultancy report.
———. 1996c. “The Privatization of Health Care Systems in Three Latin American SocialSecurity Systems.” Health Policy and Planning 11(4):406–17.
Annex Figure 5A.4. Growth in the Number of EMPs, 1994–2000
8
2024
30
38 4046 48 48
0
5
10
15
20
25
30
35
40
45
50
Nu
mb
er o
f E
MP
s
1994 1995 1996 1997 1998 1999 2000 2001 2002

———. 1999. “Demand, Market Structure and the Formalizing of Ministry of Health Fees:A Nicaraguan Case Study.” World Development 27(7):1173–89.
Fiedler, J. L., and D. Nelson. 1996. “Private Sector Healthcare Services in Ecuador: ANational Survey of Private Health Facilities” Consultancy report to the United StatesAgency for International Development’s Initiatives Project, John Snow Incorporated,Arlington, VA.
Fiedler, John L., and Jonathan B. Wight. 2003. “Privatization and the Allure of Franchis-ing: A Zambian Feasibility Study.” International Journal of Health Planning and Man-agement 18(3).
pattihereFigueras, J., R. Robinson, and E. Jakubowski, eds. 2005. Purchasing to ImproveHealth System Performance. Berkshire: Open University Press.
Freudenheim, Milt, and Clifford Krauss., 1999. “Dancing to a New Health Care Beat; LatinAmerica Becomes Ripe for U.S. Companies’ Picking.” New York Times, June 16.
Gerencia General de Salud Previsional, Instituto Nicaragüense de Seguridad Social. 1999.Directorio nacional de empresas medicas previsionales. Managua.
Gold, Marsha R., Michael Sparer, and Karyen Chu. 1998. “Medicaid Managed Care:Lessons from Five States.” In Marsha R. Gold, ed., Contemporary Managed Care: Read-ings in Structure, Operations and Public Policy. Chicago: Health Administration Press.
Gwatkin, Davidson R. 2005. “For Whom to Buy? Are Free Government Health Services theBest Way to Reach the Poor?” In Alexander S. Preker and John C. Langenbruner, eds.,Spending Wisely: Buying Health Services for the Poor. Washington, D.C.: World Bank.
Hauck, Katharina, Peter C. Smith, and Maria Goddard. 2005. “What to Buy? Revisiting Pri-ority Setting in Health Care.” In Alexander S. Preker and John C. Langenbruner, eds.,Spending Wisely: Buying Health Services for the Poor. Washington, D.C.: World Bank.
Inter-American Development Bank. 1996. Economic and Social Progress in Latin America:Making Social Services Work. Washington, D.C.
Iunes, Roberto. 1995. “A Survey-Based Analysis of the Private, For-Profit Health Sector ofEl Salvador.” World Bank consultancy report, San Salvador.
Jönsson, Bengt, and Philip Musgrove. 1997. “Government Financing of Health Care.” InGeorge J. Schieber, ed., Innovations in Health Care Financing. Washington, D.C.:World Bank (Originally published as World Bank Discussion Paper 365.)
Kongstvedt, Peter R. 2001a. “Compensation of Primary Care Physicians in ManagedHealth Care.” In Peter R. Kongstvedt, ed., The Managed Care Health Handbook.Gaithersburg, Md.: Aspen.
———. 2001b. “Negotiating and Contracting with Hospitals and Institutions.” In PeterR. Kongstvedt, ed., The Managed Care Health Handbook. Gaithersburg, Md.: Aspen.
Kutzin, Joseph, Ainura Ibrainova, Ninell Kadyrova, Gulaim Isabekova, Yevgeny Samyshkin,and Zainagual Kataganova. 2001. “Innovations in Resource Allocation, Pooling andPurchasing in the Kyrgyz Health Care System.” Paper presented at the Department forInternational Development-World Bank Conference, London.
La Forgia, Gerard M., Charles C. Griffin, and Randall R. Bovbjerg. 1993. “Extending Cov-erage and Benefits of Social Financing Systems in Developing Countries.” HealthFinancing and Sustainability Project (funded by the United States Agency for Inter-national Development), Major Applied Research Paper 3. ABT Associates and theUrban Institute, Bethesda, MD.
Health System Innovations in Central America 169

La Forgia, Gerard M., and Roberto Gutierrez. 2000. “Growing Pains: The Nicaraguan SocialInsurance Health Model in Transition.” In Magdalena Rosenmöller, ed., Challenges ofHealth Reform. Barcelona and Washington, D.C.: IESE Business School, Universidadde Navarra.
La Forgia, Gerard M., Ruth E. Levine, R. Diaz, and Madalena Rathe. 2004. “Fend for Your-self: Systemic failure in the Dominican Health Market.” Health Policy 67(2):173–186.
Langenbrunner, John C., and Xingshu Liu. 2005. “How to Pay? Understanding and UsingPayment Incentives.” In Alexander S. Preker and John C. Langenbruner, eds., SpendingWisely: Buying Health Services for the Poor. Washington, D.C.: World Bank.
Lember, Margus. 2002. “A Policy of Introducing a New Contract and Funding System ofGeneral Practice in Estonia.” International Journal of Planning and Management17:41–53.1997;
Lobato, Ana. 2002. “Aspectos distributivos do gasto público na saúde.” Preliminary study,Ministry of Health. Brasília. Processed.
Londoño, Juan Luis, and Julio J. Frenke. 1997. “Structured Pluralism: Towards an Innov-ative Model for Health System Reform in Latin America.” Health Policy 41(1):1–36.
Medici, André, Juan Luis Londoño, Oswaldo Coelho, and Helen Saxenian. 1997. “Man-aged Care and Managed Competition in Latin America and the Caribbean.” In GeorgeJ. Schieber, ed., Innovations in Health Care Financing. Washington, D.C.: World Bank.(Originally published as World Bank Discussion Paper 365.)
Mesa-Lago, Carmelo. 1992. Health Care for the Poor in Latin America and the Caribbean.Washington, D.C.: Pan American Health Organization and the Inter-AmericanFoundation.
Mills, Anne. 1998. “To Contract or Not to Contract? Issues for Low and Middle IncomeCountries.” Health Policy and Planning 13(1):32–40.
Ministry of Health, Nicaragua. 1997. “Producción de servicios: 1991–1996.” Managua.Montenegro Torres, Fernando, and Cristian Baeza. 2005. “From Whom to Buy? Selecting
Providers.” In Alexander S. Preker and John C. Langenbruner, eds., Spending Wisely:Buying Health Services for the Poor. Washington, D.C.: World Bank.
Organisation for Economic Co-operation and Development. 1994. “The Reform of HealthCare Systems: A Review of Seventeen OECD Countries.” Organisation for EconomicCo-operation and Development Health Policy Studies 5. Paris.
Palmer, Natasha, and Anne Mills. 2003. “Classical versus Relational Approaches to Under-standing Controls on a Contract with Independent GPs in South Africa.” Health Eco-nomics 12:1005–20.
Preker, Alexander S., Cristian Baeza, Melitta Jakab, and Jack Langenbrunner. 2001.“Resource Allocation and Purchasing Arrangements that Benefit the Poor andExcluded Groups.” World Bank, Washington, D.C. Processed.
Puig-Junoy, Jaume. 1999 “Managing Risk Selection Incentives in Health Sector Reforms.”International Journal of Health Planning 14:287–311.
Quintanilla, Pedro J. 2001. “Evaluación de la gestión técnica-administrativa e impactos delSeguro de Enfermedad-Maternidad 1997–2001.” Gerencia General de Salud Previ-sional, Instituto Nicaragüense de Seguridad Social, Managua.
Saltman, Richard B., and Josep Figueras. 1997. European Health Care Reform: Analysis of Cur-rent Strategies. Copenhagen: World Health Organization Regional Office for Europe.
170 World Bank Working Paper

Schieber, George J., ed. 1997. Innovations in Health Care Financing. Washington, D.C.:World Bank. (Originally published as World Bank Discussion Paper 365).
Slack, Katherine, and William D. Savedoff. 2001. Public Purchaser-Private Provider Contract-ing for Health Services: Examples from Latin America and the Caribbean. Washington, D.C.:Inter-American Development Bank.
Smith, Peter C., and Sophie N. Witter. 2005. “Risk Pooling and Purchasing.” In AlexanderS. Preker and John C. Langenbruner, eds., Spending Wisely: Buying Health Services forthe Poor. Washington, D.C.: World Bank.
Taylor, Robert F. 2003. “Contracting for Health Services.” In Private Participation in HealthServices. Washington, D.C.: World Bank.
Ubilla, G., C. Espinosa, and R. Bitán. 2000. “The Use of Capitation Payment by the SocialSecurity Institute and Previsional Medical Enterprises in Nicaragua.” United StatesAgency for International Development’s Partnerships for Health Reform Project,Major Applied Research Working Paper 3, Bethesda, MD.
World Health Organization (WHO). 2000. World Health Report 2000—Health Systems:Improving Performance. Geneva.
Health System Innovations in Central America 171


CHAPTER 6
173
A New Dimension for HealthReform—The IntegratedCommunity Child Health
Program in Honduras
Marcia Griffiths and Judith S. McGuire
Abstract
This chapter describes a national, community-based, public health and nutri-tion program in Honduras called AIN-C (Atención Integral a la Niñez en laComunidad [Integrated Community Child Health Program]). The programwas launched in 1990 because, although infant mortality had dropped dramati-cally in Honduras, malnutrition in young children remained virtually unchangedat a very high level. In its seven year evolution from concept to consolidated pro-gram, AIN-C moved from being a facility-based growth monitoring and inte-grated disease management program to a community-based preventive healthcare and nutrition program built on a foundation of monthly growth promotion,on-demand management and referral of disease in children under age five, andcare of the newborn. Innovative characteristics of the program include its focuson preventing malnutrition in all children under two through tailored and nego-tiated counseling on behavior change, development of counseling messages in thecommunity through Trials of Improved Practices (TIPS), the use of a team ofvolunteers in each community, and a simple but elegant information systemused for supervision, community mobilization, health coverage statistics, moni-toring, and evaluation. The program currently covers almost half of the healthareas in Honduras. An impact evaluation carried out in 2002 showed that AIN-Csignificantly improved both height and weight of participants compared tononparticipants and that AIN-C had significantly improved key householdbehaviors in health and nutrition. A careful cost study, also carried out in 2002,showed that AIN-C cost US$2.73 in annual recurrent costs per child under fivein participating communities or US$1.60 in incremental annual recurrent costs.Many other countries—both in the Latin America region and in Africa andAsia—have studied AIN-C and adapted the model to their own circumstances.

This chapter is about an innovative, community-based public health and nutritionprogram in Honduras called AIN-C (Atención Integral a la Niñez en la Comunidad[Integrated Community Child Health Program]). After first reviewing the justifi-
cation for a program like AIN-C in health reform, the chapter reviews the history and evo-lution of the program. It then examines the program’s conceptual framework, impact, andbasic processes. Finally, the chapter draws attention to design innovations considered cen-tral to AIN-C’s effectiveness as a key component of health sector reform.
Background
Two recent documents that outline goals and steps to overcome health disparities clearlyshow the role that a program like AIN-C can play in filling critical gaps.
According to the World Bank’s most recent World Development Report, public servicesare failing the poor in four ways: public expenditures are not spent on services needed bythe poor, the money does not always reach the frontline service provider, the serviceproviders have little incentive to provide services to the poor, and the poor may not takeadvantage of the services available because of lack of information, sociocultural factors, oraccessibility (World Bank 2003). The Bank also points out that health services often fail toreach the poor because clients do not play an active role in tailoring services to their needsand monitoring providers. The Honduran program described in this chapter addresses allof these issues. AIN-C is a community-based service program, funded and implementedby the government (or by nongovernmental organizations [NGOs] in specific locales), thataddresses the most critical health problems of poor children. The program connects thegovernment’s public health system with families through a child growth promotion pro-gram run by monitoras (community volunteers). AIN-C monitoras empower families toraise healthy children by providing monthly, tailored counseling to parents on child feed-ing, home care of common illnesses, and appropriate use of health services.
Community participation is a central tenet of AIN-C. The community has responsi-bility for selecting the AIN-C team, reviewing children’s progress, and solving detectedproblems that impede child health. AIN-C’s simple but elegant information system pro-vides an objective means to measure the performance of families, community volunteers,and local health services, and it generates the quantitative evidence a community needs toidentify and resolve common problems and demand resources from local authorities. Theprogram addresses the market failures in health service delivery by overcoming informa-tional asymmetries: parents and communities now have the information they need toassess their own children’s health.
Two of the eight Millennium Development Goals (MDGs) will not be met unless childmalnutrition is improved. The first MDG, eradication of extreme poverty and hunger, ismeasured in terms of underweight in children under the age of five. The fourth MDG, reduc-tion by two-thirds of under-five mortality, is also directly related to child nutrition. It hasbeen well documented that undernutrition is a direct or underlying cause of more than halfof under-five child (Pelletier 1994). By preventing healthy newborns from faltering in growthover the first 18–24 months of life, malnutrition in children younger than five and under-fivemortality can be dramatically reduced. Prevention of growth faltering requires proactive
174 World Bank Working Paper

attention to child growth, feeding practices, immunization, health and hygiene behaviors,and care of the sick child. AIN-C addresses all of these causes of growth faltering in a low-cost way at the community level, bringing to life the causal framework (see Figure 6.1) putforward by the United Nations Children’s Fund (UNICEF) in 1992 for malnutrition.
Health System Innovations in Central America 175
Figure 6.1. UNICEF Framework
Inadequatedietary intake
Disease
Inadequatematernal and
child care
Insufficient healthservices and unhealthy
environment
Inadequate education
Resources & control
Political and ideologicalsuperstructure
Economic structure
Insufficienthousehold food
security
Potential resources
Manifestation
Under-lying causes
Malnutrition
Immediatecauses
Basic causes
Rationale for AIN-C-type Programs in Health Reform
Active community participation, ownership, and stewardship are essential to successfuldemocratic development. Sustainable and equitable economic development, includingpromoting a healthy population, must include broad-based participation in the process.Program and project experience has shown that the organized community is essential tosuccess in water and sanitation, education, health, reforestation, watershed management,and public works. In many cultures (Indonesia, for example), there is a long history ofcommunity cooperation and action. The community can be a source of redistribution andrelief (in some communities in Africa, for instance, the community maintains an emer-gency food store). And, in most developing countries, the community is looked to as thelabor pool for program implementation and a source of political support and financing for

many public programs. One measure of success is that the resources reach the poor. As theWorld Development Report 2004 points out, one way to ensure that resources reach the pooris to transfer responsibility to the clients and the community (World Bank 2003).
The ideal of broad-based community participation and stewardship is rarely achieved,however. Too often, development programs are designed in the capital city or donor head-quarters and begun in communities without any local consultation. They are entirely sup-ply driven, providing goods, services, or both, yet simultaneously expecting labor, goods,and utilization in exchange. Often, these programs that reach the community level are cap-tured by local elites, seldom reaching those in need. In other cases, where communitymembers may be more involved, they still may not participate in program governance.Community members’ work is often taken for granted, with recognition given only dur-ing elections or catastrophes.
The health sector needs community action at least as much as other sectors. Basicpreventive health measures and appropriate use of health services by the sick require thatcommunity leaders and community-based health workers reach those who are hard toreach with education and information and mobilize and govern community action in aresponsible fashion. To take action, citizen-clients need to know about immunizationdays, new services available at the local health post, eligibility criteria for new programs,trash disposal, sanitation, maintenance of community water sources, and emergencyassistance. The community also should provide feedback to the health system. Effectiveepidemiological surveillance requires information from the community level rather thanfrom facilities alone (see Table 6.1).
176 World Bank Working Paper
Table 6.1. Why Community Participation Matters to Health Reform
Public provision Community participation required
Cold chain, vaccines, andvaccinators
Preventive health care services,such as nutrition, diarrheacontrol, prenatal care, familyplanning, bed nets, and so on
Acute care facilities and staff
Water and sanitationinfrastructure
Environmental sanitationregulations and standards;garbage collection in cities
Service statistics
Community organized for immunization days
Education and follow-up on basic preventive health care behaviors for the family, such as home or self-care,appropriate use of basic supplies, and health-seeking behavior
Detection, referral, and transport of acutely ill people to acutecare facilities; follow-up and compliance with drug and treatment regimens once patients return home
Hygiene education and maintenance of water and sanitationsystems; payment systems
Organization of the community to clean up air, water, andland; social pressure to dispose of waste properly
Provision of information for epidemiological surveillance,birth and death registries, and civil registry
Because health sector reform touches on the broad array of systems that influence cost-effective health care provision, it must design the system around community participation inhealth. The community needs to be drawn in to ensure good health outcomes. Communityparticipation facilitates health reform by getting services to needy clients, organizing demand,

informing supply, overseeing personnel, identifying unmet needs, and educating the con-sumer. Broad-based community participation makes it more likely that health services will beaccessible to the poor and needy, a key goal of health reform. However, the community andthe household have not been given adequate attention in most health reform programs.
At the same time, community participation depends on health reform for long-termsustainability. The community needs to be able to count on back-up from the health sys-tem, whether the support comes in the form of supplies, training, or supervision for com-munity workers or timely, high-quality health care at the facility. Although successful inseveral ways, an evaluation of the Honduras Rural Penetration Program in the 1980s foundthat the program was not as effective as it could have been because of the failure of thehealth system to back it up (Bossert and others 1988).
Most health reforms are carried out at the central government or ministry level, andfocus on changing policies and norms with an institutional perspective. Even decentral-ization and performance-based contracts generally stop at the health district level and don’treach down to the most peripheral service level. Since the early 1980s, Honduras has beenreforming its health sector (albeit in fits and starts, with changes of administration and per-sonnel) and strengthening community participation as part of an integrated strategy. Thecountry went beyond simple decentralization and has constructed more facilities closer tothe population. It improved access, equity, and outcomes by developing several commu-nity programs (particularly for immunization and for detection and treatment of dehy-dration and pneumonia). The final step has been to place the program in the communitywith governance by the community and only support from the health services.
History
Honduras has made remarkable progress in both improving health outcomes and providingequitable access to health services, especially given its low per capita income. (Gross nationalproduct per capita in 2002 was US$920 [World Bank 2003].) Although the economy overallis quite inequitable, health care is equitably distributed. For instance, in the mid-1990s, thepoorest quintile of the population earned only 3 percent of the income but used 21 percentof preventive health care, 17 percent of ambulatory care, and 15 percent of hospitalizations(World Bank 1997). The differences between the wealthiest and poorest quintiles in overallhealth care use are small, but the poor use predominantly public health services and the richuse private health services (World Bank 1997).
Infant mortality in Honduras dropped from 110 per 1,000 in 1970 to 39 per 1,000 in1990, and life expectancy increased apace. This rate of decrease was fast even for LatinAmerica, and notable because Honduras is one of the poorest countries in the region.Between 1990 and 1995, maternal mortality fell from 182 per 10,000 to 108 per 10,000(Walker 2003), but the decline in infant mortality has slowed since 1990. In 2000, infantmortality was 35 per 1,000.
The early, sharp decline in infant mortality was attributed not so much to the amountof money invested in the health system (about US$20 per capita in 1995; World Bank 1997)but to the effectiveness of the programs (Walker 2003). Particularly effective were vacci-nation programs using community volunteers that addressed diarrhea and respiratory ill-ness (World Bank 2001b). Part of this drop in mortality was also due to declines in fertilityrates from 7.5 in 1970 to 4.4 in 2001 (Walker 2003).
Health System Innovations in Central America 177

Health, however, is more than the absence of death. Although Honduras did a goodjob preventing death and controlling infectious disease agents, it did not do so well on non-infectious causes of disease—for example, malnutrition. While Honduras was saving livesthrough immunization and timely treatment of acute infections, it was doing much lessabout health promotion. Malnutrition was persistently high in the 1970s and 1980s, in spiteof massive food aid and a conditional cash transfer program (Programa de AsignaciónFamiliar [PRAF]). Over the course of the 1990s, fortunately, nutrition has improved. In1987, stunting stood at 44 percent, but it had fallen to 38 percent by 1996 and to 33 per-cent by 2001. Overall malnutrition, as measured by weight-for-age, fell from 24 percent to18 percent in the same period (see Figure 6.2).
178 World Bank Working Paper
Figure 6.2. Honduras Mortality and Malnutrition
0
20
40
60
80
100
120
1975 1980 1985 1990 1995 2000 2005Year
Per
cen
t
Stunting
Infant Mortality Rate
Under 5 Mortality Rate
The reason for the persistence of malnutrition until the mid-1990s and the recent dropis not well understood. Neither economic growth nor poverty reduction can explain thechanges in the malnutrition numbers. Malnutrition is concentrated among the poor, yetincreased household income does not immediately result in improved child nutrition(Haddad and others 2002). Annual economic growth between 1981 and 1990 was 2.5 per-cent, and it increased to 3.1 percent in the 1990s (World Bank 2001b). This rate of growthwas dampened, however, by population growth rates, which averaged 2.9 percent annu-ally between 1990 and 2000 (World Bank 2002).
The Evolution of AIN-C
In 1990, the Secretariat of Health realized that malnutrition was persistent and suspected thatit was the reason why mortality rates were stagnating. This commonsense suspicion was but-tressed by the international literature, which showed that more than half of under-five mor-tality globally was due to malnutrition, particularly to mild and moderate malnutrition(Pelletier 1994). Research in neighboring Guatemala showed that the effects of malnutritionin early childhood were not reversed in later life (Martorell 1990; Martorell, Khan, and

Schroeder 1994). A close look at the growth curves of young children in Honduras showedwhat was happening. For the majority of children, malnutrition began at about 3 or 4 monthsof age, with its severity increasing progressively until the child reached about 18 months ofage, by which point the child’s growth was significantly retarded (see Figure 6.3).
Health System Innovations in Central America 179
1. Dr. Gustavo Corrales reported this history at a World Bank Nutrition Training Course October1998. Dr. Corrales was Director General of Health at the inauguration of the clinic-based AIN programand a consultant on the design of AIN-C.
Figure 6.3. Declining Nutritional Status of Honduran Children in Standard Deviationsbelow the Norm, Encuesta Nacional de Epidemiología y Salud Familiar1991–92
–1.6
–1.4
–1.2
–1
–0.8
–0.6
–0.4
–0.2
03 6 9 12 15 18 21 24
Age (months)
Wei
gh
t-fo
r-ag
e(z
-sco
res)
Honduran health authorities realized that children seen periodically at health centerswere becoming malnourished, but the health system was not detecting it. Child growth overtime reflects everything that is going on in the child’s home and community environmentthat affects health: disease, nutrition, psychosocial stimulation, and child care. Malnutritiondoes not come upon a child in a matter of days, like an infectious disease. It is insidious, start-ing with a child showing signs of anorexia and gradually being reflected in slower growth.The common perception of malnutrition—bloated belly, coppery hair, and sticklike limbs—is not typical of 90 percent of the malnutrition in the world. Contrary to common practice,nutritional status (weight-for-age at any one point in time) is not a very useful programmatictool to detect malnutrition. Malnutrition is a dynamic process, the result of daily stressesof inadequate feeding, frequent bouts of disease (often minor diseases), and inadequatecare. One cannot diagnose malnutrition in its early stage without keeping track of a child’sgrowth (weight gain) from one month to the next. Assessing adequate weight gain is likewatching the onset of an illness, from general malaise to high fever or pox.
Realizing that inadequate weight gain is the first sign of a problem, Honduran healthofficials revised health center norms to require the detection of growth faltering in childrenand use that as an additional way to triage children for services. Any child who failed togain adequate weight was subject to careful review of his or her health and home care situa-tion. Inadequate growth was key to exploring multiple causes and integrating care proto-cols as needed. A special form, a checklist of causes of poor growth, was used to guide theexploration. Using growth faltering (the failure to gain the expected minimum amount ofweight) as a prompt was successful. There was a 25 percent decline in malnutrition ratesin program clinics after three years.1

By 1994, as the secretariat was reviewing the clinic-based strategy, they recognized thatit would not result in a positive impact on public health unless they could put it in the handsof the community and reach all children. The community AIN approach (AIN-C), withgrowth promotion at its heart, was piloted in two health areas in about a dozen communi-ties. The piloting was done in an ad hoc way, left up to local managers who combined it dif-ferently with the existing community diarrhea and acute respiratory infection (ARI) controlprograms. This resulted in a 1995 report on experiences but inconclusive results. A nationalmeeting on AIN-C called for systematizing the program process and changing the techni-cal content to include just the most efficacious essentials at the community level, refiningthe assessment of adequate weight gain (how to quantify an adequate growth trajectory),and placing more emphasis on how to counsel and on improving feeding of young children.
Simultaneous with the Honduran Secretariat of Health’s interest in systematizing theircommunity program for national expansion, the World Bank had just completed a review ofworldwide experience with growth promotion programs (Griffiths, Dickin, and Favin 1996).The best practices highlighted in that review, plus the lessons learned from communities thatpiloted the strategy in Honduras, directed AIN-C program development. At the point of pro-gram development, the Secretariat of Health requested technical assistance from USAID’schild survival project, BASICS. Over approximately an 18-month period (mid-1996 to late1997), program procedures were worked out with a few communities and with authoritiesat different levels in the Secretariat of Health. Research was conducted to better understandhousehold child feeding practices, and manuals, training guides, and educational materi-als, including a detailed set of counseling cards, were written, tested, and published. In early1998, the program was relaunched by the Secretariat of Health in 9 of the most populatedof Honduras’s 47 health areas. Since 1998, the AIN-C program has expanded through sec-retariat facilities to cover communities under every health center in 24 health areas. At leasteight NGOs implement AIN-C, and, in additional communities, the program is operatedby a special family assistance program (PRAF) from the president’s office in collaborationwith the Secretariat of Health.
Expansion of AIN-C has continued each year, as have technical and managerial refine-ments and additions (see box 6.1). Critical to the adjustments was revamping the childhealth actions to reflect more closely the World Health Organization’s and UNICEF’s rec-ommendations on integrated management of childhood illnesses (IMCI). In 2002, the pro-gram strengthened attention to newborns. In sum AIN-C has emerged as an integrated,basic package of care for the young child in the community.
Does AIN-C Work? What Does it Cost?
In 1998, the government of Honduras carried out a baseline survey for the AIN-C program.A midterm evaluation was carried out in 2000 (Van Roekel and others 2002), and a finalimpact survey was carried out in 2002 (Plowman and others 2004). The midterm evalua-tion showed that although AIN-C communities were more disadvantaged than control vil-lages, they had made enormous strides in knowledge, attitudes, and practice concerningcommon diseases of childhood, child feeding, and administration of micronutrient sup-plements and vaccines. AIN-C communities met or exceeded control communities on vir-tually all indicators (see Tables 6.2 and 6.3).
180 World Bank Working Paper

Health System Innovations in Central America 181
Box 6.1. Continually Seeking Improvement
In an effort to ensure that AIN-C program activities were making a difference, the U.S. Agency forInternational Development (USAID)–supported Basic Support for Institutionalizing Child SurvivalProject (BASICS) program worked with the Honduran Ministry of Health to conduct a comprehen-sive impact evaluation of the program. The baseline survey was done in July 1998, and the midtermsurvey was conducted in July and August 2000. One of the assumptions of the AIN-C program designis that rates for fully immunized children by 12 months would be significantly improved in AIN-Ccommunities because of its emphasis on universal enrollment, focus on early enrollment (the firstmonths of life), and on frequent (monthly) contact.
Midterm results showed that even in a country with high immunization rates, coverage could stillbe improved when a community-based program such as AIN-C is functioning. In AIN-C communi-ties at midterm, vaccinations for diphtheria-pertussis-tetanus, polio, and measles were 88.1 per-cent, 87.7 percent, and 86.0 percent, respectively, compared to control communities where therates were 83.7 percent, 82.5 percent, and 77.6 percent. The one exception was Calmette-Guérinbacillus (BCG) immunization. Coverage rates in AIN-C communities were lower than control com-munities (85 percent versus 94 percent). The explanation, that fewer women in AIN-C communitieswere delivering their babies in a facility, meant that AIN-C needed to get babies born at home tohealth care services. In response, an activity focusing on newborns was added to AIN-C. Now themonitora is responsible for visiting newborns and enrolling them in AIN-C within 48 hours of a homebirth or of the mother returning home from an institutional birth. Among other activities, check-ing that the infant received BCG is fundamental. If the child is unimmunized, the monitora ensuresreceipt of the vaccine through active referral or notifying the nurse for her next community visit. Inthis way, the “hard to reach” are covered by this vital service.
Table 6.2. Caregivers’ Exposure and Participation and Use of Key Health Services
AIN-C Control
1998 2000 1998 2000Variable (baseline, %) (%) (baseline, %) (%)
Caregivers know about theCBGP program in their 27 96 7 15community
Caregivers participate in theCBGP program in their 30 92 21 23community
Caregivers attend weighingsession 3 or more times in 30 70 38 44the past 3 months
Caregivers have theirchildren fully immunized by 62 76 65 66the age of 12 months
Caregivers have theirchildren 4 months of age or 2 47 4 4older take iron supplements

The impact evaluation of 2002 looked at most of the same indicators of programperformance and impact as the midterm, but it also measured nutritional status. By 2002,24 percent of the children in the control communities were participating in growth promo-tion, either in the community or at their local health facility. This confounded the evaluationdesign. Therefore, results of the 2002 evaluation were analyzed based on participation ornonparticipation in growth promotion programs (community-based or facility-based),regardless of original community designation of control or program. Participants incommunity-based growth promotion (CBGP) and AIN-C continued to be disadvan-taged on virtually every indicator of wealth and welfare (except for water source), butthe behavior differences between AIN-C and control at midterm (2000) continued to besignificant in 2002, when children who were not in growth promotion programs were com-pared with participants. Overall, the advantages of participation seen at midterm weremaintained but did not increase. For example, the rate of exclusive breastfeeding of childrenunder six months of age was significantly greater among participants in AIN-C than amongnonparticipants (57 percent versus 42 percent), and overall child feeding was significantlybetter among AIN-C participants than nonparticipants: 72 percent of the former fed theirchildren appropriately versus 60 percent of the latter. The important new information fromthe 2002 evaluation is in two areas—seeking care for ARI and nutritional status. The adventof the illness management module made a difference in care seeking for participants ingrowth promotion. Participant families sought care for an episode of ARI about one full dayearlier than they did prior to the illness management activities. Furthermore, home-basedtreatment of diarrhea (giving increased fluids, including breast milk) was significantly higheramong AIN-C participants compared to nonparticipants—51 percent versus 38 percent. Inaddition, appropriate home treatment of diarrhea (62 percent versus 38 percent gave oralrehydration solution or any fluids) and care seeking for diarrhea (45 percent versus 33 per-cent sought care) were significantly better among participants in AIN-C compared to non-
182 World Bank Working Paper
Table 6.3. Caregivers’ Key Health Promoting Practices
AIN-C Control
1998 2000 1998 2000Variable (baseline, %) (%) (baseline, %) (%)
Exclusive breastfeeding of 21 39 15 13children under 6 monthsof age
Offering complementary 70 76 70 63foods at an appropriatetime
Giving oral rehydration 32 50 30 32solution to children withdiarrhea
Giving oral rehydration 37 57 36 42therapy to children withdiarrhea
Giving children fluids and 21 33 17 16continued feeding during about of diarrhea

participants. In addition, significantly more AIN-C participants knew the danger signs of ARIcompared to nonparticipants. Far more AIN-C participants had received iron and vitaminA supplements compared to nonparticipants. Participation in growth promotion appears toresult in significantly better-nourished children when controlling for socioeconomic andcaregiver variables. Full participation in AIN-C was associated with significantly greaterweight-for-age (P<.01) and height-for-age (P<.05). This translates into a 0.395 z-score incre-ment in weight-for-age in participants over nonparticipants. Children in facility-basedgrowth promotion programs showed no difference from nonparticipants when controllingfor caregiver and socioeconomic factors.
A detailed cost analysis was also car-ried out in 2002 (Fiedler 2003). The coststudy was one of the most comprehen-sive empirical costing studies done todate on a community health program. Itfound that AIN-C cost US$1.60 perparticipating child under age five inlong-term annual incremental recurrentcosts or US$0.44 per capita of popu-lation covered. The community-basedprogram costs one-ninth of what thefacility-based growth-monitoring pro-gram costs and provided more thanthree times the coverage of child-ren under age two. Compared to pub-lic health expenditures of US$34 percapita in 2000, AIN-C’s cost must beconsidered marginal. AIN-C’s cost islow relative to similar programs in othercountries and relative to food distribu-tion programs (see Table 6.4).
How AIN-C Works
AIN-C works by focusing on many ofthe same principles applied in healthreform but at the household and community level. The program uses objective data on growthto determine need. It targets services by prioritizing children under age two, particularly thosebeginning to falter in growth, and focusing on adequate nutrition, care, and health-seekingpractices instead of expensive treatment and supplementary feeding regimes. It brings equityby insisting on 100 percent coverage of under twos, and it decentralizes decisionmaking to thecommunity and household, recognizing that the root of many problems is local.
The central focus of AIN-C is frequent contact with and precise advice to the parentsof those most at risk—all children from birth to 24 months—because that is the age ofextremely rapid growth and high susceptibility to environmental insults. AIN-C’s premiseis that most infants are born healthy but sustain most of their lifetime “injury” during thefirst 24 months of life. Therefore AIN-C’s goal is to maintain newborn health (or recuper-
Health System Innovations in Central America 183
Annual unit cost Program per participanta
AIN-C CBGPb
TINP (India) CBGP plusselective feedingc
Iringa (Tanzania) CBGPc
BINP (Bangladesh) CBGPplus feedingd
Indonesia CBGPe
Food supplementationf
School feedinge
US$1.60 (incrementalcost) or US$6.80 totalcost (2003)
US$9.00 (1985)
US$10.00 (1991)
US$18.00 (2001)
US$2.00 (1985)
US$46.00 (1985)
US$12.00 (1985)
Table 6.4. Comparative Costs of NutritionPrograms for Children under 5
a. Dollar figures are the equivalent of the cost inlocal currency in the year noted in parentheses.b. Fiedler (2003).c. Gillespie, Mason, and Martorell (1996, table 5.2).d. Mason et al. (2001, table 4.3).e. Ho (1985).f. Kennedy and Alderman (1985).Source: BINP Bangladesh Integrated Nutrition Pro-gram; TINP Tamil Nadu Integrated Nutrition Program.

ate low birthweight) by ensuring adequate monthly growth (weight gain) until the age of24 months and after that to see those children (until they are five years old) only when theyare sick, to be sure that they receive timely and appropriate attention.
All children under two in the community are eligible, and their parents are encouragedto participate in the monthly growth promotion session, which includes weighing and coun-seling on their growth performance.2 Adequacy of growth is determined by comparingactual weight with the expected weight based on the previous month’s weight, using regionalnorms for weight gain.3 The adequacy of the child’s growth is a trigger for a dialogue withthe caregiver. From the dialogue, the monitora gains insights into the child’s health, nutri-tion, and care during the past month that might affect his or her growth. The monitora thentailors her advice to the mother of the specific child with the aid of a set of counseling cards,differentiated by child’s age, adequacy or inadequacy of weight gain, illness status, andbreastfeeding status. Each card has pictorial cues for the mother. Using dialogue and thepictures, the monitora determines precisely what the mother is doing (or not doing) now andnegotiates with the mother to determine what one practice she might be willing to alter in the
184 World Bank Working Paper
Figure 6.4. Conceptual Results and Operational Framework for Community-BasedGrowth Promotion Programs
health Res
ult
s fr
amew
ork
O
per
atio
nal
fra
mew
ork
Municipal or local government Health sector support
Trains, supervises and provides material support
for volunteers
Volunteers inform community about
progress (participation, child
growth).
Monitors program progress (participation,
immunization coverage, children
failing to grow)
Frequent contact and early
detection of problems
Provides health services in the community (for example, immunization, micronutrient supplements)
Community takes collective action to address problems affecting child growth.
Volunteers weigh children to detect faltering, counsel mothers,
treat or refer (or both) sick children, and make home visits
and support health system. programs.
Community identifies and supports a team of volunteers and encourages all families to have under 2s weighed each month and all sick under 5s taken to volunteers for care.
Mobilizes community
Caregiver adoption of health-promoting
practices and timely care seeking
Improved nutritional status and reduced mortality
Improved child
growth and
Community-Based Growth Promotion
Community adopts CBGP
Health center nurse or NGO
Source: Manoff Group (2004).
2. See Annex 6.1 for a schematic of monthly weighing.3. The minimum expected weight gain table was made using two studies by Martell and others (1981)
at Uruguay’s Latin American Perinatology Center (Centro Latino-Americano de Perinatologia [CLAP]),which looked at the growth of 112 children of 0–23 months of age.

next month to improve the situation. There may be several areas for improvement suggestedby the counseling card, but the monitora selects only the one (or two) that the mother is will-ing to follow in the ensuing month. The improved practice could be as simple as nursing fromboth breasts at each feeding or giving half of a tortilla to the child at two meals during eachday. The next month, the mother gets feedback (in the form of the child’s weight gain) thatshows whether the behavior change made a difference. If the mother was not able to com-ply with the agreed changes, then the monitora tries to find out why and what can be doneto further assist the mother. When a child is seriously ill or has persistent or acute growthfailure, the monitora refers the caregiver to the health clinic (on occasion accompanyingthe mother) and, when the nurse has seen the child, a counter-referral slip is sent back tothe monitora to tell her what follow-up is needed at the community level.
The nurse auxiliary from the health post nearby often attends the monthly growth pro-motion session, where she updates immunizations; distributes micronutrient supple-ments; provides medicines to children with pneumonia, fever, or worms; arranges forclinic appointments; and discusses family planning with new mothers.
Other important AIN-C activities flow from the monthly growth session. The first ofthese is the home visit, prioritized for those children with problems or who do not attendthe weighing session. The home visit is a time for more dialogue to reinforce messages andmore direct observation. Home visits are usually done for between one-third and one-halfof children under two each month. These visits provide more frequent contact with thefamily, reinforce messages, prevent difficult situations from getting worse, and help buildconfidence in the mother and the family that they can properly care for their child.
The second critical follow-up activity is reporting of the child growth information tothe community (see Box 6.2). Community meetings are held every quarter to permit the
Health System Innovations in Central America 185
Box 6.2. A Monitora Seeks Support from a Men’s Group
It was the end of the month, and Gladys was completing her report for Laura, the health center nurse,about the status of her community’s young children in the AIN-C program. It was easy to see on the bar graph that almost all the children had been weighed that month, but she had to seek out morechildren at home for weighing than usual. She was annoyed by this, but what alarmed her was thatmore children were failing to gain weight adequately this month. The previous month had also hada number of children with poor growth, and this month she had 6 children out of 18 children undertwo years of age who had failed to gain adequate weight for two consecutive months. Gladys kneweach case and felt there was more each family could do if motivated. She colored in the bar chart withthe nurse, and they discussed it with the mothers of the young children during the nurse’s visit. Gladysfelt that the point of the importance of each child being seen and the alarm that should be felt whena child fails to grow for two months had not been understood by the community. About a week afterthe meeting with the mothers, a group of men was repairing a small footbridge over a storm drainageditch not far from her house. As Gladys watched them work, she realized that many of the men werethe fathers of AIN-C children. During a rest period, she showed her graph of the children’s growth tothe men and explained it to them. The men took a lot of interest in what she said—they wanted toknow about their children and what they could do. Many topics were covered, including the use offamily money to purchase liquor and venting cooking fire smoke from the house. The men obviouslydiscussed what they learned with their wives, because Gladys was able to report nearly perfect par-ticipation and improvement in the number of children gaining adequate weight the next month. Themothers also told her that they appreciated her calling the men’s attention to childcare.
Source: Laura Molina, Region II AIN-C supervisor, personal communication, 2003.
community at-large to make decisions and work collectively for the betterment of the com-munity’s children. Collective community action is key because many problems causingpoor child growth go beyond the power or authority of a family to correct. Contaminatedwater sources, garbage disposal, childcare, and poor health center outreach are all situa-tions that families working together can help resolve.
Another important action taken by the AIN-C program is the detection, assessment,and treatment of common childhood illnesses, especially diarrhea and pneumonia, in chil-dren under five. These cases come to the monitora’s attention either during counseling orby spontaneous demand. The monitora either treats the disease or, for severe cases, sherefers the mother immediately to the health center. Once the monitoras have mastered thecore AIN-C program for under twos, focused primarily on home-based preventive actions,they are trained in the illness and newborn modules, which focus more on identifying dan-ger signs, expedited referral, and some community-initiated treatment. Then, to diagnosepneumonia, the monitoras are given timers (to help them make the diagnosis by countingthe number of breaths per minute) and an antibiotic to treat it.
Just as the monthly session is the core activity, the determination of adequate weightgain is the pivotal indicator around which the information system is structured. The mon-itora maintains a register of all under twos that is constantly updated with births or newarrivals in the community. Each month, each child’s weight is recorded with a note onwhether or not it was an adequate increase from the previous month. The adequacy of theweight gain is also recorded on the child’s health record for the mother. At the end of themonth, the monitoras compile the individual growth information from all of the childrenand display it in bar graphs that use five simple indicators: number of children under twoin the community, number weighed that month, number gaining adequate weight, num-ber with inadequate weight gain, and number gaining inadequate weight for two or moremonths (see Figure 6.5). These five indicators are used for targeting home visits (persistentgrowth failure and illness get the most attention), to target and focus supervision, for com-munity mobilization, and for health system reporting. These same five indicators are beingimported into the management information system and used from the top to the bottomof the health system. AIN-C’s system is visual and requires no advanced math skills (such aslong division or ability to calculate percentages). The bars make the achievement of the goalclear: monitoras want the first three bars to be of equal height, or if not, the fourth bar shouldbe as low as possible, and the fifth bar should be at zero or the column should be empty.
Communication related to improved health and nutrition practices at the communityand household levels goes hand in hand with the determination of adequate growth. Afterall, measuring growth will not have a positive impact on health outcomes if nothing is donewhen growth faltering is detected. Again, AIN-C has tried to make a relatively complex task(providing tailored advice) as straightforward as possible. The counseling card set describedpreviously in this chapter is the source of the program’s health and nutrition technical con-tent. These cards for counseling enable the monitora to tailor general advice to specific sit-uations. In addition, using the audience research done for the development of the cards,other communication materials have been produced for other purposes and for the media.Small flipcharts are available for use by nurses in the health centers, a radio program pop-ularizing key behaviors is broadcast to AIN-C and non-AIN-C communities, and thesesame generic concepts are disseminated in churches, women’s groups, and literacy classesunder the national program, Programa de Comunicación en Salud Infantil (COMSAIN).
186 World Bank Working Paper
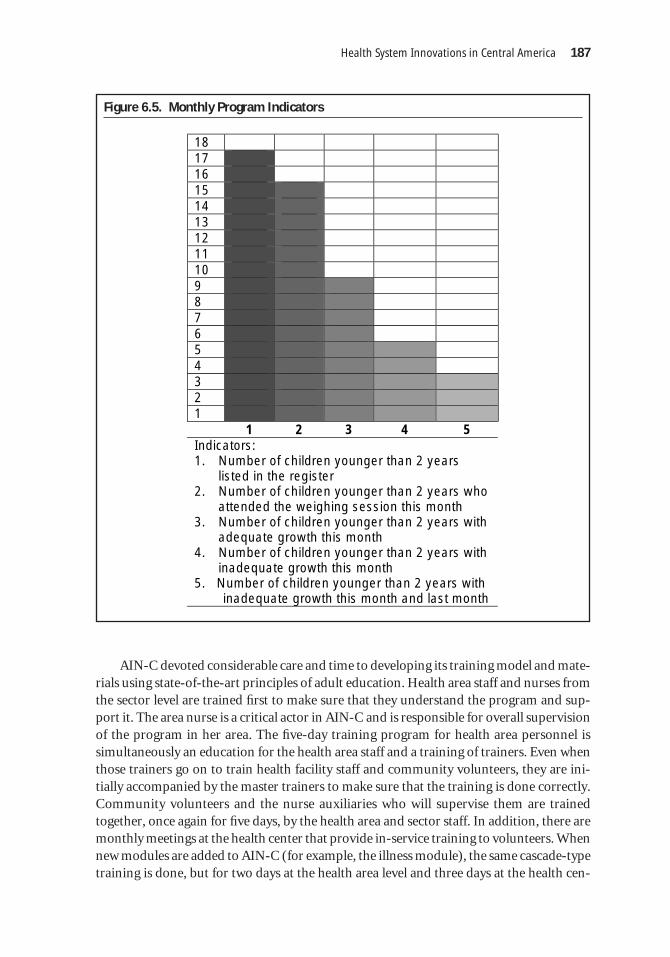
AIN-C devoted considerable care and time to developing its training model and mate-rials using state-of-the-art principles of adult education. Health area staff and nurses fromthe sector level are trained first to make sure that they understand the program and sup-port it. The area nurse is a critical actor in AIN-C and is responsible for overall supervisionof the program in her area. The five-day training program for health area personnel issimultaneously an education for the health area staff and a training of trainers. Even whenthose trainers go on to train health facility staff and community volunteers, they are ini-tially accompanied by the master trainers to make sure that the training is done correctly.Community volunteers and the nurse auxiliaries who will supervise them are trainedtogether, once again for five days, by the health area and sector staff. In addition, there aremonthly meetings at the health center that provide in-service training to volunteers. Whennew modules are added to AIN-C (for example, the illness module), the same cascade-typetraining is done, but for two days at the health area level and three days at the health cen-
Health System Innovations in Central America 187
Figure 6.5. Monthly Program Indicators
18 17 16 15 14 13 12 11 10 9 8 7 6 5 4 3 2 1 1 2 3 4 5 Indicators: 1. Number of children younger than 2 years
listed in the register 2. Number of children younger than 2 years who
attended the weighing session this month 3. Number of children younger than 2 years with
adequate growth this month 4. Number of children younger than 2 years with
inadequate growth this month 5. Number of children younger than 2 years with
inadequate growth this month and last month

ter and community levels. Training constitutes 54 percent of the first year’s costs (Fiedler2003, table 10). This falls to 41 percent in the second year.
Supervision by the health system personnel is designed to be supportive, regular, andmethodical. Although the weakest part of the program, supervision is stronger than usual inhealth systems but is an ever-increasing challenge as the program expands to cover all com-munities and adds new modules, such as the illness management module. The health systemin Honduras is divided into health areas at the highest level, health sectors below them, andhealth centers (CESARs and CESAMOs) below health areas. In each health area, there areabout 300 communities across five health sectors, each of which includes about six healthcenters covering and average of 10 communities each. (Each year, a health center’s staff intro-duces AIN-C in two communities. On average, about six years are needed for complete cov-erage of all communities in a health center’s catchment area.) Initially, when the program isintroduced to a community or a health facility, the supervision is more intense than it is later,when volunteers and auxiliaries have mastered the basic program skills. The supervision loadis 52.5 person-days per year at the health area level, 78.0 days per year at the health sectorlevel, and 30.0 days per year at the health center level (Fiedler 2003). A full 39 percent of costsare for supervision in the first year for the first cohort of communities (usually two) in ahealth area and 33 percent for subsequent cohorts (Fiedler 2003, table 10). In subsequentyears, supervision costs rise proportionally (because training costs diminish) and become vir-tually the entire program cost by the sixth year (Fiedler 2003, Table 12). This relatively highproportional cost for supervision is due to the very low cost of service delivery. The high costmakes it clear that Honduras understands that community-based programs need frequentand skilled supervision.
188 World Bank Working Paper
Box 6.3. Municipalization and AIN-C
As Honduras’s government systems decentralize, municipalities are taking on more responsibility andauthority in health policy and health services provision. Municipalities must now make decisionsabout how to respond to community health needs. The information generated from the AIN-C pro-gram on child growth is extremely helpful. They can see from comparisons of the bar graphs acrossthe months (see Figure 6.6) when situations such as a poor harvest, disruption of work, or pneumo-nia season cause children to fail to grow. The municipal response in terms of mobilizing health careor instituting new policies can be more timely.
An example of this comes from a municipality in the western mountainous region of Honduras.Two young children died over a two-month period, each of pneumonia. When municipal healthofficials looked into the deaths of these children, they realized that although the children werefrom communities with the AIN-C program, the children had not been taken to the monitora fortreatment of their illness. Instead, parents waited and then transported their children severalhours to the health service, where it was too late to help the very young children.
With these two examples, municipal and health center authorities are meeting with AIN-C com-munities and monitoras to discuss the mothers’ seeking care from the monitora at the first sign ofa problem and the subsequent referral to the health center. To reinforce the first referral to themonitora, this municipality is testing a new policy: health center personnel will see sick childrenonly if they have been seen first by their community’s monitora. To avoid problems, a lot of com-munity education about this new policy is taking place. A large sign is posted at the health center,and parents of sick children are gently reminded of this policy at the health center.
Source: Victoria de Alvarado, Basics II country representative, personal communication, 2003.

For the first six months of program implementation, either the health center nurse orthe health sector nurse attends each community weighing session. All volunteers workingin the catchment area for each center meet at the health center monthly, for the life of theprogram, to discuss problems and get new supplies. This is a form of supervision and train-ing at the same time.
What are Other Design Features?
The design of the program does not tell the full story about AIN-C and why it is an unusualprogram. There are several particular characteristics of the program that differentiate itfrom programs that might appear to be similar, and this makes it an obvious choice forextending the principles of health reform to the community.
Evidence-based decisionmaking. Perhaps the most important attribute of AIN-C is thatit provides a mechanism for identifying community needs directly linked to improvinghealth status. The objective indicator, adequacy of child growth, offers the community a
Health System Innovations in Central America 189
Figure 6.6. Five-Bar Graph Presented to the Community to Stimulate Discussion ofChanges in Child Growth over Time
April May June July
25 25
25 25
24 24
24 24
23 23
23 23
22 22
22 22
21 21
21 21
20 20
20 20
19 19
19 19
18 18
18 18
17 17
17 17
16 16
16 16
15 15
15 15
14 14
14 14
13 13
13 13
12 12
12 12
11 11
11 11
10 10
10 10
9 9 9 9 8 8 8 8 7 7 7 7 6 6 6 6 5 5 5 5 4 4 4 4 3 3 3 3 2 2 2 2 1 1 1 1
1 2 3 4 5 1 2 3 4 5 1 2 3 4 5 1 2 3 4 5 Indicator Indicator Indicator Indicator
Indicators: 1. Number of children younger than 2 years listed in the register 2. Number of children younger than 2 years who attended the weighing session this month 3. Number of children younger than 2 years with adequate growth this month 4. Number of children younger than 2 years with inadequate growth this month 5. Number of children younger than 2 years with inadequate growth this month and last month

structured means to analyze its problems (growth of young children is a good proxy formany social, economic, and biological problems in the community), measure progress,and present their situation, ideas, or improvement needs to outside entities (for example,municipalities, NGOs, donors).
Data on child growth status are sensitive over fairly short time periods to changes inthe community and are sensitive to a wide range of stresses even beyond health problems.Thus the use of child growth as an organizing principle for the community opens the doorto discussing and tackling a number of social problems, including lack of adequate childcare, HIV/AIDS, poor water and sanitation, alcoholism, domestic abuse, illiteracy and edu-cational failure, agricultural productivity, intrahousehold allocation of resources, genderrelations, and more. AIN-C is structured in such a way as to uncover local needs and makethem, and local ideas for their resolution, accessible to all.
Equity. AIN-C is targeted to all children under two in the community, and their identi-fication and enrollment is an important indicator of program performance. Including allchildren sends a clear message of concern that everyone’s children should be growing ade-quately, not just the poor children, the malnourished, or those at highest risk. There is nostigma attached to being a participant. At the same time, so far, AIN-C has been geographi-cally targeted to the worst-off areas and the worst-off communities within those areas. Thecommunities selected for first entry into the program are those with the poorest access tohealth care or in the worst socioeconomic status quintiles in the health center’s catchmentarea. This targeting helps a health system bring greater equity to health services provision.
Empowerment. AIN-C starts with the assumption that the family has the responsibil-ity and the right to keep its children healthy and well fed. The program provides guidanceon small changes in behavior that require minor changes in allocation of resources withinthe household (perhaps 300 calories all together or a half-hour of time). AIN-C’s design-ers felt that this was the best place to start: give the family the opportunity and confidenceto nurture children within its own resource base. The research done on feeding of youngchildren in Honduras indicated that only a small minority of families (8 percent) could notdo more to improve their children’s food intake (Maradiaga, Griffiths, and Nunez 1997). Incases where a household tries and still comes up short, the community is asked to take on someof the responsibility. Finally, if the community’s resources are inadequate, external sources(such as food aid programs, cash transfer programs, and welfare programs) can be sought.
This attitude toward family self-sufficiency is different from the common practice thatassumes from the beginning that the family cannot adequately provide for its children andimmediately offers food, coupons, or cash to families with malnourished children. Some-times these donations reward failure—the classic case is that of a food supplementationprogram that gives food only to children who are already malnourished. Some programsprovide cash-equivalent coupons to clients with the condition that they use a defined pack-age of health services. These transfers devalue both the contingent services and the family.If the reason for nonuse of services was poor quality (long waiting times, inconvenienthours, lack of medical staff or drugs) or inaccessible services, then the transfers may exac-erbate the problem by creating overcrowded clinics and demand for unwanted or sub-standard services by an uninformed consumer. Where the transfer is a substitute foreffective communications with families about behavior change, once the cash or in-kind
190 World Bank Working Paper

incentive is removed, the demand for services disappears. For the family, receiving cash orin-kind incentives becomes the goal rather than improving health and the family membersdo not become informed consumers.
Ownership. It is often said that sustained program success requires local ownership,and this has been shown in Honduras (Bossert and others 1988). AIN-C is a locally ownedprogram because it was conceptualized and developed within the Secretariat of Health byHondurans. From the beginning, the program had local champions who repeatedly artic-ulated the program’s key concepts and reason for being. Although external assistance hasplayed a role, it was a group of Honduran health professionals who guided the program’scourse. An important step in solidifying the program as part of the Honduran health land-scape was its adoption as national health policy in 2000.
Not only are the policy makers the “owners,” but the design and running of the pro-gram has been done in such a way as to make every community the owner of its activitiesand of progress made in its children’s growth. AIN-C guidance does not give precise speci-fications for how community workers are to perform their jobs. Instead, the program estab-lishes goals or outcomes that must be reached. How a community or group of workerschooses to reach the goals is up to them. For example, all children under two years shouldbe seen by a monitora each month. Whether the monitoras accomplish this by, for example,house-to-house visits, neighborhood meetings, or community-wide meetings is up to them.In AIN-C, communities decide if they want to have the program in their community, howmany and who will be a monitoras, how they will reach every child under two every month,how they will create a community environment that favors adequate child growth, and howthey will interact with the government’s health infrastructure.
Focus on tasks. The job description of the monitora is the basis for determining allother program actions because these actions function to support the community effort.Each item in the job description and community plan relates to the core objective of theprogram: promoting healthy growth of children. The job description is captured in prac-tical detail in the monitora’s manual.
In a similar fashion, the trainers’ and supervisors’ jobs are built upon the foundation ofthe monitoras’ work. Their manuals and tools build on the monitoras’ manuals and tools.The monitoras are trained and supervised by the local nurse from the health center using themonitoras’ manual as the guide. The area nurse trains and supervises the center nurses, andher work is, once again, a further refinement of the work of those she supervises. Hence thereis a seamless connection between community-based work and the formal health system.
Teamwork with specialization. A key practice implemented by AIN-C is the use of ateam of volunteers at the community level rather than relying on just one person. Havinga team means that each member contributes different strengths. One may be good atweighing and charting while another is good at counseling. In addition, a team minimizesthe effect of turnover and enables all members to help each other learn and rememberlessons from the training. Working as a team means that the work is not too burdensomefor any individual. Thus Honduras is able to rely on volunteers who spend about fourhours per week on AIN-C tasks, in addition to periodic tasks for the Secretariat of Health(mobilizing the community for immunization days and various campaigns).
Health System Innovations in Central America 191

Teamwork extends to the Secretariat of Health’s view of how AIN-C is implemented.From the beginning, the secretariat has welcomed and encouraged NGO collaboration inthe implementation of AIN-C. In fact, in 2000, when AIN-C was decreed the national childhealth program, the secretariat notified NGOs working in the field of child health that thebasic package they must implement is AIN-C—they can add to AIN-C but not ignore it.This insistence and support from the secretariat has meant that to date at least 800 morecommunities have AIN because of NGO collaboration.
The only drawback to NGOs’ expanding program coverage is that when an NGO pullsout of an area, the secretariat must provide supervision to many more communities thanthey have programmed resources for. One NGO, realizing this dilemma, limited the num-ber of communities they covered and put their additional resources into supportive super-vision, additional training, and monitoring for all AIN-C communities in the area. Theidea was that when they left the area, they would leave behind a strengthened permanentsystem that could be maintained by secretariat resources. The NGO’s activities includedtwo regional trainer supervisors, the purchase of a computer and help from a data analystto make a computer program to compile the five AIN-C indicators for the entire region.
Systematic support for volunteers. There are debates among professionals in the devel-opment field about reliance on volunteer workers. On the positive side, obviously volun-teer workers cost less than paid workers, and they often have greater motivation (beyondjust a paycheck) to do well. On the negative side, volunteers are said to have limited tenures,volunteerism is thought to be exploitative, and often volunteers tend to be from the higher-status or higher-income groups in a community. Neither of these sides is always right.
Honduras has a history of community spirit and volunteerism, but this alone is notenough to sustain a program over decades. AIN-C has designed its program with the vol-unteer in mind. In particular, the job of the monitora is manageable for a volunteer. AIN-Cmonitoras work, on average, 14.9 hours per month, of which 4.5 hours are at the monthlygrowth promotion session, which is a reasonable workload for a volunteer (Fiedler 2003).AIN-C also provides systematic incentives to its volunteers, and these incentives have bothintrinsic value and market value. What Honduras has learned is that the incentives needto be regularly provided and planned for—just like all other operational aspects of the pro-gram. Examples of the incentives are a letter from the Secretary of Health thanking the fam-
192 World Bank Working Paper
Box 6.4. Periurban Communities Request Assistance on Saturdays
The first indicator of AIN-C implementation is coverage. The expectation is that at least 90 percentof the children under two will be seen each month by the monitora and that no child will missmore than two sessions a year. When AIN-C monitoring data were shared with periurban com-munities, the low participation figures were an immediate cause of concern. Salaried workingmothers found it difficult to bring their children to sessions during the week. They said they couldattend sessions only on Saturday after working hours. The monitoras indicated that they couldchange the sessions to Saturday, but health center staff had been reluctant to work on Saturdays.However, when community leaders met with the health center, an arrangement was worked outfor the auxiliary nurse to be available on Saturdays to attend AIN-C growth promotion sessions.Participation is now about 80 percent each month in periurban communities.
Source: Tesla Gutierrez, AIN-C Region III supervisor, personal communication, 2000.

ily of the monitora for their generosity, an identification card with a photo of the monitora,and regular parties in honor of Mother’s Day or Children’s Day holidays. Training andmonthly meetings at the health center are also used as incentives for volunteers.
Volunteers in Honduras have done community health work for decades. Many of themonitoras are the people who volunteered years ago for sanitation or diarrhea control work,or they are traditional midwives. The number of monitoras has remained the same over time,but the individuals doing the job have changed. Because there is a team of monitoras, newpeople learn the job from their predecessors, and the health center nurse refreshes forgottenconcepts (Griffiths 2004). The fact that over a five-year period, six to eight people might haveworked in their community’s AIN-C program, instead of just three, strengthens communitycommitment, knowledge, and ownership of the process and program.
Monitoring and program development. As noted above, the information system is simple,practical, and useful for a number of different purposes: community mobilization, targetingsupervision, health system reporting, and decisionmaking by the monitoras. If participationrates are low, then the community leaders may need to mobilize support among families inthe community. If participation is high but too many children have chronic growth faltering,then the supervisor may need to make some visits to homes and observe the monitoras’ coun-seling. If there is a widespread problem, then the community may need to take action to secureexternal support. In addition to the five basic indicators, AIN-C also monitors immunizationrates, disease and referral rates, and distribution of micronutrient supplements. These help theauxiliary nurse to better target her own work. The community baseline and regular updatesand the quarterly meetings help the community monitor its own progress in improving thewell-being of its most vulnerable members and, by extension, its own development.
Conclusions
Health reform must extend to all communities and engage their participation to trulyachieve national health goals and the MDGs. Few models exist for garnering the activeparticipation of the community in improving the impact, efficiency, and quality of healthcare services.
The AIN-C program offers one such model. It has benefited from careful refinementover a decade and the incorporation of best practices from reviews of other community-based programs. Growth promotion entails tailored attention to each child and frequentinteraction between the community agent and the family. The World Bank (2003) sayssuch interactions are particularly hard to monitor, yet AIN-C’s five-indicator informationsystem does just that. Built on the concept that a healthy child is a growing child, AIN-Cuses the adequacy of monthly growth of children under two as the indicator of child, fam-ily, and community health. In addition, the evidence about growth is used as a tool to cat-alyze community analysis and commitment to solutions to the problems affecting allyoung children in the community. The program promotes equity by including all childrenunder two and by targeting preferentially to the lowest socioeconomic groups in commu-nities. It is intimately tied in to facility-based services through the critical role of health per-sonnel in training and supervision and through referral and counter referral. Its cost isquite low, and its impact is broad and deep.
Health System Innovations in Central America 193

194 World Bank Working Paper
Annex 6.1. Activity Flow for the Introduction and Operation of AIN-C in a District
Train district health team and facilitators.
Train health subdistrict and health center teams.
Agreement with community to run the program and select the group of
volunteers. Carry out community baseline.
Train volunteers from communities under one or
more health centers.
Monthly growth promotion session 4.Nurse immunizes
children, advises mothers on family planning, and sees sick children and those with acute weight loss.
3. Caregiver counseled on adequate or inadequate growth and illness status.
2. Compares weight to expected weight; informs the mother of weight and adequacy of gain.
1. Weighs child.
Volunteers complete monthly report on weight
gain. Five bars for HC.
Meet monthly at health center to
review report, check supplies, and get
in-service education.
Home visit to sick children or those with inadequate
weight gain.
Health center nurse and volunteers hold quarterly
meetings with the community to discuss
growth of all under twos and develop projects.

Bibliography
Asociación Hondureña de Planificación de Familia. 2001. “Honduras Encuesta Nacional deEpidemiología y Salud Familiar (ENESF-2001), Encuesta Nacional de Salud Masculina(ENSM-2001), Informe Resumido.” Secretaría de Salud, Asociación Hondureña dePlantificación de Familia, y USAID, Tegucigalpa.
Basic Support for Institutionalizing Child Survival Project (BASICS). 2001. “ReducingSevere and Moderate Malnutrition in Children.” In F. Marc LaForce, ed., BASICS II.A Better Future for Children: Progress toward World Summit Goals for Health and Nutri-tion. Series of briefing papers prepared for the U.N. Special Session on Children.Arlington, Va.: BASICS II.
Bossert, T., L. Godiksen, T. D. Bunce, M. Favin, C. Dabbs, and J. Massey. 1988. “The Sus-tainability of US-Supported Health, Population, and Nutrition Programs in Honduras:1942–1986.” USAID Evaluation Special Study 58. U.S. Agency for International Devel-opment, Washington, D.C.
Dickin, K., M. Griffiths, and E. Piwoz. 1997. “Designing by Dialogue: Consultative Researchto Improve Young Child Feeding: Support for Analysis and Research in Africa.” TheManoff Group and Academy for Educational Development for the Health and HumanResources Analysis (HHRAA) Project, Washington, D.C.
Fiedler, J. 2003. “A Cost Analysis of the Honduras Community-Based, Integrated Child CareProgram (Atención Integral a la Niñez–Comunitaria, AIN-C).” Health, Nutrition, andPopulation (HNP) Discussion Paper. World Bank, Washington, D.C.
Fiedler, J., and J. Suazo. 2002. “Ministry of Health. User Fees, Equity and Decentralization:Lessons from Honduras.” Health Policy and Planning 17(4):362–77.
Gillespie, S., J. Mason, and R. Martorell. 1996. “How Nutrition Improves.” ACC/SCNState-of-the-Art Series Nutrition Policy Discussion Paper 15. U.N. AdministrativeCoordinating Committee Subcommittee on Nutrition, Geneva.
Griffiths, M. 2004. “¿Implementación: el vinculo entre teoria y los resultados?” PowerPointpresentation at the Taller Nacional de Expansión de AIN, Secretariat of Health/BASICSII, Tegucigalpa, June 29–30.
Griffiths, M., and V. de Alvarado. 1999. “Honduras. The AIN Community Experience.”Paper presented at the BASICS Results Meeting, USAID, Washington, D.C., June.
Griffiths, M., K. Dickin, and M. Favin. 1996. “Promoting the Growth of Children: WhatWorks.” World Bank Nutrition Toolkit, Tool 4. World Bank, Washington, D.C.
Haddad, L., H. Alderman, S. Appleton, L. Song, and Y. Yones. 2002. “Reducing Child Under-nutrition: How Far Does Income Growth Take Us?” FCND Discussion Paper 137. Inter-national Food Policy Research Institute, Washington, D.C.
Ho., T. J. 1985. “Economic Issues in Assessing Nutrition Projects: Costs, Affordability, andCost-Effectiveness.” Population, Health, and Nutrition Technical Note 85-14. WorldBank, Washington, D.C.
Kennedy, E., and H. Alderman. 1985. Comparative Analyses of Nutritional Effectiveness ofSelective Interventions. Washington, D.C.: International Food Policy Research Institute.
Manoff Group. 2004. “Results and Operational Framework for Community-Based GrowthPromotion.” Washington, D.C.
Maradiaga, A., M. Griffiths, and I. Y. Nunez. 1997. Prácticas mejoradas de alimentación.Tegucigalpa: Secretariat of Health and BASICS.
Health System Innovations in Central America 195

Martell, M., L. A. Bertolini, F. Nieto, S. M. Tenzer, R. Ruggia, and R. Belitzky. 1981. Crec-imiento y desarrollo en los dos primeros años de vida postnatal. Washington, D.C.: Orga-nización Panamericana de Salud.
Martorell, R. 1990. “Importance of Childhood Retardation for Adult Body Size.” Statementprepared for the Expert Meeting on Economic Consequences of Health Programs inLDCs, Committee on Population, National Academy of Sciences, Washington, D.C.,June 20.
Martorell, R., L. K. Khan, and D. G. Schroeder. 1994. “Reversibility of Stunting: Epidemi-ological Findings in Children from Developing Countries.” European Journal of Clin-ical Nutrition 48(Suppl)(1):545–57.
Mason, J., J. Hunt, D. Parker, and U. Jonsson. 2001. “Improving Child Nutrition in Asia.”ADB Nutrition and Development Series 3. Manila: Asian Development Bank.
Pelletier, D. L. 1994. “The Relationship between Child Anthropometry and Mortality inDeveloping Countries: Implications for Policy, Programs and Future Research.” Jour-nal of Nutrition 124(10S):2047S–81S.
Plowman, Beth, Janet Irene Picado, Marcia Griffiths, Karen Van Roekel, and Victoria Vivasde Alvarado. 2004. “BASICS II. Evaluation of the AIN Program in Honduras, 2002.Draft Survey Report.” BASICS II for USAID, Arlington, VA.
Secretaria del Estado en el Despacho de Salud. N.D. “Plan de gobierno para el sector desalud 2002–2006.” Tegucigalpa.
———. 2003. “El proceso de reforma del sector salud en Honduras.” Tegucigalpa.United Nations Children’s Fund (UNICEF). 1992. Food, Health and Care: The UNICEF
Vision and Strategy for a World Free from Hunger and Malnutrition. New York.Van Roekel, K., B. Plowman, M. Griffiths, V. de Alvarado, J. Matute, and M. Calderon.
2002. “BASICS II. Midterm Evaluation of the AIN Program in Honduras, 2002.”BASICS II, Arlington, VA.
Van Roekel, K., B. Plowman, and M. Griffiths. 2004. “Evaluación final del programa deAIN en Honduras. BASICS II.” Paper presented at the Taller Nacional de Expansiónde AIN, Secretariat of Health/BASICS II, Tegucigalpa, June 29–30.
Villalobos, C., J. McGuire, and M. Rosenmöller. 2002. “Honduras. AIN-C Integrated ChildCare: Improving Health and Nutrition at the Community Level.” In M. Rosenmöllerand the World Bank, eds., Challenges of Health Reform. Barcelona: Estudios y EdicionesIESE, S.L.
Walker, I. 2003. “A Health Reform Strategy for Honduras.” World Bank, Washington, D.C.Processed.
World Bank. 1997. “Honduras—Improving Access, Efficiency, and Quality of Care in theHealth Sector.” Report 17008-HO. World Bank, Washington, D.C.
———. 2001a. “Honduras Poverty Diagnostic 2000.” Report 20531-HO. World Bank,Washington, D.C.
———. 2001b. “Honduras—Public Expenditure Management for Poverty Reduction andFiscal Sustainability.” Report 22070. World Bank, Washington, D.C.
———. 2002. World Development Indicators. Washington, D.C.———. 2003. World Development Report 2004: Making Services Work for Poor People.
Washington, D.C.
196 World Bank Working Paper

CHAPTER 7
197
Innovations in ImprovingEfficiency and Impact in Health
Care Services—Lessons fromCentral America
Maureen Lewis
Overview
Ensuring the sound performance and desired impact of health care delivery systems posesa challenge to all governments. In much of the developing world, including most of LatinAmerica, the integrated public financing and service provision model prevails with line-item budgets, public employees, public infrastructure, and bureaucratic strictures. Thehealth reforms of recent years in Latin America have attempted to address a number of theincentive problems underlying public health care delivery in both the financing and deliv-ery of health care with mixed results. The sweeping reforms in Brazil, Chile, and Colom-bia, for example, entailed ambitious, broad-gauged changes. However, their breadth andcomprehensiveness, combined with a neglect of baseline data collection, made impactshard to trace and lessons learned inconclusive.
Much of the challenge in health reform involves shifting incentives to improve produc-tivity, quality, and performance. But how to accomplish those goals remains elusive in allhealth care systems, and those in Latin America are no exception. The experiences heredemonstrate that modest reforms can have impressive effects on performance and consumersatisfaction, providing building blocks for further reforms.
The foregoing chapters addressed major issues within the context of Central America,where governments have launched experiments to contract out health service delivery tonongovernmental organizations (NGOs) and devised incentives to boost productivity,strengthen the scope of public health services, often in underserved areas, and improve usersatisfaction. These experiments have taken on the sensitive issue of private sector deliveryof health care. Although this is a reality throughout Latin America, the interaction and com-plementarities between the public and private sectors in health have often been contentious

and unexploited. Harnessing private entities to deliver health care to low-income popula-tions therefore has been controversial. Failures and rigidities inherent in the public healthsystems led governments in Central America to experiment with radical shifts in the struc-ture and functioning of health and nutrition services and reach out to NGOs and otherprivate groups in the process.
This has meant not only hiring private contractors, but implicitly having them com-pete with the public system and, in some cases, allowing private contracted personnel toprovide such services as management or fiduciary functions to the ministry of health orsocial security system. This has also meant that for the first time, public providers facedirect competition, and a number of the experiments included here specifically collectedinformation that allows comparisons in productivity, costs, and performance. Typicallylacking in benchmarks, public performance has historically been assessed only in terms oftrends or claims of providers and consumers. Costs and impacts remain virtually unknownbecause of lack of data.
The country experiences discussed in this volume raise thorny issues for governmentssaddled with inefficient public delivery systems, but they also offer alternatives to the tra-ditional health care delivery model—and with sufficient variety to suggest that variousoptions can and do work. Improvements can be achieved even in difficult and far from per-fect environments. These conclusions alone offer encouragement to health system reformand to changes that can improve performance on a smaller scale.
Finally, the experiments demonstrate the importance of incentives in raising perfor-mance and productivity, and the benefits to policy makers and program managers of bet-ter and more complete data. Without such innovations, health care delivery would remaina “black box” absorbing resources and producing a largely undefined set of outputs. Thedata and the experiments here offer new information and new ways of doing business.
Alternative Approaches In Health Care Delivery
Accountability in public services remains uneven in much of Central America. Indeed, recentefforts to decentralize were a hoped-for panacea for the overly centralized and rigid bureau-cracies that encountered many difficulties in ensuring that health care delivery worked andservices reached the intended populations. Public failures have helped to limit the benefits ofdecentralization and undermine meaningful reforms in health care (Kaufman and Nelson2004). The efforts analyzed here represent a way to address accountability through partialreforms based on experimentation, and do so with sufficient information that performancecan be assessed.
As a result, the experiments reflect significant departures from traditional govern-ment provision of health care. They focus on developing incentives for improved perfor-mance and efficiency in health care delivery, taking the existing public systems as thestarting point. Contracting out is the most obvious initiative, but others—such as pay-ment arrangements, collecting and using costing information, and incorporating userperspectives and satisfaction—are equally innovative. The institutional and political issueshave also been addressed in some of the country cases, notably in Nicaragua and, espe-cially, Guatemala, where the institutional process is laid out as a companion to the analy-sis of the experiments.
198 World Bank Working Paper

Contracting out encompasses many different kinds of public purchasing (Loevinsohnand Harding 2004). These range from hiring contracted services for specific, nonclinicaltasks, such as catering, laundry, and cleaning services (see Mills 1998), to the wholesale hir-ing of a company that takes responsibility for all aspects of health care delivery for a definedpopulation and an agreed sum. In both cases, government remains responsible for ensur-ing that services are delivered. Yet, in the first case, their role remains managing the deliv-ery of services; in the latter case, it requires the selection and management of contractors,a very different task requiring varied sets of skills. Both, however, require that public bod-ies remain engaged in ensuring compliance and acceptable performance.
Having government ensure the performance of private contractors offers an alternativeto simply transferring responsibility to lower levels of government. Some of the effortsdetailed in this volume, such as the Honduran growth-monitoring experiment, successfullyintegrated local communities with national programs without simply divesting to lower lev-els of government. In Guatemala and Nicaragua, the end of long conflict periods providedthe opportunity to try and reach underserved populations with a more flexible tool that didnot require long-term public investment. In Guatemala, that meant the poor and isolated;in Nicaragua, it meant middle-income earners under the Nicaraguan Social Security Insti-tute (Instituto Nicaragüense de Seguridad Social [INSS]) whose coverage had eroded underthe Sandinista government. The notion of increasing flexibility and providing incentives forperformance in underserved areas proved popular in both countries and resulted in not onlymore outreach but also a rise in suppliers willing to partner with the government.
NGOs and other forms of private delivery have long been active in health care deliveryin developing countries, and they have been particularly prominent in Central America overthe past few decades as the countries descended into civil conflict and guerrilla warfare.Recent evidence from Uganda has suggested that NGOs provide higher-quality service atlower cost than government systems, in part as a result of altruistic motives, but the greaterflexibility allows efficiency and quality to prevail (Dehn, Reinikka, and Svensson 2003).Guatemala, El Salvador, and Nicaragua relied on private groups to deliver care, particularlyin rural areas, during conflict periods, and their integration in the postconflict period was anatural extension, but certainly nothing to count on. Tensions between NGOs and publicprovision often arise when implicit competition emerges, but when government becomesthe payer, tensions subside. The Guatemala and Nicaragua examples provide details on therelationship and interaction.
The experiences in Latin America—Brazil with its network of private hospitals thatdeliver the bulk of inpatient care (World Bank 1994), Chile with its reliance on managedcare companies to provide care to the upper-income groups (Sapelli 2004), Colombia’scontracting with private providers (Ramirez 2004)—all point to the emerging realizationthat private delivery has benefits for public programs. The Central American experiencesdescribed here simply extend those initiatives to lower-income settings with populationsthat are often harder to reach.
Summary of Experiments and Salient Characteristics
The five country experiences in Central America represent a broad set of options and, insome cases, ground-breaking designs. Table 7.1 provides a summary of the characteristics
Health System Innovations in Central America 199

200 World Bank Working Paper
Table 7.1. Summary of Contracting Characteristics
Country and experiment Delivery arrangements Financing arrangements
Costa Rica:Compares traditionalsocial security provision(CCSS) and contractedNGO providers forintegrated PHC servicesusing a cross-sectionanalysis and multivariateanalysis of time seriesfor type III and IV clinics.
Guatemala:Comparison of threecontracting models ofthe Ministry of Health(MSPAS) to deliverservices to the ruralpoor—by (1) directly viaPPS; (2) indirectly throughadministrative support tothe MSPAS (ASMSS); and,(3) traditional MSPASservices.
Nicaragua:Compares INSSProvisional Health Model(MSP) that contracts out
managed care to EMPsin remote areas and the
traditional MINSAapproach.
Honduras:Compares communitiesparticipating in AIN-Cgrowth promotionactivities with controlcommunities.
• NGOs rent clinics from theCCSS for US$1 per year and acooperative provides maintenance. Purchaseinputs from CCSS at cost +15%. Own hiring and management.
• CCSS: Traditional publichealth care delivery withrigid hiring and management.
• PSS (direct NGO healthservice providers) contracted to reach remoteareas through communityoutreach centers andmonthly community visits.Hired all staff and managers.
• ADMSS mixed system: private financial administrators for theMSPAS. Hired most staff, and the MSPAS supervises.
• MSPAS traditional modelwith volunteer physiciansand midwives.
• MSP: Integrated care withdefined benefits and specificexclusions. Preapprovalneeded for costly tests andprocedures; subcontractswith MINSA for upgradedhospital care.
• MINSA: Traditional PHCdelivery with rigid hiring andmanagement.
• AIN-C promotes communitygrowth-monitoring programs.
• Delivery is through Secretariat of Health facilities or community volunteers (monitoras).
• NGOs’ per capita paymentthrough a managementagreement.
• CCSS historical budgets.• Performance guarantee bond
guaranteeing that at least85% of performance targetsare met. Public providers risk2.5% of budget for low per-formance.
• Direct PSS: capitation payments and in-kind vaccines.
• Mixed ADMSS: capitated payment for services.
• MSPAS: budgetary allocationand in-kind vaccines.
• Monthly capitated paymentper enrolled worker, withsome coverage for spouseand children.
• EMP selected.• INSS reinsurance financed
through 5% of capitated payment.
• Supervisory INSS physiciansmonitor.
• Government nurses providegrowth monitoring at facilities.
• Volunteers are trained andsupervised by Secretariat ofHealth nurses.
(continued )

of each, focusing on the nature of delivery and financing arrangements. Unlike experi-ments that are national in scope, where almost everything changes, these programs con-tain rich documentation and measurement, permitting the assessment of the experimentsand their components.
Despite the focus on contracting, the country experiments encompass multiple ele-ments of health reform, including incentives for raising productivity, splitting providers andpurchasers of care, hospital autonomy, collaborating with NGOs, using financing levers toration health care, and working with communities to promote preventive health care. In theprocess, all the country experiences have incorporated key reform elements.
For the most part, they evaluate natural experiments that are then compared with exist-ing or alternative approaches. Panama’s San Miguelito Hospital (Hospital Integrado SanMiguel de Arcángel [HISMA]) tests a radical approach. CONSALUD, a public purchasingcooperative (pooled purchasing) for the Ministry of Health and the Social Security Insti-tute, buys a comprehensive set of hospital services from HISMA to serve the insured anduninsured residents of the San Miguelito section of Panama City. The HISMA Board thenpurchases the medical, administrative, hotel, and other services needed to deliver health careto the catchment area population, all with virtually no intrusion by the government. This isunique in Latin America. A prospective payment system with predetermined prices for hos-pital use, physician visits, and surgery replaces line-item budgeting. Costa Rica, departingfrom an all-public focus that has characterized its successful health system, allows the“rental” of its public facilities by private groups with autonomy in management and provi-sion. Guatemala and Nicaragua have hired private firms and NGOs to serve hard-to-reachpopulations. The Honduran community growth-monitoring program compares progress
Health System Innovations in Central America 201
Table 7.1. Summary of Contracting Characteristics (Continued )
Country and experiment Delivery arrangements Financing arrangements
Panama:Compares the SanMiguelito Hospitalexperiment of anintermediary purchaser,CONSALUD, with twotraditional otherhospitals.
ADMSS health services administrator (administradora de servicios de salud); AIN-C Atención Integral a laNiñez en la Comunidad (Integrated Community Child Health Program); CCSS Caja Costarricense de SeguroSocial; EMPs empresas médicas previsionales (previsional medical firms); INSS Instituto Nicaragüense deSeguridad Social (Nicaraguan Social Security Institute); MINSA Ministerio de Salud (Ministry of Health);MSP Modelo de Salud Previsional (Previsional Health Model); MSPAS Ministerio de Salud Pública y Asisten-cia Social; PHC primary health care; PSS proveedora de servicios de salud (health services provider).
• San Miguelito Hospital: CONSALUD purchases management, medical, and other services. Controls own catchment area and hasautonomy in hiring, management, and contracting.
• Other hospitals: Traditionalpublic heath care deliverywith rigid hiring and management practices.
• San Miguelito Hospital:prospective payment systemwith annual production ceilings on inpatient andoutpatient department care.Overproduction reimbursedat a lower rate.
• Payment of San MiguelitoHospital contractors basedon external medical andother service audits of contracted providers andmonthly user surveys.
• Other hospitals: line-itembudget.
in target communities with control communities to demonstrate the power of communityvolunteers who have received training and public supervision.
A number of noteworthy elements emerge from these experiences:
� the willingness to allow autonomy to a private entity in the delivery of health carewhen public funds are involved, a major step for public health systems;
� collection of baseline or comparison data, including on costs and productivity;� willingness of governments to compare traditional and new delivery and financing
arrangements, risking the possibility that the current approach is flawed;� oversight and regulation of contractors, though with significant challenges;� concern for consumer satisfaction and involvement.
Table 7.2 summarizes the performance measures applied in each country, and the associ-ated findings on cost and efficiency, performance and user satisfaction.
Evaluation often confronts awkward political issues. If public programs don’t work, willthere be personal costs to public servants? The experiments suggest that the five govern-ments’ health and social security leaders were willing to take the risk of bad news—and thenews, although encouraging for policy, suggests that current public arrangements fall shortof potential. Contractor performance was consistently better regardless of the measures orindicators used. Preventive services—notably immunizations, oral rehydration therapy andprenatal care—improved under contractor arrangements in Costa Rica, Guatemala andNicaragua. Similar aspects were achieved in Honduras with a community based develop-ment model. Mixed public-private arrangements such as those in Guatemala also improvedon traditional public health services. Efficiency gains, as reflected in lower average lengths ofstay (ALOS), were consistently found in the four countries with contracted hospital services,and higher productivity was recorded in each. Indeed, in Nicaragua, productivity was threetimes greater in the private facilities when compared to traditional public performance.
Costs of both public and private delivery need to be assessed together with perfor-mance and outcomes. In Costa Rica, costs were lower, but supervision also ensured thatreferrals, drugs, and laboratory tests were used with discretion, resulting in a drop in vol-ume. Guatemala and Panama posted higher management costs at the provider level, whereproductivity also rose. Higher costs were incurred for productivity enhancement and forreaching marginalized target groups, as was the case in Guatemala. The measures intro-duced to contain the costs and volume of care proved effective: providers remained withinbudget and demonstrated savings in service delivery.
A major risk confronting public contractors is complacency or lack of authority on thepart of the government. Contracts require clauses for government recourse in the event ofnoncompliance, and more than simply cutting off funding is needed. If funds are terminated,services will follow suit, leaving an unserved population. Intermediate steps and sanctions,as well as effective (dis)incentives to promote sound performance, are needed. The experi-ments here have incorporated flexibility and sets of “carrots and sticks” to encourage highperformance. Costa Rica issued a guarantee bond to ensure that contractors met targets, andplaced a similar if more modest tax on public performance; Nicaragua provided a virtual rein-surance fund in a 5 percent set-aside for high costs and utilization review requirements; andPanama reduced reimbursement levels for services that exceeded defined output targets todiscourage overproduction. These tools apply sophisticated incentive concepts meant to
202 World Bank Working Paper

Country andmethods Performance measures Efficiency and costs Overall performance User satisfaction
Costa Rica:Cross-sectionalcomparisonsand time seriesmultivariateanalysis.
Guatemala:Comparison of 3models; cross-sectional datacomparators andlogisticregression.
Health System
Innovations in Central America
203
Table 7.2. Selective Evaluation Findings
• CCSS applied 23 coreindicators
• Analysis used 7 key indi-cators: coverage rates forvarious target groups orservices (for example,rate of Pap smears forwomen over age 35)
• General and infant mor-tality rates
Volume of service indica-tors for clinics
• Comparison of costs andproductivity of servicesby type of provider
• Incidence of selected ill-nesses and prevention
• Consumer use of specificservices and their satis-faction, by type ofprovider
• Contractors provided morevisits with general practi-tioners, but fewer labora-tory services, drugs, andspecialist referrals, reducingaverage costs; 30% lessspending overall.
• Regressions show consis-tently higher performance(higher quality and lowercost) of contractors.
• PSS: Highest production andlabor productivity, andhighest costs (travel, train-ing, bonuses to attract staffto remote areas).
• MSPAS: Lowest costs andproductivity:
Per capita cost Average costPSS Q 5.70 Q 40,000ADMSS Q 8.50 Q 30,000HPs Q 7.60 Q 24,000• Indirect overhead costs are
20% for central MSPAS ver-sus 7% for PPS. Direct over-heads: PPS 3%, MSPAS 0%.
• Mortality the same for bothgroups.
• Comparative performance ofthe CCSS and contractors:higher contractor perfor-mance in 5 of 7 indicators,and difference with 2 of 7.
• The PSS showed better perfor-mance indicators, immuniza-tion and prenatal coverage,and outcomes compared totraditional providers.
• ADMSS showed better prena-tal care coverage, tetanus andtyphoid immunization, andmicronutrient distribution.
• Management of childhooddiarrhea was best in ADMSSand more similar in the PSSand MSPAS.
• Waiting time: 68% said therewas a short wait for care atNGOs; 55% noted a short wait at the CCSS.
• Women prefer ADMSS and thePSS to HPs; shifted to mixed-service providers.
• MSPAS services rated lowest. Lowutilization where there was nophysician on staff.
• Frequent consumer shifts fromMSPAS to ADMSS or the PSS.
(continued )

Honduras:Comparisonbetweenparticipatingcommunities andControl group ofcommunities.
• Program has continued to grow,attracting new participants.
204W
orld Bank Working Paper
Table 7.2. Selective Evaluation Findings (Continued )
Country andmethods Performance measures Efficiency and costs Overall performance User satisfaction
• Coverage of immuniza-tion, prenatal care use,and growth monitoring,by type of provider
• 5 indicators related tocaretakers’ exposure orparticipation and use ofkey health services
• 5 indicators of caretak-ers’ health-promotingpractices
• Costs are entirely for super-vision because services arerun by volunteers. First-yearcosts are 39% for supervi-sion and 54% for training ofvolunteers and auxiliarypersonnel.
• AIN-C annual recurrent costsare US$2.73 per child underage 5.
• Knowledge and participationincreased threefold; amongthe control group. Across 10categories, change was negli-gible except in the case ofknowing about CBGP.
• Iron supplements for chil-dren rose from 2% to 47%;no change in control group.
• Oral rehydration therapyand feeding improved by50%; little or no change incontrol group.

Health System
Innovations in Central America
205
Nicaragua:Comparison ofcontractor andMINSAperformance inservice delivery.
Panama:Comparison ofnew hospital and2 other hospitals.
• Comparison of MSP andINSS financial perfor-mance; growth in cover-age, revenues, andexpenditures; volume ofservices provided, bytype of services
• 23 consumer satisfactionindicators
• 7 output indicators,including discharges,number of visits, andsurgeries
• 9 efficiency indicators,including ALOS and bedoccupancy rates
• 10 unit cost measures forinpatient and outpatientservices
• 8 quality indicators cover-ing accreditation, deathrates and caesarean births
• Productivity in EMPs was 3 times higher than inMINSA in the outpatient andemergency departments.
• Almost 50% more efficiencyin inpatient care.
• The MSP’s ALOS is half thatof MINSA’s.
• Costs declined by 39% over15 years.
• San Miguelito Hospitalshowed overall greater effi-ciency.
• ALOS is shorter.• Most productive for emer-
gency services and surgery;second on discharges.
• Lower unit costs for all butmaternity.
• Higher management costs.
• EMPs’ penalties haveincluded 25 minor infrac-tions, 31 verbal reprimands,22 fines, 10 suspended, and7 terminated.
• External drug purchases bypatients: 16% in EMPs and40% in MINSA.
• MSP market share rose from17% in 1993 to 33% in 1998
• Summary accreditationcompliance score for SanMiguelito Hospital morethan 50% higher than forother hospitals. (Some com-parisons were difficult tomake because of lack ofdata from other hospitals.)
• Increasing patient satisfactionwith EMPs, no MINSA data.
• Mean waiting time: 55 minutes atan EMP, 78 minutes at MINSA.
• Based on random sample ofpatients, much higher satisfac-tion with San Miguelito Hospital.
ALOS average length of stay; Q quetzal(es) (Guatemalan currency).

ration care and control costs, but they have been adapted to simpler environments, and theywork. The evolution of regulation is clearly laid out for Guatemala, and the ability of low-income governments to adopt a viable regulatory arrangement, however imperfect, showsthat it not only can be done, but can produce measurable improvements among providers.
Oversight and regulation of contractors posed a serious challenge to the five countries.Instead of being charged with delivery and management of public servants and public inputs,ministries of health were required to redefine their roles and functions. Although in somecountries controlling corruption initially took center stage, it was rapidly replaced with morecomplex regulatory functions. The Guatemalan experience outlined in this volume suggeststhat the process was fitful and iterative, with constant adjustments responding to newrequirements. Although often frustrating and time-consuming, this is not an unexpected pat-tern for the Central American ministries of health, given the newness of contracting out.
Consumers tend to be overlooked in program design for health care reform. All of thecountry programs discussed in this volume have incorporated serious efforts to elicit feed-back. These range from waiting times in Costa Rica and Nicaragua, to expressed prefer-ences in Nicaragua and Panama, to tracking enrollment patterns and changes in Guatemalaand Honduras. They have relied on interviews, enrollment numbers, household surveys,and user surveys, bringing to bear a solid arsenal of data and information. Based on per-ceived quality and convenience, consumers favored the private alternatives in all cases and,in many cases, “voted with their feet,” shifting their health care utilization to new providers.
Conclusions and Policy Implications
The Central American innovations provide a rich set of lessons for the countries themselves,as well as for other developing countries contemplating reforms. Expanding services, evento remote areas, can be achieved and often improved with private contractors. It requirespolitical will and the authority to oversee and enforce rules. The startup and learning processmay seem like time lost in the short run, but as the Guatemala example shows, it is criticalto long-term feasibility. Learning by doing characterized most of the innovations, partlybecause of their newness, limited experience, and lack of a blueprint for governments.
Documentation of successful program implementation is possible only because of thedata collection efforts and the introduction of performance objectives, both key to soundevaluation and policy impact. Effectively managing the process of reform requires the gov-ernment to continue to monitor and document trends and impacts, and to adjust theincentives and the rules over time in response to changes in circumstances. For example,capitation payments must keep up with inflation, or contractors will depart as costsoutstrip revenue, as occurred in Nicaragua and Guatemala. Contractors also need to becompensated for new or different activities and the inclusion of costly groups. Otherwise,the system is jeopardized.
Some of the shortcomings of the studies have to do with the structure of the evalua-tions, the nature of new initiatives, and sustainability. The lack of randomized allocation ofenrollees in contracted programs leads to self-selection of dissatisfied users of public healthclinics biasing the returns to the alternative investment. New facilities also tend to attractusers for no other reason than the quality of the new surroundings, thus growth in numberof clients and satisfaction may be inflated. Similarly, the lack of baseline data in all but the
206 World Bank Working Paper
Honduran case compromises the measured impacts. All substitute comparisons with exist-ing public alternatives, which is a second-best option. Availability of time series data greatlyenhances the amassed evidence, and the multivariate analyses complement the qualitativeand cross-sectional information. Ideally, all studies should be able to control for both selec-tion bias and the multitude of factors that affect health care production and consumption.
Each of the innovations represents a relatively small niche in a largely public healthdelivery system, and there is no evidence of intentions to expand beyond the initial partic-ipating communities. Consolidation of experiments remains an essential part of the process,but the lack of plans to expand successful approaches raises some concerns regarding truereform of lackluster public performance. Nicaragua’s program has shown the greatestexpansion, but it covers only 8 percent of the population.
All of the experiments have been ongoing for at least five years, but sustainabilityremains a concern. The San Miguelito Hospital’s dramatic successes could well fall prey topolitical dissatisfaction from other actors in the public health system. The lack of plans toextend the model raises concerns about political survival. The volunteer driven monitoraprogram in Honduras could suffer from “monitora fatigue,” where volunteers tire of theeffort, government interest wanes, communities decide that child growth-monitoring con-cerns should be replaced by other issues, or some combination of these. Is it realistic toexpect communities to constantly devote their meetings to the same set of issues aroundchild growth? If bigger issues with a broader constituency or of a more immediate nature(for example, a natural disaster) come along, the child growth issue could easily be replaced.All successful start-up enterprises require nurturing to ensure their survival, as well as polit-ical support. Political pressures either to loosen the oversight or to abandon the innovationare often strong, which makes the persistence of the innovations in Central America all themore impressive.
Although they are not perfect, the programs offer a rich array of possibilities for test-ing alternatives to publicly financed and delivered services. They demonstrate that com-plicated sets of incentives can be adapted to less sophisticated environments with felicitous,if not ideal, results. Most important, these studies indicate how important data and evalu-ation are to health policy. Without them, policy makers are grappling in the dark. Luckily,Central America has a body of work that can guide and inform policy in health care reformon both delivery and financing.
Bibliography
Dehn, J., R. Reinikka, and J. Svensson. 2003. “Survey Tools for Assessing Performance inService Delivery.” In F. Bourguignon and L. Pereira da Silva L., eds., The Impact of Eco-nomic Policies on Poverty and Income Distribution: Evaluation Techniques and Tools.Washington, D.C., and New York: World Bank and Oxford University Press.
Kaufman, R. and J. Nelson. 2004. Crucial Needs, Weak Incentives: Social Sector Reform,Democratization, and Globalization in Latin America. Washington, D.C.: WoodrowWilson Center Press and The Johns Hopkins University Press.
Loevinsohn, B., and A. Harding. 2004. “Contracting for the Delivery of Community HealthServices: A Review of Global Experience.” Health, Nutrition and Population Discus-sion Paper. World Bank, Washington, D.C.
Health System Innovations in Central America 207

Londoño, Juan Luis, and Julio J. Frenke. 1997. “Structured Pluralism: Towards an Innov-ative Model for Health System Reform in Latin America.” Health Policy 41(1):1–36.
Mills, A. 1998. “To Contract or Not to Contract? Issues for Low and Middle Income coun-tries.” Health Policy and Planning 13(1):32–40.
Ramirez, P. 2004. “A Sweeping Health Reform: The Quest for Unification, Coverage, andEfficiency in Colombia.” In R. Kaufman and J. Nelson, eds., Crucial Needs, WeakIncentives: Social Sector Reform, Democratization, and Globalization in Latin America.Washington, D.C.: Woodrow Wilson Center Press and The Johns Hopkins UniversityPress.
Sapelli, C. 2004. “Risk Segmentation and Equity in the Chilean Mandatory Health Insur-ance System.” In W. Jack and M. Lewis, guest eds., Special Issue on “Adjusting forMarket Failure: Challenges in Public Health Alternatives.” Social Science and Medicine58(2):259–65.
World Bank. 1994. The Organization, Delivery and Financing of Health Care in Brazil:Agenda for the 90s. World Bank Report 12655-BR. Washington, D.C.: World Bank.
208 World Bank Working Paper

209
Contributors
R icardo A. Bitrán is a health economist with 24 years of experience in Chile, the UnitedStates, and more than 35 developing countries. He received a Ph.D. in economicsand an M.B.A in finance from Boston University, and an M.S. in industrial engi-
neering from the University of Chile. His areas of expertise include the prioritization of healthspending; the economic evaluation of health investment and reform projects; the analysis ofequity, efficiency, and financial sustainability; and the formulation and evaluation of healthpolicy. Since 1995, he has been President of Bitrán & Asociados, a leading international con-sulting firm based in Santiago, Chile, that specializes in health finance and economics. Previ-ously, he worked for 10 years with Abt Associates Inc. of Cambridge, Massachusetts, first as ahealth economist and then as senior scientist. While at Abt, he was research director for theHealth Financing and Sustainability Project. Before joining Abt, Dr. Bitrán was a financial ana-lyst at the Massachusetts Department of Public Health. For the past 20 years, he has been aconsultant for the World Bank, the Inter-American Development Bank, the World HealthOrganization, and the governments of two dozen developing countries. His academic experi-ence also spans more than 20 years, with teaching posts or assignments in Chile, the UnitedStates, France, China, Democratic Republic of Congo, and a dozen other developing coun-tries. Since 2000, Dr. Bitrán has been academic director of the World Bank Institute’s FlagshipProgram on Health Sector Reform and Sustainable Financing for Latin America and theCaribbean. He is the author of academic articles, book chapters, and research papers.
Rodrigo Briceño is a health economist with Sanigest International, a health care consult-ing firm. Mr. Briceño’s current research interests include the analysis of macroeconomicsapplied to the health sector, the performance of the health sector in Central American coun-tries, and the study of the new kinds of organizations for the provision of health services. He

has worked on projects related to the health reform process in Latin America and EasternEurope, and he has undertaken several economic evaluations of projects about HIV/AIDS andtuberculosis, family health projects, and the education sector in Costa Rica. One of his latestworks is development of a framework for the economic analysis of hand-washing projects,based on the experiences of Central America and Peru. Mr. Briceño is also a professor of sta-tistics and macroeconomics in the National University of Costa Rica. He received his M.Sc. indevelopment economics from the National University of Costa Rica in 2002.
James Cercone is an economist and president of Sanigest Internacional, a health caremanagement and consulting company. After graduating from the University of Michiganwith a degree in mathematical economics, Mr. Cercone developed his interests in health eco-nomics and health reform through engagements with the World Bank (from 1990 to 1994)and the government of Costa Rica (from 1994 to 1997). Mr. Cercone has more than 14 years’experience in the health sector, with particular emphasis in Latin America and transitioncountries. He has worked in more than 40 countries, writing and developing solutions forthe impact of corruption in the health sector, hospital restructuring, purchasing strategies,provider payment mechanisms, performance improvement, economic analysis of healthprojects, monitoring and evaluation, development of HIV/AIDS strategies, and managementof health care services. Mr. Cercone has worked extensively on the design, implementation,and evaluation of projects for the World Bank, Inter-American Development Bank, Inter-national Labour Organisation and other development organizations.
Carmen Cerezo is a Guatemalan physician who has worked extensively in developinghealth care models for underserved rural populations in her native country. She graduatedas a Physician in 1984, from the national university San Carlos de Guatemala and went onto specialize as a Pediatrician, performing rotations both in Guatemala as well as in theUnited States. After practicing clinical medicine for some time, Dr. Cerezo shifted her pro-fessional interest to public health endeavors, co-founding in 1988 a non profit organiza-tion, GUATESALUD. This organization provides basic health care to farm and migrantworkers living and working in large plantations in the south coast and northwestern partof the country. She was the Medical Director of GUATESALUD for eight years. Between1997 and 2002 she worked for the Ministry of Health on the outreach, SIAS program. Uponleaving the Ministry of Health, Dr. Cerezo worked as an independent consultant up to year2004 when she joined the HIV-AIDS, Global Fund Initiative for Guatemala as the Coor-dinator of the Planning and Programming Unit.
Isabella Danel is a senior public health specialist detailed to the World Bank by theU.S. Centers for Disease Control and Prevention (CDC). She received an M.D. fromAlbany Medical College and an M.Sc in community health in developing countries fromthe London School of Hygiene and Tropical Medicine (LSHTM). She has worked at theCDC as an epidemiologist and public health specialist since 1993, focusing initially onmaternal, child, and reproductive health. She has collaborated extensively with the PanAmerican Health Organization and other development agencies on monitoring and eval-uation issues. At the World Bank, she provides technical assistance to the Latin Americaand the Caribbean Regional Office on maternal and child health, noncommunicable dis-eases, and essential public health functions, with a focus on public health surveillance. She
210 World Bank Working Paper

is currently working on projects in Argentina and Brazil. Formerly she was a research assis-tant at the LSHTM, working primarily in Central America. She has published a number ofarticles on health in the United States and internationally.
John L. (Jack) Fiedler, senior health economist, has worked in the Latin America andthe Caribbean Region of the World Bank since 2003. He earned a Ph.D. from VanderbiltUniversity, where he specialized in health and development economics and minored inLatin American studies. Before working at the World Bank, he was an international healthconsultant for 20 years in more than 30 countries. His work has covered a variety of topics,including demand and cost studies, cost-effectiveness analysis, designing and evaluatingnutrition programs, assessing user fee systems, conducting longitudinal assessments of theperformance of ministries of health, analyzing the private health care market and the pri-vate insurance industry, and designing insurance and privatization schemes. He has pub-lished more than 35 articles and a book on a variety of topics in health economics.
Virun Gauri is an economist in the Development Research Group (public services team).Mr. Gauri’s current research interests include the uses and impact of social and economicrights, the political economy of government responses to HIV/AIDS, and the governance ofnongovernmental organizations in developing countries. He has worked on and led a varietyof operational tasks in the World Bank and the International Finance Corporation, includingoperational evaluations, investments in privately owned hospitals in Latin America, a socialsector adjustment loan to Brazil, several health care projects in Brazil, and a study of the decen-tralization of health care in Nigeria. Mr. Gauri has previously taught courses in health policy,bioethics, and education policy in the United States and Chile. He received his Ph.D. in pub-lic policy from Princeton University in 1996.
Paulina Gómez is a medical doctor who received her degree from the Catholic Univer-sity of Chile and holds a master’s degree in public health from the University of Chile. She spe-cializes in public health and health economics and has more than 15 years of experience inChile and elsewhere in Latin America. She is currently chief medical officer for Integramédica,Chile’s largest private health provider network. Previously she was the director of San Borja-Arriarán Public Hospital. Her recent policy research work has dealt with financial equity, eval-uation of health care networks, costing and pricing of health care services, design of a socialsecurity health reform project, and training of policy makers in health policy for the WorldBank Institute. She also designed the price schedule for Chile’s public insurer.
Marcia Griffiths is president of The Manoff Group, a company specializing in publichealth programs and social marketing. Ms Griffiths received a BA degree in anthropologyand an M.Sc degree in nutritional sciences from the University of Wisconsin. For more than25 years, she has provided technical assistance to a variety of programs in Latin America,Africa, the Middle East, and Asia. A special focus of her work is maternal and child health,particularly in developing systems to help communities participate in health and nutritionservice delivery and in helping families and individuals improve health-promoting prac-tices. For the past decade, Ms. Griffiths has been dedicated to working with governmentsand nongovernmental organizations to develop growth promotion programs such as Hon-duras’s AIN-C (Atención Integral a la Niñez en la Comunidad [Integrated Community
Health System Innovations in Central America 211

Child Health Program). Currently there are 11 countries in which such schemes are ongo-ing. Ms Griffiths is the author of numerous publications, including the World Bank’s “Pro-moting The Growth of Children: What Works” and the World Health Organization’s IMCINutrition Food Box Adaptation Guide.
Gerard M. La Forgia is a lead health specialist at the World Bank. He received a B.S. degreefrom Northwestern University and an Sc.D. from School of Public Health at the University ofPittsburgh. He currently works and resides in Brazil, where he oversees the World Bank’shealth lending and research operations there. Before moving to Brazil, he spent 10 years con-ducting policy research and leading lending operations in Central America. He formerly wasa health specialist at the Inter-American Development Bank and a Research Associate at theUrban Institute. He has published a number of articles and prepared many technical reportsand monographs on health systems issues in Latin America. At present he is involved in pro-jects and research to improve primary care and hospital performance in Brazil.
Maureen Lewis is a senior fellow at the Center for Global Development; she earnedher Ph.D. at Johns Hopkins University. Dr. Lewis was formerly chief economist of theHuman Development Network of the World Bank, and before that, she managed a unit inthe Bank dedicated to economic policy and human development research and programsin Eastern Europe and Central Asia. Before joining the World Bank, Dr. Lewis establishedand directed the International Health and Demographic Policy Unit at the Urban Insti-tute. She has published widely on health and population in development and is currentlyan adjunct professor in the Graduate Program at George Washington University.
Cecilia Má is a medical doctor from the National University of San Marcos in Peru.She holds a master’s degree in public policy from the University of Chile and an M.S. inhealth administration from Peruvian University Cayetano Heredia. She specializes in pub-lic health and public policy and in health project evaluation, with work experience in morethan a dozen countries in Latin America and the Caribbean. She is currently an adviser tothe Inter-American Development Bank in Panama and in El Salvador, and to the govern-ments of both countries, to assist with the design and implementation of their healthreform projects. Her professional experience in Peru involved the design and implemen-tation of national public health policies, the development of strategic planning to increasehuman capital resources in the health area, and the realization of innovative strategies forhealth education. For five years she was a manager at the Child Health Institute and theCayetano Heredia General Hospital in Lima. She also has two years of experience as a con-sultant for health facilities and health care networks in Peru.
Judith S. McGuire is currently an independent consultant based outside Washington,D.C. She has worked extensively on nutrition programs in Latin America, Sub-SaharanAfrica, North Africa, and Asia. In 2001, she retired as senior nutritionist from the WorldBank, where she had worked for 12 years. Before joining the World Bank, Dr. McGuire wasa resident fellow at Resources for the Future. She received a B.A. in biology from Welles-ley College and a Ph.D. in nutritional biochemistry and metabolism from the Massachu-setts Institute of Technology. In 2005, she received an M.S. in social and organizational
212 World Bank Working Paper

learning from the School of Public Policy at George Mason University. She was awardedthe International Affairs Fellowship from the Council on Foreign Relations in 1985.
Patricia H. Mintz is an independent consultant who has worked on health care issueswith a variety of public and nongovernmental organizations over the past 25 years in LatinAmerica and the United States. She currently serves as project director and consultant tothe California Health Care Foundation’s Local Coverage Expansion Initiative, workingwith local governments to increase coverage to low-income, uninsured children and tolow-wage workers. Before her current consulting work, she served as a consultant to theWorld Bank and the Inter-American Development Bank on issues of insurance reform andextension of health insurance coverage to the poor. She began her health career with KaiserPermanente. Ms. Mintz has a B.A. from Yale University and an M.B.A. from Stanford Uni-versity Graduate School of Business.
Health System Innovations in Central America 213

Eco-AuditEnvironmental Benefits Statement
The World Bank is committed to preserving Endangered Forests and natural resources. Weprint World Bank Working Papers and Country Studies on 100 percent postconsumer recy-cled paper, processed chlorine free. The World Bank has formally agreed to follow the rec-ommended standards for paper usage set by Green Press Initiative—a nonprofit programsupporting publishers in using fiber that is not sourced from Endangered Forests. For moreinformation, visit www.greenpressinitiative.org.
In 2004, the printing of these books on recycled paper saved the following:
Trees*
307*40” in height and6-8” in diameter
Electricity
52,480KWH
Net Greenhouse Gases
28,262Pounds
Water
130,496Gallons
Solid Waste
14,387Pounds

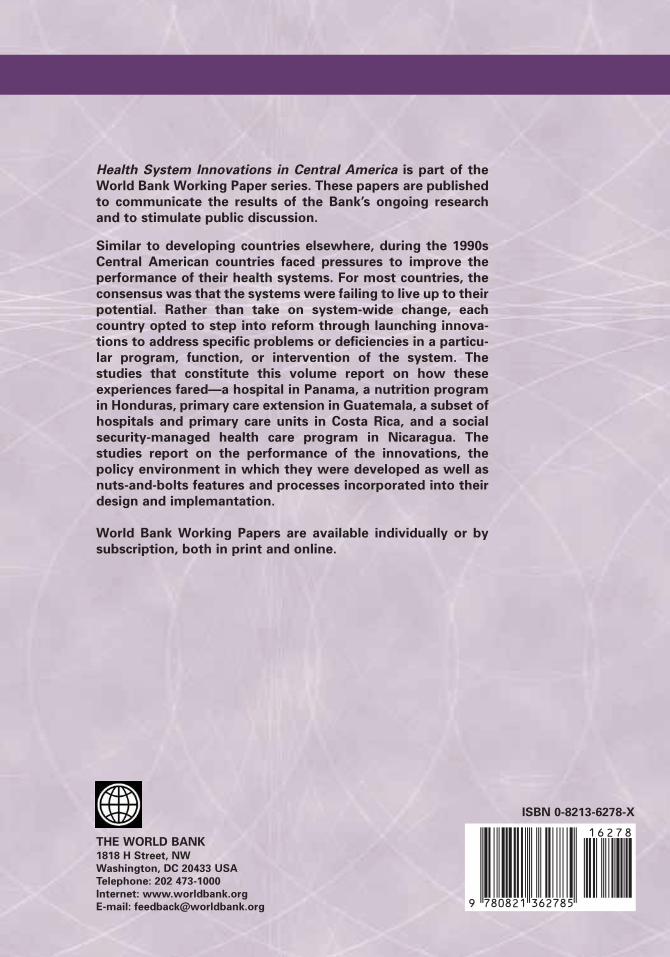
THE WORLD BANK1818 H Street, NW
Washington, DC 20433 USA
Telephone: 202 473-1000
Internet: www.worldbank.org
E-mail: [email protected]
ISBN 0-8213-6278-X
Health System Innovations in Central America is part of the
World Bank Working Paper series. These papers are published
to communicate the results of the Bank’s ongoing research
and to stimulate public discussion.
Similar to developing countries elsewhere, during the 1990s
Central American countries faced pressures to improve the
performance of their health systems. For most countries, the
consensus was that the systems were failing to live up to their
potential. Rather than take on system-wide change, each
country opted to step into reform through launching innova-
tions to address specific problems or deficiencies in a particu-
lar program, function, or intervention of the system. The
studies that constitute this volume report on how these
experiences fared—a hospital in Panama, a nutrition program
in Honduras, primary care extension in Guatemala, a subset of
hospitals and primary care units in Costa Rica, and a social
security-managed health care program in Nicaragua. The
studies report on the performance of the innovations, the
policy environment in which they were developed as well as
nuts-and-bolts features and processes incorporated into their
design and implemantation.
World Bank Working Papers are available individually or by
subscription, both in print and online.
™xHSKIMBy362785zv,:<:#:(:)