Embed Size (px)
Citation preview
HEALTH SUMMIT SUMMARY
Prepared for Yavapai County Community College District
February 3, 2016
1
Introduction:
In 2012 Yavapai College contracted with the SmithGroup/JJR, consultants that
specialize in master planning for higher educational institutions, to assist the
college in developing its master plan to better meet its mission. The
SmithGroup/JJR analyzed the demographics of the college and the communities
that the college serves, as well as conducting both focus groups and surveys with
its internal and external stakeholders, and using their expertise with state and
national trends in higher education master planning to develop concepts of a
master plan. These concepts were vetted through several iterations to arrive at a
final concept. In the late fall of 2013 the SmithGroup/JJR presented their proposal
of a ten year master plan for the college and its programs. In February 2014, the
college and its board adopted the plan and started preparations to implement it.
One of the concepts presented as part of the master plan was a “Health Science
Center,” a facility specifically intended for health care education. As a state of the
art facility it would house the college’s Allied Health, Nursing and other related
programs. This facility would include specialized classrooms and labs including
classrooms for general education courses, faculty and staff offices, conference
rooms and student support areas. This facility would also be utilized by area health
care providers as a place for ongoing continuing education, professional
development and training. It was proposed that by consolidating college health
care programs to one central location where resources could be shared and
efficiencies in expenses realized a net cost savings in program operations could be
realized. The master plan proposed that this new facility be located in Prescott
Valley, based on projected growth of county populations, partnership possibilities
with health care providers, municipalities, and Northern Arizona University.
The projected cost to construct such a facility was $45-50 million, a substantial
amount that the college administration realized was beyond its capacity to fund
through its capital building process. It was recognized that it would be unlikely that
a capital bond would be approved since the country, state and county were still
recovering from the great recession. It was also recognized that health care
professions and their educational preparation and training were dynamic and the
college and communities could benefit from furthering our partnerships with
2
county health care providers. (Appendix: Health Workforce, Healthy Economy: A
Collaborative Project of St. Luke’s Health Initiatives, City of Phoenix, Phoenix Workforce
Connection and the Maricopa County Department of Public Health. Allied Health Needs
Assessment: Maricopa Community College District)
Health Care Summits:
Under the leadership of Yavapai College’s President, Dr. Penny Wills, a meeting was
held in September, 2013, with selected college personnel that were involved in
health care education. This involved the President, Vice President of Instruction
and Student Development, Dean of the Science, Health and Public Safety Division,
Program Directors for Allied Health, Nursing and Radiological Technology. The
meeting agenda was to report on each program, discuss current and future needs
for health care education, and the potential for new partnerships. The group
determined that a Health Care Summit should be conducted so that the College
could be appropriately positioned to meet the future educational needs in health
care for its service area. The intent of a Health Care Summit was to broaden
perspectives relative to current and emerging health care professions, and
determine the educational role Yavapai College would fulfill in meeting those
needs. Additionally, the summit intent was to determine if a new single Health
Care educational facility would adequately meet the demands of a broader more
comprehensive educational plan.
A county wide Health Care Summit was soon organized for January 2014 where CEO’s and other administrators representing many of the major health care providers in the county were invited. Summit participants included the following guests:
John Amos, President and Chief Executive Officer, Yavapai Regional Medical Center (YRMC) Diane Drexler, Chief Nursing Officer, YRMC Brian DeVries, Manager – Human Resources, YRMC Donna Jacobs, Chief Executive Officer Northern Arizona VA Health Care System (NAVAHC) Dr. M. Keith Piatt, M.D., Interim Chief of Staff, NAVAHC David Warner, Supervisory HR Specialist, NAVAHC Dr. James T. Johnson, Quality Program SLM, NAVAHC
3
Jeramy Plumb, Superintendent, Mountain Institute JTED Judy Baum, Chief Executive Officer, Mountain Valley Rehabilitation Hospital Mark Roth, Chief Financial Officer, Mountain Valley Rehabilitation Hospital Yvonne Richard, Public Relations Specialist, Northern Arizona Healthcare Also invited, but not present for this meeting was Barbara Dember, President & Chief Executive Officer, Verde Valley Medical Center
Topics of discussion included:
Identifying trends in health care and comparing them to local needs.
Clarifying future workforce educational needs for local health care providers.
Ascertaining specific health care jobs needed to serve our local communities and the counties outlying rural areas.
Willingness of participants to partner with YC in a new health care educational facility.
At the conclusion of this meeting all participants expressed a desire for continued
involvement with this Health Care Summit, and a future meeting was planned for
later in the year with the inclusion of representatives from Northern Arizona
University. However, due to the impending retirement of Dr. John Hager, President
of NAU, and the subsequent search for a new president, the next summit meeting
was postponed for over a year.
The second and expanded Health Care Summit was held in late March, 2015, in
Prescott Valley. Attendee’s included:
Northern Arizona University: Dr. Rita Cheng, President Sarah Bickel, Executive Vice President and Chief of Staff Dr. Laura Huenneeke, Provost and Vice President for Academic Affairs Dr. Leslie Schulz, Executive Dean, College of Health and Human Services Debera Thomas, Dean of Nursing Fred Hurst, Senior Vice President, Extended Campuses Karen Appleby, Senior Assistant to Provost
Town of Prescott Valley:
4
Harvey Skoog, Mayor Lora Lee Nye, Vice Mayor Larry Tarkowski, Town Manager Richard Anderson, Council member Marty Grossman, Council member Steven Marshall, Council member Marnie Uhl, Director for Prescott Valley Chamber
Yavapai County Professional Leaders:
Mike Paredes, Director for Prescott Valley Economic Development Foundation
Donna Jacobs, Director, Northern Arizona VA Health Care System
John Amos, Chief Executive Officer, Yavapai Regional Medical Center
Mark Timm , Director of Human Resources, Yavapai Regional Medical Center
Judy Baum, Chief Executive Officer, Mountain Valley Rehabilitation Hospital
Yavapai College:
Dr. Penny Wills, President
Dr. Stuart Blacklaw, Provost & Vice President for Instruction & Student Development
Scott Farnsworth, Dean for Sciences & Health
Mary Brown, Director for Nursing Programs Nancy Bowers, Director for Allied Health
Rich LeClair, Director for Radiology Program Tania Sheldahl, Dean for Student Development Deb McCasland, District Governing Board member Steve Irwin, District Governing Board member
This Summit started with opening remarks from both President Wills and President Cheng, with a review of the previous Health Summit meetings. After these comments the discussion included topics of current health care educational programs at NAU and YC, current needs in the local health care workforce, the interest of furthering the current educational partnerships as well as exploring new ones, and the interest and support of local health care providers including the town of Prescott Valley. The results of the discussion are outlined in the following summarization.
5
Explore additional education opportunities.
Build NAU/YC branding and recruitment activities.
Support local Health Care providers in defining future workforce needs
Identify the Health Care and Complementary Workforce needs of Yavapai County and the State of Arizona.
o Considerations cohort size curriculum development to graduation (timeframe) pipeline facilities startup and maintenance cost clinical rotations graduate employment/wages
Align NAU/YC curriculum.
Explore concurrent nursing programs.
Develop alternative health care tracks.
Research YC’s certificates and associate degrees that will apply for NAU’s Bachelor of Science in Health Science.
Explore Yavapai County medical partners’ commitment and ability to invest time and resources.
Establish coordinated advocacy networks.
These action items were further refined into five different initiatives that were explored and reported on during the summer and fall of 2015 (Appendix- Task Force Recommendations)
1. Review appropriate YC certificate and AAS degree programs that may articulate into NAU’s Health Science Bachelor of Science.
2. Assess success rates of the joint ADN/BSN Program with NAU.
3. Address Healthcare Workforce Needs for Northern Arizona (Appendix- Healthcare Workforce Demands Analysis)
4. Confirm workforce needs with Hospital CEOs.
5. Review salaries and promotions in relation to continued education in
healthcare fields.
This Task Force report was distributed to all participants for their information and input. During the late fall of 2015 Yavapai College concluded that a final Health Summit be convened to review what has transpired over the last several years and
6
to summarize what is on the horizon for YC in anticipating and meeting the educational needs for the local health care workforce. This would also allow the other participants an opportunity to express their intent for future endeavors and partnerships. Conclusion: In an effort to better understand the current and future local workforce educational needs for healthcare, Yavapai College has organized several Health Summits. These meetings involved representatives from the town of Prescott Valley, Northern Arizona University, county wide health care providers, and Yavapai College. Discussions allowed participants to share their perspectives and to offer suggestions. A health care work force needs analysis was conducted by YC’s Regional Economic Development Center, which contributed to the information being considered. From these Health Summits the following conclusions are offered:
1. Health care is and will continue to be a strong component of the local economy requiring an educated and skilled workforce.
2. If a new state of the art center for Health Care Workforce education were to be built with partnerships between YC, NAU, area hospitals and municipalities, Prescott Valley appears to be the location of choice, based on current and projected growth of county populations. However, this center will remain in phase III of YC’s Master Plan and will primarily be influenced by and dependent upon these partnerships and workforce demands.
3. From the research conducted and reviewed (see appendices) Yavapai College is adequately meeting the local health care workforce education and training needs for which it is accredited to provide, with the exception of Medical Lab Technician. This is a field that should be considered for possible partnership as a joint program between YC and NAU.
4. Northern Arizona University continues to be a willing partner and is the primary leader in offering baccalaureate and graduate degrees in a variety of health care fields to meet the needs in the county and northern Arizona. YC and NAU are working toward a concurrent ADN/BSN program. YC and NAU

7
will continue to collaborate on joint programs that meet the county’s workforce demands in health care.
5. County health care providers are aware of these existing educational programs and are satisfied that they are meeting their primary workforce needs.
Based on these conclusions there is no need to conduct further Health Summits.
8
Attachments
1. Yavapai College’s Health Summit Task Force Report, 2015 2. Healthcare Workforce Demand Analysis, 2015
Appendix
1. Health Workforce, Healthy Economy: A Collaborative Project of St. Luke’s Health Initiatives, City of Phoenix, Phoenix Workforce Connection and the Maricopa County Department of Public Health
2. Allied Health Needs Assessment: Maricopa Community College District, 2015
9
HEALTH SUMMIT TASK FORCE REPORT
Prepared for Yavapai County Community College District
November 4, 2015

10
4 November 2015
Health Care Summit Task Force Results
Yavapai College has recognized that it plays a vital role in providing higher education and career training
opportunities to the communities of Yavapai County. Healthcare has been and continues to be an in-
demand field within the county, region and state. Earlier this spring Yavapai College and Northern
Arizona University conducted a Healthcare Summit with a variety of business, educational and
community representatives. This summit was to garner input from these constituents about current
and future educational and training needs for healthcare occupations in the county. From that meeting
five areas were identified as requiring further information that would better inform business,
educational and civic decision makers as to current and future workforce needs in healthcare. Attached
is a report of those findings.
From this report it appears that Yavapai College, along with NAU are well positioned in providing the
educational and training opportunities to meet the majority of healthcare needs within the county,
particularly in the projected large growth occupations. Future expansion of current offerings or the
creation of new educational programs in a healthcare field will require further exploration and feasibility
consideration.
Respectfully,
Scott Farnsworth
Interim Vice-President of Instruction and Student Development

11
Health Program Collaboration
YC/NAU
Report on Task Force Recommendations
Introduction:
In March, 2014, the Presidents of Northern Arizona University and Yavapai College, along with various administrators from these institutions, met with CEO’s and HR personnel from county hospitals to discuss the current and emerging health care careers. Also in attendance were representatives from the Town of Prescott Valley. NAU and YC wanted to collaborate on how each could provide the best healthcare educational training for this area. Five different areas of focus were identified for further research and review. Below are the responses for each area.
1. Review appropriate YC certificate and AAS degree programs that may articulate into NAU’s Health Science Bachelor of Science.
The Bachelor of Science degrees offered by NAU were reviewed. Particular attention was given to the online degree programs in Health Sciences, in as much as it allowed place-bound students in Yavapai County the opportunity to complete a BS degree without relocating from their present residences or employment. There are nine different degree options available, with 4 directly related to degree or certificate programs currently being offered at Yavapai College.
NAU Online Health Science Bachelor of Science Degree options;
BS Health Sciences: Allied Health (degree completion program)* BS Health Sciences: Diagnostic Medical Imaging and Therapy (degree completion
program)* BS Health Sciences: Medical Assisting (degree completion program) * BS Health Sciences: Physical Therapy Assisting (degree completion program) BS Health Sciences: Respiratory Care (degree completion program) BIS Speech-Language Sciences and Technology (Interdisciplinary degree) BS Health Sciences: Surgical Technology (degree completion program) BS Health Sciences: Paramedic Care (degree completion program)* BS Health Sciences: Public Health
* Relate to Yavapai College degree or certificate programs of study.
Conclusion:
There are currently 7 different subspecialty degree completion options available for those employed in Allied Health fields delivering patient care. This can afford those in the county, an opportunity to complete a Bachelor of Science degree online without the necessity to leave their job or residence. Of these 7 options, four of them are directly related to certificate or degree programs at Yavapai College.
12
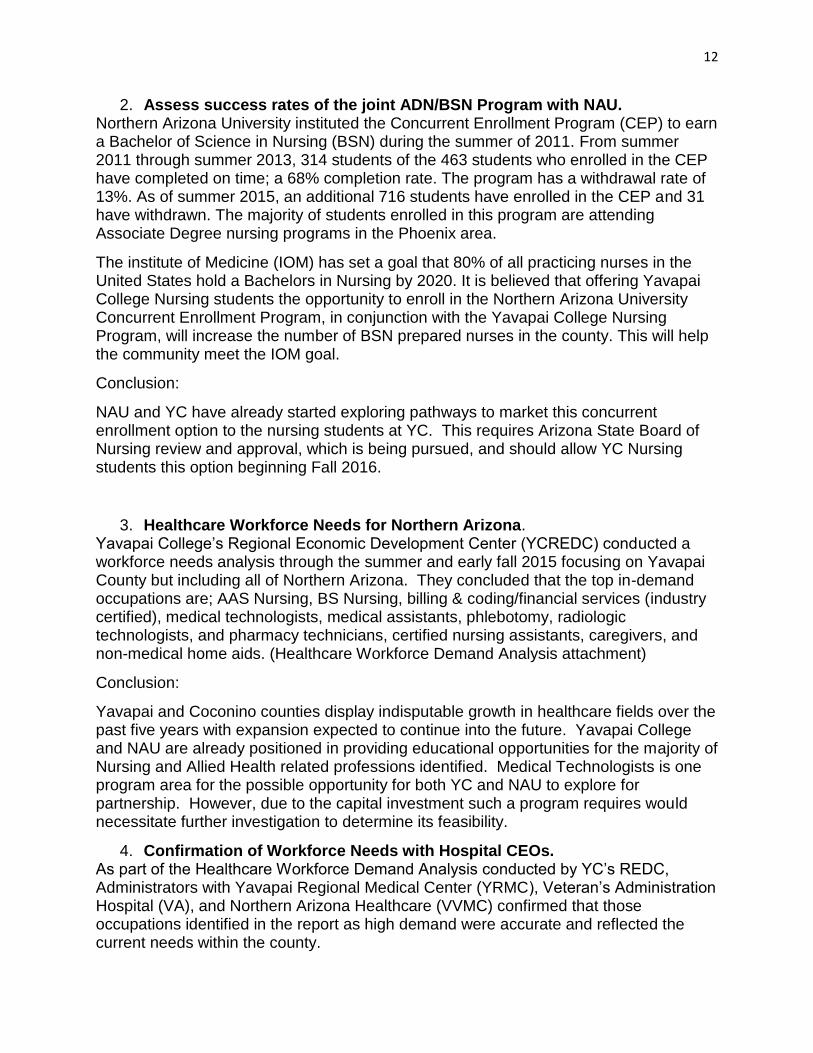
2. Assess success rates of the joint ADN/BSN Program with NAU. Northern Arizona University instituted the Concurrent Enrollment Program (CEP) to earn a Bachelor of Science in Nursing (BSN) during the summer of 2011. From summer 2011 through summer 2013, 314 students of the 463 students who enrolled in the CEP have completed on time; a 68% completion rate. The program has a withdrawal rate of 13%. As of summer 2015, an additional 716 students have enrolled in the CEP and 31 have withdrawn. The majority of students enrolled in this program are attending Associate Degree nursing programs in the Phoenix area.
The institute of Medicine (IOM) has set a goal that 80% of all practicing nurses in the United States hold a Bachelors in Nursing by 2020. It is believed that offering Yavapai College Nursing students the opportunity to enroll in the Northern Arizona University Concurrent Enrollment Program, in conjunction with the Yavapai College Nursing Program, will increase the number of BSN prepared nurses in the county. This will help the community meet the IOM goal.
Conclusion:
NAU and YC have already started exploring pathways to market this concurrent enrollment option to the nursing students at YC. This requires Arizona State Board of Nursing review and approval, which is being pursued, and should allow YC Nursing students this option beginning Fall 2016.
3. Healthcare Workforce Needs for Northern Arizona. Yavapai College’s Regional Economic Development Center (YCREDC) conducted a workforce needs analysis through the summer and early fall 2015 focusing on Yavapai County but including all of Northern Arizona. They concluded that the top in-demand occupations are; AAS Nursing, BS Nursing, billing & coding/financial services (industry certified), medical technologists, medical assistants, phlebotomy, radiologic technologists, and pharmacy technicians, certified nursing assistants, caregivers, and non-medical home aids. (Healthcare Workforce Demand Analysis attachment)
Conclusion:
Yavapai and Coconino counties display indisputable growth in healthcare fields over the past five years with expansion expected to continue into the future. Yavapai College and NAU are already positioned in providing educational opportunities for the majority of Nursing and Allied Health related professions identified. Medical Technologists is one program area for the possible opportunity for both YC and NAU to explore for partnership. However, due to the capital investment such a program requires would necessitate further investigation to determine its feasibility.
4. Confirmation of Workforce Needs with Hospital CEOs. As part of the Healthcare Workforce Demand Analysis conducted by YC’s REDC, Administrators with Yavapai Regional Medical Center (YRMC), Veteran’s Administration Hospital (VA), and Northern Arizona Healthcare (VVMC) confirmed that those occupations identified in the report as high demand were accurate and reflected the current needs within the county.
13
Conclusion:
Nurses, billing/coding services, assistants and technicians were confirmed as high demand healthcare occupations for the Yavapai and Coconino counties.
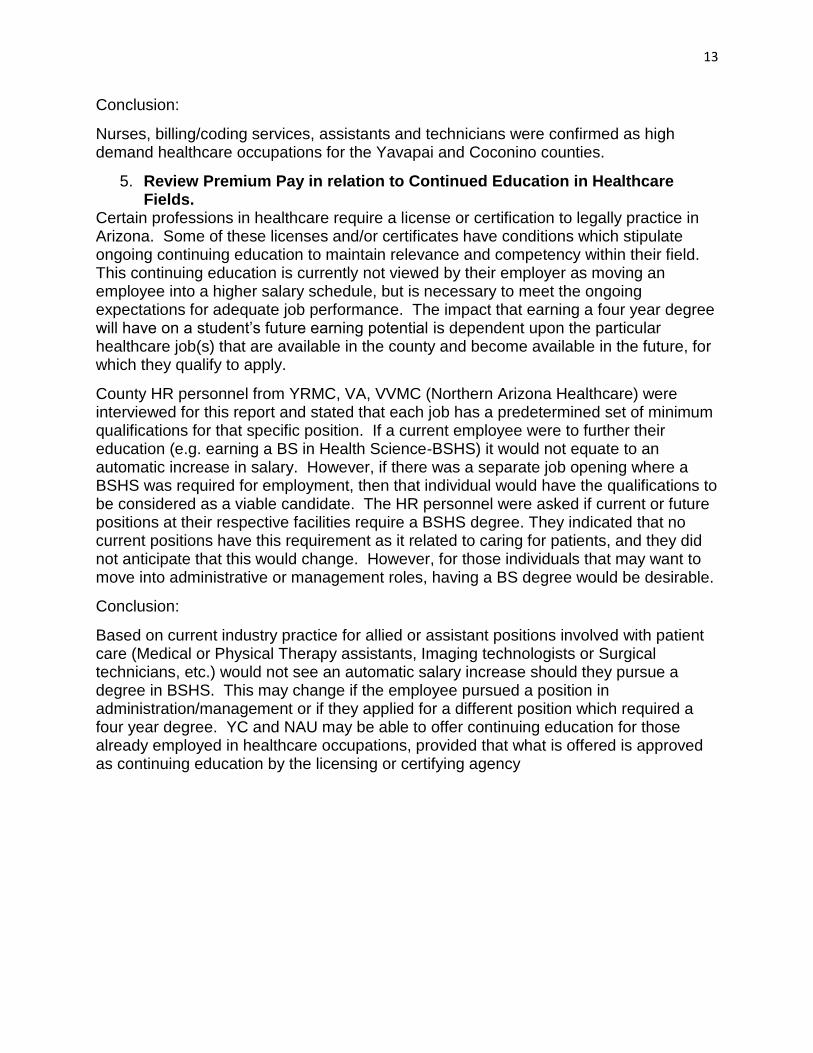
5. Review Premium Pay in relation to Continued Education in Healthcare Fields.
Certain professions in healthcare require a license or certification to legally practice in Arizona. Some of these licenses and/or certificates have conditions which stipulate ongoing continuing education to maintain relevance and competency within their field. This continuing education is currently not viewed by their employer as moving an employee into a higher salary schedule, but is necessary to meet the ongoing expectations for adequate job performance. The impact that earning a four year degree will have on a student’s future earning potential is dependent upon the particular healthcare job(s) that are available in the county and become available in the future, for which they qualify to apply.
County HR personnel from YRMC, VA, VVMC (Northern Arizona Healthcare) were interviewed for this report and stated that each job has a predetermined set of minimum qualifications for that specific position. If a current employee were to further their education (e.g. earning a BS in Health Science-BSHS) it would not equate to an automatic increase in salary. However, if there was a separate job opening where a BSHS was required for employment, then that individual would have the qualifications to be considered as a viable candidate. The HR personnel were asked if current or future positions at their respective facilities require a BSHS degree. They indicated that no current positions have this requirement as it related to caring for patients, and they did not anticipate that this would change. However, for those individuals that may want to move into administrative or management roles, having a BS degree would be desirable.
Conclusion:
Based on current industry practice for allied or assistant positions involved with patient care (Medical or Physical Therapy assistants, Imaging technologists or Surgical technicians, etc.) would not see an automatic salary increase should they pursue a degree in BSHS. This may change if the employee pursued a position in administration/management or if they applied for a different position which required a four year degree. YC and NAU may be able to offer continuing education for those already employed in healthcare occupations, provided that what is offered is approved as continuing education by the licensing or certifying agency
1100 E. Sheldon St., Prescott AZ 86301 yc.edu
Healthcare Workforce Demand Analysis Conducted by the YC Regional Economic Development Center
1
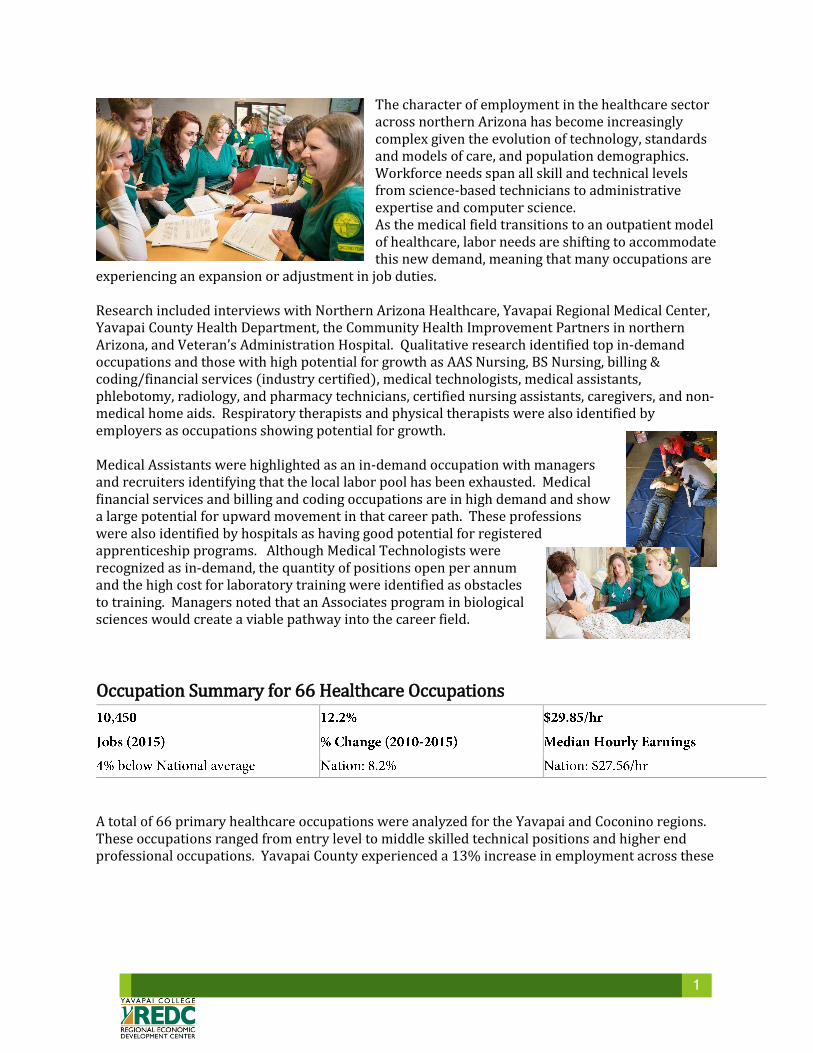
The character of employment in the healthcare sector across northern Arizona has become increasingly complex given the evolution of technology, standards and models of care, and population demographics. Workforce needs span all skill and technical levels from science-based technicians to administrative expertise and computer science. As the medical field transitions to an outpatient model of healthcare, labor needs are shifting to accommodate this new demand, meaning that many occupations are
experiencing an expansion or adjustment in job duties. Research included interviews with Northern Arizona Healthcare, Yavapai Regional Medical Center, Yavapai County Health Department, the Community Health Improvement Partners in northern Arizona, and Veteran’s Administration Hospital. Qualitative research identified top in-demand occupations and those with high potential for growth as AAS Nursing, BS Nursing, billing & coding/financial services (industry certified), medical technologists, medical assistants, phlebotomy, radiology, and pharmacy technicians, certified nursing assistants, caregivers, and non-medical home aids. Respiratory therapists and physical therapists were also identified by employers as occupations showing potential for growth. Medical Assistants were highlighted as an in-demand occupation with managers and recruiters identifying that the local labor pool has been exhausted. Medical financial services and billing and coding occupations are in high demand and show a large potential for upward movement in that career path. These professions were also identified by hospitals as having good potential for registered apprenticeship programs. Although Medical Technologists were recognized as in-demand, the quantity of positions open per annum and the high cost for laboratory training were identified as obstacles to training. Managers noted that an Associates program in biological sciences would create a viable pathway into the career field.
Occupation Summary for 66 Healthcare Occupations
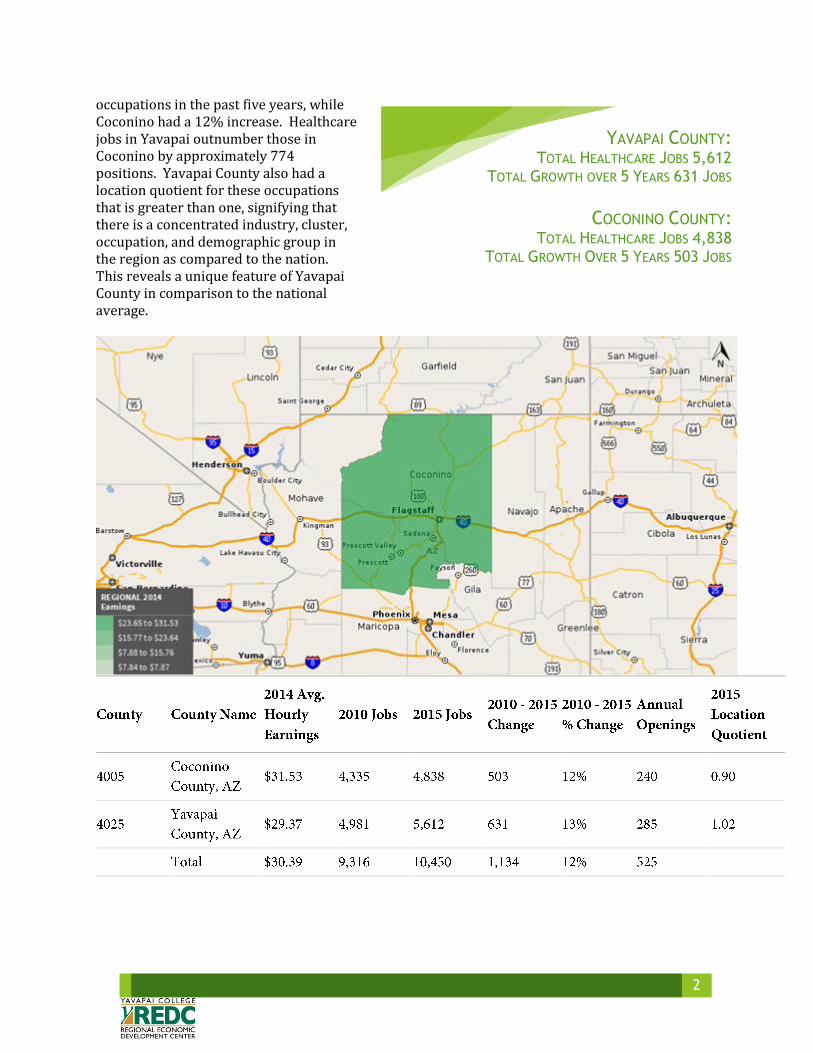
A total of 66 primary healthcare occupations were analyzed for the Yavapai and Coconino regions. These occupations ranged from entry level to middle skilled technical positions and higher end professional occupations. Yavapai County experienced a 13% increase in employment across these
2
occupations in the past five years, while Coconino had a 12% increase. Healthcare jobs in Yavapai outnumber those in Coconino by approximately 774 positions. Yavapai County also had a location quotient for these occupations that is greater than one, signifying that there is a concentrated industry, cluster, occupation, and demographic group in the region as compared to the nation. This reveals a unique feature of Yavapai County in comparison to the national average.
YAVAPAI COUNTY: TOTAL HEALTHCARE JOBS 5,612
TOTAL GROWTH OVER 5 YEARS 631 JOBS
COCONINO COUNTY:
TOTAL HEALTHCARE JOBS 4,838 TOTAL GROWTH OVER 5 YEARS 503 JOBS
3
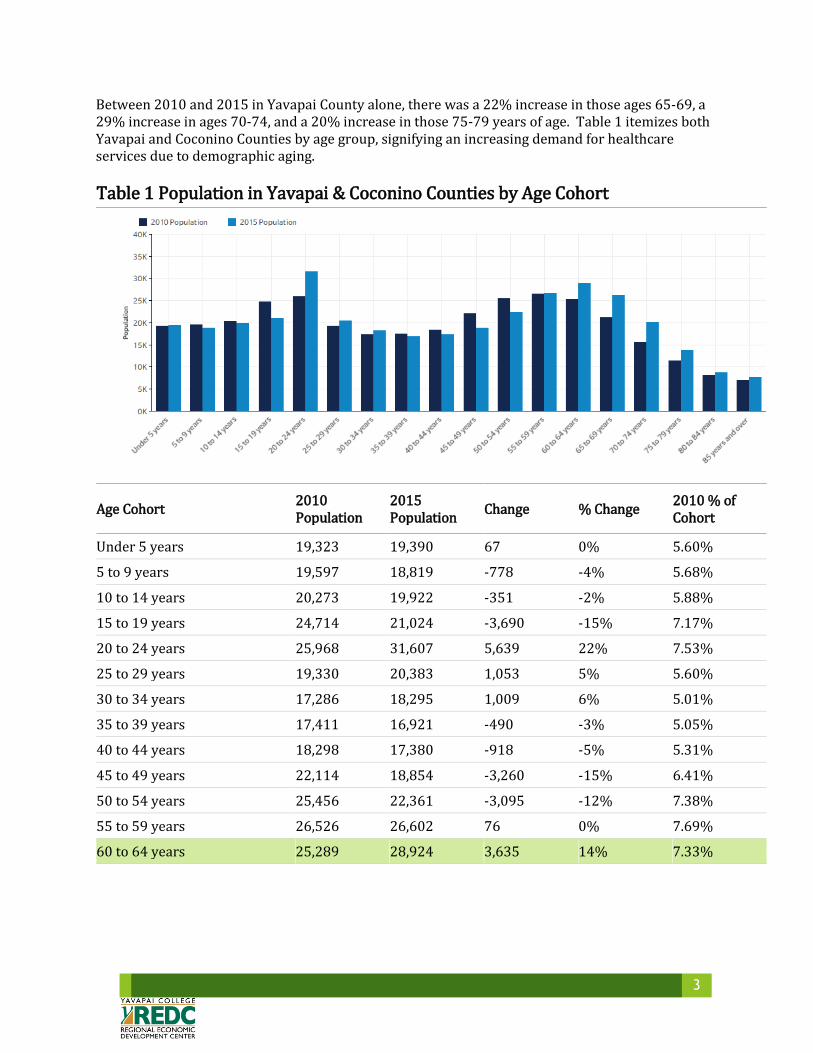
Between 2010 and 2015 in Yavapai County alone, there was a 22% increase in those ages 65-69, a 29% increase in ages 70-74, and a 20% increase in those 75-79 years of age. Table 1 itemizes both Yavapai and Coconino Counties by age group, signifying an increasing demand for healthcare services due to demographic aging.
Table 1 Population in Yavapai & Coconino Counties by Age Cohort
Age Cohort 2010 Population
2015 Population
Change % Change 2010 % of Cohort
Under 5 years 19,323 19,390 67 0% 5.60%
5 to 9 years 19,597 18,819 -778 -4% 5.68%
10 to 14 years 20,273 19,922 -351 -2% 5.88%
15 to 19 years 24,714 21,024 -3,690 -15% 7.17%
20 to 24 years 25,968 31,607 5,639 22% 7.53%
25 to 29 years 19,330 20,383 1,053 5% 5.60%
30 to 34 years 17,286 18,295 1,009 6% 5.01%
35 to 39 years 17,411 16,921 -490 -3% 5.05%
40 to 44 years 18,298 17,380 -918 -5% 5.31%
45 to 49 years 22,114 18,854 -3,260 -15% 6.41%
50 to 54 years 25,456 22,361 -3,095 -12% 7.38%
55 to 59 years 26,526 26,602 76 0% 7.69%
60 to 64 years 25,289 28,924 3,635 14% 7.33%
4
Age Cohort 2010 Population
2015 Population
Change % Change 2010 % of Cohort
65 to 69 years 21,178 26,229 5,051 24% 6.14%
70 to 74 years 15,615 20,169 4,554 29% 4.53%
75 to 79 years 11,388 13,749 2,361 21% 3.30%
80 to 84 years 8,115 8,751 636 8% 2.35%
85 years and over 7,035 7,778 743 11% 2.04%
Total 344,917 357,158 12,241 4% 100.00%
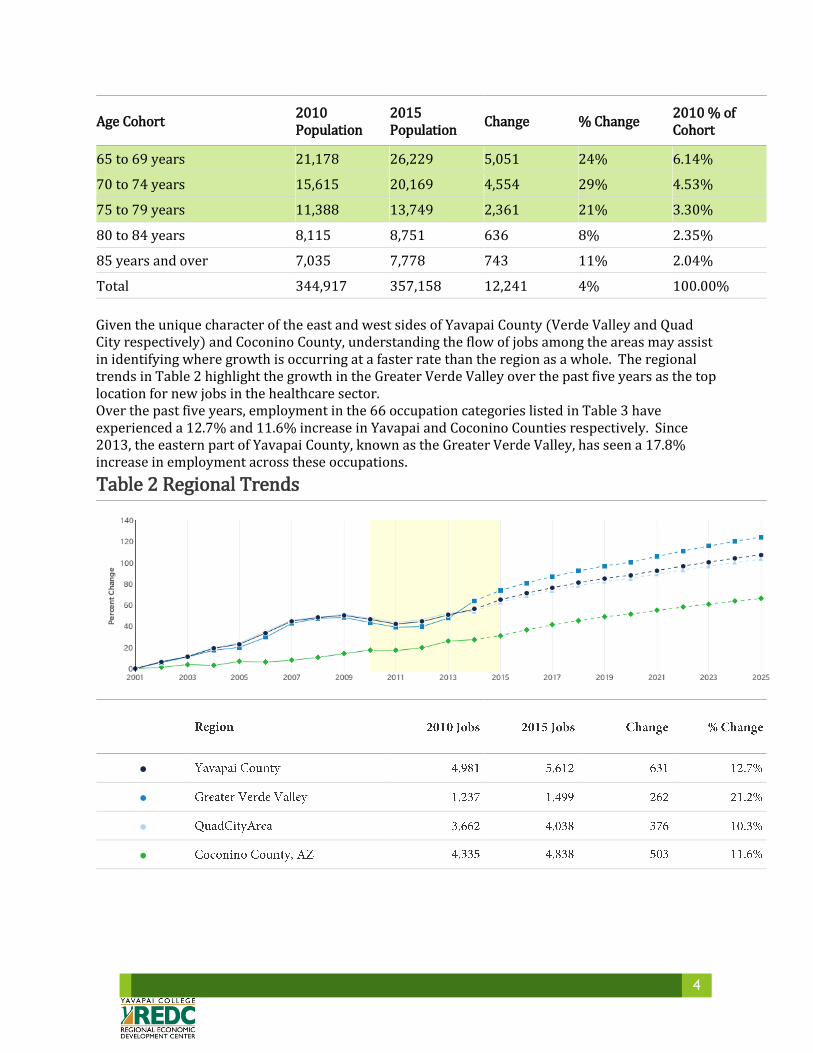
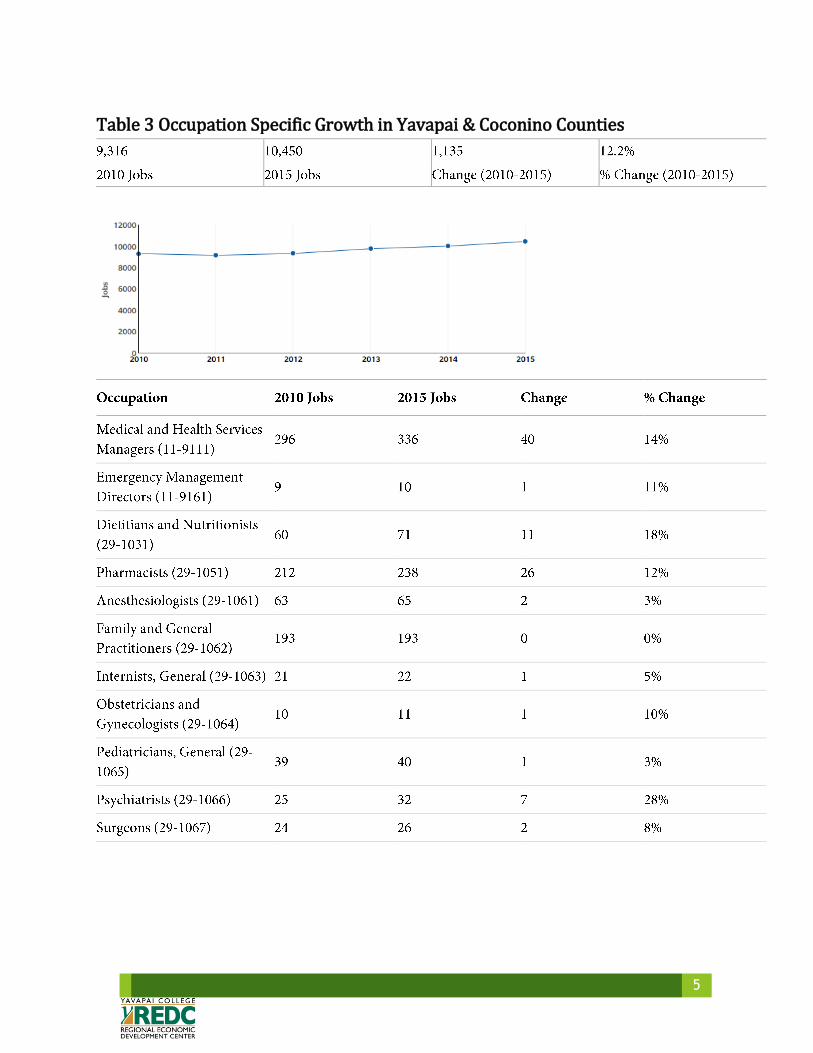
Given the unique character of the east and west sides of Yavapai County (Verde Valley and Quad City respectively) and Coconino County, understanding the flow of jobs among the areas may assist in identifying where growth is occurring at a faster rate than the region as a whole. The regional trends in Table 2 highlight the growth in the Greater Verde Valley over the past five years as the top location for new jobs in the healthcare sector. Over the past five years, employment in the 66 occupation categories listed in Table 3 have experienced a 12.7% and 11.6% increase in Yavapai and Coconino Counties respectively. Since 2013, the eastern part of Yavapai County, known as the Greater Verde Valley, has seen a 17.8% increase in employment across these occupations.
Table 2 Regional Trends
●
●
●
●
5
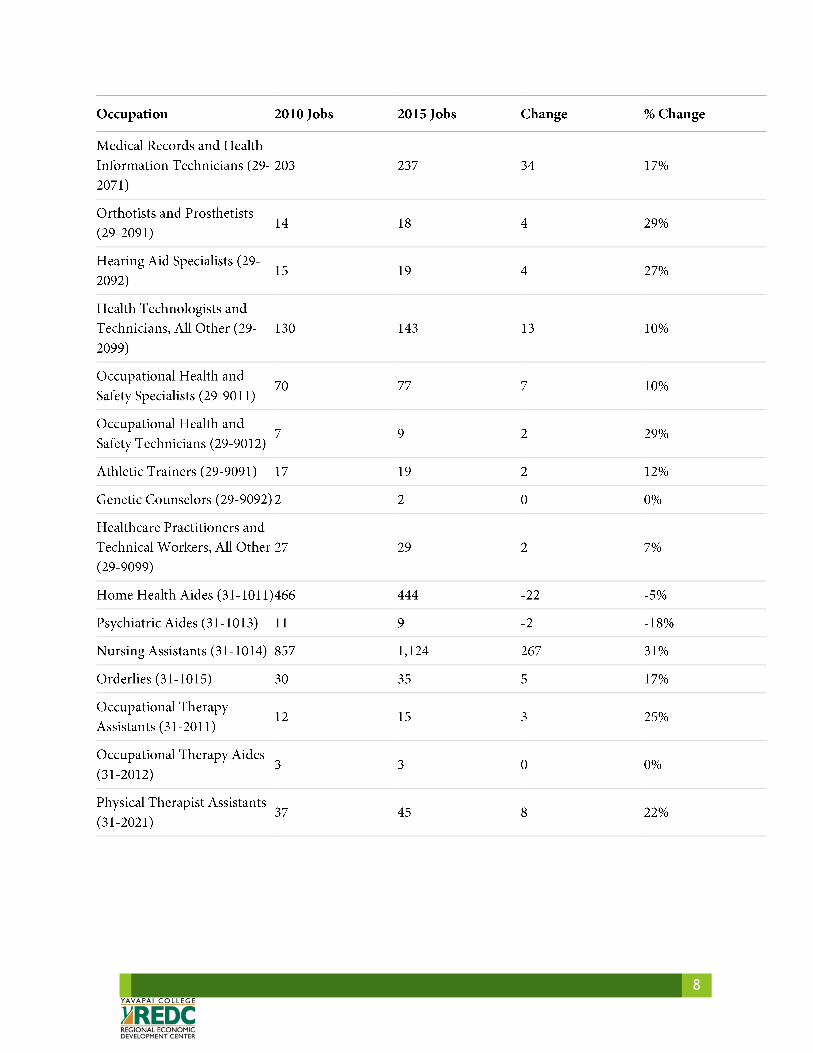
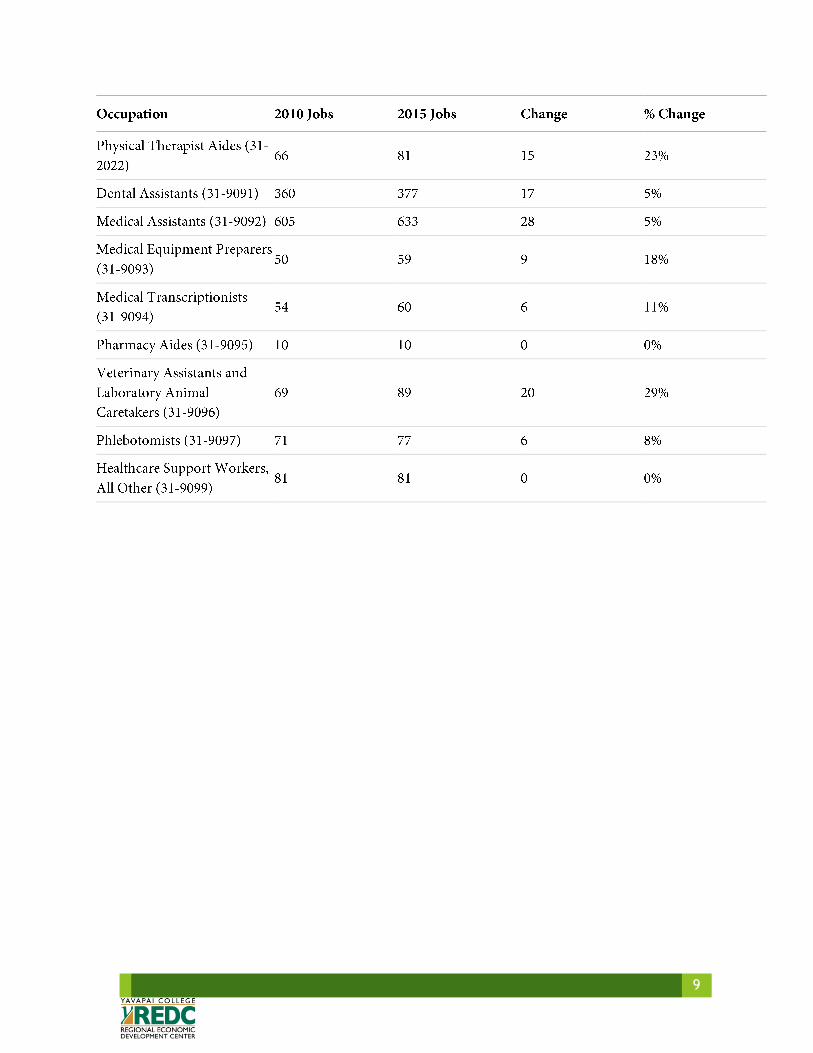
Table 3 Occupation Specific Growth in Yavapai & Coconino Counties

6

7
8
9
10
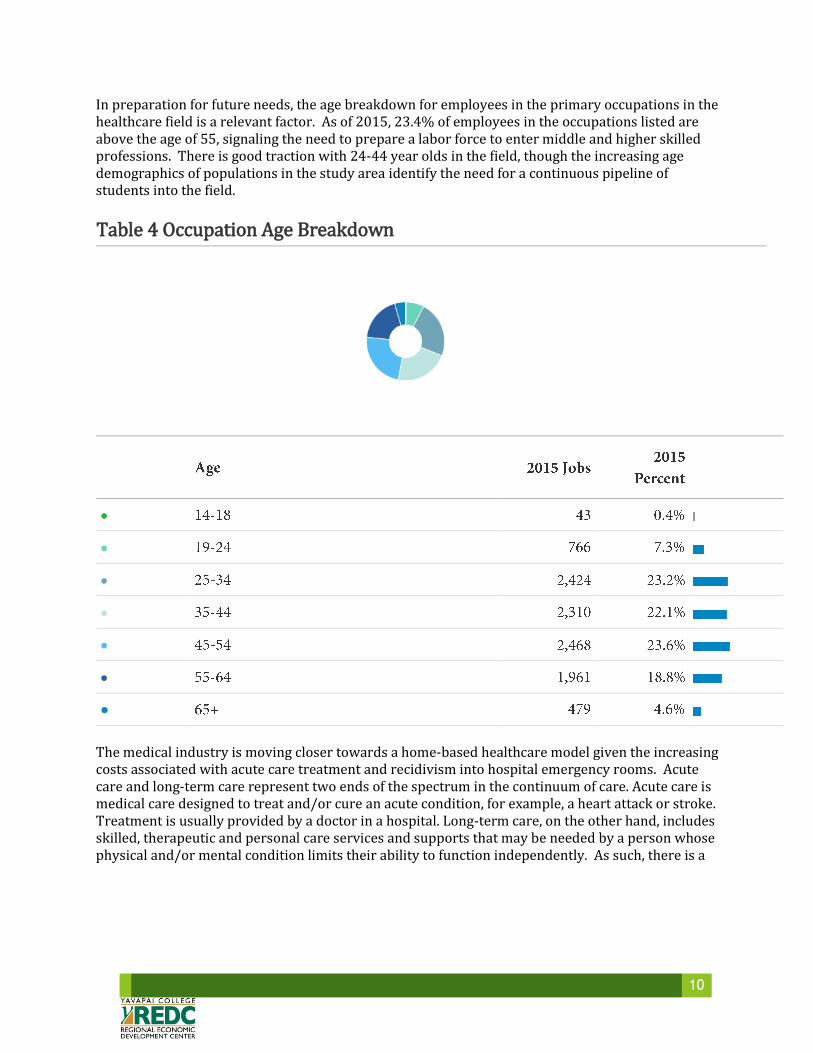
In preparation for future needs, the age breakdown for employees in the primary occupations in the healthcare field is a relevant factor. As of 2015, 23.4% of employees in the occupations listed are above the age of 55, signaling the need to prepare a labor force to enter middle and higher skilled professions. There is good traction with 24-44 year olds in the field, though the increasing age demographics of populations in the study area identify the need for a continuous pipeline of students into the field.
Table 4 Occupation Age Breakdown
●
●
●
●
●
●
●
The medical industry is moving closer towards a home-based healthcare model given the increasing costs associated with acute care treatment and recidivism into hospital emergency rooms. Acute care and long-term care represent two ends of the spectrum in the continuum of care. Acute care is medical care designed to treat and/or cure an acute condition, for example, a heart attack or stroke. Treatment is usually provided by a doctor in a hospital. Long-term care, on the other hand, includes skilled, therapeutic and personal care services and supports that may be needed by a person whose physical and/or mental condition limits their ability to function independently. As such, there is a

11
big difference between acute care and long-term care in terms of who receives care, where and by whom the care is provided, the care need, the goal of care and how care is paid for. This shift in services has increased the demand for Home Health Aids, including caregivers and non-medical home aids, and Physical Therapists. Although the quantity of jobs decreased by 20 in the study area over the past five years, demand in the Verde Valley increased by 10 jobs, justifying the need for short-term training in these fields in the Verde communities.
Variable Acute Care Long-term Care
Demographic Anyone Primarily the elderly and those with disabilities
Provider Hospitals, out-patient clinics, physician offices, physicians, nurse practitioners
Skilled nursing homes, assisted living facilities, group homes, home care, nurses, therapists, paraprofessionals
Care Need Acute conditions, infections, diseases, accidents
Functional limitations due to chronic conditions, recovery process or permanent disability
Goal of Care Treatment and cure Functional improvement through therapy and/or ongoing assistance with functional limitations to achieve the highest quality of life possible
Payer Medical insurance, Medicare, Medicaid, the Veterans Administration
Private pay, Medicare, Medicaid, long-term care insurance, Veterans Administration, Veteran’s benefits and pensions, some employer-provided medical insurance
Source: Elder Care Sources, LLC
Table 5 Top Industries Employing 66 Primary Occupations
12
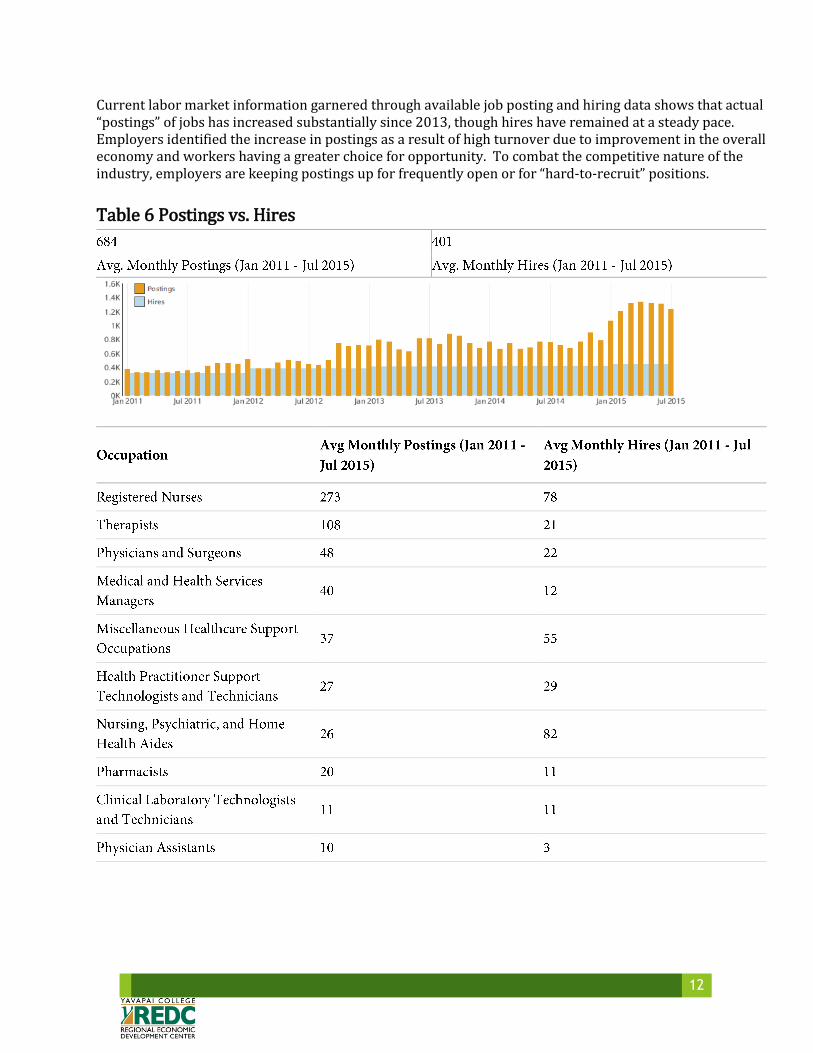
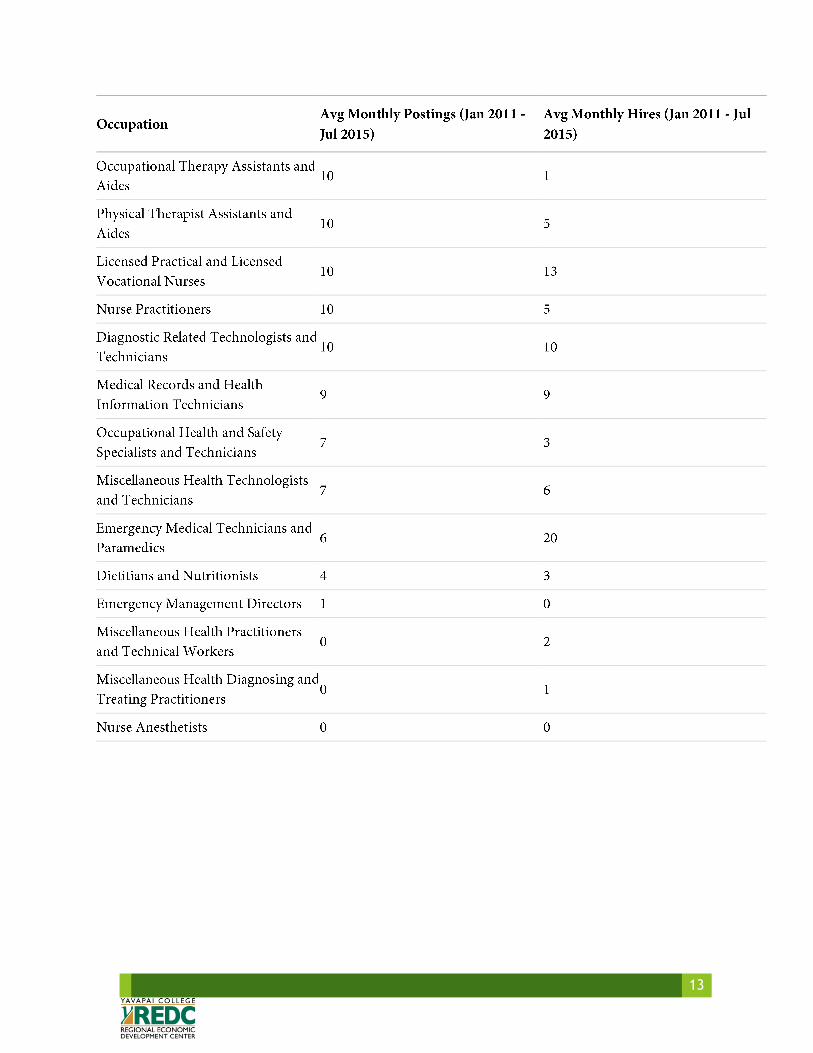
Current labor market information garnered through available job posting and hiring data shows that actual “postings” of jobs has increased substantially since 2013, though hires have remained at a steady pace. Employers identified the increase in postings as a result of high turnover due to improvement in the overall economy and workers having a greater choice for opportunity. To combat the competitive nature of the industry, employers are keeping postings up for frequently open or for “hard-to-recruit” positions.
Table 6 Postings vs. Hires
13
14
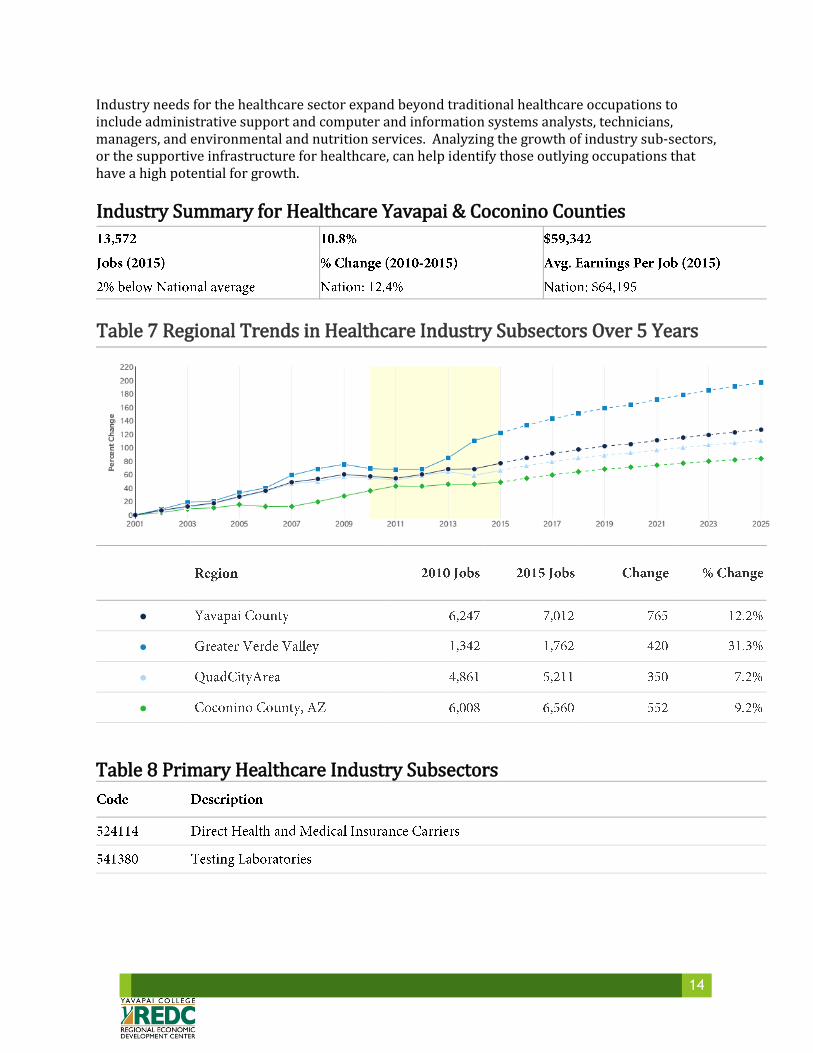
Industry needs for the healthcare sector expand beyond traditional healthcare occupations to include administrative support and computer and information systems analysts, technicians, managers, and environmental and nutrition services. Analyzing the growth of industry sub-sectors, or the supportive infrastructure for healthcare, can help identify those outlying occupations that have a high potential for growth.
Industry Summary for Healthcare Yavapai & Coconino Counties
Table 7 Regional Trends in Healthcare Industry Subsectors Over 5 Years
●
●
●
●
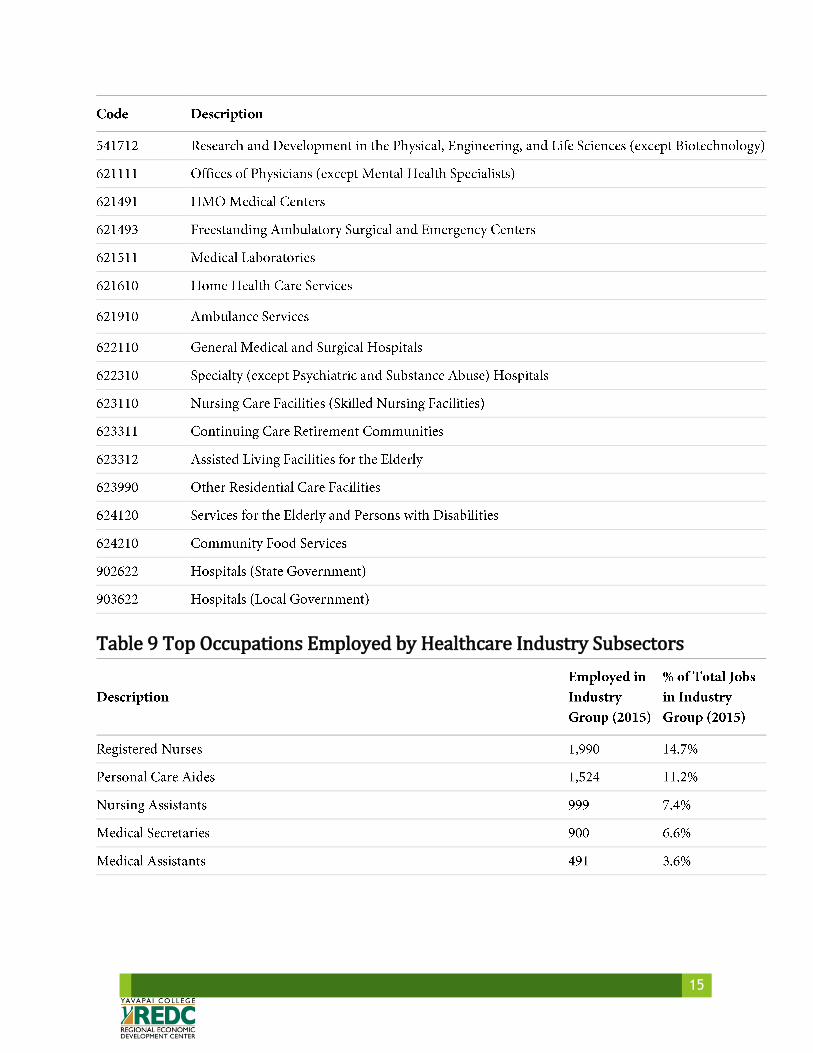
Table 8 Primary Healthcare Industry Subsectors
15
Table 9 Top Occupations Employed by Healthcare Industry Subsectors

16
In Yavapai County, the top ten occupations by quantity of jobs span retail, food preparation and service, maintenance and cleaning, health diagnosis and treatment practitioners, administrative support, and other personal care service workers. Of these top ten occupations, health diagnosing and treating practitioners lead the pack as the highest paid professions in Yavapai County at $48.61 per hour. These positions along with personal care occupations also topped the list for greatest increase in jobs based on past trends, with a 3% increase in total jobs expected by 2016.
Table 10 Largest Occupations by Job Count & Wages

17
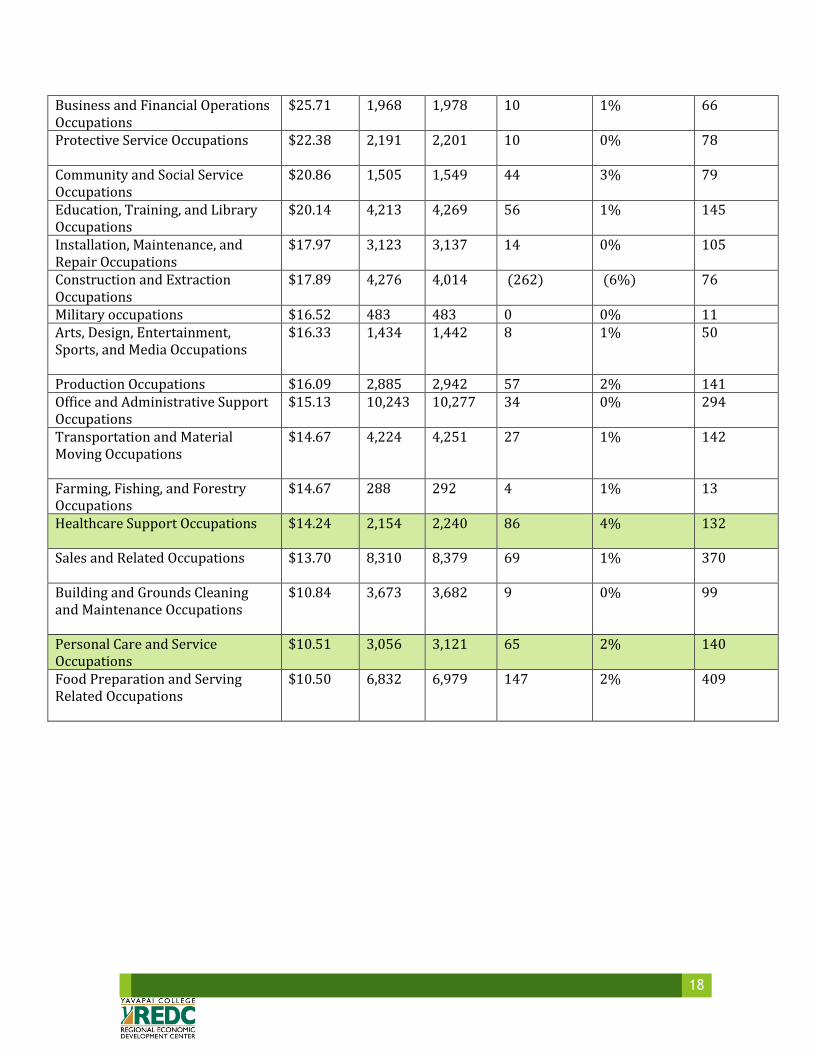
The overview of top occupations in Yavapai County by 2 digit federal Standard Occupational Classification codes identifies healthcare practitioners and technical occupations in the field to be the best return on average hourly earnings at $39.27 and the greatest quantity of jobs in the region with a total of 3,942 expected by 2016. Management occupations, professional, technical and scientific occupations, education, social service, maintenance and production occupations, agriculture, and retail sales and food service fill out the remaining top occupations by wage and quantity of jobs for the county. Health support occupations also fair well with a $14.24 average wage and the largest expected growth in jobs at 4% by 2016.
Table 11 Top 23 Yavapai County Occupations by Jobs Count Description 2014 Avg.
Hourly Earnings
2015 Jobs
2016 Jobs
2015 - 2016 Change
2015 - 2016 % Change
Annual Openings
Healthcare Practitioners and Technical Occupations
$39.27 3,816 3,942 126 3% 210
Management Occupations $34.37 3,247 3,244 (3) (0%) 99 Legal Occupations $30.30 395 395 0 0% Insf. Data Architecture and Engineering Occupations
$29.15 585 579 (6) (1%) 19
Life, Physical, and Social Science Occupations
$26.75 488 495 7 1% 22
Computer and Mathematical Occupations
$26.72 630 641 11 2% 23
18
Business and Financial Operations Occupations
$25.71 1,968 1,978 10 1% 66
Protective Service Occupations $22.38 2,191 2,201 10 0% 78
Community and Social Service Occupations
$20.86 1,505 1,549 44 3% 79
Education, Training, and Library Occupations
$20.14 4,213 4,269 56 1% 145
Installation, Maintenance, and Repair Occupations
$17.97 3,123 3,137 14 0% 105
Construction and Extraction Occupations
$17.89 4,276 4,014 (262) (6%) 76
Military occupations $16.52 483 483 0 0% 11 Arts, Design, Entertainment, Sports, and Media Occupations
$16.33 1,434 1,442 8 1% 50
Production Occupations $16.09 2,885 2,942 57 2% 141 Office and Administrative Support Occupations
$15.13 10,243 10,277 34 0% 294
Transportation and Material Moving Occupations
$14.67 4,224 4,251 27 1% 142
Farming, Fishing, and Forestry Occupations
$14.67 288 292 4 1% 13
Healthcare Support Occupations $14.24 2,154 2,240 86 4% 132
Sales and Related Occupations $13.70 8,310 8,379 69 1% 370
Building and Grounds Cleaning and Maintenance Occupations
$10.84 3,673 3,682 9 0% 99
Personal Care and Service Occupations
$10.51 3,056 3,121 65 2% 140
Food Preparation and Serving Related Occupations
$10.50 6,832 6,979 147 2% 409

19
Summary Yavapai and Coconino counties display indisputable growth in the healthcare field over the past five years with expansion expected to continue into the future. Employment in the sector affords a range of wage opportunities from the entry level home health aid to the middle-skilled technician, and further professional level occupations. The largest growth in jobs over the past five years was seen in Nursing Assistants, Registered Nurses, EMT and paramedic, Medical and Health Service Managers, Physical Therapists, Medical and Clinical Laboratory Technicians, Pharmacy Technicians, and Medical Assistants respectively. Managers and health advocates clearly articulated the need to move forward into a new era of healthcare that is holistic and inclusive of access to healthy foods, exercise, and preventative medicine. This initiative incorporates multiple industry sectors and additional occupations in the agricultural, fitness, transportation, and health fields. Yavapai County in particular displays increasing demand for a variety of healthcare occupations which correspond to high wages that ripple through the economy, churning the economic engine and fulfilling the needs of the growing constituency to create a healthy community foundation. Continued programming and expansion of current educational services is a viable and sustainable strategy economically and socially, serving the needs of community members and increasing the economic vitality of the region.
YAVAPAI COUNTY TOP IN-DEMAND OCCUPATIONS:
RETAIL & HOSPITALITY ADMINISTRATIVE & OFFICE WORKERS
NURSING AND HOME HEALTH AIDS REGISTERED NURSES
PERSONAL CARE AIDS GENERAL OPERATIONS MANAGERS
MANUFACTURING & MAINTENANCE TECHNICIANS AUTOMOTIVE TECHNICIANS
ACCOUNTING OFFICE SUPERVISORS
MISCELLANEOUS HEALTHCARE SUPPORT OCCUPTIONS

20
Special Thanks Yavapai Regional Medical Center
Northern Arizona Healthcare VA Hospital
Yavapai County Healthcare Department Community Health Improvement Partners
Yavapai County Food Plan Team Yavapai College Allied Health Faculty

21
Appendix A Parameters Regions Code Description 4005 Coconino County, AZ 4025 Yavapai County, AZ Timeframe 2010 - 2015 Datarun 2015.2 – QCEW Employees, Non-QCEW Employees, and Self-Employed
22
Appendix B Sources
Occupation Data EMSI occupation employment data are based on final EMSI industry data and final EMSI staffing patterns. Wage estimates are based on Occupational Employment Statistics (QCEW and Non-QCEW Employees classes of worker) and the American Community Survey (Self-Employed and Extended Proprietors). Occupational wage estimates also affected by county-level EMSI earnings by industry.
Location Quotient Location quotient (LQ) is a way of quantifying how concentrated a particular industry, cluster, occupation, or demographic group is in a region as compared to the nation. It can reveal what makes a particular region unique in comparison to the national average.
Job Postings Data In partnership with EMSI's parent company CareerBuilder and other third party aggregators, EMSI collects its job postings data by scraping approximately 30,000 websites. EMSI then cleans the data and applies a two-step deduplication process to present an estimate of total unique postings. Normalization of data fields is performed using machine-learning technologies, which leverage not just job postings data but also CareerBuilder's extensive database of résumés and profiles.
Hires Data EMSI produces hires data using a proprietary methodology which incorporates data from the Quarterly Workforce indicators (QWI) and American Community Survey (ACS).
Institution Data The institution data in this report is taken directly from the national IPEDS database published by the U.S. Department of Education's National Center for Education Statistics.
Completers Data The completers data in this report is taken directly from the national IPEDS database published by the U.S. Department of Education's National Center for Education Statistics.
Staffing Patterns Data The staffing pattern data in this report are compiled from several sources using a specialized process. For QCEW and Non-QCEW Employees classes of worker, sources include Occupational Employment Statistics, the National Industry-Occupation Employment Matrix, and the American Community Survey. For the Self-Employed and Extended Proprietors classes of worker, the primary source is the American Community Survey, with a small amount of information from Occupational Employment Statistics.
Industry Data EMSI industry data have various sources depending on the class of worker. (1) For QCEW Employees, EMSI
23
primarily uses the QCEW (Quarterly Census of Employment and Wages), with supplemental estimates from County Business Patterns and Current Employment Statistics. (2) Non-QCEW employees data are based on a number of sources including QCEW, Current Employment Statistics, County Business Patterns, BEA State and Local Personal Income reports, the National Industry-Occupation Employment Matrix (NIOEM), the American Community Survey, and Railroad Retirement Board statistics. (3) Self-Employed and Extended Proprietor classes of worker data are primarily based on the American Community Survey, Nonemployer Statistics, and BEA State and Local Personal Income Reports. Projections for QCEW and Non-QCEW Employees are informed by NIOEM and long-term industry projections published by individual states.
State Data Sources This report uses state data from the following agencies: Arizona Department of Administration, Office of Employment and Population Statistics
Hea
lth
Wor
kfor
ce, H
ealt
hy E
cono
my
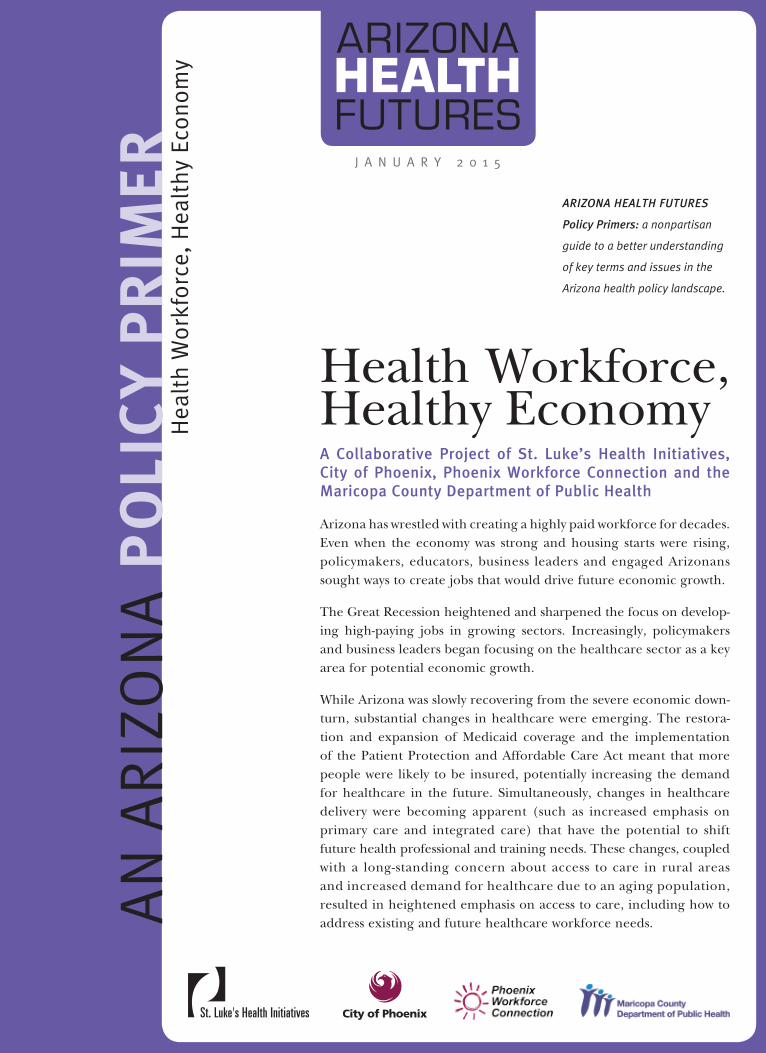
Health Workforce, Healthy EconomyA Collaborative Project of St. Luke’s Health Initiatives, City of Phoenix, Phoenix Workforce Connection and the Maricopa County Department of Public Health
Arizona has wrestled with creating a highly paid workforce for decades. Even when the economy was strong and housing starts were rising, policymakers, educators, business leaders and engaged Arizonans sought ways to create jobs that would drive future economic growth.
The Great Recession heightened and sharpened the focus on develop-ing high-paying jobs in growing sectors. Increasingly, policymakers and business leaders began focusing on the healthcare sector as a key area for potential economic growth.
While Arizona was slowly recovering from the severe economic down-turn, substantial changes in healthcare were emerging. The restora-tion and expansion of Medicaid coverage and the implementation of the Patient Protection and Affordable Care Act meant that more people were likely to be insured, potentially increasing the demand for healthcare in the future. Simultaneously, changes in healthcare delivery were becoming apparent (such as increased emphasis on primary care and integrated care) that have the potential to shift future health professional and training needs. These changes, coupled with a long-standing concern about access to care in rural areas and increased demand for healthcare due to an aging population, resulted in heightened emphasis on access to care, including how to address existing and future healthcare workforce needs.A
N A
RIZ
ON
A P
OLI
CY
PR
IMER
ARIZONA HEALTH FUTURES
Policy Primers: a nonpartisan
guide to a better understanding
of key terms and issues in the
Arizona health policy landscape.
J A N U A R Y 2 0 1 5
Growing, training and retaining needed healthcare workers are promising strategies for stimulating and stabilizing economic development. Identifying needed healthcare work-ers – both in terms of types of needed health professionals and gaps in the geographic distribution of health professionals – is an important precursor to developing strategies to effectively meet our state’s future workforce and economic development needs.
This report is an important first step to identifying those needs. It provides a glimpse of what we know – and do not know – about existing gaps in our healthcare workforce. Gathering data from a variety of sources, this report provides information on the number of health professionals in a variety of areas, including ratios of various health professionals to the population at large. Regional and geographic data is included where available.
In many instances, more information will be needed to further refine our understanding of our state’s health workforce needs. Additional data collection may be required. We may also need to refine our understanding of how future healthcare workforce needs may be different than the demands that exist today. Finally, states and localities may have to identify and refine strategies to address our workforce needs. This may include: 1) ensuring that an adequate number of training opportunities exist for needed health professionals; 2) incen-tivizing health professionals to practice in underserved communities or professions; and 3) leveraging funding to address shortage areas.
This report aims to advance our understanding of our state’s health workforce needs. By doing so, we hope that Arizonans recognize the unique opportunity to simultaneously improve access to healthcare while growing high-paying jobs in the process.
Methodology and Report Limitations
Attempting to define and count the entire healthcare workforce can be daunting. The healthcare workforce is broad in scope. It includes much more than doctors, nurses and dentists. For the purposes of this report, we loosely define healthcare workers as those who are licensed or certified to provide health or allied health services. There are many Arizonans employed among these various health professions. However, information on those professionals is extremely limited. Appendix I provides the best data available on a broad section of healthcare professionals in Arizona.
This assessment specifically provides data on licensed professions. Even when looking at licensed individuals, there are no clear, undisputed figures on the number of health pro-fessionals by specialty. Additionally, challenges in collecting data are numerous, including:
• renewal cycles that can impact real-time data collection;
• licensing reciprocity with other states;
• professionals holding active licenses in more than one state;
• data not reflecting Full-Time Equivalent (FTE) information for professionals; and
• inability to identify licensees who provide direct patient care.
2 Health Workforce, Healthy Economy
(There is)
a unique
opportunity to
simultaneously
improve access
to healthcare
while growing
high paying
jobs in the
process.
What is the Linchpin Holding Together the Dual Challenges of Economic Development and Access to Care?
Workforce.
However, a number of surveys, assessments and reporting have been completed that provide insight and obtainable data on Arizona’s healthcare workforce. This summary pulls together those figures to provide the best available information. It is organized by profession. Recognizing that there is often conflicting data, all information is sourced. When data per-mits, information is also presented to highlight workforce in both rural and urban settings statewide. Data indicating shortages can potentially identify a need to explore increasing the workforce, or even to redistribute the existing workforce.
When available, the most recent administrative data on licensees is also provided with a focus on licensees practicing in the state. However, there is one critical caveat that must be kept in mind when reviewing licensing data. An active license does not necessarily mean that the licensee is practicing directly in healthcare delivery or even practicing at all. As with all data presented, it is designed to provide a best available estimate of different specialties.
Bureau of Labor Statistics (BLS) data is also presented. This data measures employed personnel by surveying establishments covered by employment insurance. As a result, licensing data can, and often does, conflict with BLS data. Both are presented to ensure a more complete picture.
When available, national provider-to-population ratios are presented to give national context. However, as with any national comparison, it does not tell the entire story in that it cannot account for the nuances and differences among states in delivery systems and population health needs.
Finally, it is also important to highlight that this summary does not, and cannot, encompass all of the work currently being done by stakeholders, and specifically the state universities, around healthcare workforce and access.
We look at this report as an important first step to understanding Arizona’s health work-force needs.
St. Luke’s Health Initiatives 3
Overview of Arizona’s Health Workforce Needs In 2004, the U.S. Department of Health and Human Services, Health Resources and Services Administration (HRSA), declared Arizona’s healthcare workforce 49th among states in per capita employment.1 While a majority of states report shortages, there are unique Arizona characteristics that individualize and heighten the challenge of recruiting and retaining a robust healthcare workforce.
Arizona’s Unique Circumstances
Who we are as a state – our erratic spurts of growth and unique population characteristics – creates particular challenges for recruiting and retaining an adequate healthcare workforce.
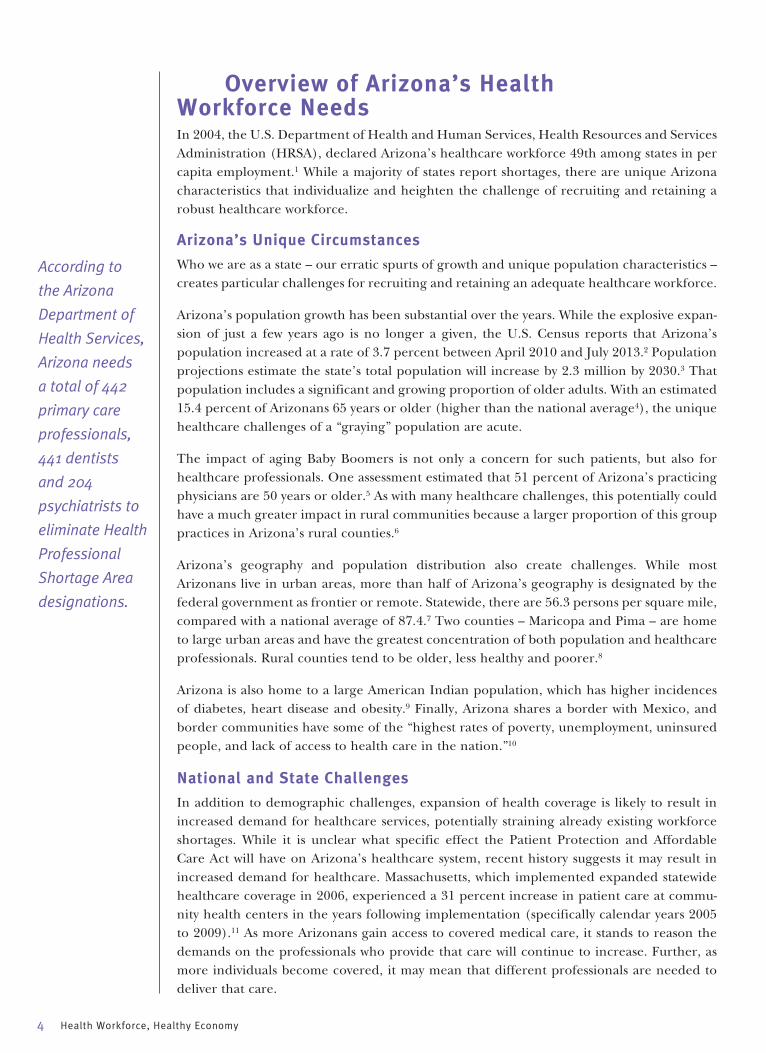
Arizona’s population growth has been substantial over the years. While the explosive expan-sion of just a few years ago is no longer a given, the U.S. Census reports that Arizona’s population increased at a rate of 3.7 percent between April 2010 and July 2013.2 Population projections estimate the state’s total population will increase by 2.3 million by 2030.3 That population includes a significant and growing proportion of older adults. With an estimated 15.4 percent of Arizonans 65 years or older (higher than the national average4), the unique healthcare challenges of a “graying” population are acute.
The impact of aging Baby Boomers is not only a concern for such patients, but also for healthcare professionals. One assessment estimated that 51 percent of Arizona’s practicing physicians are 50 years or older.5 As with many healthcare challenges, this potentially could have a much greater impact in rural communities because a larger proportion of this group practices in Arizona’s rural counties.6
Arizona’s geography and population distribution also create challenges. While most Arizonans live in urban areas, more than half of Arizona’s geography is designated by the federal government as frontier or remote. Statewide, there are 56.3 persons per square mile, compared with a national average of 87.4.7 Two counties – Maricopa and Pima – are home to large urban areas and have the greatest concentration of both population and healthcare professionals. Rural counties tend to be older, less healthy and poorer.8
Arizona is also home to a large American Indian population, which has higher incidences of diabetes, heart disease and obesity.9 Finally, Arizona shares a border with Mexico, and border communities have some of the “highest rates of poverty, unemployment, uninsured people, and lack of access to health care in the nation.”10
National and State Challenges
In addition to demographic challenges, expansion of health coverage is likely to result in increased demand for healthcare services, potentially straining already existing workforce shortages. While it is unclear what specific effect the Patient Protection and Affordable Care Act will have on Arizona’s healthcare system, recent history suggests it may result in increased demand for healthcare. Massachusetts, which implemented expanded statewide healthcare coverage in 2006, experienced a 31 percent increase in patient care at commu-nity health centers in the years following implementation (specifically calendar years 2005 to 2009).11 As more Arizonans gain access to covered medical care, it stands to reason the demands on the professionals who provide that care will continue to increase. Further, as more individuals become covered, it may mean that different professionals are needed to deliver that care.
4 Health Workforce, Healthy Economy
According to
the Arizona
Department of
Health Services,
Arizona needs
a total of 442
primary care
professionals,
441 dentists
and 204
psychiatrists to
eliminate Health
Professional
Shortage Area
designations.
St. Luke’s Health Initiatives 5
Arizona needs
a total of
1,087 full-time
primary care
and other
providers to
practice in
underserved
areas.Source: Arizona Department of Health Services, as of June 2014.
In Arizona, the restoration and expansion of Medicaid also plays into both supply and demand concerns for healthcare. As with the Patient Protection and Affordable Care Act, it is likely that there will be more Arizonans who will seek care from healthcare professionals as coverage increases.
Adding to these challenges, many regions of our state are defined as Medically Underserved Areas (AzMUAs) or Health Professional Shortage Areas (HPSAs).
A region is deemed medically underserved based on criteria such as the availability of services based on the population to primary care ratio; the area’s geographic accessibility to health-care services; and the percentage of the area’s population that is at or below a designated federal poverty level.12 Looking at the designation of medically unserved areas in Arizona (see Appendix II), the extent of the problem is clear: AzMUAs encompass most of Arizona’s geographic area, including the entirety of Apache, Cochise, Graham, Greenlee, La Paz, Navajo and Yuma counties. There are also AzMUAs in every county, including in the urban area of Maricopa County.
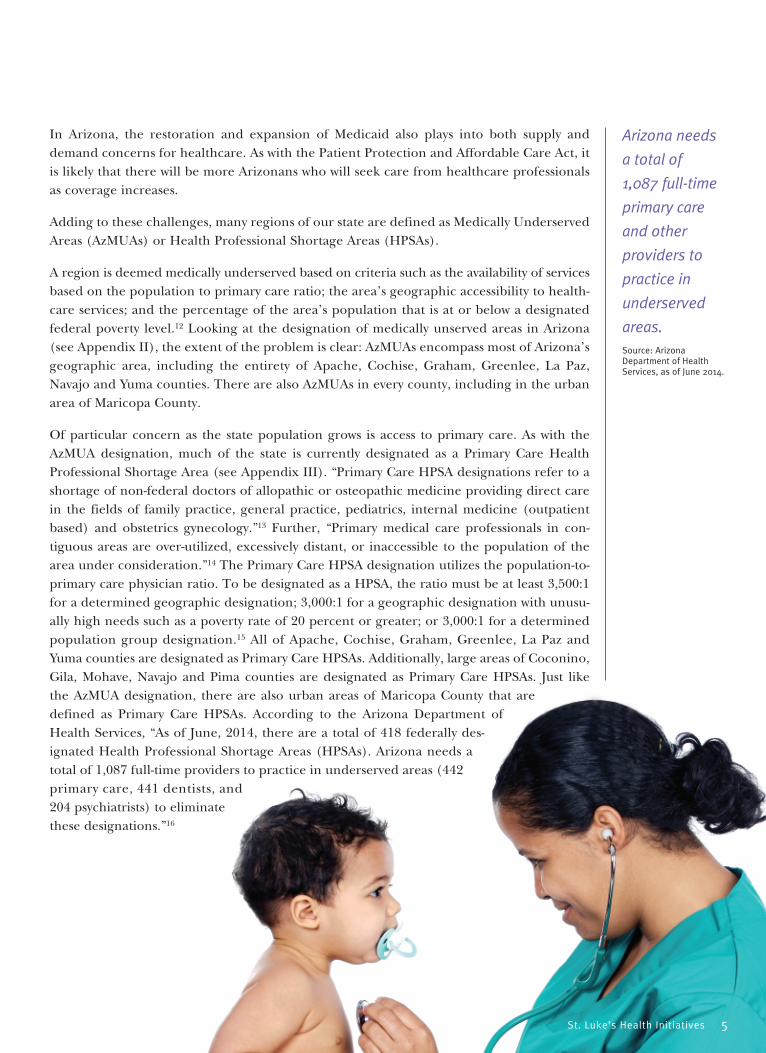
Of particular concern as the state population grows is access to primary care. As with the AzMUA designation, much of the state is currently designated as a Primary Care Health Professional Shortage Area (see Appendix III). “Primary Care HPSA designations refer to a shortage of non-federal doctors of allopathic or osteopathic medicine providing direct care in the fields of family practice, general practice, pediatrics, internal medicine (outpatient based) and obstetrics gynecology.”13 Further, “Primary medical care professionals in con-tiguous areas are over-utilized, excessively distant, or inaccessible to the population of the area under consideration.”14 The Primary Care HPSA designation utilizes the population-to-primary care physician ratio. To be designated as a HPSA, the ratio must be at least 3,500:1 for a determined geographic designation; 3,000:1 for a geographic designation with unusu-ally high needs such as a poverty rate of 20 percent or greater; or 3,000:1 for a determined population group designation.15 All of Apache, Cochise, Graham, Greenlee, La Paz and Yuma counties are designated as Primary Care HPSAs. Additionally, large areas of Coconino, Gila, Mohave, Navajo and Pima counties are designated as Primary Care HPSAs. Just like the AzMUA designation, there are also urban areas of Maricopa County that are defined as Primary Care HPSAs. According to the Arizona Department of Health Services, “As of June, 2014, there are a total of 418 federally des-ignated Health Professional Shortage Areas (HPSAs). Arizona needs a total of 1,087 full-time providers to practice in underserved areas (442 primary care, 441 dentists, and 204 psychiatrists) to eliminate these designations.”16
6 Health Workforce, Healthy Economy
A Closer Look at Workforce NeedsTo better understand specific workforce shortages by profession and geographic area, existing information from a variety of published sources was analyzed. Below you will find a summary of what we know (and by inference, what we don’t know) about workforce needs among various health professions.
Pharmacists and Pharmacy Technicians
Data indicates the number of Arizona pharmacists is increasing. However, with the state’s growing population – and specifically the growing, aging population – there is still concern that the number of licensed pharmacists will not be enough to meet demand.
As each section will demonstrate, when comparing workforce data, depending on the source or point-in-time measured, statistics can vary. However, the most recent data available provides:
• Pharmacy is the third-largest health profession in the U.S.17
• Per the Bureau of Labor Statistics (BLS), which bases its estimates on surveying estab-lishments covered by unemployment insurance, in 2012, Arizona had 5,260 pharmacists and 6,740 pharmacy technicians.18
• Per the Arizona State Board of Pharmacy, in 2011, there were 6,131 active, licensed pharmacists in Arizona, an increase of 11 percent from 2008; there also were 9,345 active, licensed pharmacy technicians in Arizona, an increase of 29 percent from 2008.19
While there are healthcare specialties seeing stagnation or loss, pharmacy is one specialty where growth is anticipated. One estimate projected a 23 percent growth in pharmacist positions between 2010 and 2020 with 240 anticipated annual openings in Arizona.20
An April 2009 report from the Center for Health Information & Research at Arizona State University cited U.S. Census data from 2006 that anticipated growth in the number of pharmacists in the 10 years between 2006 and 2016.21 However, even with this continued growth, a shortage was still considered possible.22 Driving this con-cern was the issue of “the growing and aging population, growth in prescription medication use, and (the) evolving role of pharmacists with more responsibility on disease medication management and patient counseling.”23
Data by County: Pharmacists
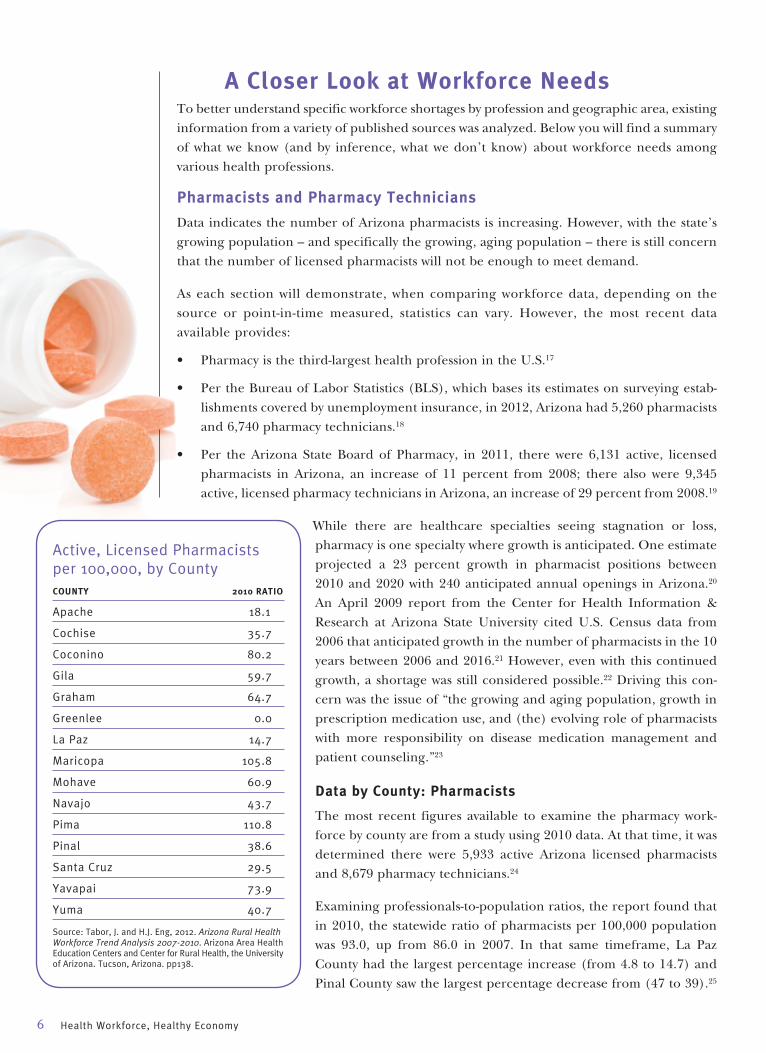
The most recent figures available to examine the pharmacy work-force by county are from a study using 2010 data. At that time, it was determined there were 5,933 active Arizona licensed pharmacists and 8,679 pharmacy technicians.24
Examining professionals-to-population ratios, the report found that in 2010, the statewide ratio of pharmacists per 100,000 population was 93.0, up from 86.0 in 2007. In that same timeframe, La Paz County had the largest percentage increase (from 4.8 to 14.7) and Pinal County saw the largest percentage decrease from (47 to 39).25
Active, Licensed Pharmacists per 100,000, by CountyCOUNTY 2010 RATIO
Apache 18.1
Cochise 35.7
Coconino 80.2
Gila 59.7
Graham 64.7
Greenlee 0.0
La Paz 14.7
Maricopa 105.8
Mohave 60.9
Navajo 43.7
Pima 110.8
Pinal 38.6
Santa Cruz 29.5
Yavapai 73.9
Yuma 40.7
Source: Tabor, J. and H.J. Eng, 2012. Arizona Rural Health Workforce Trend Analysis 2007-2010. Arizona Area Health Education Centers and Center for Rural Health, the University of Arizona. Tucson, Arizona. pp138.
St. Luke’s Health Initiatives 7
The shortage
of pharmacists
was the most
severe in rural
areas.
In 2008,
the statewide
ratio of
pharmacists
per 100,000
was 79.4,
compared to
a national
average of 79.5.
Source: Johnson WG, Wilson BL, Edge M, Qiu Y, Oliver EL, Russell KM. (April 2009). The Arizona health care workforce: nurses, pharmacists, & physician assistants. (Prepared under con-tract with the Arizona Hospital and Healthcare Association.) Phoenix, AZ: Center for Health Information & Research, Arizona State University.
National comparative data are limited, however, the national ratio in 2008 was reported as 79.5 per 100,000, which compared to an Arizona ratio of 79.4.26
This statewide assessment also determined that in 2010, 93.4 percent of pharmacists and 91 percent of pharmacy technicians were located in urban areas. Inequalities between counties were most pronounced when comparing Pima County, with 111 pharmacists per 100,000 population to Greenlee County, who had no practicing pharmacists from 2007 through 2010.27
Additionally, 2008 survey data indicated the state’s pharmacy workforce is younger, with a plurality of respondents aged 30 to 40.28 A 2009 report surveyed pharmacists and pharmacy technicians in Maricopa County and also found pharmacists in the county tended to be younger – with 54 percent 44 years or younger.29
Data by County: Pharmacy Technicians
The statewide ratio for pharmacy technicians per 100,000 increased from 112 in 2007 to 135 in 2010. Additionally, all counties saw an increase in the ratio for technicians in that timeframe. Greenlee County had the smallest ratio in 2010 at 23.9 and Maricopa had the largest at 155.1.30
Framing the Data
Trying to frame these workforce numbers can be difficult. However, a 2009 report examin-ing 2008 license renewal data stated, “The ratio of pharmacist to population in Arizona is higher than the national average and the predicted trend is for it to remain so. The increase may not however, represent a sufficient increase to offset increase in demand for services associated with the rapid aging of Arizona’s population.” This same assessment determined that the shortage of pharmacists was the most severe in rural areas.31 Using 2008 data, this study determined the statewide ratio of pharmacists per 100,000 was 79.4 compared to a national average of 79.5.32
This is demonstrative of the difficulty in identifying consistent data. The ratio of pharmacists identified in this report using 2008 data was 79.4,33 lower than the ratio of 86 pharmacists in 2007 from the 2010 workforce study.34
Projection data available published in 2009 estimated:
• Arizona’s ratio of pharmacists to residents will continue to be higher than the national through 2020; however
• When projecting the ratio of active pharmacists per 100,000 population age 65 or older, we fall behind the national average.35
Greenlee County had no practicing pharmacists from 2007 through 2010.Source: Tabor, J. and H.J. Eng, 2012. Arizona Rural Health Workforce Trend Analysis 2007-2010. Arizona Area Health Education Centers and Center for Rural Health, the University of Arizona. Tucson, Arizona. pp138.
8 Health Workforce, Healthy Economy
Nurses and Certified Nursing Assistants
Perhaps the most robust and conflicting data surrounds nursing. Up until recently, there was substantial concern about both a national and state nursing shortage, however more recent data indicate it is possible Arizona now could be experiencing a nursing surplus.
Nursing professionals include registered nurses (RNs), licensed practical nurses (LPNs) and advance practice nurses (APNs). Nurses serve in a variety of settings and in certain instances provide primary care. According to the most recent data on nursing professionals:
• Per administrative licensing data, in 2013 there were 65,213 RNs with active licenses in Arizona; 9,838 active LPNs; and 4,253 active APNs. This is a total nursing workforce of 79,304, and a 17 percent increase in the total workforce between 2008 and 2013.36
• According to BLS 2012 survey data, there were 45,600 RNs, 6,440 LPNs and licensed vocational nurses, 1,900 nurse practitioners and 440 nurse anesthetists.37
The Arizona State Board of Nursing (AZBN) tracks a variety of data on the nursing workforce to assess needs and opportunities. One item is nursing program enrollment, utilized to get a sense of the “pipeline” for nursing professionals. For calendar years 2007 through 2010, there was year-to-year growth in nursing enrollment for RNs and LPNs combined. Enrollment dipped slightly in 2011, but increased again in 2012 by 1.3 percent. Since 2010, total state-wide program enrollment has been at least 6,800 individuals.38
When examining the data more closely to compare RN to LPN enrollment, the AZBN found a slight increase in 2012 over 2011 in RN enrollments, which the Board described as “stagnant.” Meanwhile, there was a 22 percent decrease in LPN enrollments between 2011 and 2012.39 A component of this was the significant decrease in LPN program admissions those two years, resulting in the lowest enrollment since 2004.40
Data by County: RNs
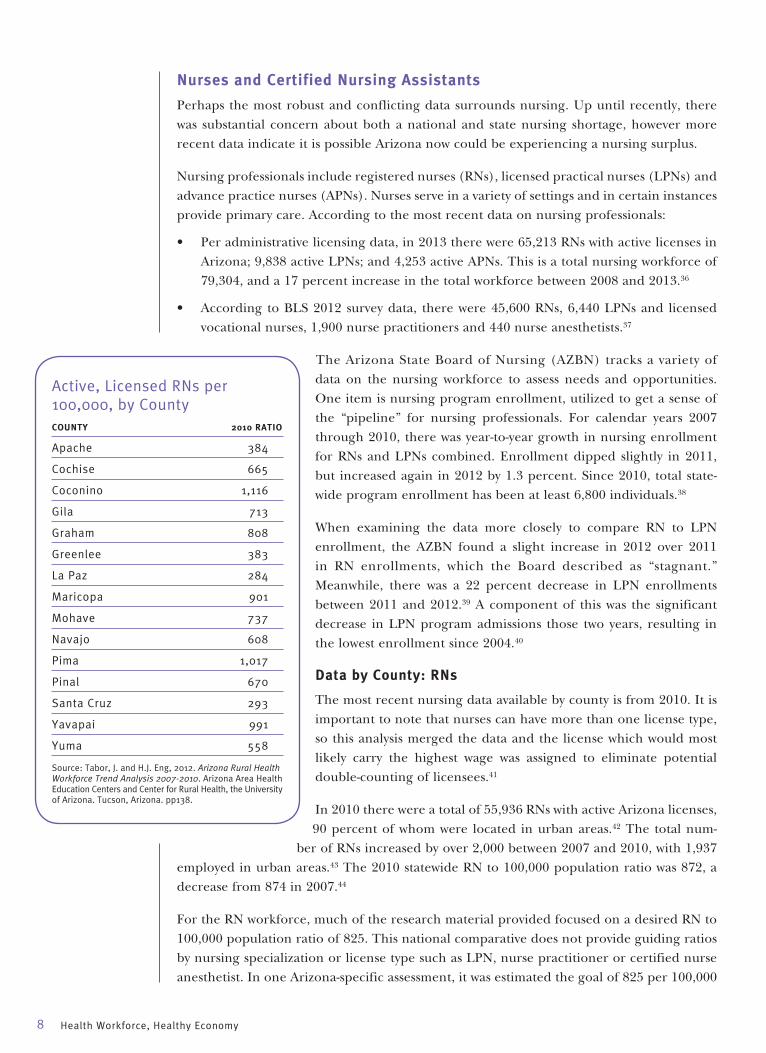
The most recent nursing data available by county is from 2010. It is important to note that nurses can have more than one license type, so this analysis merged the data and the license which would most likely carry the highest wage was assigned to eliminate potential double-counting of licensees.41
In 2010 there were a total of 55,936 RNs with active Arizona licenses, 90 percent of whom were located in urban areas.42 The total num-
ber of RNs increased by over 2,000 between 2007 and 2010, with 1,937 employed in urban areas.43 The 2010 statewide RN to 100,000 population ratio was 872, a decrease from 874 in 2007.44
For the RN workforce, much of the research material provided focused on a desired RN to 100,000 population ratio of 825. This national comparative does not provide guiding ratios by nursing specialization or license type such as LPN, nurse practitioner or certified nurse anesthetist. In one Arizona-specific assessment, it was estimated the goal of 825 per 100,000
Active, Licensed RNs per 100,000, by CountyCOUNTY 2010 RATIO
Apache 384
Cochise 665
Coconino 1,116
Gila 713
Graham 808
Greenlee 383
La Paz 284
Maricopa 901
Mohave 737
Navajo 608
Pima 1,017
Pinal 670
Santa Cruz 293
Yavapai 991
Yuma 558
Source: Tabor, J. and H.J. Eng, 2012. Arizona Rural Health Workforce Trend Analysis 2007-2010. Arizona Area Health Education Centers and Center for Rural Health, the University of Arizona. Tucson, Arizona. pp138.

Perhaps the
most robust
and conflicting
data surrounds
nursing. Up
until recently,
there was
substantial
concern about
both a national
and state
nursing
shortage.
However,
more recent
data indicate
it is possible
Arizona now
could be
experiencing
a nursing
surplus.
St. Luke’s Health Initiatives 9
population would be met by 2017.45 This goal was then adopted by the Arizona Hospital and Healthcare Association.46 Of note, once adopted, the national average ratio increased to 841.47
The study broke the state into four geographic classifications: urban, large rural town areas, small rural town areas and isolated rural town areas. Looking at the ratio of RNs to 100,000 population in 2010 by geographic classification showed:
• Urban: 922 RNs per 100,000
• Large rural town: 689 RNs per 100,000
• Small rural town: 570 RNs per 100,000
• Isolated small rural town: 377 RNs per 100,00048
These ratios demonstrate the additional challenge in recruiting and retaining healthcare professionals in rural areas, which encompass the vast geographic majority of Arizona.
Coconino County had the highest ratio per 100,000 with 1,116; La Paz County had the lowest at 284. Between 2007 and 2010, Pinal County experienced the largest decrease in RN-to-population ratio, while Greenlee County experienced the largest county increase in the ratio.49
Data by County: LPNs
For licensed practical nurses in 2010, 88 percent of the 8,846 practiced in urban areas. From 2007 to 2010 the study found the number of LPNs decreased by 676 statewide. The ratio of LPNs per 100,000 population dropped between 2007 and 2010 to 138 from 154.50 Further, La Paz was the only county that experienced an increase in their LPN-to-population ratio between 2007 and 2010.51
Data by County: APNs
Advanced practice nurses are RNs with additional training and licensure and can practice in a variety of settings. One study using 2008 renewal cycle data estimated that 92.5 percent of APNs work in direct patient care.52
The 2010 assessment by county examined four specific APN license types: certified registered nurse anesthetists (CRNAs); nurse practitioners (NPs); certified nurse midwives (CNMs); and clinical nurse specialists (CNSs).
Certified Registered Nurse Anesthetists: In 2010, there were 310 CRNAs statewide with active Arizona licenses. This is an increase of 50 CRNAs statewide between 2007 and 2010. The study found 85.5 percent of CRNAs were in urban areas, and the largest increase in CRNAs between 2007 and 2010 was also in urban areas at 24.4 percent.53 In 2010, the state-wide ratio for CRNAs was 4.8 per 100,000.54
Nurse Practitioners: In 2013, there were 3,068 NPs in the state, with the majority in urban areas.55 2013 survey data also indicated that many NPs are approaching retirement, with about 31 percent of survey respondents stating they were over age 55.56 Further, the 2013 assessment looked at NPs trained in the state and found “the yearly increase in Arizona NPs is only slightly due to the production and retention of Arizona-trained NPs. The steady annual increase in number of NPs licensed in Arizona is primarily from out-of-state recruit-ment.”57 One potential reason for this could be that Arizona is one of only 18 states that allow NPs to practice without physician supervision.58
10 Health Workforce, Healthy Economy
It’s not just the
sheer volume
of RNs that
should be
considered
when deter-
mining if there
is sufficient
supply. It is
also important
to consider
whether
available
nurses have
the right level
of training.
2010 data, which examine NPs by county, found nurse practitioners outnumbered physician assistants by more than 1,000 licensed individuals for a total of 2,957 NPs – an important comparative since both professions are critical to providing primary care, especially in rural areas.59 Between 2007 and 2010 the NP ratio rose from 37 to 46 per 100,000 statewide. Apache County saw the largest increase in its provider ratio.60 This compares to a 2013 provider-to-population ratio of 30 per 100,000,61 lower than the 2010 ratio, even though 2013 data indicates there were more NPs statewide than in 2010. A 2013 assessment found Arizona’s NP ratio of 30 per 100,000 to be lower than the national average of 58.62
However, another assessment of 2008 renewal data on APNs and NPs determined the ratio of nurse practitioners to population was higher in Arizona than the nation, while all other APN specialty groups were below the national average.63
In 2013, there were five Arizona NP programs approved by the AZBN and accredited.64
Certified Nurse Midwives: In 2013, there were 182 CNMs with an active license and practice address in Arizona.65 The 2013 data also indicated that retiring CNMs could be a future concern for healthcare delivery. Specifically, 70 percent of rural CNMs were age 55 or older and the ratio of CNMs is higher in rural areas. As a result, retirement of CNM professionals could have a disproportionate impact on rural communities.66 Additionally, Arizona has no in-state CNM training programs.67
To examine CNM data by county, 2010 data needs to be reviewed. In 2010, there were 140 certified nurse midwives statewide, with 85 percent located in urban areas.68 The statewide ratio was 11.1 to 100,000 women of childbearing age (15-44). There were no CNMs in the years between 2007 and 2010 in Gila, Greenlee, La Paz or Santa Cruz counties. Additionally, there were no CNMs in Cochise County 2007 through 2008 or in 2010.69
Clinical Nurse Specialists: In 2010, there were 122 CNSs statewide. The ratio of CNSs to 100,000 population was 1.9. The counties of Apache, Gila, Graham, Greenlee, La Paz, Santa Cruz and Yuma had no CNSs any of the four years from 2007 to 2010.70
Data by County: Certified Nursing Assistants
Certified Nursing Assistants (CNAs) are “persons who assist individuals with healthcare needs that are associated with daily living and provide bedside care, including basic nursing procedures, all under the supervision of an RN or LPN.”71
In 2010, there were 24,564 CNAs statewide and 81 percent were located in urban areas. There was a 16 percent increase in the number of CNAs between 2007 and 2010.72 The state-wide ratio in 2010 was 383 CNAs per 100,000 population.73 No national comparative ratio was found. Greenlee County had the largest population ratio increase in CNAs between 2007 and 2010 and the urban areas had lower CNA ratios than the other three geographic designations of large rural town, small rural town and isolated small rural town.74

St. Luke’s Health Initiatives 11
“The AZ RN
workforce
may be
educationally
unprepared
to meet future
health care
needs with
only 32.5
percent of
newly licensed
nurses edu-
cated at BSN
level and 54
percent of all
RNs educated
at the bach-
elor’s level
or higher, not
necessarily
in nursing.” Source: Randolph,
Pamela K. 2012. Arizona State Board of Nursing Summary and Analysis of Annual Reports from Arizona Nursing Education Programs Calendar Year 2012. Arizona State Board of Nursing.
Shortage or Surplus?
In 2004, HRSA stated that Arizona was 45th in the nation for nursing ratios.75 In 2012, the AZBN published the Arizona State Board of Nursing Summary and Analysis of Annual Reports
from Arizona Nursing Education Programs Calendar Year 2012. This summary addressed the size of the current and future RN workforce, noting a 166 percent increase in the number of graduates from RN programs between 2002 and 2012.76 However, AZBN noted that it is not just sheer volume of RNs that should be considered when determining if there is suf-ficient supply. The AZBN report cited research that recommends 80 percent of RNs have a baccalaureate degree and/or the minimum ratio of bachelor-level nurses to associate-level nurses should be 60/40.77 By either measure, in 2012 the AZBN concluded, “The AZ RN workforce may be educationally unprepared to meet future health care needs with only 32.5 percent of newly licensed nurses educated at BSN level and 54 percent of all RNs educated at the bachelor’s level or higher, not necessarily in nursing.”78 Additionally, approximately 45 percent of RNs have a bachelor degree or higher specifically in nursing.79
The report concluded: “There is expected to be a shortage of registered nurses in the Western states, including Arizona, within the next decade. Due to the complexity of health care, the nursing workforce must be educated beyond the associate-degree level.”80
However, while the AZBN expected a shortage as recently as 2012, in 2009 it received conflicting feedback about the supply and demand for RNs in the state. It is important to note, while data indicates a recognized increase in the number of individuals with active RN licenses, this does not necessarily translate into RNs employed directly in healthcare, or even actively engaged in the workforce.
In addition to admissions, enrollment and administrative data, the AZBN annually surveys all Arizona nurses recently licensed by exam. The survey was created in 2009 in response to national survey data that indicated new nurses were having difficulty finding employment. The Arizona report provided, “We recruited persons into the profession with promises of easy employment, job mobility and high salaries. Then the economy took an unprecedented nose-dive and suddenly we have an oversupply of novice nurses.”81 AZBN continued to survey newly licensed nurses and found:
• In 2010, 21 percent of respondents were not practicing. Length of licensure was a factor, with 67 percent of non-practicing nurses licensed three months or less. The reason most cited by non-practicing nurses (85 percent) was “not enough jobs for new RN grads in the area.”82
• In 2011, 17 percent of respondents were not practicing and 91 percent of those respon-dents indicated it was because of a lack of jobs.83
• In 2012, 21 percent of respondents were not practicing and 56 percent of those not practicing indicated it was because of a lack of jobs.84
After years of focus and effort to address a nursing shortage, a nursing workforce study pub-lished in December 2013 found “the predictions did not include the effects of the economic recession that began in 2007-2008,” and “the 2017 target ratio of 825 registered nurses per 100,000 population was reached in 2010 and continues to increase.”85 It is worth noting, that nursing shortages have tended to dissipate during times of economic downturn and often have returned when the economy improves.
12 Health Workforce, Healthy Economy
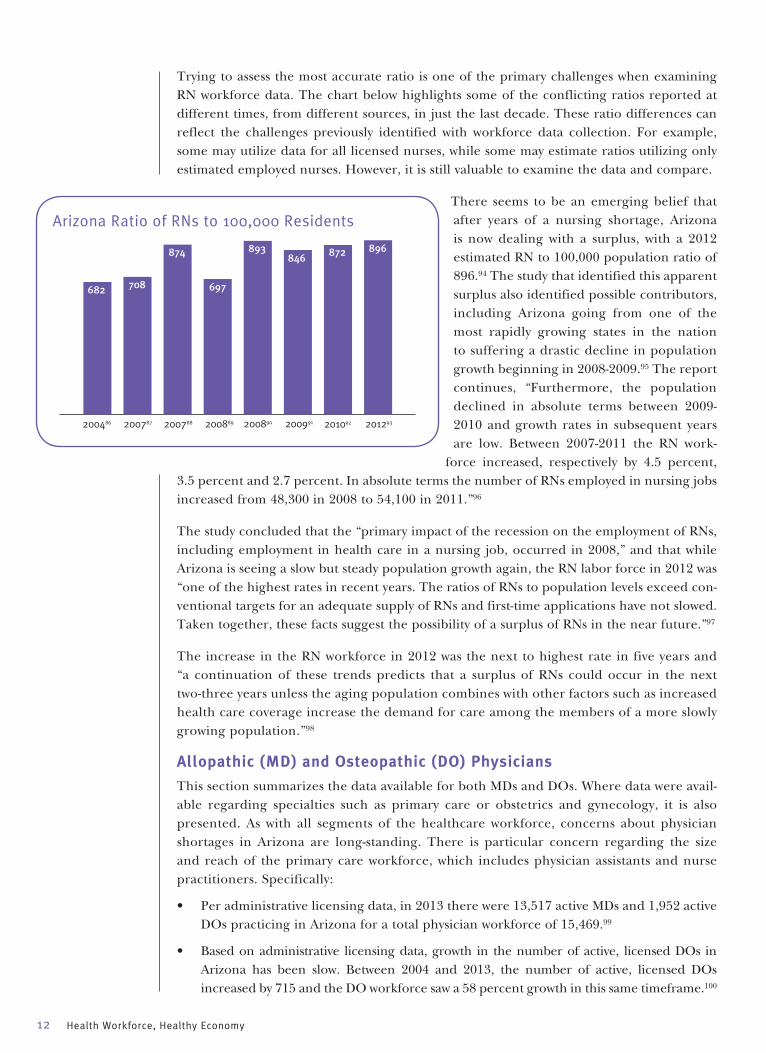
Trying to assess the most accurate ratio is one of the primary challenges when examining RN workforce data. The chart below highlights some of the conflicting ratios reported at different times, from different sources, in just the last decade. These ratio differences can reflect the challenges previously identified with workforce data collection. For example, some may utilize data for all licensed nurses, while some may estimate ratios utilizing only estimated employed nurses. However, it is still valuable to examine the data and compare.
There seems to be an emerging belief that after years of a nursing shortage, Arizona is now dealing with a surplus, with a 2012 estimated RN to 100,000 population ratio of 896.94 The study that identified this apparent surplus also identified possible contributors, including Arizona going from one of the most rapidly growing states in the nation to suffering a drastic decline in population growth beginning in 2008-2009.95 The report continues, “Furthermore, the population declined in absolute terms between 2009-2010 and growth rates in subsequent years are low. Between 2007-2011 the RN work-
force increased, respectively by 4.5 percent, 3.5 percent and 2.7 percent. In absolute terms the number of RNs employed in nursing jobs increased from 48,300 in 2008 to 54,100 in 2011.”96
The study concluded that the “primary impact of the recession on the employment of RNs, including employment in health care in a nursing job, occurred in 2008,” and that while Arizona is seeing a slow but steady population growth again, the RN labor force in 2012 was “one of the highest rates in recent years. The ratios of RNs to population levels exceed con-ventional targets for an adequate supply of RNs and first-time applications have not slowed. Taken together, these facts suggest the possibility of a surplus of RNs in the near future.”97
The increase in the RN workforce in 2012 was the next to highest rate in five years and “a continuation of these trends predicts that a surplus of RNs could occur in the next two-three years unless the aging population combines with other factors such as increased health care coverage increase the demand for care among the members of a more slowly growing population.”98
Allopathic (MD) and Osteopathic (DO) Physicians
This section summarizes the data available for both MDs and DOs. Where data were avail-able regarding specialties such as primary care or obstetrics and gynecology, it is also presented. As with all segments of the healthcare workforce, concerns about physician shortages in Arizona are long-standing. There is particular concern regarding the size and reach of the primary care workforce, which includes physician assistants and nurse practitioners. Specifically:
• Per administrative licensing data, in 2013 there were 13,517 active MDs and 1,952 active DOs practicing in Arizona for a total physician workforce of 15,469.99
• Based on administrative licensing data, growth in the number of active, licensed DOs in Arizona has been slow. Between 2004 and 2013, the number of active, licensed DOs increased by 715 and the DO workforce saw a 58 percent growth in this same timeframe.100
Arizona Ratio of RNs to 100,000 Residents
682 708
874
697
893846 872 896
200486 200787 200788 200889 200890 200991 201092 201293
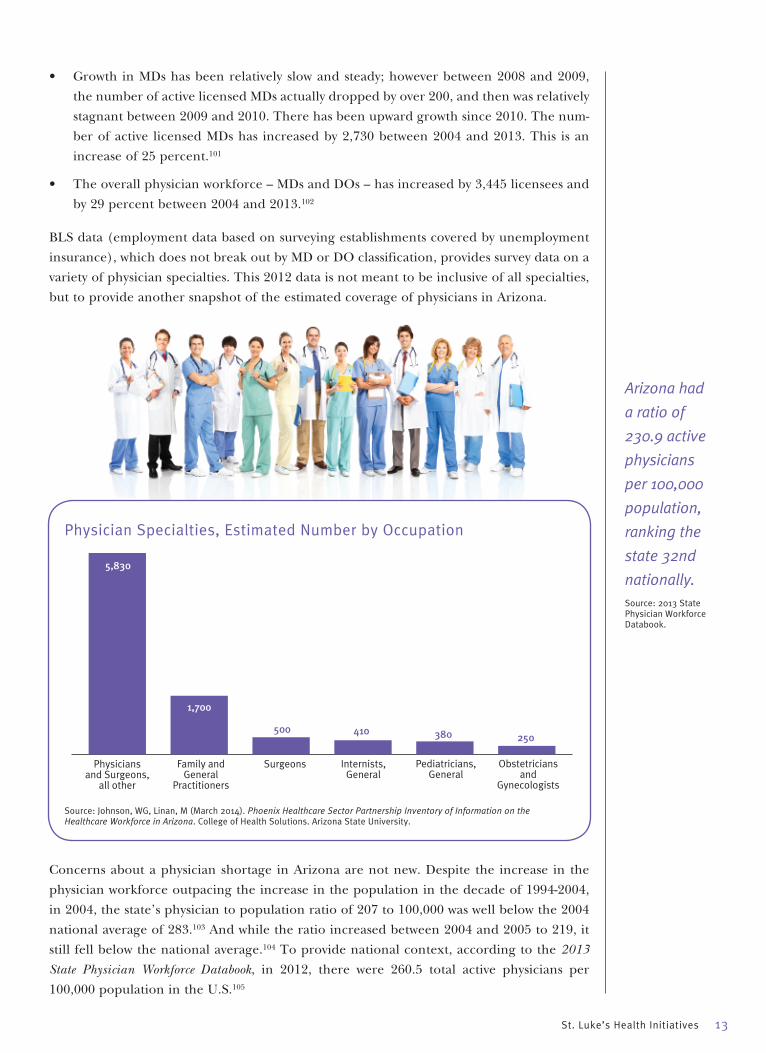
St. Luke’s Health Initiatives 13
• Growth in MDs has been relatively slow and steady; however between 2008 and 2009, the number of active licensed MDs actually dropped by over 200, and then was relatively stagnant between 2009 and 2010. There has been upward growth since 2010. The num-ber of active licensed MDs has increased by 2,730 between 2004 and 2013. This is an increase of 25 percent.101
• The overall physician workforce – MDs and DOs – has increased by 3,445 licensees and by 29 percent between 2004 and 2013.102
BLS data (employment data based on surveying establishments covered by unemployment insurance), which does not break out by MD or DO classification, provides survey data on a variety of physician specialties. This 2012 data is not meant to be inclusive of all specialties, but to provide another snapshot of the estimated coverage of physicians in Arizona.
Concerns about a physician shortage in Arizona are not new. Despite the increase in the physician workforce outpacing the increase in the population in the decade of 1994-2004, in 2004, the state’s physician to population ratio of 207 to 100,000 was well below the 2004 national average of 283.103 And while the ratio increased between 2004 and 2005 to 219, it still fell below the national average.104 To provide national context, according to the 2013
State Physician Workforce Databook, in 2012, there were 260.5 total active physicians per 100,000 population in the U.S.105
Physician Specialties, Estimated Number by Occupation
5,830
Physiciansand Surgeons,
all other
Family andGeneral
Practitioners
Surgeons Internists,General
Pediatricians,General
Obstetriciansand
Gynecologists
1,700
500 410 380 250
Source: Johnson, WG, Linan, M (March 2014). Phoenix Healthcare Sector Partnership Inventory of Information on the Healthcare Workforce in Arizona. College of Health Solutions. Arizona State University.
Arizona had
a ratio of
230.9 active
physicians
per 100,000
population,
ranking the
state 32nd
nationally.Source: 2013 State Physician Workforce Databook.

14 Health Workforce, Healthy Economy
Data by County: MDs and DOs
In 2004, physician shortages were most acute in rural communities. Pima County’s physi-cian-to-population ratio was 276 to 100,000 population, compared to Apache County, which experienced a coverage ratio of 48 to 100,000.106 Disparities continued in 2005, with a ratio of 292 in Pima County compared to 50 in Apache County.107
Examining 2010 data provides the capacity to look at licensees more recently by geographic area. Using this data, it was calculated that in 2010, there were 14,839 physicians with active Arizona licenses.108 Between 2007 and 2010, allopathic physicians had a greater increase in numbers, but a smaller percentage increase when compared to osteopathic doctors.109 Additionally, 92 percent of physicians were located in urban areas.110
Examining the physician to 100,000 population ratio in 2010, it was estimated there were 231.4 physicians for every 100,000 Arizonans statewide.111 From 2007 to 2010, Pinal County experienced the larg-est decrease in ratio and Apache County had the largest increase in ratio. In 2010, Pima County had a ratio of 301 at the high end and Pinal County had the lowest at 56.8.112
Framing the Data
To provide national context, according to the 2013 State Physician Workforce Databook, in 2012 there were 260.5 total active physicians per 100,000 population in the U.S.113 Arizona had a ratio of 230.9 per 100,000, ranking the state 32nd nationally.114 The national rate of physicians in active patient care was 225.6 per 100,000 in 2012; Arizona had an estimated rate of 206.6, ranking Arizona 31st nationally.115
Another concern is the lack of homegrown physicians. The concern is not the quality of out-of-state-trained physicians, but instead the lost economic opportunity to create high-paying jobs for Arizona residents. In 2004, approximately 90 percent of Arizona allopathic doctors were not trained in Arizona.116 In 2008, nearly 31 percent of Arizona primary care physicians were foreign-trained.117 The 2013 State Physician Workforce Databook estimated that nationally 24.1 percent of physicians were International Medical Graduates; the Arizona estimate was 22.9 percent, ranking the state 16th nationally.118
Another concern is the lack of homegrown physicians. The state concern is not the quality
of out-of-state-trained physicians, but instead the lost economic opportunity to create high-paying
jobs for Arizona residents.
Sources: Johnson, WG, Rimsza M, Garcy A, Grossman M. 2005. The Arizona physician workforce study part 1: The numbers of practicing physicians 1992-2004. Tempe (AZ). Center for Health Information & Research, Arizona State University.
Active, Licensed Physicians per 100,000, by Geographic ClassificationCLASSIFICATION 2010 RATIO
Urban 250.3
Large Rural Town 151.4
Small Rural Town 119.8
Isolated Small Rural Town 69.9
Source: Tabor, J. and H.J. Eng, 2012. Arizona Rural Health Workforce Trend Analysis 2007-2010. Arizona Area Health Education Centers and Center for Rural Health, the University of Arizona. Tucson, Arizona. pp138.
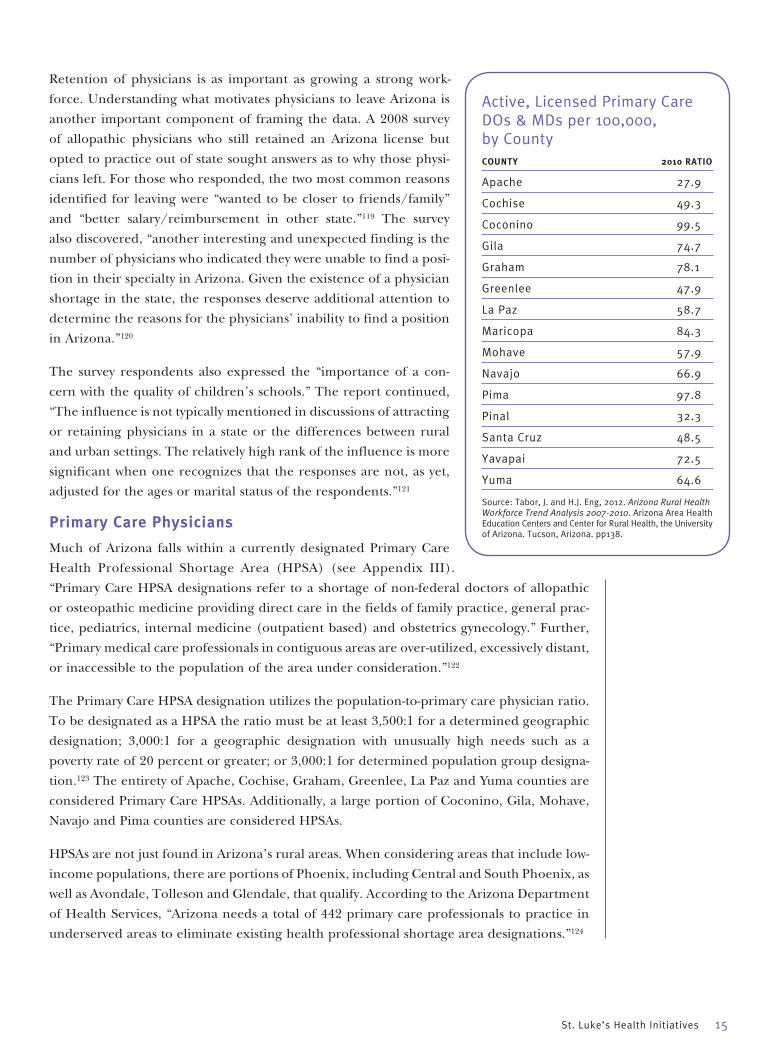
St. Luke’s Health Initiatives 15
Retention of physicians is as important as growing a strong work-force. Understanding what motivates physicians to leave Arizona is another important component of framing the data. A 2008 survey of allopathic physicians who still retained an Arizona license but opted to practice out of state sought answers as to why those physi-cians left. For those who responded, the two most common reasons identified for leaving were “wanted to be closer to friends/family” and “better salary/reimbursement in other state.”119 The survey also discovered, “another interesting and unexpected finding is the number of physicians who indicated they were unable to find a posi-tion in their specialty in Arizona. Given the existence of a physician shortage in the state, the responses deserve additional attention to determine the reasons for the physicians’ inability to find a position in Arizona.”120
The survey respondents also expressed the “importance of a con-cern with the quality of children’s schools.” The report continued, “The influence is not typically mentioned in discussions of attracting or retaining physicians in a state or the differences between rural and urban settings. The relatively high rank of the influence is more significant when one recognizes that the responses are not, as yet, adjusted for the ages or marital status of the respondents.”121
Primary Care Physicians
Much of Arizona falls within a currently designated Primary Care Health Professional Shortage Area (HPSA) (see Appendix III). “Primary Care HPSA designations refer to a shortage of non-federal doctors of allopathic or osteopathic medicine providing direct care in the fields of family practice, general prac-tice, pediatrics, internal medicine (outpatient based) and obstetrics gynecology.” Further, “Primary medical care professionals in contiguous areas are over-utilized, excessively distant, or inaccessible to the population of the area under consideration.”122
The Primary Care HPSA designation utilizes the population-to-primary care physician ratio. To be designated as a HPSA the ratio must be at least 3,500:1 for a determined geographic designation; 3,000:1 for a geographic designation with unusually high needs such as a poverty rate of 20 percent or greater; or 3,000:1 for determined population group designa-tion.123 The entirety of Apache, Cochise, Graham, Greenlee, La Paz and Yuma counties are considered Primary Care HPSAs. Additionally, a large portion of Coconino, Gila, Mohave, Navajo and Pima counties are considered HPSAs.
HPSAs are not just found in Arizona’s rural areas. When considering areas that include low-income populations, there are portions of Phoenix, including Central and South Phoenix, as well as Avondale, Tolleson and Glendale, that qualify. According to the Arizona Department of Health Services, “Arizona needs a total of 442 primary care professionals to practice in underserved areas to eliminate existing health professional shortage area designations.”124
Active, Licensed Primary Care DOs & MDs per 100,000, by CountyCOUNTY 2010 RATIO
Apache 27.9
Cochise 49.3
Coconino 99.5
Gila 74.7
Graham 78.1
Greenlee 47.9
La Paz 58.7
Maricopa 84.3
Mohave 57.9
Navajo 66.9
Pima 97.8
Pinal 32.3
Santa Cruz 48.5
Yavapai 72.5
Yuma 64.6
Source: Tabor, J. and H.J. Eng, 2012. Arizona Rural Health Workforce Trend Analysis 2007-2010. Arizona Area Health Education Centers and Center for Rural Health, the University of Arizona. Tucson, Arizona. pp138.

16 Health Workforce, Healthy Economy
Looking at the primary care workforce a decade ago, it was estimated that in 2004, approx-imately 41 percent of Arizona’s doctors were primary care physicians.125 No national com-parative was provided. In 2008, survey data estimated that the percentage of physicians practicing in primary care remained relatively unchanged from 2004.126 Specifically, “Based on our surveys, the percent of physicians in primary care increased from 37.4 percent in 2004 to 39.3 percent in 2008. However, the percent of physicians in primary care ranges from 40 percent to 41 percent if both MDs and DOs in primary care are included.”127 In 2008, this percentage translated to approximately 6,300 doctors.128
By 2010, it was estimated nearly a third of all Arizona physicians practiced in primary care – a total of 5,106 professionals.129 At that time, there were almost twice as many non-primary care doctors compared to primary care physicians.130 Between 2007 and 2010, there was a greater increase in the number of non-primary care doctors compared to primary care – 620 non-primary care compared to 554 primary care.131 No national comparative was found.
Physician assistants (PAs) and nurse practitioners (NPs) can, and often do, provide primary care, especially in rural communities. Between 2007 and 2010, the percent growth in both numbers and coverage for PAs and NPs was more than double primary care doctors.132 Between 2007 and 2010, there was a 12 percent increase in the number of primary care physicians.133
Data by County: Primary Care Physicians
Primary care coverage is of particular concern for rural areas. In 2010, 89 percent of primary care doctors served in urban areas and there were 79.6 primary care doctors per 100,000 statewide.134 The disparities between the counties were notable, with Coconino County having the highest ratio at 99.5 primary care doctors per 100,000; and Apache County the lowest at 27.9.135
Framing the Data: Primary Care Doctors
Examining primary care data is becoming even more important as the demand for primary care services are likely to increase as new models of healthcare delivery are implemented.
Even though the 2007 to 2010 data comparisons pointed to growth in the number of primary care physicians in Arizona, 2012 data indicated coverage may be decreasing:
• The number of osteopathic primary care doctors per 100,000 was static between 2006 and 2010; the ratio also decreased from 14.6 per 100,000 in 2010 to 14.2 in 2011.136
• The number of non-primary care DOs per 100,000 residents exceeded the ratio for primary care DOs for the first time in 2011.137 However, it is important to note, “the 2006 to 2010 static trend does not appear for primary care and non-primary care allo-pathic physicians.”138
To provide national context, according to the 2013 State Physician Workforce Databook, in 2012, there were 90.1 primary care physicians per 100,000.139 Arizona had a ratio of 79.2 primary care physicians per 100,000, ranking 36th.140 The national rate of primary care doctors in active patient care per 100,000 was 80.7.141 Arizona’s rate was 72.1, ranking 37th nationally.142
Primary care
coverage is of
particular con-
cern for rural
areas. In 2010,
89 percent of
primary care
doctors served
in urban areas
and there were
79.6 primary
care doctors
per 100,000
population
statewide.Source: Tabor, J. and H.J. Eng, 2012. Arizona Rural Health Workforce Trend Analysis 2007-2010. Arizona Area Health Education Centers and Center for Rural Health, the University of Arizona. Tucson, Arizona. pp138.

The national
rate of
primary care
doctors
in active
patient care
per 100,000
population
was 80.7.
Arizona’s rate
was 72.1,
ranking 37th
nationally.Source: 2013 State Physician Workforce Databook.
St. Luke’s Health Initiatives 17
Data by County: Non-Primary Care Doctors & Specialists
In 2010, the Arizona ratio of non-primary care doctors to 100,000 population was 151.8 per 100,000; markedly higher than the 2010 primary care physician ratio of 79.6.143 Additionally, in 2010, 93 percent of non-primary care doctors were located in urban areas.144 County specific data include:
• Between 2007 and 2010, Cochise County had the largest percentage decrease in ratio for non-primary care doctors and Graham County had the largest increase. In 2010, Pima County had the largest ratio at 203.1 per 100,000; Pinal County had the lowest at 24.5.145
• In 2010 there were a total of 784 obstetrics and gynecology physicians in Arizona.146 For OB/GYNs the ratio utilized was the number of OB/GYNs per 100,000 women of child-bearing age (15-44). Using this metric, statewide the ratio rose from 60.2 to 62.0 per 100,000 women of childbearing age between 2007 and 2010.147
• The counties experiencing the largest decreases in OB/GYN to population ratio were Apache and Cochise; the counties with the largest increases were Pinal and Graham.148 Examining individual county ratios in 2010, the county with the highest ratio of OB/GYNs to women of child-bearing age was Coconino at 73.1 per 100,000; the lowest was Greenlee County, who had zero OB/GYNs every year from 2007 through 2010.149
Physician Assistants
Physician assistants (PAs) serve a growing role in providing primary care. Specifically, “physician assistants are a very important component of the health care workforce since they disproportionately practice in rural areas, partially compensating for the pronounced shortage of physicians in these areas.”150
According to national data referenced in a 2009 state workforce study, it is estimated that “nationally approximately 37 percent of PAs practiced in primary care in 2008.”151 2013 data provided by the American Academy of Physician Assistants (AAPA) Annual Survey estimated Arizona PA specialties. No corresponding national survey data were provided. The AAPA estimated that 47.3 percent of Arizona PAs practiced in a physician group or solo practice.152
PA data is provided below, starting with the most recent, for years 2008 and 2010-2013. There appears to be some inconsistencies – certain years appear to have fewer PAs than prior years – however, all years are presented to provide the broadest insight into PA data.
Arizona’s ratio of non-primary care doctors to 100,000 population was 151.8 per 100,000; markedly higher than the 2010 primary care physician ratio of 79.6.Source: Tabor, J. and H.J. Eng, 2012. Arizona Rural Health Workforce Trend Analysis 2007-2010. Arizona Area Health Education Centers and Center for Rural Health, the University of Arizona. Tucson, Arizona. pp138.
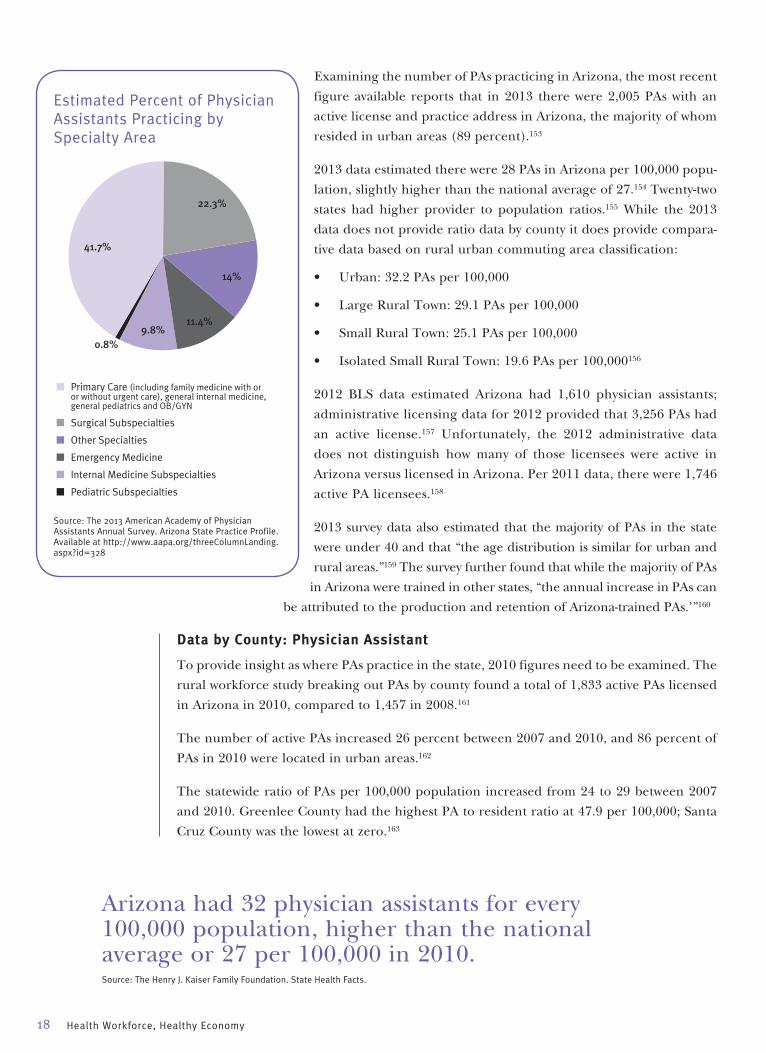
18 Health Workforce, Healthy Economy
Examining the number of PAs practicing in Arizona, the most recent figure available reports that in 2013 there were 2,005 PAs with an active license and practice address in Arizona, the majority of whom resided in urban areas (89 percent).153
2013 data estimated there were 28 PAs in Arizona per 100,000 popu-lation, slightly higher than the national average of 27.154 Twenty-two states had higher provider to population ratios.155 While the 2013 data does not provide ratio data by county it does provide compara-tive data based on rural urban commuting area classification:
• Urban: 32.2 PAs per 100,000
• Large Rural Town: 29.1 PAs per 100,000
• Small Rural Town: 25.1 PAs per 100,000
• Isolated Small Rural Town: 19.6 PAs per 100,000156
2012 BLS data estimated Arizona had 1,610 physician assistants; administrative licensing data for 2012 provided that 3,256 PAs had an active license.157 Unfortunately, the 2012 administrative data does not distinguish how many of those licensees were active in Arizona versus licensed in Arizona. Per 2011 data, there were 1,746 active PA licensees.158
2013 survey data also estimated that the majority of PAs in the state were under 40 and that “the age distribution is similar for urban and rural areas.”159 The survey further found that while the majority of PAs
in Arizona were trained in other states, “the annual increase in PAs can be attributed to the production and retention of Arizona-trained PAs.’”160
Data by County: Physician Assistant
To provide insight as where PAs practice in the state, 2010 figures need to be examined. The rural workforce study breaking out PAs by county found a total of 1,833 active PAs licensed in Arizona in 2010, compared to 1,457 in 2008.161
The number of active PAs increased 26 percent between 2007 and 2010, and 86 percent of PAs in 2010 were located in urban areas.162
The statewide ratio of PAs per 100,000 population increased from 24 to 29 between 2007 and 2010. Greenlee County had the highest PA to resident ratio at 47.9 per 100,000; Santa Cruz County was the lowest at zero.163
Estimated Percent of Physician Assistants Practicing by Specialty Area
Source: The 2013 American Academy of Physician Assistants Annual Survey. Arizona State Practice Profile. Available at http://www.aapa.org/threeColumnLanding.aspx?id=328
41.7%
22.3%
14%
11.4%9.8%
0.8%
■ Primary Care (including family medicine with or or without urgent care), general internal medicine, general pediatrics and OB/GYN
■ Surgical Subspecialties
■ Other Specialties
■ Emergency Medicine
■ Internal Medicine Subspecialties
■ Pediatric Subspecialties
Arizona had 32 physician assistants for every 100,000 population, higher than the national average or 27 per 100,000 in 2010.Source: The Henry J. Kaiser Family Foundation. State Health Facts.

St. Luke’s Health Initiatives 19
Framing the Data
Citing national projections, the Center for Health Information & Research at Arizona State University in 2009 indicated that after a rapid expansion of PAs that stabilized in the 1990s, “the number of PAs entering the workforce is expected to increase by 27 percent by the year 2016 (Occupational Outlook Handbook, 2008-2009 Edition, 2007).”164 Utilizing 2010 data, State Health Facts estimated Arizona had 32 physician assistants for every 100,000 population, higher than the national average of 27 per 100,000.165 While the state average is higher than the national, this may be because these health professionals are serving to fill gaps in areas where health shortages exist, particularly areas experiencing primary care physician shortages.
In 2013, there were three accredited PA programs in the state, namely the Arizona School of Health Sciences, Midwestern University, and Northern Arizona University.166
Psychiatrists, Psychologists and Behavioral Health Professionals
There is no question Arizona is experiencing a statewide shortage in mental health and behavioral health providers. However, specific data on this segment of the healthcare workforce is limited. According to the state’s Mental Health Professional Shortage Areas map (see Appendix IV), the entire state of Arizona is currently designated as a shortage area.
Psychiatrists
The data on the number of licensed Arizona psychiatrists can vary depending on the source. Per BLS data for Arizona, in 2012 there were 500 psychiatrists employed statewide. The data also identified 1,350 psychiatric technicians employed.167
Beyond the high-level estimates provided by BLS, the most recent assessment of the size of the state’s psychiatric workforce examined health professionals by county. This report found:
• There were 748 licensed active psychiatric physicians statewide in 2010, 36 more psychiatrists than in 2007.168
• In 2010, 94 percent were located in urban areas, with both Graham and La Paz counties having no active psychiatrist.169
• The statewide ratio of psychiatrists per 100,000 population increased from 11.5 in 2007 to 11.7 in 2010.170
• Pima County had the highest ratio in 2010 at 18.9. Also, from 2007 to 2010, six of Arizona’s 15 counties saw a decrease in the ratio of psychiatrists to population.171
Data from 2004 indicates that this segment of the healthcare workforce has fallen behind the pace of population growth. A 2004 report of the statewide psychiatric workforce found there were 691 active psychiatrists statewide and a statewide ratio of 12.03 psychiatrists per 100,000 population.172 While the total number of psychiatrists increased between 2004 and 2008, the ratio decreased.
The most recent national comparative was for the year 2000, with a professional to popula-tion ratio of 16.5 psychiatrists per 100,000.173 This is higher than Arizona’s 2010 ratio.
According to the Arizona Department of Health Services, “Arizona needs a total of 204 psychiatrists to practice in underserved areas to eliminate the medically underserved area, medically underserved population and health professional shortage designations.”174
There is no
question
Arizona is
experiencing
a statewide
shortage in
mental health
and behavioral
health
providers.

20 Health Workforce, Healthy Economy
Psychologists
The most recent data on psychologists is from 2010, when there were 1,424 licensed active psychologists.175 This was nearly double the number of 2010 licensed active psychiatrists identified in the same report.176
This study also found 95 percent of psychologists were in urban areas and there was an increase statewide of only two psychologists between 2007 and 2010.177 During this same timeframe, the ratio of psychologists per 100,000 decreased from 23 to 22.2.178
As with many of the healthcare professions discussed in this summary, there were notable inequalities among Arizona’s counties. For example, in 2010, Coconino County’s ratio of psychologists to population was 55 per 100,000; Greenlee and La Paz counties had no psychologists.179
Behavioral Health Professionals
According to a 2012 performance audit of the Arizona Board of Behavioral Health Examiners conducted by the Office of the Auditor General, in May of 2012 there were 8,639 active behavioral health licensees.180 There are ten license types issued by the board in four areas: counseling, marriage and family therapy, social work and substance abuse counseling.181 Specifically:
• Counseling licensees, including associate and professional counselor: 3,167
• Marriage and family therapy licensees, including associate and marriage and family therapist: 445
• Social work licensees, including bachelor, master and clinical social worker: 3,405
• Substance abuse counseling licensees, including substance abuse technician, associate substance abuse counselor and independent substance abuse counselor: 1,622182
Unfortunately, the 2012 data is not broken out geographically. The only data provided to do so examined behavioral health professionals by county in 2002. At that time there were 5,545 behavioral health professionals statewide.183 In 2002, 82 percent of behavioral health professionals were in urban counties and there were 101.32 behavioral health professionals per 100,000 population statewide.184 No national comparative was provided.
Dentists and Dental Hygienists
While discussions regarding healthcare access may often fail to mention oral health, access to consistent preventative dental care, as well as treatment when needed, is part of overall health.
Dentists
The Dental Health Professional Shortage Areas (HPSA) map (see Appendix V) shows a sizable portion of the state’s geographic area is currently designated as a Dental HPSA, including the entirety of Graham, Greenlee, La Paz, Santa Cruz and Yuma counties. According to the Arizona Department of Health Services, “Arizona needs a total of 441 dentists to practice in underserved areas to eliminate existing dental health professional shortage area designations.”185
Per BLS numbers for Arizona, in 2012, there were a total of 2,440 general dentists employed statewide; 130 orthodontists; and 140 dentists comprising all other specialties.186 The data also identified 3,390 dental hygienists. Additionally, there were 6,160 dental assistants.187

St. Luke’s Health Initiatives 21
Data by County: Dentists
The most recent assessment examining dental services by county uses 2010 data. One particular issue with the data on dental health providers that the report authors identified was a change in 2010 in the way licensees reported information on multiple practice locations. In the past, dentists could report practicing in more than one place allowing for “more precise estimates of workforce coverage, especially in rural areas.” In 2010, the board data only provided one practice location. This didn’t impact statewide reporting, but did impact finer geographic reporting with “under-reporting in rural areas likely” because dentists often work at more than one location.188
In 2010, there were 3,558 active licensed dentists with a dip in the number of licensed dentists between 2009 and 2010 – a decrease of 75 licensees – after an increase of 101 licensees between 2007 and 2009.189
In 2010, 92 percent of dentists reported working in urban areas.190 Specifically, 91 percent of general dentists and 96 percent of spe-cialist dentists practiced in urban areas.191 The study estimated that statewide coverage for all dentists “peaked” in 2009 at 57 per 100,000, and dropped to 55.5 per 100,000 in 2010.192 The National Center for Health Statistics estimated Arizona had 54.7 dentists per 100,000 in 2010, but did not provide a national comparative.193
Coconino County had the highest ratio in 2010 at 76.5 per 100,000; La Paz County had the lowest at 4.9.194 Eleven counties saw a percentage drop in the ratio of dentists to population from 2007 to 2010, with La Paz experiencing the largest drop at 66.4 percent.195 The four counties experiencing growth between 2007 and 2010 were Coconino, Greenlee, Maricopa and Yavapai.196
In 2010, 82 percent of active dentists were general and the ratio of general dentists to population was 45.3 per 100,000. The ratio of specialist dentists to population was 10.2 per 100,000.197 Greenlee County had no specialist dentists in the years 2007 through 2010 and La Paz County had no specialist dentists 2008 through 2010.198
Dental Hygienists199
There were 3,200 active hygienists licensed in Arizona in 2010, with 91.4 percent located in urban areas. The number of licensed hygienists increased by 362 between 2007 and 2010, with a 2010 statewide ratio of 50 to 100,000 population. Apache County had the greatest percentage increase in the hygienist ratio at 94 percent with a 2010 ratio of 14.0. Coconino County had the highest ratio in 2010 at 77.2 hygienists per 100,000; La Paz and Greenlee counties had no dental hygienists.
A sizable portion of the state’s geographic area is currently designated as a Dental HPSA,
including the entirety of Graham, Greenlee, La Paz, Santa Cruz and Yuma counties.Source: Arizona Department of Health Services
Active, Licensed Dentists per 100,000, by CountyCOUNTY 2010 RATIO
Apache 16.7
Cochise 31.9
Coconino 76.5
Gila 35.5
Graham 51.2
Greenlee 23.9
La Paz 4.9
Maricopa 64.5
Mohave 36.0
Navajo 38.1
Pima 54.1
Pinal 22.9
Santa Cruz 16.9
Yavapai 51.2
Yuma 21.4
Source: Tabor, J. and H.J. Eng, 2012. Arizona Rural Health Workforce Trend Analysis 2007-2010. Arizona Area Health Education Centers and Center for Rural Health, the University of Arizona. Tucson, Arizona. pp138.
22 Health Workforce, Healthy Economy
Physical Therapists and Assistants and Occupational Therapists and Assistants
Physical and occupational therapists, two specialties within the allied healthcare workforce, are professionals whose services will continue to increase in demand as Arizona’s population grows and ages.
Physical Therapists and Physical Therapist Assistants
In 2010, there were an estimated 3,610 physical therapists in Arizona.200 Physical therapy is a profession that is expected to see significant growth, with a projected 38 percent increase in employment opportunities in the decade between 2010 and 2020 and a projected 180 job openings annually in Arizona.201 The median annual salary for Arizona physical therapists in 2013 was $77,000.202
BLS 2012 survey data estimated there were 4,040 physical therapists licensed in Arizona.203 BLS 2012 survey data also estimated there were 870 physical therapist assistants.204
That same estimate of 870 physical therapist assistants was cited by an additional source in 2010, with a projected 40 percent increase in employment opportunities between 2010 and 2020.205 It is also estimated there will be 50 annual projected job openings for physical therapist assistants in Arizona.206 The median annual salary for Arizona physical therapist assistants in 2013 was $44,500, nearly $9,000 less than the national average.207
Occupational Therapists and Occupational Therapist Assistants
In 2010, there were an estimated 1,630 occupational therapists (OTs) in Arizona.208 Like physical therapy, occupational therapy is a profession that is expected to see growth in employment opportunities, with a projected 26 percent increase in the decade between 2010 and 2020 and a projected 70 job openings annually in Arizona.209 The median annual salary for Arizona occupational therapists in 2013 was $76,700.210
BLS 2012 data estimated a smaller number of occupational therapists, with a total of 1,180.211 BLS survey data also estimated a total of 460 occupational therapist assistants in Arizona in 2012.212
2010 estimates for the number of occupational therapist assistants determined there were approximately 210 in Arizona.213 However, as with physical therapist assistants, occupational therapist assistants are expected to see growth in employment opportunities, with an esti-mated increase of 30 percent from 2010 to 2020, with 10 projected openings annually.214 The median salary in 2013 for an occupational therapist assistant in Arizona was $43,500, nearly $12,000 less than the national average.215
The only occupational therapy program at a state university in Arizona is at Northern Arizona
University. NAU is also the only Arizona program offering an Occupational Therapy Doctoral (OTD)
degree. According to data provided by NAU, Arizona’s OT-to-resident ratio is substantially lower
than the national average. The OT national ratio is 1 to 2,485; Arizona’s rate is 1 to 3,523.
Source: Provided by Dr. Patricia Crist, July 2, 2014. Source provided by The National Board for Certification in Occupational Therapy.
Framing the Data
Currently, the only occupational therapy program at a state university in Arizona is at Northern Arizona University. NAU is also the only Arizona program offering an Occupational Therapy Doctoral (OTD) degree. According to data provided by NAU, Arizona’s OT-to-resident ratio is substantially lower than the national average. The OT national ratio is 1 to 2,485; Arizona’s rate is 1 to 3,523.216
Emergency Medical Technicians (EMTs)
EMTs, including EMT-Basic, EMT-Intermediate and EMT-Paramedic are licensed by the Arizona Department of Health Services. According to BLS data, there were 3,650 EMTs and paramedics in Arizona in 2012.217 Another source estimated that in 2010 there were 3,580 EMTs and paramedics in Arizona. In the decade between 2010 and 2020, EMT and paramedic employment opportunity is expected to increase 44 percent, with an estimated annual 230 job openings in Arizona.218
The most recent geographic data on EMTs is from 2010. Due to data limitations, the levels of EMT licensure could not be broken out, so numbers are for all EMT levels. Additionally, due to data errors the authors had to use 2006 and 2008 data to interpolate 2007 figures.
Specifically, in 2010 there were 16,619 certified EMTs in Arizona.219 It is estimated the num-ber of EMTs increased by 1,368 between 2007 and 2010.220 This is a substantially different figure than the 2012 number reported by BLS, which estimated Arizona had approximately 12,950 fewer EMTs in 2012 than this study identified in 2010. However, as previously noted, licensing data and BLS data measure workforce differently.
Using licensing data, the ratio of EMTs per 100,000 Arizona population increased from 247 in 2007 to 259 in 2010.221 No national comparison was found. Additionally:
• 80.5 percent of EMTs in 2010 were located in urban areas;
• Coconino County had the highest ratio at 516 per 100,000; Apache had the lowest at 174;
• Four counties experienced a decrease in the ratio of EMTs between 2007 and 2010, with Coconino experiencing the largest decline at 3.6 percent; and
• Mohave County experienced the largest increase in the EMT to popu-lation ratio at 15.5 percent.222
St. Luke’s Health Initiatives 23
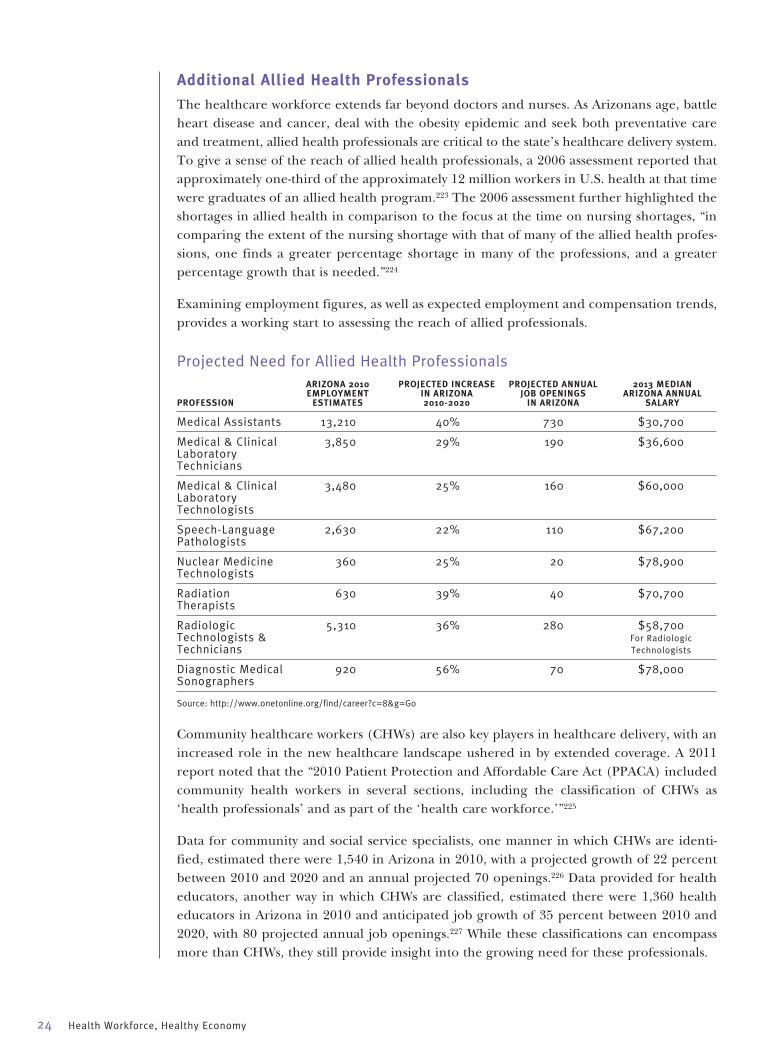
24 Health Workforce, Healthy Economy
Additional Allied Health Professionals
The healthcare workforce extends far beyond doctors and nurses. As Arizonans age, battle heart disease and cancer, deal with the obesity epidemic and seek both preventative care and treatment, allied health professionals are critical to the state’s healthcare delivery system. To give a sense of the reach of allied health professionals, a 2006 assessment reported that approximately one-third of the approximately 12 million workers in U.S. health at that time were graduates of an allied health program.223 The 2006 assessment further highlighted the shortages in allied health in comparison to the focus at the time on nursing shortages, “in comparing the extent of the nursing shortage with that of many of the allied health profes-sions, one finds a greater percentage shortage in many of the professions, and a greater percentage growth that is needed.”224
Examining employment figures, as well as expected employment and compensation trends, provides a working start to assessing the reach of allied professionals.
Projected Need for Allied Health Professionals ARIZONA 2010 PROJECTED INCREASE PROJECTED ANNUAL 2013 MEDIAN EMPLOYMENT IN ARIZONA JOB OPENINGS ARIZONA ANNUAL PROFESSION ESTIMATES 2010-2020 IN ARIZONA SALARY
Medical Assistants 13,210 40% 730 $30,700
Medical & Clinical 3,850 29% 190 $36,600 Laboratory Technicians
Medical & Clinical 3,480 25% 160 $60,000 Laboratory Technologists
Speech-Language 2,630 22% 110 $67,200 Pathologists
Nuclear Medicine 360 25% 20 $78,900 Technologists
Radiation 630 39% 40 $70,700 Therapists
Radiologic 5,310 36% 280 $58,700 Technologists & For Radiologic Technicians Technologists
Diagnostic Medical 920 56% 70 $78,000 Sonographers
Source: http://www.onetonline.org/find/career?c=8&g=Go
Community healthcare workers (CHWs) are also key players in healthcare delivery, with an increased role in the new healthcare landscape ushered in by extended coverage. A 2011 report noted that the “2010 Patient Protection and Affordable Care Act (PPACA) included community health workers in several sections, including the classification of CHWs as ‘health professionals’ and as part of the ‘health care workforce.’”225
Data for community and social service specialists, one manner in which CHWs are identi-fied, estimated there were 1,540 in Arizona in 2010, with a projected growth of 22 percent between 2010 and 2020 and an annual projected 70 openings.226 Data provided for health educators, another way in which CHWs are classified, estimated there were 1,360 health educators in Arizona in 2010 and anticipated job growth of 35 percent between 2010 and 2020, with 80 projected annual job openings.227 While these classifications can encompass more than CHWs, they still provide insight into the growing need for these professionals.
Final ThoughtsThis summary pulled together a variety of best-estimate data to provide insight into different sectors of the healthcare workforce, including numbers, reach and geographic location. It is important to acknowledge that data by nature lags. Therefore, the most recent assessment information available likely does not reflect the current point-in-time. Going forward, pro-fessionals, educators and policymakers need to have access to more frequent, accurate and comparable data regarding the healthcare workforce. Policymakers need to explore more permanent solutions to maintaining this ongoing data collection and assessment.
It is also important to acknowledge Arizona was substantially affected by the Great Recession. We fell faster and are taking longer to recover than many other states. As a result, it is still unclear what long-term population and employment trends may be.
However, growing and supporting the healthcare workforce remain primary tools that Arizona can use to stimulate and stabilize economic development. The value of this data, however incomplete and inexact, is in assessing supply and demand for healthcare. Decisions and planning can be made accordingly to fill existing gaps and anticipate new ones.
There are many looming questions related to the healthcare workforce and our state’s future, and economic development factors are just one of them. Arizona’s population is diverse, with a large component of aging residents and a booming segment of young, minority residents. More Arizonans now have healthcare coverage of some kind and more Arizonans are going to want, and need, access to care. The critical question is, will there be enough professionals to provide it?
St. Luke’s Health Initiatives 25
26 Health Workforce, Healthy Economy
1 Wilson BL, Johnson WG. July/August (2009). Using innova-tion to assess nursing workforce in Arizona: a collaborative approach. Nursing Economics. 27(4): 233-238.
2 Census.gov. Arizona Quick Facts. http://Quickfacts.census.gov/qfd/states/04000.html
3 Tabor, J., Jennings, N., Kohler, L., Degnan, B., Derksen, D., Campos-Outcalt, D. and Eng. H. 2014. The Supply of Physician Assistants, Nurse Practitioners, and Certified Nurse Midwives in Arizona. Arizona Area Health Education Centers and Mel and Enid Zuckerman College of Public Health, Center for Rural Health. pp1-80.
4 Census.gov. Arizona Quick Facts. http://Quickfacts.census.gov/qfd/states/04000.html
5 Tabor, J. and H.J. Eng, 2012. Arizona Rural Health Workforce Trend Analysis 2007-2010. Arizona Area Health Education Centers and Center for Rural Health, the University of Arizona. Tucson, Arizona. pp138.
6 Ibid.
7 Census.gov. Arizona Quick Facts. http://Qiuckfacts.census.gov/qfd/states/04000.html
8 Tabor, J. and H.J. Eng, 2012. Arizona Rural Health Workforce Trend Analysis 2007-2010. Arizona Area Health Education Centers and Center for Rural Health, the University of Arizona. Tucson, Arizona. pp138.
9 Ibid.
10 Ibid.
11 L. Ku, E. Jones, P. Shin, F. R. Byrne, S. K. Long. Safety-Net Providers After Health Care Reform: Lessons From Massachusetts. Archives of Internal Medicine, 2011; 171 (15): 1379 DOI: 10.1001/archinternmed.2011.317
12 Arizona Department of Health Services. Note: The Arizona Department of Health Services estimates a new AzMUA map will be available October 1, 2014.
13 Arizona Department of Health Services.
14 Ibid.
15 Ibid.
16 Provided by T. Lenartz, Arizona Department of Health Services.
17 Johnson, WG, Wilson BL, Edge M, Qiu Y, Oliver EL, Russell KM (April 2009). The Arizona health care workforce: nurses, pharmacists & physician assistants. (Prepared under con-tract with the Arizona Hospital and Healthcare Association.) Phoenix, AZ. Center for Health Information & Research, Arizona State University.
18 Johnson, WG, Linan, M (March 2014). Phoenix Healthcare Sector Partnership Inventory of Information on the Healthcare Workforce in Arizona. College of Health Solutions. Arizona State University.
19 Ibid.
20 National Center for O*NET Development. 29-1051.00. O*NET OnLine. Retrieved July 11, 2014, from http://www.oneton-line.org/link/summary/29-1051.00
21 Johnson, WG, Wilson BL, Edge M, Qiu Y, Oliver EL, Russell KM (April 2009). The Arizona health care workforce: nurses, pharmacists & physician assistants. (Prepared under con-tract with the Arizona Hospital and Healthcare Association.) Phoenix, AZ. Center for Health Information & Research, Arizona State University.
22 Ibid.
23 Ibid.
24 Tabor, J. and H.J. Eng, 2012. Arizona Rural Health Workforce Trend Analysis 2007-2010. Arizona Area Health Education Centers and Center for Rural Health, the University of Arizona. Tucson, Arizona. pp138.
25 Ibid.
26 Johnson WG, Wilson BL, Edge M, Qiu Y, Oliver EL, Russell KM. (April 2009). The Arizona health care workforce: nurses, pharmacists, & physician assistants. (Prepared under con-tract with the Arizona Hospital and Healthcare Association.) Phoenix, AZ: Center for Health Information & Research, Arizona State University.
27 Tabor, J. and H.J. Eng, 2012. Arizona Rural Health Workforce Trend Analysis 2007-2010. Arizona Area Health Education Centers and Center for Rural Health, the University of Arizona. Tucson, Arizona. pp138.
28 Johnson WG, Wilson BL, Edge M, Qiu Y, Oliver EL, Russell KM. (April 2009). The Arizona health care workforce: nurses, pharmacists, & physician assistants. (Prepared under con-tract with the Arizona Hospital and Healthcare Association.) Phoenix, AZ: Center for Health Information & Research, Arizona State University.
29 Johnson WG, Wilson BL, Harootunian G, Qiu Y, Sama TL. (December 2010). Health care workforce data report: nurs-ing and pharmacy in Maricopa county. Phoenix (AZ): Arizona State University, Center for Health Information & Research.
30 Tabor, J. and H.J. Eng, 2012. Arizona Rural Health Workforce Trend Analysis 2007-2010. Arizona Area Health Education Centers and Center for Rural Health, the University of Arizona. Tucson, Arizona. pp138.
31 Johnson WG, Wilson BL, Edge M, Qiu Y, Oliver EL, Russell KM. (April 2009). The Arizona health care workforce: nurses, pharmacists, & physician assistants. (Prepared under con-tract with the Arizona Hospital and Healthcare Association.) Phoenix, AZ: Center for Health Information & Research, Arizona State University.
32 Ibid.
33 Ibid.
34 Tabor, J. and H.J. Eng, 2012. Arizona Rural Health Workforce Trend Analysis 2007-2010. Arizona Area Health Education Centers and Center for Rural Health, the University of Arizona. Tucson, Arizona. pp138.
35 Johnson WG, Wilson BL, Edge M, Qiu Y, Oliver EL, Russell KM. (April 2009). The Arizona health care workforce: nurses, pharmacists, & physician assistants. (Prepared under con-tract with the Arizona Hospital and Healthcare Association.) Phoenix, AZ: Center for Health Information & Research, Arizona State University.
36 Johnson, WG, Linan, M (March 2014). Phoenix Healthcare Sector Partnership Inventory of Information on the Healthcare Workforce in Arizona. College of Health Solutions. Arizona State University.
37 Ibid.
38 Randolph, Pamela K. 2012. Arizona State Board of Nursing Summary and Analysis of Annual Reports From Arizona Nursing Education Programs Calendar Year 2012. Arizona State Board of Nursing.
39 Ibid.
40 Ibid.
41 Tabor, J. and H.J. Eng, 2012. Arizona Rural Health Workforce Trend Analysis 2007-2010. Arizona Area Health Education Centers and Center for Rural Health, the University of Arizona. Tucson, Arizona. pp138.
42 Ibid.
43 Ibid.
44 Ibid.
45 Johnson WG, Wilson BL, Edge M, Qiu Y, Oliver EL, Russell KM. (April 2009). The Arizona health care workforce: nurses, pharmacists, & physician assistants. (Prepared under con-tract with the Arizona Hospital and Healthcare Association.) Phoenix, AZ: Center for Health Information & Research, Arizona State University.
Endnotes
46 Johnson WG, Harootunian G. (December 2013). What hap-pened to the shortage of registered nurses: the Arizona experience 2008-2012. Phoenix, AZ: Center for Health Information & Research (Prepared for Arizona Hospital and Healthcare Association).
47 Ibid.
48 Tabor, J. and H.J. Eng, 2012. Arizona Rural Health Workforce Trend Analysis 2007-2010. Arizona Area Health Education Centers and Center for Rural Health, the University of Arizona. Tucson, Arizona. pp138.
49 Ibid.
50 Ibid.
51 Ibid.
52 Johnson WG, Wilson BL, Edge M, Qiu Y, Oliver EL, Russell KM. (April 2009). The Arizona health care workforce: nurses, pharmacists, & physician assistants. (Prepared under con-tract with the Arizona Hospital and Healthcare Association.) Phoenix, AZ: Center for Health Information & Research, Arizona State University.
53 Tabor, J. and H.J. Eng, 2012. Arizona Rural Health Workforce Trend Analysis 2007-2010. Arizona Area Health Education Centers and Center for Rural Health, the University of Arizona. Tucson, Arizona. pp138.
54 Ibid.
55 Tabor, J., Jennings, N., Kohler, L., Degnan, B., Derksen, D., Campos-Outcalt, D. and Eng. H. 2014. The Supply of Physician Assistants, Nurse Practitioners, and Certified Nurse Midwives in Arizona. Arizona Area Health Education Centers and Mel and Enid Zuckerman College of Public Health, Center for Rural Health. pp1-80.
56 Ibid.
57 Ibid.
58 Ibid.
59 Tabor, J. and H.J. Eng, 2012. Arizona Rural Health Workforce Trend Analysis 2007-2010. Arizona Area Health Education Centers and Center for Rural Health, the University of Arizona. Tucson, Arizona. pp138.
60 Ibid.
61 Tabor, J., Jennings, N., Kohler, L., Degnan, B., Derksen, D., Campos-Outcalt, D. and Eng. H. 2014. The Supply of Physician Assistants, Nurse Practitioners, and Certified Nurse Midwives in Arizona. Arizona Area Health Education Centers and Mel and Enid Zuckerman College of Public Health, Center for Rural Health. pp1-80.
62 Ibid.
63 Johnson WG, Wilson BL, Edge M, Qiu Y, Oliver EL, Russell KM. (April 2009). The Arizona health care workforce: nurses, pharmacists, & physician assistants. (Prepared under con-tract with the Arizona Hospital and Healthcare Association.) Phoenix, AZ: Center for Health Information & Research, Arizona State University.
64 Tabor, J., Jennings, N., Kohler, L., Degnan, B., Derksen, D., Campos-Outcalt, D. and Eng. H. 2014. The Supply of Physician Assistants, Nurse Practitioners, and Certified Nurse Midwives in Arizona. Arizona Area Health Education Centers and Mel and Enid Zuckerman College of Public Health, Center for Rural Health. pp1-80.
65 Ibid.
66 Ibid.
67 Ibid.
68 Tabor, J. and H.J. Eng, 2012. Arizona Rural Health Workforce Trend Analysis 2007-2010. Arizona Area Health Education Centers and Center for Rural Health, the University of Arizona. Tucson, Arizona. pp138.
69 Ibid.
70 Ibid.
71 Ibid.
72 Ibid.
73 Ibid.
74 Ibid.
75 Wilson BL, Johnson WG. July/August (2009). Using innova-tion to assess nursing workforce in Arizona: a collaborative approach. Nursing Economics. 27(4): 233-238.
76 Randolph, Pamela K. 2012. Arizona State Board of Nursing Summary and Analysis of Annual Reports From Arizona Nursing Education Programs Calendar Year 2012. Arizona State Board of Nursing.
77 Ibid.
78 Ibid.
79 Ibid.
80 Ibid.
81 Randolph, Pamela K. 2010. Arizona State Board of Nursing Employment of Newly Licensed RNs.
82 Ibid.
83 Randolph, Pamela K. 2011. Arizona State Board of Nursing Employment of Newly Licensed RNs.
84 Randolph, Pamela K. 2012. Arizona State Board of Nursing Employment of Newly Licensed RNs.
85 Johnson WG, Harootunian G. (December 2013). What hap-pened to the shortage of registered nurses: the Arizona experience 2008-2012. Phoenix, AZ: Center for Health Information & Research (Prepared for Arizona Hospital and Healthcare Association).
86 Johnson WG, Wilson BL, Edge M, Qiu Y, Oliver EL, Russell KM. (April 2009). The Arizona health care workforce: nurses pharmacists, & physician assistants. (Prepared under con-tract with the Arizona Hospital and Healthcare Association.) Phoenix, AZ: Center for Health Information & Research, Arizona State University.
87 Ibid.
88 Tabor, J. and H.J. Eng, 2012. Arizona Rural Health Workforce Trend Analysis 2007-2010. Arizona Area Health Education Centers and Center for Rural Health, the University of Arizona. Tucson, Arizona. pp138.
89 Johnson WG, Wilson BL, Edge M, Qiu Y, Oliver EL, Russell KM. (April 2009). The Arizona health care workforce: nurses pharmacists, & physician assistants. (Prepared under con-tract with the Arizona Hospital and Healthcare Association.) Phoenix, AZ: Center for Health Information & Research, Arizona State University.
90 Tabor, J. and H.J. Eng, 2012. Arizona Rural Health Workforce Trend Analysis 2007-2010. Arizona Area Health Education Centers and Center for Rural Health, the University of Arizona. Tucson, Arizona. pp138.
91 Ibid.
92 Ibid.
93 Johnson WG, Harootunian G. (December 2013). What hap-pened to the shortage of registered nurses: the Arizona experience 2008-2012. Phoenix, AZ: Center for Health Information & Research (Prepared for Arizona Hospital and Healthcare Association).
94 Ibid.
95 Ibid.
96 Ibid.
97 Ibid.
98 Ibid.
99 Johnson, WG, Linan, M (March 2014). Phoenix Healthcare Sector Partnership Inventory of Information on the Healthcare Workforce in Arizona. College of Health Solutions. Arizona State University.
100 Ibid.
101 Ibid.
102 Ibid.
St. Luke’s Health Initiatives 27
28 Health Workforce, Healthy Economy
103 Johnson, WG, Rimsza M, Garcy A, Grossman M. 2005. The Arizona physician workforce study part I: The numbers of practicing physicians 1992-2004. Tempe (AZ). Center for Health Information & Research, Arizona State University.
104 Rimsza M, Johnson WG, Speicher M, Grossman M. (2006). The Arizona physician workforce study: part II 1994-2005.
105 2013 State Physician Workforce Databook.
106 Johnson WG, Rimsza M, Garcy A, Grossman M. 2005. The Arizona physician workforce study part I: The numbers of practicing physicians 1992-2004. Tempe (AZ): Center for Health Information & Research, Arizona State University.
107 Rimsza M, Johnson WG, Speicher M, Grossman M. (2006). The Arizona physician workforce study: part II 1994-2005.
108 Tabor, J. and H.J. Eng, 2012. Arizona Rural Health Workforce Trend Analysis 2007-2010. Arizona Area Health Education Centers and Center for Rural Health, the University of Arizona. Tucson, Arizona. pp138.
109 Ibid.
110 Ibid.
111 Ibid.
112 Ibid.
113 2013 State Physician Workforce Databook.
114 Ibid.
115 Ibid.
116 Johnson, WG, Rimsza M, Garcy A, Grossman M. 2005. The Arizona physician workforce study part I: The numbers of practicing physicians 1992-2004. Tempe (AZ). Center for Health Information & Research, Arizona State University.
117 Qiu, Y, Johnson, WG, August 2009. Arizona primary care workforce report. (Prepared by the Center for Health Information & Research, Biomedicine @ Arizona State University under Contract No 09104502.) Phoenix, AZ: St. Luke’s Health Initiatives.
118 2013 State Physician Workforce Databook.
119 Johnson, WG, Bannister WM, Russell KM, Edge M, Gray H, Merritt R. (June 2008). Arizona physician trends: reasons for leaving Arizona. Phoenix (AZ). Arizona State University, Center for Health Information & Research.
120 Ibid.
121 Ibid.
122 Arizona Department of Health Services.
123 Ibid.
124 Provided by T. Lenartz, Arizona Department of Health Services.
125 Johnson, WG, Rimsza M, Garcy A, Grossman M. 2005. The Arizona physician workforce study part I: The numbers of practicing physicians 1992-2004. Tempe (AZ). Center for Health Information & Research, Arizona State University.
126 Qiu, Y, Johnson WG, August 2009. Arizona primary care workforce report. (Prepared by the Center for Health Information & Research, Biomedicine @Arizona State University under Contract No 09104502.) Phoenix, AZ. St. Luke’s Health Initiatives.
127 Ibid.
128 Ibid.
129 Tabor, J. and H.J. Eng, 2012. Arizona Rural Health Workforce Trend Analysis 2007-2010. Arizona Area Health Education Centers and Center for Rural Health, the University of Arizona. Tucson, Arizona. pp138.
130 Ibid.
131 Ibid.
132 Ibid.
133 Ibid.
134 Ibid.
135 Ibid.
136 Ibid.
137 Ibid.
138 Ibid.
139 2013 State Physician Workforce Databook.
140 Ibid.
141 Ibid.
142 Ibid.
143 Tabor, J. and H.J. Eng, 2012. Arizona Rural Health Workforce Trend Analysis 2007-2010. Arizona Area Health Education Centers and Center for Rural Health, the University of Arizona. Tucson, Arizona. pp138.
144 Ibid.
145 Ibid.
146 Ibid.
147 Ibid.
148 Ibid.
149 Ibid.
150 Johnson, WG, Wilson BL, Edge, M, Qiu Y, Oliver EL, Russell KM. (April 2009). The Arizona health care workforce: nurses, pharmacists, & physicians assistants. (Prepared under con-tract with the Arizona Hospital and Healthcare Association.) Phoenix, AZ: Center for Health Information & Research, Arizona State University.
151 Qiu Y, Johnson WG, August 2009. Arizona primary care work-force report. (Prepared by the Center for Health Information & Research, Biomedicine @ Arizona State University under Contract No 09104502.) Phoenix, AZ: St. Luke’s Health Initiatives, citing American Academy of Physician Assistants.
152 The 2013 American Academy of Physician Assistants Annual Survey. Arizona State Practice Profile. Available at http://www.aapa.org/threeColumnLanding.aspx?id=328
153 Tabor, J., Jennings, N. Kohler, L., Degnan, B., Derksen, D., Campos-Outcalt, D. and Eng. H. 2014. The Supply of Physician Assistants, Nurse Practitioners, and Certified Nurse Midwives in Arizona. Arizona Area Health Education Centers and Mel and Enid Zuckerman College of Public Health, Center for Rural Health. pp1-80.
154 Ibid.
155 Ibid.
156 Ibid.
157 Johnson, WG, Linan, M (March 2014). Phoenix Healthcare Sector Partnership Inventory of Information on the Healthcare Workforce in Arizona. College of Health Solutions. Arizona State University.
158 Ibid.
159 Tabor, J., Jennings, N. Kohler, L., Degnan, B., Derksen, D., Campos-Outcalt, D. and Eng. H. 2014. The Supply of Physician Assistants, Nurse Practitioners, and Certified Nurse Midwives in Arizona. Arizona Area Health Education Centers and Mel and Enid Zuckerman College of Public Health, Center for Rural Health. pp1-80.
160 Ibid.
161 Tabor, J. and H.J. Eng, 2012. Arizona Rural Health Workforce Trend Analysis 2007-2010. Arizona Area Health Education Centers and Center for Rural Health, the University of Arizona. Tucson, Arizona. pp138.
162 Ibid.
163 Ibid.
164 Johnson, WG, Wilson BL, Edge, M, Qiu Y, Oliver EL, Russell KM. (April 2009). The Arizona health care workforce: nurses, pharmacists, & physicians assistants. (Prepared under con-tract with the Arizona Hospital and Healthcare Association.) Phoenix, AZ: Center for Health Information & Research, Arizona State University. Referencing Occupational Outlook Handbook, 2008-2009 Edition, 2007.
165 The Henry J. Kaiser Family Foundation. State Health Facts. http://kff.org/other/state-indicator/physician-assistants-per-100000-pop/
166 Tabor, J., Jennings, N. Kohler, L., Degnan, B., Derksen, D., Campos-Outcalt, D. and Eng. H. 2014. The Supply of Physician Assistants, Nurse Practitioners, and Certified Nurse Midwives in Arizona. Arizona Area Health Education Centers and Mel and Enid Zuckerman College of Public Health, Center for Rural Health. pp1-80.
167 Johnson, WG, Linan, M (March 2014). Phoenix Healthcare Sector Partnership Inventory of Information on the Healthcare Workforce in Arizona. College of Health Solutions. Arizona State University.
168 Tabor, J. and H.J. Eng, 2012. Arizona Rural Health Workforce Trend Analysis 2007-2010. Arizona Area Health Education Centers and Center for Rural Health, the University of Arizona. Tucson, Arizona. pp138.
169 Ibid.
170 Ibid.
171 Ibid.
172 Rimsza, M.E., Johnson, W.G., Speicher, M., Grossman, M. (2005). The Arizona psychiatric physician workforce study. Tempe (AZ). Arizona State University, Center for Health Information and Research.
173 Ibid.
174 Provided by T. Lenartz, Arizona Department of Health Services.
175 Tabor, J. and H.J. Eng, 2012. Arizona Rural Health Workforce Trend Analysis 2007-2010. Arizona Area Health Education Centers and Center for Rural Health, the University of Arizona. Tucson, Arizona. pp138.
176 Ibid.
177 Ibid.
178 Ibid.
179 Ibid.
180 State of Arizona Office of the Auditor General. Performance Audit and Sunset Review: Arizona Board of Behavioral Health Examiners. Report No. 12-03. August 2012.
181 Ibid.
182 Ibid.
183 Eng, Howard J., Julie Jacobs, and Jennifer Peashock. “Arizona Rural Health Plan 2005-2007,” December 2004, pp.1-96.
184 Ibid.
185 Provided by T. Lenartz, Arizona Department of Health Services.
186 Johnson, WG, Linan, M (March 2014). Phoenix Healthcare Sector Partnership Inventory of Information on the Healthcare Workforce in Arizona. College of Health Solutions. Arizona State University.
187 Ibid.
188 Tabor, J. and H.J. Eng, 2012. Arizona Rural Health Workforce Trend Analysis 2007-2010. Arizona Area Health Education Centers and Center for Rural Health, the University of Arizona. Tucson, Arizona. pp138.
189 Ibid.
190 Ibid.
191 Ibid.
192 Ibid.
193 Health Indicators Warehouse. http://www.healthindicators.gov/Indicators/Dentist-rate-per-100000_130/Profile/Chart
194 Tabor, J. and H.J. Eng, 2012. Arizona Rural Health Workforce Trend Analysis 2007-2010. Arizona Area Health Education Centers and Center for Rural Health, the University of Arizona. Tucson, Arizona. pp138.
195 Ibid.
196 Ibid.
197 Ibid.
198 Ibid.
199 Ibid.
200 National Center for O*NET Development. 29-1123.00. O*NET OnLine. Retrieved July 12, 2014, from http://www.oneton-line.org/link/summary/29-1123.00
201 Ibid.
202 Ibid.
203 Johnson, WG, Linan, M (March 2014). Phoenix Healthcare Sector Partnership Inventory of Information on the Healthcare Workforce in Arizona. College of Health Solutions. Arizona State University.
204 Ibid.
205 National Center for O*NET Development. 31-2021.00. O*NET OnLine. Retrieved July 12, 2014, from http://www.oneton-line.org/link/summary/31-2021.00
206 Ibid.
207 Ibid.
208 National Center for O*NET Development. 29-1122.00. O*NET OnLine. Retrieved July 12, 2014, from http://www.oneton-line.org/link/summary/29-1122.00
209 Ibid.
210 Ibid.
211 Johnson, WG, Linan, M (March 2014). Phoenix Healthcare Sector Partnership Inventory of Information on the Healthcare Workforce in Arizona. College of Health Solutions. Arizona State University.
212 Ibid.
213 National Center for O*NET Development. 31-2011.00. O*NET OnLine. Retrieved July 12, 2014, from http://www.oneton-line.org/link/summary/31-2011.00
214 Ibid.
215 Ibid.
216 Provided by Dr. Patricia Crist, July 2, 2014. Source provided by The National Board for Certification in Occupational Therapy.
217 Johnson, WG, Linan, M (March 2014). Phoenix Healthcare Sector Partnership Inventory of Information on the Healthcare Workforce in Arizona. College of Health Solutions. Arizona State University.
218 National Center for O*NET Development. 29-2041.00. O*NET OnLine. Retrieved July 12, 2014, from http://www.oneton-line.org/link/summary/29-2041.00
219 Tabor, J. and H.J. Eng, 2012. Arizona Rural Health Workforce Trend Analysis 2007-2010. Arizona Area Health Education Centers and Center for Rural Health, the University of Arizona. Tucson, Arizona. pp138.
220 Ibid.
221 Ibid.
222 Ibid.
223 Collier, Stephen N., Ph.D. “A Study of Allied Health Education Program Needs in Arizona.” (Internal Report). July 2006. pp1-78.
224 Ibid.
225 Eng, Howard J., Ana Celia Hernandez-Martinez, and Jasmen Dorian. “Four U.S. Border States’ Community Health Worker Training Needs Assessment Report.” December 2011, pp1-38.
226 National Center for O*NET Development. 21-1094.00. O*NET OnLine. Retrieved July 12, 2014, from http://www.oneton-line.org/link/summary/21-1094.00
227 National Center for O*NET Development. 21-1091.00. O*NET OnLine. Retrieved July 12, 2014, from http://www.oneton-line.org/link/summary/21-1091.00
St. Luke’s Health Initiatives 29

30 Health Workforce, Healthy Economy
Bibliography2013 State Physician Workforce Databook.
2013 American Academy of Physician Assistants Annual Survey. Arizona State Practice Profile. http://www.aapa.org/threeColumn-Landing.aspx?id=328
Arizona Department of Health Services.
Census.gov. Arizona Quick Facts. http://Quickfacts.census.gov/qfd/states/04000.html
Collier, Stephen N., Ph.D. “A Study of Allied Health Education Program Needs in Arizona.” (Internal Report). July 2006. pp1-78.
Dr. Patricia Crist from a source provided by The National Board for Certification in Occupational Therapy.
Eng, Howard J., Ana Celia Hernandez-Martinez, and Jasmen Dorian. “Four U.S. Border States’ Community Health Worker Training Needs Assessment Report.” December 2011, pp1-38.
Eng, Howard J., Julie Jacobs, and Jennifer Peashock. “Arizona Rural Health Plan 2005-2007,” December 2004, pp.1-96.
Health Indicators Warehouse. http://www.healthindicators.gov/Indicators/Dentist-rate-per-100000_130/Profile/Chart
The Henry J. Kaiser Family Foundation. State Health Facts. http://kff.org/other/state-indicator/physician-assistants-per-100000-pop/
Johnson WG, Bannister WM, Russell KM, Edge M, Gray H, Merritt R. (June 2008). Arizona physician trends: reasons for leaving Arizona. Phoenix (AZ). Arizona State University, Center for Health Information & Research.
Johnson WG, Harootunian G. (December 2013). What happened to the shortage of registered nurses: the Arizona experience 2008-2012. Phoenix, AZ: Center for Health Information & Research (Prepared for Arizona Hospital and Healthcare Association).
Johnson, WG, Linan, M (March 2014). Phoenix Healthcare Sector Partnership Inventory of Information on the Healthcare Workforce in Arizona. College of Health Solutions. Arizona State University.
Johnson, WG, Rimsza M, Garcy A, Grossman M. 2005. The Arizona physician workforce study part I: The numbers of practicing physi-cians 1992-2004. Tempe (AZ). Center for Health Information & Research, Arizona State University.
Johnson, WG, Wilson BL, Edge M, Qiu Y, Oliver EL, Russell KM (April 2009). The Arizona health care workforce: nurses, pharmacists & physician assistants. (Prepared under contract with the Arizona Hospital and Healthcare Association.) Phoenix, AZ. Center for Health Information & Research, Arizona State University.
Johnson, WG, Wilson BL, Harootunian G, Qiu Y, Sama TL. (December 2010). Health care workforce data report: nursing and pharmacy in Maricopa county. Phoenix (AZ): Arizona State University, Center for Health Information & Research.
L. Ku, E. Jones, P. Shin, F. R. Byrne, S. K. Long. Safety-Net Providers After Health Care Reform: Lessons From Massachusetts. Archives of Internal Medicine, 2011; 171 (15): 1379 DOI: 10.1001/archinternmed.2011.317.
Tracy Lenartz, Arizona Department of Health Services.
National Center for O*NET Development. 21-1091.00. O*NET OnLine. Retrieved July 12, 2014, from http://www.onetonline.org/link/summary/21-1091.00
National Center for O*NET Development. 21-1094.00. O*NET OnLine. Retrieved July 12, 2014, from http://www.onetonline.org/link/summary/21-1094.00
National Center for O*NET Development. 29-1051.00. O*NET OnLine. Retrieved July 11, 2014, from http://www.onetonline.org/link/summary/29-1051.00
National Center for O*NET Development. 29-1122.00. O*NET OnLine. Retrieved July 12, 2014, from http://www.onetonline.org/link/summary/29-1122.00
National Center for O*NET Development. 29-1123.00. O*NET OnLine. Retrieved July 12, 2014, from http://www.onetonline.org/link/summary/29-1123.00
National Center for O*NET Development. 29-2041.00. O*NET OnLine. Retrieved July 12, 2014, from http://www.onetonline.org/link/summary/29-2041.00
National Center for O*NET Development. 31-2011.00. O*NET OnLine. Retrieved July 12, 2014, from http://www.onetonline.org/link/summary/31-2011.00
National Center for O*NET Development. 31-2021.00. O*NET OnLine. Retrieved July 12, 2014, from http://www.onetonline.org/link/summary/31-2021.00
Qiu, Y, Johnson, WG, August 2009. Arizona primary care workforce report. (Prepared by the Center for Health Information & Research, Biomedicine @ Arizona State University under Contract No 09104502.) Phoenix, AZ: St. Luke’s Health Initiatives.
Randolph, Pamela K. 2010. Arizona State Board of Nursing Employment of Newly Licensed RNs.
Randolph, Pamela K. 2011. Arizona State Board of Nursing Employment of Newly Licensed RNs.
Randolph, Pamela K. 2012. Arizona State Board of Nursing Summary and Analysis of Annual Reports From Arizona Nursing Education Programs Calendar Year 2012. Arizona State Board of Nursing.
Rimsza, M.E., Johnson, W.G., Speicher, M., Grossman, M. (2005). The Arizona psychiatric physician workforce study. Tempe (AZ). Arizona State University, Center for Health Information and Research.
Rimsza M, Johnson WG, Speicher M, Grossman M. (2006). The Arizona physician workforce study: part II 1994-2005.
State of Arizona Office of the Auditor General. Performance Audit and Sunset Review: Arizona Board of Behavioral Health Examiners. Report No. 12-03. August 2012.
Tabor, J. and H.J. Eng, 2012. Arizona Rural Health Workforce Trend Analysis 2007-2010. Arizona Area Health Education Centers and Center for Rural Health, the University of Arizona. Tucson, Arizona. pp138.
Tabor, J., Jennings, N. Kohler, L., Degnan, B., Derksen, D., Campos-Outcalt, D. and Eng. H. 2014. The Supply of Physician Assistants, Nurse Practitioners, and Certified Nurse Midwives in Arizona. Arizona Area Health Education Centers and Mel and Enid Zuckerman College of Public Health, Center for Rural Health. pp1-80.
Wilson BL, Johnson WG. July/August (2009). Using innovation to assess nursing workforce in Arizona: a collaborative approach. Nursing Economics. 27(4): 233-238.
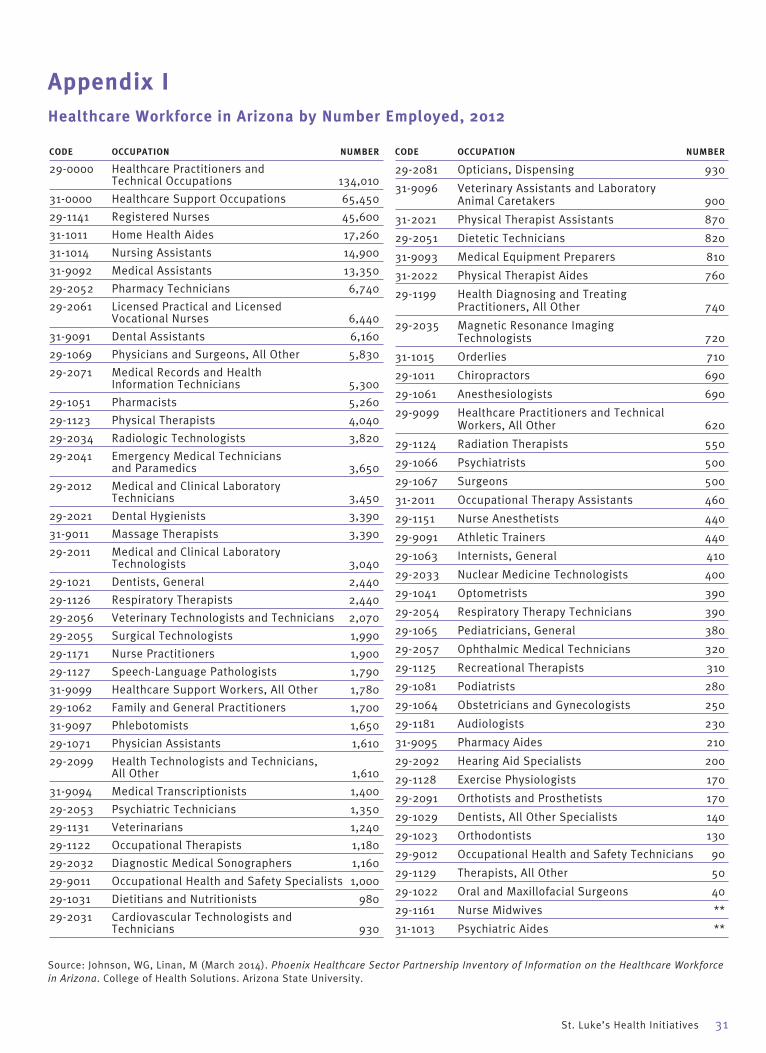
St. Luke’s Health Initiatives 31
CODE OCCUPATION NUMBER
29-0000 Healthcare Practitioners and Technical Occupations 134,010
31-0000 Healthcare Support Occupations 65,450
29-1141 Registered Nurses 45,600
31-1011 Home Health Aides 17,260
31-1014 Nursing Assistants 14,900
31-9092 Medical Assistants 13,350
29-2052 Pharmacy Technicians 6,740
29-2061 Licensed Practical and Licensed Vocational Nurses 6,440
31-9091 Dental Assistants 6,160
29-1069 Physicians and Surgeons, All Other 5,830
29-2071 Medical Records and Health Information Technicians 5,300
29-1051 Pharmacists 5,260
29-1123 Physical Therapists 4,040
29-2034 Radiologic Technologists 3,820
29-2041 Emergency Medical Technicians and Paramedics 3,650
29-2012 Medical and Clinical Laboratory Technicians 3,450
29-2021 Dental Hygienists 3,390
31-9011 Massage Therapists 3,390
29-2011 Medical and Clinical Laboratory Technologists 3,040
29-1021 Dentists, General 2,440
29-1126 Respiratory Therapists 2,440
29-2056 Veterinary Technologists and Technicians 2,070
29-2055 Surgical Technologists 1,990
29-1171 Nurse Practitioners 1,900
29-1127 Speech-Language Pathologists 1,790
31-9099 Healthcare Support Workers, All Other 1,780
29-1062 Family and General Practitioners 1,700
31-9097 Phlebotomists 1,650
29-1071 Physician Assistants 1,610
29-2099 Health Technologists and Technicians, All Other 1,610
31-9094 Medical Transcriptionists 1,400
29-2053 Psychiatric Technicians 1,350
29-1131 Veterinarians 1,240
29-1122 Occupational Therapists 1,180
29-2032 Diagnostic Medical Sonographers 1,160
29-9011 Occupational Health and Safety Specialists 1,000
29-1031 Dietitians and Nutritionists 980
29-2031 Cardiovascular Technologists and Technicians 930
CODE OCCUPATION NUMBER
29-2081 Opticians, Dispensing 930
31-9096 Veterinary Assistants and Laboratory Animal Caretakers 900
31-2021 Physical Therapist Assistants 870
29-2051 Dietetic Technicians 820
31-9093 Medical Equipment Preparers 810
31-2022 Physical Therapist Aides 760
29-1199 Health Diagnosing and Treating Practitioners, All Other 740
29-2035 Magnetic Resonance Imaging Technologists 720
31-1015 Orderlies 710
29-1011 Chiropractors 690
29-1061 Anesthesiologists 690
29-9099 Healthcare Practitioners and Technical Workers, All Other 620
29-1124 Radiation Therapists 550
29-1066 Psychiatrists 500
29-1067 Surgeons 500
31-2011 Occupational Therapy Assistants 460
29-1151 Nurse Anesthetists 440
29-9091 Athletic Trainers 440
29-1063 Internists, General 410
29-2033 Nuclear Medicine Technologists 400
29-1041 Optometrists 390
29-2054 Respiratory Therapy Technicians 390
29-1065 Pediatricians, General 380
29-2057 Ophthalmic Medical Technicians 320
29-1125 Recreational Therapists 310
29-1081 Podiatrists 280
29-1064 Obstetricians and Gynecologists 250
29-1181 Audiologists 230
31-9095 Pharmacy Aides 210
29-2092 Hearing Aid Specialists 200
29-1128 Exercise Physiologists 170
29-2091 Orthotists and Prosthetists 170
29-1029 Dentists, All Other Specialists 140
29-1023 Orthodontists 130
29-9012 Occupational Health and Safety Technicians 90
29-1129 Therapists, All Other 50
29-1022 Oral and Maxillofacial Surgeons 40
29-1161 Nurse Midwives **
31-1013 Psychiatric Aides **
Appendix IHealthcare Workforce in Arizona by Number Employed, 2012
Source: Johnson, WG, Linan, M (March 2014). Phoenix Healthcare Sector Partnership Inventory of Information on the Healthcare Workforce in Arizona. College of Health Solutions. Arizona State University.

Navajo NationLittlefield
Dateland
Flagstaff
Kingman
Williams
Ajo
Fredonia
Gila Bend
Elfrida
Salome
Saint Johns
Hopi Nation
Buckeye
Quartzsite
Dolan Springs
Holbrook
Morenci
Tohono O'Odham Nation
Ash Fork
Arivaca
Willcox/Bowie
Yavapai-South
Florence
Scottsdale
Benson
San Carlos Apache Tribe
Wickenburg
Chino Valley
Eloy
Superior
Bisbee
Bonita/Klondyke
Pima
SnowflakeBagdad
Continental
Nogales
Wellton
Hualapai Tribe
White Mountain Apache Tribe
San Manuel
Round Valley
Graham-Southern
Yavapai-Northeast
Marana
Cordes Junction
Duncan
Gila-Young-Tonto Basin
Patagonia
Maricopa
Tubac
Gila-Northern-Young
Gila-Central-Globe
Tombstone
Heber-Overgaard
Cave Creek
Tanque Verde
Douglas
Parker
Sierra Vista
Sedona
PrescottLake Havasu City
Show Low
Mesa
Casa Grande
Gila River Indian Community
Winslow
Tucson-Northeast
Havasupai Tribe
CatalinaSomerton
Tucson-Northwest
Tucson-West
Colorado River Indian Tribes
Fort Mohave
Peoria
Kaibab Paiute Tribe
Kearny
Paradise ValleyEl Mirage
Coolidge
Yuma-East
ChandlerTempe
Gila-Southern-Hayden
Ahwatukee
Phoenix-Central
Bullhead City Sanders
Apache JunctionAvondale/Tolleson
Page
Peoria
Yuma-West
Prescott Valley
Tucson-Southwest
Ak-Chin Indian Community
San Luis
Green Valley
Fort Mohave Indian Tribe
Flagstaff-West Central
Fort Mohave Indian Tribe
Yavapai Apache Tribe
Fort Yuma-Quechan Tribe
Yavapai Apache Tribe
Arizona Medically Underserved Areas
±Scottsdale
Gila Bend
Mesa
Cave CreekWickenburg
Buckeye
Peoria
Superior
Paradise Valley
El Mirage
Gila River Indian Community
Chandler
Tempe
Ahwatukee
Phoenix-Central
Queen Creek
Gilbert
Glendale
Avondale/Tolleson
Peoria
Phoenix-South Mountain Apache Junction
Phoenix-South Central
Salt River Pima-Maricopa Indian Community
Fort McDowell Mohave-Apache Indian Community
Luke
Litchfield Park
Phoenix Sunnyslope
Guadalupe
Marana
Arivaca
Tanque Verde
Continental
Benson
Tucson-Northeast
CatalinaTucson-Northwest
Tucson-West
Eloy Florence San Manuel
Tohono O'Odham Nation
Tohono O'Odham Nation
Bonita/Klondyke
Tucson-Southwest
Tucson-CentralTucson-East
Tucson-East Central
Tucson-Southeast
Tucson-North Central
Green Valley
Pascua Yaqui Tribe
Metro Phoenix
±
±Metro Tucson
AzMUA Regions
LegendAzCounties
PC HPSA TYPENot Designated
County
Geographic
Native American
Population Low Income
StAzMUAState AzMUA Only
April 2013
Appendix IIArizona Medically Underserved Areas
32 Health Workforce, Healthy Economy
Source: Arizona Department of Health Services.
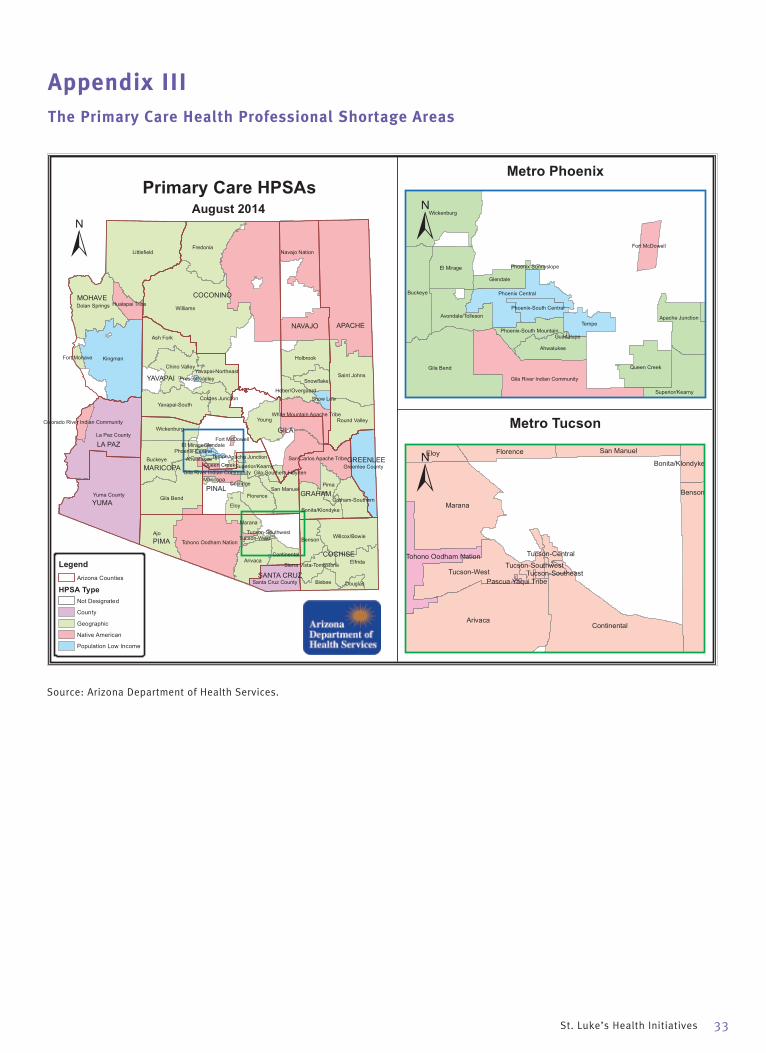
Navajo Nation
Williams
Littlefield
Kingman
Ajo
Yuma County
Fredonia
Gila Bend
La Paz County
Elfrida
Saint Johns
Buckeye
Young
Dolan Springs
Holbrook
Arivaca
Ash Fork
Tohono Oodham NationWillcox/Bowie
Yavapai-South
Round Valley
Florence
Benson
Wickenburg
Chino Valley
Pima
Eloy
San Carlos Apache Tribe
San Manuel
Bisbee
Bonita/Klondyke
Santa Cruz County
Snowflake
Continental
Greenlee County
Yavapai-Northeast
White Mountain Apache Tribe
Marana
Cordes Junction
Graham-Southern
Superior/Kearny
Hualapai Tribe
Heber/Overgaard
Douglas
Sierra Vista-Tombstone
Show Low
Gila River Indian Community
Fort Mohave
Tucson-West
Colorado River Indian Community
Maricopa
El Mirage
Tempe
Gila-Southern-HaydenQueen Creek
AhwatukeePhoenix Central
Apache Junction
Glendale
Coolidge
Fort McDowell
Prescott Valley
Tucson-Southwest
PIMA
COCONINOMOHAVE
APACHENAVAJO
GILA
YAVAPAI
YUMA
PINAL
MARICOPA
COCHISE
LA PAZ
GRAHAM
GREENLEE
SANTA CRUZ
Primary Care HPSAs
±
Gila Bend
Wickenburg
Buckeye
El Mirage
Gila River Indian Community
Tempe
Queen Creek
Ahwatukee
Phoenix Central
Apache Junction
Superior/Kearny
Avondale/Tolleson
Glendale
Fort McDowell
Phoenix-South Mountain
Phoenix-South Central
Phoenix Sunnyslope
Guadalupe
Arivaca
Marana
Continental
Benson
Tucson-West
Eloy Florence San Manuel
Tohono Oodham Nation
Bonita/Klondyke
Tucson-Southwest
Tucson-Central
Tucson-SoutheastPascua Yaqui Tribe
Metro Phoenix
±
±Metro Tucson
LegendArizona Counties
HPSA TypeNot Designated
County
Geographic
Native American
Population Low Income
August 2014
Appendix IIIThe Primary Care Health Professional Shortage Areas
St. Luke’s Health Initiatives 33
Source: Arizona Department of Health Services.
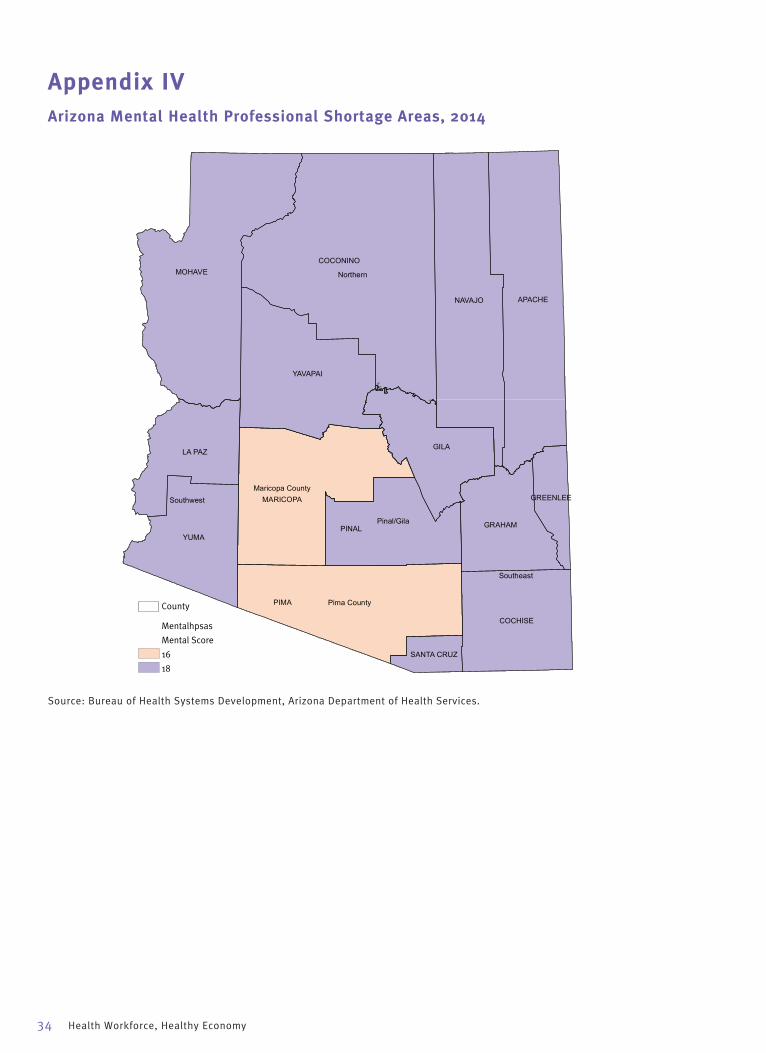
Northern
Southeast
Pinal/Gila
Southwest
Pima County
Maricopa County
PIMA
COCONINOMOHAVE
APACHENAVAJO
GILA
YAVAPAI
YUMAPINAL
MARICOPA
COCHISE
LA PAZ
GRAHAM
SANTA CRUZ
GREENLEE
County
Mentalhpsas
Mental Score
16
18
Appendix IVArizona Mental Health Professional Shortage Areas, 2014
34 Health Workforce, Healthy Economy
Source: Bureau of Health Systems Development, Arizona Department of Health Services.

St. Luke’s Health Initiatives 35
Williams
Littlefield
Dateland
Kingman
Hopi Nation
Fredonia
Gila Bend
Salome
Saint Johns
Buckeye
Quartzsite
Dolan Springs
Morenci
Tohono Oodham Nation
Arivaca
Hualapai Tribe
Willcox/Bowie
Yavapai-South
Round Valley
Florence
Benson
Casa Grande
Wickenburg
Chino Valley
Pima
San Carlos Apache Tribe
San Manuel
Bisbee
Bonita/Klondyke
Bagdad
Nogales
Continental
Wellton
Yavapai-Northeast
White Mountain Apache Tribe
Marana
Cordes Junction
Graham SouthernDuncan
Gila-Young-Tonto Basin
Patagonia
Flagstaff
Gila-Northern-Young
Gila-Central-Globe
Tombstone
Heber-Overgaard
Tanque Verde
Douglas
Show LowParker
Sierra VistaTubac
Gila River Indian Community
Winslow
Somerton
Colorado River Indian Tribes
Tucson-West
Fort Mohave
Tempe
Yuma-East
Gila-Southern-Hayden
Phoenix-Central
Bullhead City
Sedona
El Mirage/Luke
Avondale/Tolleson
Yuma-West
Prescott Valley
Phoenix-South Mountain
Tucson-Southwest
Fort McDowell Yavapai Nation
Green Valley
Tucson-North Central
PIMA
COCONINOMOHAVE
APACHENAVAJO
GILA
YAVAPAI
YUMA PINAL
MARICOPA
COCHISE
LA PAZ
GRAHAM
GREENLEE
SANTA CRUZ
Dental HPSAs
±
Gila Bend
Wickenburg
Buckeye
Gila River Indian Community
Tempe
Phoenix-Central
El Mirage/Luke
Avondale/Tolleson
GlendaleSalt River Pima-Maricopa Indian Com
Phoenix-South Mountain
Phoenix-South Central
Fort McDowell Yavapai Nation
Phoenix Sunnyslope
Guadalupe
Phoenix Sunnyslope
Marana
Arivaca
Tanque Verde
Continental
BensonTucson-West
Florence San Manuel
Tohono Oodham Nation
Tohono Oodham Nation
Casa Grande
Bonita/Klondyke
Tucson-Southwest
Tucson-Central
Tucson-West
Tucson-EastTucson-East Central
Tucson-North Central
Green Valley
Metro Phoenix
±
±Metro Tucson
LegendArizona Counties
HPSA TypeNot Dental HPSA
DentalTypeGeographic
P Low-Inc.
August 2014
Appendix VDental Health Professional Shortage Areas
Source: Arizona Department of Health Services.
Our Mission
To inform, connect and support efforts to improve the health of individuals and communities in
Arizona. In all that we do, St. Luke’s Health Initiatives seeks to be a catalyst for community health.
For a complete list of Arizona Health Futures publications, conferences and other public education activities, visit the SLHI web site at www.slhi.org. If you would like to receive extra copies of a publication or be added to our mailing list, please call 602.385.6500 or email us at [email protected].
Equal Opportunity Employer/Program Auxiliary Aids and services are available upon request to individuals with disabilities. Please contact 602-262-6776 or City TTY Relay/602-534-5500 as early as possible to coordinate needed arrangements.
St. Luke’s Health Initiatives is a public foundation formed through the sale of the St. Luke’s Health System in 1995. For a comprehensive overview of our programs and activities to advance a healthy, vital and resilient Arizona, please visit our web site. We welcome your comments and involvement.
Analyst:Kristin Borns, Borns Solutions AZ
Editor: Kim VanPelt
Graphic Design:Chalk Design
©2015. All Rights Reserved.
Material may be reproduced without permission when proper acknowledgment is made.
NONPROFIT ORG.U.S. POSTAGE
PAIDPHOENIX, ARIZONAPERMIT NO. 4288
2929 N Central AvenueSuite 1550Phoenix Arizona 85012
602.385.6500602.385.6510 fax
Allied Health Needs Assessment
Prepared for Maricopa County Community College District
By Jane Irvine MSW, ACSW, LCSW and William G. Johnson, Ph.D.
April 20, 2015

1
Acknowledgments
A project of this scope could not have been undertaken without the cooperation, support
and collaboration of a number of people in a variety of ways.
We are grateful to the 70 executives and managers of 43 healthcare and behavioral health
organizations for participating in interviews, focus groups and surveys to share their insight
on needs and emerging trends for allied health occupations.
Members of the Maricopa County Community College District leadership team provided
many valuable hours of technical assistance and direction to ensure that information and
information was accurate and relevant.
We especially thank the following people for their commitment and valuable contributions.
Maricopa County Community College District Project Leadership Team
Julie Stiak, M.Ed., District Director of Health Care Education
Steve Schroeder, Director of the Integrated Competency Assessment Network
Robert Franciosi Ph.D., Director Health Care Education Research and Evaluation, Health
Care Education Department.
Organizations Participating in the Allied Health Needs Assessment
Abrazo Health Arrowhead Hospital
Arizona Alliance for Community Health
Centers
Arizona Behavioral Health Corporation
Arizona's Children Association
Arizona Council of Human Service Providers
Arizona Dental Association
Arizona Healthcare Human Resources
Association
Arizona Department of Health Services
Arizona Public Health Association
Arizonans for Prevention
Banner Health Network
Barnet Dulaney Perkins Eye Centers
Cardiovascular Consultants
Cenpatico
Chicanos Por La Causa
Child & Family Support Services
Cochise County Health Department
Community Bridges Inc.
Dignity Health
Foundation for Senior Living
Gila County Health and Emergency Services
Helping Associates
HonorHealth (Scottsdale Lincoln Health
Network)
Marc Community Resources
Maricopa County Health Department
Mayo Clinic
Mt. Graham Regional Medical Center
Mountain Park Community Health Center
NARBHA Health Choice Integrated Care
NextCare Urgent Care
Pasadera Behavioral Health Network
Sonora Quest Laboratories
Southwest Network
Southwest Kidney Institute, PLC
Spectrum Healthcare
STAR - Stand Together and Recover Centers.
The Guidance Clinic
Touchstone Behavioral Health
West Yavapai Guidance Clinic
Westminster Village
Table of Contents
Acknowledgments ............................................................................................................................... 1
Table of Contents ................................................................................................................................. 0
List of Figures and Tables ................................................................................................................... 2
Executive Summary ............................................................................................................................. 3
Introduction ........................................................................................................................................... 8
Approach ............................................................................................................................................... 9
The Allied Health Care Workforce Defined ................................................................................... 9
Interviews and Focus Groups ....................................................................................................... 10
Allied Health Needs Assessment Employer Survey ................................................................. 11
Allied Health Occupations Trend Analyses ................................................................................ 12
Allied Health Occupation Workforce Data .................................................................................... 13
Trends in Employment...................................................................................................................... 13
Average Annual Growth Rates in Employment ........................................................................ 15
High Growth Occupations ............................................................................................................. 19
Medium Growth Occupations .................................................................................................. 20
Low Growth Occupations .......................................................................................................... 21
Declining Occupations .............................................................................................................. 22
Summary of Trend Data ............................................................................................................... 23
Projections Ranked by Growth Rates......................................................................................... 23
Projections Ranked by Number Employed ................................................................................ 29
Wages ............................................................................................................................................. 32
Critical Issues and Trends ................................................................................................................ 36
Implications for Allied Health .......................................................................................................... 39
New Roles and Expanded Scope of Practice ............................................................................ 39
Recruitment Challenges and Workforce Trends ...................................................................... 45
Occupations with High Numbers of Potential Jobs (+37,497 employees) ....................... 45
Occupations with Medium Numbers of Potential Jobs (+ 7,364 employees) ................. 47
Occupations with Low Numbers of Potential Jobs (+2,037) .............................................. 48
Occupations with Declining Numbers of Potential Jobs (-903) .......................................... 49
Occupations Omitted from Projections .................................................................................. 50
Workforce Training Needs ........................................................................................................... 51
1
Synthesis of Findings - Strategic Opportunities and Challenges ............................................... 57
Strategic Opportunities ................................................................................................................. 57
Challenges ...................................................................................................................................... 63
Conclusion .......................................................................................................................................... 66
References ......................................................................................................................................... 67
Appendix A: Organizations and Senior Managers Interviewed .................................................. 69
Appendix B: Crosswalk of MCCCD Allied Health Programs to BLS SOC Occupations ............ 70
Appendix C: Banner Health Network Health Coach Job Description ......................................... 73
Appendix D: HonorHealth Scottsdale-Lincoln Health Network Transition Specialist Job
Description ......................................................................................................................................... 74
Appendix E: Dignity Health Network Community Resource Aide Job Description .................. 75
Appendix F: Banner University Medicine Medical Scribe Job Description ................................ 76
Appendix G: MH7 Medical Assistant-Scribe Job Description ...................................................... 77
Appendix H: HonorHealth (Scottsdale Lincoln Health Network) – Patient Navigator Job
Description ......................................................................................................................................... 78
Appendix I: Little Colorado Behavioral Health – Peer Support/Recovery Specialist Job
Description ......................................................................................................................................... 79
Appendix J: Family Involvement Center – Peer Parent Family Support Partner Job
Description ......................................................................................................................................... 80
Appendix K: Potential Partners and Resources for Maricopa County Community College
District ................................................................................................................................................. 81

2
List of Figures and Tables
Figure 1.Unemployment Rates in Arizona by Month 2004-2014 ............................................. 14
Figure 2. Allied Health Employment in Arizona 2000-2013 ...................................................... 14
Figure 3. Arizona Allied Health Occupations: Average Annual Employment Growth Rate
(2004-2012) Highest Average Annual Employment Growth ..................................................... 15
Figure 4. Arizona Allied Health Occupations: Average Annual Employment Growth Rate
(2004-2012) Lowest Average Annual Employment Growth ...................................................... 16
Table 1.Employment Trends 2004-2012 & Employment Rank 2012 ..................................... 18
Table 2. Projections for Persons Employed in Allied Health Care in Arizona .......................... 25
Table 3. Comparison of Projections to DOA Estimates ............................................................... 26
Figure 5. Arizona Allied Health Occupations: Total Employment (2012) ................................. 29
Highest Total Employment .............................................................................................................. 29
Figure 6. Arizona Allied Health Occupations: Total Employment (2012) ................................. 30
Lowest Total Employment ............................................................................................................... 30
Table 4. Projected Employment of Allied Health Workers ......................................................... 31
Figure 7. Arizona Allied Health Occupations: Average Annual Wage Growth Rate (2004-
2012) Highest Average Annual Wage Growth ............................................................................. 32
Figure 8. Arizona Allied Health Occupations: Average Annual Wage Growth Rate (2004-
2012) Lowest Average Annual Wage Growth .............................................................................. 33
Figure 9. Arizona Allied Health Occupations: Average Annual Wage Growth Rate (2008-
2012) Highest Average Annual Wage Growth .............................................................................. 33
Figure 10. Arizona Allied Health Occupations: Average Annual Wage Growth Rate (2008-
2012) Lowest Average Annual Wage Growth ............................................................................. 34
Table 5. Allied Health Occupations with Wage Growth Substantially Above or Below the
Median and Moved in Opposite Directions from Trends in Employment ................................. 34
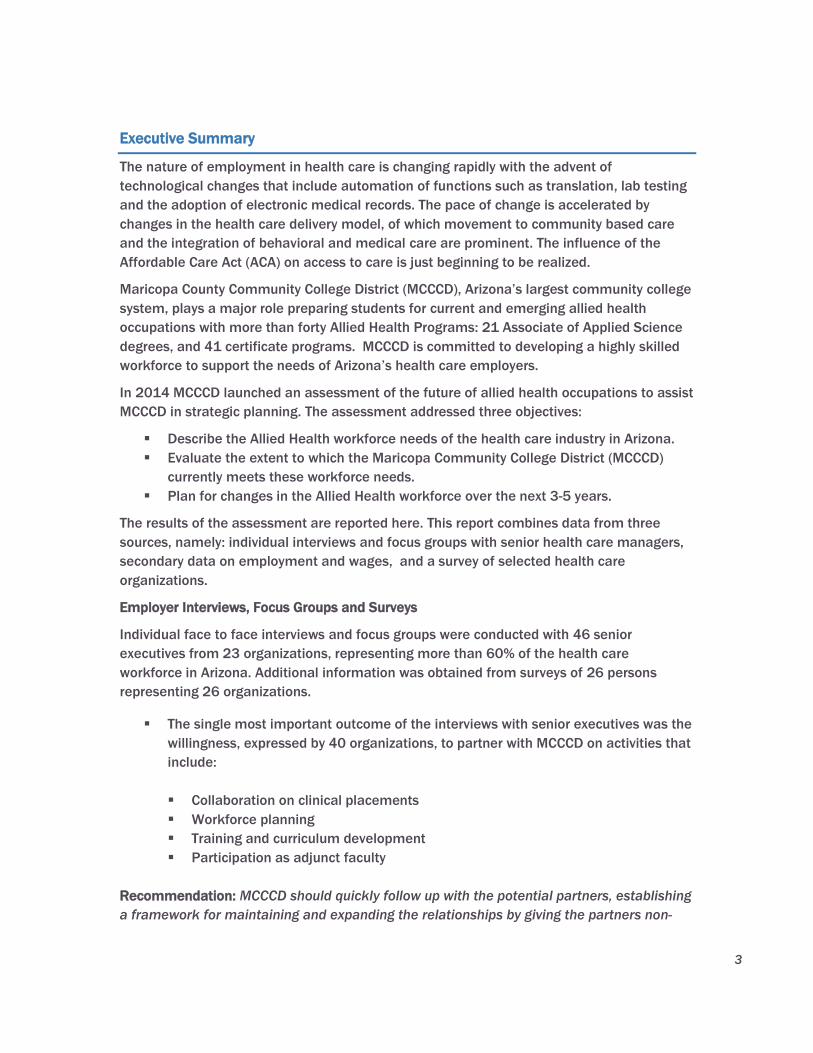
3
Executive Summary
The nature of employment in health care is changing rapidly with the advent of
technological changes that include automation of functions such as translation, lab testing
and the adoption of electronic medical records. The pace of change is accelerated by
changes in the health care delivery model, of which movement to community based care
and the integration of behavioral and medical care are prominent. The influence of the
Affordable Care Act (ACA) on access to care is just beginning to be realized.
Maricopa County Community College District (MCCCD), Arizona’s largest community college
system, plays a major role preparing students for current and emerging allied health
occupations with more than forty Allied Health Programs: 21 Associate of Applied Science
degrees, and 41 certificate programs. MCCCD is committed to developing a highly skilled
workforce to support the needs of Arizona’s health care employers.
In 2014 MCCCD launched an assessment of the future of allied health occupations to assist
MCCCD in strategic planning. The assessment addressed three objectives:
Describe the Allied Health workforce needs of the health care industry in Arizona.
Evaluate the extent to which the Maricopa Community College District (MCCCD)
currently meets these workforce needs.
Plan for changes in the Allied Health workforce over the next 3-5 years.
The results of the assessment are reported here. This report combines data from three
sources, namely: individual interviews and focus groups with senior health care managers,
secondary data on employment and wages, and a survey of selected health care
organizations.
Employer Interviews, Focus Groups and Surveys
Individual face to face interviews and focus groups were conducted with 46 senior
executives from 23 organizations, representing more than 60% of the health care
workforce in Arizona. Additional information was obtained from surveys of 26 persons
representing 26 organizations.
The single most important outcome of the interviews with senior executives was the
willingness, expressed by 40 organizations, to partner with MCCCD on activities that
include:
Collaboration on clinical placements
Workforce planning
Training and curriculum development
Participation as adjunct faculty
Recommendation: MCCCD should quickly follow up with the potential partners, establishing
a framework for maintaining and expanding the relationships by giving the partners non-
4
ceremonial tasks that allow them to make significant contributions to MCCCD and to bind
them more closely to MCCCD as a source for their employees.
The list of 40 organizations expressing interest in potential partnerships and collaborative
efforts includes:
Abrazo Health Arrowhead Hospital
Arizona Alliance for Community Health
Centers
Arizona Behavioral Health Corporation
Arizona's Children Association
Arizona Council of Human Service Providers
Arizona Dental Association
Arizona Healthcare Human Resources
Association
Arizona Department of Health Services
Arizona Public Health Association
Arizonans for Prevention
Banner Health Network
Barnet Dulaney Perkins Eye Centers
Cardiovascular Consultants
Cenpatico
Chicanos Por La Causa
Child & Family Support Services
Cochise County Health Department
Community Bridges Inc.
Dignity Health
Foundation for Senior Living
Gila County Health and Emergency Services
Helping Associates
HonorHealth (Scottsdale Lincoln Health
Network)
Marc Community Resources
Maricopa County Health Department
Mayo Clinic
Mt. Graham Regional Medical Center
Mountain Park Community Health Center
NARBHA Health Choice Integrated Care
NextCare Urgent Care
Pasadera Behavioral Health Network
Sonora Quest Laboratories
Southwest Network
Southwest Kidney Institute, PLC
Spectrum Healthcare
STAR - Stand Together and Recover Centers
The Guidance Clinic
Touchstone Behavioral Health
West Yavapai Guidance Clinic
Westminster Village
Employers identified a wide array of training needs for the current workforce including:
Credential programs
Leadership Academy (training for front line supervisors)
Training in new technologies
Adding training in behavioral health for a variety of occupations
Re-certification training for various occupations including Medical Billing Coders
and Posting Clerks and Radiation and Respiratory Therapists
Several large hospital systems are initiating programs in community based health.
Designed to minimize hospital admissions and re-admissions when hospitalization
occurs, the programs differ in detail but share many of the same training needs. The
current programs rely, for example, on retraining personnel from a variety of
occupations to perform expanded duties needed to provide community based care. The
types of occupations where re-training is needed include:
Health and Transition Coaches
Community Resource Aides
5
Community Care Workers
Case Managers- Integrated Care
Patient Navigators
Emergency Medical Technicians and Paramedics
The interviews and the survey results show that the implementation of integrated care
(physical and behavioral health) in Arizona presents another strategic opportunity for
MCCCD to bring together the necessary interdisciplinary resources to play a significant
role the development of curricula, workforce training and certification programs to
prepare allied health workers at all levels to work in an integrated care model. A
certificate program on integrated care for allied health care professionals in a range of
occupations is needed.
We could not estimate the potential number of jobs for which interdisciplinary training
will be required but the opportunities include both direct and supplementary training in
behavioral health for the following positions :
Behavioral Health Technicians
Case Aides
Case managers
Clinical Information Technology
Direct Care Para-Professionals
Family Peer Support Partners
Health Information Informatics programs
Integrated Health Specialists and Coordinators
Management of Clinical Information Technology
Management of Clinical and Bioscience Informatics
Info Tech Specialists
Medical Records Clerks
Medical Assistants
Licensed Practical Nurse (LPN )
Parent Aides
Peer Support/Recovery Specialists
Population Care Managers
Recommendation: MCCCD contact the senior managers of each of the three RHBA
Integrated Care Contractors to further explore the potential number of workers who will
need training in integrated care. Cenpatico and NARBHA Health Choice indicated a
willingness to partner with MCCCD and there may be possibilities for a coordinated training
initiative involving all three. (Note: An interview was not able to be completed with Mercy
Maricopa Integrated Care in time for this report.)
Employers were asked to consider which forms of training would be most effective in
meeting their needs for well-trained allied health care professionals. They suggested
the following methods in combinations that could vary among employers as needed.
6
Online and hybrid models (classroom and online).
Classroom
Work site
Train the trainer
Projections
The analysis of employment and wage trends for the years 2004-2012 and their
extrapolation show the demand for most allied health care occupations will increase
significantly, adding approximately 47,000 new jobs by 2020. The size of the increases,
however, vary considerably among occupations and there are a few occupations where
employment is expected to decline.
Six occupations account for approximately eighty percent of the potential growth:
Personal Care Aides
Medical Records and Health Information Technicians
Emergency Medical Technicians and Paramedics
Medical and Health Services Managers
Medical Assistants
Pharmacy Technicians
The four occupations for which employment is projected to decline are;
Medical Transcriptionists
Dietetic Technicians
Physical Therapy Assistants
Healthcare Support Workers
One occupation shows declines in the number of persons in employed accompanied
by above average increases in wages suggesting that there is a shortage: Radiologic
Technologists and Technicians
Trend based projections do not incorporate changes related to the re-definition or
expansion of the services provided by workers within a traditional occupational
classification. There are at least two occupations where the demand for care and
potentially the scope of practice are changing as the result of mandates included in the
ACA. The emerging occupations are:
Expanded Function Dental Assistants
Community Dental Health Coordinators
Recommendation: The projections that we report have been compared to alternative
estimates and to employer opinions and possible exceptions are described. Decision

7
makers should interpret the results as useful indicators of the likely direction of future
trends and as useful but approximate estimates of the employment of allied health care
workforce professionals. Comparisons of potential training opportunities among different
occupations should not be based on small differences in estimated employment.
8
Introduction
The professions in Health Care are dynamic, resulting in ever-changing training and
workforce needs. The Maricopa County Community College District (MCCCD) is committed
to developing a highly skilled workforce to support the needs of health care employers.
MCCCD has forty plus Allied Health Programs: 21 Associate of Applied Science degrees,
and 41 certificate programs. In 2012 - 2013, 15,715 students were enrolled in Allied
Health Programs.
In July 2014, Maricopa County Community College District (MCCCD) engaged Jane Irvine
Consulting (Jane Irvine LCSW and William Johnson Ph.D.) to conduct an assessment of
emerging trends that affect the future of allied health occupations to assist in strategic
decision making process. The objectives of the Allied Health Needs Assessment established
by the Maricopa County Community College District (MCCCD) address three key areas:
Identify the current Allied Health workforce needs of the health care industry in the
Maricopa County region.
Evaluate the extent to which the Maricopa Community College District (MCCCD)
currently meets these workforce needs.
Plan for new Allied Health workforce needs emerging in the next 3-5 years.
.
Report Organization
This report, Allied Health Needs Assessment, reflects work performed and information
collected for the period from July 30, 2014 to March 31, 2015. To address the three
objectives the report is organized into five sections.
The Introduction and Approach section focuses on the background and conceptual
framework utilized for the Allied Health Needs Assessment. The approach describes three
components including development of a crosswalk matching the MCCCD allied health
education tracks to U. S. Bureau of Labor Statistics (BLS) Standard Occupational Codes
(SOC), application of the allied health crosswalk to the development of trend data on
employment and wages, an employer survey and interviews with managers in health care
and behavioral health organizations.
The Allied Health Occupation Workforce Data Analyses section focuses on growth trends for
high, medium, low and declining allied health occupation, projections and wages.
The Critical Issues and Trends section presents key findings from interviews, focus groups
and surveys highlighting major policy and practice initiatives impacting health care delivery.
The Implications for Allied Health section presents findings from interviews, focus groups
and surveys focusing on New Roles and Expanded Scope of Practice, Recruitment
Challenges and Workforce Trends and Workforce Training Needs.
The concluding section, Synthesis of Findings: Strategic Opportunities and Challenges,
aligns information based on workforce analyses data, interviews and focus groups with
senior managers in healthcare and behavioral health organizations and survey responses to
9
identify potential opportunities and challenges for Maricopa County Community College
District.
Approach
The needs assessment included interviews, focus groups, and a survey for employers
regarding Allied Health employment and training needs, soft and technical skills and
clinical practicums required by the health care partners. Data was analyzed to current
employment and labor trends, and projections for Allied Health professions in Maricopa
County. In addition, the Needs Assessment gathered information from employers to
determine how MCCCD clinical partners view MCCCD Allied Health programs and graduates
they have hired, and how they define MCCCD’s role in the future. The components of the
needs assessment included:
In order to define the Allied Health Workforce a crosswalk was developed matching
the Maricopa Community College District (MCCCD) allied health education tracks to
U.S. Bureau of Labor Statistics (BLS) Standard Occupational Codes (SOC).
Application of the allied health crosswalk to the development of trend data on
employment and wages for allied healthcare workers in Arizona.
Interviewed 36 administrators from a representative group of 23 Arizona healthcare
employers and conducted a focus group with 10 human resource directors from the
Arizona Council of Human Service Providers Human Resource (HR) Committee to
inform the Allied Health Needs Assessment. The original plan to meet with focus
groups to inform the needs assessment was revised, substituting individual
meetings with senior managers from a representative group of Arizona employers.
A list of organizations and senior managers interviewed is presented in Appendix A.
Created and distributed an on-line needs assessment survey to human resource
managers in more than 332 healthcare organizations. Responses were received
from 26 organizations providing healthcare and behavioral health services
throughout Arizona. In an effort to inform the employer survey the consultants
reached out to employers, associations and provider groups for feedback and
assistance in survey design and distribution. The employer survey, instructions and
summary of response data is included in a separate document (Technical
Appendix).
Each of these activities is described in detail in the section below.
The Allied Health Care Workforce Defined
The MCCCD staff provided descriptions of the categories of allied health care workers that
are trained by MCCCD. Categories were matched to the U.S. Standard Occupational Codes
(SOC) that used by the federal and state government to conduct occupational and
employment surveys. Difficulties in matching were resolved with the help of the MCCCD
10
staff. A crosswalk, including text descriptions of each occupational category was developed
to use in the development of trend data and, as described subsequently, in employer
interviews. The 33 SOC categories provide a standard metric for classifying and comparing
the results of the focus interviews, trend data from secondary sources and the results of the
survey and to match all against the educational categories used by MCCCD in its programs.
The Crosswalk of MCCCD Allied Health Programs to BLS SOC Occupations is presented as
Appendix B.
Interviews and Focus Groups
Initially the approach was to consist of a series of focus groups, drawing from persons with
whom MCCCD has contact. The contacts included more than 1,800 persons, most of whom
supervise allied health personnel and/or MCCCD student interns. Given the very large
amount of information that MCCCD collects from this group, the approach was revised to
one which would yield complementary information from a different group.
Senior managers from organizations that employ allied health care personnel were
selected with the assistance of the MCCCD staff to inform the approach to the Allied Health
Needs Assessment Project. The difficulty of scheduling senior managers for group sessions
led us to embark on one-on-one, in-depth interviews. Background materials, including a
general description of the study, the study personnel, a copy of the crosswalk and a draft
survey instrument were supplied to potential interviewees with an invitation to participate.
The interviews were directed but not tightly structured to allow for complete expression of
the respondents’ ideas given their very high levels of expertise and responsibility. Interviews
focused on the following discussion areas:
Overview of employer organization (model, experience, implementation issues)
Comments and suggestions on approach to Allied Health Needs Assessment
Workforce Survey
Allied health workforce challenges and opportunities
Workforce training needs
Methods of training delivery
Emerging occupations
Changing roles for current allied health occupations
Potential partnerships with Maricopa County Community College District
Internships and clinical placements
Organizations were selected to represent, to the degree possible, the full range of potential
employers by size and the nature of the services that they provide. Outreach to provider
associations was instrumental in gathering general information on trends and identifying
providers to interview. One focus group was conducted with 10 Human Resource Directors
representing member agencies of the Arizona Council of Human Service Providers. A total
of 46 individuals participated in interviews and focus groups representing 23 organizations.
Additional efforts were made to schedule interviews with additional organizations but were
not able to be scheduled within the timeframe for the report. In some larger organizations,

11
more than one senior manager was interviewed. The interviews generally lasted one hour
or more and were conducted either in person or via conference call, depending on the
preferences of the respondents. Interviews were completed with senior managers from
organizations that, together, employ more than 100,000 persons (including but not
restricted to allied health care occupations).
The interviews with senior managers from healthcare and behavioral health organizations
produced findings in several areas including:
Issues related to current status and future need for allied health care personnel in
the respondents’ respective organizations.
Training needs for their existing workforce, changing roles in allied health
occupations and new or emerging occupations.
Suggestions for the organization of the Allied Health Needs Assessment Employer
Survey.
Potential opportunities for partnership with Maricopa County Community College
District and post-secondary academic institutions.
Any other comments that the respondents considered relevant.
A list of organizations and senior managers interviewed is presented in Appendix A.
Allied Health Needs Assessment Employer Survey
A brief review of recent allied healthcare workforce survey projects in Arizona other states
was conducted to provide context for the MCCCD project in Arizona. Projects from Alaska,
Arizona, California, Maryland and New York provided valuable information on survey design,
data collection, findings and lessons learned.
Interviews conducted with Human Resource Directors of healthcare organizations provided
feedback resulting in revisions to the approach for the Allied Health Needs Assessment
Survey. Key findings that were incorporated into the approach include:
Survey questions requesting data on vacancies and turnover were eliminated from
the Allied Health Needs Assessment Survey. Occupational trend data from existing
public reports will be utilized as a comprehensive data source.
Added a direct question addressing current partnerships with MCCCD. Specific
questions were added to the survey asking respondents for consent to share
information on emerging allied health occupations and partnership opportunities
with MCCCD to facilitate dialogue and follow up on potential opportunities.
Use of BLS – SOC Titles in the Allied Health Needs Assessment survey was
supported as a framework for occupations by healthcare administrators
interviewed. Suggestions were made and incorporated to clarify and supplement
some of the occupation titles (Medical and Health Services Managers and Natural
Sciences Mangers) with common job descriptions such as Health Services
Management, HealthCare Regulatory Compliance.

12
Human Resource Directors were the target respondents for the Allied Health Needs
Assessment survey. Information on allied healthcare occupations, recruitment
activity and qualifications of applicants is maintained in human resource
departments. Associations and organizations with the capacity to reach healthcare
employers were asked to distribute survey invitations. Examples of these
organizations include:
Arizona Council of Human Resource Providers
Arizona Dental Association
Arizona Alliance of Community Health Centers
Arizona Healthcare Human Resources Association (an affiliated chapter of the
American Society for Healthcare Human Resources Administration ASHHRA)
Arizona Hospital and Healthcare Association
In addition, survey invitations were sent to Human Services Directors and hiring
managers of small, medium and large allied health employers not included in the
above-mentioned organizations or associations. A list of more than 1000 statewide
organizations that participate with Maricopa County Community College District in
clinical partnerships was utilized as a resource. More than 332 organizations were
invited to participate in the Employer Survey between February 9- April 3, 2015
resulting in 26 responses.)
Allied Health Occupations Trend Analyses
Employment and wage data for the twenty-five occupations of interest to MCCCD were
obtained from U.S. Bureau of the Census, Bureau of Labor Statistics and from the
employment data and projections supplied by the Arizona Department of Administration
(AZDOA). Annual data for the period 2004-2012 were used to calculate average annual
rates of change and rank the occupations by the relative size of their growth rates.
To test for possible inflections in trends, average annual rates of change were also
calculated for the period 2008-2012 and compared to the longer period results. Initial
estimates using OLS regression produced results little different from the application of the
annual rates of change and the latter were used to project changes in employment for the
period 2013-2020.
Our projections were compared to recent estimates from AZDOA as a safeguard against
errors attributable to incorrect assumptions or errors in data even though the two sets of
projections are not strictly comparable. Differences that could affect decision making were
discussed and recommended interpretations were described.
A final set of projections were described in terms of the number of potential jobs, the
product of the employment size of an occupation and the growth rate, as the most relevant
for MCCCD decision making regarding potential demand for students.
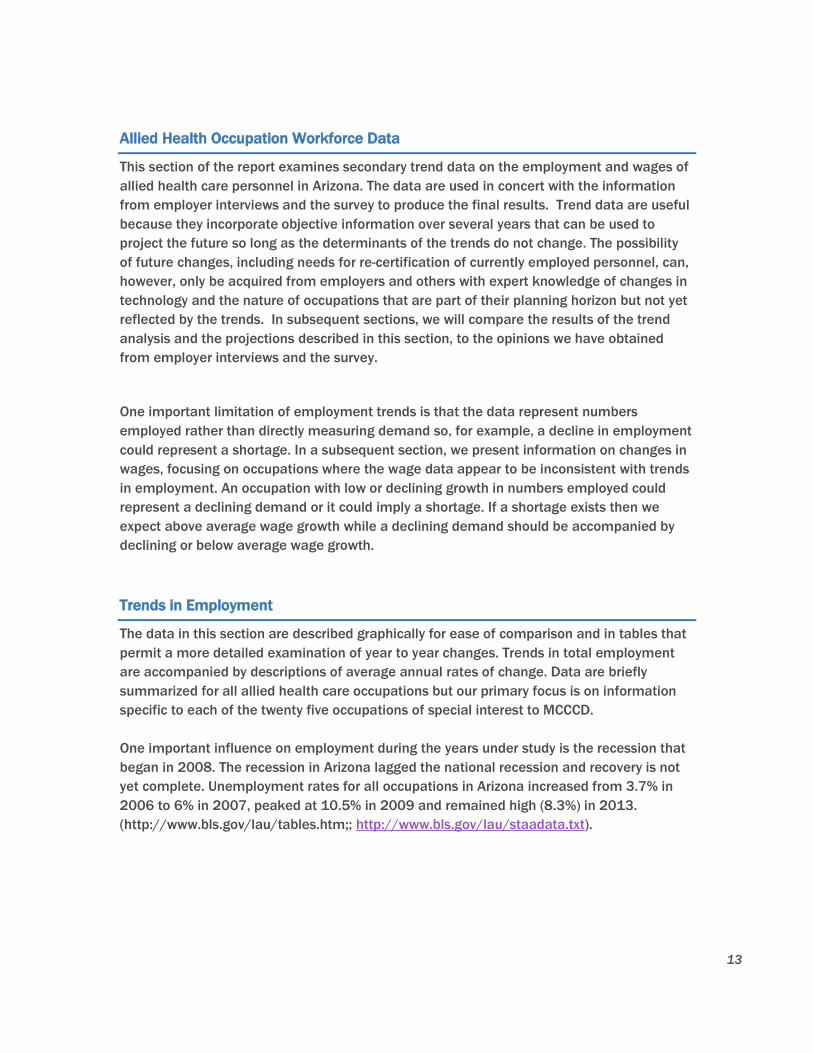
13
Allied Health Occupation Workforce Data
This section of the report examines secondary trend data on the employment and wages of
allied health care personnel in Arizona. The data are used in concert with the information
from employer interviews and the survey to produce the final results. Trend data are useful
because they incorporate objective information over several years that can be used to
project the future so long as the determinants of the trends do not change. The possibility
of future changes, including needs for re-certification of currently employed personnel, can,
however, only be acquired from employers and others with expert knowledge of changes in
technology and the nature of occupations that are part of their planning horizon but not yet
reflected by the trends. In subsequent sections, we will compare the results of the trend
analysis and the projections described in this section, to the opinions we have obtained
from employer interviews and the survey.
One important limitation of employment trends is that the data represent numbers
employed rather than directly measuring demand so, for example, a decline in employment
could represent a shortage. In a subsequent section, we present information on changes in
wages, focusing on occupations where the wage data appear to be inconsistent with trends
in employment. An occupation with low or declining growth in numbers employed could
represent a declining demand or it could imply a shortage. If a shortage exists then we
expect above average wage growth while a declining demand should be accompanied by
declining or below average wage growth.
Trends in Employment
The data in this section are described graphically for ease of comparison and in tables that
permit a more detailed examination of year to year changes. Trends in total employment
are accompanied by descriptions of average annual rates of change. Data are briefly
summarized for all allied health care occupations but our primary focus is on information
specific to each of the twenty five occupations of special interest to MCCCD.
One important influence on employment during the years under study is the recession that
began in 2008. The recession in Arizona lagged the national recession and recovery is not
yet complete. Unemployment rates for all occupations in Arizona increased from 3.7% in
2006 to 6% in 2007, peaked at 10.5% in 2009 and remained high (8.3%) in 2013.
(http://www.bls.gov/lau/tables.htm;; http://www.bls.gov/lau/staadata.txt).
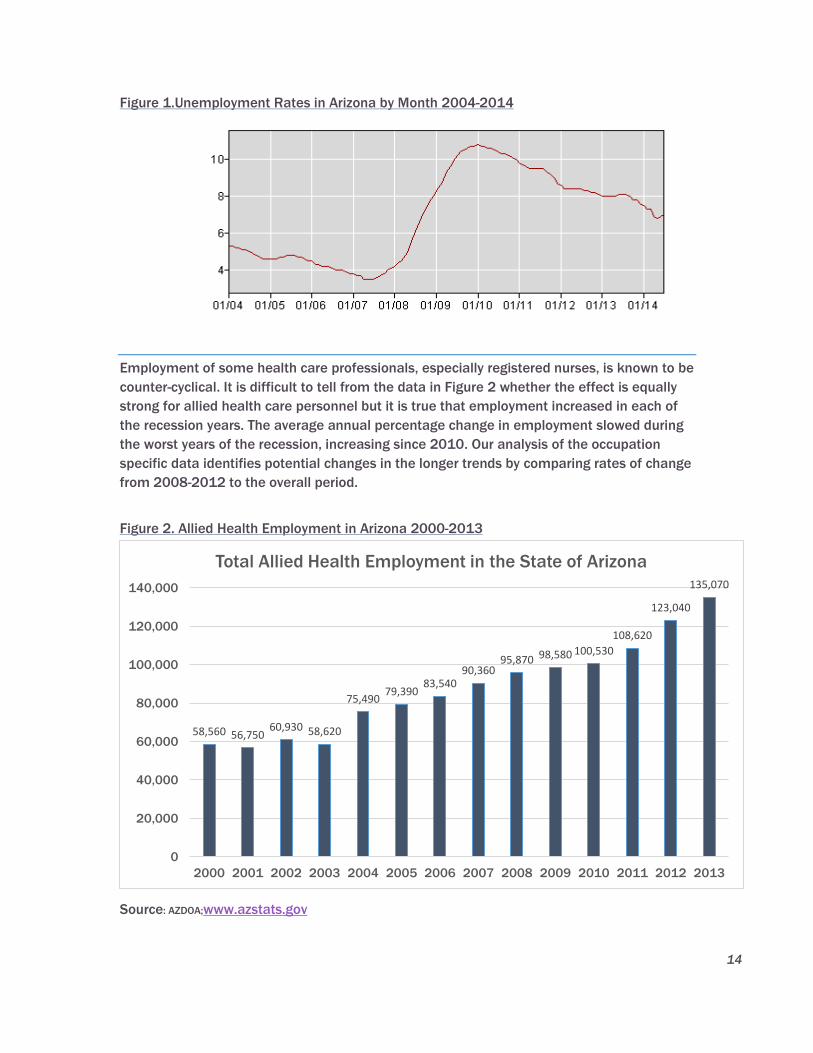
14
Figure 1.Unemployment Rates in Arizona by Month 2004-2014
Employment of some health care professionals, especially registered nurses, is known to be
counter-cyclical. It is difficult to tell from the data in Figure 2 whether the effect is equally
strong for allied health care personnel but it is true that employment increased in each of
the recession years. The average annual percentage change in employment slowed during
the worst years of the recession, increasing since 2010. Our analysis of the occupation
specific data identifies potential changes in the longer trends by comparing rates of change
from 2008-2012 to the overall period.
Figure 2. Allied Health Employment in Arizona 2000-2013
Source: AZDOA;www.azstats.gov
58,560 56,750 60,930 58,620
75,490 79,390
83,540 90,360
95,870 98,580 100,530
108,620
123,040
135,070
0
20,000
40,000
60,000
80,000
100,000
120,000
140,000
2000 2001 2002 2003 2004 2005 2006 2007 2008 2009 2010 2011 2012 2013
Total Allied Health Employment in the State of Arizona
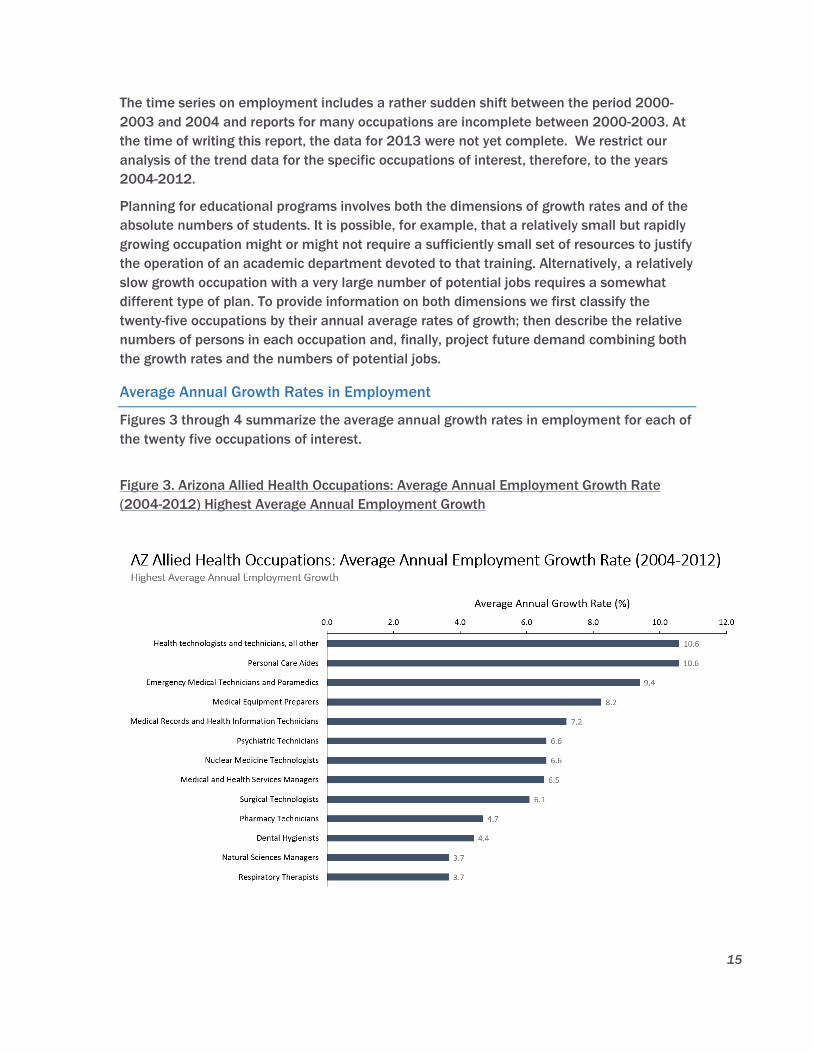
15
The time series on employment includes a rather sudden shift between the period 2000-
2003 and 2004 and reports for many occupations are incomplete between 2000-2003. At
the time of writing this report, the data for 2013 were not yet complete. We restrict our
analysis of the trend data for the specific occupations of interest, therefore, to the years
2004-2012.
Planning for educational programs involves both the dimensions of growth rates and of the
absolute numbers of students. It is possible, for example, that a relatively small but rapidly
growing occupation might or might not require a sufficiently small set of resources to justify
the operation of an academic department devoted to that training. Alternatively, a relatively
slow growth occupation with a very large number of potential jobs requires a somewhat
different type of plan. To provide information on both dimensions we first classify the
twenty-five occupations by their annual average rates of growth; then describe the relative
numbers of persons in each occupation and, finally, project future demand combining both
the growth rates and the numbers of potential jobs.
Average Annual Growth Rates in Employment
Figures 3 through 4 summarize the average annual growth rates in employment for each of
the twenty five occupations of interest.
Figure 3. Arizona Allied Health Occupations: Average Annual Employment Growth Rate
(2004-2012) Highest Average Annual Employment Growth
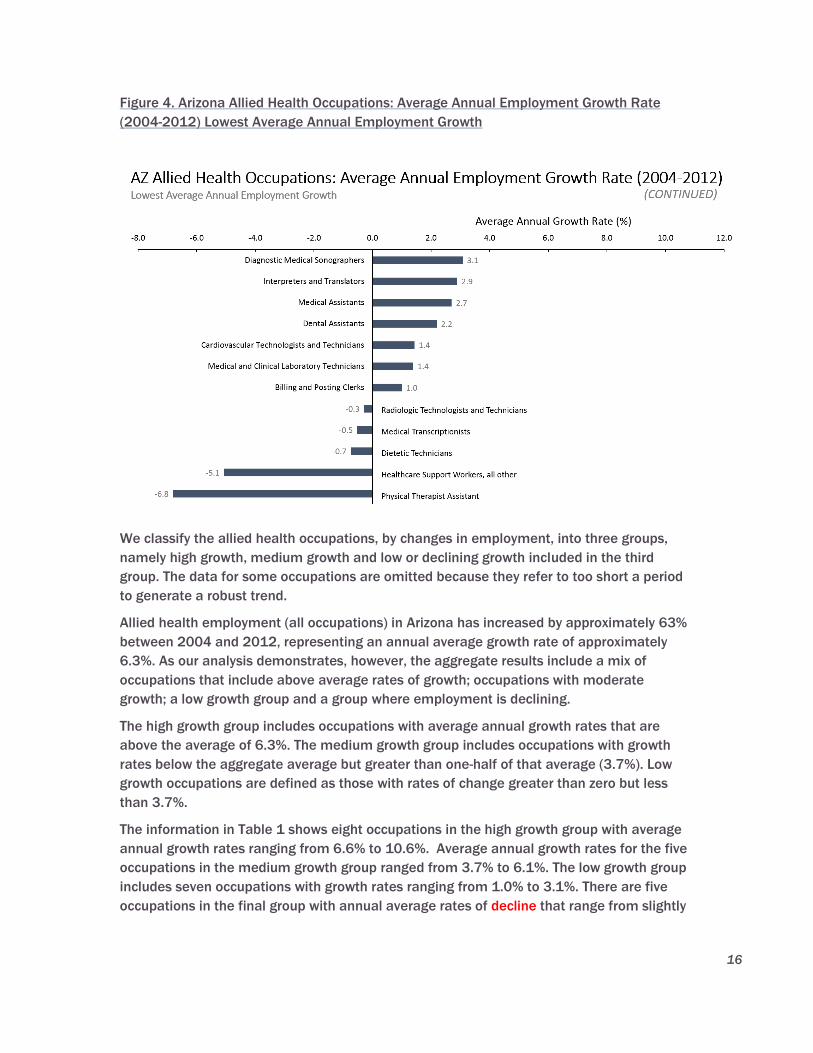
16
Figure 4. Arizona Allied Health Occupations: Average Annual Employment Growth Rate
(2004-2012) Lowest Average Annual Employment Growth
We classify the allied health occupations, by changes in employment, into three groups,
namely high growth, medium growth and low or declining growth included in the third
group. The data for some occupations are omitted because they refer to too short a period
to generate a robust trend.
Allied health employment (all occupations) in Arizona has increased by approximately 63%
between 2004 and 2012, representing an annual average growth rate of approximately
6.3%. As our analysis demonstrates, however, the aggregate results include a mix of
occupations that include above average rates of growth; occupations with moderate
growth; a low growth group and a group where employment is declining.
The high growth group includes occupations with average annual growth rates that are
above the average of 6.3%. The medium growth group includes occupations with growth
rates below the aggregate average but greater than one-half of that average (3.7%). Low
growth occupations are defined as those with rates of change greater than zero but less
than 3.7%.
The information in Table 1 shows eight occupations in the high growth group with average
annual growth rates ranging from 6.6% to 10.6%. Average annual growth rates for the five
occupations in the medium growth group ranged from 3.7% to 6.1%. The low growth group
includes seven occupations with growth rates ranging from 1.0% to 3.1%. There are five
occupations in the final group with annual average rates of decline that range from slightly
17
more than -0.3% to – 6.8%. There are six occupations for which the data are not sufficient
to estimate a trend.
Average annual growth rates are useful as comparable measures among the many
occupations but the results for individual occupations require additional analysis. To better
visualize year to year variations in the trends, employment that is larger than that in the
previous year is presented in green; declines from the previous year are depicted in red and
small changes (effectively stable) are printed in black. The data for 2004 are in black since
we do not compare 2004 to 2003.
The final right hand column of the table indicates the rank of the occupation by number of
persons employed in 2012.
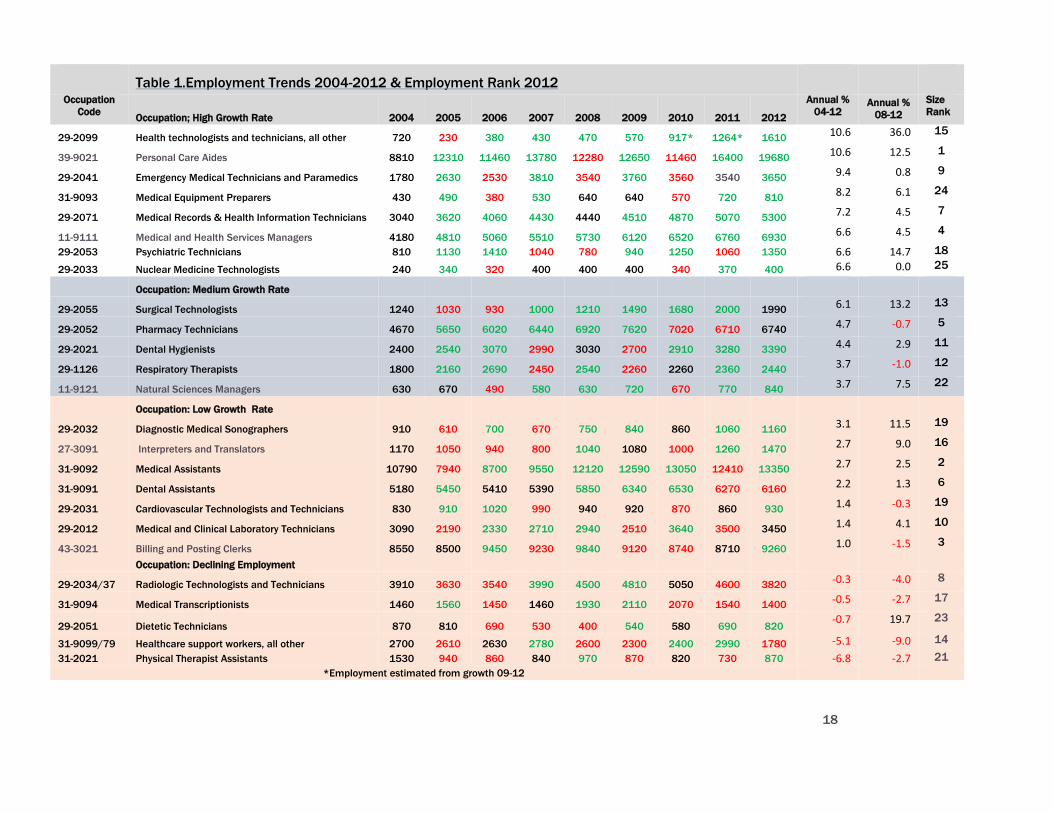
18
Table 1.Employment Trends 2004-2012 & Employment Rank 2012
Occupation
Code Occupation; High Growth Rate 2004 2005 2006 2007 2008 2009 2010 2011 2012
Annual %
04-12 Annual %
08-12
Size
Rank
29-2099 Health technologists and technicians, all other 720 230 380 430 470 570 917* 1264* 1610 10.6 36.0 15
39-9021 Personal Care Aides 8810 12310 11460 13780 12280 12650 11460 16400 19680 10.6 12.5 1
29-2041 Emergency Medical Technicians and Paramedics 1780 2630 2530 3810 3540 3760 3560 3540 3650 9.4 0.8 9
31-9093 Medical Equipment Preparers 430 490 380 530 640 640 570 720 810 8.2 6.1 24
29-2071 Medical Records & Health Information Technicians 3040 3620 4060 4430 4440 4510 4870 5070 5300 7.2 4.5 7
11-9111 Medical and Health Services Managers 4180 4810 5060 5510 5730 6120 6520 6760 6930 6.6 4.5 4
29-2053 Psychiatric Technicians 810 1130 1410 1040 780 940 1250 1060 1350 6.6 14.7 18
29-2033 Nuclear Medicine Technologists 240 340 320 400 400 400 340 370 400 6.6 0.0 25
Occupation: Medium Growth Rate
29-2055 Surgical Technologists 1240 1030 930 1000 1210 1490 1680 2000 1990 6.1 13.2 13
29-2052 Pharmacy Technicians 4670 5650 6020 6440 6920 7620 7020 6710 6740 4.7 -0.7 5
29-2021 Dental Hygienists 2400 2540 3070 2990 3030 2700 2910 3280 3390 4.4 2.9 11
29-1126 Respiratory Therapists 1800 2160 2690 2450 2540 2260 2260 2360 2440 3.7 -1.0 12
11-9121 Natural Sciences Managers 630 670 490 580 630 720 670 770 840 3.7 7.5 22
Occupation: Low Growth Rate
29-2032 Diagnostic Medical Sonographers 910 610 700 670 750 840 860 1060 1160 3.1 11.5 19
27-3091 Interpreters and Translators 1170 1050 940 800 1040 1080 1000 1260 1470 2.7 9.0 16
31-9092 Medical Assistants 10790 7940 8700 9550 12120 12590 13050 12410 13350 2.7 2.5 2
31-9091 Dental Assistants 5180 5450 5410 5390 5850 6340 6530 6270 6160 2.2 1.3 6
29-2031 Cardiovascular Technologists and Technicians 830 910 1020 990 940 920 870 860 930 1.4 -0.3 19
29-2012 Medical and Clinical Laboratory Technicians 3090 2190 2330 2710 2940 2510 3640 3500 3450 1.4 4.1 10
43-3021 Billing and Posting Clerks 8550 8500 9450 9230 9840 9120 8740 8710 9260 1.0 -1.5 3
Occupation: Declining Employment
29-2034/37 Radiologic Technologists and Technicians 3910 3630 3540 3990 4500 4810 5050 4600 3820 -0.3 -4.0 8
31-9094 Medical Transcriptionists 1460 1560 1450 1460 1930 2110 2070 1540 1400 -0.5 -2.7 17
29-2051 Dietetic Technicians 870 810 690 530 400 540 580 690 820 -0.7 19.7 23
31-9099/79 Healthcare support workers, all other 2700 2610 2630 2780 2600 2300 2400 2990 1780 -5.1 -9.0 14
31-2021 Physical Therapist Assistants 1530 940 860 840 970 870 820 730 870 -6.8 -2.7 21
*Employment estimated from growth 09-12
19
The two most rapidly growing occupations in the high growth group are Health
Technologists and Technicians (29-2099) and Personal Care Aides (39-9021) with annual
average growth rates of 10.6% each. It seems likely that the growth in these occupations is
an example of (1) the increasing use of technology to substitute for personnel and (2)the
well-known, dramatic expansion in the elderly population caused by the “baby boom”.
The growth in employment for these two groups is continuing. There is some year to year
variation but employment of Health Technologists increased at an average annual growth
rate of 36.0% between 2008-2012. The growth rate for the same period is 12.5% for
Personal Care Aides, slightly above its longer term average. The number of persons
employed as Health Technologists is not very large (N=1,610) but more persons employed
as Personal Care Aides (N=19,680) than in any of the other occupations that we study.
Approximately 19,680 persons worked as Personal Care Aides in 2012. Thus, a one percent
change in employment implies a much larger increase in the number of potential trainees
for Personal Care Aides than for Health Technologists.
The employment of Emergency Medical Technicians and Paramedics (29-2041) grew at an
annual average rate of 9.4% between 2004 and 2012. Although year to year variations are
relatively small, there are three years in which employment dropped, one year in which it
was stable and four years in which employment increased. The growth in employment has
rather dramatically slowed in recent years with an average annual growth rate of only 0.8%
between 2008-2012. The overall rate of 8.3% really only represents growth in the years
from 2004-2008 and is not a good predictor of the future unless some structural change
occurs. The number of persons employed as Emergency Medical Technicians and
Paramedics (N=1,610) ranks 15th out of 24 occupations.
The next of the high growth occupations is Medical Equipment Preparers (931-9093).
Employment increased at an annual average rate of 8.2% from 2004-2012. Employment
was unchanged during the first two years of the recession (2008-2009), declined in two
years and increased in two years. The increases are slowing slightly, with growth rates
between 2008-2012 dropping to 6.1%. There are relatively few persons employed in the
occupation, ranking next to last in terms of numbers employed.
Medical Records and HIT Technicians (29-2071) is the sixth ranked occupation in terms of
numbers of persons employed. The occupation experienced the most rapid growth of
occupations in the medium growth group with an annual average growth rate (7.2%). The
trend has been consistent with no years in which employment fell and only one year in
which there was no change in employment. Recent growth has slowed, however, with the
average growth rate falling to 4.5%.
The next three occupations in the share an annual average growth rate of 6.6% for 2004-
2012 but differ greatly in terms of their likely future growth and in their relative importance
in terms of numbers of workers and potential students.
Medical and Health Services Managers (11-9111) includes the largest number of workers
of the three occupations, ranking 4th among all the 24 allied health occupations. The
High Growth Occupations
20
growth in employment over time is the most consistent of the three occupations, increasing
in every year since 2004 , but the growth rate declined to 4.9% in the 2008-2012 time
period.
Psychiatric Technicians (29-2053) is the next largest occupational group among the three,
ranking 17th among the 24 occupations. The trend in employment has been subject to
considerable year to year variation. Employment increased in five years and declined in
three others. The recent (2008-20012) trend reveals a much higher rate of growth, namely
14.7% than the longer term average. That result may, however, be deceptive because,
during the first year of the recession (2008), employment dropped to the lowest number in
the series, from 1,040 to 780, a 25% reduction in one year. The drop was followed by a
21% increase in employment in 2009. Variations of this size are somewhat suspect
because they may indicate problems with data collection. Whatever the cause, when 780 is
used as the base in calculating recent trends, it greatly increases the estimated annual
average rates of change.
The third and smallest group of workers whose employment increased annually by 6.6% is
Nuclear Medicine Technologists (29-2033). There were only 400 workers employed in this
occupation in 2012, making it the 24th of 24 occupations in terms of the size of
employment. Employment trends are unusually stable with employment unchanged in
three of the years; increasing in three years and declining in two years. The changes, both
positive and negative, are, however, very small. Recent trends suggest that the stability will
continue. The number of persons employed in 2012 is exactly equal to the number
employed in 2008.
Medium Growth Occupations
Surgical Technologists (29-2055) rank fourth in rates of growth among the moderate
growth group with an annual average growth rate of 6.1%. They rank 13th by size of
employment, with nearly 2,000 persons employed in 2012. Employment declined in two
early years but has steadily increased since then with the exception of 2012 when there
was essentially no change from the previous year. Employment grew more rapidly in the
2008-2012 period, with an annual average rate of approximately 13.2%. Employment may,
however, have reached a plateau since approximately the same number of persons were
employed in 2013 (partial year data) as in 2011 and 2012. The trend data suggest, absent
additional information, suggest that the employment of Surgical Technologists is unlikely to
increase in the next few years.
Pharmacy Technicians(29-2052) are one of the larger occupations, ranking 5th out of 24
occupations with total employment equal to 6,940 in 2012. Employment increased
consistently from 2004-2009 then decrease in 2010 and 2011. The rate for the last five
years shows an average decline of -0.7% compared to an annual average increase of 4.7%
for the full period.
The trend in employment for Dental Hygienists (29-2021) is one of moderate increase
(4.4% annually) with moderate year to year variations. The trend in the five most recent
years is one of positive growth at diminishing rates with an average equal to 2.9%. Ranked
11th in size of employment, 3,390 persons worked as Dental Hygienists in 2012.
21
Ranked next to Dental Hygienists in size of employment, Respiratory Therapists (29-1126)
grew in size at 3.7% annually for the nine year period with rather minor year to year
variation in numbers employed. Between 2008 and 2012, employment changed by only
110 persons, decreasing from 2,540 to 2,440. The average annual rate for the recent years
was, therefore, negative at -1.0%. Preliminary, partial year data from 2013 show an
increase of more than 200 workers. The year to year variations suggest that employment in
this occupation is likely to increase slightly in the future.
Natural Sciences Managers (11-9121) are one of the smallest of the occupations, ranking
21st of 24 occupations in employment size. The trend in employment is characterized by
relatively small changes from year to year with an annual average of 3.7% growth.
Employment in 2010 was, for example, equal to the number employed in 2005 and
essentially the same (only 10 persons different) as in 2004. Most of the growth
represented by the 3.3% rate is due to increase that occurred during 2011 and 2012. The
annual average rate of change (2008-2012) was, for example, 7.5%. There was, however, a
small drop in employment for partial year 2013, so the potential for future increases is
uncertain. It is likely that the best available assumption for prediction is the annual average
rate of 3.3%.
Low Growth Occupations
The trend for Diagnostic Medical Sonographers (29-2032) shares the characteristics of the
trend for the preceding occupation. That is, one of relative stability for most years with
significant increases in 2011 and 2012. The important difference between the two
occupations, however, is that for this group, the 2013 data show a continuing increase. The
long period average annual growth rate is 3.1% and the recent trend indicates an average
rate of 11.5%. The occupation has an employment size rank of 18. The trend results
suggest that employment will continue to increase at rates above the current long term
average.
Interpreters and Translators (27-3091) exhibit a rather curious trend in employment.
Despite an annual average growth rate of 2.7%, employment declined in four of the nine
years and was effectively constant in a fifth year. The number of employed workers was
lower than in 2004 in every year until 2011. The positive growth rate is largely the result of
relatively large increases in 2011 and 2012 as reflected by the annual growth in recent
years of 9.0%. Employment continued to increase in 2013. The trend data imply that
employment will continue to expand, growing at rates in excess of 2.6%.
Medical Assistants (31-9092) experienced only two years in which employment declined
but growth has been modest with an average annual rate of 2.7%. The trend remains quite
stable when the time period is restricted to 2008-2012, dropping slightly to 1.3%. The
group is, however, the second largest in terms of numbers employed so small changes in
percentages represent a relatively large number of jobs and the potential for a need for
training.
Although growth rates (1.9%) for Dental Assistants (31-9091) are nearly equal to those for
Medical Assistants, the trend is different with several years without changes in employment
and, potentially more important, declines in the two most recent years. Preliminary data
22
show a slight increase in 2013 but total employment in 2013 is less than in 2010. Ranked
6th in terms of size of employment, the data suggest that , at best, employment will be
relatively stable with some demand for new employees to replace attrition. It is not known,
however, how many trained dental assistants may be employed in other fields since there
has been such limited expansion since 2004.
Cardiovascular Technologists and Technicians (29-2031) represent a relatively small group
of allied healthcare workers, ranking 19th out of 23 in employment size. Employment
increased in two of the years, declined in two years and remained the same in three years.
The result is a relatively stable trend characterized by a low annual average rate of change
of 1.3%. The more recent trend indicates a decline of -0.2% but that change is sufficiently
small to be within variations around the historical trend so it seems reasonable to expect
that growth should continue at the long term rate.
The Medical and Clinical Laboratory Technicians (29-2012) occupation includes
approximately 3,450 employed workers in 2012, ranking 10th in employment size. The long
term average annual growth rate is 1.4% with an increase in recent years to 4.1%.
Employment in this occupation declined after 2007, not closely approaching the number of
persons employed in 2007 until 2008. The partial year data for 2013 show, however, a
reduction that lowers employment to the 2008 level, suggesting that the trend is reverting
to the longer term growth rate.
The occupation that sits at the boundary between low growth and declines is Billing and
Posting Clerks (43-3021). It is a very large group, ranking third in terms of employment, but
it has both a very low growth rate (1.0%), further reduced by a decline in the more recent
years of -1.5%. The 2013 data show an additional decline, although it is small in absolute
terms. Although further decline is possible, we think it is reasonable to assume that the
longer term trend will prevail.
Declining Occupations
Four of the five occupations with declines in employment show declines in both the long
term and the more recent years. The exception is Dietetic Technicians (929-2051) with a
long term rate of decline equal to -0.7% but a positive growth rate of 19.7% for the period
2008-2012. The 2012 employment was 820 persons, the first time since 2005 that the
number was greater than 800 since 2005, with employment in the intervening years
ranging from 200 to 690. Employment did increase slightly in 2013 so it is possible that
the long term trend may be converted to one of small but more stable growth.
Radiologic Technologists and Technicians (29-2034/2037) is the largest in number of the
declining occupations, ranking 8th in employment size. Its long term rate of decline (-0.3%)
increased significantly to -4.0% in the more recent period, reinforcing the downward trend.
A similar pattern of long term decline with rates of decline increasing for the 2008-2012
period is observed for two other occupations. The long and more recent rates of decline for
the three are respectively : -0.5% and -2.7% for Medical Transcriptionists (31-9094); -5.1%
and -9.0% for Healthcare Support Workers (31-9099/9079).
23
Physical Therapist Assistants (31-2021) had the largest average annual rate of decline for
the entire period (-6.8%). Although the rate of decline moderates in recent years, (-2.7%)
the trend is clearly toward declining employment.
Summary of Trend Data
The trend data for 2004-2012 show that eight occupations have annual average growth
rates that exceed the overall growth rate for all allied healthcare occupations combined.
The remaining occupations include twelve groups with low to moderate growth and five
occupations where the trend is clearly negative. We also examined trends from 2008-2012
which include the most severe years of the recent recession and speculated on how
differences between them and the longer term results could influence the future. The
differences between the longer and more recent trends do not, however, consistently
reinforce or contradict the longer term trends, making it difficult to evaluate associations
between differences in the trends and the gradual, not yet complete, recovery from the
recession.
The information presented in this section has ranked occupations by growth rates, and
rankings by size of employment have been described. The demand for training, however, is
based on the number of persons being sought by employers. Our projections for the future,
which are described in the next section use the product of number employed and growth
rates to predict the likely number of jobs for which trained personnel will be needed.
Trend data are always limited by the fact that they simply extend past behavior without any
substantive content. As we have stated, therefore, the trend data results will be compared
to the expert opinions and the responses from the general survey. The strongest set of
inferences will be created in those cases where the three sources of information agree.
Projections Ranked by Growth Rates
This section describes our estimates of the changes in employment for each of the
occupations between 2012 and 2020. Predictions of employment are typically based on
the extrapolation of past trends. Although this is often the best available information, trend
predictions are valid only to the extent that the underlying structure of influences on
employment is stable over time. The information presented in this section needs to be
interpreted with those limitations in mind. Trend projections are useful so long as they are
interpreted as very general approximations of the likely future. Turning points associated
with changes in the structural relationships are rarely, if ever, predicted from trend data as
many investors in stock markets have learned to their regret. It is literally impossible to
predict future events unless the structure of influences embedded in historical data does
not change or the changes are known in advance.
The influences on the demand for allied health care workers that can change include the
expansion of health insurance coverage under the ACA; the limitations on the ACA that
could be imposed by the U.S. Supreme Court decision in June; the recent state legislation
limiting payments to AHCCCS providers; changes in technology, such as the recent changes
in technologies that included automated lab tests, electronic health records and language
translation. Changes in the types of health care services include the aging of the population
24
with the increase in the management of chronic illness, although that should be reflected in
part by the current trends. We hope to complement the trend based projections with the
information on potential changes gathered from the employer interviews.
We suggest that the projections be interpreted as very general but useful approximations
and not as precise estimates. Large differences in the numbers employed or the growth
rates of wages and employment should be accepted as meaningful. Small differences
should be interpreted to be within the cone of probable error.
Recognition of the limitations must not, however, lead to dismissal of the trend results.
Rather they should be compared to the next best alternatives for planning for the future.
Too often, organizations adopt strategies more based on the presentation skills and
commitments of their authors than the likelihood of success.
The projections shown in Table 2 apply the long term growth rates, with a few exceptions, to
the 2012 data to estimate the number of persons employed in allied health care in Arizona
in each of the relevant occupations.
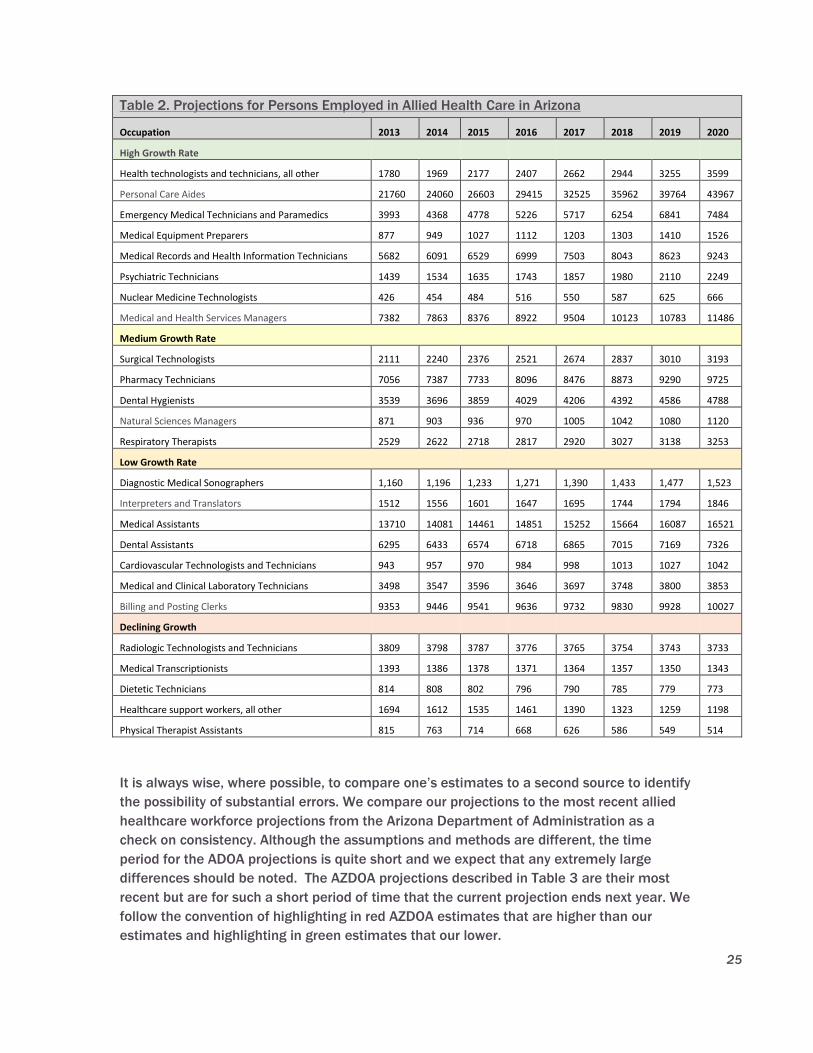
25
Table 2. Projections for Persons Employed in Allied Health Care in Arizona
Occupation 2013 2014 2015 2016 2017 2018 2019 2020
High Growth Rate
Health technologists and technicians, all other 1780 1969 2177 2407 2662 2944 3255 3599
Personal Care Aides 21760 24060 26603 29415 32525 35962 39764 43967
Emergency Medical Technicians and Paramedics 3993 4368 4778 5226 5717 6254 6841 7484
Medical Equipment Preparers 877 949 1027 1112 1203 1303 1410 1526
Medical Records and Health Information Technicians 5682 6091 6529 6999 7503 8043 8623 9243
Psychiatric Technicians 1439 1534 1635 1743 1857 1980 2110 2249
Nuclear Medicine Technologists 426 454 484 516 550 587 625 666
Medical and Health Services Managers 7382 7863 8376 8922 9504 10123 10783 11486
Medium Growth Rate
Surgical Technologists 2111 2240 2376 2521 2674 2837 3010 3193
Pharmacy Technicians 7056 7387 7733 8096 8476 8873 9290 9725
Dental Hygienists 3539 3696 3859 4029 4206 4392 4586 4788
Natural Sciences Managers 871 903 936 970 1005 1042 1080 1120
Respiratory Therapists 2529 2622 2718 2817 2920 3027 3138 3253
Low Growth Rate
Diagnostic Medical Sonographers 1,160 1,196 1,233 1,271 1,390 1,433 1,477 1,523
Interpreters and Translators 1512 1556 1601 1647 1695 1744 1794 1846
Medical Assistants 13710 14081 14461 14851 15252 15664 16087 16521
Dental Assistants 6295 6433 6574 6718 6865 7015 7169 7326
Cardiovascular Technologists and Technicians 943 957 970 984 998 1013 1027 1042
Medical and Clinical Laboratory Technicians 3498 3547 3596 3646 3697 3748 3800 3853
Billing and Posting Clerks 9353 9446 9541 9636 9732 9830 9928 10027
Declining Growth
Radiologic Technologists and Technicians 3809 3798 3787 3776 3765 3754 3743 3733
Medical Transcriptionists 1393 1386 1378 1371 1364 1357 1350 1343
Dietetic Technicians 814 808 802 796 790 785 779 773
Healthcare support workers, all other 1694 1612 1535 1461 1390 1323 1259 1198
Physical Therapist Assistants 815 763 714 668 626 586 549 514
It is always wise, where possible, to compare one’s estimates to a second source to identify
the possibility of substantial errors. We compare our projections to the most recent allied
healthcare workforce projections from the Arizona Department of Administration as a
check on consistency. Although the assumptions and methods are different, the time
period for the ADOA projections is quite short and we expect that any extremely large
differences should be noted. The AZDOA projections described in Table 3 are their most
recent but are for such a short period of time that the current projection ends next year. We
follow the convention of highlighting in red AZDOA estimates that are higher than our
estimates and highlighting in green estimates that our lower.
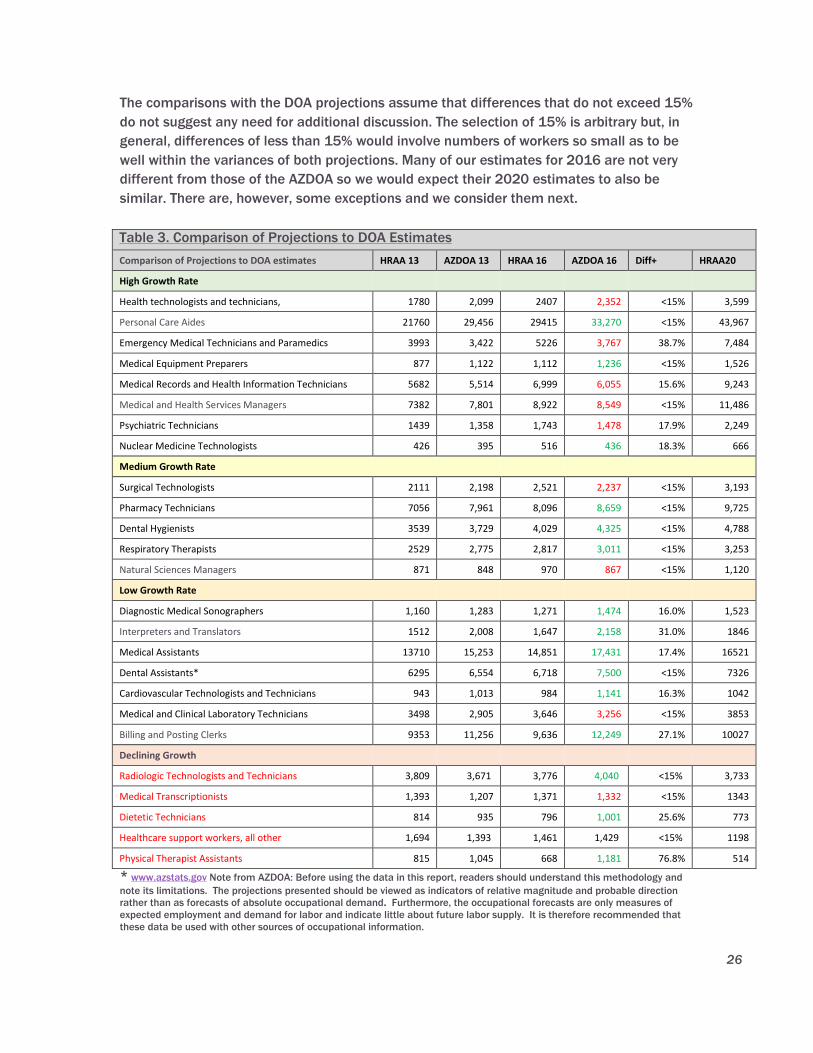
26
The comparisons with the DOA projections assume that differences that do not exceed 15%
do not suggest any need for additional discussion. The selection of 15% is arbitrary but, in
general, differences of less than 15% would involve numbers of workers so small as to be
well within the variances of both projections. Many of our estimates for 2016 are not very
different from those of the AZDOA so we would expect their 2020 estimates to also be
similar. There are, however, some exceptions and we consider them next.
Table 3. Comparison of Projections to DOA Estimates
Comparison of Projections to DOA estimates HRAA 13 AZDOA 13 HRAA 16 AZDOA 16 Diff+ HRAA20
High Growth Rate
Health technologists and technicians, 1780 2,099 2407 2,352 <15% 3,599
Personal Care Aides 21760 29,456 29415 33,270 <15% 43,967
Emergency Medical Technicians and Paramedics 3993 3,422 5226 3,767 38.7% 7,484
Medical Equipment Preparers 877 1,122 1,112 1,236 <15% 1,526
Medical Records and Health Information Technicians 5682 5,514 6,999 6,055 15.6% 9,243
Medical and Health Services Managers 7382 7,801 8,922 8,549 <15% 11,486
Psychiatric Technicians 1439 1,358 1,743 1,478 17.9% 2,249
Nuclear Medicine Technologists 426 395 516 436 18.3% 666
Medium Growth Rate
Surgical Technologists 2111 2,198 2,521 2,237 <15% 3,193
Pharmacy Technicians 7056 7,961 8,096 8,659 <15% 9,725
Dental Hygienists 3539 3,729 4,029 4,325 <15% 4,788
Respiratory Therapists 2529 2,775 2,817 3,011 <15% 3,253
Natural Sciences Managers 871 848 970 867 <15% 1,120
Low Growth Rate
Diagnostic Medical Sonographers 1,160 1,283 1,271 1,474 16.0% 1,523
Interpreters and Translators 1512 2,008 1,647 2,158 31.0% 1846
Medical Assistants 13710 15,253 14,851 17,431 17.4% 16521
Dental Assistants* 6295 6,554 6,718 7,500 <15% 7326
Cardiovascular Technologists and Technicians 943 1,013 984 1,141 16.3% 1042
Medical and Clinical Laboratory Technicians 3498 2,905 3,646 3,256 <15% 3853
Billing and Posting Clerks 9353 11,256 9,636 12,249 27.1% 10027
Declining Growth
Radiologic Technologists and Technicians 3,809 3,671 3,776 4,040 <15% 3,733
Medical Transcriptionists 1,393 1,207 1,371 1,332 <15% 1343
Dietetic Technicians 814 935 796 1,001 25.6% 773
Healthcare support workers, all other 1,694 1,393 1,461 1,429 <15% 1198
Physical Therapist Assistants 815 1,045 668 1,181 76.8% 514
* www.azstats.gov Note from AZDOA: Before using the data in this report, readers should understand this methodology and
note its limitations. The projections presented should be viewed as indicators of relative magnitude and probable direction
rather than as forecasts of absolute occupational demand. Furthermore, the occupational forecasts are only measures of
expected employment and demand for labor and indicate little about future labor supply. It is therefore recommended that
these data be used with other sources of occupational information.
27
The differences in the estimates for the Nuclear Medical Technologist and the
Cardiovascular Technologists and Technicians occupations meet the 15+% criterion but the
differences are so small (80 cases and 157 cases respectively) that further discussion
would imply greater degrees of accuracy in the estimates than are justified. Of the
remaining nine occupations that meet the criterion, there are six for which the ADOA
projects larger numbers of jobs and only three where the ADOA estimate is lower. There
are no differences between the estimates in the medium growth rate group that differ by
15% or more.
The lower ADOA projections are for occupations in our high growth rate group, namely EMTs
and Paramedics, Medical Records and Health Information Technologists and Psychiatric
Technicians.
The difference for Medical Records and Health Information Technologists only fractionally
exceeds the 15% standard although the group is relatively large so the absolute difference
is approximately 944 cases. We do not consider the differences in the assumed growth
rates, however, to be sufficient to revise our estimates.
Our evaluation of the other differences in the high growth rate group suggests that our
projection for EMTs and Paramedics may overstate the expected growth but that the
projection for Psychiatric Technicians is quite reasonable.
The uncertainty surrounding the estimated employment for EMTs includes the cautions in
our previous discussion about the recent slowing of growth rates (a potential negative) and
the possible expansion of the duties of EMTs that have been mentioned in the interviews (a
potential positive). Our projection uses the annual average rate of 9.4% but the rate of
growth in the period 2008-2012 is less than one percent (0.8%). AZDOA is projecting
growth in employment at approximately 3.25% annually and this plus a relatively small
difference between the base year numbers for the two projections, is the reason for the
large difference in the results.
Data just released for employment in May, 2014 also suggest that our projection is too
high, although comparisons to a single year are always problematic.
(http://www.bls.gov/oes/current/oes_az.htm). On the other hand, our subsequent section
on interview and survey results includes employer comments and related information
predicting significant changes in the scope of practice and utilization of EMTs. Never the
less, the uncertainty surrounding recent rates of growth suggests that the reader must
make a judgement about the most probable estimate between the two projections and that
our estimate should be considered an upper bound. We cannot estimate the potential
increase in employment that could be occasioned by the implementation of the integrated
care organizations.
As we have noted, the average annual growth rates for Psychiatric Technicians during the
period 2008-2012 are more than twice as high as the longer term rate of 6.6% that we
used for our estimates. That fact, combined with the expansion in psychiatric care that is
beginning as a result of the new integrated care models convinces us that our current
projection is reasonable.
28
Omitting the one occupation for which the difference in absolute numbers is quite small,
there are four occupations in the Low Growth Rate group for which the difference between
our projection and the AZDOA estimate is 15+%. The largest percentage differences are for
Interpreters and Translators (31%) and Billing and Posting Clerks (27.1%).
Reference to the May 2014 employment data shows that our estimate for 2014 for
Interpreters and Translators is essentially equal to the actual numbers employed in 2014
while the AZDOA projection is substantially higher. Although the 2014 data are not for the
complete year, we find no reason to change our projection.
We project the future employment for Billing and Posting Clerks at an average annual
growth rate of 1.0% despite the fact that in more recent years (2008-2012), employment
declined. Comparison to the preliminary 2014 data shows that our estimate is lower than
the actual by approximately 12%. The AZDOA projection assumes an average annual
growth rate of 2.89% for which we find no justification in the historical data, so we assume
our projection is reasonable.
The differences in estimates for Diagnostic Medical Sonographers is relatively small. It
reflects the AZDOA use of a slightly higher rate of growth than the 3.1% used for our
projections. We see no compelling reason to adjust our projections.
Our estimate of future employment for Medical Assistants relies on an average annual
growth rate of 2.7%, which has been quite stable over time, although it dropped slightly to
2.5% between 2008-2012. The AZDOA projection also adopts a growth rate of 2.7%.
Comparisons of the base numbers used by both projections show that AZDOA uses slightly
higher base year numbers. Comparisons of the respective projections to the preliminary
2014 data show that both estimates are lower than the actual numbers employed. The
AZDOA estimate is lower by approximately 4% (16,280 actual vs. 15,664 estimate) and our
projection is lower by approximately 16 % (16,280 actual versus 14,081 estimate). We
suggest, therefore, that our estimate be interpreted as a lower bound with the most
probable growth being better represented by the AZDOA estimate.
There are two occupations in the Declining Growth Group where the estimates differ by
more than 15%, namely Dietetic Technicians and Physical Therapy Assistants.
The employment of Dietetic Technicians in 2012 was higher than in any previous year since
2004, although it was slightly lower than the 2004 number. The AZDOA estimate may be
disproportionately influenced by that base year number. There is nothing, in our opinion, to
justify the increases in employment being predicted by AZDOA. Comparison to the May
2014 data also supports this contention, indicating that employment dropped to 760 in
2014, which is slightly lower than our estimate of 808.
The largest percentage difference among all the occupations is the 76.8% difference
between the estimates for Physical Therapy Assistants. Much of the difference is
attributable to the larger 2013 estimate from AZDOA. As we indicated in our discussion of
the trend data, the rate of decline in employment of Physical Therapy Assistants did
moderate between 2008-2012 but there is no indication of the trend becoming positive.
The May 2013 data do show an unusually large increase in employment to 1,290, the
highest level in the history of the trends we report. One year, however, does not a trend
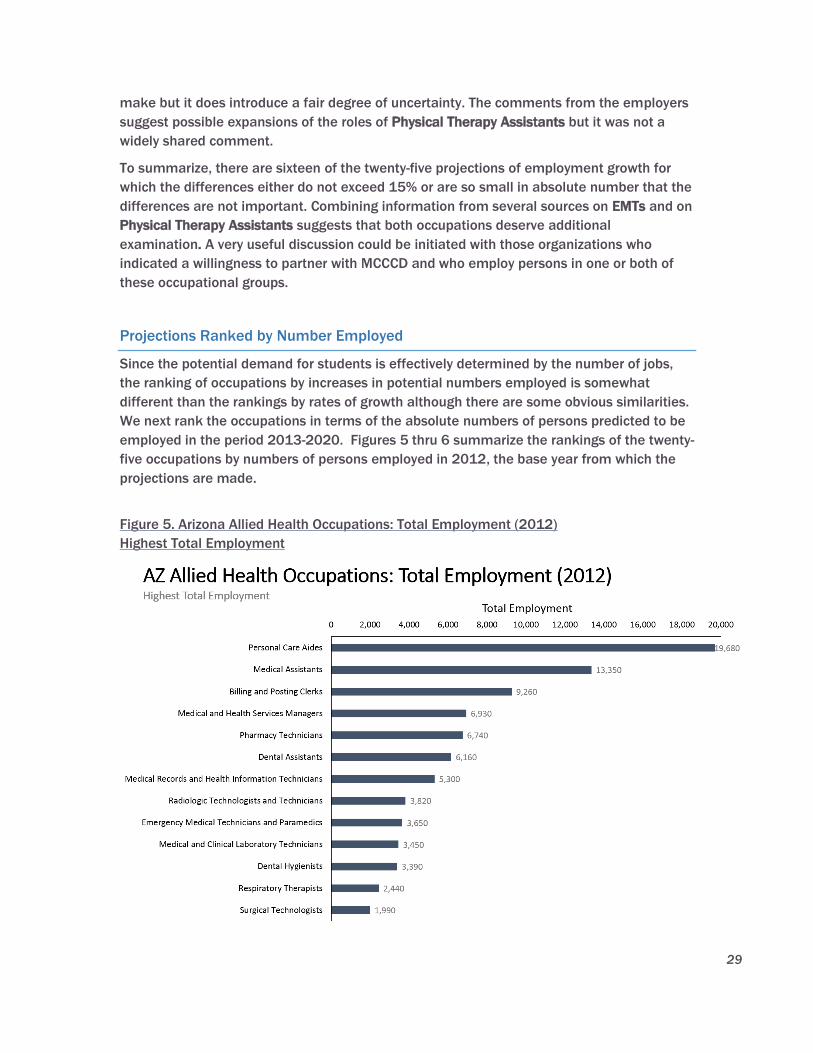
29
make but it does introduce a fair degree of uncertainty. The comments from the employers
suggest possible expansions of the roles of Physical Therapy Assistants but it was not a
widely shared comment.
To summarize, there are sixteen of the twenty-five projections of employment growth for
which the differences either do not exceed 15% or are so small in absolute number that the
differences are not important. Combining information from several sources on EMTs and on
Physical Therapy Assistants suggests that both occupations deserve additional
examination. A very useful discussion could be initiated with those organizations who
indicated a willingness to partner with MCCCD and who employ persons in one or both of
these occupational groups.
Projections Ranked by Number Employed
Since the potential demand for students is effectively determined by the number of jobs,
the ranking of occupations by increases in potential numbers employed is somewhat
different than the rankings by rates of growth although there are some obvious similarities.
We next rank the occupations in terms of the absolute numbers of persons predicted to be
employed in the period 2013-2020. Figures 5 thru 6 summarize the rankings of the twenty-
five occupations by numbers of persons employed in 2012, the base year from which the
projections are made.
Figure 5. Arizona Allied Health Occupations: Total Employment (2012)
Highest Total Employment

30
Figure 6. Arizona Allied Health Occupations: Total Employment (2012)
Lowest Total Employment
The projected employment of allied health care workers in each of the twenty-five
occupations is described in Table 4. The calculations are no different than those used in the
growth rate based projections but the results are re-ordered to distinguish among
occupations by the number of jobs and, thereby, the potential demand in terms of numbers
of students. We have noted, for the reader’s convenience, where the projected growth in
numbers changes the original classification of the occupation. So, for example, Medical
Assistants is a low growth rate occupation but, because of the large number of jobs, it
represents high potential numbers. We indicated the difference by including its original
classification (LGR) in parentheses. Where no such changes occur, no notation is made.

31
Table 4. Projected Employment of Allied Health Workers
2013 2020 Difference
High Potential Numbers
Personal Care Aides 21,760 43,967 22,207
Medical Records and Health Information Technicians 5,682 9,243 3,561
Medical and Health Services Managers 7,382 10,783 3,401
Emergency Medical Technicians and Paramedics 3,993 6,841 2,848
Medical Assistants (LGR) 13,710 16,521 2,811
Pharmacy Technicians (MGR) 7,056 9,725 2,669
Medium Potential Numbers
Health technologists and technicians (HGR) 1,780 3599 1,819
Dental Hygienists 3,539 4,788 1,249
Surgical Technologists 2,111 3,193 1,082
Dental Assistants* 6,295 7,326 1,031
Psychiatric Technicians (HGR) 1,439 2,249 810
Respiratory Therapists 2,529 3,253 724
Medical Equipment Preparers (HGR) 877 1,526 649
Low Potential Numbers
Billing and Posting Clerks 9,353 10,027 674
Diagnostic Medical Sonographers 1,160 1,523 363
Medical and Clinical Laboratory Technicians 3,498 3,853 355
Interpreters and Translators 1,512 1,846 334
Natural Sciences Managers (MGR) 871 1,120 250
Nuclear Medicine Technologists (HGR) 426 625 240
Cardiovascular Technologists and Technicians 943 1,042 99
Declining Growth
Radiologic Technologists and Technicians 3,809 3,733 -76
Medical Transcriptionists 1,393 1,343 -50
Dietetic Technicians 814 773 -41
Physical Therapist Assistants 815 514 -301
Healthcare support workers, all other 1,694 1,259 -435
As we mentioned in a previous section, employment data alone cannot distinguish between
changes in demand for workers from changes related to supply effects. So, for example, a
year to year fall in employment could be due to either a reduced demand for an occupation
or it could indicate a shortage. The data in the next section compare changes in wages to
changes in employment to attempt to find such distinctions where they exist.
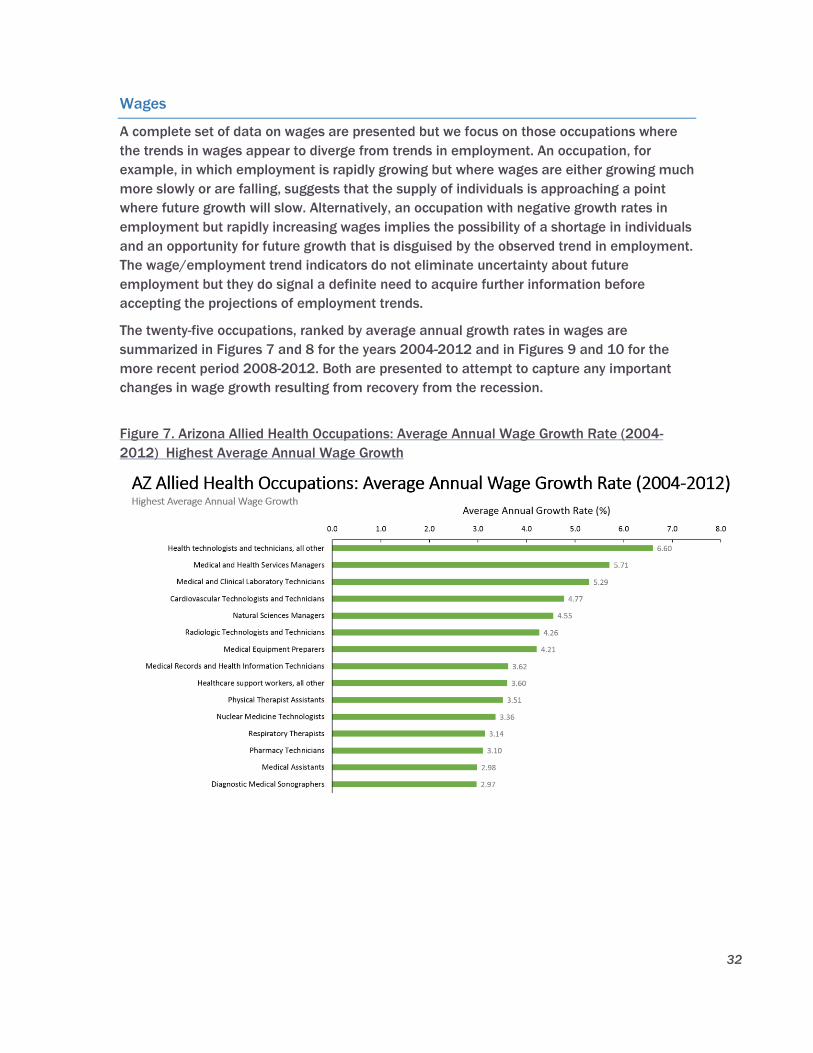
32
Wages
A complete set of data on wages are presented but we focus on those occupations where
the trends in wages appear to diverge from trends in employment. An occupation, for
example, in which employment is rapidly growing but where wages are either growing much
more slowly or are falling, suggests that the supply of individuals is approaching a point
where future growth will slow. Alternatively, an occupation with negative growth rates in
employment but rapidly increasing wages implies the possibility of a shortage in individuals
and an opportunity for future growth that is disguised by the observed trend in employment.
The wage/employment trend indicators do not eliminate uncertainty about future
employment but they do signal a definite need to acquire further information before
accepting the projections of employment trends.
The twenty-five occupations, ranked by average annual growth rates in wages are
summarized in Figures 7 and 8 for the years 2004-2012 and in Figures 9 and 10 for the
more recent period 2008-2012. Both are presented to attempt to capture any important
changes in wage growth resulting from recovery from the recession.
Figure 7. Arizona Allied Health Occupations: Average Annual Wage Growth Rate (2004-
2012) Highest Average Annual Wage Growth
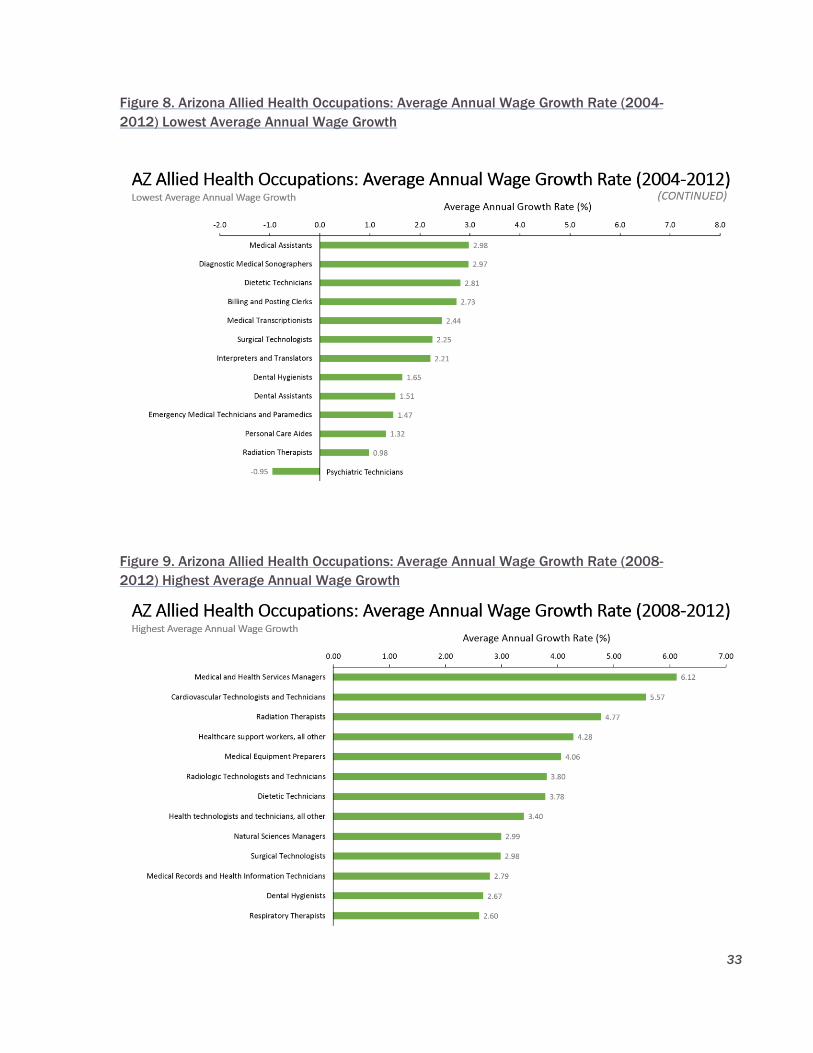
33
Figure 8. Arizona Allied Health Occupations: Average Annual Wage Growth Rate (2004-
2012) Lowest Average Annual Wage Growth
Figure 9. Arizona Allied Health Occupations: Average Annual Wage Growth Rate (2008-
2012) Highest Average Annual Wage Growth
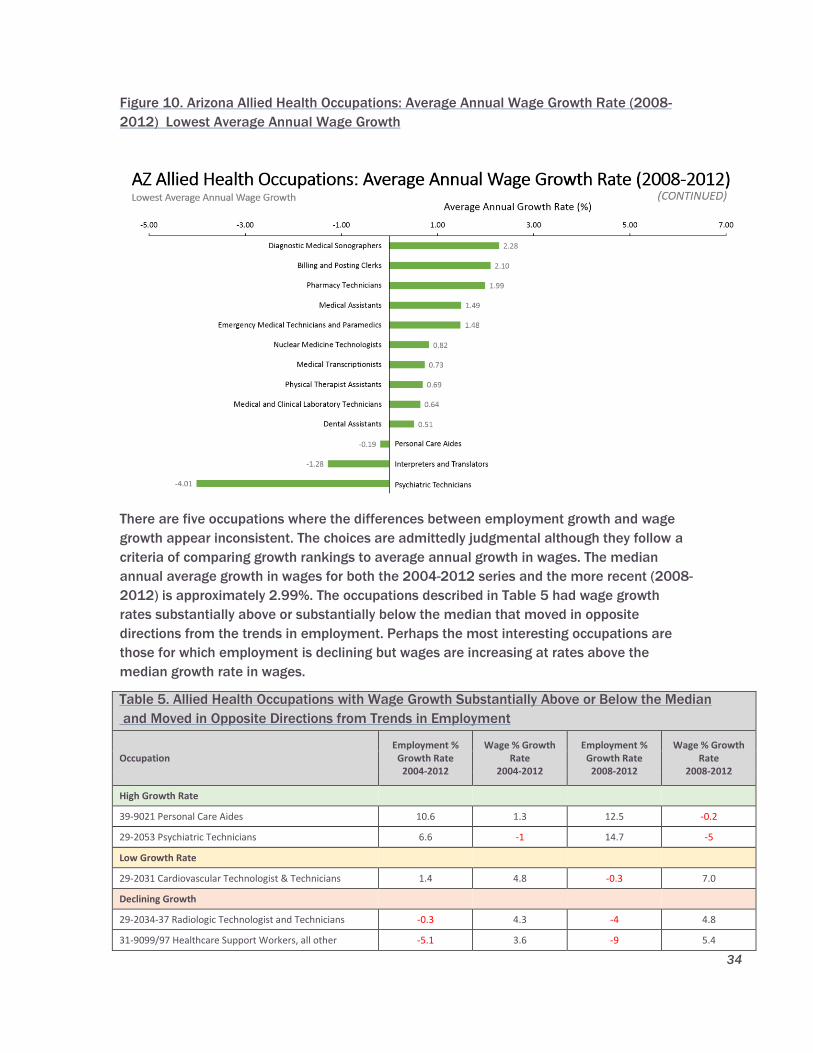
34
Figure 10. Arizona Allied Health Occupations: Average Annual Wage Growth Rate (2008-
2012) Lowest Average Annual Wage Growth
There are five occupations where the differences between employment growth and wage
growth appear inconsistent. The choices are admittedly judgmental although they follow a
criteria of comparing growth rankings to average annual growth in wages. The median
annual average growth in wages for both the 2004-2012 series and the more recent (2008-
2012) is approximately 2.99%. The occupations described in Table 5 had wage growth
rates substantially above or substantially below the median that moved in opposite
directions from the trends in employment. Perhaps the most interesting occupations are
those for which employment is declining but wages are increasing at rates above the
median growth rate in wages.
Table 5. Allied Health Occupations with Wage Growth Substantially Above or Below the Median
and Moved in Opposite Directions from Trends in Employment
Occupation Employment %
Growth Rate 2004-2012
Wage % Growth Rate
2004-2012
Employment % Growth Rate
2008-2012
Wage % Growth Rate
2008-2012
High Growth Rate
39-9021 Personal Care Aides 10.6 1.3 12.5 -0.2
29-2053 Psychiatric Technicians 6.6 -1 14.7 -5
Low Growth Rate
29-2031 Cardiovascular Technologist & Technicians 1.4 4.8 -0.3 7.0
Declining Growth
29-2034-37 Radiologic Technologist and Technicians -0.3 4.3 -4 4.8
31-9099/97 Healthcare Support Workers, all other -5.1 3.6 -9 5.4
35
Although we must carefully recognize the absence of information on the actual supply of
allied health care professionals, which includes graduates from Arizona and out of state
institutions other than MCCCD, the disparities between wage growth rates and employment
growth rates signal some possible supply conditions that are not adequately captured by
the secondary data.
In the first instance, two high growth rate occupations are experiencing wage growth
substantially below the median and, in some years, wages are actually falling. Increases in
employment with falling wages suggest that the market for these occupations is close to a
surplus supply. If this is true, then the trends used to project employment will overstate the
likely experience for these occupations.
The three occupations with low or declining growth in employment may be examples of the
possible situation, cited earlier, in which the declines in employment indicate a shortage of
qualified personnel rather than a decline in demand for those occupations. The most
compelling cases are for the Cardiovascular Technologists and Technicians and the
Healthcare Support Workers where increases in the rates of decline in employment are
associated with rather large percentage increases in wages.
The historical trends and the projections based on those trends are an important input for
decision making but the future that they predict will be realized only if there are no
important changes in the influences on employment and wages. Health care is a rapidly
changing environment in terms of technological changes that include automation of
functions such as translation and lab testing, the use of health care information, changes in
the health care model, of which movement to community based care and the integration of
behavioral and medical care are prominent as well as substantial changes in financing that
will affect access to care, of which the ACA is most important. The next sections of this
report describe the expectations and needs of senior health care managers regarding allied
health care workers, providing insights into probable changes in the trends that have been
observed.
36
Critical Issues and Trends
Key findings from interviews, focus groups and surveys were synthesized into critical issues
that will impact the future of allied health occupations in Arizona. The issues and trends
are interrelated and should be viewed collectively.
Health care reform Initiatives with an increasing emphasis on outcomes and cost-
effectiveness encourage alternative models of care and demand increased
accountability from providers. Major initiatives impacting Arizona include:
Affordable Care Act (ACA)
The federal Patient Protection and Affordable Care Act (ACA) together with the Health
Care and Education Reconciliation Act, signed into law in March, 2010, represent the
most significant regulatory overhaul of the U.S. healthcare system since the passage of
Medicare and Medicaid in 1965. The ACA aims to increase the quality and affordability
of health insurance, lower the number of uninsured by expanding public and private
insurance coverage, and reduce the overall costs of healthcare. It provides a number of
mechanisms, including mandates, subsidies and an insurance exchange, with the goal
of improving coverage and affordability. The law also requires insurance companies to
cover all applicants within new minimum standards and offer the same rates regardless
of pre-existing conditions or gender. Essential health benefits include:
Ambulatory patient services
Emergency services
Hospitalization
Maternity and newborn care
Mental health and substance use disorder services, including behavioral health
treatment
Prescription drugs
Rehabilitative and habilitative services and devices
Laboratory services
Preventive and wellness services and chronic disease management
Pediatric services
Accountable Care Organizations (ACO) and Patient Centered Medical Homes
(PCMH)
A persistent theme in health reform is for the “Triple Aim” of improving the
experience of care, improving the health of populations, and reducing per capita
costs of health care. A number of initiatives call for more integrated care through
Accountable Care Organizations (ACO) and Patient Centered Medical Homes
(PCMH). ACOs are pilot projects, initially for Medicare populations, where groups of
providers will be compensated on the basis of patient outcomes, rather than on the
quantity of delivered services. Provider organizations are integrating care on all
levels and across disciplines, using metrics to identify effective practices and
improved health outcomes. The PCMH model draws on professionals from all
disciplines from surgeons to social workers to coordinate a full range of the overall
patient’s health.

37
Medicaid Expansion
Arizona is fully participating in the Medicaid Expansion under provisions of
the Affordable Care Act (ACA) extending coverage to low income adults with
incomes below 133% of the Federal Poverty Level (FPL) with no eligibility criteria.
The federal government pays for 100% of the cost of the expansion in a state for
the first two years of the program. Funding levels reduce each year of the program
until they reach 90%.
Children’s Health Insurance Program (CHIP)
Arizona children have limited options for health coverage after state policymakers
closed enrollment in 2010 for Arizona’s Children’s Health Insurance Program
(CHIP), called KidsCare. Arizona is the only state in the country where children do
not have access to CHIP.
Integrated Care for Seriously Mentally Ill
In 2014 Arizona implemented integrated care for the Seriously Mentally Ill (SMI)
population utilizing models that focus on coordination of physical and behavioral
health, health education and promotion, and improved health information
technology. Given the link between oral health and overall health the contracts
include provision of dental care. The Arizona Department of Health Services
awarded contracts to three Regional Behavioral Health Authorities to administer
services statewide.
Mercy Maricopa Integrated Care - Maricopa County.
Health Choice Integrated Care(HCIC) - Northern Region
Cenpatico - Southern Region
Beginning in July 2015, behavioral health services will no longer be administered by
the Arizona Department of Health Services–Division of Behavioral Health but will be
transferred to the Arizona Health Care Cost Containment System (AHCCCS),
Arizona’s Medicaid agency. Some healthcare managers expect the integrated care
model to be implemented for all Medicaid public health programs in Arizona within
five years.
Healthcare providers are forming much larger entities to better collaborate, prioritize
programs, increase purchasing power, consolidate services and cut costs. Health
systems are expanding through acquisitions of hospitals, physician practices,
ambulatory centers, diagnostic centers, home care services, and durable medical
equipment and wellness companies.
Technology innovations make available promising approaches to patient care and
coordination and help both patients and clinicians make informed decisions. For
example, rural communities are rapidly utilizing Telemedicine and Teledentistry to
compensate for the shortage of physicians and dentists.
The challenges of combining of patient data from different sources and a lack of
common computer code standards across Electronic Medical Record (EMR) vendors has
limited the success of data sharing among providers and with patients to support
38
patient care. Efforts such as the Arizona Health –e Connection and Behavioral Health
Information Network of Arizona for Integrated care providers are promising platforms
for the exchange of health information.
Increased accountability and compliance requirements of new models of care have
increased the complexity of medical billing for providers. Liability for billing errors is
now extended to these occupations and penalties have become more severe.
Arizona’s population is aging and becoming more diverse leading to different disease
patterns, care seeking behavior, health insurance coverage and ability to pay.
According to the Administration on Aging, a 65–year-old person can expect, on
average, to live to the age of 84, the highest life-expectancy rate for Americans in
history. Palliative care, a rapidly growing field, likely will fill many of the gaps in
health care coverage in the future. 1
1 “Rise in Palliative Care Could Help Boomers Living with Chronic Conditions,”
HealthlineNews,March 13, 2014.

39
Implications for Allied Health
Key findings from interviews, focus groups and surveys were synthesized into three
categories of implications for allied health occupations in Arizona. These categories
include: New Roles and Expanded Scope of Practice, Recruitment Challenges and
Workforce Trends and Workforce Training Needs.
New Roles and Expanded Scope of Practice
An expanding market is anticipated for occupations related to community health,
including integrated hospital-community health programs. Healthcare organizations will
be hiring more allied health workers (Community Health Workers, Nursing Assistants
and Medical Assistants) and expanding their scope of practice to assist patients in
integrated care (primary care and behavioral health) and a range of follow up services
to prevent hospital re-admissions (checking vital signs, nutrition, medication follow up
etc). Healthcare organizations are expanding primary care teams to include emerging
roles for Health and Transition Coaches and Community Resource Aides to migrate the
care delivery model towards health and prevention. Examples include:
One of the new areas of focus for the Banner Health Network is the Intensive
Ambulatory Care Program, which makes extensive use of Health Coaches. The
pilot program uses both tele-health and in person contacts to provide care for
chronically ill persons with the objective of minimizing inpatient admissions and
improving the quality of life for the patients. This emerging occupation draws
from community health workers and nursing and medical assistants but may be
more general. A job description for a Banner Health Network Health Coach
(Appendix C) provides a detailed example of the expectations for this emerging
allied health occupation.
The Transition Coach program at John C. Lincoln Hospital (an affiliate of
HonorHealth (Scottsdale Lincoln Health Network) uses former military medics
and corpsmen to care for designated Medicare patients, providing a personal
touch to help them understand medical instructions, prescriptions, doctor
appointments, nutrition and costs of care. Transition Specialists are part of the
Accountable Care Organization (ACO). The transition program was developed
especially for medically trained military veterans. Transition Specialists help
recently discharged patients make sure their transitions are as smooth as
possible. The Transition Specialists call and visit patients in their homes after
discharge to be sure they or their caregivers have what is needed to manage
and maintain their target level of wellness. The Transition Specialists assist
patients with:
Follow-up medical care
Blood pressure monitoring
Medication management
Nutrition education
The Transition Specialists follow patients regardless of where they transfer—
home, rehab or skilled nursing facility. The Transition Specialists employed by
HonorHealth (Scottsdale Lincoln Health Network) were trained to provide
40
medical care for military personnel. As part of their transfer to civilian careers
as transition specialists, each of these veterans receive additional training in:
Patient communication
Health privacy regulations
Hospital and community resources
Electronic health records systems
Transition Specialists have produced significant savings, reducing Medicare
patient hospital readmission rates, and the program received the MGMA-ACMPE
Fred Graham Award in 2013. A job description for a HonorHealth (Scottsdale
Lincoln Network) Transition Specialist (Appendix D) provides a detailed example
of the expectations for this emerging allied health occupation.
Dignity Health Network is hiring Community Resource Aides to comply with
Affordable Care Act mandates to improve post-discharge health. Community
Resource Aides are utilized to provide services such as visiting discharged
patients in their homes and/or at community based programs. A job
description for a Dignity Health Network Health Community Resource Aide
(Appendix E) provides a detailed example of the expectations for this emerging
allied health occupation.
Mountain Park Community Health Center, is an example of how community
health centers are leaders in implementation of an integrated care model. Most
community health centers operate in medically underserved areas. Growth
areas involve Integrated Health Specialists (Medical Assistants) to support
Dieticians and Behavioral Health Specialists, including Psychologists and Social
Workers.
Chicanos Por La Causa, a community-based organization providing an array of
social services, behavioral health and primary care, is hiring Community Care
Workers to help clients with follow up with medical and behavioral health care
plans. Qualifications for the Community Care Workers include knowledge of the
community and resources, bilingual and ability to work with teams to do
whatever it takes to keep the clients on track and out of the Emergency Room.
Medical Scribes are expanding from assisting physicians in emergency rooms to
hospital medical wards and office based practices. Physicians report that they
like to use scribes to handle EHR data entry because doctors find EMRs slow
and clunky to use, interfering with their interactions with patients. Qualifications
include high school completion, computer skills, College degree or current
enrollment in a degree program preferred. People taking time off before
Medical, PA or NP school are favored. A job description for Banner University
Medicine Medical Scribe (Appendix F) provides a detailed example of the
expectations for this emerging allied health occupation.
Some health care organizations utilize Medical Assistants to perform the
functions of Medical Scribes in addition to clinical tasks in their scope of
practice. A MH7 Medical Assistant-Scribe Job Description (Appendix G) provides
a detailed description of the expectations of this emerging occupation in a
setting providing primary care to geriatric patients in their homes.
41
Creation of Enhanced Dental Teams will result in expanded roles for Dental Assistants,
Dental Hygienists and Community Dental Health Coordinators (CERT).
Utilizing technology (Teledentistry), these enhanced dental teams will operate
with greater efficiency and provide increased access to services in an array of
settings (rural, tribal communities, community health centers, nursing homes,
pediatric dentistry practices, and Head Start Centers).
State Statue outlines the scope of practice for dental hygienists and dental
assistants. In addition to the functions a dental assistant may perform, a
hygienist may administer local anesthetics, examine the oral cavity, remove
plaque and apply sealant and topical fluoride. Qualified dental assistants may
perform x-rays, polish teeth and provide patient care. Any expansion of this
scope requires a review through the sunrise process (A.R.S.§§ 32-1281;32-
1291).
In 2014 a sunrise application was submitted by the Arizona Dental Association
to increase the scope of practice for dental assistants by creating the Expanded
Function Dental Assistant (EFDA) position. The Senate Health and Human
Services Committee held a hearing and recommended forwarding of the
application to the full Legislature for consideration. Legislation (SB 12822) was
introduced to institute requirements concerning Teledentistry and modifies the
dental affiliated practice statute to increase the scope of practice for dental
assistants by creating an Expanded Function Dental Assistant (EFDA) position.
Expanded functions include the following:
Placement, contouring and finishing of direct restorations.
Placement and cementation of prefabricated crowns following preparation
of the tooth by a licensed dentist.
Placement of interim therapeutic restorations under the general supervision
and direction of a licensed dentist following a consultation conducted
through teledentistry.
Application of sealants and fluoride varnish under the general supervision
and direction of a licensed dentist.
The new legislation passed by the Arizona Legislature (SB1282, Chapter 196)
will expand roles for Dental Hygienists to engage in restorative functions
permissible for an Expanded Function Dental Assistant with study and
examination equivalent to an EFDA. EFDAs must complete a Board-approved
Expanded Function Dental Assistant training program completed at an
institution accredited by the Commission on Dental Accreditation of the
American Dental Association and an examination in expanded functions that is
approved by the Board. Arizona has three accredited certificate programs for
EFDA located at Phoenix College, Rio Salado (both MCCCD affiliates) and Pima
College in Tucson.
Community Dental Health Coordinators are an emerging enhanced role for
Registered Dental Hygienists or Certified Dental Assistants with a Certificate of
2 Arizona State Legislature (www.azleg.gov) (Passed by the Arizona Legislature and signed by the
Governor on 4.6.2015)
42
Completion (CCL) in Community Dental Health Coordination (CDHC) program.
Community Dental Health Coordinators are culturally competent team
members with the skills to promote oral health literacy to support Dental Teams
in underserved areas such as remote areas and tribal communities. Rio Salado
College (MCCCD) developed the certificate program designed to provide
students with a practical and theoretical basis for assisting in the reduction of
disparities in dental health. Courses cover advocacy, intercultural
communication, and finance in addition to dental health coordination,
documentation, and reporting procedures. Legal and ethical issues are also
covered.
Pima College in Tucson offers a Dental Laboratory Technology Associate of
Applied Science program and is the sole dental lab program in the state
accredited by the American Dental Association Commission on Dental
Accreditation. Students learn the skills to construct and repair dentures, partial
dentures, crowns, bridges and other dental appliances. Students who complete
the program and exam are qualified to work in a dental lab.
Integration of Primary Care and Behavioral Health will result in new and expanded roles
for allied health occupations with interdisciplinary training and credentials in the
delivery of behavioral health and medical care services. Examples include:
Billing and Posting Clerks
Case /Care Managers (manage primary care and behavioral health needs)
Community Health Workers
Crisis Team (24-7) to deal with behavioral health and primary care needs
Direct Care Paraprofessionals
Family Peer Support Partners
Integrated Care Coordinators
Medical Records and Health Information Technicians
Medical Records Clerks
Population Care Managers
Peer Support/Recovery Specialists
Information Technology Specialists
Licensed Practical Nurse (LPN)
Medical Assistants
Patient Navigators
The 2014 contracts awarded required the Regional Behavioral Health Authorities
(RBHAs) to hire care managers to oversee integrated care delivered by the partners and
providers. Arizona legislation prohibits Regional Behavioral Health Administrators
(RBHAs) from providing direct services (such as case management). The RBHAs provide
direct services through contracts with a network of partners and providers. For
example, one of the requirements for a national certification program for care
managers is direct service to patients, which is prohibited by the current Arizona
legislation creating some implementation challenges.
43
Dramatic changes in the healthcare industry have spurred a demand for frontline and
nonclinical workers who are tasked with not just patient health, but with taking care of
the whole patient—meaning making sure that the patient experience is both seamless
and satisfactory. While education and job requirements for these positions vary,
healthcare organizations often prefer or require a certificate, associate’s or bachelor’s
degree for today’s frontline and nonclinical roles. Some examples include:
Patient Navigators (also known as Patient Representatives) alleviate stress and
improve care by coordinating health services and information for patients. The
patient navigator role is a cross between a customer service representative and a
social worker, supporting patients and their families and helping them to navigate
the healthcare system. These frontline workers are coordinators who bring together
resources and manage paperwork associated with patient care. Primary Care
Physicians (PCPs) are spending less time with patients leaving more follow up work
for team members. Patient representatives often inform patients and their families
with research on their particular diseases, help address insurance issues, connect
patients with doctors, conduct critical conversations, and help patients understand
their options for treatment and care. They also frequently accompany patients on
medical visits. Today’s frontline and nonclinical healthcare workers need a more
versatile set of skills than were required for these types of positions in the past—
collaborative teamwork abilities, fluency in technology, and an understanding of
how to navigate the healthcare system. A job description for HonorHealth
(Scottsdale Lincoln Health Network) (Appendix H) provides a detailed description of
the expectations of this emerging occupation.
Peer Support/Recovery Specialists – People who have achieved and sustained
recovery can be a powerful influence for individuals seeking their own path to
recovery. Behavioral health employers are taking steps to increase recruitment and
development of Peer Support/Recovery Specialists. By sharing personal
experiences, peers help build a sense of self-worth, community connectedness, and
an improved quality of life. Peer services are supported on a statewide and national
level. The Centers for Medicare and Medicaid Services (CMS) issued a letter to
states, recognizing the importance of peer support services as a viable component
in the treatment of mental health and substance abuse issues. In the letter, CMS
provides guidance to states for establishing criteria for peer support services,
including supervision, care-coordination and training/credentialing. The Arizona
Department of Health Services/Division of Behavioral Health Services
(ADHS/DBHS) has developed training requirements and certification standards for
Peer Support Specialists/Recovery Support Specialists providing Peer Support
Services, as described in the ADHS/DBHS Covered Behavioral Health Services
Guide.3.
3 Arizona Department of Health Services Division of Behavioral Health
(http://www.azdhs.gov/bhs/covserv.htm)
44
In order to be hired by an agency an applicant must complete an 80 hour initial
training program that meets the ADHS-BHS certification requirements and
employers prefer to hire Peer Support Specialists who have completed the initial
training. Some employers expressed concern about the lack of availability and
affordability of the training. Many employers are subsidizing applicants to complete
the basic training in order to have sufficient Peer Support Specialists in the pipeline.
A job description for Little Colorado Behavioral Health Centers (Appendix I) provides
a detailed description of the expectations of this emerging occupation.
The Arizona Department of Health Services/Division of Behavioral Health has
recently awarded a two-year contract to Arizona State University to coordinate a
Peer Career Advancement Academy. The purpose of this academy is to provide
advanced training and educational opportunities to certified peer specialists. The
Arizona State University (ASU) Center for Applied Behavioral Health Policy will be
coordinating this new initiative. Over the course of the next two years, the design of
the Peer Career Advancement Academy will be finalized, and training tracks
implemented for health and wellness coaches, special assistance advocates,
housing support and supported employment specialists will serve as a career
ladder.
Marc Center Community Resources hires Wellness Coaches to assist patients and
members navigate medical services and behavioral health. The wellness coaches
participate in 46 hours of training provided by the agency including the Stanford
Chronic Disease Self Management program in addition to Motivational Interviewing,
Supportive Housing, and Family Support Partners.
Family Support Partners/Parent Partners deliver peer-to-peer support to families.
Family Support Partners are family members/caregiver of someone who is or has in
the past received Behavioral Health Services and have some understanding of what
it is like taking care of someone with behavioral health challenges. The Family
Support partners provide support and information on community resources and
educate on navigating the Behavioral Health System and other systems. A job
description for the Family Involvement Center (Appendix J) provides a detailed
description of the expectations of this emerging occupation.
Integrated Care Coordinators - With the implementation of integrated care,
organizations are creating case manager positions to coordinate physical and
behavioral health services. Desirable qualifications for these case managers
working in an integrated care environment are backgrounds in social work (MSW) or
nursing (RN or LPN) with the expectation of considerable on the job and
supplemental training.
Population Care Managers–Integrated care models utilize data to predict services
patients will need and have created emerging occupations for staff with clinical and
45
medical management backgrounds. Population Care Managers understand health
care and statistics and communicate trends and concerns to case managers.
Recruitment Challenges and Workforce Trends
This section compares the results of the interviews and survey responses to our projections
of the number of additional jobs, for each occupation, between 2012 and 2020. Many of
the responses are consistent with the trends and, although all responses are reported, our
discussion focuses on the occupations where the interviews and survey responses signal
changes from the historical trends that should be included by decision makers in their
expectations and plans.
Occupations with High Numbers of Potential Jobs (+37,497 employees)
The interview and survey responses regarding the occupations in the high potential number
group are consistent with our projections but the comments on Emergency Medical
Technicians and Paramedics offer additional insights concerning the uncertainty about the
future of that occupation. We noted in our comparison of our projections to the AZDOA
estimates that our estimates appeared to be too high, suggesting that decision makers
interpret them as an upper bound. The employer remarks, however, suggest that the
traditional role for the occupation is changing in a manner that is likely to increase the
demand for these workers.
Emergency Medical Technicians and Paramedics- Several employers predicted demand
for Emergency Medical Technicians and Paramedics would increase in the next two
years and their scope of practice would be expanded through training in community
paramedicine. Community paramedicine is a paradigm shift for the use of paramedics
in which paramedics function outside their usual emergency response and transport
roles delving into the world of primary care. As the health care world increasingly shifts
toward prevention and well care the system will increasingly demand more folks that
can function in a community health (primary care and prevention) role. Community
paramedicine is increasingly being recognized as a promising solution to efficiently
increase access to care (especially for underserved populations). 4 For example-
paramedics could shift from a sole focus on emergency response to things like: 1)
providing follow-up care for persons recently discharged from the hospital to prevent
unnecessary readmissions; 2) providing community-based support for people with
diabetes, asthma, congestive heart failure, or multiple chronic conditions; and/or 3)
partnering with community health workers and primary care providers in underserved
areas to provide preventive care. The Arizona Department of Health Services, Bureau of
Emergency Medical Services & Trauma System, established a Community Integrated
Para-medicine Workgroup in 2013. (http://www.azdhs.gov/bems/community-
paramedicine)
4 Arizona Department of Health Services, What is Community Paramedicine?, Director’s Blog, Will
Humble, September 3, 2013. (www. http://directorsblog.health.azdhs.gov/whats-community-
paramedicine)
46
Personal Care Aides - Some employers indicated an anticipated increase in demand in
next two years for Personal Care Aides. Arizona’s aging population and trends toward
increases in home health care, palliative care, and long term care are increasing the
demand for Personal Care Aides. They work in a variety of settings, including patients’
homes and larger care communities. There are no formal education requirements but
most have a high school diploma. Arizona does not require aides to have specific
training or certification. Experience is not required. Challenges for employers include
growth and expansion of services, high turnover, provision of short term on the job
training and many sources to recruit employees to fill the positions.
Medical Records and Health Information Technicians are evolving into Health
Information Managers with the transition to electronic medical records. Sonora Quest
Laboratory identified examples of opportunities for first line and supervisors and mid-
level managers in lab management with 2-year degrees. These are positions that staff
can work their way into using a career ladder but must be able to take on the additional
responsibilities and demonstrate leadership. More opportunities are opening up for
Associate degree candidates that formerly required Bachelor’s Degrees. These areas
have presented some challenges in recruitment attributed to issues pertaining to work-
personal life balance.
Medical and Health Services Managers - Hospitals have a continuing need for Medical
and Health Service Managers in their health quality departments to deal with a variety
of regulatory requirements, including accreditation and compliance audits. This need is
likely to continue to expand and require an increased skill set. With the increasing
complexities of accountability, legal issues, licensing and contracts, many of these
positions focus on compliance and are held by persons with Bachelor’s and Master’s
degrees. Some are trained on the job and generally promoted from within.
Medical Assistants - Hospitals are changing the roles for Medical Assistants (examples
such as health coaches described in the previous section) eliminating CNAs and LPNs,
hiring fewer RN nurses and hiring more Medical Assistants. The rapid job growth is
attributable to the increasing number of healthcare facilities that need more support
personnel, and to the fact that medical assistants work mostly in primary care -- a
growing sector of the healthcare industry. If the trend continues, this should increase
the demand for Medical Assistants.
The West Yavapai Guidance Center in Prescott Valley, is in the early stages of
implementing an integrated primary care and behavioral health program for SMI
patients and is hiring more CNAs and Medical Assistants to support efficiencies in
service delivery to improve patient outcomes. In large clinics or hospitals where a
wide range of health professionals are employed, allied health practitioners may
not be called on to use the full extent of their scope of practice skills, since they
may overlap with those of other professionals. However in small clinics and rural
environments where there are fewer health team members, use of the full scope of
47
practice takes on greater importance and these settings will need to rely on the
professional’s use of existing skills to fill in the service gaps.
Pharmacy Technicians -The increasing number of prescription drugs available and
the growth and aging of the population are spurring the high demand for Pharmacy
Technicians. Integrated care and behavioral health providers are providing
pharmacy services on site. QoL meds, a national pharmacy specializing in mental
health, is operating the on-site pharmacy services for several behavioral health and
integrated care providers in Arizona. Medication management poses challenges for
many behavioral health patients who need special packaging, daily dosage and
monitoring. Integrated care sites reported fewer problems experienced by patients
when all their medications were processed by an on-site pharmacy.
Occupations with Medium Numbers of Potential Jobs (+ 7,364 employees)
The projections of fairly stable growth in the medium growth occupations are generally
supported by the opinions of the health care employers. The exceptions include two dental
occupations where demand could increase more rapidly than project because of the new
mandates and reimbursement formulas from the ACA and the models of integrated care.
The third exception is Surgical Technologists.
Dental Hygienists- As described in the previous section on emerging occupations,
employers anticipate putting in place more enhanced dental teams that will require
Expanded Function Dental Assistants (EFDAs). The implementation of the ACA and
Integrated Care children and seriously mentally ill adults (SMI) will have increased
access to coverage for dental care. Employers report increased demand for
Community Dental Health Coordinators (Certificate) will increase access for children
and adults, especially those in underserved areas. Community Health Centers are
expanding dental clinics in rural and underserved areas.
Dental Assistants – As described in the previous section on emerging occupations,
employers anticipate putting in place more enhanced dental teams that will require
Expanded Function Dental Assistants (EFDAs). With the implementation of the ACA
and Integrated Care children and seriously mentally ill adults (SMI) will have
increased access to coverage for dental care. Employers reported increased
demand for Community Dental Health Coordinators (Certificate) will increase access
for children and adults, especially those in underserved areas. Community Health
Centers are expanding dental clinics in rural and underserved areas.
Surgical Technologists – Employers reported both an anticipated increase in
demand in next two years for Surgical Technologists and also current challenges
recruiting sufficient qualified applicants for positions at the current time Although
we did not find a substantial disparity between the growth in employment and
annual average rates of wage growth, the comments describe the existence of a

48
shortage that could increase over time. Thus, our projections may be somewhat
understated.
Health technologists and technicians - Some employers indicated an anticipated
increase in demand in next two years but there are no indications of a substantial
shift in demand or a change in the scope of practice.
Psychiatric Technicians - Employers reported increased demand for Psychiatric
Technicians with the expansion of mental health services following the
implementation of the Affordable Health Act (ACA) and Integrated care.
Respiratory Therapists - Employers reported a continuing need for respiratory
therapists.
Medical Equipment Preparers - Some employers indicated an anticipated increase
in demand in next two years for Medical Equipment Preparers.
Occupations with Low Numbers of Potential Jobs (+2,037)
The most interesting set of comments in this section refer to the Cardiovascular
Technologist and Technician occupation.
Cardiovascular Technologists and Technicians- Some employers indicated an
anticipated increase in demand in next two years for Cardiovascular Technologists
and Technicians. This is one of the occupations where we found wage growth rates
to be well above the median rate for wages for 2004-2012 and a rate of increase
nearly double the long term rate for the years 2008-2012. The changes in wages
and the employer comments suggest that the projected growth rate (+1.4%) used in
our projections is likely to understate the future employment prospects for workers
in this occupation. That expectation must, however, remain conditioned on the fact
that it is a very small group so even doubling the growth rate in employment will
add fewer than 200 workers over the period 2013-2020.
Medical and Clinical Lab Technicians - Lack of updated lab facilities for schools
were noted as a concern. Sonora Quest Laboratories indicated some difficulty
recruiting since ASU and UA closed programs. An Associate Degree program is
potential opportunity for MCCCD. Sonora Quest Laboratories hired a trainer to help
staff move from one level to another. (Medical Technician). ASU has worked with
Phoenix College on a 4 year college program with clinical rotations. The increased
use of automated tests by pharmacies may shift employment opportunities from
hospital systems to pharmacies or through joint ventures between hospitals.
Billing and Posting Clerks- Some employers indicated an anticipated increase in
demand in next two years for Billing and Posting Clerks with the implementation of
the Affordable Care Act, Medicaid Expansion and Integrated Care.
49
Interpreters and Translators- The advent of phone based translations and
technology that brings sign language translation to the bedside is dramatically
reducing the demand within hospitals for Interpreters and Translators. For example,
Dignity Health Network has a staff of Spanish translators because a very high
proportion of their patients are Spanish speakers. Other languages are translated
using phone-based translation services. In smaller organizations, employers report a
demand for bilingual and culturally competent allied health workers with clinical
skills and subject matter knowledge to work on medical teams in communicating
with patients and obtaining follow up information is preferred to hiring Interpreters
and Translators. For example, Chicanos Por La Causa serves a large Spanish-
speaking population and recruits bilingual staff for many occupations for behavioral
health, human services and an expanding health care practice. Behavioral health
provider contracts with RBHAs have significantly reduced the amount providers are
reimbursed for Interpreters and Translators.
Natural Sciences Managers - Some employers indicated an anticipated increase in
demand in next two years for Natural Science Managers.
Nuclear Medicine Technologists - Some employers indicated an anticipated increase
in demand in next two years for Nuclear Medicine Technologists. .
Diagnostic Medical Sonographers - Some employers noted increased hiring of
Cardiovascular Diagnostic Medical Sonographers to assist with Ultrasound
procedures.
Occupations with Declining Numbers of Potential Jobs (-903)
The Radiologic Technologists and Technicians and the Healthcare Support Workers are
both examples of occupations with declining employment data but above average wage
increases. No employer comments were received regarding Healthcare Support Workers.
Radiologic Technologists and Technicians – The employer comments are at least
consistent with the possibility that the declines in employment, coupled with above
average wage increases, are evidence of an increasing shortage rather than a
decline in demand. We suggest that MCCCD contact employers who have expressed
a willingness to be partners to further explore this possibility.
Medical Transcriptionists - Employers confirmed the low demand due to the
widespread implementation of electronic medical records. Some organizations
have a small staff of Medical Transcriptionists to meet specific needs, and one
organization permitted them to work from home, reducing turnover.
50
Dietetic Technicians - Some employers reported increased demand for Dieticians
and Dietetic Technicians to support increased comprehensive care and focus on
prevention and reduction in obesity and diabetes.
Physical Therapist Assistants - Some employers indicated an anticipated increase in
demand in next two years for Physical Therapist Assistants. Agencies providing
home health care services reported an increased demand for more physical
therapists which would include Physical Therapy Assistants as well. Some
employers in rural areas reported challenges in recruiting Physical Therapists and
Physical Therapist Assistants for rural and remote areas.
Occupations Omitted from Projections
The data for some occupations were omitted because they refer to too short a period to
generate a robust trend. Additional information was obtained from interviews, focus groups
and surveys with senior managers of health care and behavioral health organizations.
Community Health Workers- Some employers indicated an anticipated increase in
demand in next two years for community health workers to support medical teams
as health coaches to provide outreach and follow up to patients to prevent
hospitalizations, provide support services and increase culturally competent
communication between the patient, family and medical team.
Radiation Therapists- Some employers indicated an anticipated increase in demand
in next two years for Radiation Therapists.
Magnetic Resonance Imaging Technologists –Some employers anticipate an
increase in demand for Magnetic Resonance Imaging Technologists in the next two
years.
Ophthalmic Medical Technicians- Some employers reported challenges recruiting
sufficient qualified applicants for positions.
Phlebotomists: Phlebotomists make up the largest group of employees and
positions at Sonora Quest Laboratories where they are always recruiting well trained
entry level phlebotomists. Both numbers and level of training are a problem due to
turnover as many positions are entry level and employees may move up to new
positions. Sonora Quest encourages phlebotomists to obtain certification (national
certification requires an exam) although not required.
Massage Therapists: Hiring trends for Massage Therapists was not available from
the employers participating in the needs assessment. According to the BLS
projections the demand for Massage Therapists will increase on a national level.
Data was not available as to the number of jobs for Massage Therapists in
healthcare industry in Arizona. One possible explanation for the lack of data is many
51
Massage Therapists are employed in private settings, such as health spas and
resorts.
Medical Secretaries: Some employers anticipate an increase in demand for Medical
Secretaries in the next two years.
Nursing Assistants- Some hospital employers anticipate increased demand for
Nursing Assistants especially in areas serving elderly populations.
Speech and Language Pathology Assistants: Some employers anticipate an
increase in demand for Speech and Language Pathology Assistants in the next two
years.
Additional allied occupations beyond the focus of this needs assessment with
anticipated high demand include Nurse Practitioners, and bilingual staff in a wide
range of allied health occupations that delivery direct care such as nurses,
psychiatric nurses and LPNs.
Workforce Training Needs
Findings from interviews, focus groups and survey responses provide information on the
range of workforce training needs for allied health from the perspective of employers. We
were not able to obtain data on the number of employees who will need training in these
areas but examples of specific needs and suggestions from employers include:
Use of technology and electronic data in the delivery of healthcare is a major focus
for employers for most health occupations. Training in Electronic Medical Records
(EMR) is a requirement for all allied health occupations and ongoing training is
necessary to keep up with updates.
Nearly all the allied health occupations need more technological expertise as a
minimum standard for adequate preparation for the work they will perform.
Knowledge and skills in the following areas are recommended:
Basic electronic communications technology including Microsoft (MS) Suite,
Documentation of services and care provided.
Foundation course on health care technology,
Health IT and health related social media that would be required for all
occupations would be useful.
Training to meet ongoing Re-Certification requirements for occupations such as
Radiation Therapist and Respiratory Therapists.
Radiation Therapist This is one of the occupations where there is a need for re-
certification as technology changes. More generally, most of the occupations
face an increasing need for continuing education as technology changes. The
52
new emphasis on community based post-discharge charge suggests that there
will be more outpatient care in the future
Respiratory Therapists need training for re-certification as the technology
changes. For example, Dignity Health currently handles the re-certification.
There may be an opportunity for the re-certification to be more efficiently done
through a cooperative venture with educational institutions such as MCCCD.
The trend toward requirements of a BA or Master’s Degree for better career
opportunities for Respiratory Therapists will impact the Community College –
level programs which could be a potential opportunity for a bridge program with
ASU.
Training for Medical Billing Coders and Billing and Posting Clerks will require more
knowledge about insurer/payor requirements, compliance, operations and quality
assurance in addition to some specialty training to the basic skills (for example,
training billing students in some service delivery areas such as behavioral health,
primary care, cardiology, ophthalmology or laboratory billing as examples of
options. The training could be accomplished through online or classroom training
and/or internships. For example, Barnet Dulaney Perkins Eye Centers recently
started employing certified Medical Billing Coders to review and validate billing.
They have found that this additional step in the billing process has increased the
accuracy of billing and reduced the need to correct errors based on feedback from
health insurers.
The new integrated care models and contracts for behavioral health and medical
care have created a need for training for several occupations for providers
statewide. The need for new training stems from the fact that current attempts at
integrated care have suffered from the lack of familiarity among physical health
professionals with behavioral problems and their discomfort in dealing with persons
with behavioral problems. The delivery systems have very different cultures. The
physical health delivery model is driven by a physician directing the care for a
patient and in the behavioral health model is team driven and includes the
members (clients) and family members. Some early programs have been able to
provide behavioral health and primary care at a single site but challenges remain to
integrate the services. The goal of integration is coordination of care so the person’s
whole health is taken into consideration at every site they access services. Training
and curriculum development are needed in the following areas:
Training on Integrated Care Management – One example of a training model is
offered by the University of Massachusetts and attended by the leadership team
from Cenpatico. The program is designed for integrated team members
including physicians, social workers, nurses, counselors, therapists, and
psychologists.
(http://www.umassmed.edu/uploadedFiles/fmch/Education/Primary_Care_Be
havioral_Health/PCBH%20Brochure_Final%205%2011%202011.pdf)
53
Examples of topic areas addressed in the 36 hour program include:
Primary Care Culture, Behavioral Health Needs and Working with
Physicians
Evidence-based Therapies and Substance Abuse in Primary Care
Child Development and Collaborative Pediatric Practice
Integrating Care for People with Serious and Persistent Mental Illness
Behavioral Healthcare for Chronic Illnesses, Care Management and an
Overview of Psychotropic Medication in Primary Care
Behavioral Medicine Interventions: Health Behavior Change and
Relaxation Response Techniques
Families and Culture in Primary Care, Advice on Implementation
Integrated behavioral and physical health care needs to be addressed in health
education programs curriculums at the community college and university levels
and also in training programs designed to meet the needs of employers for their
current workforce. There is a need for a certificate program on integrated care
for Arizona provider staff in a range of occupations, including allied health.
Behavioral health agencies utilize personnel that serve as case aides, parent
aides, behavioral health technicians, residential care workers to provide support
to patients. Individuals in these paraprofessional occupations would be good
candidates for a two year certification program in integrated care to qualify
them to move up the career ladder. In some organizations, experience can
substitute education in positions such as case manager that require a
bachelor’s degree.
Training Emergency Medical Technicians (EMTs) to expand their roles to prepare
them to deal with persons with acute behavioral problems in crisis situations
through de-escalation rather than, as is often the case, having physical
confrontations between police. Examples of Community Paramedicine efforts in
Arizona include the Mesa Fire and Medical Department is using a grant from the
Centers for Medicare and Medicaid Services to staff mental health and nurse
practitioners and the Rio Rico Fire District in Southern Arizona utilizing
paramedics with additional training in primary care to be the eyes and ears of
primary care providers out in the community. Community Paramedics will be
equipped to reach out to patients at highest risk for using the 911 system.
In general, Allied Health Curricula should include topics such as basic
professionalism, setting boundaries, social media, de-escalation.
Incorporate more about the field of public health as a career option, as well as
Arizona statutes which require certain diseases and outbreaks to be reported to the
county Health Department. Learning how to write executive summaries and white
papers are needed skills.
54
Establish a Supervisor Training Certification for first line supervisors (Leadership
Academy) with emphasis on behavioral health.
Establish a certification program for Direct Care Paraprofessionals in Behavioral
Health who work in jobs as Residential Care Workers
Training in Behavioral Health Assessments is needed for behavioral health
paraprofessionals including Behavioral Health Technicians, Case Aides, Case
Assistants, Direct Care Providers, and Parent Aides etc.
An additional set of skills that are desired would be training in motivational
interviewing for both current and future providers although emphasis was on current
providers not just behavioral but for all forms of health care, especially chronic
conditions. Some aspect of motivational interviewing should be included in every
course.
Certificate programs are needed for Prevention Specialists. A recent collaboration
between behavioral health agencies Glendale and South Mountain Community
College was launched to develop a certification program for Substance Abuse
Prevention. Additional prevention training certificate programs to support
prevention specialists in the field on topics that include teen pregnancy, gang
violence, bullying, obesity and diabetes.
Delivery of Training
Training needs to be made available in multiple formats including classroom, work
site, train the trainer and hybrid models (classroom and online). Online training is
the most common format utilized by employers as in-person training is not always
cost effective or a viable option for some topics. For employers, off-site classroom
training is the option used least often.
Extended in-depth internship opportunities for a semester would be beneficial to
students to reinforce training and education.
Tuition reimbursement programs are offered by the majority of employers
participating in the needs assessment but some have had to cut back or put these
programs on hold due to budget constraints.
Rural areas pose challenges for recruitment of allied health staff and delivery of
training. Providers often hire staff that do not come with the necessary
qualifications and need on the job training. With shortages of physicians and allied
health workers, rural areas are often under pressure to perform a wide range of
tasks with minimal on site supervision. Rural agencies often work collaboratively to
share expertise across the network through technology such as telemedicine. For

55
some occupations, working in a medically underserved area can enable workers to
take advantage of student loan repayment programs and VISA waivers.
The Arizona Department of Health Services–Division of Behavioral Health requires
behavioral health providers providing services through RBHAs to have employees
complete required training within 90 days of employment with some annual
recertification requirements. Some of the training is provided by staff in the hiring
agencies and RBHAs offer online training through Relias Learning, an online
training resource. A third option for providers is to purchase training for employees
through an outside source (university, community college or outside expert).
Training priorities for Emerging Occupations noted by employers included:
Alternative clinical practices
Associate Degree in Nutrition, Dietetics, Diet Tech Registered (pass credentialing
exam within 3 months)
Benefits eligibility
Chronic diseases and community health workers
Collaboration (For Dental Teams)
Combination of Psychiatric/Medical Assessment and intervention skills
Culinary Arts
Documentation of services provided IT, Meaningful Use, Health Record
Management
Employment Services resource training
Health Care auditing
Health Coaching
Health screening
Population Health Management
Psychiatric pharmacology
Supportive services
Training priorities for Current Allied Health occupations noted by employers included:
Addiction treatment models
Behavioral health and child welfare
Behavioral Health Courses with ability to obtain independent license
Behavioral Health Nursing Skills
BSN – Online
Caregiver Training
Combining medical and psychiatric assessment
Compliance, HIPAA, IT Security
Continuing Professional Education for Clinical Staff
Core Public Health Competencies
Cultural Sensitivity and CLAS Standards
Cultural Competency
EMR/HER
Evaluation, Outcomes, Data Analysis for Decision Making, Finance
Field of practice and Internal Medicine- Cardiology, Urology, Nephrology
Health Coaching
IT Security, Privacy and Compliance
Leadership Competencies
Public Health Competencies
56
Quality Improvement
Patient Satisfaction
Physical Therapists – Home Health
Performance improvement
Public Health Accreditation
Physicians, nurses, administration, finance
Public Health 101 and training on working through policy, systems, and
environmental approaches
Quality Improvement and Customer Service
Recovery-based approaches to care
RN License
Safety
Screening for Physical Health Conditions
Systems of Care
Standard Required Annual Updates i.e. (HIPAA, Required Reporting, Hand washing,
etc.)
Support training in accounting and medical billing (very difficult to find)
Strategic Planning
Safety/Compliance
Trauma informed care in a clinical counseling
Therapy skills with a focus on trauma informed care
Whole health
Wraparound services
Skills and experience attributed to very good or excellent job applicants and highly
valued by employers include:
Strong clinical skills
Overall engagement in patient experience
Strong work ethic
Embracing the mission, vision and values of the organizational culture
Time management
Customer services
Computer skills
Positive attitude
Flexibility
Professionalism
Critical thinking
Good communicators
Efforts to become leaders and transformation agents

57
Synthesis of Findings - Strategic Opportunities and Challenges
Findings based on the workforce analyses data, interviews, focus groups and surveys were
aligned to identify potential strategic opportunities and challenges for the Maricopa County
Community College District to address workforce needs in allied health care.
Strategic Opportunities
Strengthen and Expand Partnership Network with Healthcare and Behavioral Health
Organizations
MCCCD has developed an impressive network of
partnerships with organizations throughout Arizona. The
primary focus has been the development of clinical
placements where students can be placed as interns and
complete clinical requirements. Allied Health career
programs located throughout the ten campuses have
established Advisory Committees with representatives
from the respective occupations in the community. These
Clinical partners and Advisory Committee members are
typically Department Supervisors in the respective
occupational fields. These Clinical Partners provide
supervision and support for students and feedback and
advice to the MCCCD Allied Health Programs. In 2014, Dr.
Rufus Glasper, Chancellor of Maricopa County Community
College District (MCCCD), invited senior level managers in
major healthcare organizations to a roundtable session to
address the community's education and workforce
training needs.
These successful collaborative efforts provide a strong
foundation for MCCCD to further expand and engage key
personnel at multiple levels of Healthcare and Behavioral
Health organizations as partners in the development of
curricula and training for emerging allied health
occupations, recruitment pipelines for employers and training to meet the needs of the
current workforce,
Senior level executives and managers from 40 organizations participating in the Allied
Health Needs Assessment expressed an interest in potential or expanded partnerships
with MCCCD. These individuals have the capacity to provide MCCCD with input from a
long range perspective on workforce needs including hiring and training. The list
(Appendix K: Potential Partners and Resources for Maricopa County Community College
District) represents a group of employers with diverse perspectives interested in
“HonorHealth has worked
closely with Maricopa
County Community College
District to place student
interns and recruit allied
health students into the
organization as Medical
Assistants, Radiology
Technicians and many
other occupations. We
have also implemented
successful collaborative
training programs for our
workforce with Gateway
and Phoenix College.”
Dede Schmallen,
Associate Vice President of
Organizational and
Workforce Development
Judie Goe, Associate Vice
President of Talent
Acquisition
HonorHealth
58
collaboration on workforce planning and recruitment, training and curriculum
development, clinical placements and recruitment of faculty.
Specific ideas and suggestions for partnerships between MCCCD and healthcare and
behavioral health organizations included:
Hospital administrators would welcome
opportunities to provide feedback to MCCCD on
evaluations of training, curriculum and the
demands of the jobs performed in a hospital
setting.
Internship programs play a critical role in
healthcare organizations in the establishment
of pipelines for recruitment of new staff.
Healthcare organizations partnering with
Maricopa Community College District programs
on clinical internships and training reported
positive experiences frequently serving as
recruitment pipelines. In-depth internship
opportunities for one or two semesters would
be beneficial to students to reinforce training
and education.
Continue to promote an environment that allows and expects instructors to seek out
partnership roles within professional entities and organizations.
New Roles and Expanded Scope of Practice
Strengthen current allied health career programs that address emerging occupations
and expanded scope of practice. Rio Salado and
Phoenix College currently have highly regarded
programs accredited by the American Dental
Association for these occupations.
Expanded Function Dental Assistants
Community Dental Health Coordinators
The comparison of the trends to the information
from the interviews, focus groups and surveys
indicates that the modest growth rates in the
employment of Dental Assistants (18.9%) is
consistent with remarks from interviewees that
there is very little turnover in the occupation and
“New legislation (SB 1282) requires
Dental Assistants to complete Expanded
Function Dental Assistant Certification
Programs at an institution accredited by
the American Dental Association. Arizona
has three accredited programs that
include Phoenix College, Rio Salado
College and Pima College. The Arizona
Dental Association has a history of
successful collaboration with Rio Salado
and Phoenix College on certificate
programs Expanded Function Dental
Assistants and Community Dental Health
Coordinators designed to meet the needs
of the future workforce in dentistry.“
Kevin Earle, Executive Director
Arizona Dental Association
“Mountain Park Health Center
would be interested in potential
opportunities to partner with
Maricopa Community College
District to develop a pipeline for
entry-level Medical Assistants
with training and interest in
community health. Growth areas
include integrated health
specialists to support Dieticians,
Behavioral Health Practitioners
including Psychologists and
Social Workers.”
Troy Foster, Human Resources
Director
Mountain Park Health Center
59
that it is relatively easy to make new hires when necessary. Employment peaked in
2010 and declined in each subsequent year by approximately 4% (2010-11) and by
approximately 2% (2011-12). Given the increases in population and the effect on
demand for care, the results clearly suggest that the demand for Dental Assistants can
be expected, at best, to stabilize at current levels. The impact of passage of SB 1282 to
expand the scope of practice for Expanded Function Dental Assistants will drive an
increased need for certificate training among current
Dental Assistants and transform the curriculum for
new enrollees in the program.
Address the need for development of curricula and
certification programs to reflect new and emerging
roles and expanded scope of practice for allied health
occupations. Examples include
Health and Transition Coaches
Community Resource Aides
Community Care Workers
Case Managers - Integrated Care
Patient Navigators
Emergency Medical Technicians and
Paramedics
The implementation of Integrated Care (physical and behavioral health) in Arizona
presents a strategic opportunity for MCCCD to bring together the necessary
interdisciplinary resources to play a significant role the development of curricula,
workforce training and certification programs to prepare allied health workers at all
levels to work in an integrated care model.
Interdisciplinary opportunities include:
Behavioral Health Technicians
Case Aides
Case managers
Clinical Information Technology
Direct Care Paraprofessionals
Family Peer Support Partners
Health Information Infomatics programs
Integrated Health Specialists and
Coordinators
Management of Clinical Information
Technology
Management of Clinical and Bioscience
Informatics
Info Tech Specialists
“Community Care Workers
who are knowledgeable
about their communities
are essential team
members to help patients
with nutrition, medication
management and vital
signs and do whatever it
takes to keep patients out
of the ER.”
Arjelia "Argie" Gomez,
Chief Operating Officer
Chicanos Por La Causa
“In Arizona few professionals are
fully prepared for integrated
care. There is a great need for a
certificate program on
integrated care for the current
workforce in a range of
occupations, including allied
health.”
Jay Gray, Chief Operating Officer
Cenpatico
60
Medical Records Clerks
Medical Assistants
Licensed Practical Nurse (LPN )
Parent Aides
Peer Support/Recovery Specialists
Population Care Managers
Collaborative efforts with providers in the development and
delivery of certificate training content for an array of
occupations may be mutually beneficial. Provider agencies
and organizations develop training for their staff and receive
approved certification for the courses from Arizona Department of Health Services
(ADHS-DBHS). Limited options and incentives are available to share the training outside
their organization with peer agencies statewide. Strategies for MCCCD may include
hiring practitioners to teach courses, disseminate through webinars and community
college network statewide. Examples include:
Establish a Supervisor Training Certification program or Leadership Academy for
first line supervisors working in integrated care, behavioral health and human
service agencies.
Training in Behavioral Health Assessments for behavioral health paraprofessionals
including Behavioral Health Technicians, Case Aides,
Case Assistants, Direct Care Providers and Parent
Aides etc.
Establish a Prevention Certificate Program for
prevention specialists.
Establish a certification program for Direct Care
Paraprofessionals in Behavioral Health who work in
jobs as Residential Care Workers.
Workforce Training
As the healthcare climate continues to change, there
is an increasing need to hire certified/ credentialed
individuals in most areas (i.e., Med. Asst., Nursing
Asst, DMS, Rad Tech, etc.) Certification programs
would make the services provided by Community
Health Workers, Medical Assistants, Nursing Assistants, Case Aides, Case Managers
and some other occupations eligible for re-imbursement by state programs.
Nearly all the allied health occupations need more technological expertise as a
minimum standard for adequate preparation for the work they will perform.
“A Leadership Academy
Certification Program for
supervisors is needed with
components for child
welfare and behavioral
health.”
Bahney E. Dedolph,
Policy Analyst
Human Resources
Committee
Arizona Council of Human
Service Providers
“Peer and Family Support
Specialists are key to
helping people get into
and succeed in recovery.”
Shawn Nau
Chief Operating Officer
NARBHA Health Choice
61
Predictive analytics hold much promise for a health care industry that must
demonstrate value in an increasingly competitive environment.
Training for Medical Billing Coders and Billing and Posting Clerks will require more
knowledge about insurer/payer requirements,
compliance, operations and quality assurance in
addition to some specialty training to the basic
skills (for example, training billing students in
some service delivery areas such as behavioral
health, primary care, cardiology, ophthalmology or
laboratory billing as examples of options. The
training could be accomplished through classroom
training and/or internships.
Delivery of Training
Training needs to be made available in multiple
formats including online, work site, train the trainer,
classroom, webinar and hybrid models (classroom and
online). In person training is preferred by many
employers but is not always cost effective or a viable
option for some topics. Tuition reimbursement
programs are an option with the majority of employers
participating in the needs assessment but some have
had to cut back or put these programs on hold due to budget constraints. Potential
partnerships with Arizona’s statewide network of community colleges, universities,
healthcare and behavioral health providers may provide vehicles for to share and
disseminate curricula and training packages statewide.
Training for Re-Certification Requirements
Radiation Therapist - This is one of the occupations where there is a need for re-
certification as technology changes. More generally, most of the occupations face an
increasing need for continuing education as technology changes. The new emphasis on
community based post-discharge charge suggests that there will be more outpatient
care in the future
Respiratory Therapists need training for re-certification as the technology changes. For
example, Dignity Health currently handles the re-certification. There may be an
opportunity to the re-certification to be more efficiently done through a cooperative
venture with educational institutions such as MCCCD.
“Medical Billing Coders
and Billing and Posting
Clerks will need enhanced
skills and to be more
integrated into the work of
the healthcare
organization which is
expected to provide more
information on treatment
and clinical affirmation of
outcomes. Many positions
will require a college
degree.”
Mary Jo Gregory, President
and Chief Executive Officer
NARBHA Health Choice
Integrated Care
62
“Training and certification programs for
Integrated Care would be helpful for all
levels of practitioners including allied
health professionals, especially Medical
Assistants. Integrated care models
must address basic needs of patients as
many experience job loss,
homelessness and contact with the
criminal justice system as a result of
their mental illness and physical
health.”
Larry Green, Chief Executive Officer,
West Yavapai Guidance Center
“Case managers, Case Aides
and Behavioral Health Aides
provide much of the connective
tissue to support patient
services. Touchstone
developed the Whatever it
Takes program.”
Gary Brennan, President
Touchstone Behavioral Health

63
Challenges
The U.S. health care system is transforming the delivery system from hospital-
centric sick care to a super outpatient model that will emphasize community-based
care.
Training in Electronic Medical Records (EMR) is
a requirement for all allied health occupations
and ongoing training is necessary to keep up
with updates however employers utilize
different platforms and software that requires
frequent training and retraining of staff.
Implementation of integrated care will need to
address the diverse cultures and approaches.
Successful integration of physical and
behavioral health will require a shared culture,
rooted in a jointly developed common vision
and strong set of values. These values support
the organization’s mission and serve to help
resolve the inevitable conflicts that arise among
partners. They include:
A broader concern for both the quality and
cost of services delivered to a defined
population.
A sense of responsibility for the long-term
success and reputation of the organization
that feels like ownership by transcends the
details of organizational structure or legal
ownership rights.
A commitment to performance measurement transparency and to performance
improvement through collective action.
The low growth rate for the employment of Medical and Clinical Laboratory
Technicians (29-2012) (11.7%) is also consistent with the expert opinions that
many of the functions of this occupation are being replaced by automated testing
technologies. However, the reports from Sonora Quest Laboratories suggest that the
decline may represent the development of a shortage, listing this as an occupation
where it is difficult to recruit. This may also apply to Radiologic Technologists and
Technicians (29-2034/7) (-2.3%).
“Electronic health
information exchange (HIE)
is a dynamic and evolving
landscape critical to the
success of integrated care.
Access to both health and
behavioral health patient
data at the point of care
provides a means to inform
treatment but also has the
potential to reduce costs
through the reduction of
redundant or unnecessary
healthcare services.”
Ted Williams
President/Chief Executive
Officer
Arizona Behavioral Health
Corporation
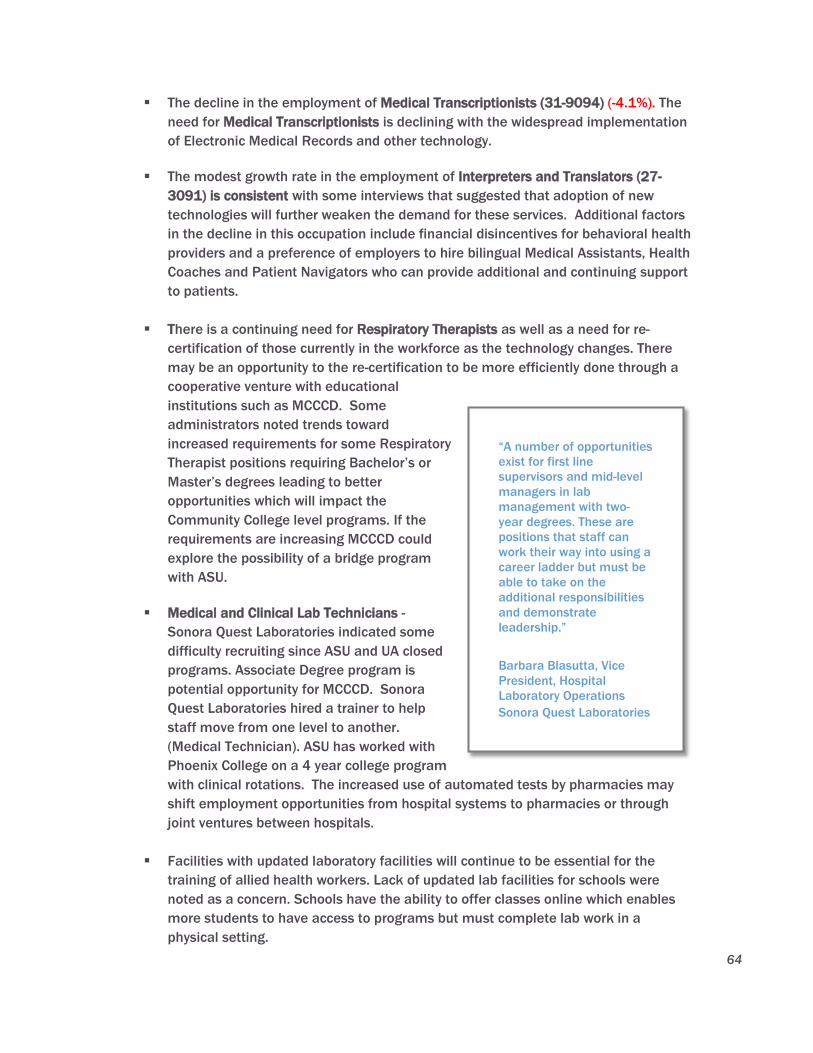
64
The decline in the employment of Medical Transcriptionists (31-9094) (-4.1%). The
need for Medical Transcriptionists is declining with the widespread implementation
of Electronic Medical Records and other technology.
The modest growth rate in the employment of Interpreters and Translators (27-
3091) is consistent with some interviews that suggested that adoption of new
technologies will further weaken the demand for these services. Additional factors
in the decline in this occupation include financial disincentives for behavioral health
providers and a preference of employers to hire bilingual Medical Assistants, Health
Coaches and Patient Navigators who can provide additional and continuing support
to patients.
There is a continuing need for Respiratory Therapists as well as a need for re-
certification of those currently in the workforce as the technology changes. There
may be an opportunity to the re-certification to be more efficiently done through a
cooperative venture with educational
institutions such as MCCCD. Some
administrators noted trends toward
increased requirements for some Respiratory
Therapist positions requiring Bachelor’s or
Master’s degrees leading to better
opportunities which will impact the
Community College level programs. If the
requirements are increasing MCCCD could
explore the possibility of a bridge program
with ASU.
Medical and Clinical Lab Technicians -
Sonora Quest Laboratories indicated some
difficulty recruiting since ASU and UA closed
programs. Associate Degree program is
potential opportunity for MCCCD. Sonora
Quest Laboratories hired a trainer to help
staff move from one level to another.
(Medical Technician). ASU has worked with
Phoenix College on a 4 year college program
with clinical rotations. The increased use of automated tests by pharmacies may
shift employment opportunities from hospital systems to pharmacies or through
joint ventures between hospitals.
Facilities with updated laboratory facilities will continue to be essential for the
training of allied health workers. Lack of updated lab facilities for schools were
noted as a concern. Schools have the ability to offer classes online which enables
more students to have access to programs but must complete lab work in a
physical setting.
“A number of opportunities
exist for first line
supervisors and mid-level
managers in lab
management with two-
year degrees. These are
positions that staff can
work their way into using a
career ladder but must be
able to take on the
additional responsibilities
and demonstrate
leadership.”
Barbara Blasutta, Vice
President, Hospital
Laboratory Operations
Sonora Quest Laboratories
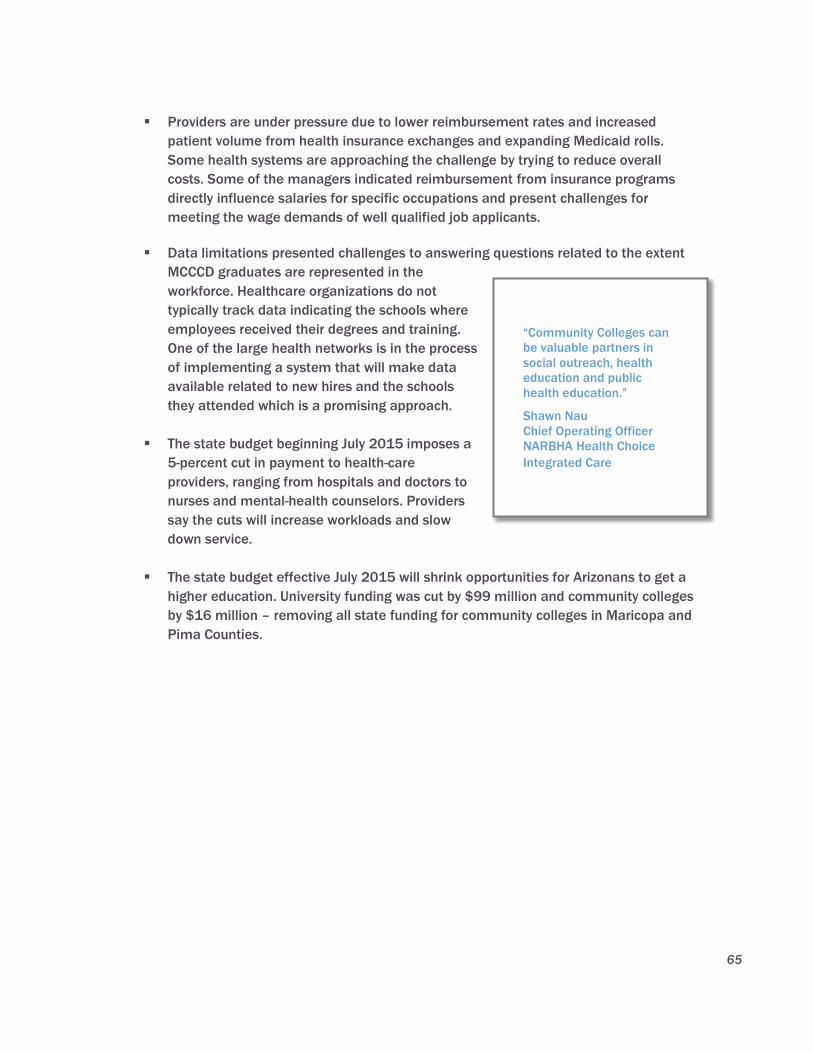
65
Providers are under pressure due to lower reimbursement rates and increased
patient volume from health insurance exchanges and expanding Medicaid rolls.
Some health systems are approaching the challenge by trying to reduce overall
costs. Some of the managers indicated reimbursement from insurance programs
directly influence salaries for specific occupations and present challenges for
meeting the wage demands of well qualified job applicants.
Data limitations presented challenges to answering questions related to the extent
MCCCD graduates are represented in the
workforce. Healthcare organizations do not
typically track data indicating the schools where
employees received their degrees and training.
One of the large health networks is in the process
of implementing a system that will make data
available related to new hires and the schools
they attended which is a promising approach.
The state budget beginning July 2015 imposes a
5-percent cut in payment to health-care
providers, ranging from hospitals and doctors to
nurses and mental-health counselors. Providers
say the cuts will increase workloads and slow
down service.
The state budget effective July 2015 will shrink opportunities for Arizonans to get a
higher education. University funding was cut by $99 million and community colleges
by $16 million – removing all state funding for community colleges in Maricopa and
Pima Counties.
“Community Colleges can
be valuable partners in
social outreach, health
education and public
health education.”
Shawn Nau
Chief Operating Officer
NARBHA Health Choice
Integrated Care

66
Conclusion
Changes in public policy, demographics, technology and health coverage will have
significant effects on the role of allied health professionals in the delivery of health care.
The disparate job titles, employment settings, and licensure regulations for these many
different allied health disciplines make it very difficult to project the degree to which
Arizona’s colleges and universities will be able to meet future allied health workforce
demand.
The professions in health care are dynamic, resulting in ever-changing training and
workforce needs.. Trend data indicates that Arizona employers will hire approximately
47,000 allied health employees by 2020 in 25 allied health occupations. In addition new
occupations are emerging to meet the needs of the changing landscape of health care
delivery such as health coaches, patient navigators, peer support specialists, population
managers and integrated care managers which will further increase the demand for allied
health workers.
Successful collaborative efforts provide a strong foundation for MCCCD to further expand
and engage key personnel at multiple levels of Healthcare and Behavioral Health
organizations as partners in the development of curricula and training for emerging allied
health occupations, recruitment pipelines for employers and training to meet the needs of
the current workforce.
MCCCD can bring vast academic resources and capacity to collaborative efforts with
networks of employers to collectively address the training needs of a growing allied health
workforce.
This is a critical time for MCCCD to develop strategic priorities and address challenges to
chart a course for the future of Allied Health occupations in Arizona. The Allied Health
Needs Assessment provides information to inform this process.
67
References
Alaska Center for Rural Health, University of Alaska Anchorage, Alaska’s Allied
Health Workforce: A Statewide Assessment, March 2001.
AMN Healthcare Clinical Workforce Survey, 2013, A National Survey of Hospital
Executives Examining Clinical Workforce issues in the Era of Health Reform.
Arizona Council of Human Service Providers, 2015 Salary Survey (a joint effort with
Mountain States Employers Council).
Arizona Department of Administration, Office of Employment & Population
Statistics, www.azstats.gov.
Arizona State Legislature (www.azleg.gov) (SB 1282, Chapter 196, Passed by
Legislature and signed by Governor on 4.6.2015)
Arizona Department of Health Services What is Community Paramedicine?
Director’s Blog, Will Humble, September 3, 2013.
(http://directorsblog.health.azdhs.gov/whats-community-paramedicine)
Arizona Department of Health Services Division of Behavioral Health
(http://www.azdhs.gov/bhs/covserv.htm)
ASU Center for Health Information & Research; Physicians’ Use, Exchange, and
Evaluation of Electronic Medical Records, October 2014.
California Hospital Association, Critical Roles: California’s Hospital Association,
Allied Health Workforce Survey, February, 2011. Hospital UAR (2007-2011).
Critical Trends Affecting The Future of Dentistry : Assessing the Shifting
Landscape, Prepared for the American Dental Association, by Diringer and
Associates, May 2013.
Maryland’s Allied Health Industry Workforce Report and Recommendations,
Presented by: Governor’s Workforce Investment Board Healthcare Industry Initiative
Steering Committee Allied Health Professions Subcommittee, June 2009.
Nursing and Allied Health Care Professionals Workforce Survey Report.
New York’s Health Care Sector; A Changing Growing Workforce, Demand Continues
for Health Care Professions, 2013.

68
Gene J. O’Dell, Donna J. Aspy, Lee Ann Jarousse for H&HN, 2015 American Hospital
Association Environmental Scan.
Phoenix Health Care Sector Partnership, Inventory of Information on Healthcare
Workforce in Arizona, March, 26, 2014 and revised April 19, 2014.
Rise in Palliative Care Could Help Boomers Living with Chronic Conditions,”
Healthline News, March 13, 2014.
William G. Johnson, The Arizona Health Care Workforce: Nurses, Pharmacists, &
Physician Assistants, A Report Sponsored by and Prepared for the Arizona Hospital
and Healthcare Association by the Center for Health Information & Research. April
2009.
Stephen W. Thomas, Lee McLean, Alisa Debnam, The Role of Allied Health in Health
Care Reform. Health Reform in North Carolina, North Caroline Medical Journal Vol
72, No.5. (NCMedicalJournal.com)
Surveys administered by Maricopa Community Colleges such as Employer Survey,
Histologic Technology Program Phoenix College.
U.S. Department of Labor Bureau of Labor Statistics, May 2013 estimated
employment: http://www.bls.gov/oes/current/oes_az.htm#29-0000.

69
Appendix A: Organizations and Senior Managers Interviewed
Organizations and Senior Managers Interviewed
Organization Interview Participants
Arizona Alliance for Community Health Centers Lourdes Paez, Coordinator
Workforce Development
Arizona Behavioral Health Corporation Ted Williams, President and Chief Executive Officer
Arizona Council of Human Service Providers Emily Jenkins, Executive Director
Bahney Dedolph, Policy Analyst
Focus Group Human Resources Committee (10)
Arizona Dental Association Kevin Earle, Executive Director
Arizona Healthcare Human Resources Association Wick Lewis, President
Gary Pastore, Board Member, HonorHealth
Arizona Department of Health Services, Bureau of Health
Systems Development
Patricia Tarango, Bureau Chief
Arizona Public Health Association Tracy Lenartz, President
Arizonans for Prevention Lauriane Bellot-Hanson
Vice President, Board of Directors and
Community Youth Development Program Coordinator
Southwest Behavioral Health Services
Banner Health Network
Deborah Dahl, VP/Clinical Innovation
Deborah Martin, RN, Professional Development, Senior Director
Barnet Dulaney Perkins Eye Centers
Tracy G. Farrington, Director of Clinics
Cardiovascular Consultants
Dr. Andrei Damien, Chief Executive Officer
Cenpatico Dr. Jay Gray, Chief Operating Officer
Michele Flatbush, Provider Performance and Network Development
Administrator
Lee Martinez, Program Specialist
Kristin Frounfelker, Medical Management Administrator
Chicanos Por La Causa Arjelia Gomez, Chief Operating Officer
Dignity Health Kathleen Dowler, Director of Community Integration
Marc Community Services Cheryl Anderson, Director of Recovery and Resiliency Services
Doug Barshter, Training Manager
Mountain Park Community Health Center Troy Foster, Human Resources Director
NARBHA
Health Choice Integrated Care
Mary Jo Gregory, President and Chief Executive Officer
Shawn Nau, Chief Operating Officer
Providers Meeting (10)
Scottsdale Healthcare – Lincoln Health Care Network
(HonorHealth)
Dede Schmallen, Associate Vice President of Organizational and
Workforce Development
Judie Goe, Associate Vice President of Talent Acquisition
Judie Seiler, Network Director, Workforce Development
Sonora Quest Laboratories
Barbara Blasutta, VP Hospital Laboratory Operations
Joe Garletts, Director, Operations, SQL
Peggy Scroggins, Director, Human Resources
Southwest Network Amy Henning, Chief Executive Officer
The Guidance Clinic Jack Callaghan, CEO
Mike Lerch, Human Resource Director
Touchstone Behavioral Health Gary Brennan, President
West Yavapai Guidance Clinic Larry Green, Chief Executive Officer
Total Organizations =23 Total Participants =46

70
Appendix B: Crosswalk of MCCCD Allied Health Programs to BLS SOC Occupations
Crosswalk of MCCCD Allied Health Programs to BLS SOC Occupations
MCCCD Allied Health Programs SOC Title Definition
Health Services Management,
Healthcare Regulatory Compliance
11-9111 Medical and Health
Services Managers
Plan, direct, or coordinate medical and health services in hospitals, clinics, managed care organizations, public
health agencies, or similar organizations.
Clinical Research Associate and
Coordinator
11-9121 Natural Sciences
Managers
Plan, direct, or coordinate activities in such fields as life sciences, physical sciences, mathematics, statistics,
and research and development in these fields. Exclude "Engineering Managers" (11-9041) and "Computer and
Information Systems Managers" (11-3021).
Community Health Advocate,
Community Dental Health
21-1094 Community Health
Workers
Assist individuals and communities to adopt healthy behaviors. Conduct outreach for medical personnel or
health organizations to implement programs in the community that promote, maintain, and improve individual
and community health. May provide information on resources, provide social support and informal counseling,
advocate for individuals and community health needs, and provide services such as first aid and blood pressure
screening. May collect data to help identify community health needs. Excludes “Health Educators” (21-1091).
Medical Interpreter-Spanish 27-3091 Interpreters and
Translators
Interpret oral or sign language, or translate written text from one language into another.
Radiation Therapy Technologist 29-1124 Radiation Therapists Provide radiation therapy to patients as prescribed by a radiologist according to established practices and
standards. Duties may include reviewing prescription and diagnosis; acting as liaison with physician and
supportive care personnel; preparing equipment, such as immobilization, treatment, and protection devices; and
maintaining records, reports, and files. May assist in dosimetry procedures and tumor localization.
Respiratory Care 29-1126 Respiratory Therapists Assess, treat, and care for patients with breathing disorders. Assume primary responsibility for all respiratory
care modalities, including the supervision of respiratory therapy technicians. Initiate and conduct therapeutic
procedures; maintain patient records; and select, assemble, check, and operate equipment.
Clinical Laboratory Technician,
Histologic Technician, Laboratory
Assistant
29-2012 Medical and Clinical
Laboratory Technicians
Perform routine medical laboratory tests for the diagnosis, treatment, and prevention of disease. May work
under the supervision of a medical technologist.
Dental Hygienist 29-2021 Dental Hygienists Clean teeth and examine oral areas, head, and neck for signs of oral disease. May educate patients on oral
hygiene, take and develop x rays, or apply fluoride or sealants.
EKG Technician 29-2031 Cardiovascular
Technologists and
Technicians
Conduct tests on pulmonary or cardiovascular systems of patients for diagnostic purposes. May conduct or
assist in electrocardiograms, cardiac catheterizations, pulmonary functions, lung capacity, and similar tests.
Includes vascular technologists.
Diagnostic Medical Sonography 29-2032 Diagnostic Medical
Sonographers
Produce ultrasonic recordings of internal organs for use by physicians.
Nuclear Medicine Technology 29-2033 Nuclear Medicine
Technologists
Prepare, administer, measure radioactive isotopes in therapeutic, diagnostic, and tracer studies using a variety
of radioisotope equipment. Prepare stock solutions of radioactive materials and calculate doses to be
administered by radiologists. Subject patients to radiation. Execute blood volume, red cell survival, and fat
absorption studies following standard laboratory techniques.

71
Crosswalk of MCCCD Allied Health Programs to BLS SOC Occupations
MCCCD Allied Health Programs SOC Title Definition
Medical Radiographer 29-2034 Radiologic
Technologists
Take x rays and CAT scans or administer nonradioactive materials into patient's blood stream for diagnostic
purposes. Includes technologists who specialize in other scanning modalities. Excludes “Diagnostic Medical
Sonographers”(29-2032) and “Magnetic Resonance Imaging Technologists” (29-2035).
Magnetic Resonance Imaging,
Computed Tomography
29-2035 Magnetic Resonance
Imaging Technologists
Operate Magnetic Resonance Imaging (MRI) scanners. Monitor patient safety and comfort, and view images of
area being scanned to ensure quality of pictures. May administer gadolinium contrast dosage intravenously.
May interview patient, explain MRI procedures, and position patient on examining table. May enter into the
computer data such as patient history, anatomical area to be scanned, orientation specified, and position of
entry.
EMT 29-2041 Emergency Medical
Technicians and
Paramedics
Assess injuries, administer emergency medical care, and extricate trapped individuals. Transport injured or sick
persons to medical facilities.
Dietetic Technology 29-2051 Dietetic Technicians Assist in the provision of food service and nutritional programs, under the supervision of a dietitian. May plan
and produce meals based on established guidelines, teach principles of food and nutrition, or counsel
individuals.
Pharmacy Technician, Pharmacy Tech:
Test Prep
29-2052 Pharmacy Technicians Prepare medications under the direction of a pharmacist. May measure, mix, count out, label, and record
amounts and dosages of medications according to prescription orders.
Advanced Behavioral Health Services 29-2053 Psychiatric Technicians Care for individuals with mental or emotional conditions or disabilities, following the instructions of physicians or
other health practitioners. Monitor patients' physical and emotional well-being and report to medical staff. May
participate in rehabilitation and treatment programs, help with personal hygiene, and administer oral or
injectable medications.
Surgical Technologist 29-2055 Surgical Technologists Assist in operations, under the supervision of surgeons, registered nurses, or other surgical personnel. May help
set up operating room, prepare and transport patients for surgery, adjust lights and equipment, pass
instruments and other supplies to surgeons and surgeon's assistants, hold retractors, cut sutures, and help
count sponges, needles, supplies, and instruments.
Ophthalmic Assistant 29-2057 Ophthalmic Medical
Technicians
Assist ophthalmologists by performing ophthalmic clinical functions. May administer eye exams, administer eye
medications, and instruct the patient in care and use of corrective lenses.
Health Information 29-2071 Medical Records and
Health Information
Technicians
Compile, process, and maintain medical records of hospital and clinic patients in a manner consistent with
medical, administrative, ethical, legal, and regulatory requirements of the health care system. Process,
maintain, compile, and report patient information for health requirements and standards in a manner consistent
with the healthcare industry’s numerical coding system. Excludes “File Clerks” (43-4071).
Tech: Electroneurodiagnostic
Tech;Polysomnnography EEG/END;
Dialysis
29-2099 Health Technologists
and Technicians, All
Other
All health technologists and technicians not listed separately.
Patient Care Associate 31-1014 Nursing Assistants Provide basic patient care under direction of nursing staff. Perform duties such as feed, bathe, dress, groom, or
move patients, or change linens. May transfer or transport patients. Includes nursing care attendants, nursing
aides, and nursing attendants. Excludes "Home Health Aides" (31-1011), "Orderlies" (31-1015), "Personal Care
Aides" (39-9021), and "Psychiatric Aides" (31-1013).
Health Unit Coordinating,
Dental Office Management
43-6013 Medical Secretaries Perform secretarial duties utilizing specific knowledge of medical terminology and hospital, clinic, or laboratory
procedures. Duties include scheduling appointments, billing patients, and compiling and recording medical
charts, reports, and correspondence.
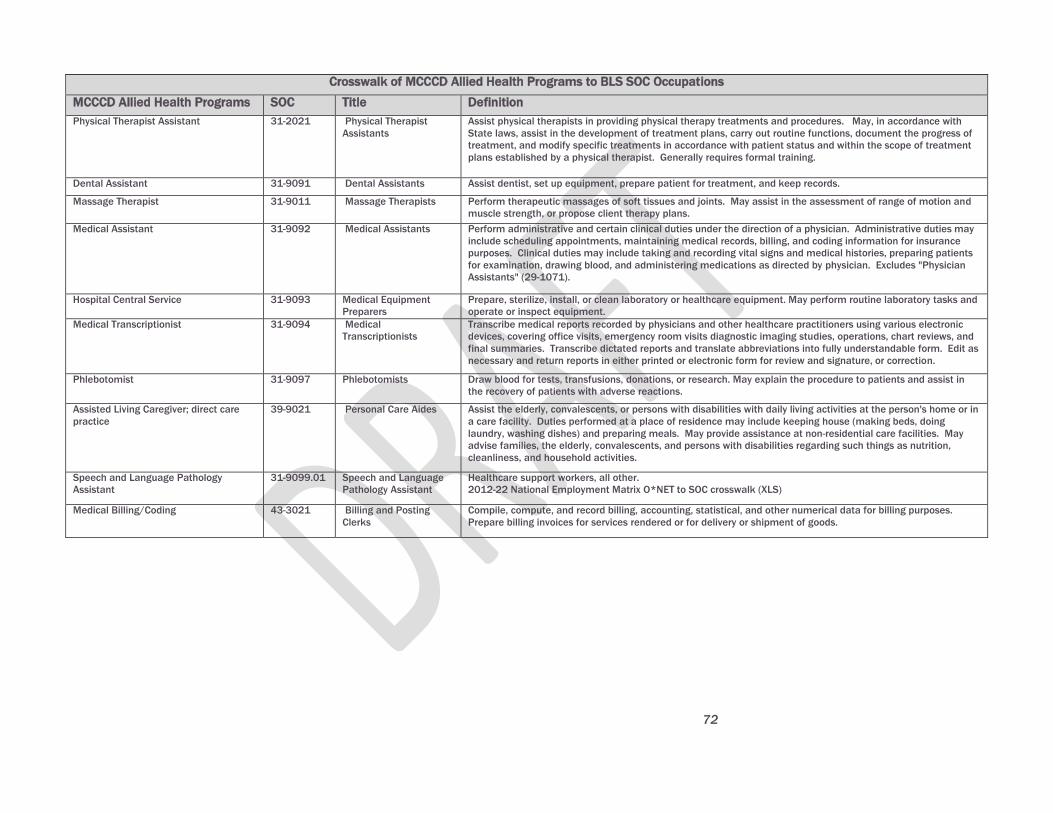
72
Crosswalk of MCCCD Allied Health Programs to BLS SOC Occupations
MCCCD Allied Health Programs SOC Title Definition
Physical Therapist Assistant 31-2021 Physical Therapist
Assistants
Assist physical therapists in providing physical therapy treatments and procedures. May, in accordance with
State laws, assist in the development of treatment plans, carry out routine functions, document the progress of
treatment, and modify specific treatments in accordance with patient status and within the scope of treatment
plans established by a physical therapist. Generally requires formal training.
Dental Assistant 31-9091 Dental Assistants Assist dentist, set up equipment, prepare patient for treatment, and keep records.
Massage Therapist 31-9011 Massage Therapists Perform therapeutic massages of soft tissues and joints. May assist in the assessment of range of motion and
muscle strength, or propose client therapy plans.
Medical Assistant 31-9092 Medical Assistants Perform administrative and certain clinical duties under the direction of a physician. Administrative duties may
include scheduling appointments, maintaining medical records, billing, and coding information for insurance
purposes. Clinical duties may include taking and recording vital signs and medical histories, preparing patients
for examination, drawing blood, and administering medications as directed by physician. Excludes "Physician
Assistants" (29-1071).
Hospital Central Service 31-9093 Medical Equipment
Preparers
Prepare, sterilize, install, or clean laboratory or healthcare equipment. May perform routine laboratory tasks and
operate or inspect equipment.
Medical Transcriptionist 31-9094 Medical
Transcriptionists
Transcribe medical reports recorded by physicians and other healthcare practitioners using various electronic
devices, covering office visits, emergency room visits diagnostic imaging studies, operations, chart reviews, and
final summaries. Transcribe dictated reports and translate abbreviations into fully understandable form. Edit as
necessary and return reports in either printed or electronic form for review and signature, or correction.
Phlebotomist 31-9097 Phlebotomists Draw blood for tests, transfusions, donations, or research. May explain the procedure to patients and assist in
the recovery of patients with adverse reactions.
Assisted Living Caregiver; direct care
practice
39-9021 Personal Care Aides Assist the elderly, convalescents, or persons with disabilities with daily living activities at the person's home or in
a care facility. Duties performed at a place of residence may include keeping house (making beds, doing
laundry, washing dishes) and preparing meals. May provide assistance at non-residential care facilities. May
advise families, the elderly, convalescents, and persons with disabilities regarding such things as nutrition,
cleanliness, and household activities.
Speech and Language Pathology
Assistant
31-9099.01 Speech and Language
Pathology Assistant
Healthcare support workers, all other.
2012-22 National Employment Matrix O*NET to SOC crosswalk (XLS)
Medical Billing/Coding 43-3021 Billing and Posting
Clerks
Compile, compute, and record billing, accounting, statistical, and other numerical data for billing purposes.
Prepare billing invoices for services rendered or for delivery or shipment of goods.
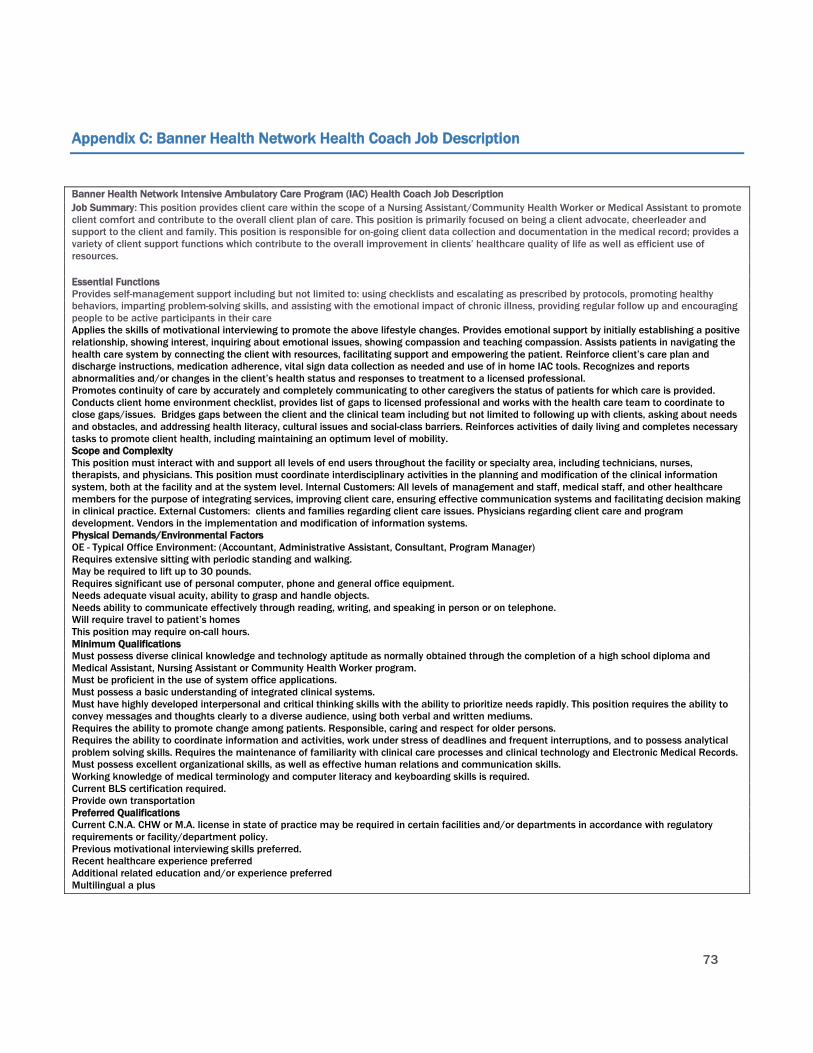
73
Appendix C: Banner Health Network Health Coach Job Description
Banner Health Network Intensive Ambulatory Care Program (IAC) Health Coach Job Description
Job Summary: This position provides client care within the scope of a Nursing Assistant/Community Health Worker or Medical Assistant to promote
client comfort and contribute to the overall client plan of care. This position is primarily focused on being a client advocate, cheerleader and
support to the client and family. This position is responsible for on-going client data collection and documentation in the medical record; provides a
variety of client support functions which contribute to the overall improvement in clients’ healthcare quality of life as well as efficient use of
resources.
Essential Functions
Provides self-management support including but not limited to: using checklists and escalating as prescribed by protocols, promoting healthy
behaviors, imparting problem-solving skills, and assisting with the emotional impact of chronic illness, providing regular follow up and encouraging
people to be active participants in their care
Applies the skills of motivational interviewing to promote the above lifestyle changes. Provides emotional support by initially establishing a positive
relationship, showing interest, inquiring about emotional issues, showing compassion and teaching compassion. Assists patients in navigating the
health care system by connecting the client with resources, facilitating support and empowering the patient. Reinforce client’s care plan and
discharge instructions, medication adherence, vital sign data collection as needed and use of in home IAC tools. Recognizes and reports
abnormalities and/or changes in the client’s health status and responses to treatment to a licensed professional.
Promotes continuity of care by accurately and completely communicating to other caregivers the status of patients for which care is provided.
Conducts client home environment checklist, provides list of gaps to licensed professional and works with the health care team to coordinate to
close gaps/issues. Bridges gaps between the client and the clinical team including but not limited to following up with clients, asking about needs
and obstacles, and addressing health literacy, cultural issues and social-class barriers. Reinforces activities of daily living and completes necessary
tasks to promote client health, including maintaining an optimum level of mobility.
Scope and Complexity
This position must interact with and support all levels of end users throughout the facility or specialty area, including technicians, nurses,
therapists, and physicians. This position must coordinate interdisciplinary activities in the planning and modification of the clinical information
system, both at the facility and at the system level. Internal Customers: All levels of management and staff, medical staff, and other healthcare
members for the purpose of integrating services, improving client care, ensuring effective communication systems and facilitating decision making
in clinical practice. External Customers: clients and families regarding client care issues. Physicians regarding client care and program
development. Vendors in the implementation and modification of information systems.
Physical Demands/Environmental Factors
OE - Typical Office Environment: (Accountant, Administrative Assistant, Consultant, Program Manager)
Requires extensive sitting with periodic standing and walking.
May be required to lift up to 30 pounds.
Requires significant use of personal computer, phone and general office equipment.
Needs adequate visual acuity, ability to grasp and handle objects.
Needs ability to communicate effectively through reading, writing, and speaking in person or on telephone.
Will require travel to patient’s homes
This position may require on-call hours.
Minimum Qualifications
Must possess diverse clinical knowledge and technology aptitude as normally obtained through the completion of a high school diploma and
Medical Assistant, Nursing Assistant or Community Health Worker program.
Must be proficient in the use of system office applications.
Must possess a basic understanding of integrated clinical systems.
Must have highly developed interpersonal and critical thinking skills with the ability to prioritize needs rapidly. This position requires the ability to
convey messages and thoughts clearly to a diverse audience, using both verbal and written mediums.
Requires the ability to promote change among patients. Responsible, caring and respect for older persons.
Requires the ability to coordinate information and activities, work under stress of deadlines and frequent interruptions, and to possess analytical
problem solving skills. Requires the maintenance of familiarity with clinical care processes and clinical technology and Electronic Medical Records.
Must possess excellent organizational skills, as well as effective human relations and communication skills.
Working knowledge of medical terminology and computer literacy and keyboarding skills is required.
Current BLS certification required.
Provide own transportation
Preferred Qualifications
Current C.N.A. CHW or M.A. license in state of practice may be required in certain facilities and/or departments in accordance with regulatory
requirements or facility/department policy.
Previous motivational interviewing skills preferred.
Recent healthcare experience preferred
Additional related education and/or experience preferred
Multilingual a plus
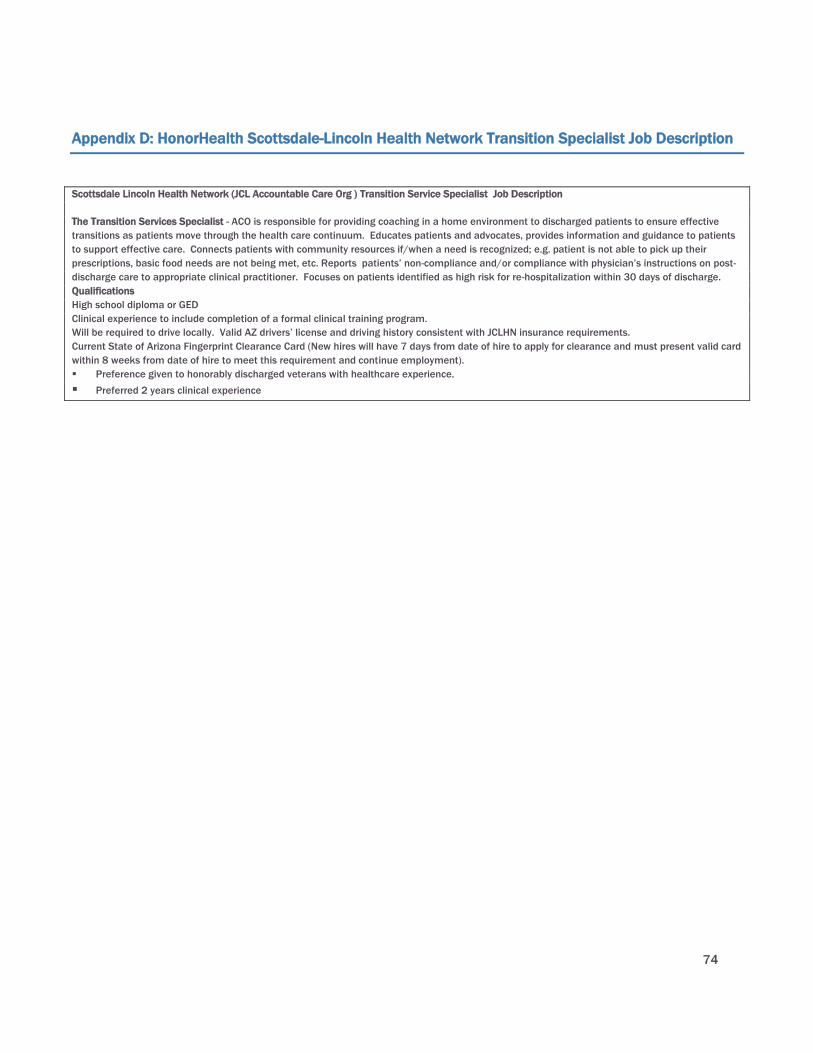
74
Appendix D: HonorHealth Scottsdale-Lincoln Health Network Transition Specialist Job Description
Scottsdale Lincoln Health Network (JCL Accountable Care Org ) Transition Service Specialist Job Description
The Transition Services Specialist - ACO is responsible for providing coaching in a home environment to discharged patients to ensure effective
transitions as patients move through the health care continuum. Educates patients and advocates, provides information and guidance to patients
to support effective care. Connects patients with community resources if/when a need is recognized; e.g. patient is not able to pick up their
prescriptions, basic food needs are not being met, etc. Reports patients’ non-compliance and/or compliance with physician’s instructions on post-
discharge care to appropriate clinical practitioner. Focuses on patients identified as high risk for re-hospitalization within 30 days of discharge.
Qualifications
High school diploma or GED
Clinical experience to include completion of a formal clinical training program.
Will be required to drive locally. Valid AZ drivers’ license and driving history consistent with JCLHN insurance requirements.
Current State of Arizona Fingerprint Clearance Card (New hires will have 7 days from date of hire to apply for clearance and must present valid card
within 8 weeks from date of hire to meet this requirement and continue employment).
Preference given to honorably discharged veterans with healthcare experience.
Preferred 2 years clinical experience
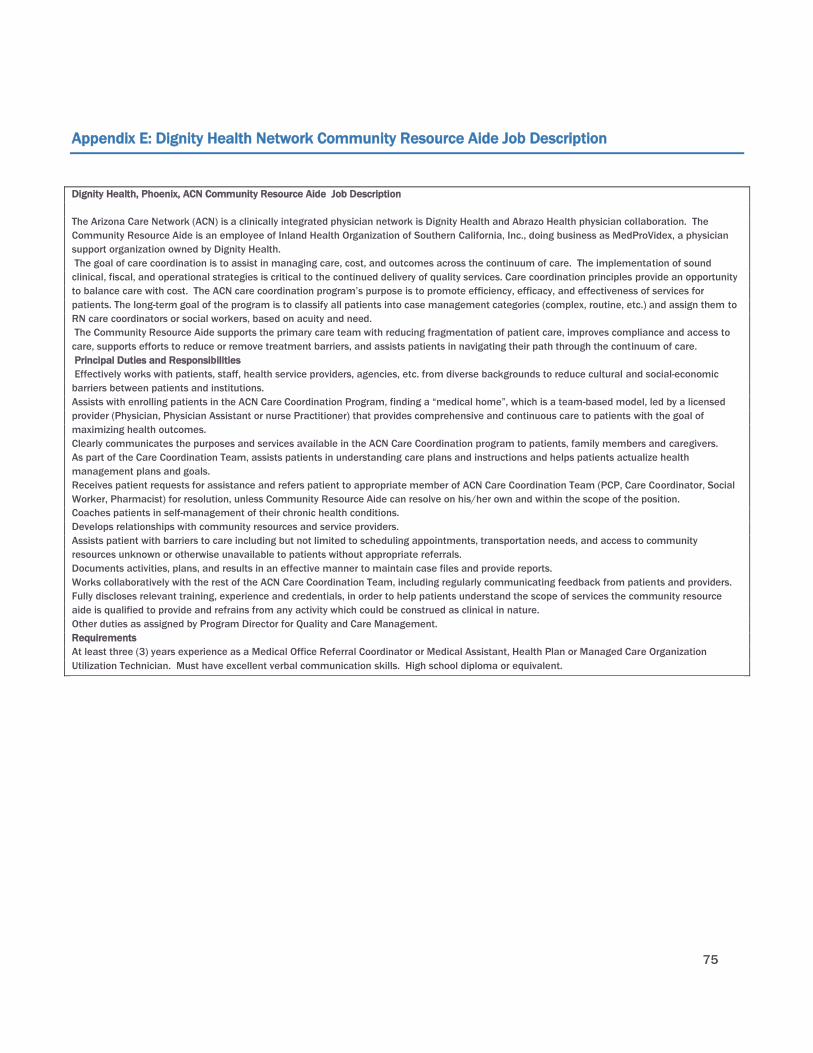
75
Appendix E: Dignity Health Network Community Resource Aide Job Description
Dignity Health, Phoenix, ACN Community Resource Aide Job Description
The Arizona Care Network (ACN) is a clinically integrated physician network is Dignity Health and Abrazo Health physician collaboration. The
Community Resource Aide is an employee of Inland Health Organization of Southern California, Inc., doing business as MedProVidex, a physician
support organization owned by Dignity Health.
The goal of care coordination is to assist in managing care, cost, and outcomes across the continuum of care. The implementation of sound
clinical, fiscal, and operational strategies is critical to the continued delivery of quality services. Care coordination principles provide an opportunity
to balance care with cost. The ACN care coordination program’s purpose is to promote efficiency, efficacy, and effectiveness of services for
patients. The long-term goal of the program is to classify all patients into case management categories (complex, routine, etc.) and assign them to
RN care coordinators or social workers, based on acuity and need.
The Community Resource Aide supports the primary care team with reducing fragmentation of patient care, improves compliance and access to
care, supports efforts to reduce or remove treatment barriers, and assists patients in navigating their path through the continuum of care.
Principal Duties and Responsibilities
Effectively works with patients, staff, health service providers, agencies, etc. from diverse backgrounds to reduce cultural and social-economic
barriers between patients and institutions.
Assists with enrolling patients in the ACN Care Coordination Program, finding a “medical home”, which is a team-based model, led by a licensed
provider (Physician, Physician Assistant or nurse Practitioner) that provides comprehensive and continuous care to patients with the goal of
maximizing health outcomes.
Clearly communicates the purposes and services available in the ACN Care Coordination program to patients, family members and caregivers.
As part of the Care Coordination Team, assists patients in understanding care plans and instructions and helps patients actualize health
management plans and goals.
Receives patient requests for assistance and refers patient to appropriate member of ACN Care Coordination Team (PCP, Care Coordinator, Social
Worker, Pharmacist) for resolution, unless Community Resource Aide can resolve on his/her own and within the scope of the position.
Coaches patients in self-management of their chronic health conditions.
Develops relationships with community resources and service providers.
Assists patient with barriers to care including but not limited to scheduling appointments, transportation needs, and access to community
resources unknown or otherwise unavailable to patients without appropriate referrals.
Documents activities, plans, and results in an effective manner to maintain case files and provide reports.
Works collaboratively with the rest of the ACN Care Coordination Team, including regularly communicating feedback from patients and providers.
Fully discloses relevant training, experience and credentials, in order to help patients understand the scope of services the community resource
aide is qualified to provide and refrains from any activity which could be construed as clinical in nature.
Other duties as assigned by Program Director for Quality and Care Management.
Requirements
At least three (3) years experience as a Medical Office Referral Coordinator or Medical Assistant, Health Plan or Managed Care Organization
Utilization Technician. Must have excellent verbal communication skills. High school diploma or equivalent.
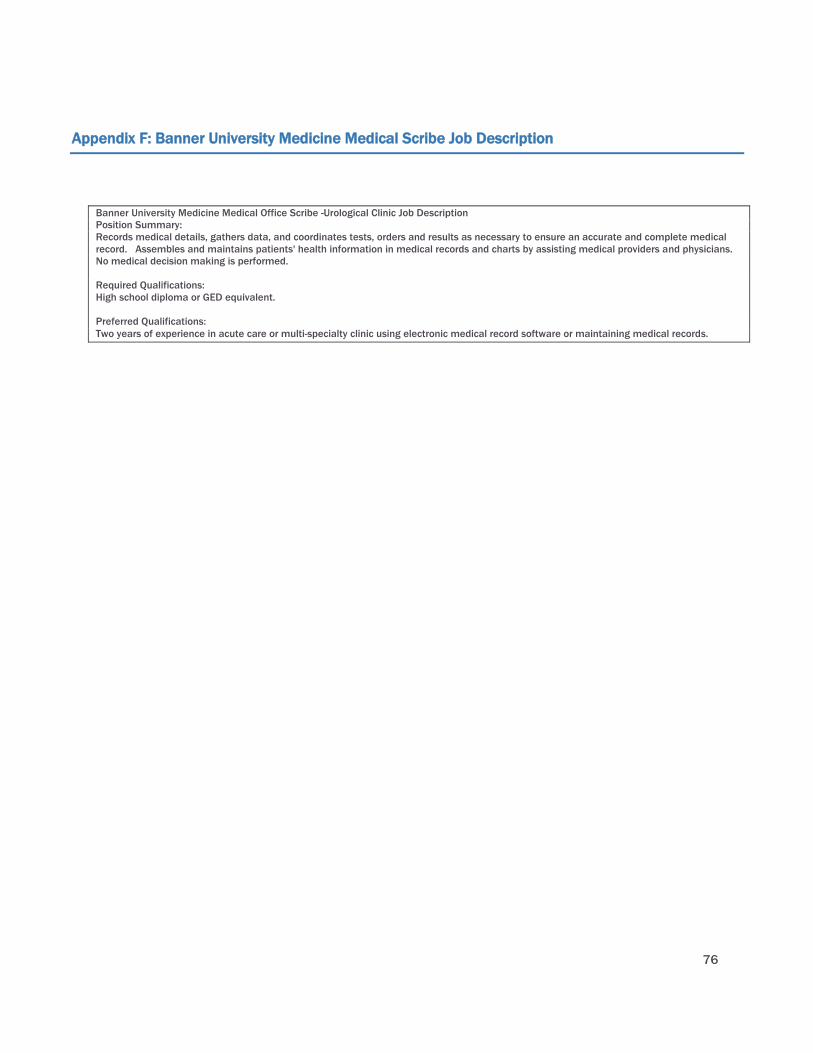
76
Appendix F: Banner University Medicine Medical Scribe Job Description
Banner University Medicine Medical Office Scribe -Urological Clinic Job Description
Position Summary:
Records medical details, gathers data, and coordinates tests, orders and results as necessary to ensure an accurate and complete medical
record. Assembles and maintains patients' health information in medical records and charts by assisting medical providers and physicians.
No medical decision making is performed.
Required Qualifications:
High school diploma or GED equivalent.
Preferred Qualifications:
Two years of experience in acute care or multi-specialty clinic using electronic medical record software or maintaining medical records.

77
Appendix G: MH7 Medical Assistant-Scribe Job Description
MH7 Medical Assistant-Scribe – Job Description
We're looking for a team player, with experience, great work ethic and excellent people skills who enjoys working in geriatrics. Requires an
outgoing pleasant personality, excellent computer skills, and a willingness to learn. EMR experience is required. Must be a self-starter with great
attention to detail.
We need Scribes that will serve as valuable members of our healthcare team, providing real-time charting for providers by shadowing them
throughout their day and performing a variety of helpful tasks.
Common duties include:
Checking patients in to the EMR
Updating medication list
Checking and recording vitals
Preparing plans for follow-up care

78
Appendix H: HonorHealth (Scottsdale Lincoln Health Network) – Patient Navigator Job Description
Honor Health (Scottsdale Lincoln Health Network) – Patient Navigator Job Description
Patient Navigator-ACO is responsible for coordinating and expediting care for all patients who are attributed to the Accountable Care Organization.
Effectively communicates with JCL ACO participating providers and community support organizations to co-ordinate and facilitate a comprehensive
plan-of-care for patients attributed to the ACO. This includes scheduling appointments and providing a full range of support services as well as a
wide range of educational information.
Qualifications
High school diploma or GED
3 years working within a health insurance call center dealing with benefit verification and scheduling or similar experience in a health care setting.
Novice Excel
Novice PowerPoint
Intermediate Word
Intermediate MS Outlook
Must demonstrate proficiency in Electronic Health Record post hire by attending required training and passing proficiency test.
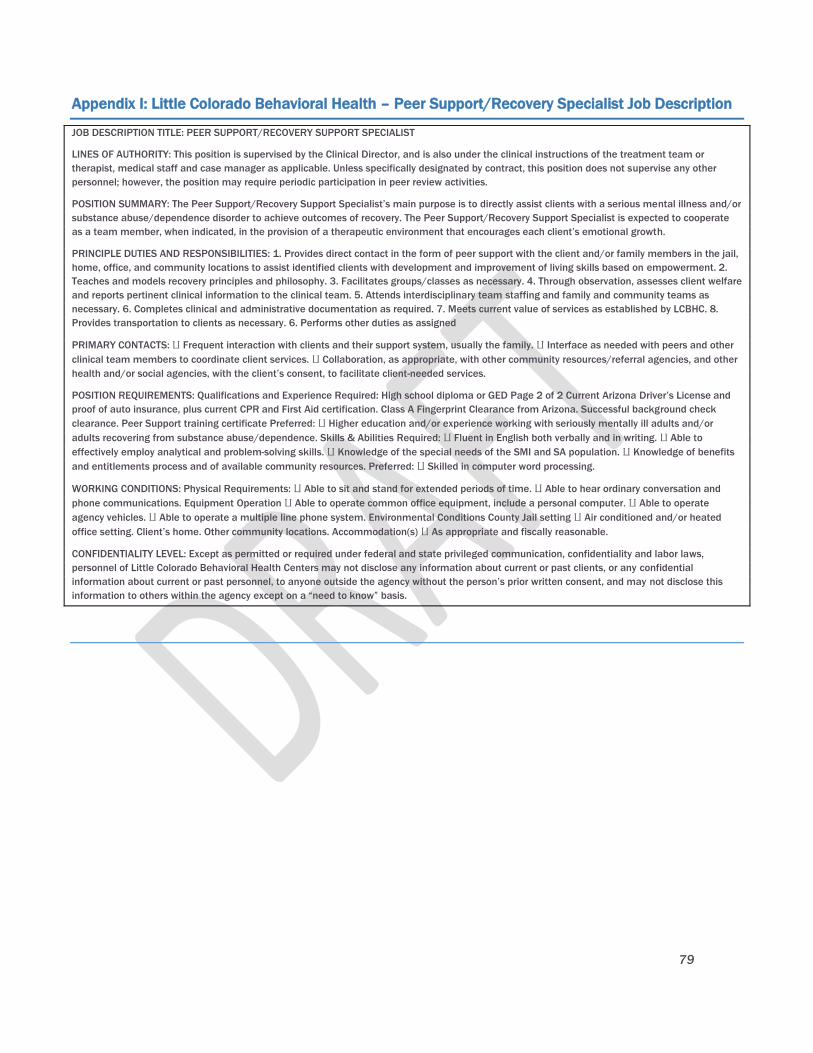
79
Appendix I: Little Colorado Behavioral Health – Peer Support/Recovery Specialist Job Description
JOB DESCRIPTION TITLE: PEER SUPPORT/RECOVERY SUPPORT SPECIALIST
LINES OF AUTHORITY: This position is supervised by the Clinical Director, and is also under the clinical instructions of the treatment team or
therapist, medical staff and case manager as applicable. Unless specifically designated by contract, this position does not supervise any other
personnel; however, the position may require periodic participation in peer review activities.
POSITION SUMMARY: The Peer Support/Recovery Support Specialist’s main purpose is to directly assist clients with a serious mental illness and/or
substance abuse/dependence disorder to achieve outcomes of recovery. The Peer Support/Recovery Support Specialist is expected to cooperate
as a team member, when indicated, in the provision of a therapeutic environment that encourages each client’s emotional growth.
PRINCIPLE DUTIES AND RESPONSIBILITIES: 1. Provides direct contact in the form of peer support with the client and/or family members in the jail,
home, office, and community locations to assist identified clients with development and improvement of living skills based on empowerment. 2.
Teaches and models recovery principles and philosophy. 3. Facilitates groups/classes as necessary. 4. Through observation, assesses client welfare
and reports pertinent clinical information to the clinical team. 5. Attends interdisciplinary team staffing and family and community teams as
necessary. 6. Completes clinical and administrative documentation as required. 7. Meets current value of services as established by LCBHC. 8.
Provides transportation to clients as necessary. 6. Performs other duties as assigned
PRIMARY CONTACTS: ⨿ Frequent interaction with clients and their support system, usually the family. ⨿ Interface as needed with peers and other
clinical team members to coordinate client services. ⨿ Collaboration, as appropriate, with other community resources/referral agencies, and other
health and/or social agencies, with the client’s consent, to facilitate client-needed services.
POSITION REQUIREMENTS: Qualifications and Experience Required: High school diploma or GED Page 2 of 2 Current Arizona Driver’s License and
proof of auto insurance, plus current CPR and First Aid certification. Class A Fingerprint Clearance from Arizona. Successful background check
clearance. Peer Support training certificate Preferred: ⨿ Higher education and/or experience working with seriously mentally ill adults and/or
adults recovering from substance abuse/dependence. Skills & Abilities Required: ⨿ Fluent in English both verbally and in writing. ⨿ Able to
effectively employ analytical and problem-solving skills. ⨿ Knowledge of the special needs of the SMI and SA population. ⨿ Knowledge of benefits
and entitlements process and of available community resources. Preferred: ⨿ Skilled in computer word processing.
WORKING CONDITIONS: Physical Requirements: ⨿ Able to sit and stand for extended periods of time. ⨿ Able to hear ordinary conversation and
phone communications. Equipment Operation ⨿ Able to operate common office equipment, include a personal computer. ⨿ Able to operate
agency vehicles. ⨿ Able to operate a multiple line phone system. Environmental Conditions County Jail setting ⨿ Air conditioned and/or heated
office setting. Client’s home. Other community locations. Accommodation(s) ⨿ As appropriate and fiscally reasonable.
CONFIDENTIALITY LEVEL: Except as permitted or required under federal and state privileged communication, confidentiality and labor laws,
personnel of Little Colorado Behavioral Health Centers may not disclose any information about current or past clients, or any confidential
information about current or past personnel, to anyone outside the agency without the person’s prior written consent, and may not disclose this
information to others within the agency except on a “need to know” basis.
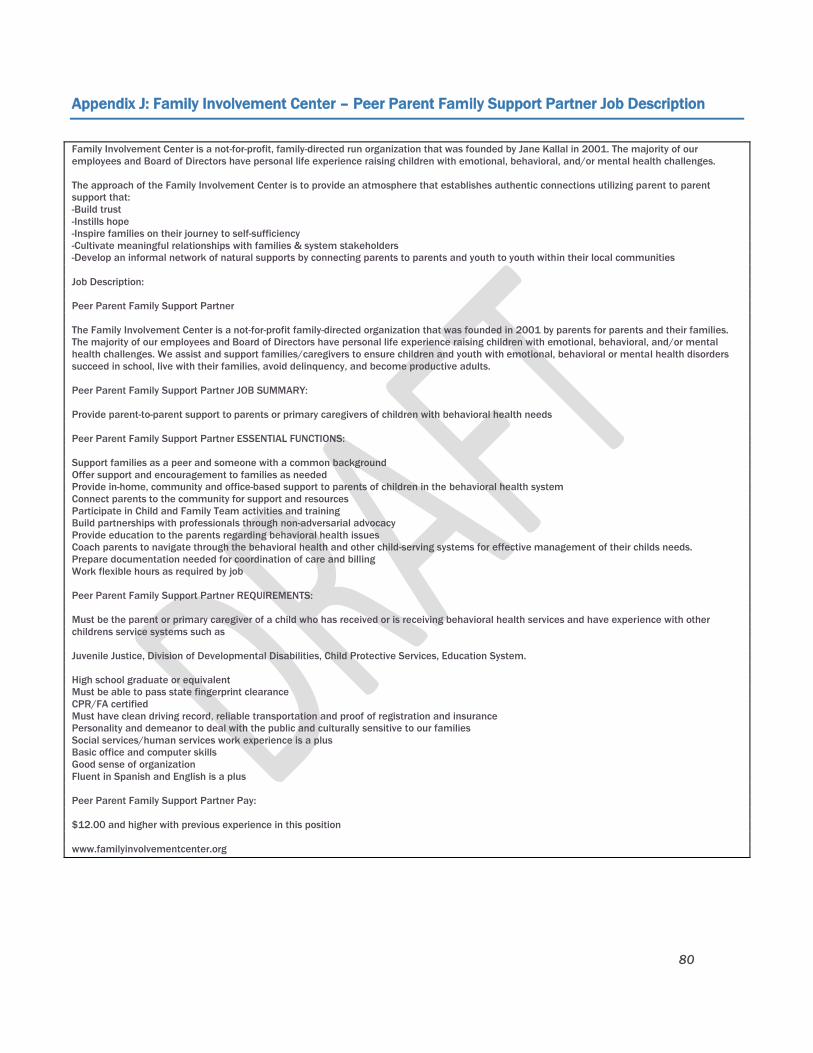
80
Appendix J: Family Involvement Center – Peer Parent Family Support Partner Job Description
Family Involvement Center is a not-for-profit, family-directed run organization that was founded by Jane Kallal in 2001. The majority of our
employees and Board of Directors have personal life experience raising children with emotional, behavioral, and/or mental health challenges.
The approach of the Family Involvement Center is to provide an atmosphere that establishes authentic connections utilizing parent to parent
support that:
-Build trust
-Instills hope
-Inspire families on their journey to self-sufficiency
-Cultivate meaningful relationships with families & system stakeholders
-Develop an informal network of natural supports by connecting parents to parents and youth to youth within their local communities
Job Description:
Peer Parent Family Support Partner
The Family Involvement Center is a not-for-profit family-directed organization that was founded in 2001 by parents for parents and their families.
The majority of our employees and Board of Directors have personal life experience raising children with emotional, behavioral, and/or mental
health challenges. We assist and support families/caregivers to ensure children and youth with emotional, behavioral or mental health disorders
succeed in school, live with their families, avoid delinquency, and become productive adults.
Peer Parent Family Support Partner JOB SUMMARY:
Provide parent-to-parent support to parents or primary caregivers of children with behavioral health needs
Peer Parent Family Support Partner ESSENTIAL FUNCTIONS:
Support families as a peer and someone with a common background
Offer support and encouragement to families as needed
Provide in-home, community and office-based support to parents of children in the behavioral health system
Connect parents to the community for support and resources
Participate in Child and Family Team activities and training
Build partnerships with professionals through non-adversarial advocacy
Provide education to the parents regarding behavioral health issues
Coach parents to navigate through the behavioral health and other child-serving systems for effective management of their childs needs.
Prepare documentation needed for coordination of care and billing
Work flexible hours as required by job
Peer Parent Family Support Partner REQUIREMENTS:
Must be the parent or primary caregiver of a child who has received or is receiving behavioral health services and have experience with other
childrens service systems such as
Juvenile Justice, Division of Developmental Disabilities, Child Protective Services, Education System.
High school graduate or equivalent
Must be able to pass state fingerprint clearance
CPR/FA certified
Must have clean driving record, reliable transportation and proof of registration and insurance
Personality and demeanor to deal with the public and culturally sensitive to our families
Social services/human services work experience is a plus
Basic office and computer skills
Good sense of organization
Fluent in Spanish and English is a plus
Peer Parent Family Support Partner Pay:
$12.00 and higher with previous experience in this position
www.familyinvolvementcenter.org

81
Appendix K: Potential Partners and Resources for Maricopa County Community College District
Potential Partners for Maricopa County Community College District Allied Health
Organization Name Title
Abrazo Health | Arrowhead Hospital
Gareth Holdstock CHRO
Arizona Alliance for Community Health
Centers
Lourdes Paez Coordinator
Workforce Development
Arizona Healthcare Human Resources
Association
Wick Lewis President
Arizona Behavioral Health Corporation Ted Williams President and Chief Executive Officer
Arizona's Children Association Julie Peterson Human Resources Manager
Arizona Council of Human Service Providers
Emily Jenkins
Bahney Dedolph, Human
Resources Committee
Executive Director
Policy Analyst
Arizona Dental Association
Kevin Earle Executive Director
Arizona Department of Health Services,
Bureau of Health Systems Development
Patricia Tarango, MS Bureau Chief
Arizonans for Prevention Lauriane Bellot-Hanson
Vice President , Board of Directors and Community Youth Development
Program Coordinator
Southwest Behavioral Health Services
Arizona Public Health Association Tracy Lenartz President
Banner Health Network Laura Hadley
Deborah Dahl,
Deborah Martin
Health Careers Program Director- Talent Acquisition
Clinical Innovation
RN, Professional Development,
Senior Director
Barnet Dulaney Perkins Eye Centers
Tracy G. Farrington
Director of Clinics
Cardiovascular Consultants
Dr. Andrei Damien President
Cenpatico Jay Gray, PhD
Michele Flatbush,
Lee Martinez
Kristin Frounfelker,
Chief Operating Officer
Provider Performance and Network Development Administrator
Program Specialist
Medical Management Administrator
Chicanos Por La Causa Pilar Vargas, Psy.D., LISAC
Arjelia Gomez
Vice President - Integrated Health and Human Services
CEO
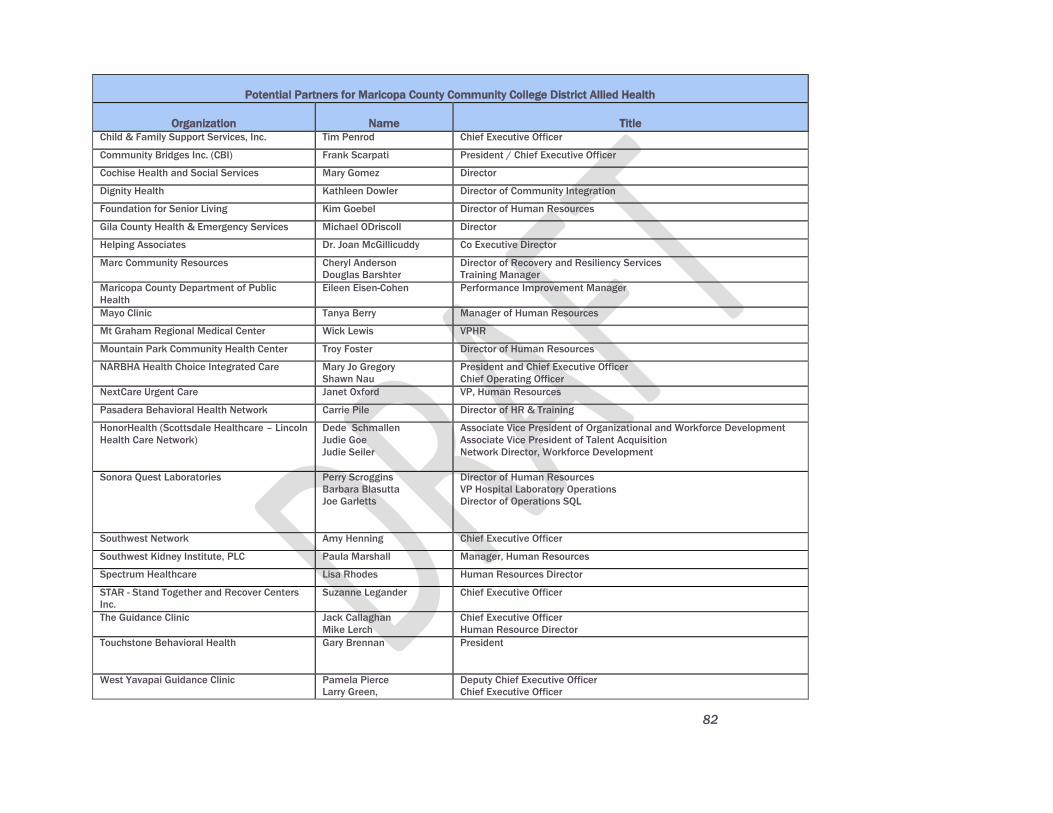
82
Potential Partners for Maricopa County Community College District Allied Health
Organization Name Title Child & Family Support Services, Inc. Tim Penrod Chief Executive Officer
Community Bridges Inc. (CBI) Frank Scarpati President / Chief Executive Officer
Cochise Health and Social Services Mary Gomez Director
Dignity Health Kathleen Dowler Director of Community Integration
Foundation for Senior Living Kim Goebel Director of Human Resources
Gila County Health & Emergency Services Michael ODriscoll Director
Helping Associates Dr. Joan McGillicuddy Co Executive Director County Health Department
Marc Community Resources Cheryl Anderson
Douglas Barshter
Director of Recovery and Resiliency Services
Training Manager
Maricopa County Department of Public
Health
Eileen Eisen-Cohen Performance Improvement Manager
Mayo Clinic Tanya Berry Manager of Human Resources
Mt Graham Regional Medical Center Wick Lewis VPHR
Mountain Park Community Health Center Troy Foster Director of Human Resources
NARBHA Health Choice Integrated Care Mary Jo Gregory
Shawn Nau
President and Chief Executive Officer
Chief Operating Officer
NextCare Urgent Care Janet Oxford VP, Human Resources
Pasadera Behavioral Health Network Carrie Pile Director of HR & Training
Continuing Care Retirement Community
HonorHealth (Scottsdale Healthcare – Lincoln
Health Care Network)
Dede Schmallen
Judie Goe
Judie Seiler
Associate Vice President of Organizational and Workforce Development
Associate Vice President of Talent Acquisition
Network Director, Workforce Development
Sonora Quest Laboratories Perry Scroggins
Barbara Blasutta
Joe Garletts
Director of Human Resources
VP Hospital Laboratory Operations
Director of Operations SQL
Southwest Network Amy Henning Chief Executive Officer
Southwest Kidney Institute, PLC Paula Marshall Manager, Human Resources
Spectrum Healthcare Lisa Rhodes Human Resources Director
STAR - Stand Together and Recover Centers
Inc.
Suzanne Legander Chief Executive Officer
The Guidance Clinic Jack Callaghan
Mike Lerch
Chief Executive Officer
Human Resource Director
Touchstone Behavioral Health Gary Brennan President
West Yavapai Guidance Clinic Pamela Pierce
Larry Green,
Deputy Chief Executive Officer
Chief Executive Officer

83
Potential Partners for Maricopa County Community College District Allied Health
Organization Name Title Westminster Village Anthony D. Wilber Human Resources Director
t