Embed Size (px)
Citation preview
World Health Report (2010)Background Paper, 20
The path to universal coverageHEALTH SYSTEMS FINANCING
Health services utilization and out-of-pocket expenditure at public and private facilities in low-income countriesPriyanka Saksena, Ke Xu, Riku Elovainio and Jean Perrot

© World Health Organization, 2010 All rights reserved. The designations employed and the presentation of the material in this publication do not imply the expression of any opinion whatsoever on the part of the World Health Organization concerning the legal status of any country, territory, city or area or of its authorities, or concerning the delimitation of its frontiers or boundaries. Dotted lines on maps represent approximate border lines for which there may not yet be full agreement. The mention of specific companies or of certain manufacturers' products does not imply that they are endorsed or recommended by the World Health Organization in preference to others of a similar nature that are not mentioned. Errors and omissions excepted, the names of proprietary products are distinguished by initial capital letters. All reasonable precautions have been taken by the World Health Organization to verify the information contained in this publication. However, the published material is being distributed without warranty of any kind, either expressed or implied. The responsibility for the interpretation and use of the material lies with the reader. In no event shall the World Health Organization be liable for damages arising from its use. The findings, interpretations and conclusions expressed in this paper are entirely those of the author and should not be attributed in any manner whatsoever to the World Health Organization.
Health services utilization and out-of-pocket expenditure at public and private facilities
in low-income countries World Health Report (2010) Background Paper, No 20
Priyanka Saksena1, Ke Xu1, Riku Elovainio1 and Jean Perrot1
1 World Health Organization, Geneva, Switzerland
2
Introduction The size and role of the private sector in health care provision varies. In nearly all countries, regardless of
economic development, private facilities including faith-based facilities, non-government non-profit
organizations and private for-profit facilities are involved in health services provision. And in many contexts,
their importance is growing. There are great differences among private facilities in terms of their objectives,
principles, operation styles, and location to name a few. They can range from an informal private provider
operating in a slum area of a large city, a high-end clinic providing sophisticated care for the elite in the rich
neighborhoods of the same city to a church-run non-profit health center in a rural village where public
services may not even exist.
The role of private health providers has sparked controversial debates in low-and middle income countries.
For some increasing private provision could lead to gains in efficiency, responsiveness, quality and
consumer choice (1;2). Indeed, the private sector has complemented or taken on health service delivery
functions with positive outcomes in some contexts (3;4). Others have argued that relying on public provision
for health care services is the best guarantee for equitable access and for better health outcomes for the whole
population (5;6) Globally the evidence on the relative advantages of the private sector in health service
provision is largely inconclusive (7-9). However, there is one common message from almost all previous
research - governments cannot afford to ignore non-state actors (10-12).
It is not possible to dichotomize clearly between public funding and service provision and private funding
and service provision. Public funding can be channeled through private facilities and vice versa. However,
irrespective of this, it is in practice impossible to ensure equitable access with limited overall public funding.
National Health Account (NHA) data shown in Figure 1 illustrates that general government expenditure on
health (GGHE) as a share of total health expenditure (THE) ranged from 10% to 97% in low and low-middle
income countries in 2007. Per capita GGHE ranges from a mere Int $ 1 to Int $ 529. In half of these
countries, public funding accounts for less than 50% of total national health expenditure, but there is
considerable variation. Publically funded facilities are often unable to provide a full range of services or
provide medicines for free at the point of service and user charges commonly exist despite the efforts of
many countries in abolishing them (13;14).Moreover, in order to get health care services people have to pay
indirect costs such as transportation costs, which are indifferent to the public-private divide.
3
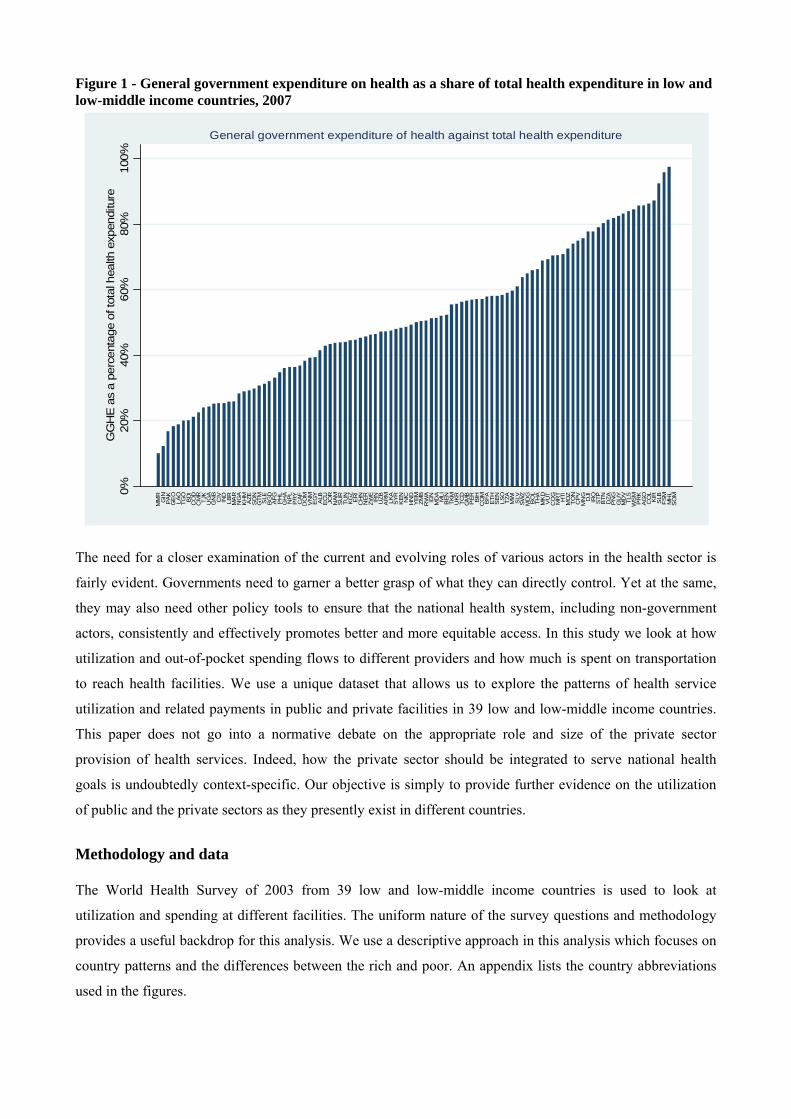
Figure 1 - General government expenditure on health as a share of total health expenditure in low and low-middle income countries, 2007
0%20
%40
%60
%80
%10
0%G
GH
E a
s a
perc
enta
ge o
f tot
al h
ealth
exp
endi
ture
MM
RG
INP
AKG
EO
LAO
TGO
BD
IC
OD
CM
RTJ
KU
GA
GN
BC
IVIN
DLB
RM
AR
NG
AK
HM
AZE
SD
NG
TM SLE
BG
DA
FG PH
LG
HA
NPL
PR
YC
AFD
OM
VN
ME
GY
ALB
EC
UJO
RN
AMS
UR
TUN
KG
ZE
RI
CH
NN
ERZW
EIR
NU
ZBA
RM
LKA
SYR
KEN NIC
HN
DY
EM ZMB
RW
AID
NM
DA
MLI
BEN
TKM
UKR
TCD
GM
BP
ER BIH
CO
MB
FAE
THS
EN LSO
TZA
MW
IS
LVS
WZ
MD
GB
OL
THA
MK
DV
UT
CO
GM
RT
HTI
MO
ZTO
NC
PVM
NG
DJI
IRQ
STP
BTN
DZA
PN
GG
UY
MD
VTL
SW
SM
PR
KA
GO
CO
LK
IRS
LBFS
MM
HL
SO
M
General government expenditure of health against total health expenditure
The need for a closer examination of the current and evolving roles of various actors in the health sector is
fairly evident. Governments need to garner a better grasp of what they can directly control. Yet at the same,
they may also need other policy tools to ensure that the national health system, including non-government
actors, consistently and effectively promotes better and more equitable access. In this study we look at how
utilization and out-of-pocket spending flows to different providers and how much is spent on transportation
to reach health facilities. We use a unique dataset that allows us to explore the patterns of health service
utilization and related payments in public and private facilities in 39 low and low-middle income countries.
This paper does not go into a normative debate on the appropriate role and size of the private sector
provision of health services. Indeed, how the private sector should be integrated to serve national health
goals is undoubtedly context-specific. Our objective is simply to provide further evidence on the utilization
of public and the private sectors as they presently exist in different countries.
Methodology and data The World Health Survey of 2003 from 39 low and low-middle income countries is used to look at
utilization and spending at different facilities. The uniform nature of the survey questions and methodology
provides a useful backdrop for this analysis. We use a descriptive approach in this analysis which focuses on
country patterns and the differences between the rich and poor. An appendix lists the country abbreviations
used in the figures.
4

Service utilization, out-of-pocket payment and transportation cost are from the individual section of the
survey. We included outpatient visits that were reported to have occurred in the 30 days preceding the survey
and inpatient stays within the one year preceding the survey. In order to yield meaningful cross-country
results, we aggregated all the different non-public providers under the single denomination of "private
providers". We classified providers listed in the survey as public and private (where the former were
providers operated by the government and later included privately operated, NGO and other facilities). OOP
was separated into consultation/doctors fees, medicines, tests and others costs.
Utilization rates, out-of-pocket payments (OOP) and per-visit charges are reported for outpatient
consultations and inpatient stays for different providers. We also analyze transportation costs in order to
better understand the factor of the distance and travel cost in choosing facilities.
Results Utilization Results from the surveys showed that for outpatient services, more than half of the utilization was at public
facilities in 27 out of 39 countries in the study (Figure 2). For some countries, over 80% of services were
provided at public facilities. For inpatient services, public facilities are even more dominant and their share
exceeded that of the private facilities in all countries except Pakistan and India. In Brazil, Nepal, the
Philippines and the Dominican Republic between 50% and 60% of hospitalizations were at public facilities.
These results can be validated with similar country-specific findings in previous literature (15-17).
In general we can observe a relationship between the dominance of public facilities in outpatient and
inpatient services. Countries with high utilization of public facilities for outpatient services show similar
patterns for inpatient services. However, in exceptions like Bangladesh, private facilities account for a
significant share of outpatient visits, but not inpatient stays.
5
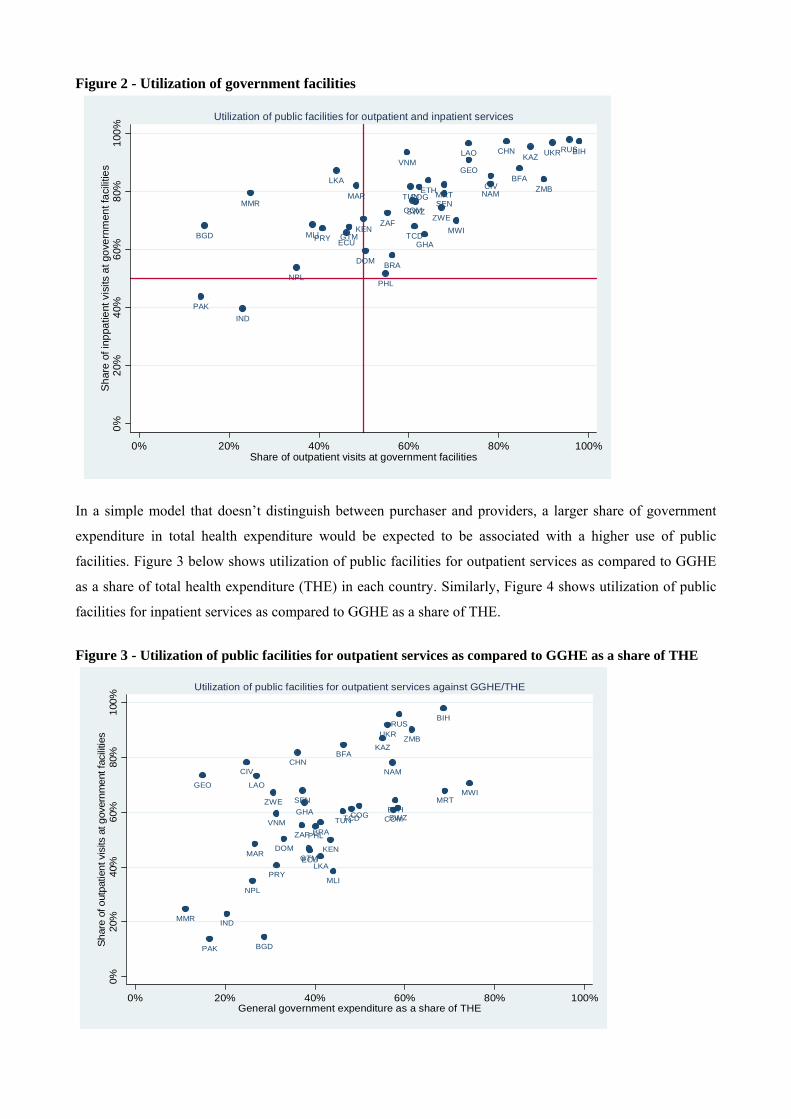
Figure 2 - Utilization of government facilities
BFA
BGD
BIH
BRA
CHN
CIVCOG
COM
DOM
ECU
ETH
GEO
GHAGTM
IND
KAZ
KEN
LAO
LKA
MAR
MLI
MMRMRT
MWI
NAM
NPL
PAK
PHL
PRY
RUS
SENSWZ
TCD
TUN
UKRVNM
ZAF
ZMB
ZWE
0%20
%40
%60
%80
%10
0%S
hare
of i
nppa
tient
vis
its a
t gov
ernm
ent f
acili
ties
0% 20% 40% 60% 80% 100%Share of outpatient visits at government facilities
Utilization of public facilities for outpatient and inpatient services
In a simple model that doesn’t distinguish between purchaser and providers, a larger share of government
expenditure in total health expenditure would be expected to be associated with a higher use of public
facilities. Figure 3 below shows utilization of public facilities for outpatient services as compared to GGHE
as a share of total health expenditure (THE) in each country. Similarly, Figure 4 shows utilization of public
facilities for inpatient services as compared to GGHE as a share of THE.
Figure 3 - Utilization of public facilities for outpatient services as compared to GGHE as a share of THE
BFA
BGD
BIH
BRA
CHNCIV
COG COM
DOMECU
ETH
GEO
GHA
GTM
IND
KAZ
KEN
LAO
LKAMAR
MLI
MMR
MRTMWI
NAM
NPL
PAK
PHL
PRY
RUS
SEN
SWZTCDTUN
UKR
VNMZAF
ZMB
ZWE
0%20
%40
%60
%80
%10
0%Sh
are
of o
utpa
tient
vis
its a
t gov
ernm
ent f
acili
ties
0% 20% 40% 60% 80% 100%General government expenditure as a share of THE
Utilization of public facilities for outpatient services against GGHE/THE
6
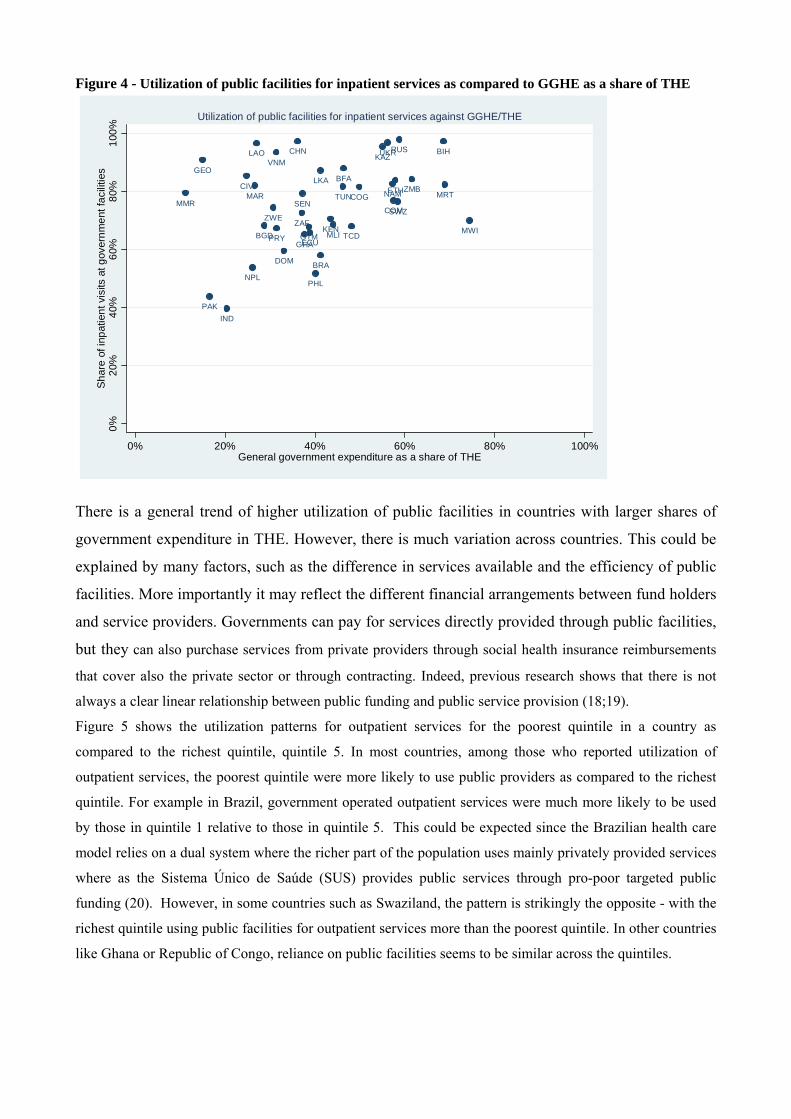
Figure 4 - Utilization of public facilities for inpatient services as compared to GGHE as a share of THE
BFA
BGD
BIH
BRA
CHN
CIVCOG
COM
DOM
ECU
ETH
GEO
GHAGTM
IND
KAZ
KEN
LAO
LKA
MAR
MLI
MMRMRT
MWI
NAM
NPL
PAK
PHL
PRY
RUS
SENSWZ
TCD
TUN
UKRVNM
ZAF
ZMB
ZWE
0%20
%40
%60
%80
%10
0%Sh
are
of in
patie
nt v
isits
at g
over
nmen
t fac
ilitie
s
0% 20% 40% 60% 80% 100%General government expenditure as a share of THE
Utilization of public facilities for inpatient services against GGHE/THE
There is a general trend of higher utilization of public facilities in countries with larger shares of
government expenditure in THE. However, there is much variation across countries. This could be
explained by many factors, such as the difference in services available and the efficiency of public
facilities. More importantly it may reflect the different financial arrangements between fund holders
and service providers. Governments can pay for services directly provided through public facilities,
but they can also purchase services from private providers through social health insurance reimbursements
that cover also the private sector or through contracting. Indeed, previous research shows that there is not
always a clear linear relationship between public funding and public service provision (18;19).
Figure 5 shows the utilization patterns for outpatient services for the poorest quintile in a country as
compared to the richest quintile, quintile 5. In most countries, among those who reported utilization of
outpatient services, the poorest quintile were more likely to use public providers as compared to the richest
quintile. For example in Brazil, government operated outpatient services were much more likely to be used
by those in quintile 1 relative to those in quintile 5. This could be expected since the Brazilian health care
model relies on a dual system where the richer part of the population uses mainly privately provided services
where as the Sistema Único de Saúde (SUS) provides public services through pro-poor targeted public
funding (20). However, in some countries such as Swaziland, the pattern is strikingly the opposite - with the
richest quintile using public facilities for outpatient services more than the poorest quintile. In other countries
like Ghana or Republic of Congo, reliance on public facilities seems to be similar across the quintiles.
7
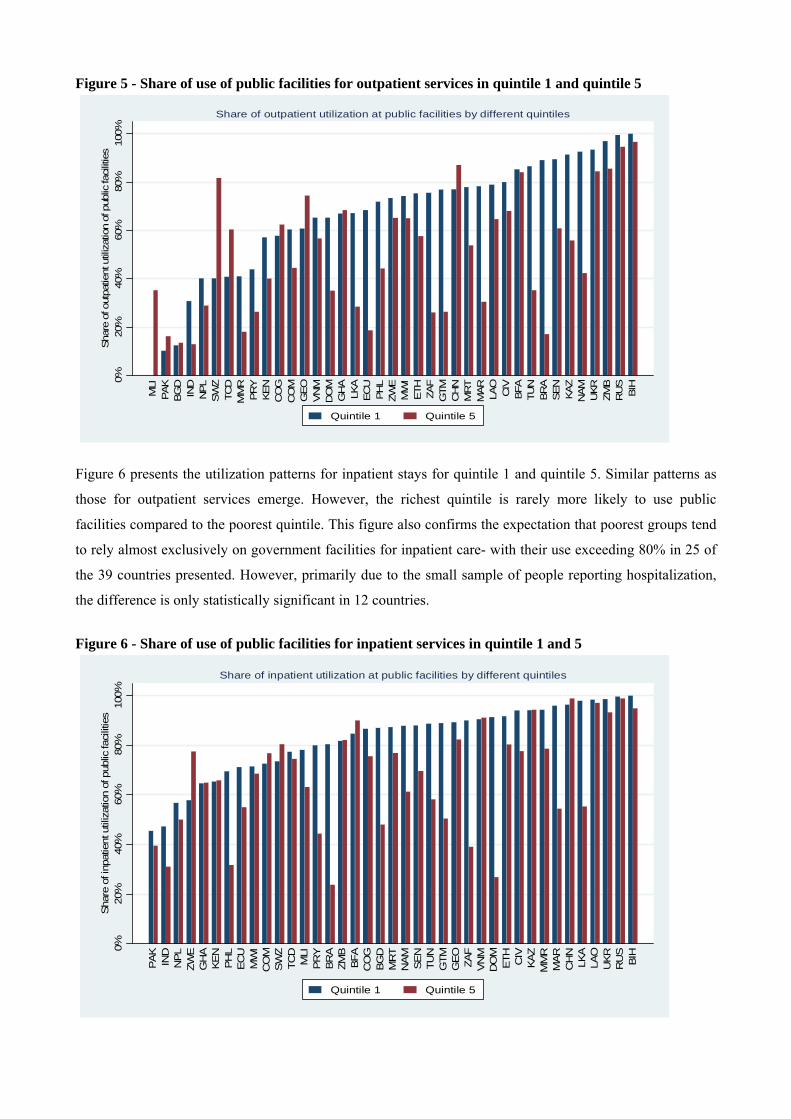
Figure 5 - Share of use of public facilities for outpatient services in quintile 1 and quintile 5
0%20
%40
%60
%80
%10
0%Sha
re o
f out
patie
nt u
tiliz
atio
n of
pub
lic fa
cilit
ies
MLI
PAK
BG
DIN
DN
PLSW
ZTC
DM
MR
PR
YKEN
CO
GC
OM
GEO
VN
MD
OM
GH
ALK
AEC
UPH
LZW
EM
WI
ETH ZA
FG
TMC
HN
MR
TM
AR LAO
CIV
BFA
TUN
BR
ASEN KAZ
NAM
UKR
ZMB
RU
SBIH
Share of outpatient utilization at public facilities by different quintiles
Quintile 1 Quintile 5
Figure 6 presents the utilization patterns for inpatient stays for quintile 1 and quintile 5. Similar patterns as
those for outpatient services emerge. However, the richest quintile is rarely more likely to use public
facilities compared to the poorest quintile. This figure also confirms the expectation that poorest groups tend
to rely almost exclusively on government facilities for inpatient care- with their use exceeding 80% in 25 of
the 39 countries presented. However, primarily due to the small sample of people reporting hospitalization,
the difference is only statistically significant in 12 countries.
Figure 6 - Share of use of public facilities for inpatient services in quintile 1 and 5
0%20
%40
%60
%80
%10
0%S
hare
of i
npat
ient
util
izat
ion
of p
ublic
faci
litie
s
PA
KIN
DN
PL
ZWE
GH
AK
EN
PH
LE
CU
MW
IC
OM
SW
ZTC
DM
LIP
RY
BR
AZM
BB
FAC
OG
BG
DM
RT
NA
MS
EN
TUN
GTM
GE
OZA
FV
NM
DO
ME
TH CIV
KA
ZM
MR
MA
RC
HN
LKA
LAO
UK
RR
US
BIH
Share of inpatient utilization at public facilities by different quintiles
Quintile 1 Quintile 5
8
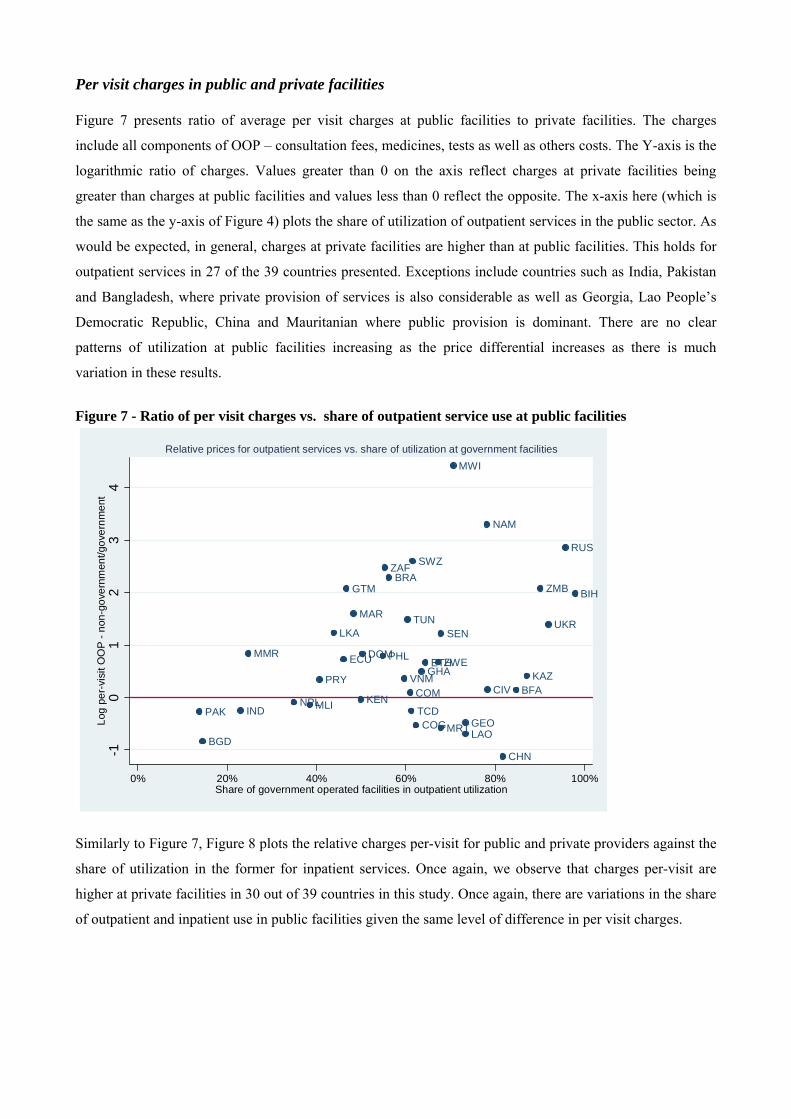
Per visit charges in public and private facilities Figure 7 presents ratio of average per visit charges at public facilities to private facilities. The charges
include all components of OOP – consultation fees, medicines, tests as well as others costs. The Y-axis is the
logarithmic ratio of charges. Values greater than 0 on the axis reflect charges at private facilities being
greater than charges at public facilities and values less than 0 reflect the opposite. The x-axis here (which is
the same as the y-axis of Figure 4) plots the share of utilization of outpatient services in the public sector. As
would be expected, in general, charges at private facilities are higher than at public facilities. This holds for
outpatient services in 27 of the 39 countries presented. Exceptions include countries such as India, Pakistan
and Bangladesh, where private provision of services is also considerable as well as Georgia, Lao People’s
Democratic Republic, China and Mauritanian where public provision is dominant. There are no clear
patterns of utilization at public facilities increasing as the price differential increases as there is much
variation in these results.
Figure 7 - Ratio of per visit charges vs. share of outpatient service use at public facilities
BFA
BGD
BIHBRA
CHN
CIV
COG
COM
DOMECU ETH
GEO
GHA
GTM
IND
KAZ
KEN
LAO
LKA
MAR
MLI
MMR
MRT
MWI
NAM
NPLPAK
PHL
PRY
RUS
SEN
SWZ
TCD
TUN UKR
VNM
ZAF
ZMB
ZWE
-10
12
34
Log
per-
visi
t OO
P -
non-
gove
rnm
ent/g
over
nmen
t
0% 20% 40% 60% 80% 100%Share of government operated facilities in outpatient utilization
Relative prices for outpatient services vs. share of utilization at government facilities
Similarly to Figure 7, Figure 8 plots the relative charges per-visit for public and private providers against the
share of utilization in the former for inpatient services. Once again, we observe that charges per-visit are
higher at private facilities in 30 out of 39 countries in this study. Once again, there are variations in the share
of outpatient and inpatient use in public facilities given the same level of difference in per visit charges.
9
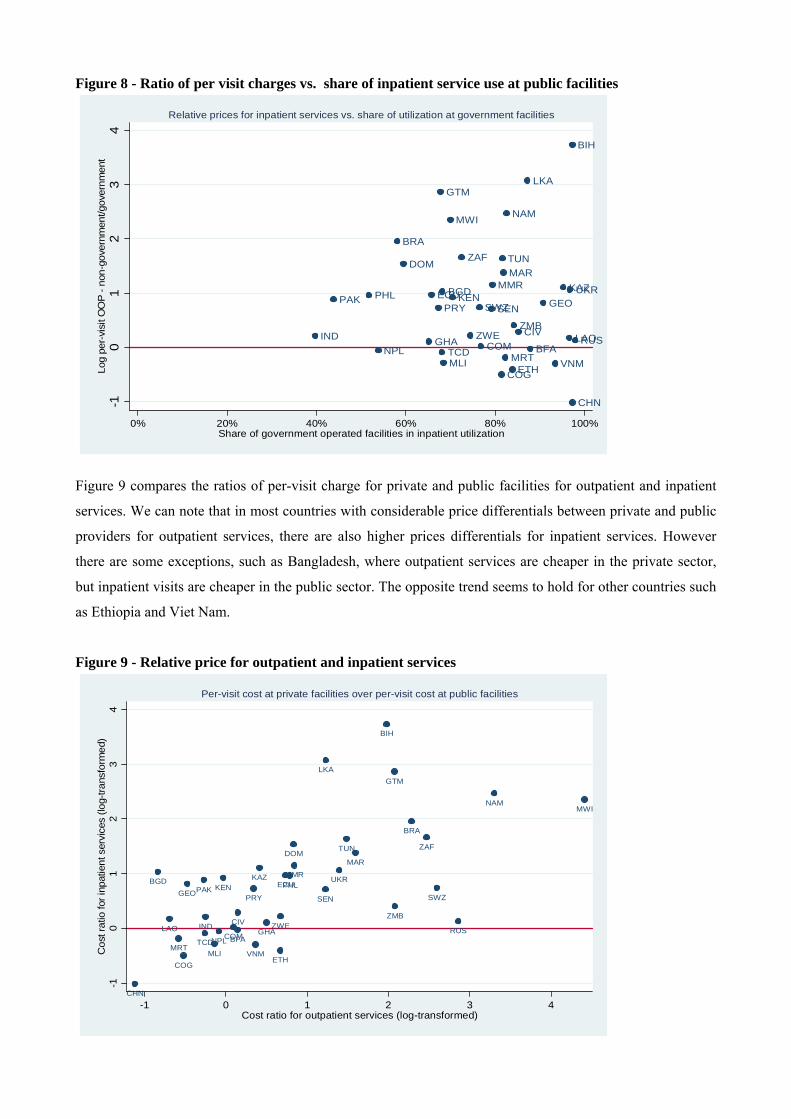
Figure 8 - Ratio of per visit charges vs. share of inpatient service use at public facilities
BFA
BGD
BIH
BRA
CHN
CIV
COG
COM
DOM
ECU
ETH
GEO
GHA
GTM
IND
KAZKEN
LAO
LKA
MAR
MLI
MMR
MRT
MWI NAM
NPL
PAK PHLPRY
RUS
SENSWZ
TCD
TUN
UKR
VNM
ZAF
ZMBZWE
-10
12
34
Log
per-
visi
t OO
P - n
on-g
over
nmen
t/gov
ernm
ent
0% 20% 40% 60% 80% 100%Share of government operated facilities in inpatient utilization
Relative prices for inpatient services vs. share of utilization at government facilities
Figure 9 compares the ratios of per-visit charge for private and public facilities for outpatient and inpatient
services. We can note that in most countries with considerable price differentials between private and public
providers for outpatient services, there are also higher prices differentials for inpatient services. However
there are some exceptions, such as Bangladesh, where outpatient services are cheaper in the private sector,
but inpatient visits are cheaper in the public sector. The opposite trend seems to hold for other countries such
as Ethiopia and Viet Nam.
Figure 9 - Relative price for outpatient and inpatient services
BFA
BGD
BIH
BRA
CHN
CIV
COG
COM
DOM
ECU
ETH
GEO
GHA
GTM
IND
KAZKEN
LAO
LKA
MAR
MLI
MMR
MRT
MWINAM
NPL
PAK PHL
PRY
RUS
SEN SWZ
TCD
TUN
UKR
VNM
ZAF
ZMBZWE
-10
12
34
Cos
t rat
io fo
r inp
atie
nt s
ervi
ces
(log-
trans
form
ed)
-1 0 1 2 3 4Cost ratio for outpatient services (log-transformed)
Per-visit cost at private facilities over per-visit cost at public facilities
10
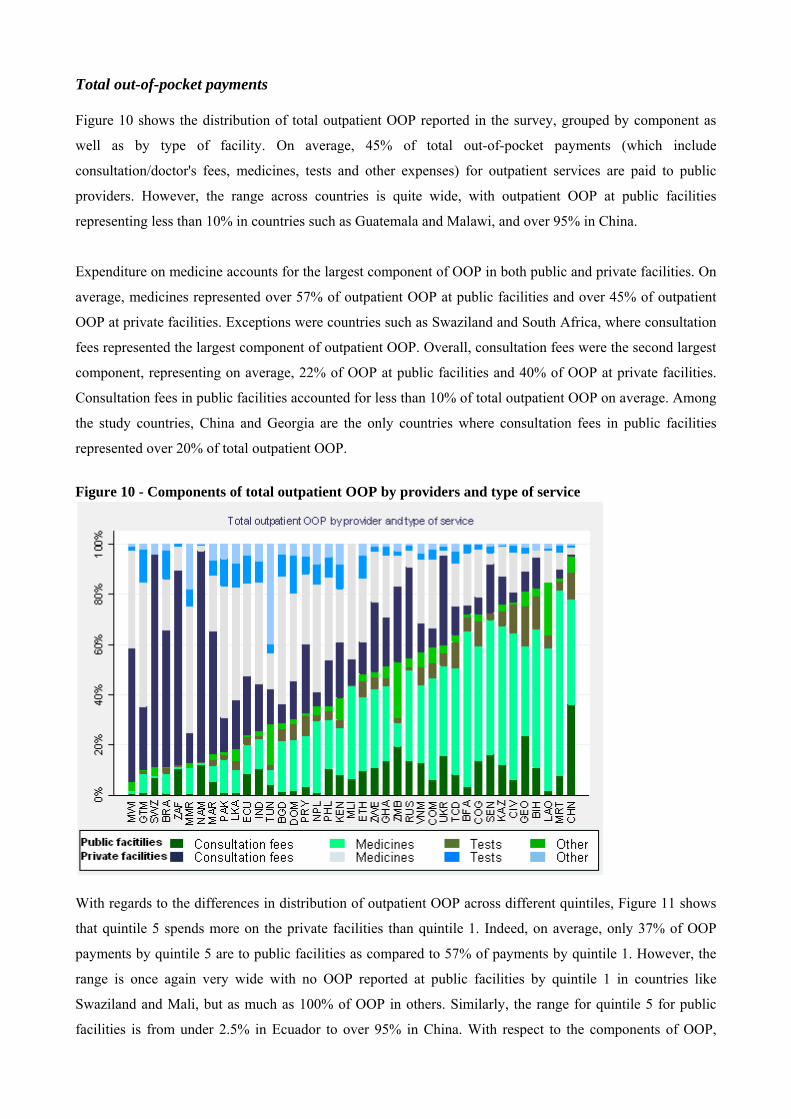
Total out-of-pocket payments Figure 10 shows the distribution of total outpatient OOP reported in the survey, grouped by component as
well as by type of facility. On average, 45% of total out-of-pocket payments (which include
consultation/doctor's fees, medicines, tests and other expenses) for outpatient services are paid to public
providers. However, the range across countries is quite wide, with outpatient OOP at public facilities
representing less than 10% in countries such as Guatemala and Malawi, and over 95% in China.
Expenditure on medicine accounts for the largest component of OOP in both public and private facilities. On
average, medicines represented over 57% of outpatient OOP at public facilities and over 45% of outpatient
OOP at private facilities. Exceptions were countries such as Swaziland and South Africa, where consultation
fees represented the largest component of outpatient OOP. Overall, consultation fees were the second largest
component, representing on average, 22% of OOP at public facilities and 40% of OOP at private facilities.
Consultation fees in public facilities accounted for less than 10% of total outpatient OOP on average. Among
the study countries, China and Georgia are the only countries where consultation fees in public facilities
represented over 20% of total outpatient OOP.
Figure 10 - Components of total outpatient OOP by providers and type of service
With regards to the differences in distribution of outpatient OOP across different quintiles, Figure 11 shows
that quintile 5 spends more on the private facilities than quintile 1. Indeed, on average, only 37% of OOP
payments by quintile 5 are to public facilities as compared to 57% of payments by quintile 1. However, the
range is once again very wide with no OOP reported at public facilities by quintile 1 in countries like
Swaziland and Mali, but as much as 100% of OOP in others. Similarly, the range for quintile 5 for public
facilities is from under 2.5% in Ecuador to over 95% in China. With respect to the components of OOP,
11
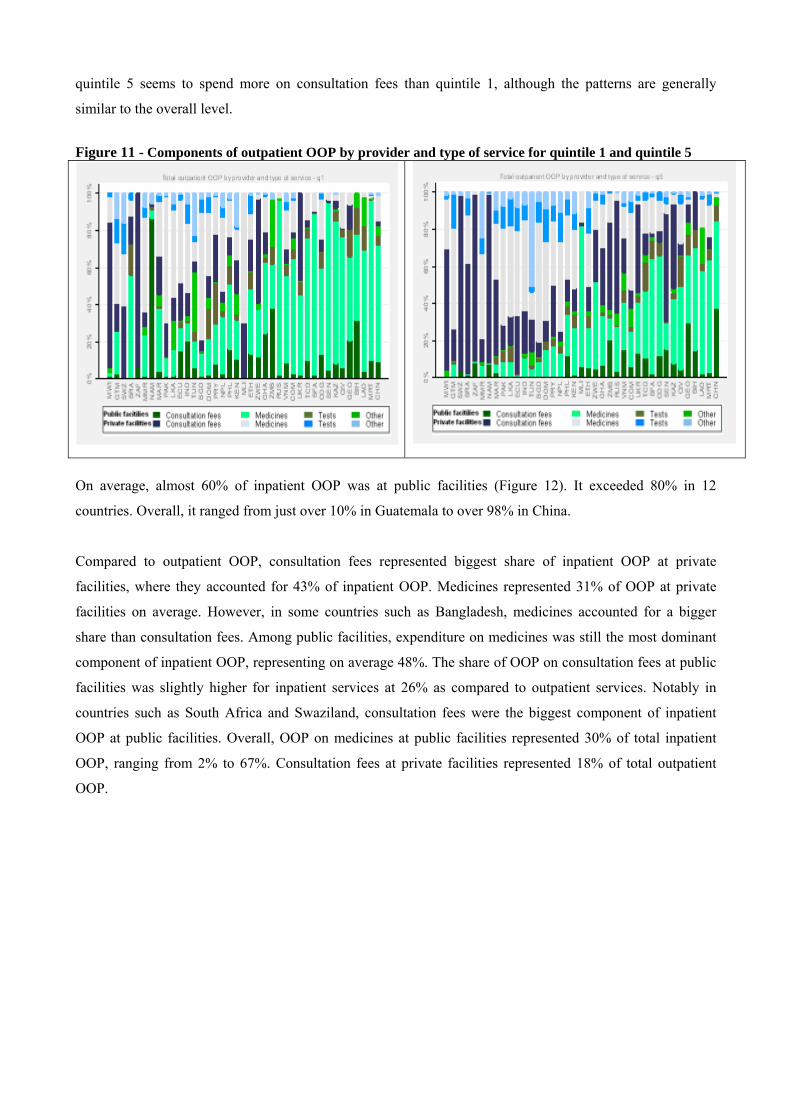
quintile 5 seems to spend more on consultation fees than quintile 1, although the patterns are generally
similar to the overall level.
Figure 11 - Components of outpatient OOP by provider and type of service for quintile 1 and quintile 5
On average, almost 60% of inpatient OOP was at public facilities (Figure 12). It exceeded 80% in 12
countries. Overall, it ranged from just over 10% in Guatemala to over 98% in China.
Compared to outpatient OOP, consultation fees represented biggest share of inpatient OOP at private
facilities, where they accounted for 43% of inpatient OOP. Medicines represented 31% of OOP at private
facilities on average. However, in some countries such as Bangladesh, medicines accounted for a bigger
share than consultation fees. Among public facilities, expenditure on medicines was still the most dominant
component of inpatient OOP, representing on average 48%. The share of OOP on consultation fees at public
facilities was slightly higher for inpatient services at 26% as compared to outpatient services. Notably in
countries such as South Africa and Swaziland, consultation fees were the biggest component of inpatient
OOP at public facilities. Overall, OOP on medicines at public facilities represented 30% of total inpatient
OOP, ranging from 2% to 67%. Consultation fees at private facilities represented 18% of total outpatient
OOP.
12
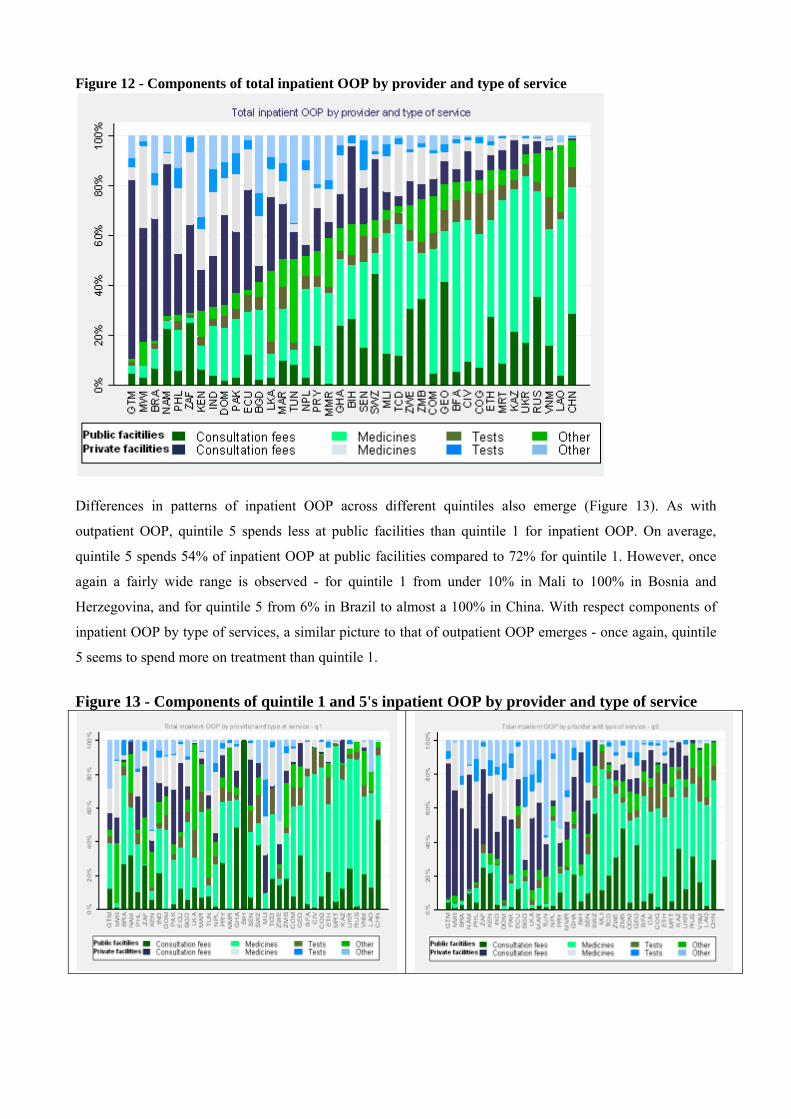
Figure 12 - Components of total inpatient OOP by provider and type of service
Differences in patterns of inpatient OOP across different quintiles also emerge (Figure 13). As with
outpatient OOP, quintile 5 spends less at public facilities than quintile 1 for inpatient OOP. On average,
quintile 5 spends 54% of inpatient OOP at public facilities compared to 72% for quintile 1. However, once
again a fairly wide range is observed - for quintile 1 from under 10% in Mali to 100% in Bosnia and
Herzegovina, and for quintile 5 from 6% in Brazil to almost a 100% in China. With respect components of
inpatient OOP by type of services, a similar picture to that of outpatient OOP emerges - once again, quintile
5 seems to spend more on treatment than quintile 1.
Figure 13 - Components of quintile 1 and 5's inpatient OOP by provider and type of service
13
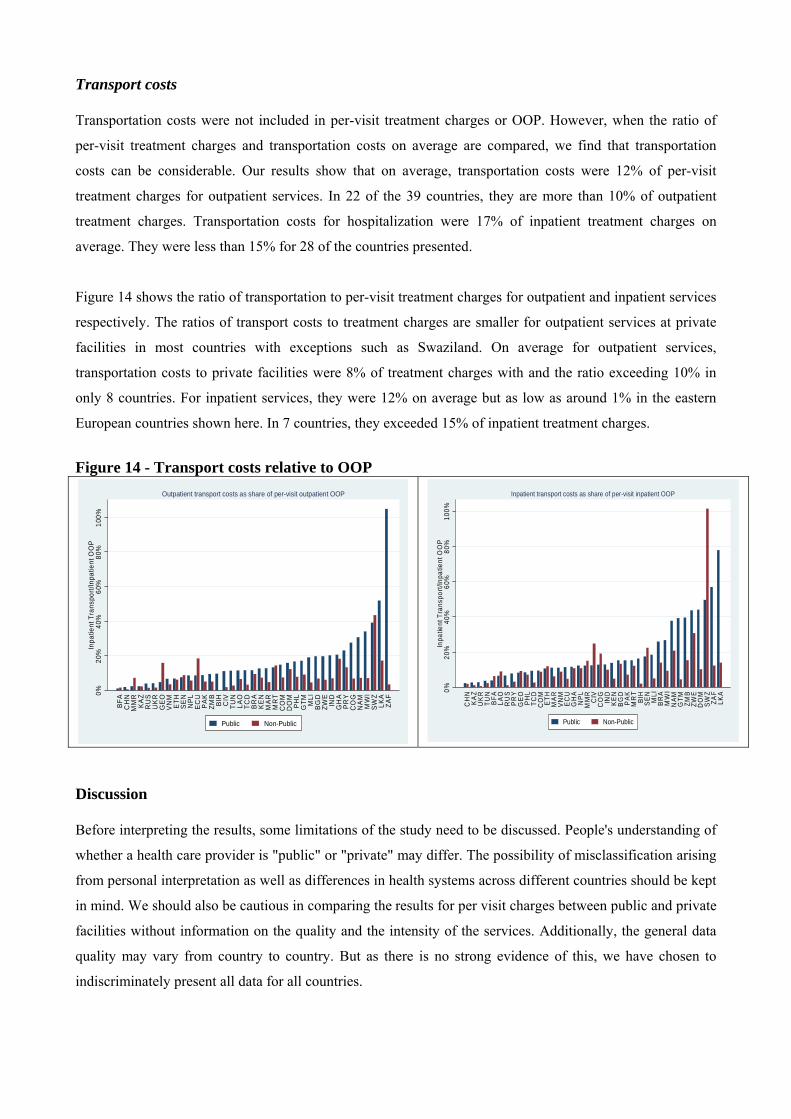
Transport costs Transportation costs were not included in per-visit treatment charges or OOP. However, when the ratio of
per-visit treatment charges and transportation costs on average are compared, we find that transportation
costs can be considerable. Our results show that on average, transportation costs were 12% of per-visit
treatment charges for outpatient services. In 22 of the 39 countries, they are more than 10% of outpatient
treatment charges. Transportation costs for hospitalization were 17% of inpatient treatment charges on
average. They were less than 15% for 28 of the countries presented.
Figure 14 shows the ratio of transportation to per-visit treatment charges for outpatient and inpatient services
respectively. The ratios of transport costs to treatment charges are smaller for outpatient services at private
facilities in most countries with exceptions such as Swaziland. On average for outpatient services,
transportation costs to private facilities were 8% of treatment charges with and the ratio exceeding 10% in
only 8 countries. For inpatient services, they were 12% on average but as low as around 1% in the eastern
European countries shown here. In 7 countries, they exceeded 15% of inpatient treatment charges.
Figure 14 - Transport costs relative to OOP
0%20
%40
%60
%80
%10
0%In
patie
nt T
rans
port/
Inpa
tient
OO
P
BFA
CH
NM
MR
KAZ
RU
SU
KR
GE
OV
NM
ETH
SE
NN
PLE
CU
PAK
ZMB
BIH
CIV
TUN
LAO
TCD
BR
AK
EN
MA
RM
RT
CO
MD
OM
PHL
GTM M
LIB
GD
ZWE
IND
GH
AP
RY
CO
GN
AM
MW
ISW
ZLK
AZA
F
Outpatient transport costs as share of per-visit outpatient OOP
Public Non-Public
0%20
%40
%60
%80
%10
0%In
patie
nt T
rans
port/
Inpa
tient
OO
P
CH
NKA
ZU
KR
TUN
BFA
LAO
RU
SP
RY
GEO PH
LTC
DC
OM
ETH
MA
RVN
MEC
UG
HA
NPL
MM
RC
IVC
OG
IND
KEN
BG
DPA
KM
RT
BIH
SEN M
LIB
RA
MW
IN
AMG
TMZM
BZW
ED
OM
SWZ
ZAF
LKA
Inpatient transport costs as share of per-visit inpatient OOP
Public Non-Public
Discussion Before interpreting the results, some limitations of the study need to be discussed. People's understanding of
whether a health care provider is "public" or "private" may differ. The possibility of misclassification arising
from personal interpretation as well as differences in health systems across different countries should be kept
in mind. We should also be cautious in comparing the results for per visit charges between public and private
facilities without information on the quality and the intensity of the services. Additionally, the general data
quality may vary from country to country. But as there is no strong evidence of this, we have chosen to
indiscriminately present all data for all countries.
14
A few findings are worth highlighting here. Firstly, the study found that individuals in the richest quintile are
more likely to use private facilities as compared to lowest income group. However, the use of private sector
is not limited to the elite. Even for among poorest quintile, private facilities are used for more than 20% of
total outpatient visits in the majority of countries. This result is in line with previous studies that have also
noted a considerable use of private health services among the poor (21-23).
Secondly, we find that price competition may not be the main criteria for patients in many countries. Indeed,
in many countries even when the price at private facilities is well above that of public facilities, use of public
sector providers is comparatively low. Others factors such as perceived quality, responsiveness and
geographical access may play an important role in determining what kind of facility is used. Indeed, our
study also found that in most countries included in this study, transport costs represented more than 10% of
what the individuals were paying for treatment.
The study also found that consultation fees in public facilities do not necessarily represent the largest
component of OOP. Consultation fees for inpatient and outpatient visits in public facilities account for, on
average, only 10% of total OOP. In most countries, the level is well below 15%. Importantly, the major part
of OOP at public facilities are for the purchase of medicines.
These findings suggest that blanket policies of abolishing user fees, which in most cases only include
consultation fees in public facilities, do not solve the whole problem. As this study shows, this may ignore
the majority of payments such as spending on medicines as well as spending at private facilities, which are
likely to pose immense challenges for equitable access. In practice governments will need to find funding
mechanisms other than direct payments for improving access to services and medicines. Countries should
also consider lowering transportation costs through long-term strategies, such as increasing the number of
facilities and allocating resources based on population need, as well as other policies such as vouchers or
other reimbursement schemes to cover transportation costs (24;25).
More importantly perhaps national health financing systems need to engage with the private sector in a way
that enables greater and better access for the population. Governments, as health sector stewards, should
ensure quality standards are met and routinely gather information from both public and private facilities. In
addition governments may need to implement regulatory measures or establish contractual agreements with
the private sector as part of national service provision strategies. There are many pioneering programs
engaging with the private sector in various settings (26-29). Building on existing experience and the lessons
learnt, policymakers in every country could take steps to better engage with the private sector to achieve
national goals.
Last but not the least, we must bear in mind that the "private" or "non-government" sector is very
heterogeneous. And country-context is key. For example, private facilities may provide drastically different
15

quality of care in different settings and for different people (30;31). Indeed, our study also found much
variation, both in utilization and in the cost of services. As such, countries should not adopt dogmatic views
on the role of the private sector in health care. This is a complex reality, and policies should reflect rather
than ignore context-specific subtleties.
16
References 1. Preker AS, Harding A, Travis P. "Make or buy" decisions in the production of health care goods and
services: new insights from institutional economics and organizational theory. Bull World Health Organ 2000;78(6):779-90.
2. Bhattacharyya O, Khor S, McGahan A, Dunne D, Daar A, Singer P. Innovative health service delivery models in low and middle income countries - what can we learn from the private sector? Health Research Policy and Systems 2010;8(1):24.
3. Loevinsohn B, Harding A. Buying results? Contracting for health service delivery in developing countries. The Lancet 2005;366(9486):676-81.
4. Liu X, Hotchkiss DR, Bose S. The effectiveness of contracting-out primary health care services in developing countries: a review of the evidence. Health Policy and Planning 2008;23(1):1-13.
5. Oxfam, International. Blind Optimism Challenging the Myths About Private Health Care in Poor
6. Rannan-Eliya, R and Sikurajapathy, L. Sri Lanka: "Good Practice" in Expanding Health Care Coverage. Research Studies Series 3. 2009. Institute for Health Policy, The World Bank.
7. Hollingsworth B. The measurement of efficiency and productivity of health care delivery. Health Economics 2008;17(10):1107-28.
8. Mills A. Improving the efficiency of public sector health services in developing countries: bureaucratic versus market approaches. In: Colclough C, editor. Marketizing education and health in developing countries: miracle or mirage? Oxford University Press; 1997.
9. Patouillard E, Goodman C, Hanson K, Mills A. Can working with the private for-profit sector improve utilization of quality health services by the poor? A systematic review of the literature. International Journal for Equity in Health 2007;6(1):17.
10. Bustreo F, Harding A, Axelsson H. Can developing countries achieve adequate improvements in child health outcomes without engaging the private sector? Bull World Health Organ 2003;81(12):886-95.
11. Hanson K, Gilson L, Goodman C, Mills A, Smith R, Feachem R et al. Is Private Health Care the Answer to the Health Problems of the World's Poor? PLoS Med 2008;5(11):e233.
12. Preker AS. Public ends, private means: strategic purchasing of health services. World Bank Publications; 2007.
13. Meessen, B., Hercot, D., Noirhomme, M., Ridde, V., Tibouti, A., Bicaba, A., Tashobya, C. K., and Gilson, L. Removing user fees in the health sector in low-income countries: a multi-country review. 2009. United Nations Children's Fund (UNICEF).
14. Yates R. Universal health care and the removal of user fees. Lancet 2009;373(9680):2078-81.
15. Dilip TR. Utilization of inpatient care from private hospitals: trends emerging from Kerala, India. Health Policy and Planning 2010;25(5):437-46.
16. Sengupta A, Nundy S. The private health sector in India. BMJ 2005;331(7526):1157-8.
17. Barnes J, O'Hanlon B, Feeley F, Mckeon K, Gitonga N. Private Health Sector Assessment in Kenya. World Bank Publications; 2010.
17
18. Hanson K, Berman P. Private Health Care Provision in Developing Countries: A Preliminary Analysis of Levels and Composition. Health Policy and Planning 1998;13(3):195-211.
19. Gauri V, Cercone J, BriceГ±o R. Separating financing from provision: evidence from 10 years of partnership with health cooperatives in Costa Rica. Health Policy and Planning 2004;19(5):292-301.
20. Elias PE, Cohn A. Health Reform in Brazil: Lessons to Consider. Am J Public Health 2003;93(1):44-8.
21. Harding, April. Partnerships with the Private Sector in Health: What the International Community Can Do to Strengthen Health Systems in Developing Countries. 2009. Center for Global Development.
22. Prata N, Montagu D, Jefferys E. Private sector, human resources and health franchising in Africa. Bull World Health Organ 2005;83(4):274-9.
23. Bhatia JC, Cleland J. Health-care seeking and expenditure by young Indian mothers in the public and private sectors. Health Policy and Planning 2001;16(1):55-61.
24. Noirhomme M, Meessen B, Griffiths F, Ir P, Jacobs B, Thor R et al. Improving access to hospital care for the poor: comparative analysis of four health equity funds in Cambodia. Health Policy and Planning 2007;22(4):246-62.
25. National Health Service England. Healthcare Travel Costs Scheme. http://www.nhs.uk/nhsengland/Healthcosts/pages/Travelcosts.aspx . 7-24-2010.
26. Mahmud H, Ullah Khan A, Ahmed S. Mid-term health facility survey - urban primary health care project. Dhaka: Mitra and Associates 2002.
27. Balique H, Ouattara O, Ag Iknane A. Dix ans d'expérience des centres de santé communautaire au Mali. Santé Publique 2001;13(1):35.
28. Danel I, La Forgia G. Contracting for Basic Health Care in Rural Guatemala - Comparison of the Performance of Three Delviery Models. Health Systems Innovations in Central America: Lessons and Impact of New Approaches.Edited by Gerard LaForgia.World Bank, Washington DC.ISBN-10: 0-8213-6278-X 2005.
29. Mavalankar D, Singh A, Patel SR, Desai A, Singh PV. Saving mothers and newborns through an innovative partnership with private sector obstetricians: Chiranjeevi scheme of Gujarat, India. International Journal of Gynecology & Obstetrics 2009;107(3):271-6.
30. Harding A, Preker AS. Private participation in health services. World Bank Publications; 2003.
31. World Health Organization. World health report. Primary health care: now more than ever. 2008. Geneva, Switzerland.
18
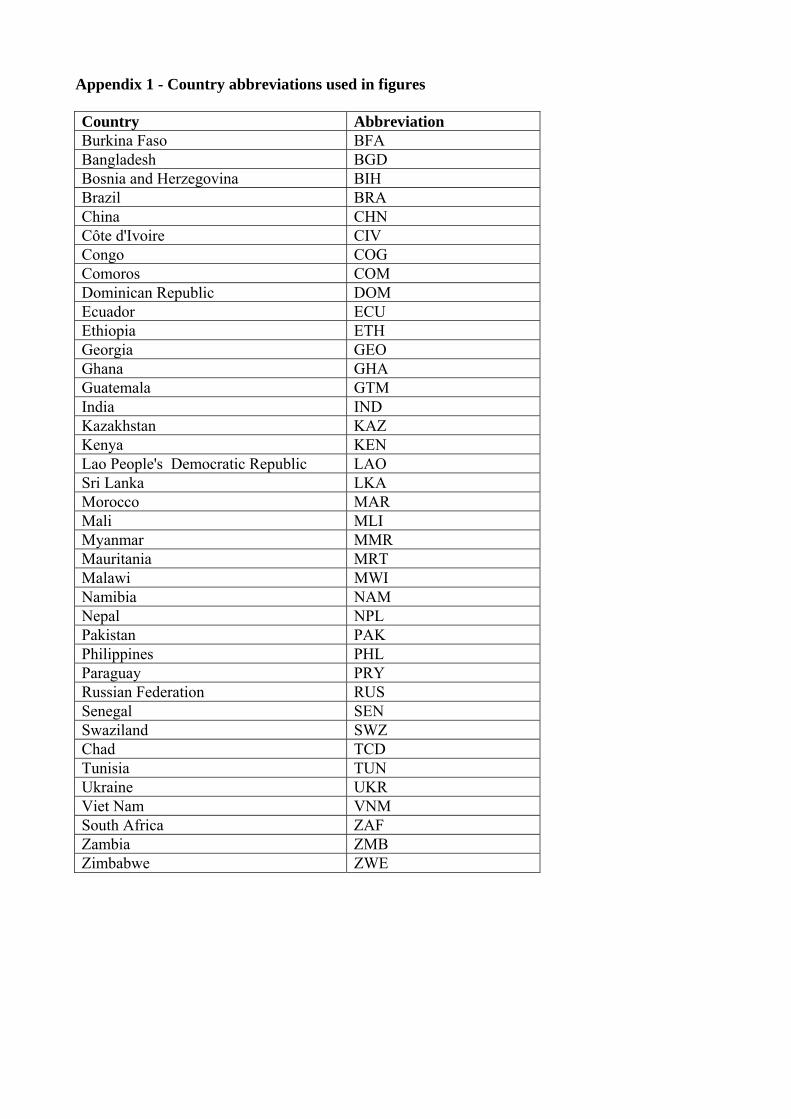
Appendix 1 - Country abbreviations used in figures Country Abbreviation Burkina Faso BFA Bangladesh BGD Bosnia and Herzegovina BIH Brazil BRA China CHN Côte d'Ivoire CIV Congo COG Comoros COM Dominican Republic DOM Ecuador ECU Ethiopia ETH Georgia GEO Ghana GHA Guatemala GTM India IND Kazakhstan KAZ Kenya KEN Lao People's Democratic Republic LAO Sri Lanka LKA Morocco MAR Mali MLI Myanmar MMR Mauritania MRT Malawi MWI Namibia NAM Nepal NPL Pakistan PAK Philippines PHL Paraguay PRY Russian Federation RUS Senegal SEN Swaziland SWZ Chad TCD Tunisia TUN Ukraine UKR Viet Nam VNM South Africa ZAF Zambia ZMB Zimbabwe ZWE
19