Embed Size (px)
Citation preview


IV
Copyright ©2016
NASSCOM 4E-Vandana Building (4th Floor) 11, Tolstoy Marg, Connaught Place New Delhi 110 001, India T +91 11 4151 9230; F +91 11 4151 9240 E [email protected] W www.nasscom.in
Published by NASSCOM, New Delhi
Disclaimer
The Report includes projections, forecasts and other predictive statements which are based on assumptions and expectations in the light of currently available information. These projections and forecasts are based on industry trends, circumstances and factors which involve risks, variables and uncertainties. NASSCOM disclaims all warranties as to the accuracy, completeness or adequacy of such information. NASSCOM and/or its Affiliates and its officers, directors and employees including the analysts/authors/advisors shall not be in any way responsible for any direct, indirect, special or consequential damages that may arise to any person from any inadvertent error in the information or judgement or opinion contained in the report nor do they take guarantee or assume liability for any omissions of the information contained therein. The projections and forecasts described in this report should be evaluated keeping in mind the fact that these are not scientifically proven to guarantee certain intended results and are not published as a warranty and do not carry any evidentiary value. Opinions expressed therein are current opinion as of the date appearing on the report only. Data may be subject to update and correction without notice.
Every effort has been made to trace the owners of the copyright material included in this Report. The material in this publication is copyrighted. Reproduction or dissemination, directly or indirectly, either on paper or on electronic media, of the research data and report in any form is prohibited except with the written permission of NASSCOM. The user should consult their own advisors before making use of any information or data contained in the report.
The publishers would be grateful for any omissions brought to their notice for acknowledgement in future editions of the book.
Analysis of Talent Demand and Supply V
ForewordThe Indian IT-BPM story has demonstrated disruptive potential across the globe over the last three decades. It is India’s largest and most diverse private sector employer, estimated to account for revenues of approximately USD 160 billion in FY2016, with a direct workforce nearing 3.7 million and effecting over 10 million indirect jobs.
Today, yet again, it is set to play an integral role in ushering in a new paradigm. NASSCOM’s ‘Perspective 2025’ Report focuses on to a new force: the changing role of digital technology. The needle has shifted towards automation, e-commerce, start-up ecosystem building, which combined with the impact of policy mandates such as Digital India, Smart Cities and Skill India sets the national agenda on a trajectory to realize the vast potential of digital technologies.
At this juncture, it is crucial that the national program incorporates a commitment to sustainably developing a skilled and job-ready workforce at par with global standards. IT-ITeS Sector Skills Council NASSCOM (SSC NASSCOM) has been entrusted with the responsibility to identify and facilitate the building of required capacity. A key function of the SSC NASSCOM is therefore to focus on bridging the employability gaps within the industry.
This report is an analysis of the talent demand and supply in IT-BPM industry, and an exploration of the forces that currently shape the ecosystem. The research effort comprises quantitative and qualitative analyses of aggregate economic data and trends, and also lays down expectations for the next three to five year period. Effectively, the report is designed to engage all stakeholders in the endeavour to establish and nurture a standards-based employment ecosystem.
We remain deeply committed to the mission of growth in the industry, and hope this report will prove to be a meaningful addition to your own efforts.
R ChandrashekarPresident, NASSCOM

VI
Analysis of Talent Demand and Supply VII
AcknowledgementsWe are grateful to Dr. BVR Mohan Reddy, Chairman, IT-ITeS Sector Skills Council NASSCOM, and Founder & Executive Chairman, Cyient Ltd., and Mr. R Chandrashekhar, President, NASSCOM for their strategic leadership and support towards this key report.
Special gratitude to the concerned officials and leadership at the Ministry of Skill Development and Entrepreneurship (MSDE), the Ministry of Communications and Information Technology (MCIT), the Ministry of Labour and Employment (MoLE), the Prime Minister's Office (PMO), and the National Skills Development Corporation (NSDC), each having supported this endeavour by providing relevant information and insights that have enhanced the report.
Our heartfelt thanks to NASSCOM members and the educational institutes for their contribution towards quantitative and qualitative perspectives, both of which have been critical to this effort.
We extend our thanks to the members of the Project Board, Mr. Anil Menon at CMS, Mr. Arjun Raghunathan at HCL Technologies, Mr. Sameer Kohli at CSC, Mr. Srikantan Moorthy at Infosys, and Mr. Vidyut Navelkar at TCS.
We are also grateful for the complementary support and insights provided by the NASSCOM Research team, including Sangeeta Gupta, Achyuta Ghosh, Diksha Nerurkar and Nirmala Balakrishnan.
We thank the Deloitte Project team consisting of Mr. Anindya Mallick, Mr. Mohammed Shariff, Mr. Arvind B., Mr. S Badrinarayanan and Ms. Neha Yadav for conducting the research and putting this report together.

VIII
Analysis of Talent Demand and Supply IX
ContentsForeword III
Acknowledgements V
Executive Summary 1
Approach and Methodology 5
Analysis of the IT-BPM industry 8 Trends in Global IT sector spends 8 India’s rising share of global IT-BPM spend 9 Overview of Indian IT industry 10 Performance within the IT-BPM industry 11 Key forces of disruption 12 Investment Scenario in the IT Industry 18 Shifting focus of delivery locations 19 Key Takeaways 20
Analysis of Demand for Talent 21 Overview of Indian IT Industry 21 Indian IT Industry Revenue projections - 2015 to 2019 21 Industry employment projections - 2015 to 2019 22 Employment and Hiring by IT Sub-sector 23 Employment and Hiring in IT-BPM by region 23 The skilling imperative to the disruptions expected 24 High Demand Occupations and New age Skills 25 Key Takeaways 27
Analysis of Supply of Talent 28 Overview of the National Talent Supply 28 Overview of Total Supply to the IT-BPM Industry 32 Supply by State and Region 33 Supply by Stream 34 Employability of Talent Supply 34 Overview of skilling ecosystem 35 Role of SSC NASSCOM in the Skilling Ecosystem 36 Certification Landscape 36 Academic Perspective of Skilling Ecosystem 37 Role of Industry in Skill Development through CSR funds 37 Key Takeaways 38
Analysis of Skill Gaps 39 Quantitative Skill Gaps 39 Incremental Employment Demand- Supply Analysis by State and Region 40
The Way Forward 43
ANNEXURES 47 Annexure I: Supply Side Breakup by Streams for Key States 48 Annexure II: List of Figures 56 Annexure III: List of Tables 58 Annexure IV: Bibliography 59

Analysis of Talent Demand and Supply 1
143
190-200
FY2016 FY2019F
Industry Revenue (USD Bn)
3.7
4.2-4.3
Employment (in Mn)
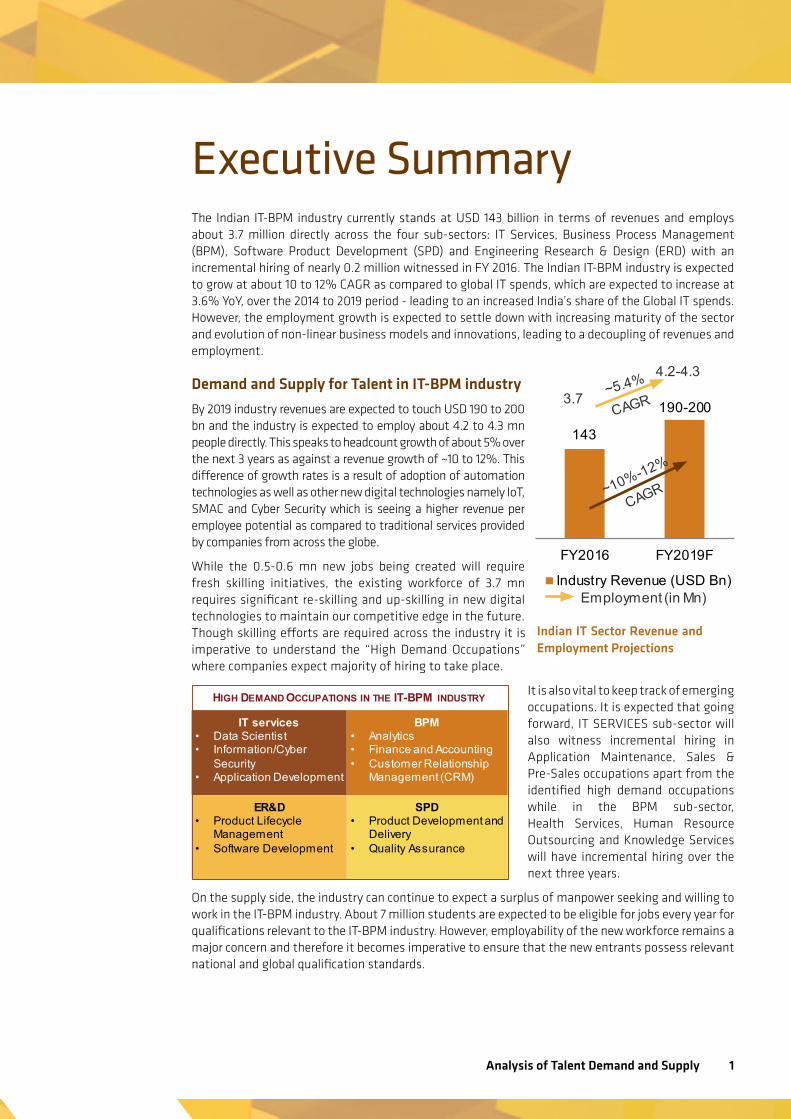
Executive SummaryThe Indian IT-BPM industry currently stands at USD 143 billion in terms of revenues and employs about 3.7 million directly across the four sub-sectors: IT Services, Business Process Management (BPM), Software Product Development (SPD) and Engineering Research & Design (ERD) with an incremental hiring of nearly 0.2 million witnessed in FY 2016. The Indian IT-BPM industry is expected to grow at about 10 to 12% CAGR as compared to global IT spends, which are expected to increase at 3.6% YoY, over the 2014 to 2019 period - leading to an increased India’s share of the Global IT spends. However, the employment growth is expected to settle down with increasing maturity of the sector and evolution of non-linear business models and innovations, leading to a decoupling of revenues and employment.
Demand and Supply for Talent in IT-BPM industry
By 2019 industry revenues are expected to touch USD 190 to 200 bn and the industry is expected to employ about 4.2 to 4.3 mn people directly. This speaks to headcount growth of about 5% over the next 3 years as against a revenue growth of ~10 to 12%. This difference of growth rates is a result of adoption of automation technologies as well as other new digital technologies namely IoT, SMAC and Cyber Security which is seeing a higher revenue per employee potential as compared to traditional services provided by companies from across the globe.
While the 0.5-0.6 mn new jobs being created will require fresh skilling initiatives, the existing workforce of 3.7 mn requires significant re-skilling and up-skilling in new digital technologies to maintain our competitive edge in the future. Though skilling efforts are required across the industry it is imperative to understand the “High Demand Occupations” where companies expect majority of hiring to take place.
It is also vital to keep track of emerging occupations. It is expected that going forward, IT SERVICES sub-sector will also witness incremental hiring in Application Maintenance, Sales & Pre-Sales occupations apart from the identified high demand occupations while in the BPM sub-sector, Health Services, Human Resource Outsourcing and Knowledge Services will have incremental hiring over the next three years.
On the supply side, the industry can continue to expect a surplus of manpower seeking and willing to work in the IT-BPM industry. About 7 million students are expected to be eligible for jobs every year for qualifications relevant to the IT-BPM industry. However, employability of the new workforce remains a major concern and therefore it becomes imperative to ensure that the new entrants possess relevant national and global qualification standards.
Indian IT Sector Revenue and Employment Projections
IT services• Data Scientist• Information/Cyber
Security• Application Development
SPD• Product Development and
Delivery • Quality Assurance
ER&D• Product Lifecycle
Management• Software Development
BPM• Analytics• Finance and Accounting• Customer Relationship
Management (CRM)
HIGH DEMAND OCCUPATIONS IN THE IT-BPM INDUSTRY
2
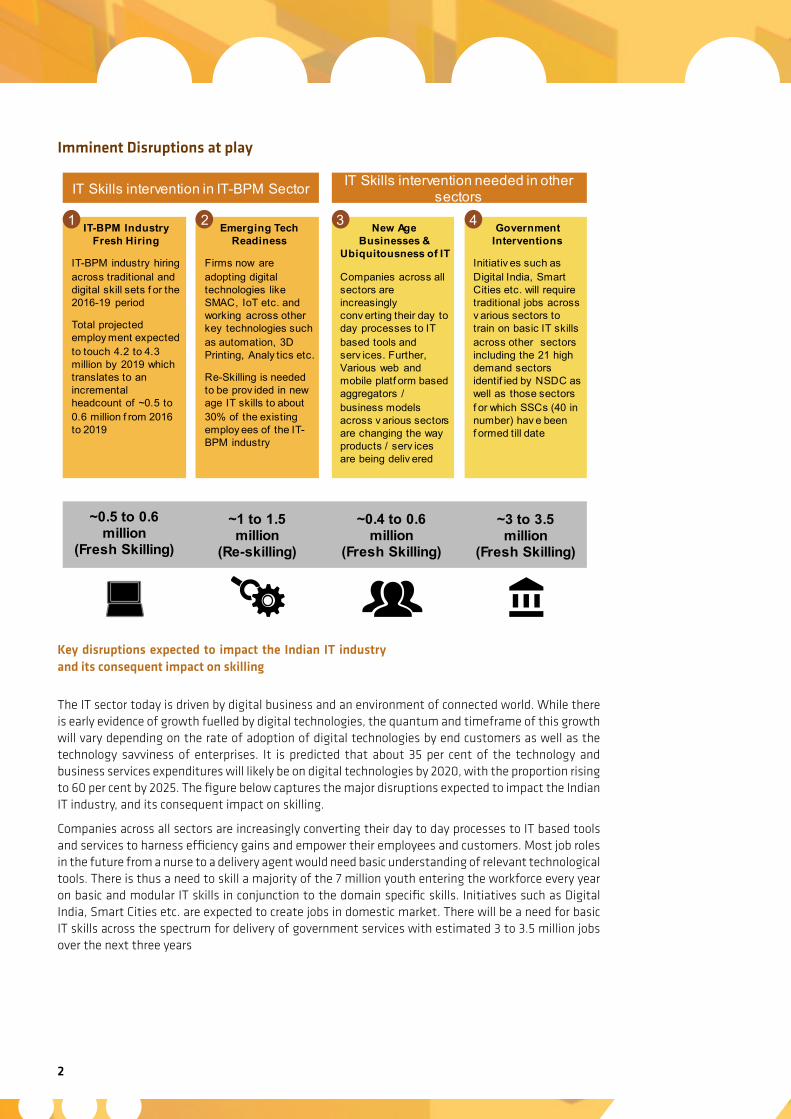
Imminent Disruptions at play
The IT sector today is driven by digital business and an environment of connected world. While there is early evidence of growth fuelled by digital technologies, the quantum and timeframe of this growth will vary depending on the rate of adoption of digital technologies by end customers as well as the technology savviness of enterprises. It is predicted that about 35 per cent of the technology and business services expenditures will likely be on digital technologies by 2020, with the proportion rising to 60 per cent by 2025. The figure below captures the major disruptions expected to impact the Indian IT industry, and its consequent impact on skilling.
Companies across all sectors are increasingly converting their day to day processes to IT based tools and services to harness efficiency gains and empower their employees and customers. Most job roles in the future from a nurse to a delivery agent would need basic understanding of relevant technological tools. There is thus a need to skill a majority of the 7 million youth entering the workforce every year on basic and modular IT skills in conjunction to the domain specific skills. Initiatives such as Digital India, Smart Cities etc. are expected to create jobs in domestic market. There will be a need for basic IT skills across the spectrum for delivery of government services with estimated 3 to 3.5 million jobs over the next three years
Key disruptions expected to impact the Indian IT industry and its consequent impact on skilling
IT Skills intervention in IT-BPM Sector IT Skills intervention needed in other sectors
IT-BPM Industry Fresh Hiring
IT-BPM industry hiring across traditional and digital skill sets f or the 2016-19 period
Total projected employ ment expected to touch 4.2 to 4.3 million by 2019 which translates to an incremental headcount of ~0.5 to 0.6 million f rom 2016 to 2019
Emerging Tech Readiness
Firms now are adopting digital technologies like SMAC, IoT etc. and working across other key technologies such as automation, 3D Printing, Analy tics etc.
Re-Skilling is needed to be prov ided in new age IT skills to about 30% of the existing employ ees of the IT-BPM industry
New Age Businesses &
Ubiquitousness of IT
Companies across all sectors are increasingly conv erting their day to day processes to IT based tools and serv ices. Further, Various web and mobile platf orm based aggregators / business models across v arious sectors are changing the way products / serv ices are being deliv ered
GovernmentInterventions
Initiativ es such as Digital India, Smart Cities etc. will require traditional jobs across v arious sectors to train on basic IT skills across other sectors including the 21 high demand sectors identif ied by NSDC as well as those sectors f or which SSCs (40 in number) hav e been f ormed till date
~0.5 to 0.6 million
(Fresh Skilling)
~0.4 to 0.6 million
(Fresh Skilling)
~1 to 1.5 million
(Re-skilling)
~3 to 3.5 million
(Fresh Skilling)
21 43
Analysis of Talent Demand and Supply 3
Skilling imperatives for the way forward
In order to address the skilling needs of the industry, NASSCOM, with the support of National Skill Development Corporation, established the IT-ITeS Sector Skills Council (SSC NASSCOM) in 2012 with a mandate of being the standard setting and certifying body for skill training. The SSC has since completed a mapping of more than 517 job roles in the industry with career paths defined from entry level to department heads / CXOs. It has also created standards for 74 entry level job roles, known as Qualification Packs (QPs), which define the requisite activities expected to be performed on the job along with the skills, knowledge and understanding needed to carry out the role effectively. These QPs serve as the standard for creation and implementation of skill training activities which will help make the “SSC certified” workforce relevant and employable. SSC NASSCOM’s efforts in getting more and more educational institutes to provide courses which are QP aligned as well as the SSC certified workforce getting created has lead to a rise in employability amongst the students through both traditional degree programs as well as vocational training.
One hindrance to this, however, is limited understanding of QPs across most colleges in India. Thus SSC NASSCOM needs to continue its efforts to create awareness amongst both colleges and industry players to increase adoption of qualification standards, acceptable globally, and align both training as well as hiring norms to these standards.
The next 3 to 5 years are expected to see significant shifts for the IT-BPM sector and the ability of the industry to grow will depend on the availability of a workforce trained on global standards. Each of the disruptions expected has two types of skilling related impact expected – fresh skilling of workforce newly entering IT or other sectors or up skilling of existing workforce within the IT industry. Further with the advent of digital technologies as well as automation and the adoption of the same by Indian IT-BPM companies in India, 30% of the existing manpower is expected to undergo re-skilling. This translates to re-skilling of about 1 to 1.5 million of the IT workforce.
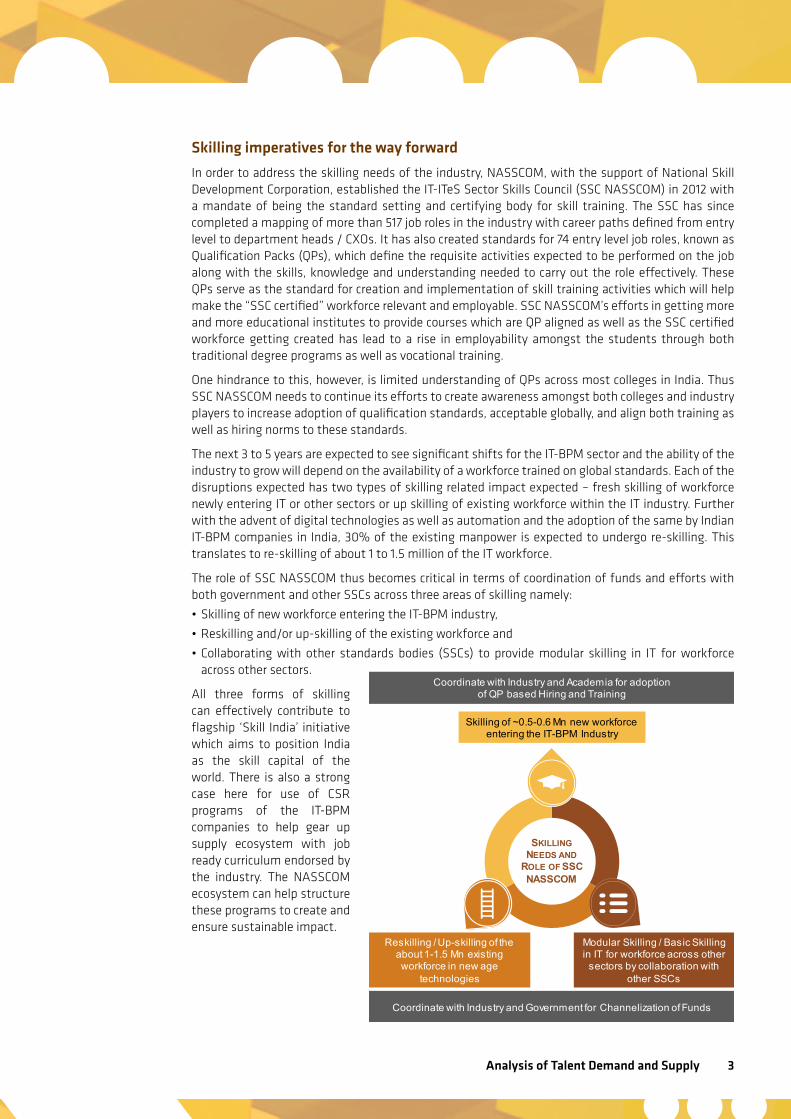
The role of SSC NASSCOM thus becomes critical in terms of coordination of funds and efforts with both government and other SSCs across three areas of skilling namely:
• Skilling of new workforce entering the IT-BPM industry,
• Reskilling and/or up-skilling of the existing workforce and
• Collaborating with other standards bodies (SSCs) to provide modular skilling in IT for workforce across other sectors.
All three forms of skilling can effectively contribute to flagship ‘Skill India’ initiative which aims to position India as the skill capital of the world. There is also a strong case here for use of CSR programs of the IT-BPM companies to help gear up supply ecosystem with job ready curriculum endorsed by the industry. The NASSCOM ecosystem can help structure these programs to create and ensure sustainable impact.
Skilling of ~0.5-0.6 Mn new workforce entering the IT-BPM Industry
Reskilling / Up-skilling of the about 1-1.5 Mn existing workforce in new age
technologies
Modular Skilling / Basic Skilling in IT for workforce across other
sectors by collaboration with other SSCs
SKILLINGNEEDS AND
ROLE OF SSC NASSCOM
Coordinate with Industry and Government for Channelization of Funds
Coordinate with Industry and Academia for adoption of QP based Hiring and Training

4
Analysis of Talent Demand and Supply 5
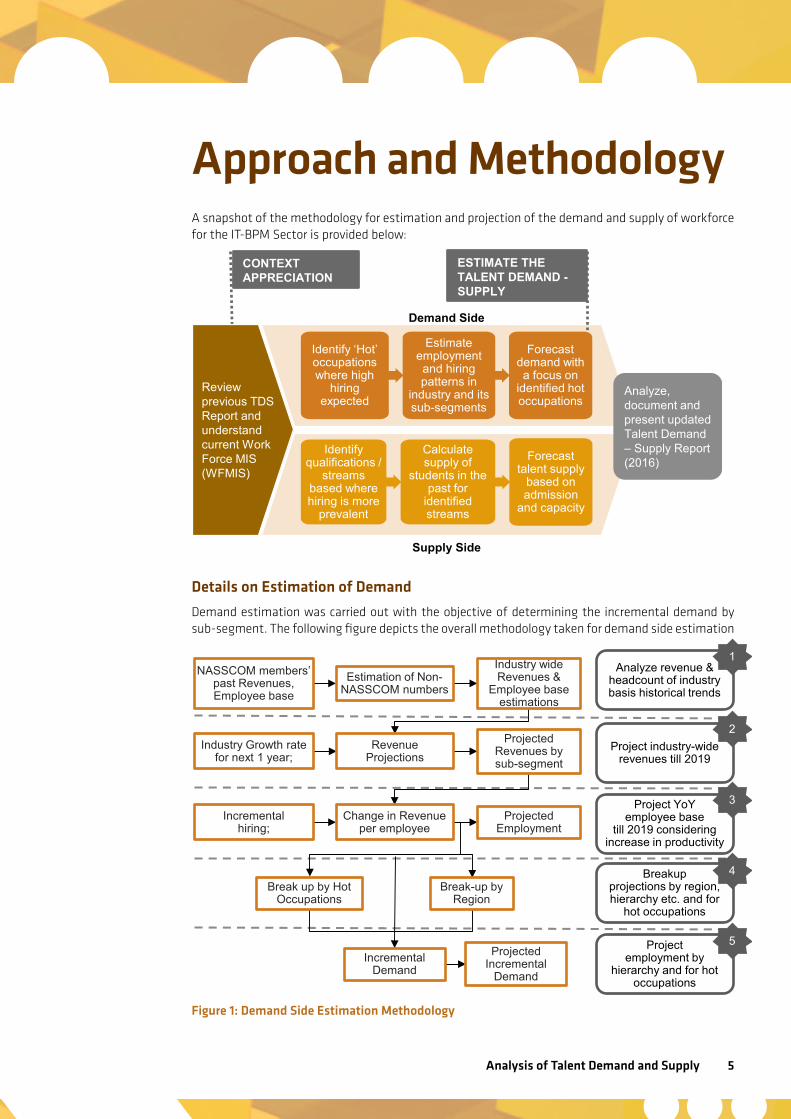
Approach and MethodologyA snapshot of the methodology for estimation and projection of the demand and supply of workforce for the IT-BPM Sector is provided below:
Details on Estimation of Demand
Demand estimation was carried out with the objective of determining the incremental demand by sub-segment. The following figure depicts the overall methodology taken for demand side estimation
Figure 1: Demand Side Estimation Methodology
CONTEXT APPRECIATION
ESTIMATE THE TALENT DEMAND - SUPPLY
Review previous TDS Report and understand current Work Force MIS (WFMIS)
Identify ‘Hot’ occupations where high
hiring expected
Estimate employment and hiring patterns in
industry and its sub-segments
Forecast demand with a focus on
identified hot occupations
Identify qualifications /
streams based where hiring is more
prevalent
Calculate supply of
students in the past for
identified streams
Forecast talent supply
based on admission
and capacity
Analyze, document and present updated Talent Demand – Supply Report (2016)
Demand Side
Supply Side
Analyze revenue & headcount of industry basis historical trends
Project industry-wide revenues till 2019
Project YoY employee base
till 2019 considering increase in productivity
Breakup projections by region, hierarchy etc. and for
hot occupations
Project employment by
hierarchy and for hot occupations
5
4
3
2
1
Estimation of Non-NASSCOM numbers
NASSCOM members’ past Revenues, Employee base
Industry wide Revenues &
Employee base estimations
Revenue Projections
Industry Growth rate for next 1 year;
Projected Revenues by sub-segment
Change in Revenue per employee
Incremental hiring;
Projected Employment
Incremental Demand
Projected Incremental
Demand
Break up by Hot Occupations
Break-up by Region
6
The estimation of demand has taken into consideration …
1. Estimated industry revenues, employee base and hiring pattern
• Estimated the aggregate industry revenue, employee base and hiring numbers.
2. Forecasted sub-segment wise demand
• Compiled the growth rate in terms of revenue and hiring numbers over the last three years.
• Projected demand, for the next 3 years on annual basis, based on the past growth as well as based on rise of global IT spends.
• Adjusted the expected rise in employment based on the change in revenue per employee.
3. Projected employment opportunities for identified 10 hot occupations
• Through secondary research, collected the information on job postings at the occupational level for IT services and BPM sub-sectors.
• Applied the percentage of each occupation to the respective sub-segment’s workforce to the demand estimation to arrive at demand for identified hot occupations.
4. Estimated incremental manpower demand for sub-segments as well as for 10 hot occupations for three years
Secondary research included
• Annual reports of the last three years of the top IT companies in each of the four sub segment
• Relevant reports like Skill Gap Study for IT/ITeS industry, employability report and State Skill Gap Study conducted for the key states (A.P., T.N., Karnataka, Kerala, Delhi and Maharashtra)
• Policy documents related to Make in India and Digital India
• NASSCOM/ SSC NASSCOM reports like Quarterly Industry Review, Innovation Report, India’s Domestic IT-BPO Market, BPO Career Guide, Indian Knowledge Services Outsourcing Report, The IT-BPO Sector in India: Strategic Review, etc.
• Report from reputed IT sector analysts like Gartner, IDC and Forrester.
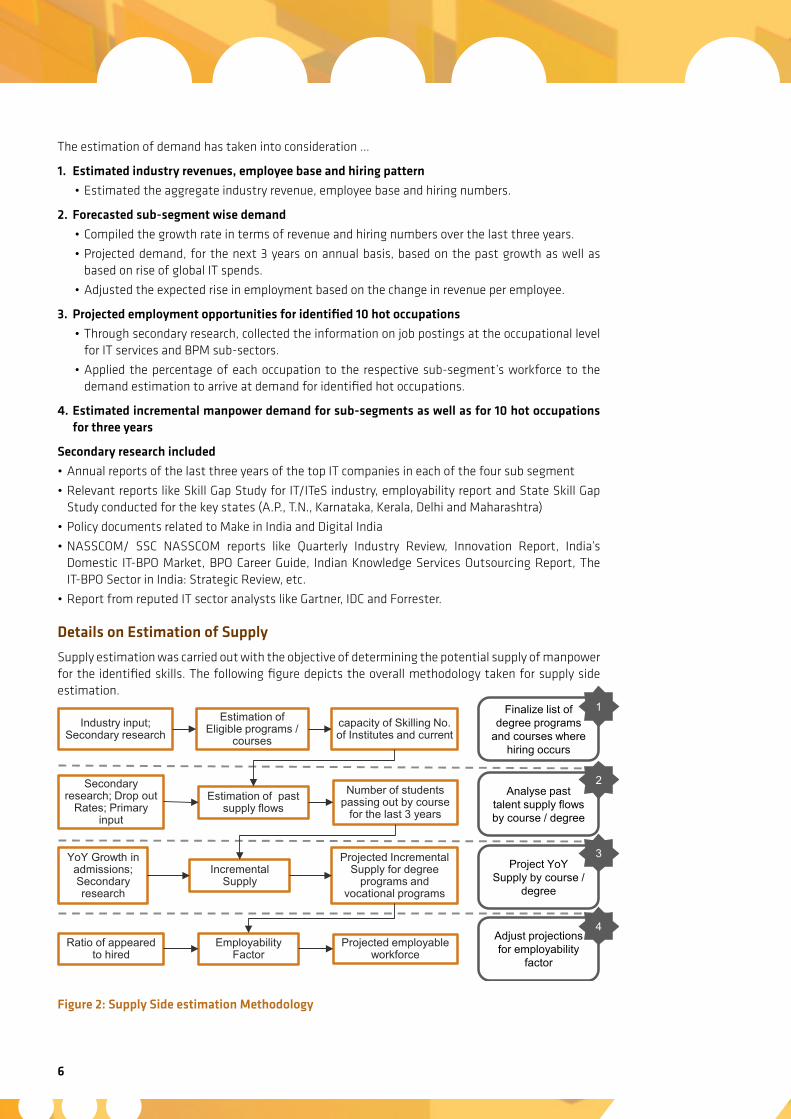
Details on Estimation of Supply
Supply estimation was carried out with the objective of determining the potential supply of manpower for the identified skills. The following figure depicts the overall methodology taken for supply side estimation.
Figure 2: Supply Side estimation Methodology
Estimation of Eligible programs /
courses Industry input;
Secondary research capacity of Skilling No. of Institutes and current
Finalize list of degree programs
and courses where hiring occurs
Estimation of past supply flows
Secondary research; Drop out
Rates; Primary input
Number of students passing out by course
for the last 3 years
Analyse past talent supply flows by course / degree
Incremental Supply
YoY Growth in admissions; Secondary research
Projected Incremental Supply for degree
programs and vocational programs
Project YoY Supply by course /
degree
Adjust projections for employability
factor
4
3
2
1
Employability Factor
Ratio of appeared to hired
Projected employable workforce
Analysis of Talent Demand and Supply 7
The following steps were used for supply estimation
1. Identified qualifications and estimation of potential number of institutes
• Mapped the current qualifications being hired across the industry through industry interaction and qualifications required for each job role as mentioned in QPs created.
• Identified various streams, number of institutes within each stream in the country and calculation of current capacity, admissions and number of students passing out by state.
2. Calculated enrolment, number of students passing by streams
• For each of the streams identified (Computer Science, BCA/MCA etc.), calculated enrolment and students pass outs to estimate growth rates.
• Applied the drop-out rates available through secondary research to the aggregate data to arrive at the number of students passing out of every stream.
3. Estimated Supply
• Based on the growth rates YoY, drop-out rates and growth of vocational skills training, estimated the following:
– Number of students enrolled by course and level for period constituting supply for the period 2016-2019 for each state – Number of students passing out by course and level for period 2016-2019 for each state
4. Incorporated willingness to work employability factor at entry levels
• Based on Workforce Participation Rate (Wfpr) rates available and secondary research the ratio of people passing out to willing to work to employable workforce.
• This ratio is applied on the total number of incremental workforce to get the actual number of people found to be employable
Demand - Supply gap estimation
Calculated the demand-supply gap considering the incremental demand and supply from the calculations as explained above. The demand supply gap analysis also included impact of disruption lead factors and the qualitative skilling aspects of the same. Further, the slicing of demand vs supply was also done at a state and regional level to provide the policy makers with requisite perspective.
8
Analysis of the IT-BPM industryTrends in Global IT-BPM spends
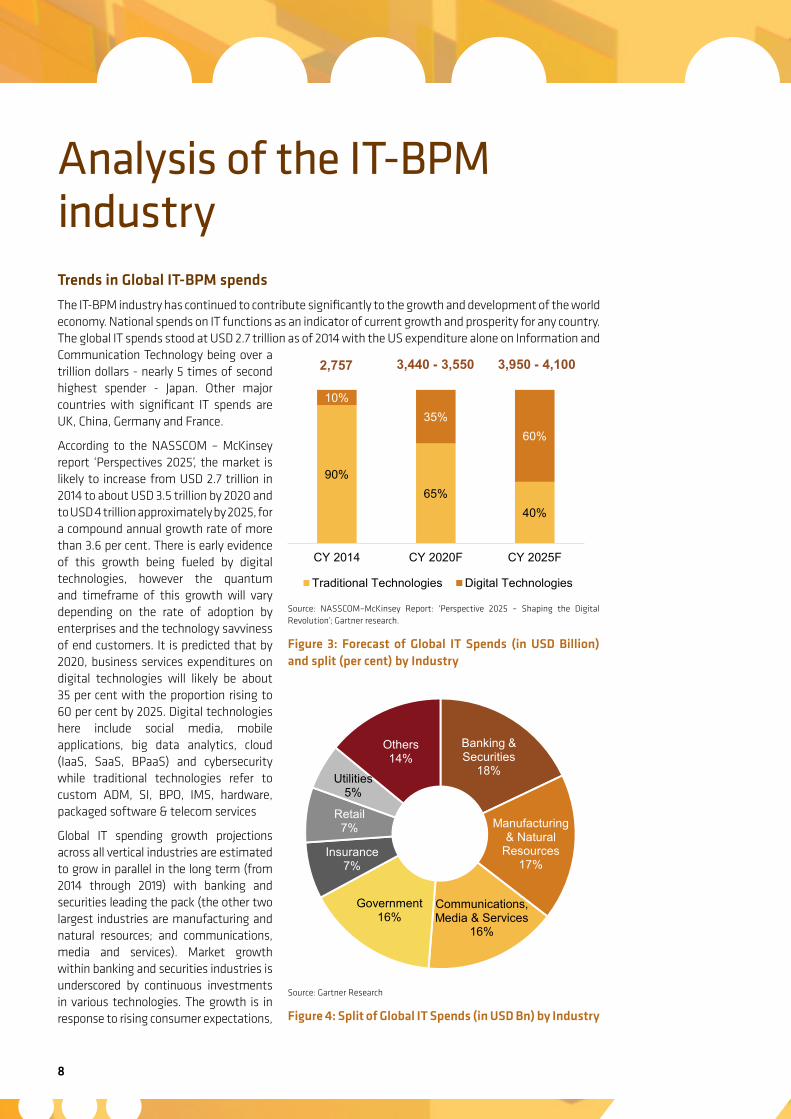
The IT-BPM industry has continued to contribute significantly to the growth and development of the world economy. National spends on IT functions as an indicator of current growth and prosperity for any country. The global IT spends stood at USD 2.7 trillion as of 2014 with the US expenditure alone on Information and Communication Technology being over a trillion dollars - nearly 5 times of second highest spender - Japan. Other major countries with significant IT spends are UK, China, Germany and France.
According to the NASSCOM – McKinsey report ‘Perspectives 2025’, the market is likely to increase from USD 2.7 trillion in 2014 to about USD 3.5 trillion by 2020 and to USD 4 trillion approximately by 2025, for a compound annual growth rate of more than 3.6 per cent. There is early evidence of this growth being fueled by digital technologies, however the quantum and timeframe of this growth will vary depending on the rate of adoption by enterprises and the technology savviness of end customers. It is predicted that by 2020, business services expenditures on digital technologies will likely be about 35 per cent with the proportion rising to 60 per cent by 2025. Digital technologies here include social media, mobile applications, big data analytics, cloud (IaaS, SaaS, BPaaS) and cybersecurity while traditional technologies refer to custom ADM, SI, BPO, IMS, hardware, packaged software & telecom services
Global IT spending growth projections across all vertical industries are estimated to grow in parallel in the long term (from 2014 through 2019) with banking and securities leading the pack (the other two largest industries are manufacturing and natural resources; and communications, media and services). Market growth within banking and securities industries is underscored by continuous investments in various technologies. The growth is in response to rising consumer expectations,
90% 65%
40%
10% 35%
60%
CY 2014 CY 2020F CY 2025F
Traditional Technologies Digital Technologies
2,757 3,440 - 3,550 3,950 - 4,100
Source: NASSCOM–McKinsey Report: ‘Perspective 2025 – Shaping the Digital Revolution’; Gartner research.
Figure 3: Forecast of Global IT Spends (in USD Billion) and split (per cent) by Industry
Source: Gartner Research
Figure 4: Split of Global IT Spends (in USD Bn) by Industry
Banking & Securities
18%
Manufacturing & Natural
Resources 17%
Communications, Media & Services
16%
Government 16%
Insurance 7%
Retail 7%
Utilities 5%
Others 14%
Analysis of Talent Demand and Supply 9
increased regulatory expectations, cybersecurity and competition from new "fintech" companies that, after growing their presence in niche banking areas, are challenging the traditional banking industry. Healthcare providers and insurance are the other two fastest-growth industries.
The communications, media and services industry is now in the midst of a massive digital transformation, with the traditional industry heavyweights (across telecommunications, cable, television, newspapers and online) challenged by the existing and new emerging market competitors (for example, over-the-top players or Uber-like organizations). To be competitive, companies are now focusing on discovering new business models (digital business) and on improving existing business processes (creating bimodal business delivery platforms) that favor innovation and decrease time to market. Thus, IT spending priorities in the industry are dominated by BI/analytics (opportunity to harvest real business value from insight), infrastructure and cloud projects. By 2018, 20% of the top 1,000 global enterprises will implement MVNO capabilities to support their IoT needs. To meet this demand, many communications service providers and IT services firms are investing in creating their IoT platforms.1
India’s rising share of global IT-BPM spend
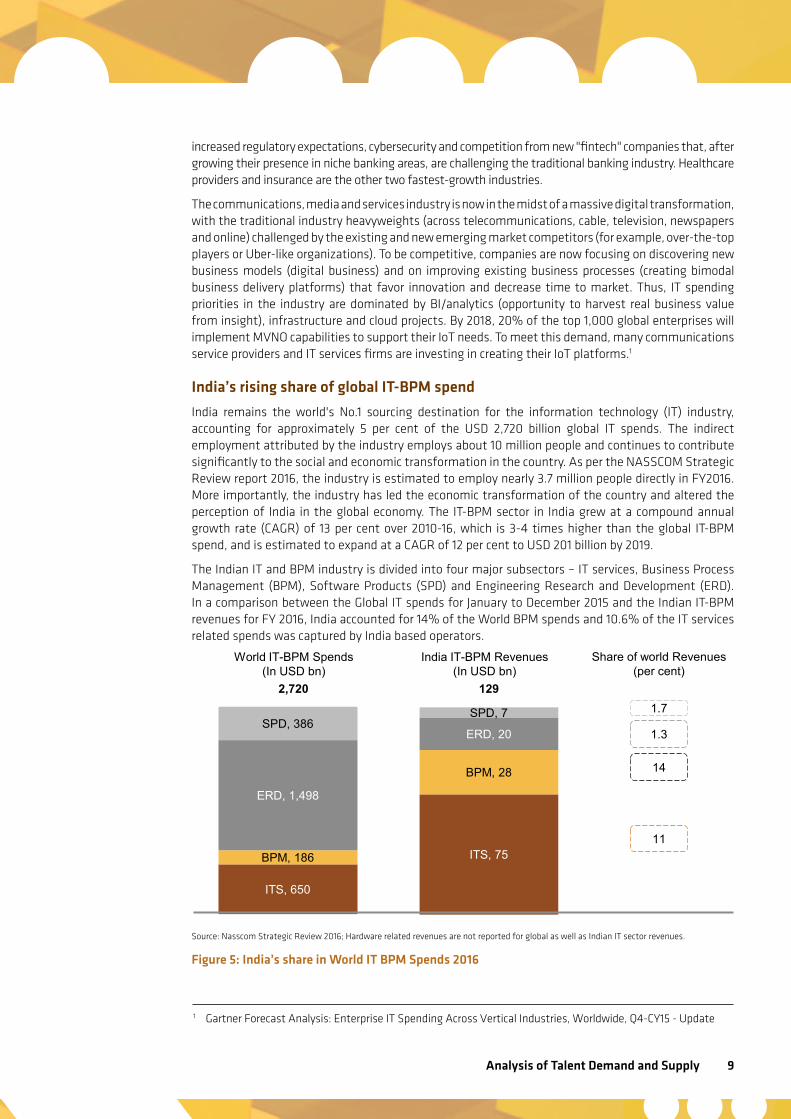
India remains the world's No.1 sourcing destination for the information technology (IT) industry, accounting for approximately 5 per cent of the USD 2,720 billion global IT spends. The indirect employment attributed by the industry employs about 10 million people and continues to contribute significantly to the social and economic transformation in the country. As per the NASSCOM Strategic Review report 2016, the industry is estimated to employ nearly 3.7 million people directly in FY2016. More importantly, the industry has led the economic transformation of the country and altered the perception of India in the global economy. The IT-BPM sector in India grew at a compound annual growth rate (CAGR) of 13 per cent over 2010-16, which is 3-4 times higher than the global IT-BPM spend, and is estimated to expand at a CAGR of 12 per cent to USD 201 billion by 2019.
The Indian IT and BPM industry is divided into four major subsectors – IT services, Business Process Management (BPM), Software Products (SPD) and Engineering Research and Development (ERD). In a comparison between the Global IT spends for January to December 2015 and the Indian IT-BPM revenues for FY 2016, India accounted for 14% of the World BPM spends and 10.6% of the IT services related spends was captured by India based operators.
Source: Nasscom Strategic Review 2016; Hardware related revenues are not reported for global as well as Indian IT sector revenues.
Figure 5: India’s share in World IT BPM Spends 2016
1 Gartner Forecast Analysis: Enterprise IT Spending Across Vertical Industries, Worldwide, Q4-CY15 - Update
ITS, 650
BPM, 186
ERD, 1,498
SPD, 386
ITS, 75
BPM, 28
ERD, 20
SPD, 7
Share of world Revenues (per cent)
14
11
World IT-BPM Spends (In USD bn)
2,720
India IT-BPM Revenues (In USD bn)
129 1.7
1.3
10
This share is expected to grow in light of overall growth of IT spends across the world. India’s Share of Global IT spends in the IT services segment is expected to rise from about 11% currently to about 14% by FY19. This is followed by BPM sub-sector which rises to 16% of global IT spends. ERD and SPD are expected to rise marginally to 1.7% and 2.3% of respective Global IT spends. For this to hold true Indian IT companies need to up their services through digital technologies as well as build skillsets required for such technologies.
IT services in India are approximately 3-4 times cheaper than in the US and this cost competitiveness continues to be the mainstay of its unique selling proposition (USP) in the global sourcing market. In recent times India has also gained prominence in terms of housing intellectual capital as evidenced by several global IT firms setting up their innovation centres in India. India remains the world's No.1 sourcing destination for the information technology (IT) industry, accounting for approximately 56 per cent of the USD 162-166 billion market (not including hardware)
Overview of Indian IT industry
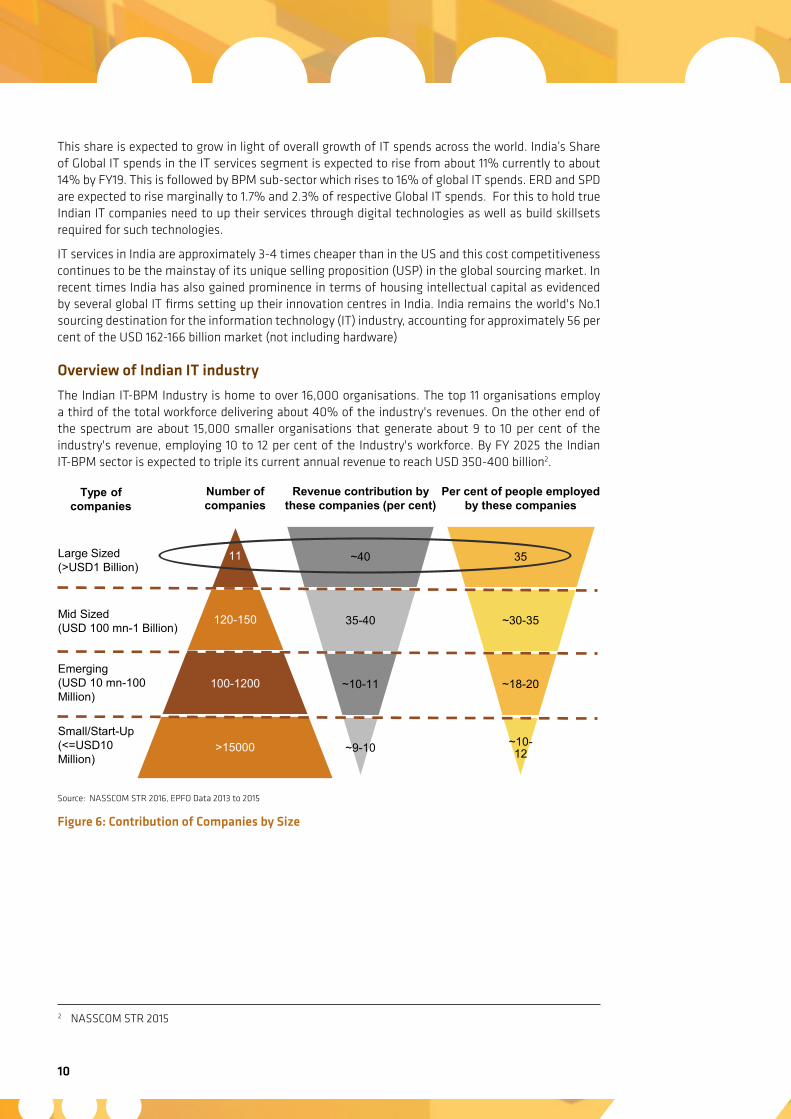
The Indian IT-BPM Industry is home to over 16,000 organisations. The top 11 organisations employ a third of the total workforce delivering about 40% of the industry's revenues. On the other end of the spectrum are about 15,000 smaller organisations that generate about 9 to 10 per cent of the industry's revenue, employing 10 to 12 per cent of the Industry's workforce. By FY 2025 the Indian IT-BPM sector is expected to triple its current annual revenue to reach USD 350-400 billion2.
Source: NASSCOM STR 2016, EPFO Data 2013 to 2015
Figure 6: Contribution of Companies by Size
11
120-150
100-1200
>15000
Number of companies
Per cent of people employed by these companies
Revenue contribution by these companies (per cent)
~40
35-40
~10-11
~9-10
35
~30-35
~18-20
~10-12
Large Sized (>USD1 Billion)
Mid Sized (USD 100 mn-1 Billion)
Emerging (USD 10 mn-100 Million)
Type of companies
Small/Start-Up (<=USD10 Million)
2 NASSCOM STR 2015
Analysis of Talent Demand and Supply 11
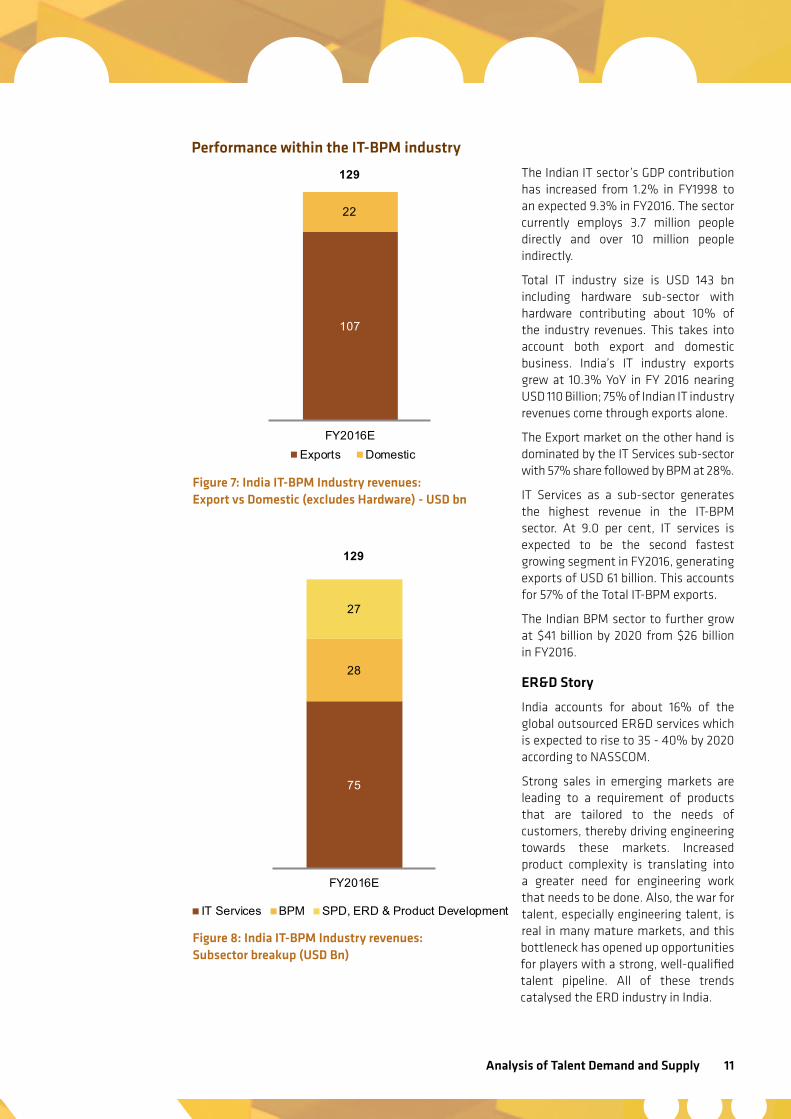
Performance within the IT-BPM industry
The Indian IT sector’s GDP contribution has increased from 1.2% in FY1998 to an expected 9.3% in FY2016. The sector currently employs 3.7 million people directly and over 10 million people indirectly.
Total IT industry size is USD 143 bn including hardware sub-sector with hardware contributing about 10% of the industry revenues. This takes into account both export and domestic business. India’s IT industry exports grew at 10.3% YoY in FY 2016 nearing USD 110 Billion; 75% of Indian IT industry revenues come through exports alone.
The Export market on the other hand is dominated by the IT Services sub-sector with 57% share followed by BPM at 28%.
IT Services as a sub-sector generates the highest revenue in the IT-BPM sector. At 9.0 per cent, IT services is expected to be the second fastest growing segment in FY2016, generating exports of USD 61 billion. This accounts for 57% of the Total IT-BPM exports.
The Indian BPM sector to further grow at $41 billion by 2020 from $26 billion in FY2016.
ER&D Story
India accounts for about 16% of the global outsourced ER&D services which is expected to rise to 35 - 40% by 2020 according to NASSCOM.
Strong sales in emerging markets are leading to a requirement of products that are tailored to the needs of customers, thereby driving engineering towards these markets. Increased product complexity is translating into a greater need for engineering work that needs to be done. Also, the war for talent, especially engineering talent, is real in many mature markets, and this bottleneck has opened up opportunities for players with a strong, well-qualified talent pipeline. All of these trends catalysed the ERD industry in India.
Figure 7: India IT-BPM Industry revenues: Export vs Domestic (excludes Hardware) - USD bn
Figure 8: India IT-BPM Industry revenues: Subsector breakup (USD Bn)
107
22
FY2016EExports Domestic
129
75
28
27
FY2016E
IT Services BPM SPD, ERD & Product Development
129
12
According to a study3, growth in global ERD spend is being driven by four emerging trends:
• Continued R&D investment considered imperative by multinational conglomerates when it comes to pursuing innovation and penetrating new, emerging markets
• Increasing use of electronics, the search for alternate fuel sources and greater fuel efficiency, and the convergence of technologies that enable a single device to perform multiple functions
• Growing sophistication and maturity of the ERD services industry
• Changing view of India as a strategic partner focused on innovation rather than simply sustenance and maintenance of existing products
Key forces of disruption
India is currently the third largest IT market in the APAC region, following China and Australia, and is expected to take the second position by 2019. The confluence of digital technologies (cloud, mobility, IoT, social, big data), changing business models, rapidly growing innovative start-up ecosystem, government’s vision of driving digitization, and India’s consumer economy have been identified as major trends projected to spearhead this growth. The Industry is expected to reach US$350 billion by 20254.
To realise this growth potential, it is imperative that India capitalise on the opportunities presented by the paradigm shifts taking place within the industry over the next five years. The shifts in play are both global and India-centric in nature, affecting the way businesses will be run and the workforce required to do so.
Global Factors
There have been marked phases in the story in the IT industry, with firms of newer generations often supplanting incumbent market leaders, as evidenced by the shift from leadership in mainframes, to minicomputers, to personal computers, to the present era of the internet and mobile. Once-great firms unable to keep up or embrace the new paradigm saw themselves be ousted form relevance. The key therefore is to identify the next set of disruptions expected within the industry globally and to prepare for the same.
1. Internet of Things (IoT)
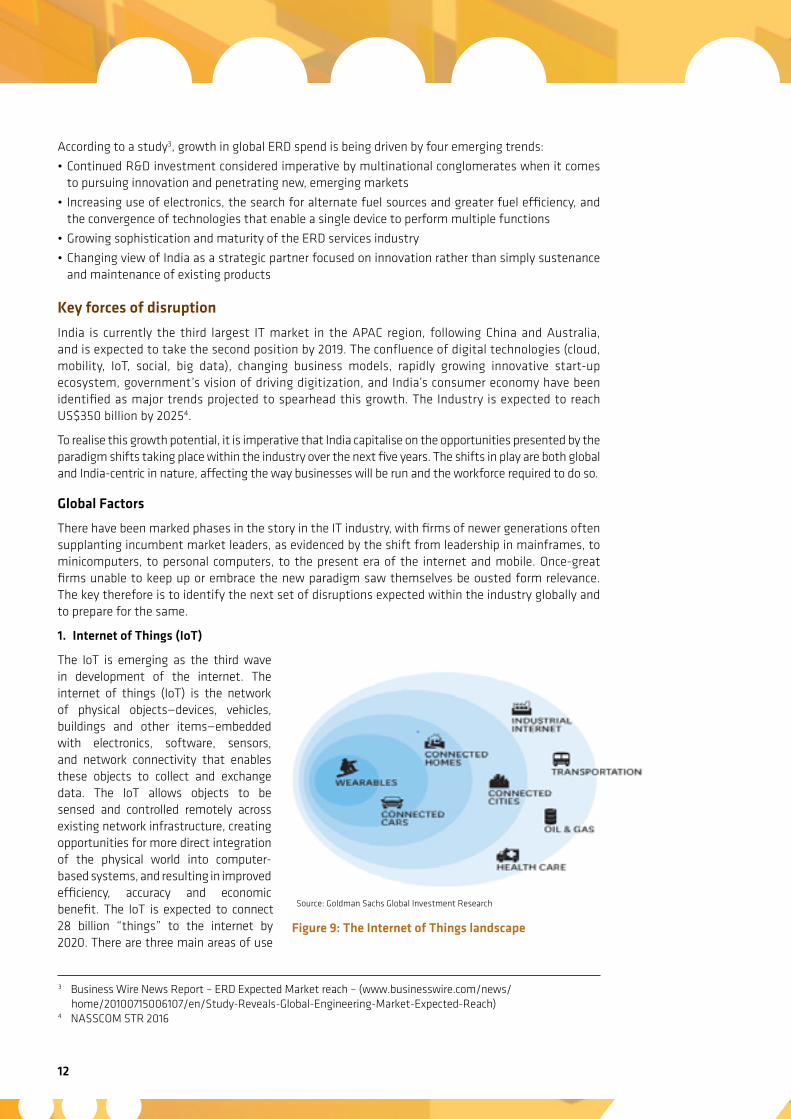
The IoT is emerging as the third wave in development of the internet. The internet of things (IoT) is the network of physical objects—devices, vehicles, buildings and other items—embedded with electronics, software, sensors, and network connectivity that enables these objects to collect and exchange data. The IoT allows objects to be sensed and controlled remotely across existing network infrastructure, creating opportunities for more direct integration of the physical world into computer-based systems, and resulting in improved efficiency, accuracy and economic benefit. The IoT is expected to connect 28 billion “things” to the internet by 2020. There are three main areas of use
3 Business Wire News Report – ERD Expected Market reach – (www.businesswire.com/news/home/20100715006107/en/Study-Reveals-Global-Engineering-Market-Expected-Reach)
4 NASSCOM STR 2016
Figure 9: The Internet of Things landscape
Source: Goldman Sachs Global Investment Research
Analysis of Talent Demand and Supply 13
for IoT devices - government, enterprise, and the home. The aggregate number of IoT devices estimated in use is expected to grow from 0.6 billion in 2014 to 6.7 billion by 2019, reflecting a CAGR of 61%.
The IoT companies' revenue opportunity lies primarily with those who can create the infrastructure and networks that IoT devices run on. It is estimated that hardware will account for only $50 billion by 2019, whereas software and service providers will generate up to $550 billion. Gartner predicts that spending on IOT hardware will exceed 2.5USD million every minute in 2016.5
IoT in India is given a major push by government of India through its smart city project. Governments’ objective is to create an IoT industry in India of USD 15 billion by 2020.Another key initiative taken by Government is the formation of Centre of Excellence on Internet of Things as a joint initiative with NASSCOM.
Some of the companies who are active in the IoT space in India are Intel, Volkswagen, MediaTek, Hero Motocorp, Hindustan Petroleum, Apollo Hospitals, Cisco, Bharti Infratel, TVS Motor, and IBM.6
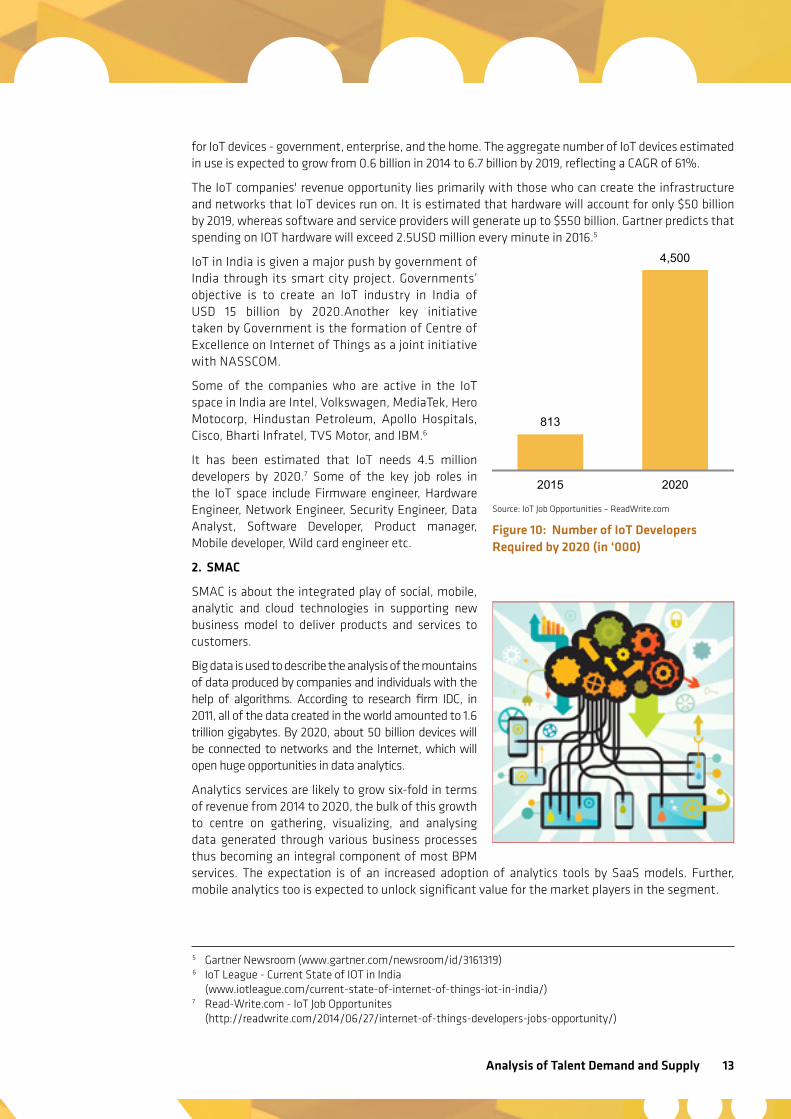
It has been estimated that IoT needs 4.5 million developers by 2020.7 Some of the key job roles in the IoT space include Firmware engineer, Hardware Engineer, Network Engineer, Security Engineer, Data Analyst, Software Developer, Product manager, Mobile developer, Wild card engineer etc.
2. SMAC
SMAC is about the integrated play of social, mobile, analytic and cloud technologies in supporting new business model to deliver products and services to customers.
Big data is used to describe the analysis of the mountains of data produced by companies and individuals with the help of algorithms. According to research firm IDC, in 2011, all of the data created in the world amounted to 1.6 trillion gigabytes. By 2020, about 50 billion devices will be connected to networks and the Internet, which will open huge opportunities in data analytics.
Analytics services are likely to grow six-fold in terms of revenue from 2014 to 2020, the bulk of this growth to centre on gathering, visualizing, and analysing data generated through various business processes thus becoming an integral component of most BPM services. The expectation is of an increased adoption of analytics tools by SaaS models. Further, mobile analytics too is expected to unlock significant value for the market players in the segment.
5 Gartner Newsroom (www.gartner.com/newsroom/id/3161319)6 IoT League - Current State of IOT in India
(www.iotleague.com/current-state-of-internet-of-things-iot-in-india/)7 Read-Write.com - IoT Job Opportunites
(http://readwrite.com/2014/06/27/internet-of-things-developers-jobs-opportunity/)
Source: IoT Job Opportunities – ReadWrite.com
813
4,500
2015 2020
Figure 10: Number of IoT Developers Required by 2020 (in ‘000)
14
International Data Corp. (IDC) estimates that Indian IT vendors will generate at least USD 225 billion in overall revenue in 2020 on back of growth of SMAC. The break-up of spending expected across each of the components are 10% of the total IT budget on big data and analytics, 9.5% on cloud services, 5.3% on mobile apps and devices and 3.4% on social media. A survey of 410 global IT decision makers in 2014 predicted India will export $15 billion worth of SMAC software and services in FY17.
A McKinsey report also quotes a shortfall of up to 190,000 data scientists and 1.5 Mn data managers in the U.S. alone thus providing Currently, the skill base for analytics in India is estimated to be about 90,000. Some of the key job roles in analytics include Specialized Analytics Analyst, Big Data Engineer, and Software Engineer-Analytics etc.
3. Software Automation
Software automation, artificial technology and greater efficiency through digital technology will require significant re-skilling of existing workforce. Clients of IT firms are looking more and more to move to newer technologies and cut costs on the older systems through automation.8 Some place cognitive technologies or automations on the same historical path as other breakthroughs – generating employment. Cognitive technologies may eliminate some kinds of work, it's much more likely that they will take over discrete tasks, making human workers more effective. Certain kinds of tasks—those that involve dealing with ambiguity, common sense, creativity, and human interaction—are likely to remain out of reach of computers for some time. Combining the skills of a smart human with a smart machine is more likely to make businesses competitive.9
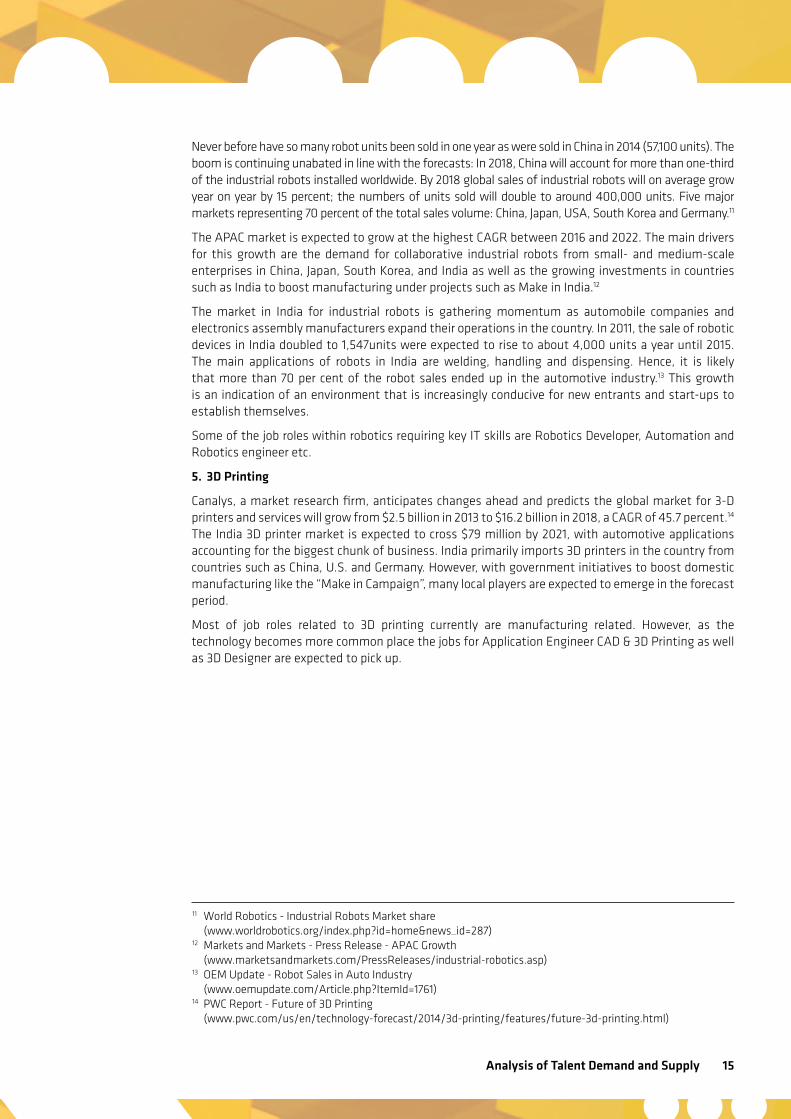
4. Robotics
Robotics is a field of hardware based automation which concerns with the adoption of such automation to ensure quality production and meet market demand, and the growing demand from small- and medium-scale enterprises in developing countries. Key players in the market are increasingly developing low-cost, affordable, compact and energy-efficient solutions to cater the growing demands of the customers.
By 2018, around 1.3 million industrial robots will be entering service in factories around the world Industrial robotics market is expected to grow at CAGR of 11.9% between 2016 and 2022, and reach USD 79.56 Billion by 202210. In the high-revenue automotive sector, global investments in industrial robots increased by a record-breaking 43 percent (2013-2014) within one year. The current global leader in industrial robotic automation is South Korea.
8 Economic Times News Report - Surviving the Digital Age (http://economictimes.indiatimes.com/jobs/surviving-the-digital-wave-it-employees-need-to-upgrade-their-skills-to-stay-relevant/articleshow/50004219.cms)
9 Deloitte Research Report - Redesigning Work for Cognitive Technologies (www2.deloitte.com/content/dam/Deloitte/tr/Documents/technology-media-telecommunications/ redesigningworkcognitivetechnologies.pdf)
10 Industrial Robotics Market by Type, Application, Component, and Geography - Analysis & Forecast to 2022"
Analysis of Talent Demand and Supply 15
Never before have so many robot units been sold in one year as were sold in China in 2014 (57,100 units). The boom is continuing unabated in line with the forecasts: In 2018, China will account for more than one-third of the industrial robots installed worldwide. By 2018 global sales of industrial robots will on average grow year on year by 15 percent; the numbers of units sold will double to around 400,000 units. Five major markets representing 70 percent of the total sales volume: China, Japan, USA, South Korea and Germany.11
The APAC market is expected to grow at the highest CAGR between 2016 and 2022. The main drivers for this growth are the demand for collaborative industrial robots from small- and medium-scale enterprises in China, Japan, South Korea, and India as well as the growing investments in countries such as India to boost manufacturing under projects such as Make in India.12
The market in India for industrial robots is gathering momentum as automobile companies and electronics assembly manufacturers expand their operations in the country. In 2011, the sale of robotic devices in India doubled to 1,547units were expected to rise to about 4,000 units a year until 2015. The main applications of robots in India are welding, handling and dispensing. Hence, it is likely that more than 70 per cent of the robot sales ended up in the automotive industry.13 This growth is an indication of an environment that is increasingly conducive for new entrants and start-ups to establish themselves.
Some of the job roles within robotics requiring key IT skills are Robotics Developer, Automation and Robotics engineer etc.
5. 3D Printing
Canalys, a market research firm, anticipates changes ahead and predicts the global market for 3-D printers and services will grow from $2.5 billion in 2013 to $16.2 billion in 2018, a CAGR of 45.7 percent.14
The India 3D printer market is expected to cross $79 million by 2021, with automotive applications accounting for the biggest chunk of business. India primarily imports 3D printers in the country from countries such as China, U.S. and Germany. However, with government initiatives to boost domestic manufacturing like the “Make in Campaign”, many local players are expected to emerge in the forecast period.
Most of job roles related to 3D printing currently are manufacturing related. However, as the technology becomes more common place the jobs for Application Engineer CAD & 3D Printing as well as 3D Designer are expected to pick up.
11 World Robotics - Industrial Robots Market share (www.worldrobotics.org/index.php?id=home&news_id=287)
12 Markets and Markets - Press Release - APAC Growth (www.marketsandmarkets.com/PressReleases/industrial-robotics.asp)
13 OEM Update - Robot Sales in Auto Industry (www.oemupdate.com/Article.php?ItemId=1761)
14 PWC Report - Future of 3D Printing (www.pwc.com/us/en/technology-forecast/2014/3d-printing/features/future-3d-printing.html)
16
India Centric Factors
Whereas global would affect all markets, there are some changes specific to the Indian context. These factors
1. Government Initiatives - Digital India Program
Digital India
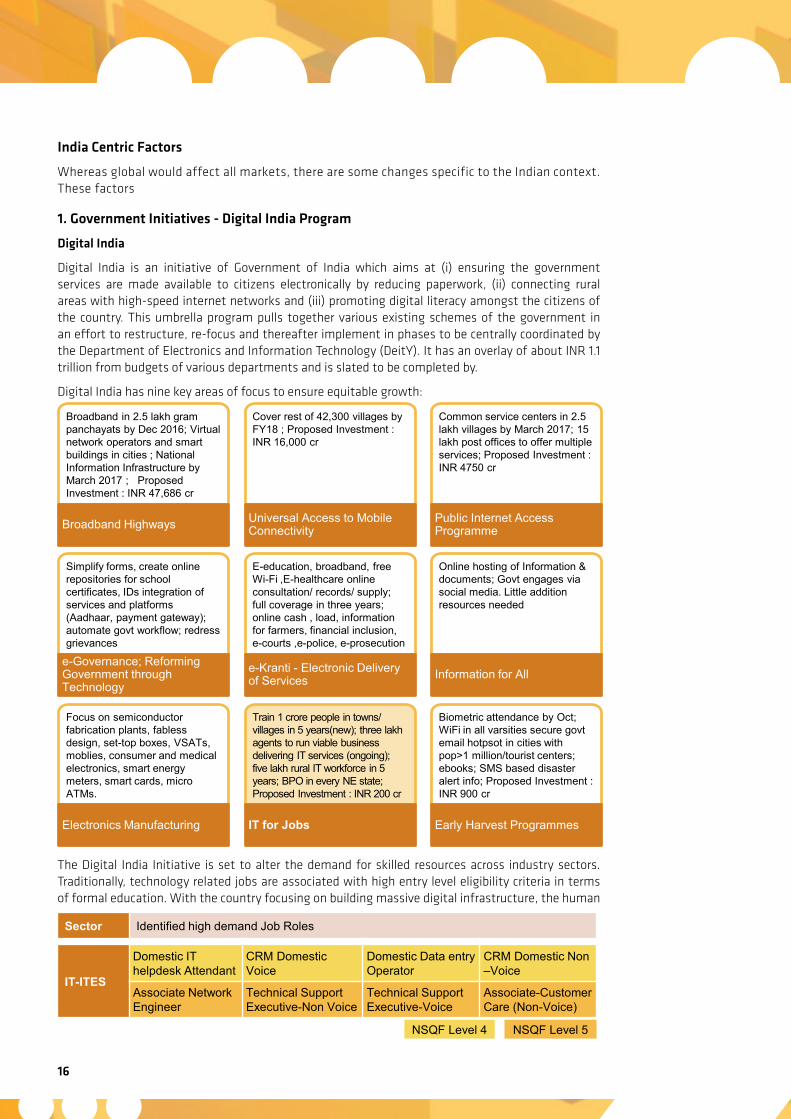
Digital India is an initiative of Government of India which aims at (i) ensuring the government services are made available to citizens electronically by reducing paperwork, (ii) connecting rural areas with high-speed internet networks and (iii) promoting digital literacy amongst the citizens of the country. This umbrella program pulls together various existing schemes of the government in an effort to restructure, re-focus and thereafter implement in phases to be centrally coordinated by the Department of Electronics and Information Technology (DeitY). It has an overlay of about INR 1.1 trillion from budgets of various departments and is slated to be completed by.
Digital India has nine key areas of focus to ensure equitable growth:
The Digital India Initiative is set to alter the demand for skilled resources across industry sectors. Traditionally, technology related jobs are associated with high entry level eligibility criteria in terms of formal education. With the country focusing on building massive digital infrastructure, the human
Broadband in 2.5 lakh gram panchayats by Dec 2016; Virtual network operators and smart buildings in cities ; National Information Infrastructure by March 2017 ; Proposed Investment : INR 47,686 cr
Broadband Highways
Cover rest of 42,300 villages by FY18 ; Proposed Investment : INR 16,000 cr
Universal Access to Mobile Connectivity
Common service centers in 2.5 lakh villages by March 2017; 15 lakh post offices to offer multiple services; Proposed Investment : INR 4750 cr
Public Internet Access Programme
Simplify forms, create online repositories for school certificates, IDs integration of services and platforms (Aadhaar, payment gateway); automate govt workflow; redress grievances
e-Governance; Reforming Government through Technology
E-education, broadband, free Wi-Fi ,E-healthcare online consultation/ records/ supply; full coverage in three years; online cash , load, information for farmers, financial inclusion, e-courts ,e-police, e-prosecution
e-Kranti - Electronic Delivery of Services
Online hosting of Information & documents; Govt engages via social media. Little addition resources needed
Information for All
Focus on semiconductor fabrication plants, fabless design, set-top boxes, VSATs, moblies, consumer and medical electronics, smart energy meters, smart cards, micro ATMs.
Electronics Manufacturing
Train 1 crore people in towns/ villages in 5 years(new); three lakh agents to run viable business delivering IT services (ongoing); five lakh rural IT workforce in 5 years; BPO in every NE state; Proposed Investment : INR 200 cr
IT for Jobs
Biometric attendance by Oct; WiFi in all varsities secure govt email hotpsot in cities with pop>1 million/tourist centers; ebooks; SMS based disaster alert info; Proposed Investment : INR 900 cr
Early Harvest Programmes
Sector Identified high demand Job Roles
IT-ITES
Domestic IT helpdesk Attendant
CRM Domestic Voice
Domestic Data entry Operator
CRM Domestic Non –Voice
Associate Network Engineer
Technical Support Executive-Non Voice
Technical Support Executive-Voice
Associate-Customer Care (Non-Voice)
NSQF Level 4 NSQF Level 5
Analysis of Talent Demand and Supply 17
resources requirement in these industries may shift, giving rise to jobs which do not have formal education as an eligibility constraint. The identified job roles have low-eligibility barriers, and can be instrumental in implementing the Digital India vision:-
2. E-Commerce and the rise of the Indian startups
E-commerce
E-commerce has become commonplace because of its ability to attract a wide customer base with the best deals for products and services. The tech-savvy population has increased rapidly worldwide, driving the market growth. This has also increased the need for enhanced software, services, and analytics that can track buying patterns and online behaviour.
The global e-commerce industry generated revenues of USD 1.5 Trillion, growing at 20 per cent; the US being the world’s largest market, followed by China15. The Indian ecommerce industry today is clocking revenues of about USD 17 Billion, growing at a CAGR of over 30%16. Growing internet penetration, entry of global majors, rise in smartphones adoption, innovations in mobile technology, security, and payments, and access to funding helping accelerate the growth of e-commerce. Diverse demographics and inadequate infrastructure will catalyse the transformation of the e-commerce sector into a hyper local, on demand market. Augmented transaction values, increased data usage and higher online shopping penetration has the capacity to take the Indian e-Commerce revenues to USD 200 billion in gross merchandize value by 2030. The growth of ecommerce has attracted tremendous investments and it has resulted in the creation of jobs across different areas including IT-BPM.
The booming Internet commerce sector (e-commerce) was one of the major growth drivers of the economy in 2014. The nascent, yet growing, industry not only played a crucial role in generating new jobs but also in perking up salaries.
IT in E-Commerce companies includes design, development, implementation, and maintenance of the whole technical architecture. E-commerce enterprises' IT spending is directly linked to the company's strategy and goals. IT investments are critical and dependent on business needs and expansion strategies. However, the dynamism observed in sales patterns and consumer behaviour largely determines the utility value of IT investments.17 Some of the IT based job roles within E-Commerce companies include Software Engineer-Python Developer, Front Developer, Software Developer etc.
The Startup Story
India is the third largest base for new businesses in the world and home to over 4,200 tech start-ups, a number that is set to increase to 11,500 by 2020. The growth of tech startups has been fuelled by internet / app based business as well as new digital technologies. Some of factors leveraging the developments are:
• India’s internet economy is expected to touch USD 151.6 billion by 2018, accounting for 5 per cent of the country’s gross domestic product (GDP)18. India’s internet user base is expected to reach over 462 million by June 2016, the third largest in the world, while the number of social media users grow to 160 million
• Public cloud services revenue in India is expected to reach USD 0.9 billion in 2015, growing by 33 per cent YoY, as per a report by Gartner Inc. In yet another Gartner report, the public cloud market alone in the country was estimated to treble to USD 1.9 billion by 2018 from USD 0.6 billion in 2014. Increased penetration of internet (including in rural areas) and rapid emergence of e-commerce are the main drivers for continued growth of data centre co-location and hosting market in India.19 It is likely that these will be the key drivers for demand in the current economic scenario of uncertainty.
15 NASSCOM Report – e-commerce in India – Fueling a billion dreams16 NASSCOM STR 201617 Global E-commerce Software and Services Spending Market - 2015 to 2019, Technovio Report18 India @ D-gital. Bharat - BCG and IAMAI report - 201519 Indian in Business News Report
(http://indiainbusiness.nic.in/newdesign/index.php?param=industryservices_landing/395/3)
18
Investment Scenario in the IT Industry
Indian IT's core competencies and strengths have attracted significant investments from major countries. The computer software and hardware sector in India attracted cumulative Foreign Direct Investment (FDI) inflows worth US$ 18.2 billion between April 2000 and September 2015, according to data released by the Department of Industrial Policy and Promotion (DIPP).
Indian start-ups received funding worth US$ 5 billion by the end of 2015, a 125 per cent increase in a year, according to a report by IT Industry association NASSCOM. The private equity (PE) deals increased the number of mergers and acquisitions (M&A) especially in the e-commerce space in 2014. The IT space, including e-commerce, witnessed 240 M&A deals worth US$ 3.8 billion in 2014, as per data from Dealogic.
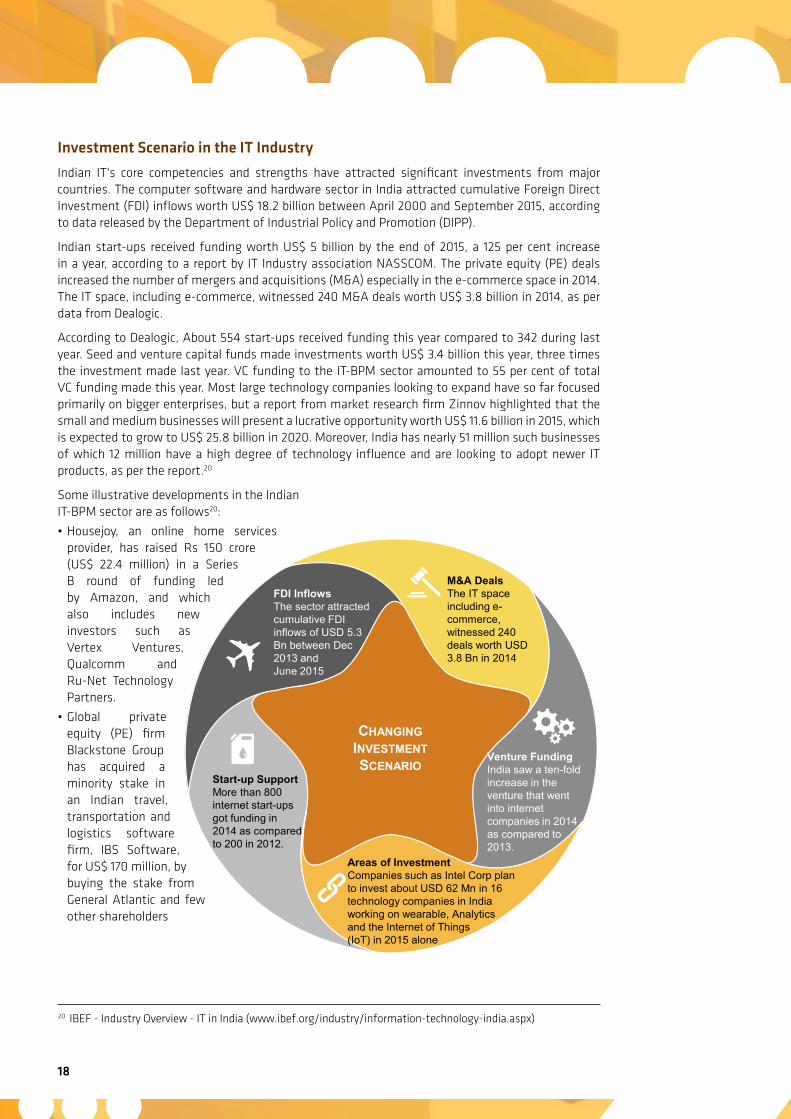
According to Dealogic, About 554 start-ups received funding this year compared to 342 during last year. Seed and venture capital funds made investments worth US$ 3.4 billion this year, three times the investment made last year. VC funding to the IT-BPM sector amounted to 55 per cent of total VC funding made this year. Most large technology companies looking to expand have so far focused primarily on bigger enterprises, but a report from market research firm Zinnov highlighted that the small and medium businesses will present a lucrative opportunity worth US$ 11.6 billion in 2015, which is expected to grow to US$ 25.8 billion in 2020. Moreover, India has nearly 51 million such businesses of which 12 million have a high degree of technology influence and are looking to adopt newer IT products, as per the report.20
Some illustrative developments in the Indian IT-BPM sector are as follows20:
• Housejoy, an online home services provider, has raised Rs 150 crore (US$ 22.4 million) in a Series B round of funding led by Amazon, and which also includes new investors such as Vertex Ventures, Qualcomm and Ru-Net Technology Partners.
• Global private equity (PE) firm Blackstone Group has acquired a minority stake in an Indian travel, transportation and logistics software firm, IBS Software, for US$ 170 million, by buying the stake from General Atlantic and few other shareholders
20 IBEF - Industry Overview - IT in India (www.ibef.org/industry/information-technology-india.aspx)
CHANGING INVESTMENT SCENARIO
M&A Deals The IT space including e-commerce, witnessed 240 deals worth USD 3.8 Bn in 2014
Venture Funding India saw a ten-fold increase in the venture that went into internet companies in 2014 as compared to 2013.
Areas of Investment Companies such as Intel Corp plan to invest about USD 62 Mn in 16 technology companies in India working on wearable, Analytics and the Internet of Things (IoT) in 2015 alone
Start-up Support More than 800 internet start-ups got funding in 2014 as compared to 200 in 2012.
FDI Inflows The sector attracted cumulative FDI inflows of USD 5.3 Bn between Dec 2013 and June 2015
Analysis of Talent Demand and Supply 19
• India’s top-tier information technology (IT) company, Infosys Ltd, has bought a minority stake worth US$ 3 million in Whoop, which is a US-based start-up that makes activity trackers worn by athletes.
• Microsoft Ventures is planning to incubate 500 start-ups in India in the next five years with a vision to create a viable and profitable business out of the booming start-up sector in India.
• National Association of Software and Services Companies (NASSCOM) plans to open four more tech start-up incubation centres in different parts of India, in addition to existing three, in support of Government of India’s ‘Start-up India’ initiative.
• Infosys, India’s second largest Information Technology services company has acquired US-based Noah Consulting, a provider of advanced information management consulting services for the oil and gas industry.
• US-based Callidus Software Inc, a cloud-based sales, marketing, learning and customer experience solutions provider, has opened its centre in Hyderabad and also launched its ‘The Lead to Money’ suite in Indian markets.
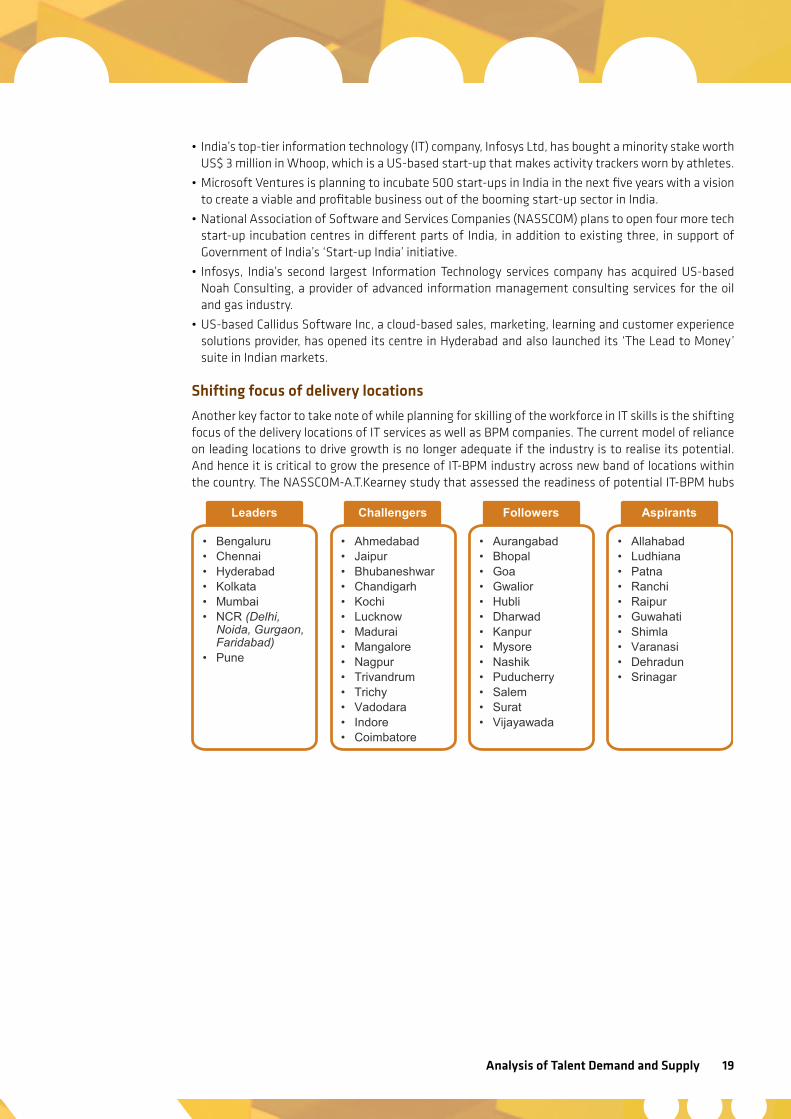
Shifting focus of delivery locations
Another key factor to take note of while planning for skilling of the workforce in IT skills is the shifting focus of the delivery locations of IT services as well as BPM companies. The current model of reliance on leading locations to drive growth is no longer adequate if the industry is to realise its potential. And hence it is critical to grow the presence of IT-BPM industry across new band of locations within the country. The NASSCOM-A.T.Kearney study that assessed the readiness of potential IT-BPM hubs
Leaders
• Bengaluru • Chennai • Hyderabad • Kolkata • Mumbai • NCR (Delhi,
Noida, Gurgaon, Faridabad)
• Pune
Challengers
• Ahmedabad • Jaipur • Bhubaneshwar • Chandigarh • Kochi • Lucknow • Madurai • Mangalore • Nagpur • Trivandrum • Trichy • Vadodara • Indore • Coimbatore
Followers
• Aurangabad • Bhopal • Goa • Gwalior • Hubli • Dharwad • Kanpur • Mysore • Nashik • Puducherry • Salem • Surat • Vijayawada
Aspirants
• Allahabad • Ludhiana • Patna • Ranchi • Raipur • Guwahati • Shimla • Varanasi • Dehradun • Srinagar
20
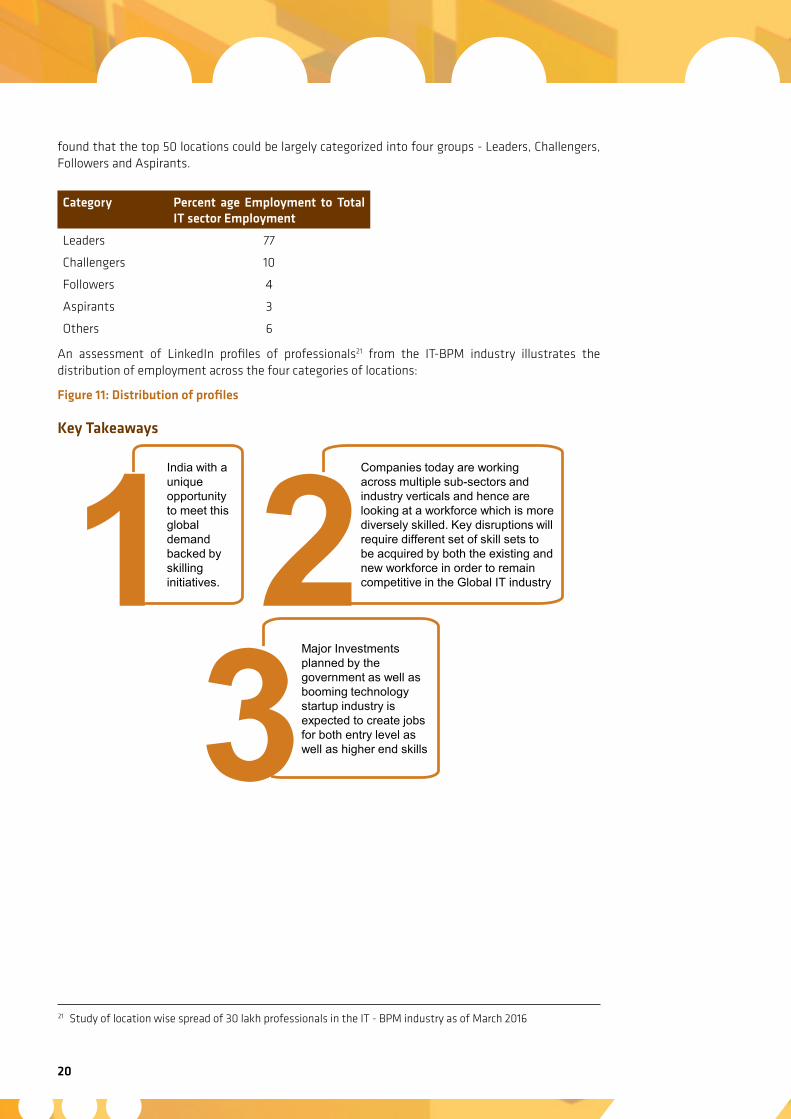
found that the top 50 locations could be largely categorized into four groups - Leaders, Challengers, Followers and Aspirants.
An assessment of LinkedIn profiles of professionals21 from the IT-BPM industry illustrates the distribution of employment across the four categories of locations:
Figure 11: Distribution of profiles
Key Takeaways
Category Percent age Employment to Total IT sector Employment
Leaders 77
Challengers 10
Followers 4
Aspirants 3
Others 6
21 Study of location wise spread of 30 lakh professionals in the IT - BPM industry as of March 2016
India with a unique opportunity to meet this global demand backed by skilling initiatives. 1
Companies today are working across multiple sub-sectors and industry verticals and hence are looking at a workforce which is more diversely skilled. Key disruptions will require different set of skill sets to be acquired by both the existing and new workforce in order to remain competitive in the Global IT industry 2
Major Investments planned by the government as well as booming technology startup industry is expected to create jobs for both entry level as well as higher end skills 3
Analysis of Talent Demand and Supply 21
Analysis of Demand for TalentOverview of Indian IT Industry
The Indian IT industry gained significant market share growing at 20% CAGR over the FY 2003-15 period. This growth is attributed to the global delivery model which lent the Indian IT players a cost arbitrage advantage to Indian IT players. Over time, the industry has matured capturing 56% of the outsourced global IT spends overall growth has slowed down as the industry matures.
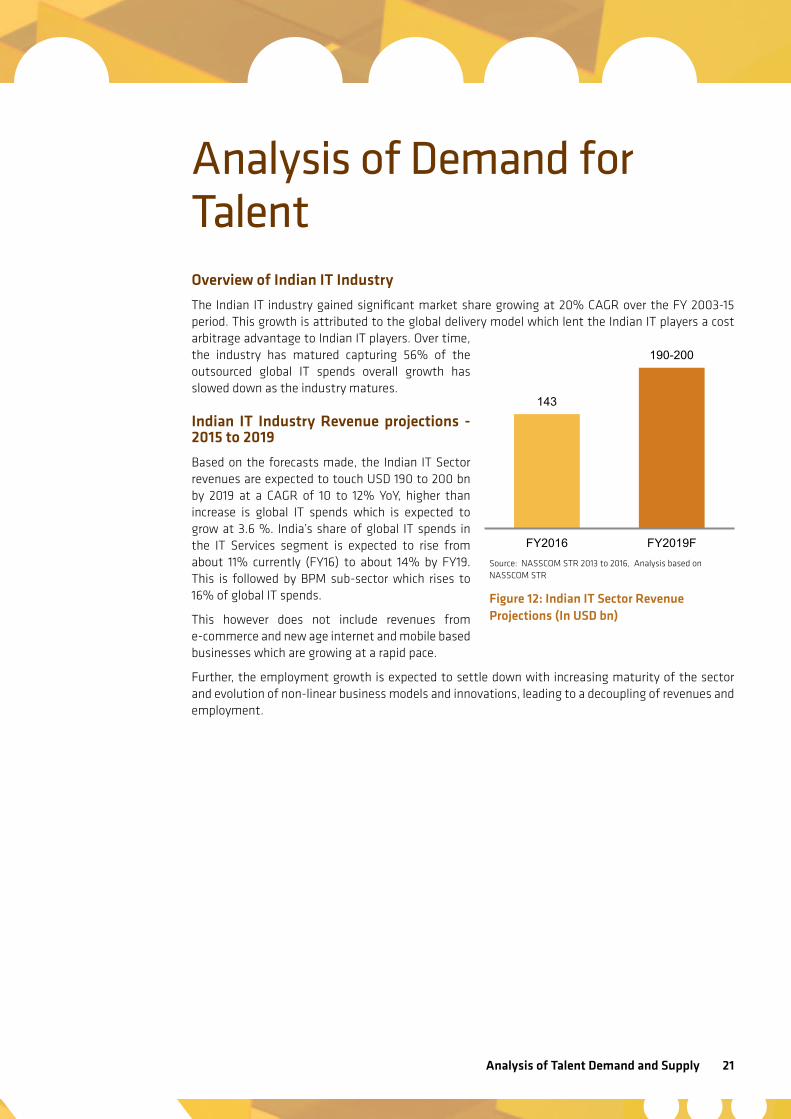
Indian IT Industry Revenue projections - 2015 to 2019
Based on the forecasts made, the Indian IT Sector revenues are expected to touch USD 190 to 200 bn by 2019 at a CAGR of 10 to 12% YoY, higher than increase is global IT spends which is expected to grow at 3.6 %. India’s share of global IT spends in the IT Services segment is expected to rise from about 11% currently (FY16) to about 14% by FY19. This is followed by BPM sub-sector which rises to 16% of global IT spends.
This however does not include revenues from e-commerce and new age internet and mobile based businesses which are growing at a rapid pace.
Further, the employment growth is expected to settle down with increasing maturity of the sector and evolution of non-linear business models and innovations, leading to a decoupling of revenues and employment.
Source: NASSCOM STR 2013 to 2016, Analysis based on NASSCOM STR
Figure 12: Indian IT Sector Revenue Projections (In USD bn)
143
190-200
FY2016 FY2019F
22
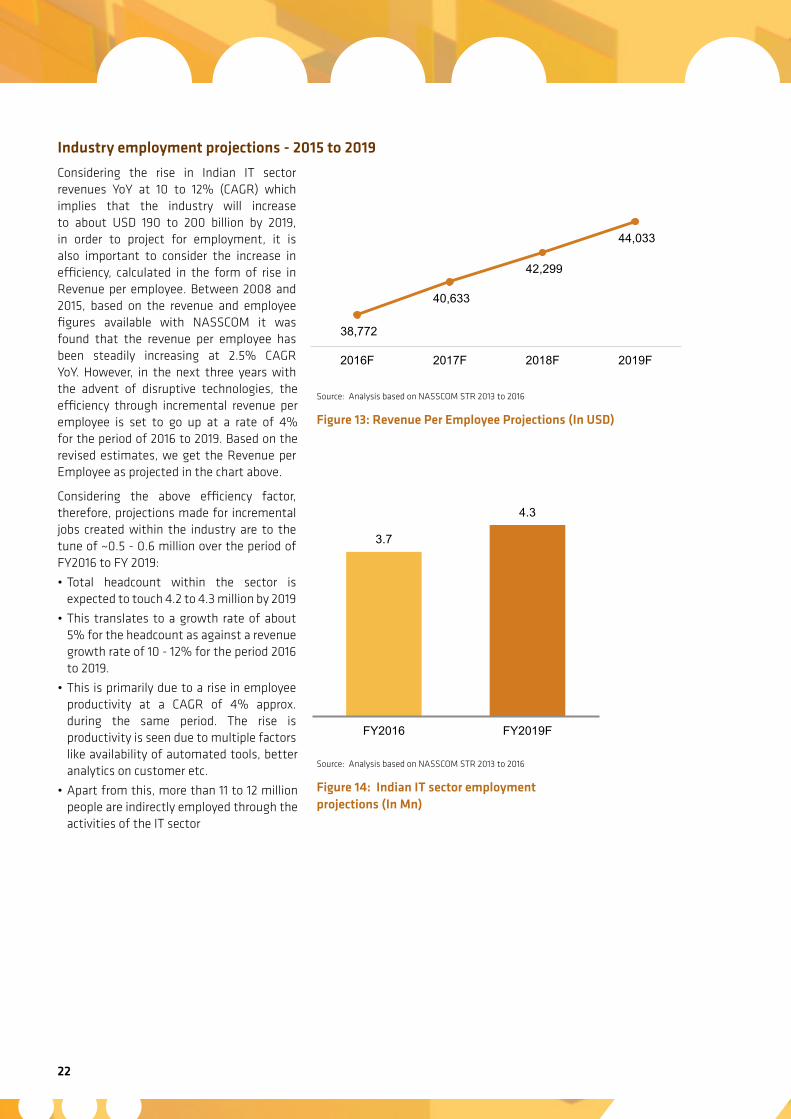
Industry employment projections - 2015 to 2019
Considering the rise in Indian IT sector revenues YoY at 10 to 12% (CAGR) which implies that the industry will increase to about USD 190 to 200 billion by 2019, in order to project for employment, it is also important to consider the increase in efficiency, calculated in the form of rise in Revenue per employee. Between 2008 and 2015, based on the revenue and employee figures available with NASSCOM it was found that the revenue per employee has been steadily increasing at 2.5% CAGR YoY. However, in the next three years with the advent of disruptive technologies, the efficiency through incremental revenue per employee is set to go up at a rate of 4% for the period of 2016 to 2019. Based on the revised estimates, we get the Revenue per Employee as projected in the chart above.
Considering the above efficiency factor, therefore, projections made for incremental jobs created within the industry are to the tune of ~0.5 - 0.6 million over the period of FY2016 to FY 2019:
• Total headcount within the sector is expected to touch 4.2 to 4.3 million by 2019
• This translates to a growth rate of about 5% for the headcount as against a revenue growth rate of 10 - 12% for the period 2016 to 2019.
• This is primarily due to a rise in employee productivity at a CAGR of 4% approx. during the same period. The rise is productivity is seen due to multiple factors like availability of automated tools, better analytics on customer etc.
• Apart from this, more than 11 to 12 million people are indirectly employed through the activities of the IT sector
Source: Analysis based on NASSCOM STR 2013 to 2016
Figure 13: Revenue Per Employee Projections (In USD)
Source: Analysis based on NASSCOM STR 2013 to 2016
Figure 14: Indian IT sector employment projections (In Mn)
38,772
40,633
42,299
44,033
2016F 2017F 2018F 2019F
3.7
4.3
FY2016 FY2019F
Analysis of Talent Demand and Supply 23
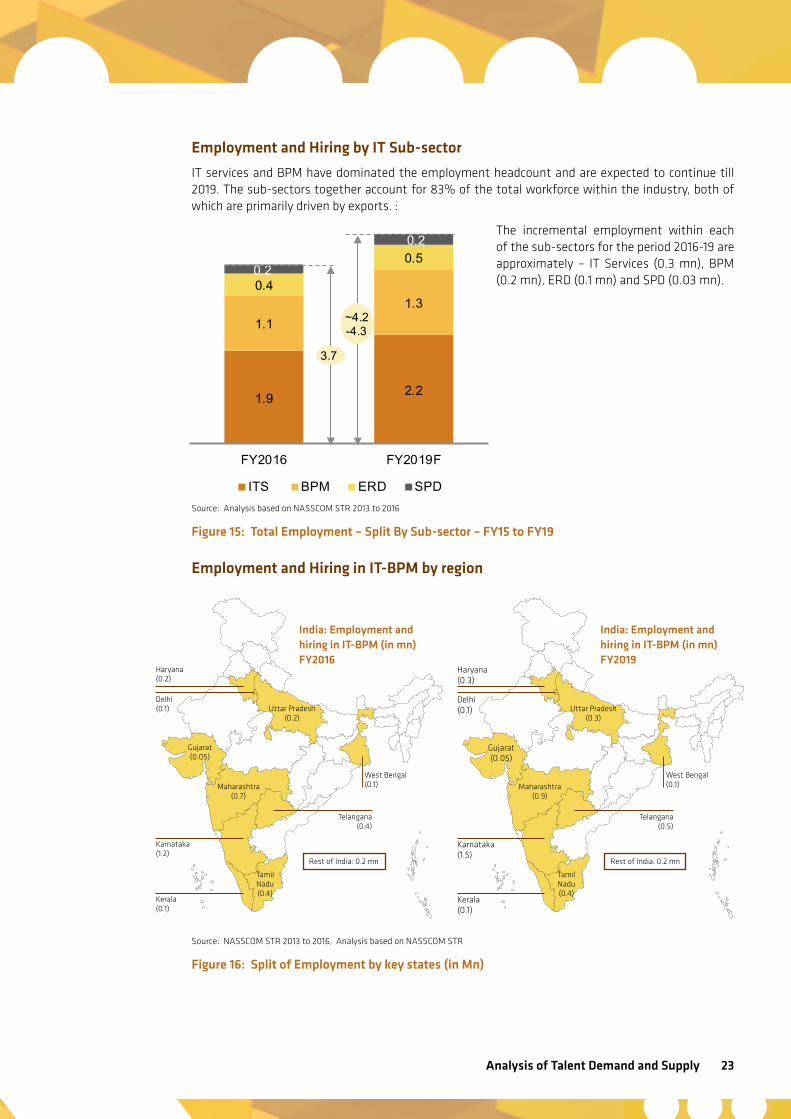
Employment and Hiring by IT Sub-sector
IT services and BPM have dominated the employment headcount and are expected to continue till 2019. The sub-sectors together account for 83% of the total workforce within the industry, both of which are primarily driven by exports. :
The incremental employment within each of the sub-sectors for the period 2016-19 are approximately – IT Services (0.3 mn), BPM (0.2 mn), ERD (0.1 mn) and SPD (0.03 mn).
Employment and Hiring in IT-BPM by region
Source: NASSCOM STR 2013 to 2016, Analysis based on NASSCOM STR
Figure 16: Split of Employment by key states (in Mn)
Source: Analysis based on NASSCOM STR 2013 to 2016
Figure 15: Total Employment – Split By Sub-sector – FY15 to FY19
Haryana (0.3)
Delhi (0.1)
Kerala (0.1)
Telangana (0.5)
Tamil Nadu (0.4)
Maharashtra (0.9)
Gujarat (0.05)
Karnataka(1.5)
Rest of India: 0.2 mn
India: Employment and hiring in IT-BPM (in mn) FY2019
Uttar Pradesh (0.3)
West Bengal (0.1)
Haryana (0.2)
Delhi (0.1)
Kerala (0.1)
Telangana (0.4)
Tamil Nadu (0.4)
Maharashtra (0.7)
Gujarat (0.05)
Karnataka(1.2)
Rest of India: 0.2 mn
India: Employment and hiring in IT-BPM (in mn) FY2016
Uttar Pradesh (0.2)
West Bengal (0.1)
1.9 2.2
1.11.3
0.4
0.50.2
0.2
FY2016 FY2019F
ITS BPM ERD SPD
3.7
~4.2-4.3
24
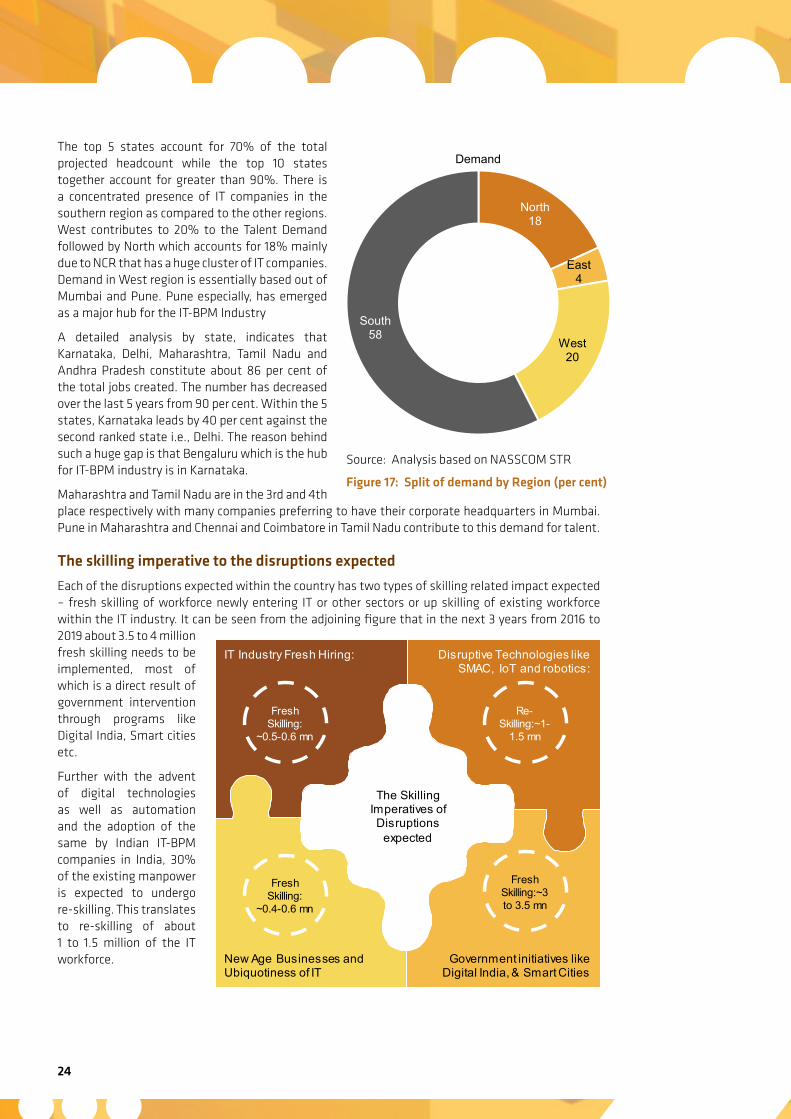
The top 5 states account for 70% of the total projected headcount while the top 10 states together account for greater than 90%. There is a concentrated presence of IT companies in the southern region as compared to the other regions. West contributes to 20% to the Talent Demand followed by North which accounts for 18% mainly due to NCR that has a huge cluster of IT companies. Demand in West region is essentially based out of Mumbai and Pune. Pune especially, has emerged as a major hub for the IT-BPM Industry
A detailed analysis by state, indicates that Karnataka, Delhi, Maharashtra, Tamil Nadu and Andhra Pradesh constitute about 86 per cent of the total jobs created. The number has decreased over the last 5 years from 90 per cent. Within the 5 states, Karnataka leads by 40 per cent against the second ranked state i.e., Delhi. The reason behind such a huge gap is that Bengaluru which is the hub for IT-BPM industry is in Karnataka.
Maharashtra and Tamil Nadu are in the 3rd and 4th place respectively with many companies preferring to have their corporate headquarters in Mumbai. Pune in Maharashtra and Chennai and Coimbatore in Tamil Nadu contribute to this demand for talent.
The skilling imperative to the disruptions expected
Each of the disruptions expected within the country has two types of skilling related impact expected – fresh skilling of workforce newly entering IT or other sectors or up skilling of existing workforce within the IT industry. It can be seen from the adjoining figure that in the next 3 years from 2016 to 2019 about 3.5 to 4 million fresh skilling needs to be implemented, most of which is a direct result of government intervention through programs like Digital India, Smart cities etc.
Further with the advent of digital technologies as well as automation and the adoption of the same by Indian IT-BPM companies in India, 30% of the existing manpower is expected to undergo re-skilling. This translates to re-skilling of about 1 to 1.5 million of the IT workforce.
Disruptive Technologies like SMAC, IoT and robotics:
Government initiatives like Digital India, & Smart Cities
New Age Businesses and Ubiquotiness of IT
IT Industry Fresh Hiring:
The Skilling Imperatives of Disruptions
expected
Fresh Skilling:
~0.5-0.6 mn
Re-Skilling:~1-
1.5 mn
Fresh Skilling:~3 to 3.5 mn
Fresh Skilling:
~0.4-0.6 mn
Source: Analysis based on NASSCOM STR
Figure 17: Split of demand by Region (per cent)
North 18
East 4
West 20
South 58
Demand
Analysis of Talent Demand and Supply 25
High Demand Occupations and New age Skills
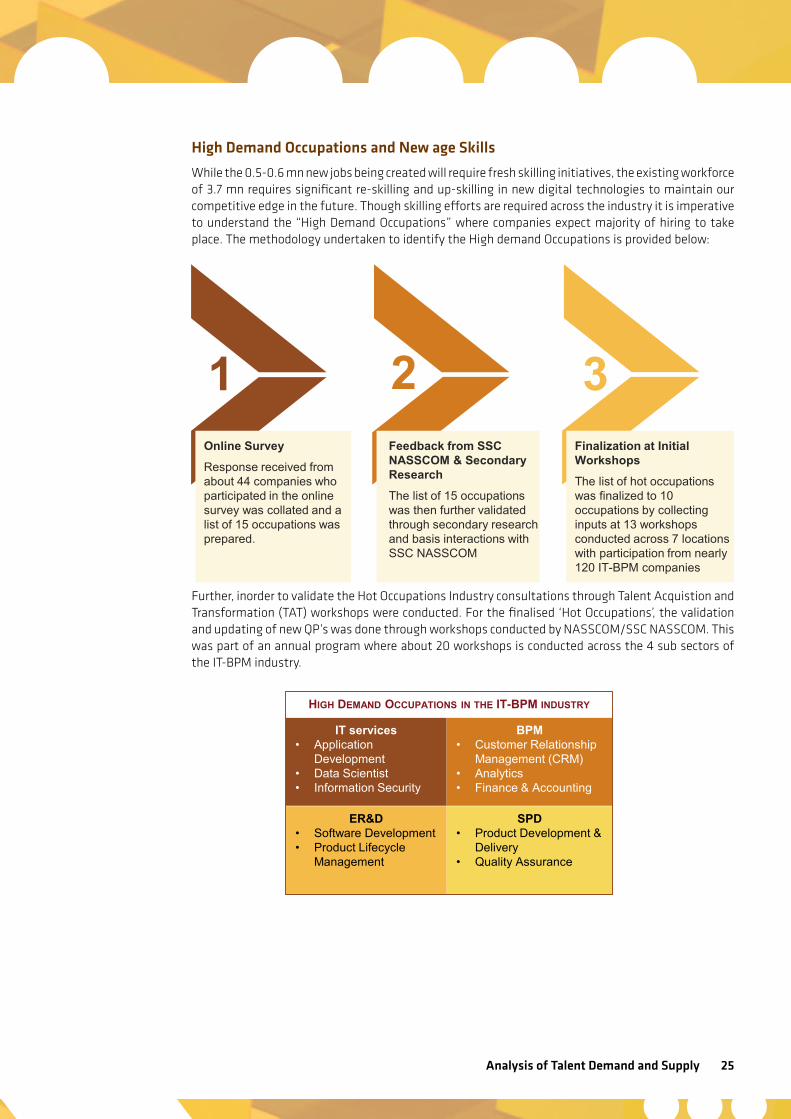
While the 0.5-0.6 mn new jobs being created will require fresh skilling initiatives, the existing workforce of 3.7 mn requires significant re-skilling and up-skilling in new digital technologies to maintain our competitive edge in the future. Though skilling efforts are required across the industry it is imperative to understand the “High Demand Occupations” where companies expect majority of hiring to take place. The methodology undertaken to identify the High demand Occupations is provided below:
Further, inorder to validate the Hot Occupations Industry consultations through Talent Acquistion and Transformation (TAT) workshops were conducted. For the finalised ‘Hot Occupations’, the validation and updating of new QP’s was done through workshops conducted by NASSCOM/SSC NASSCOM. This was part of an annual program where about 20 workshops is conducted across the 4 sub sectors of the IT-BPM industry.
IT services • Application
Development • Data Scientist • Information Security
SPD
• Product Development & Delivery
• Quality Assurance
ER&D • Software Development • Product Lifecycle
Management
BPM • Customer Relationship
Management (CRM) • Analytics • Finance & Accounting
HIGH DEMAND OCCUPATIONS IN THE IT-BPM INDUSTRY
Online Survey Response received from about 44 companies who participated in the online survey was collated and a list of 15 occupations was prepared.
1 Feedback from SSC NASSCOM & Secondary Research The list of 15 occupations was then further validated through secondary research and basis interactions with SSC NASSCOM
Finalization at Initial Workshops The list of hot occupations was finalized to 10 occupations by collecting inputs at 13 workshops conducted across 7 locations with participation from nearly 120 IT-BPM companies
2 3
26
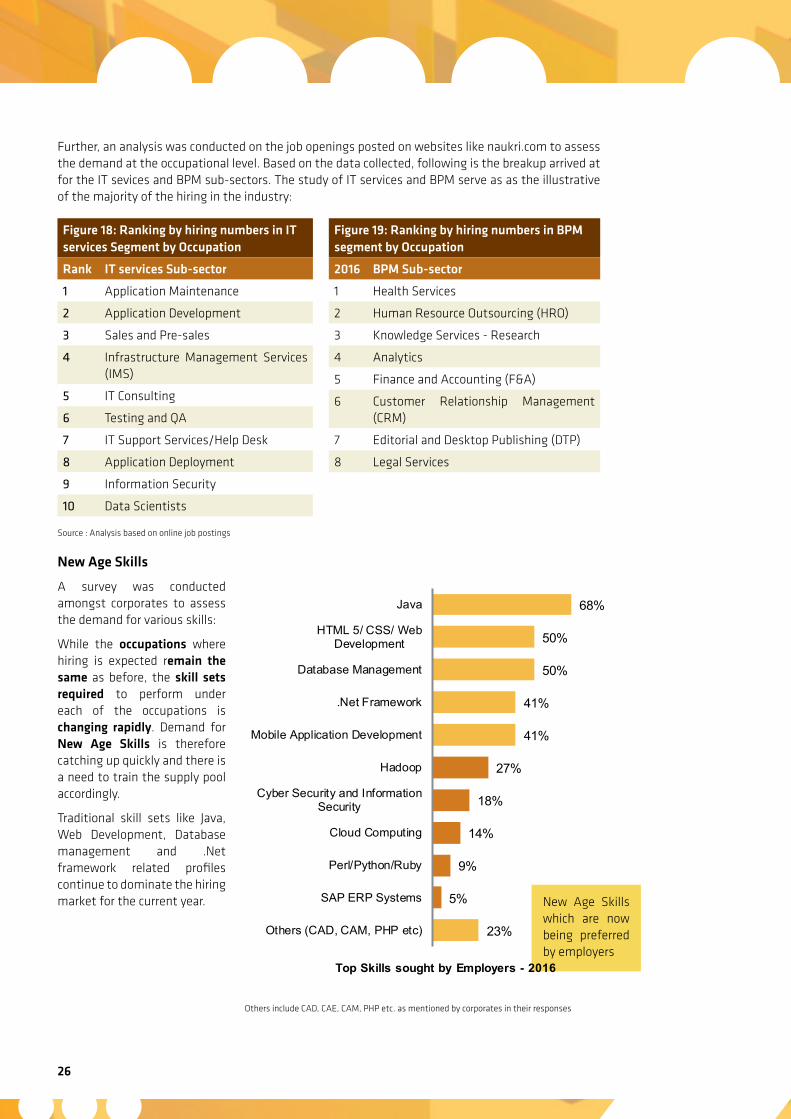
Further, an analysis was conducted on the job openings posted on websites like naukri.com to assess the demand at the occupational level. Based on the data collected, following is the breakup arrived at for the IT sevices and BPM sub-sectors. The study of IT services and BPM serve as as the illustrative of the majority of the hiring in the industry:
Source : Analysis based on online job postings
New Age Skills
A survey was conducted amongst corporates to assess the demand for various skills:
While the occupations where hiring is expected remain the same as before, the skill sets required to perform under each of the occupations is changing rapidly. Demand for New Age Skills is therefore catching up quickly and there is a need to train the supply pool accordingly.
Traditional skill sets like Java, Web Development, Database management and .Net framework related profiles continue to dominate the hiring market for the current year.
Figure 18: Ranking by hiring numbers in IT services Segment by Occupation
Rank IT services Sub-sector
1 Application Maintenance
2 Application Development
3 Sales and Pre-sales
4 Infrastructure Management Services (IMS)
5 IT Consulting
6 Testing and QA
7 IT Support Services/Help Desk
8 Application Deployment
9 Information Security
10 Data Scientists
Figure 19: Ranking by hiring numbers in BPM segment by Occupation
2016 BPM Sub-sector
1 Health Services
2 Human Resource Outsourcing (HRO)
3 Knowledge Services - Research
4 Analytics
5 Finance and Accounting (F&A)
6 Customer Relationship Management (CRM)
7 Editorial and Desktop Publishing (DTP)
8 Legal Services
Others include CAD, CAE, CAM, PHP etc. as mentioned by corporates in their responses
New Age Skills which are now being preferred by employers
23%
5%
9%
14%
18%
27%
41%
41%
50%
50%
68%
Others (CAD, CAM, PHP etc)
SAP ERP Systems
Perl/Python/Ruby
Cloud Computing
Cyber Security and InformationSecurity
Hadoop
Mobile Application Development
.Net Framework
Database Management
HTML 5/ CSS/ WebDevelopment
Java
Top Skills sought by Employers - 2016

Analysis of Talent Demand and Supply 27
Key Takeaways
About 0.5-0.6 mn direct jobs are expected to be created within the industry for which fresh skilling initiatives need to be prepared for. This will further also enhance indirect jobs which get created as a result of growing IT-BPM industry1
While the occupations where hiring is expected remain the same as before, the skill sets required to perform under each of the occupations is changing rapidly. Demand for New Age Skills is therefore catching up quickly and there is a need to train the supply pool accordingly.2
28
Analysis of Supply of TalentOverview of the National Talent Supply
India has one of the world's largest education systems, which includes 1.3 million schools, over 35,000 higher educational institutions including colleges and universities. Over the last decade, the education market, especially the higher education sector, has witnessed massive expansion in terms of growth and enrolment.National focus on education, especially higher education, is not new. Many governments of the past have understood the pivotal role it plays in shaping a nation’s socio-economic makeup. In recent times, several big-ticket reforms and progressive initiatives have been ideated on and discussed to strengthen the sector and its preparedness for future opportunities.
The announcement by the Centre in the Union budget 2015 to establish new institutes of excellence including IIMs and IITs in the country, setting up of financing authority, extending additional funds for infrastructural development of institutions of national importance, amongst others, are expected to essay a new storyline for the higher education sector in the country. At the statelevel, the states of UP, Tamil Nadu, Maharashtra, amongst others are some of the leading states in terms of students enrolment in higher educational institutions. Five southern states led by Tamil Nadu and Karnataka accounts for almost 30 percent of total enrolments in the country.
Top ten states in India by Universities
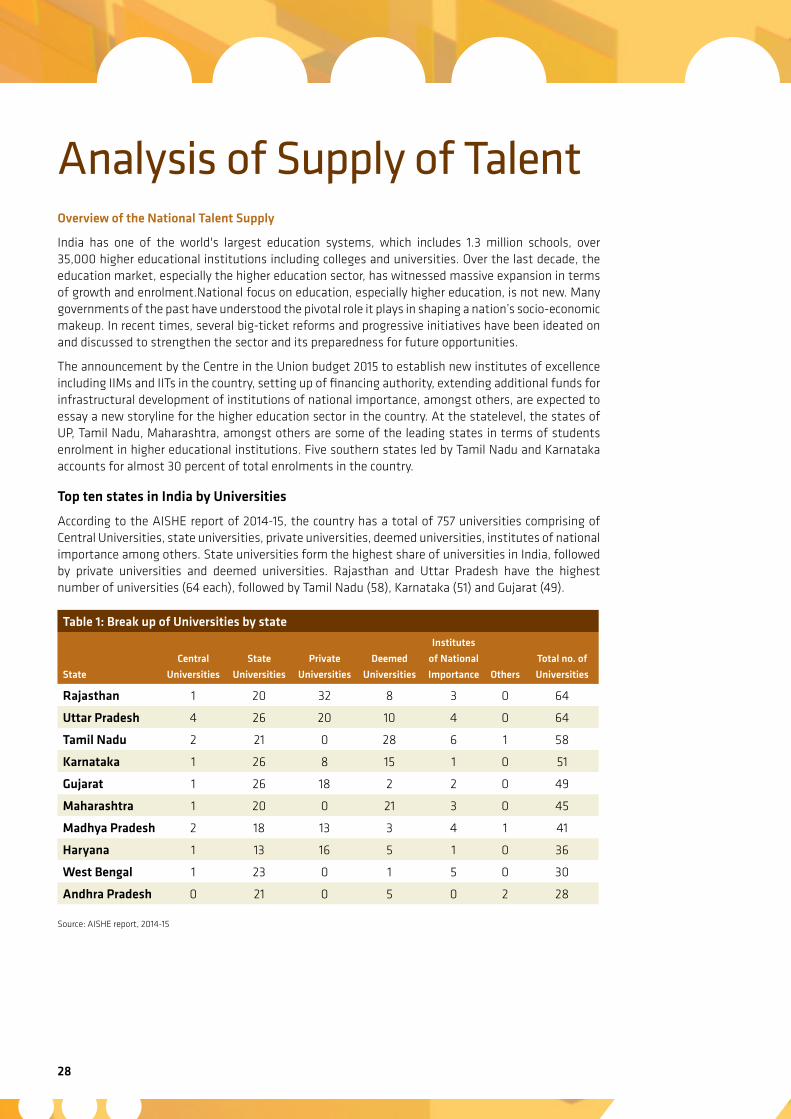
According to the AISHE report of 2014-15, the country has a total of 757 universities comprising of Central Universities, state universities, private universities, deemed universities, institutes of national importance among others. State universities form the highest share of universities in India, followed by private universities and deemed universities. Rajasthan and Uttar Pradesh have the highest number of universities (64 each), followed by Tamil Nadu (58), Karnataka (51) and Gujarat (49).
Source: AISHE report, 2014-15
Table 1: Break up of Universities by state
State
Central
Universities
State
Universities
Private
Universities
Deemed
Universities
Institutes
of National
Importance Others
Total no. of
Universities
Rajasthan 1 20 32 8 3 0 64
Uttar Pradesh 4 26 20 10 4 0 64
Tamil Nadu 2 21 0 28 6 1 58
Karnataka 1 26 8 15 1 0 51
Gujarat 1 26 18 2 2 0 49
Maharashtra 1 20 0 21 3 0 45
Madhya Pradesh 2 18 13 3 4 1 41
Haryana 1 13 16 5 1 0 36
West Bengal 1 23 0 1 5 0 30
Andhra Pradesh 0 21 0 5 0 2 28
Analysis of Talent Demand and Supply 29
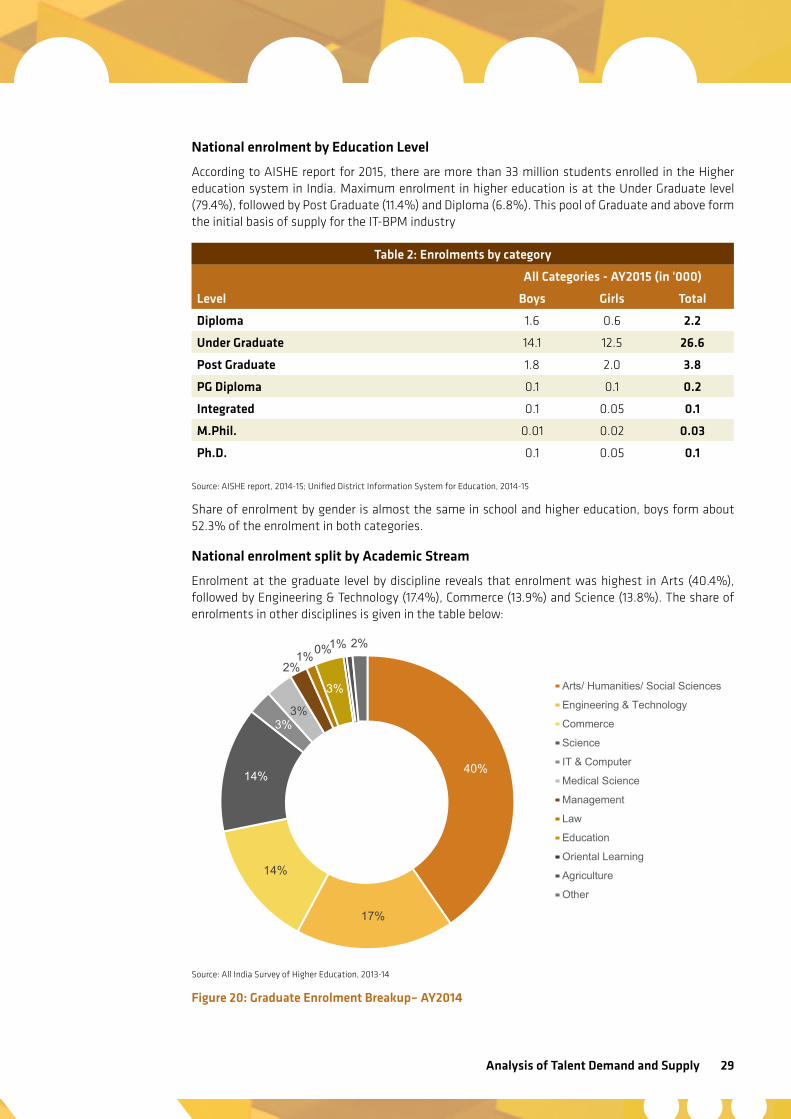
National enrolment by Education Level
According to AISHE report for 2015, there are more than 33 million students enrolled in the Higher education system in India. Maximum enrolment in higher education is at the Under Graduate level (79.4%), followed by Post Graduate (11.4%) and Diploma (6.8%). This pool of Graduate and above form the initial basis of supply for the IT-BPM industry
Source: AISHE report, 2014-15; Unified District Information System for Education, 2014-15
Share of enrolment by gender is almost the same in school and higher education, boys form about 52.3% of the enrolment in both categories.
National enrolment split by Academic Stream
Enrolment at the graduate level by discipline reveals that enrolment was highest in Arts (40.4%), followed by Engineering & Technology (17.4%), Commerce (13.9%) and Science (13.8%). The share of enrolments in other disciplines is given in the table below:
Source: All India Survey of Higher Education, 2013-14
Figure 20: Graduate Enrolment Breakup– AY2014
Table 2: Enrolments by category
All Categories - AY2015 (in '000)
Level Boys Girls Total
Diploma 1.6 0.6 2.2
Under Graduate 14.1 12.5 26.6
Post Graduate 1.8 2.0 3.8
PG Diploma 0.1 0.1 0.2
Integrated 0.1 0.05 0.1
M.Phil. 0.01 0.02 0.03
Ph.D. 0.1 0.05 0.1
40%
17%
14%
14%
3% 3%
2% 1%
3%
0% 1% 2%
Arts/ Humanities/ Social Sciences
Engineering & Technology
Commerce
Science
IT & Computer
Medical Science
Management
Law
Education
Oriental Learning
Agriculture
Other
30
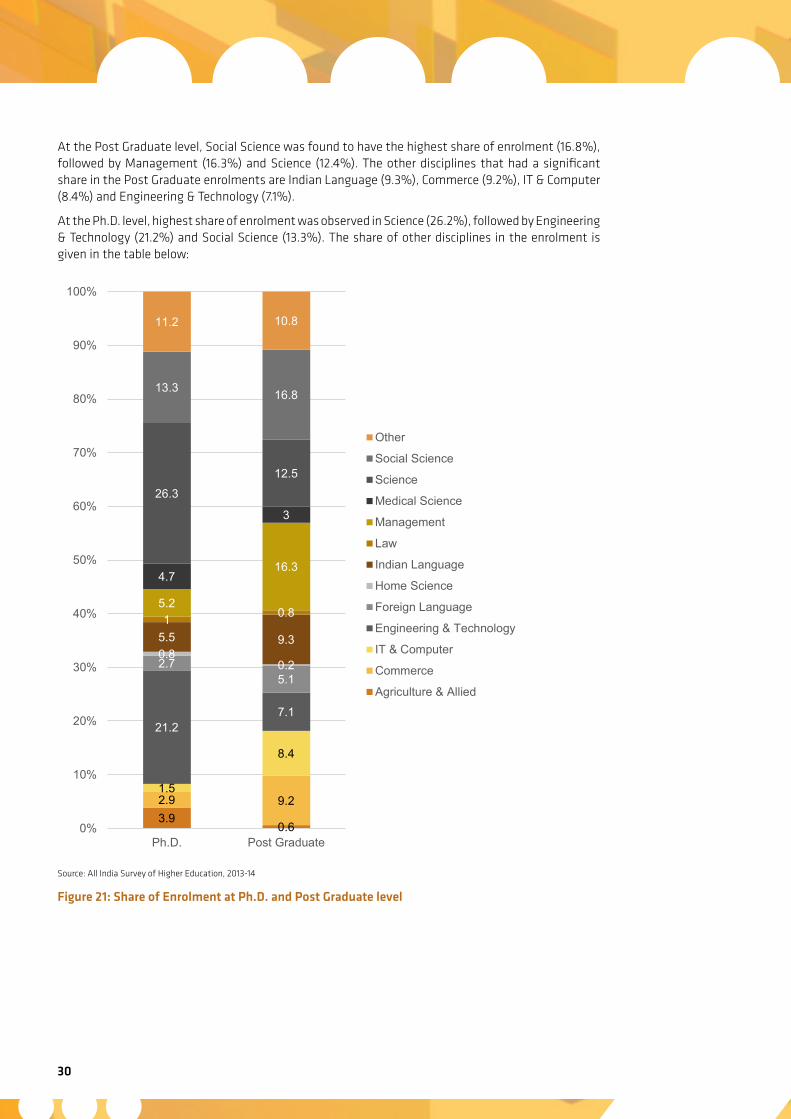
At the Post Graduate level, Social Science was found to have the highest share of enrolment (16.8%), followed by Management (16.3%) and Science (12.4%). The other disciplines that had a significant share in the Post Graduate enrolments are Indian Language (9.3%), Commerce (9.2%), IT & Computer (8.4%) and Engineering & Technology (7.1%).
At the Ph.D. level, highest share of enrolment was observed in Science (26.2%), followed by Engineering & Technology (21.2%) and Social Science (13.3%). The share of other disciplines in the enrolment is given in the table below:
Source: All India Survey of Higher Education, 2013-14
Figure 21: Share of Enrolment at Ph.D. and Post Graduate level
3.9 0.6
2.9 9.2 1.5
8.4
21.2 7.1
2.7 5.1
0.8 0.2
5.5 9.3 1 0.8
5.2
16.3 4.7
3
26.3 12.5
13.3 16.8
11.2 10.8
0%
10%
20%
30%
40%
50%
60%
70%
80%
90%
100%
Ph.D. Post Graduate
Other
Social Science
Science
Medical Science
Management
Law
Indian Language
Home Science
Foreign Language
Engineering & Technology
IT & Computer
Commerce
Agriculture & Allied
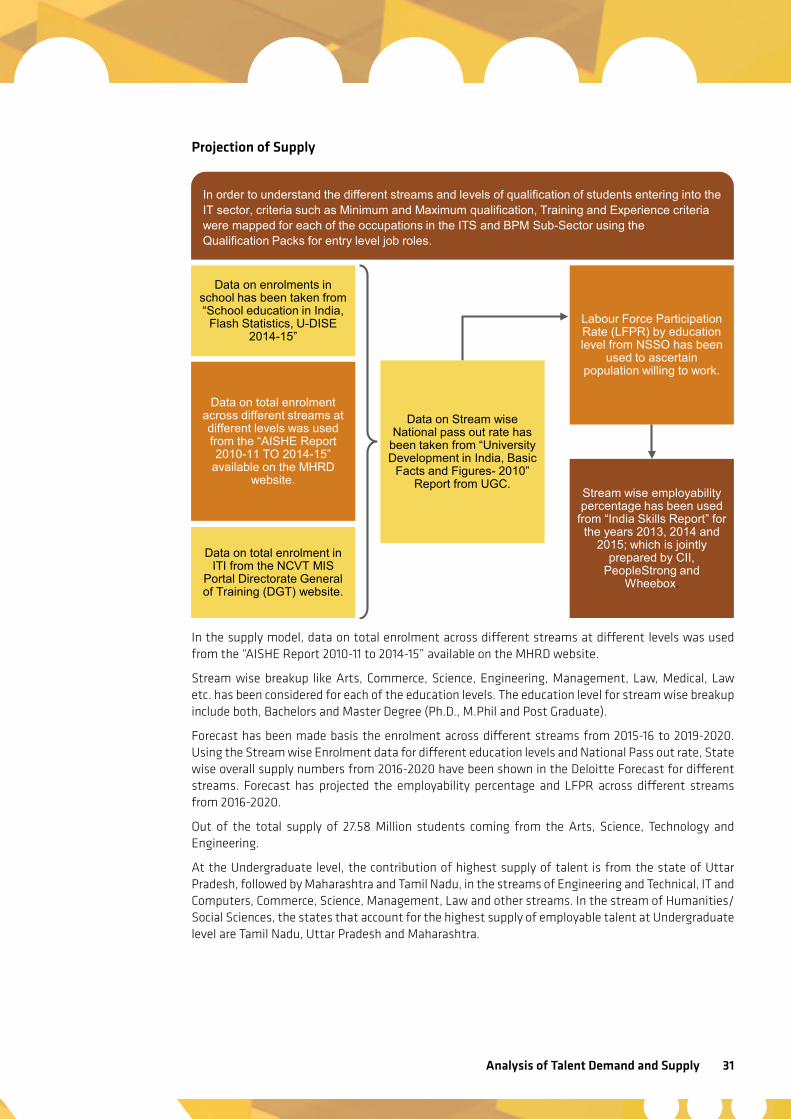
Analysis of Talent Demand and Supply 31
Projection of Supply
In the supply model, data on total enrolment across different streams at different levels was used from the “AISHE Report 2010-11 to 2014-15” available on the MHRD website.
Stream wise breakup like Arts, Commerce, Science, Engineering, Management, Law, Medical, Law etc. has been considered for each of the education levels. The education level for stream wise breakup include both, Bachelors and Master Degree (Ph.D., M.Phil and Post Graduate).
Forecast has been made basis the enrolment across different streams from 2015-16 to 2019-2020. Using the Stream wise Enrolment data for different education levels and National Pass out rate, State wise overall supply numbers from 2016-2020 have been shown in the Deloitte Forecast for different streams. Forecast has projected the employability percentage and LFPR across different streams from 2016-2020.
Out of the total supply of 27.58 Million students coming from the Arts, Science, Technology and Engineering.
At the Undergraduate level, the contribution of highest supply of talent is from the state of Uttar Pradesh, followed by Maharashtra and Tamil Nadu, in the streams of Engineering and Technical, IT and Computers, Commerce, Science, Management, Law and other streams. In the stream of Humanities/ Social Sciences, the states that account for the highest supply of employable talent at Undergraduate level are Tamil Nadu, Uttar Pradesh and Maharashtra.
In order to understand the different streams and levels of qualification of students entering into the IT sector, criteria such as Minimum and Maximum qualification, Training and Experience criteria were mapped for each of the occupations in the ITS and BPM Sub-Sector using the Qualification Packs for entry level job roles.
Data on enrolments in school has been taken from “School education in India,
Flash Statistics, U-DISE 2014-15”
Data on total enrolment across different streams at different levels was used from the “AISHE Report 2010-11 TO 2014-15”
available on the MHRD website.
Data on total enrolment in ITI from the NCVT MIS
Portal Directorate General of Training (DGT) website.
Data on Stream wise National pass out rate has
been taken from “University Development in India, Basic
Facts and Figures- 2010” Report from UGC.
Labour Force Participation Rate (LFPR) by education level from NSSO has been
used to ascertain population willing to work.
Stream wise employability percentage has been used
from “India Skills Report” for the years 2013, 2014 and
2015; which is jointly prepared by CII,
PeopleStrong and Wheebox.
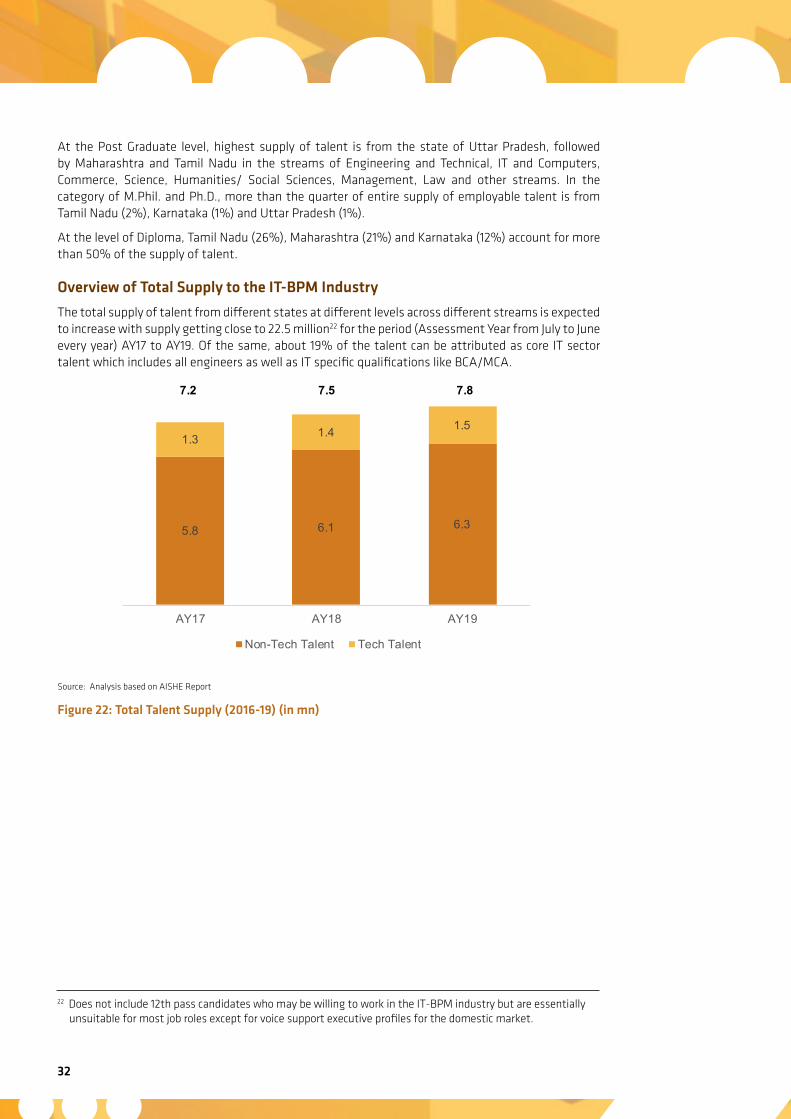
32
At the Post Graduate level, highest supply of talent is from the state of Uttar Pradesh, followed by Maharashtra and Tamil Nadu in the streams of Engineering and Technical, IT and Computers, Commerce, Science, Humanities/ Social Sciences, Management, Law and other streams. In the category of M.Phil. and Ph.D., more than the quarter of entire supply of employable talent is from Tamil Nadu (2%), Karnataka (1%) and Uttar Pradesh (1%).
At the level of Diploma, Tamil Nadu (26%), Maharashtra (21%) and Karnataka (12%) account for more than 50% of the supply of talent.
Overview of Total Supply to the IT-BPM Industry
The total supply of talent from different states at different levels across different streams is expected to increase with supply getting close to 22.5 million22 for the period (Assessment Year from July to June every year) AY17 to AY19. Of the same, about 19% of the talent can be attributed as core IT sector talent which includes all engineers as well as IT specific qualifications like BCA/MCA.
Source: Analysis based on AISHE Report
Figure 22: Total Talent Supply (2016-19) (in mn)
22 Does not include 12th pass candidates who may be willing to work in the IT-BPM industry but are essentially unsuitable for most job roles except for voice support executive profiles for the domestic market.
5.8 6.1 6.3
1.3 1.4 1.5
AY17 AY18 AY19
Non-Tech Talent Tech Talent
7.2 7.5 7.8
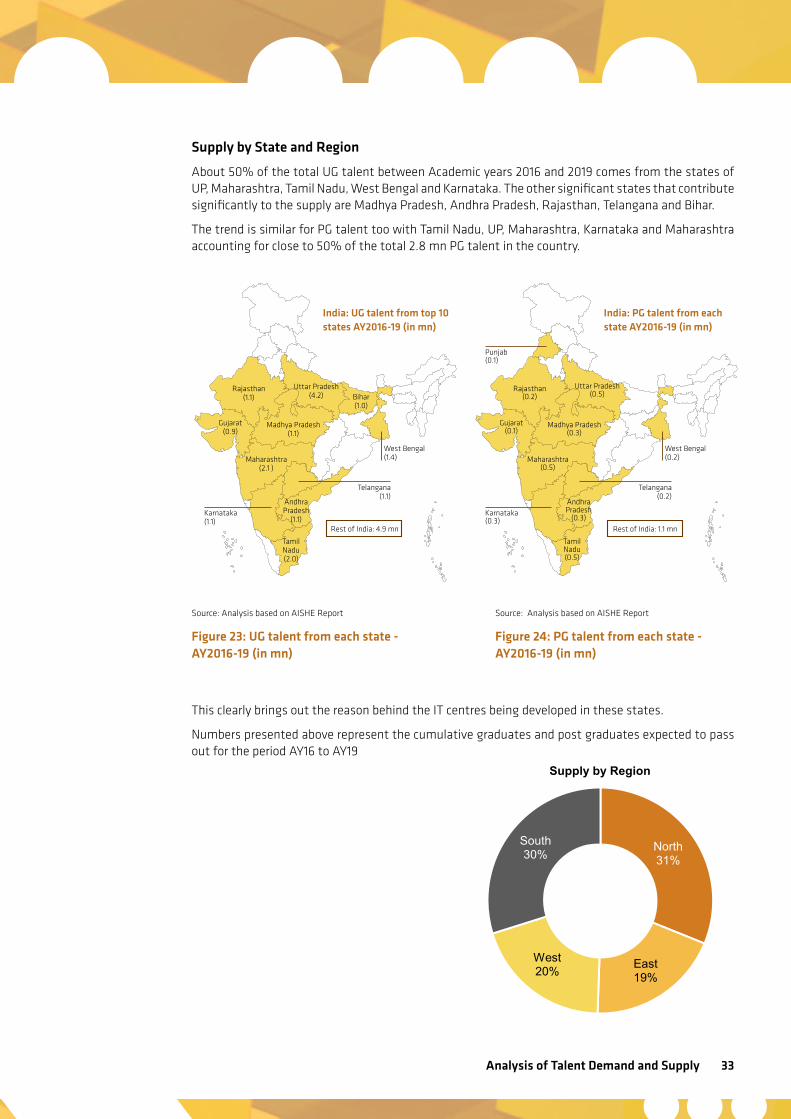
Analysis of Talent Demand and Supply 33
Supply by State and Region
About 50% of the total UG talent between Academic years 2016 and 2019 comes from the states of UP, Maharashtra, Tamil Nadu, West Bengal and Karnataka. The other significant states that contribute significantly to the supply are Madhya Pradesh, Andhra Pradesh, Rajasthan, Telangana and Bihar.
The trend is similar for PG talent too with Tamil Nadu, UP, Maharashtra, Karnataka and Maharashtra accounting for close to 50% of the total 2.8 mn PG talent in the country.
This clearly brings out the reason behind the IT centres being developed in these states.
Numbers presented above represent the cumulative graduates and post graduates expected to pass out for the period AY16 to AY19
Source: Analysis based on AISHE Report
Figure 23: UG talent from each state - AY2016-19 (in mn)
Source: Analysis based on AISHE Report
Figure 24: PG talent from each state - AY2016-19 (in mn)
North 31%
East 19%
West 20%
South 30%
Supply by Region
Telangana (1.1)
Tamil Nadu (2.0)
Maharashtra (2.1 )
Madhya Pradesh (1.1)
Andhra Pradesh
(1.1)
Gujarat (0.9)
Karnataka(1.1)
Rest of India: 4.9 mn
India: UG talent from top 10 states AY2016-19 (in mn)
Uttar Pradesh (4.2)
Rajasthan (1.1) Bihar
(1.0)
West Bengal (1.4)
Telangana (0.2)
Tamil Nadu (0.5)
Maharashtra (0.5)
Madhya Pradesh (0.3)
Andhra Pradesh
(0.3)
Gujarat (0.1)
Karnataka(0.3)
Punjab(0.1)
Rest of India: 1.1 mn
India: PG talent from each state AY2016-19 (in mn)
Uttar Pradesh (0.5)
Rajasthan (0.2)
West Bengal (0.2)
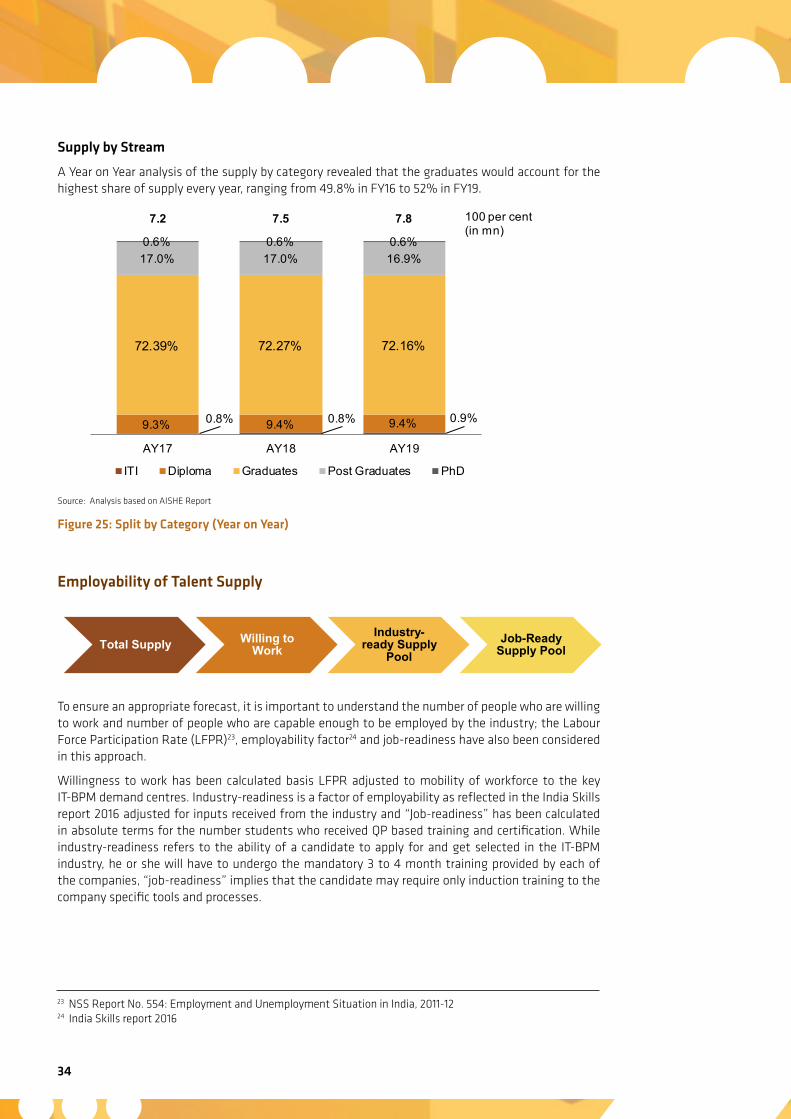
34
Supply by Stream
A Year on Year analysis of the supply by category revealed that the graduates would account for the highest share of supply every year, ranging from 49.8% in FY16 to 52% in FY19.
Source: Analysis based on AISHE Report
Figure 25: Split by Category (Year on Year)
Employability of Talent Supply
To ensure an appropriate forecast, it is important to understand the number of people who are willing to work and number of people who are capable enough to be employed by the industry; the Labour Force Participation Rate (LFPR)23, employability factor24 and job-readiness have also been considered in this approach.
Willingness to work has been calculated basis LFPR adjusted to mobility of workforce to the key IT-BPM demand centres. Industry-readiness is a factor of employability as reflected in the India Skills report 2016 adjusted for inputs received from the industry and “Job-readiness” has been calculated in absolute terms for the number students who received QP based training and certification. While industry-readiness refers to the ability of a candidate to apply for and get selected in the IT-BPM industry, he or she will have to undergo the mandatory 3 to 4 month training provided by each of the companies, “job-readiness” implies that the candidate may require only induction training to the company specific tools and processes.
Total Supply Willing to Work
Industry-ready Supply
Pool Job-Ready
Supply Pool
23 NSS Report No. 554: Employment and Unemployment Situation in India, 2011-1224 India Skills report 2016
0.8% 0.8% 0.9%9.3% 9.4% 9.4%
72.39% 72.27% 72.16%
17.0% 17.0% 16.9%0.6% 0.6% 0.6%
AY17 AY18 AY19
ITI Diploma Graduates Post Graduates PhD
7.5 7.87.2 100 per cent(in mn)
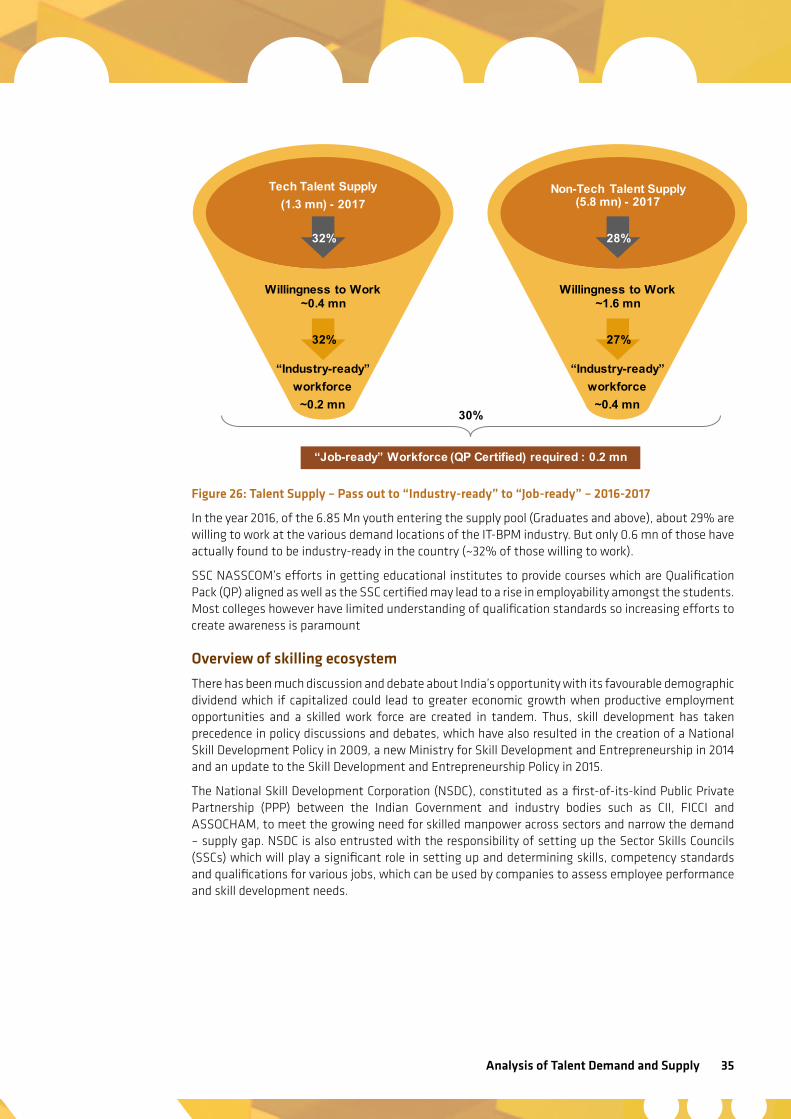
Analysis of Talent Demand and Supply 35
Figure 26: Talent Supply – Pass out to “Industry-ready” to “Job-ready” – 2016-2017
In the year 2016, of the 6.85 Mn youth entering the supply pool (Graduates and above), about 29% are willing to work at the various demand locations of the IT-BPM industry. But only 0.6 mn of those have actually found to be industry-ready in the country (~32% of those willing to work).
SSC NASSCOM’s efforts in getting educational institutes to provide courses which are Qualification Pack (QP) aligned as well as the SSC certified may lead to a rise in employability amongst the students. Most colleges however have limited understanding of qualification standards so increasing efforts to create awareness is paramount
Overview of skilling ecosystem
There has been much discussion and debate about India’s opportunity with its favourable demographic dividend which if capitalized could lead to greater economic growth when productive employment opportunities and a skilled work force are created in tandem. Thus, skill development has taken precedence in policy discussions and debates, which have also resulted in the creation of a National Skill Development Policy in 2009, a new Ministry for Skill Development and Entrepreneurship in 2014 and an update to the Skill Development and Entrepreneurship Policy in 2015.
The National Skill Development Corporation (NSDC), constituted as a first-of-its-kind Public Private Partnership (PPP) between the Indian Government and industry bodies such as CII, FICCI and ASSOCHAM, to meet the growing need for skilled manpower across sectors and narrow the demand – supply gap. NSDC is also entrusted with the responsibility of setting up the Sector Skills Councils (SSCs) which will play a significant role in setting up and determining skills, competency standards and qualifications for various jobs, which can be used by companies to assess employee performance and skill development needs.
Tech Talent Supply (1.3 mn) - 2017
Willingness to Work~0.4 mn
32%
“Job-ready” Workforce (QP Certified) required : 0.2 mn
30%
“Industry-ready” workforce
~0.2 mn
Non-Tech Talent Supply (5.8 mn) - 2017
Willingness to Work ~1.6 mn
28%
“Industry-ready” workforce
~0.4 mn
32% 27%
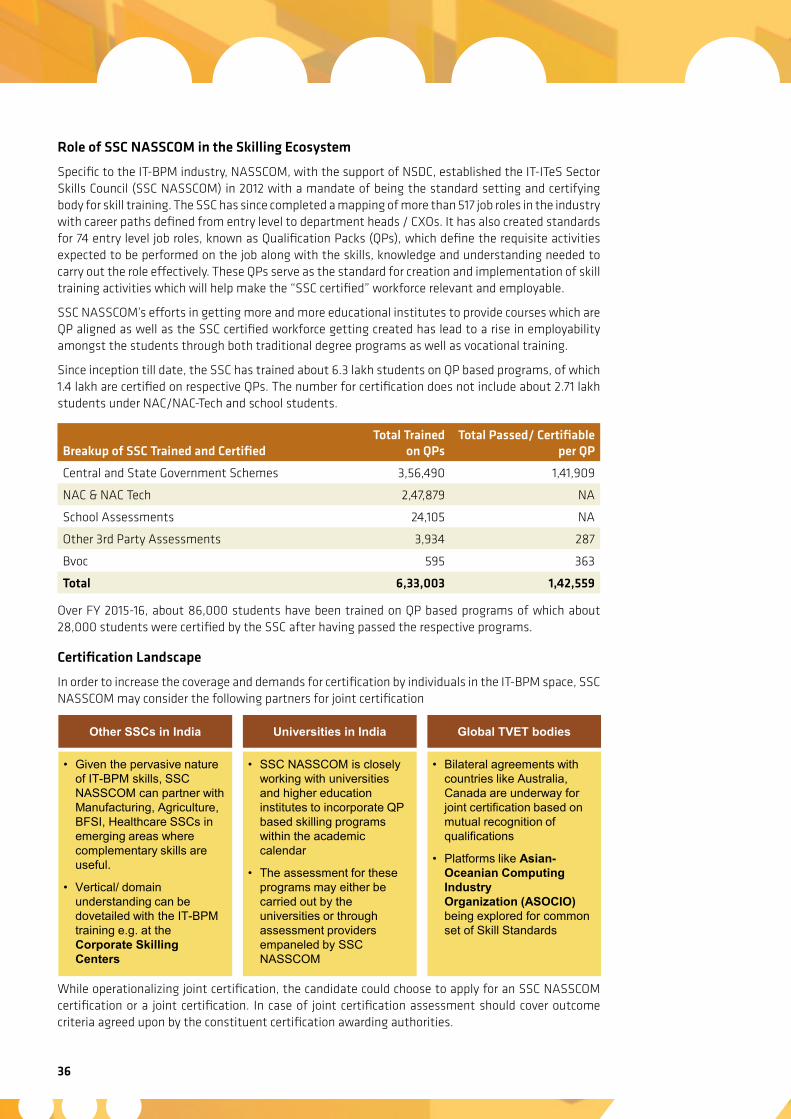
36
Role of SSC NASSCOM in the Skilling Ecosystem
Specific to the IT-BPM industry, NASSCOM, with the support of NSDC, established the IT-ITeS Sector Skills Council (SSC NASSCOM) in 2012 with a mandate of being the standard setting and certifying body for skill training. The SSC has since completed a mapping of more than 517 job roles in the industry with career paths defined from entry level to department heads / CXOs. It has also created standards for 74 entry level job roles, known as Qualification Packs (QPs), which define the requisite activities expected to be performed on the job along with the skills, knowledge and understanding needed to carry out the role effectively. These QPs serve as the standard for creation and implementation of skill training activities which will help make the “SSC certified” workforce relevant and employable.
SSC NASSCOM’s efforts in getting more and more educational institutes to provide courses which are QP aligned as well as the SSC certified workforce getting created has lead to a rise in employability amongst the students through both traditional degree programs as well as vocational training.
Since inception till date, the SSC has trained about 6.3 lakh students on QP based programs, of which 1.4 lakh are certified on respective QPs. The number for certification does not include about 2.71 lakh students under NAC/NAC-Tech and school students.
Over FY 2015-16, about 86,000 students have been trained on QP based programs of which about 28,000 students were certified by the SSC after having passed the respective programs.
Certification Landscape
In order to increase the coverage and demands for certification by individuals in the IT-BPM space, SSC NASSCOM may consider the following partners for joint certification
While operationalizing joint certification, the candidate could choose to apply for an SSC NASSCOM certification or a joint certification. In case of joint certification assessment should cover outcome criteria agreed upon by the constituent certification awarding authorities.
Breakup of SSC Trained and CertifiedTotal Trained
on QPsTotal Passed/ Certifiable
per QP
Central and State Government Schemes 3,56,490 1,41,909
NAC & NAC Tech 2,47,879 NA
School Assessments 24,105 NA
Other 3rd Party Assessments 3,934 287
Bvoc 595 363
Total 6,33,003 1,42,559
Other SSCs in India
• Given the pervasive nature of IT-BPM skills, SSC NASSCOM can partner with Manufacturing, Agriculture, BFSI, Healthcare SSCs in emerging areas where complementary skills are useful.
• Vertical/ domain understanding can be dovetailed with the IT-BPM training e.g. at the Corporate Skilling Centers
Universities in India
• SSC NASSCOM is closely working with universities and higher education institutes to incorporate QP based skilling programs within the academic calendar
• The assessment for these programs may either be carried out by the universities or through assessment providers empaneled by SSC NASSCOM
Global TVET bodies
• Bilateral agreements with countries like Australia, Canada are underway for joint certification based on mutual recognition of qualifications
• Platforms like Asian-Oceanian Computing Industry Organization (ASOCIO) being explored for common set of Skill Standards
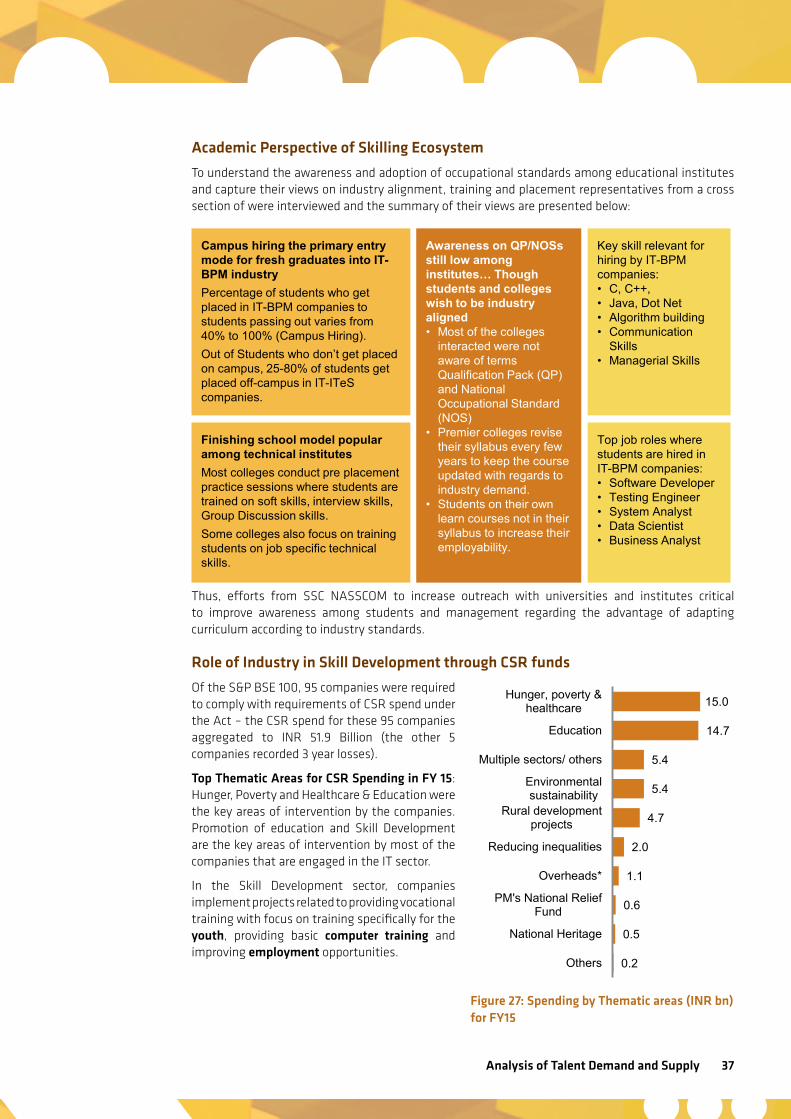
Analysis of Talent Demand and Supply 37
Academic Perspective of Skilling Ecosystem
To understand the awareness and adoption of occupational standards among educational institutes and capture their views on industry alignment, training and placement representatives from a cross section of were interviewed and the summary of their views are presented below:
Thus, efforts from SSC NASSCOM to increase outreach with universities and institutes critical to improve awareness among students and management regarding the advantage of adapting curriculum according to industry standards.
Role of Industry in Skill Development through CSR funds
Of the S&P BSE 100, 95 companies were required to comply with requirements of CSR spend under the Act – the CSR spend for these 95 companies aggregated to INR 51.9 Billion (the other 5 companies recorded 3 year losses).
Top Thematic Areas for CSR Spending in FY 15: Hunger, Poverty and Healthcare & Education were the key areas of intervention by the companies. Promotion of education and Skill Development are the key areas of intervention by most of the companies that are engaged in the IT sector.
In the Skill Development sector, companies implement projects related to providing vocational training with focus on training specifically for the youth, providing basic computer training and improving employment opportunities.
Key skill relevant for hiring by IT-BPM companies: • C, C++, • Java, Dot Net • Algorithm building • Communication
Skills • Managerial Skills
Top job roles where students are hired in IT-BPM companies: • Software Developer • Testing Engineer • System Analyst • Data Scientist • Business Analyst
Awareness on QP/NOSs still low among institutes… Though students and colleges wish to be industry aligned • Most of the colleges
interacted were not aware of terms Qualification Pack (QP) and National Occupational Standard (NOS)
• Premier colleges revise their syllabus every few years to keep the course updated with regards to industry demand.
• Students on their own learn courses not in their syllabus to increase their employability.
Finishing school model popular among technical institutes Most colleges conduct pre placement practice sessions where students are trained on soft skills, interview skills, Group Discussion skills. Some colleges also focus on training students on job specific technical skills.
Campus hiring the primary entry mode for fresh graduates into IT-BPM industry Percentage of students who get placed in IT-BPM companies to students passing out varies from 40% to 100% (Campus Hiring). Out of Students who don’t get placed on campus, 25-80% of students get placed off-campus in IT-ITeS companies.
0.2
0.5
0.6
1.1
2.0
4.7
5.4
5.4
14.7
15.0
Others
National Heritage
PM's National ReliefFund
Overheads*
Reducing inequalities
Rural developmentprojects
Environmentalsustainability
Multiple sectors/ others
Education
Hunger, poverty &healthcare
Figure 27: Spending by Thematic areas (INR bn) for FY15
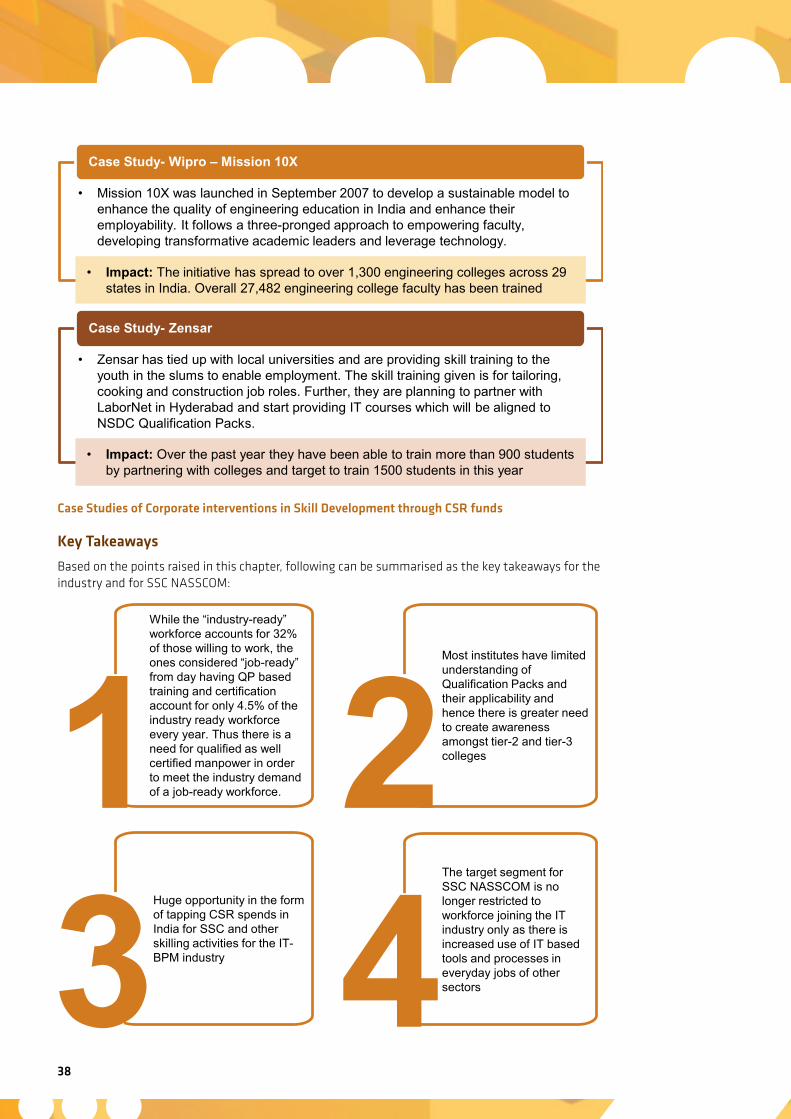
38
While the “industry-ready” workforce accounts for 32% of those willing to work, the ones considered “job-ready” from day having QP based training and certification account for only 4.5% of the industry ready workforce every year. Thus there is a need for qualified as well certified manpower in order to meet the industry demand of a job-ready workforce. 1
Most institutes have limited understanding of Qualification Packs and their applicability and hence there is greater need to create awareness amongst tier-2 and tier-3 colleges 2
Huge opportunity in the form of tapping CSR spends in India for SSC and other skilling activities for the IT-BPM industry 3
The target segment for SSC NASSCOM is no longer restricted to workforce joining the IT industry only as there is increased use of IT based tools and processes in everyday jobs of other sectors 4
Case Studies of Corporate interventions in Skill Development through CSR funds
Key Takeaways
Based on the points raised in this chapter, following can be summarised as the key takeaways for the industry and for SSC NASSCOM:
• Mission 10X was launched in September 2007 to develop a sustainable model to enhance the quality of engineering education in India and enhance their employability. It follows a three-pronged approach to empowering faculty, developing transformative academic leaders and leverage technology.
Case Study- Wipro – Mission 10X
• Impact: The initiative has spread to over 1,300 engineering colleges across 29 states in India. Overall 27,482 engineering college faculty has been trained
• Zensar has tied up with local universities and are providing skill training to the youth in the slums to enable employment. The skill training given is for tailoring, cooking and construction job roles. Further, they are planning to partner with LaborNet in Hyderabad and start providing IT courses which will be aligned to NSDC Qualification Packs.
Case Study- Zensar
• Impact: Over the past year they have been able to train more than 900 students by partnering with colleges and target to train 1500 students in this year
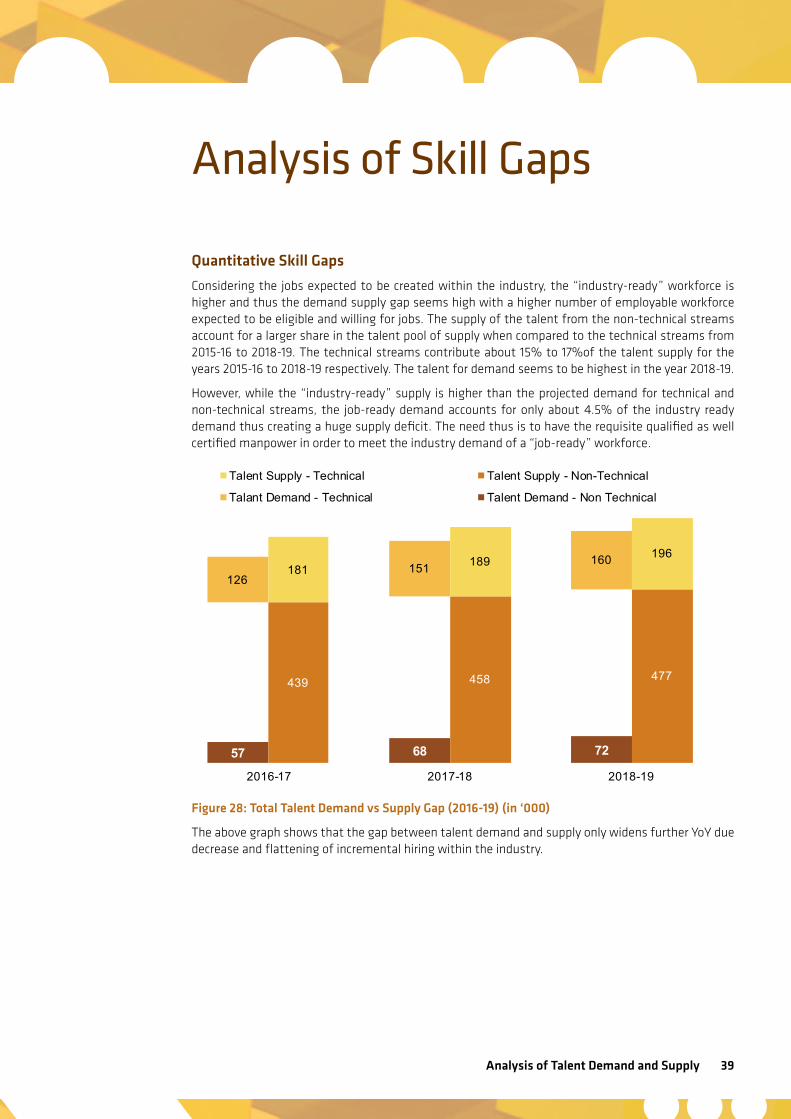
Analysis of Talent Demand and Supply 39
Analysis of Skill Gaps
Quantitative Skill Gaps
Considering the jobs expected to be created within the industry, the “industry-ready” workforce is higher and thus the demand supply gap seems high with a higher number of employable workforce expected to be eligible and willing for jobs. The supply of the talent from the non-technical streams account for a larger share in the talent pool of supply when compared to the technical streams from 2015-16 to 2018-19. The technical streams contribute about 15% to 17%of the talent supply for the years 2015-16 to 2018-19 respectively. The talent for demand seems to be highest in the year 2018-19.
However, while the “industry-ready” supply is higher than the projected demand for technical and non-technical streams, the job-ready demand accounts for only about 4.5% of the industry ready demand thus creating a huge supply deficit. The need thus is to have the requisite qualified as well certified manpower in order to meet the industry demand of a “job-ready” workforce.
Figure 28: Total Talent Demand vs Supply Gap (2016-19) (in ‘000)
The above graph shows that the gap between talent demand and supply only widens further YoY due decrease and flattening of incremental hiring within the industry.
57 68 72
126151
160
439 458 477
181189
196
Talent Supply - Technical Talent Supply - Non-Technical
Talant Demand - Technical Talent Demand - Non Technical
2016-17 2017-18 2018-19
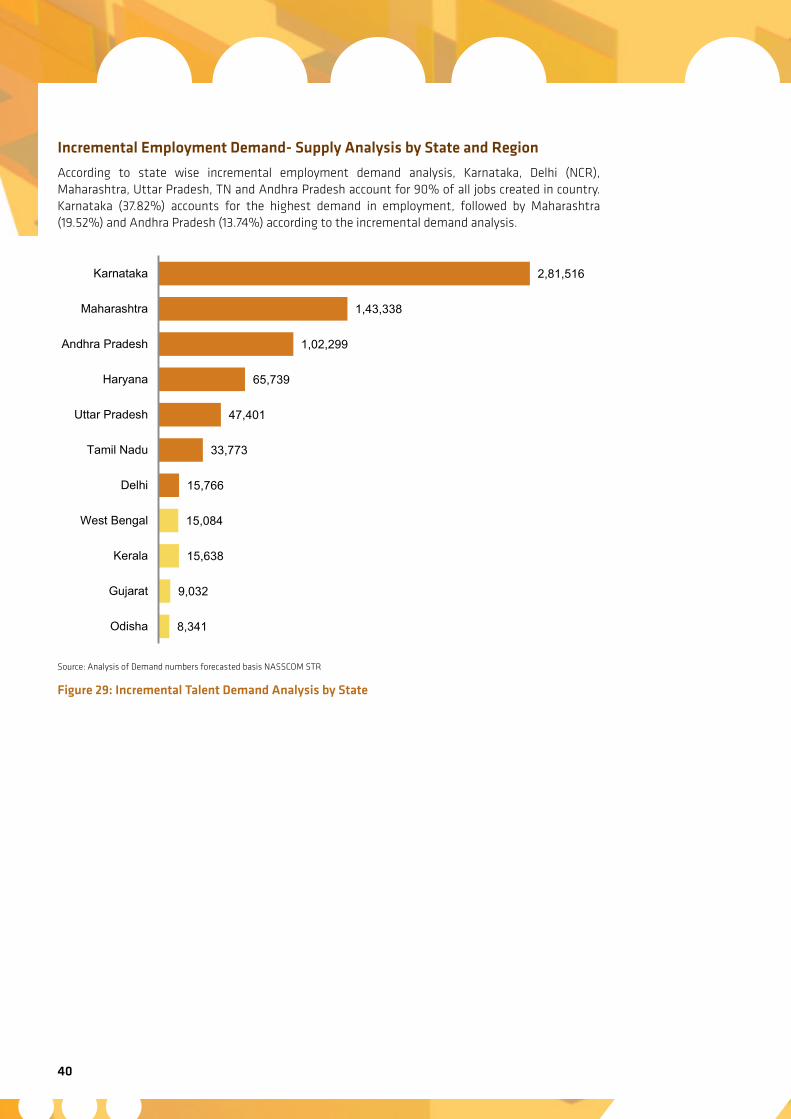
40
Incremental Employment Demand- Supply Analysis by State and Region
According to state wise incremental employment demand analysis, Karnataka, Delhi (NCR), Maharashtra, Uttar Pradesh, TN and Andhra Pradesh account for 90% of all jobs created in country. Karnataka (37.82%) accounts for the highest demand in employment, followed by Maharashtra (19.52%) and Andhra Pradesh (13.74%) according to the incremental demand analysis.
Source: Analysis of Demand numbers forecasted basis NASSCOM STR
Figure 29: Incremental Talent Demand Analysis by State
2,81,516
1,43,338
1,02,299
65,739
47,401
33,773
15,766
15,084
15,638
9,032
8,341
Karnataka
Maharashtra
Andhra Pradesh
Haryana
Uttar Pradesh
Tamil Nadu
Delhi
West Bengal
Kerala
Gujarat
Odisha
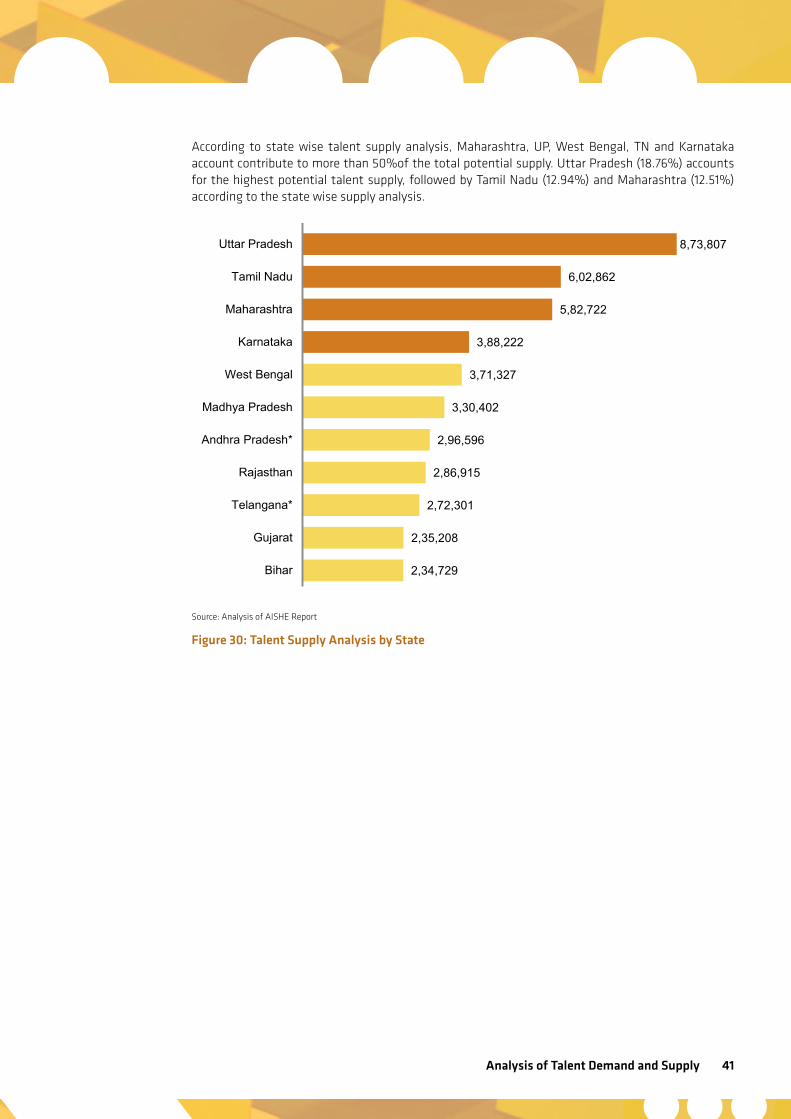
Analysis of Talent Demand and Supply 41
According to state wise talent supply analysis, Maharashtra, UP, West Bengal, TN and Karnataka account contribute to more than 50%of the total potential supply. Uttar Pradesh (18.76%) accounts for the highest potential talent supply, followed by Tamil Nadu (12.94%) and Maharashtra (12.51%) according to the state wise supply analysis.
Source: Analysis of AISHE Report
Figure 30: Talent Supply Analysis by State
8,73,807
6,02,862
5,82,722
3,88,222
3,71,327
3,30,402
2,96,596
2,86,915
2,72,301
2,35,208
2,34,729
State
Uttar Pradesh
Tamil Nadu
Maharashtra
Karnataka
West Bengal
Madhya Pradesh
Andhra Pradesh*
Rajasthan
Telangana*
Gujarat
Bihar
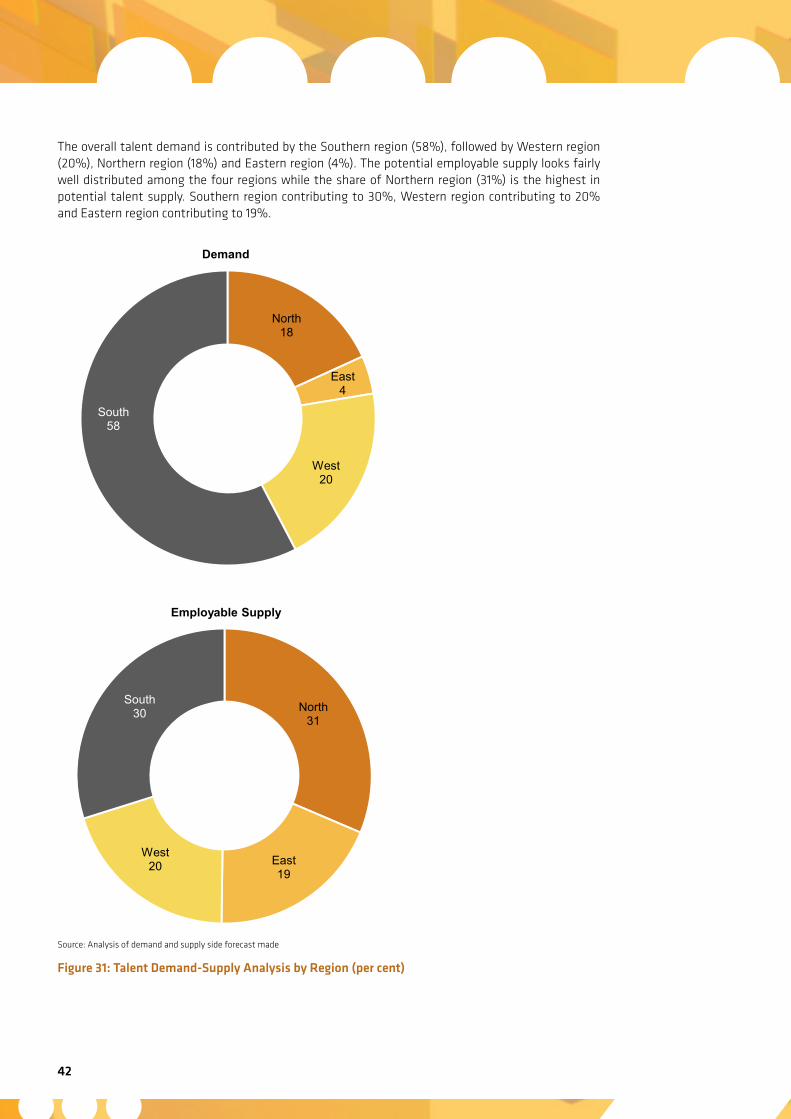
42
The overall talent demand is contributed by the Southern region (58%), followed by Western region (20%), Northern region (18%) and Eastern region (4%). The potential employable supply looks fairly well distributed among the four regions while the share of Northern region (31%) is the highest in potential talent supply. Southern region contributing to 30%, Western region contributing to 20% and Eastern region contributing to 19%.
Source: Analysis of demand and supply side forecast made
Figure 31: Talent Demand-Supply Analysis by Region (per cent)
North 31
East 19
West 20
South 30
Employable Supply
North 18
East 4
West 20
South 58
Demand
Analysis of Talent Demand and Supply 43
The Way ForwardWhile the pace of growth of the IT industry has come a long way from the days of 25% growth YoY (during 2000 to 2010) to about 11% to 15% growth in the last 3 years and the net hiring seen by the sector has come down to about 8 to 10% growth levels, major disruptions are expected over the next 3 to 5 years in both the global and local industry segments. These disruptions will require people to be skilled in both new areas as well as across multiple domains to be able to meet the expectations of clients from across the world. In order for India to not just remain competitive on the global scale but also take advantage of the opportunities provided by these disruptive factors.
In order to address the skilling needs of the industry, NASSCOM, with the support of National Skill Development Corporation, established the IT-ITeS Sector Skills Council (SSC NASSCOM) in 2012 with a mandate of being the standard setting and certifying body for skill training. The SSC has since created standards for 74 entry level job roles which serve as the standard for creation and implementation of skill training activities which will help make the “SSC certified” workforce relevant and employable. SSC NASSCOM’s efforts in getting more and more educational institutes to provide courses which are QP aligned as well as the SSC certified workforce getting created has lead to a rise in “job-readiness” amongst the students.
One hindrance to this, however, is limited understanding of QPs across most colleges in India. Thus SSC NASSCOM needs to continue its efforts to create awareness amongst both colleges and industry players to increase adoption of qualification standards, acceptable globally, and align both training as well as hiring norms to these standards.
As mentioned, each of the disruptions expected in the next 3 to 5 years has two types of skilling related impact expected – fresh skilling of workforce newly entering IT or other sectors or up skilling of existing workforce within the IT industry. Further with the advent of digital technologies as well as automation and the adoption of the same by Indian IT-BPM companies in India, 30% of the existing manpower is expected to undergo re-skilling. This translates to re-skilling of about 1 to 1.5 million of the IT workforce.
Recognizing the demographic dividend, major investments are being made by both government and private parties into the sector which will boost the requirement for skilled IT workforce in the country from basic lower order skills to higher levels ones. This will require significant interventions to skill and up-skill the new and existing workforce.
Finally, another major factor to be considered is the rising conversion of corporate processes to IT-based tools as well as increased implementation of electronics in the everyday utilities. As a result, employees from across different sectors, be it healthcare, automotive, BFSI, hospitality or even transportation & logistics need to be at minimum be “IT-literate” with requirement of IT skills know-how depending on the level of use of technology in the industry and the specific organization.
All three forms of skilling can effectively contribute to flagship ‘Skill India’ initiative which aims to position India as the skill capital of the world. There is also a strong case here for use of CSR programs of the IT-BPM companies to help gear up supply ecosystem with job ready curriculum endorsed by the industry. The NASSCOM ecosystem can help structure these programs to create and ensure sustainable impact.
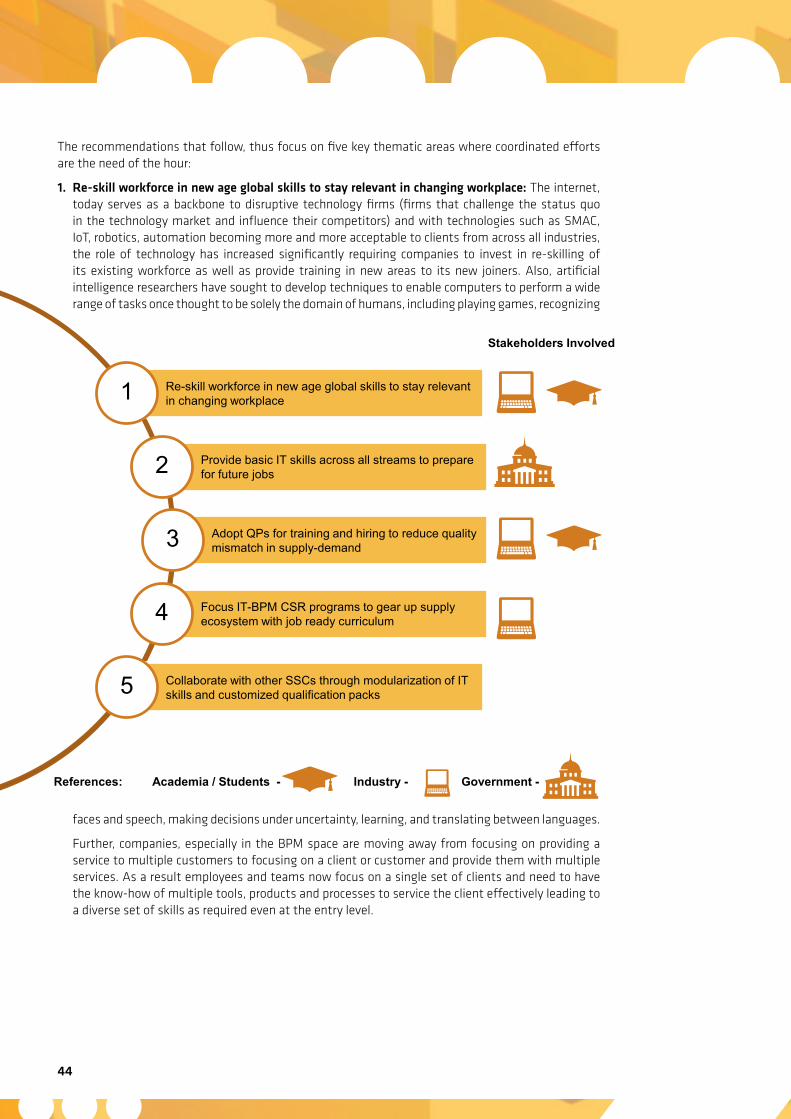
44
The recommendations that follow, thus focus on five key thematic areas where coordinated efforts are the need of the hour:
1. Re-skill workforce in new age global skills to stay relevant in changing workplace: The internet, today serves as a backbone to disruptive technology firms (firms that challenge the status quo in the technology market and influence their competitors) and with technologies such as SMAC, IoT, robotics, automation becoming more and more acceptable to clients from across all industries, the role of technology has increased significantly requiring companies to invest in re-skilling of its existing workforce as well as provide training in new areas to its new joiners. Also, artificial intelligence researchers have sought to develop techniques to enable computers to perform a wide range of tasks once thought to be solely the domain of humans, including playing games, recognizing
faces and speech, making decisions under uncertainty, learning, and translating between languages.
Further, companies, especially in the BPM space are moving away from focusing on providing a service to multiple customers to focusing on a client or customer and provide them with multiple services. As a result employees and teams now focus on a single set of clients and need to have the know-how of multiple tools, products and processes to service the client effectively leading to a diverse set of skills as required even at the entry level.
Re-skill workforce in new age global skills to stay relevant in changing workplace 1
Provide basic IT skills across all streams to prepare for future jobs 2
Adopt QPs for training and hiring to reduce quality mismatch in supply-demand 3
Focus IT-BPM CSR programs to gear up supply ecosystem with job ready curriculum 4
Collaborate with other SSCs through modularization of IT skills and customized qualification packs 5
Stakeholders Involved
References: Academia / Students - Industry - Government -
Analysis of Talent Demand and Supply 45
In light of the above factors, the focus of skilling has now shifted two-fold:
a) Skilling or re-skilling of workforce in digital skills: The new job roles created as a result of the technological disruptions require additional skill sets to be added to the traditional job roles especially in the areas of embedded systems, cloud and networking, social media etc. This needs to be achieved through an update of existing QPs to provide the industry and academia with a sense of direction in which traditional job roles are moving. Also, the new digital skills as will be required by the industry needs to be publicized with students and educational institutes to create necessary awareness amongst the target segment.
b) Multi-skilling of workforce: This is an extension of the above point where-in job roles are getting more diverse in the sense that it requires understanding of tools and subject matter knowledge of multiple domains. This too requires a regular update of relevant Qualification Packs as they serve as the means of communication of the changing requirements of the industry. While the individual requirement of companies might be different in terms of the additional skill sets required, the need is to modularize the batch of skills needed for various job roles and for companies to use these modularized skills as a means of describing the job description provided with new job postings.
The world is at the cusp of another major technological break-through and the only way for India as a country to capitalize on the same is to build a workforce with all relevant skills. This requires serious interventions from the side of both the industry as well as SSC NASSCOM in driving the relevant initiatives forward.
2. Provide basic IT skills across all streams to prepare for future jobs: Digital India aims to create 1.7 crore jobs through the period of its implementation across the country. These jobs will primarily focus on providing government and other services through IT-enabled platforms. All central government ministries and departments will come up with their individual projects that can be delivered to public using ICT like health services, education, judicial services etc. Government will prefer to adopt Public Private Partnerships (PPP) wherever feasible for rolling out Digital India program. The program also envisages various other key initiatives like
• Train 1 crore people in towns/villages in 5 years,
• Three lakh agents to run viable business delivering IT services,
• Five lakh rural IT workforce in 5 years,
• BPO in every North Eastern state
While, the implementation of the above initiatives would require providing suitable connectivity to every part of the country, it will also need able workforce which is trained in basic IT skills.
Further, with the maturity of the IT industry and provision of various automated processes and tools, the minimum qualifications for basic entry level jobs, especially in the BPM sector is shifting lower to 12th pass students. The companies are also moving their operations, servicing domestic clients, to tier-2 and tier-3 towns in order to lower their costs.
In order to address the above mentioned points, the need is to provide basic IT-skills which may include using basic productivity tools (spreadsheet, word processor etc.), web access and development tools etc. at the level of schools and colleges. This will help by providing low cost resources who are willing and able to work and address the need of low-end skills at far off locations. SSC NASSCOM may also look at increased drive towards NVEQF based training in schools especially in rural and semi-urban districts focusing on such basic IT-skills.
46
3. Adopt QPs for training and hiring to reduce quality mismatch in supply-demand: One of the most critical factor faced by the industry today is low employability of candidates applying for the job openings. This is a direct result of lack of relevant training at colleges and other educational institutes. Qualification Packs (QPs) were brought on to address this very concern wherein standards were developed for all jobs within an industry by the combined feedback of all the industry member companies. However, there is limited understanding of what a QP is and how it is to be used amongst the educational institutes. 90% of the institutes surveyed as part of the study did not know what a QP was or its applicability.
There is thus a great need to promote and advocate use of QPs amongst colleges and other educational institutes to
• Create awareness amongst the faculty, management and students of various institutes about what a QP is, what its various components are and the applicability of the same.
• Promote use of QPs in designing the curriculum of the respective institutes.
While SSC NASSCOM has already been conducting the said activities and tying up with various institutes like Anna University for promotion of adoption of QPs, the need is to step this up further with mass outreach programs being conducted which may be supported through interventions and support of the industry.
Further, it is also imperative to get more and more of industry players to adopt QPs and use them as a means of advertising for various job role postings. This in turn will push the educational institutes towards greater adoption of said QPs.
4. Focus IT-BPM CSR programs to gear up supply ecosystem with job ready curriculum: Even before the CSR spend related law being mandated, corporates from across all sectors have made significant and sustained contributions in various social development activities. However with the Company’s Law mandating the 2% spend on certain listed activities, this space has become far more organized and sustainable.
Skill Development remains as one of the top agendas of the companies wanting to spend their CSR kitty, but quite often, misses out due to lack of understanding of the various means of making the relevant spends. It is therefore imperative from the perspective of SSC NASSCOM to conduct the necessary drives and outreach programs to corporates to provide them with necessary information about schemes like Corporate Skilling Centers, contributions to National Skill Development Fund (NSDF) or even work towards sponsoring of assessment and certification fee for candidates from rural locations. Companies can thus benefit from the NASSCOM ecosystem to provide structure to their CSR programs
5. Collaborate with other SSCs through modularization of IT skills and customized qualification packs: As has already been highlighted across various sections of the report, one of the major factors requiring IT skilling is the increased usage of IT tools and processes to replace the traditional or manual based ones. Be it usage of high end technology within a hospital to monitor patients or basic RFID chip based tagging and tracking of goods and consignment moving across the globe, usage of IT has spread and is increasing across all sectors. With the advent of all businesses using internet as a medium of interacting with customers as well as for delivery of services, job roles such as a nurse or a delivery agent cannot be executed without a basic understanding of how to use the relevant technological tools. Thus know-how of IT skills has become imperative.
The need is to develop suitable modules which cover basic and intermediate IT-skills which can be used in combination with QPs of various other SSCs and to deliver the same through coordination with each of the relevant SSCs.
Analysis of Talent Demand and Supply 47
Annexures
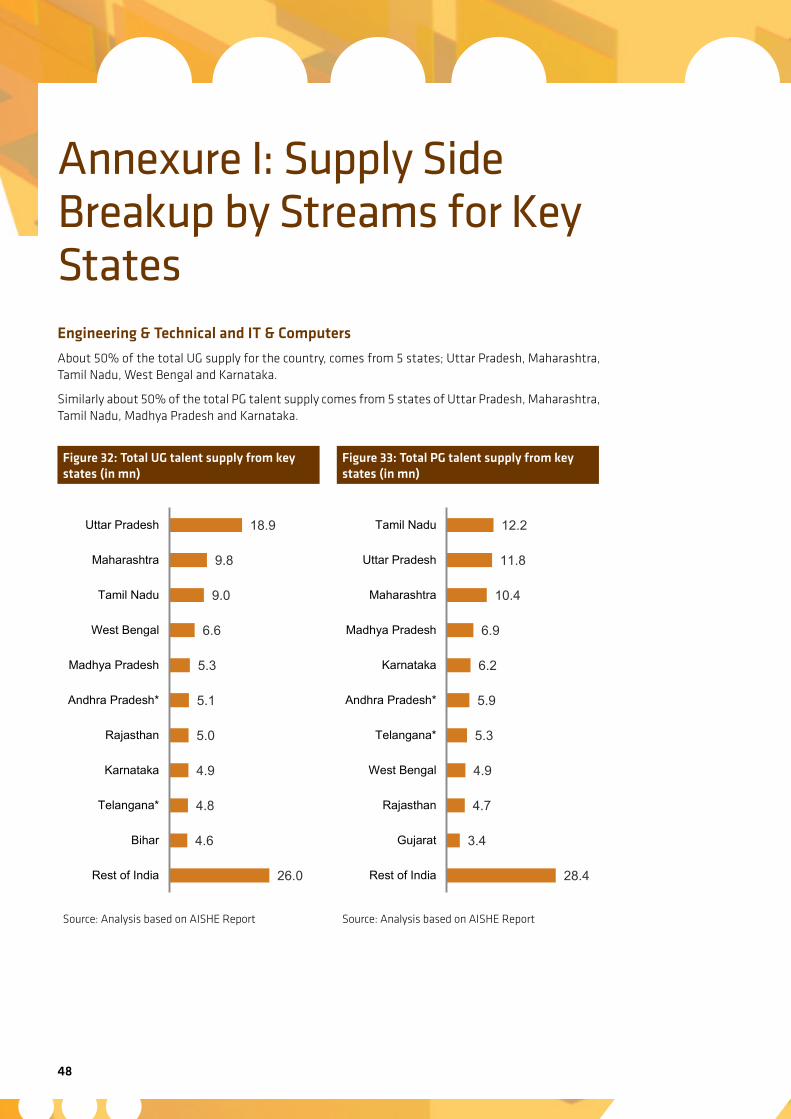
48
Annexure I: Supply Side Breakup by Streams for Key StatesEngineering & Technical and IT & Computers
About 50% of the total UG supply for the country, comes from 5 states; Uttar Pradesh, Maharashtra, Tamil Nadu, West Bengal and Karnataka.
Similarly about 50% of the total PG talent supply comes from 5 states of Uttar Pradesh, Maharashtra, Tamil Nadu, Madhya Pradesh and Karnataka.
Figure 32: Total UG talent supply from key states (in mn)
Source: Analysis based on AISHE Report
Figure 33: Total PG talent supply from key states (in mn)
Source: Analysis based on AISHE Report
26.0
4.6
4.8
4.9
5.0
5.1
5.3
6.6
9.0
9.8
18.9
Rest of India
Bihar
Telangana*
Karnataka
Rajasthan
Andhra Pradesh*
Madhya Pradesh
West Bengal
Tamil Nadu
Maharashtra
Uttar Pradesh
28.4
3.4
4.7
4.9
5.3
5.9
6.2
6.9
10.4
11.8
12.2
Rest of India
Gujarat
Rajasthan
West Bengal
Telangana*
Andhra Pradesh*
Karnataka
Madhya Pradesh
Maharashtra
Uttar Pradesh
Tamil Nadu
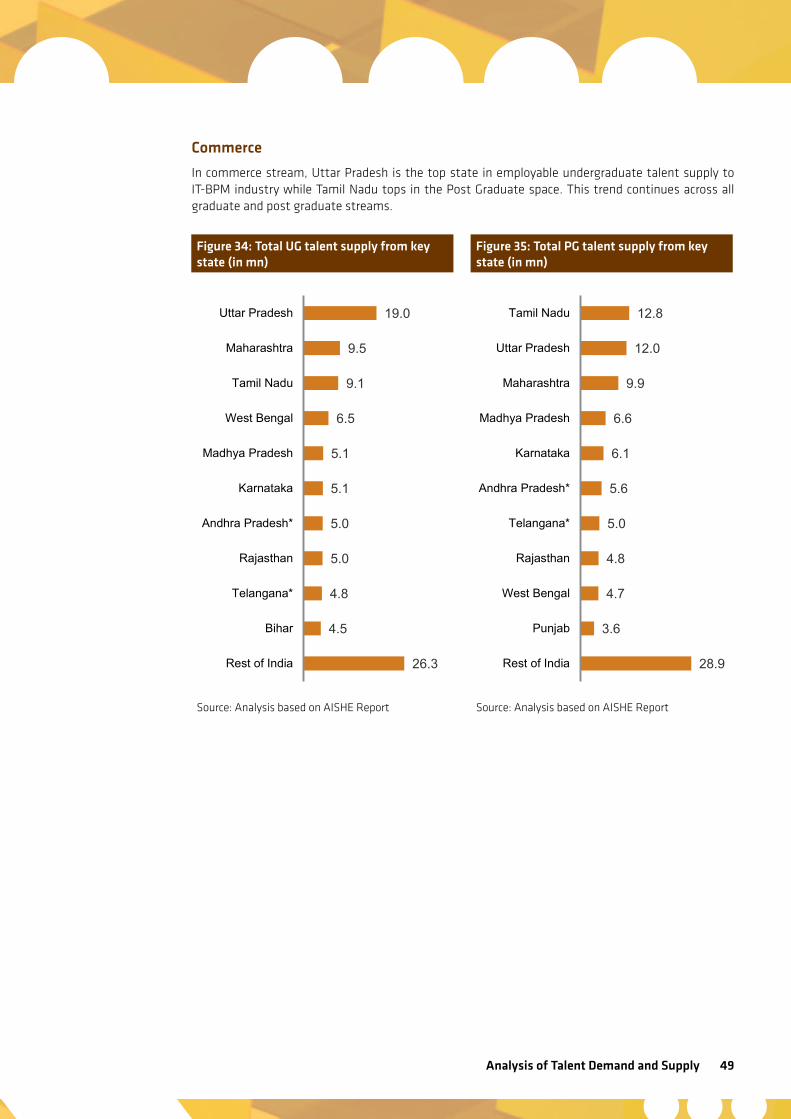
Analysis of Talent Demand and Supply 49
Commerce
In commerce stream, Uttar Pradesh is the top state in employable undergraduate talent supply to IT-BPM industry while Tamil Nadu tops in the Post Graduate space. This trend continues across all graduate and post graduate streams.
Figure 34: Total UG talent supply from key state (in mn)
Source: Analysis based on AISHE Report
Figure 35: Total PG talent supply from key state (in mn)
Source: Analysis based on AISHE Report
28.9
3.6
4.7
4.8
5.0
5.6
6.1
6.6
9.9
12.0
12.8
Rest of India
Punjab
West Bengal
Rajasthan
Telangana*
Andhra Pradesh*
Karnataka
Madhya Pradesh
Maharashtra
Uttar Pradesh
Tamil Nadu
26.3
4.5
4.8
5.0
5.0
5.1
5.1
6.5
9.1
9.5
19.0
Rest of India
Bihar
Telangana*
Rajasthan
Andhra Pradesh*
Karnataka
Madhya Pradesh
West Bengal
Tamil Nadu
Maharashtra
Uttar Pradesh

50
Science
Trend was similar as in the commerce stream.
Figure 36: Total UG talent supply from key state (in mn)
Source: Analysis based on AISHE Report
Figure 37: Total PG talent supply from key state (in mn)
Source: Analysis based on AISHE Report
26.3
4.5
4.8
5.0
5.0
5.1
5.1
6.5
9.1
9.5
19.1
Rest of India
Bihar
Telangana*
Andhra Pradesh*
Rajasthan
Karnataka
Madhya Pradesh
West Bengal
Tamil Nadu
Maharashtra
Uttar Pradesh
28.8
3.6
4.8
4.8
5.0
5.6
6.1
6.7
10.0
12.0
12.7
Rest of India
Punjab
West Bengal
Rajasthan
Telangana*
Andhra Pradesh*
Karnataka
Madhya Pradesh
Maharashtra
Uttar Pradesh
Tamil Nadu
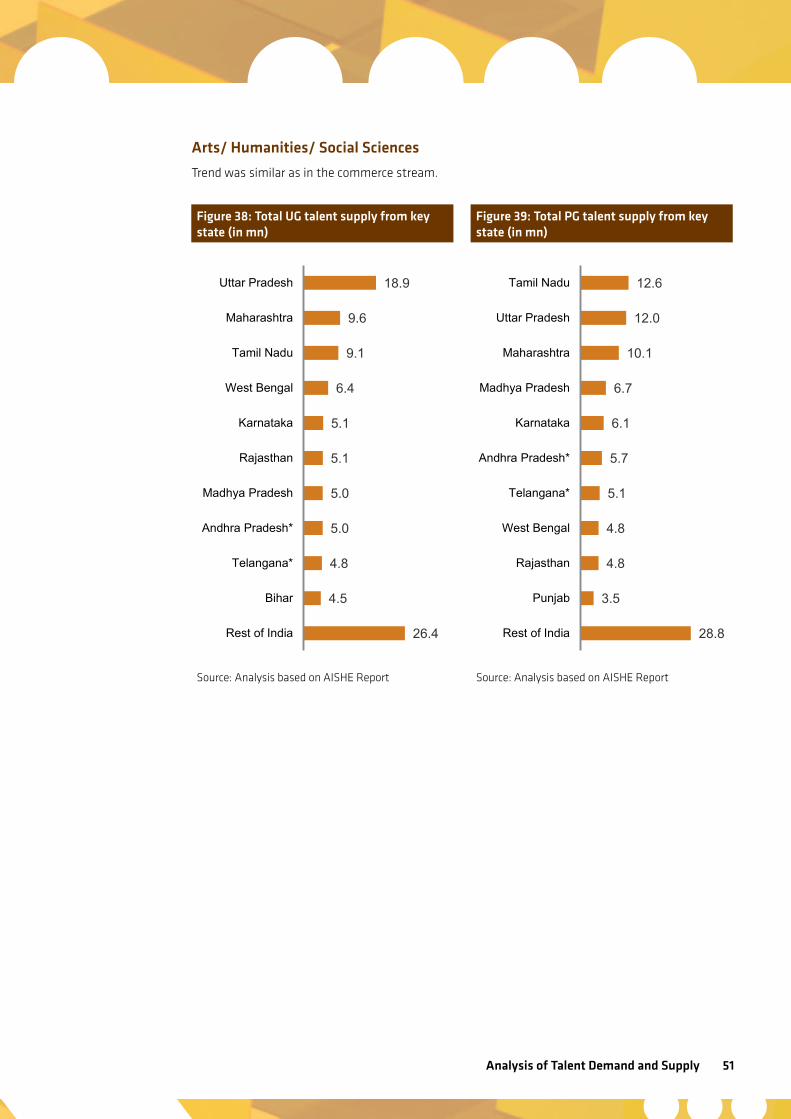
Analysis of Talent Demand and Supply 51
Arts/ Humanities/ Social Sciences
Trend was similar as in the commerce stream.
Figure 38: Total UG talent supply from key state (in mn)
Source: Analysis based on AISHE Report
Figure 39: Total PG talent supply from key state (in mn)
Source: Analysis based on AISHE Report
28.8
3.5
4.8
4.8
5.1
5.7
6.1
6.7
10.1
12.0
12.6
Rest of India
Punjab
Rajasthan
West Bengal
Telangana*
Andhra Pradesh*
Karnataka
Madhya Pradesh
Maharashtra
Uttar Pradesh
Tamil Nadu
26.4
4.5
4.8
5.0
5.0
5.1
5.1
6.4
9.1
9.6
18.9
Rest of India
Bihar
Telangana*
Andhra Pradesh*
Madhya Pradesh
Rajasthan
Karnataka
West Bengal
Tamil Nadu
Maharashtra
Uttar Pradesh
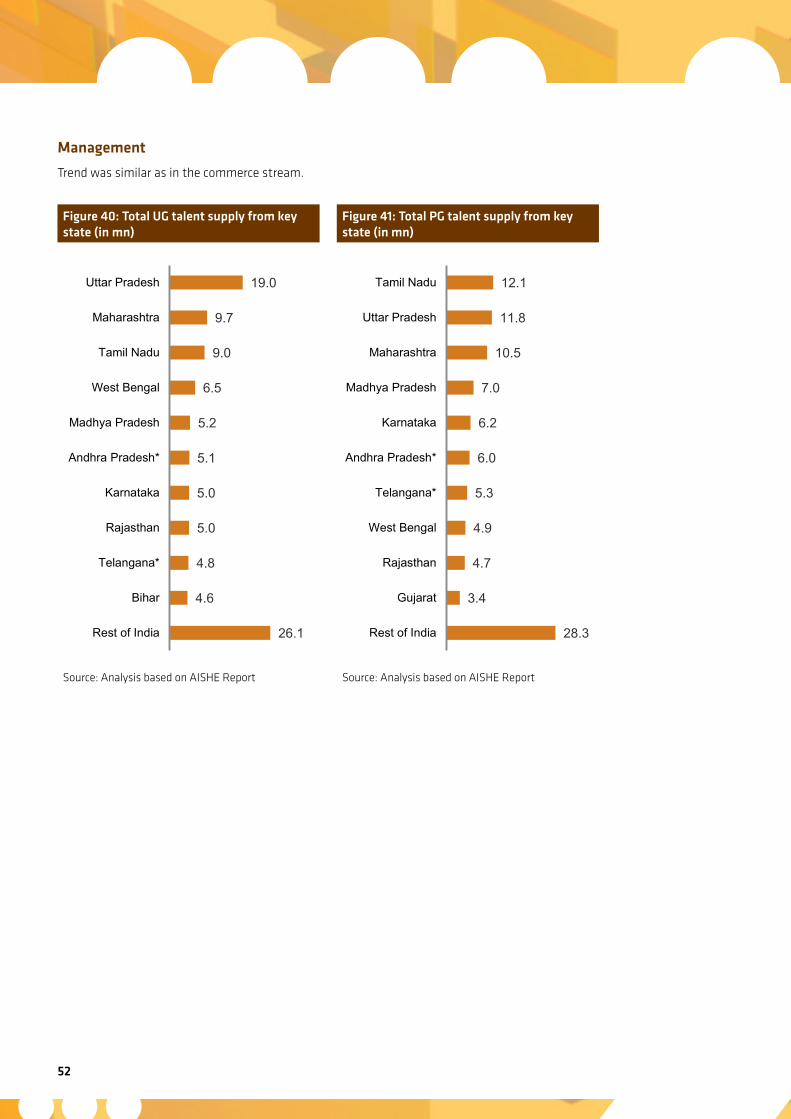
52
Management
Trend was similar as in the commerce stream.
Figure 40: Total UG talent supply from key state (in mn)
Source: Analysis based on AISHE Report
Figure 41: Total PG talent supply from key state (in mn)
Source: Analysis based on AISHE Report
26.1
4.6
4.8
5.0
5.0
5.1
5.2
6.5
9.0
9.7
19.0
Rest of India
Bihar
Telangana*
Rajasthan
Karnataka
Andhra Pradesh*
Madhya Pradesh
West Bengal
Tamil Nadu
Maharashtra
Uttar Pradesh
28.3
3.4
4.7
4.9
5.3
6.0
6.2
7.0
10.5
11.8
12.1
Rest of India
Gujarat
Rajasthan
West Bengal
Telangana*
Andhra Pradesh*
Karnataka
Madhya Pradesh
Maharashtra
Uttar Pradesh
Tamil Nadu
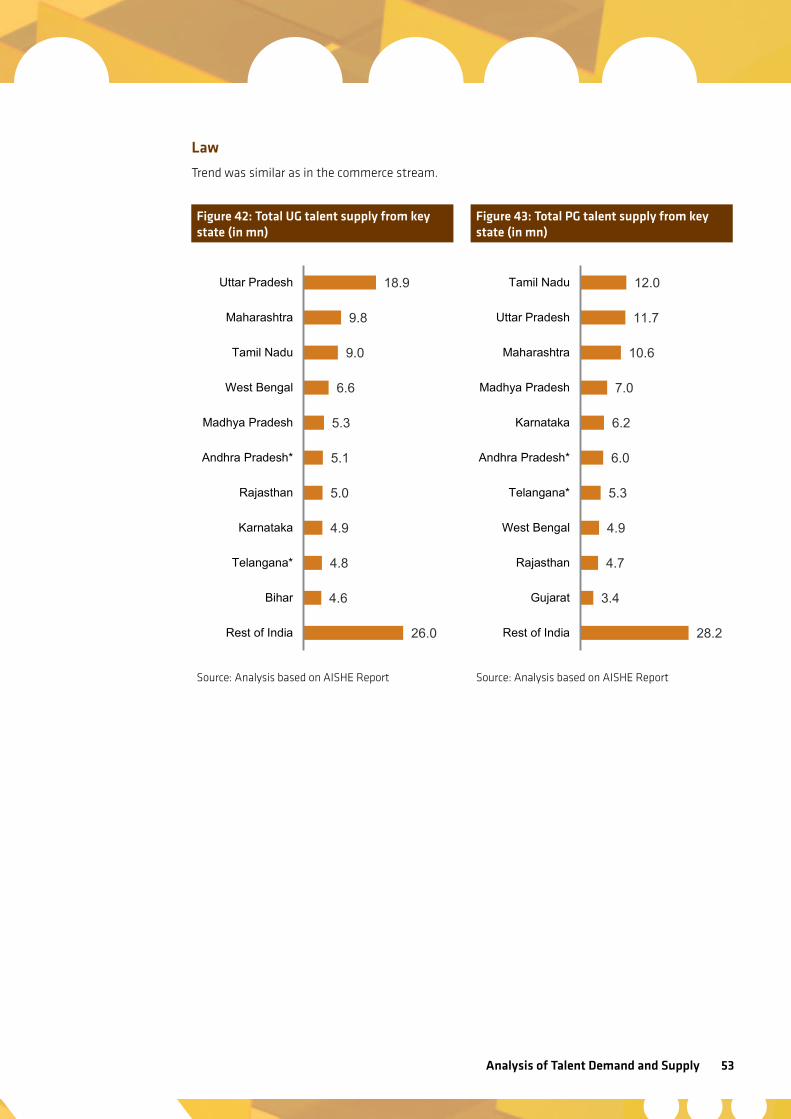
Analysis of Talent Demand and Supply 53
Law
Trend was similar as in the commerce stream.
Figure 42: Total UG talent supply from key state (in mn)
Source: Analysis based on AISHE Report
Figure 43: Total PG talent supply from key state (in mn)
Source: Analysis based on AISHE Report
26.0
4.6
4.8
4.9
5.0
5.1
5.3
6.6
9.0
9.8
18.9
Rest of India
Bihar
Telangana*
Karnataka
Rajasthan
Andhra Pradesh*
Madhya Pradesh
West Bengal
Tamil Nadu
Maharashtra
Uttar Pradesh
28.2
3.4
4.7
4.9
5.3
6.0
6.2
7.0
10.6
11.7
12.0
Rest of India
Gujarat
Rajasthan
West Bengal
Telangana*
Andhra Pradesh*
Karnataka
Madhya Pradesh
Maharashtra
Uttar Pradesh
Tamil Nadu
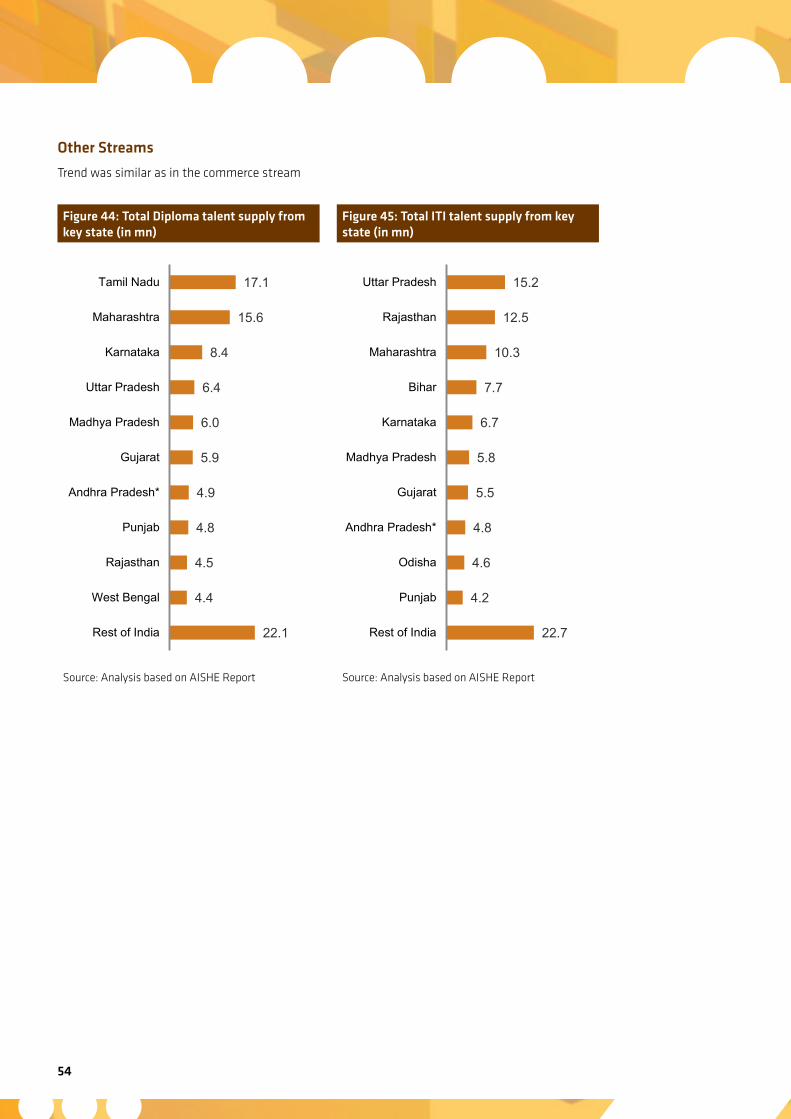
54
Other Streams
Trend was similar as in the commerce stream
Figure 44: Total Diploma talent supply from key state (in mn)
Source: Analysis based on AISHE Report
Figure 45: Total ITI talent supply from key state (in mn)
Source: Analysis based on AISHE Report
22.1
4.4
4.5
4.8
4.9
5.9
6.0
6.4
8.4
15.6
17.1
Rest of India
West Bengal
Rajasthan
Punjab
Andhra Pradesh*
Gujarat
Madhya Pradesh
Uttar Pradesh
Karnataka
Maharashtra
Tamil Nadu
22.7
4.2
4.6
4.8
5.5
5.8
6.7
7.7
10.3
12.5
15.2
Rest of India
Punjab
Odisha
Andhra Pradesh*
Gujarat
Madhya Pradesh
Karnataka
Bihar
Maharashtra
Rajasthan
Uttar Pradesh
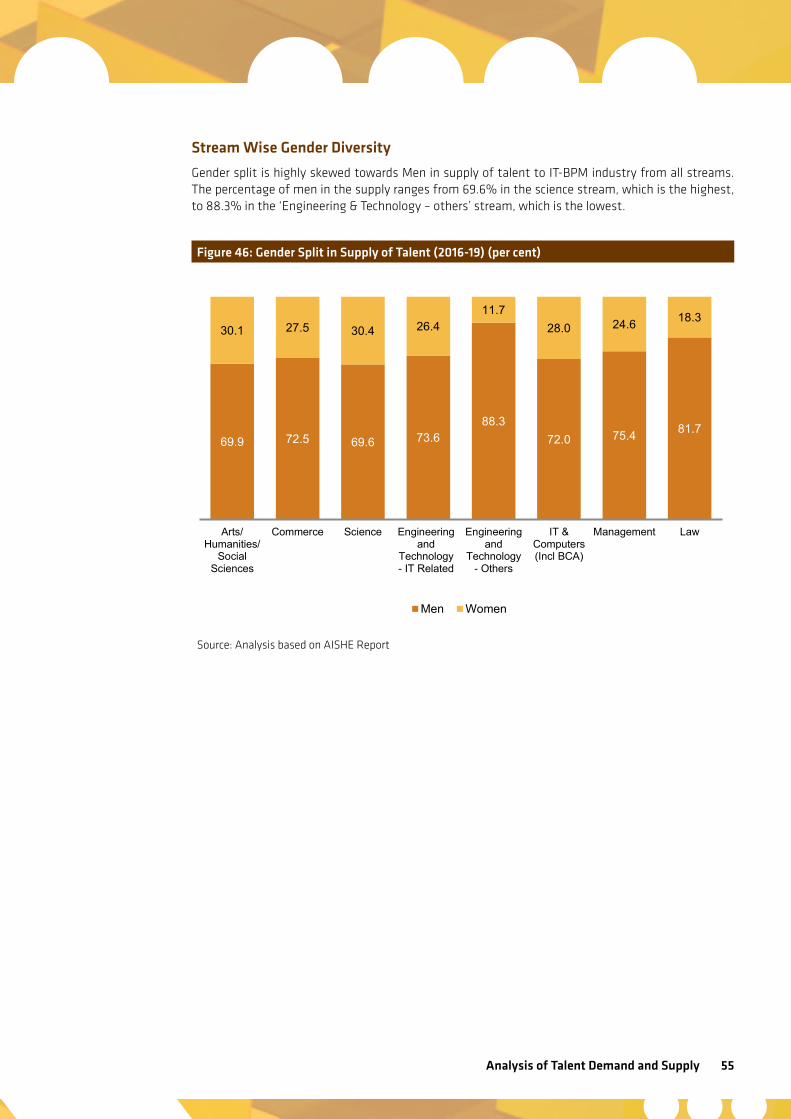
Analysis of Talent Demand and Supply 55
Stream Wise Gender Diversity
Gender split is highly skewed towards Men in supply of talent to IT-BPM industry from all streams. The percentage of men in the supply ranges from 69.6% in the science stream, which is the highest, to 88.3% in the ‘Engineering & Technology – others’ stream, which is the lowest.
Figure 46: Gender Split in Supply of Talent (2016-19) (per cent)
Source: Analysis based on AISHE Report
69.9 72.5 69.6 73.6 88.3
72.0 75.4 81.7
30.1 27.5 30.4 26.4 11.7
28.0 24.6 18.3
Arts/Humanities/
SocialSciences
Commerce Science Engineeringand
Technology- IT Related
Engineeringand
Technology- Others
IT &Computers(Incl BCA)
Management Law
Men Women
56
Annexure II: List of Figures
Figure 1: Demand Side Estimation Methodology 5
Figure 2 Supply Side estimation Methodology 6
Figure 3 Forecast of Global IT Spends (in USD Billion) and split (per cent) by Industry 8
Figure 4 Split of Global IT Spends (in USD Bn) by Industry 8
Figure 5 India’s share in World IT BPM Spends 2016 9
Figure 6 Contribution of Companies by Size 10
Figure 7 India IT-BPM Industry revenues: Export vs Domestic (Includes Hardware) - USD bn 11
Figure 8 India IT-BPM Industry revenues: Subsector breakup (USD Bn) 11
Figure 9 The Internet of Things landscape 12
Figure 10 Number of IoT Developers Required by 2020 (in ‘000) 13
Figure 11 Distribution of profiles 20
Figure 12 Indian IT Sector Revenue Projections (In USD BN) 21
Figure 13 Revenue Per Employee Projections (In USD) 22
Figure 14 Indian IT sector employment projections (In Mn) 22
Figure 15 Total Employment – Split By Sub-sector – FY15 to FY19 23
Figure 16 Split of Employment by key states (in Mn) 23
Figure 17 Split of demand by Region 24
Figure 18 Ranking by hiring numbers in IT services Segment by Occupation 26
Figure 19 Ranking by hiring numbers in BPM segment by Occupation 26
Figure 20 Graduate Enrolment Breakup– AY2014 29
Figure 21 Share of Enrolment at Ph.D. and Post Graduate level 30
Figure 22 Total Talent Supply (2016-19) (in Million) 32
Figure 23 UG talent from each state - AY2016-19 (in mn) 33
Figure 24 PG talent from each state - AY2016-19 (in mn) 33
Figure 25 Split by Category (Year on Year) 34
Figure 26 Talent Supply – Pass out to “Industry-ready” to “Job-ready” - 2016 35
Figure 27 Spending by Thematic areas (INR Billion) for FY15 37
Figure 28 Total Talent Demand vs Supply Gap (2016-19) (in ‘000) 39
Figure 29 Incremental Talent Demand Analysis by State 40
Figure 30 Talent Supply Analysis by State 41
Figure 31 Talent Demand-Supply Analysis by Region 42
Figure 32 Total UG talent supply from key states(in mn) 48
Analysis of Talent Demand and Supply 57
Figure 33 Total PG talent supply from key states(in Mn) 48
Figure 34 Total UG talent supply from key state(in mn) 49
Figure 35 Total PG talent supply from key state(in Mn) 49
Figure 36 Total UG talent supply from key state(in mn) 50
Figure 37 Total PG talent supply from key state(in Mn) 50
Figure 38 Total UG talent supply from key state(in mn) 51
Figure 39 Total PG talent supply from key state(in Mn) 51
Figure 40 Total UG talent supply from key state(in mn) 52
Figure 41 Total PG talent supply from key state(in Mn) 52
Figure 42 Total UG talent supply from key state(in mn) 53
Figure 43 Total PG talent supply from key state(in Mn) 53
Figure 44 Total Diploma talent supply from key state(in mn) 54
Figure 45 Total ITI talent supply from key state(in Mn) 54
Figure 46 Gender Split in Supply of Talent (2016-19) 55

58
Annexure III: List of Tables
Table 1 Break up of Universities by state 28
Table 2 Enrolments by education level 29
Analysis of Talent Demand and Supply 59
Annexure IV: Bibliography
1. All India Survey of Higher Education, 2013-14
2. analyticsvidhya.com (July 27, 2015)
3. AISHE Report 2014-15
4. BMI Research, “India Information Technology Report-Q2 2016.” EMIS, March 04, 2016.
5. businesswire.com (February 22,2016)
6. “E-commerce Jobs in India.” The Financial Express, February 5, 2016.
7. “Global Outsourcing Revenue to hit 233$ billion by 2020” The Hindu Business Line September 17, 2013.
8. “India Shining in the global ER&D space.” NASSCOM Newsletters.
9. indiatechonline.com
10. “Report on IoT.” BI Intelligence, October 8, 2014.
11. CXOtoday News Desk, “IT-BPM Sector to grow by 10-12% in FY2016-17,” CXOtoday, February 04, 2016.
12. Gartner press release on “India IT spending” dated November 3, 2015.
13. Gartner press release on “World Wide IT Spending” dated January 18, 2016.
14. iotleague.com-current-state-of-internet-of-things-iot-in-india (September 28, 2015)
15. NASSCOM Strategic Review 2013 to 2016.
16. NASSCOM, “FY16 Performance and FY17 Outlook.” February 2016.
17. Press release from Markets and Markets on Advances Analytics
18. Press release from Markets and Markets on Business Analytics
19. Press release from Markets and markets on Industrial Robots.
20. Press release from Markets and Markets on Retail Analytics
21. Press release from The Allied Market Research on Industrial Robots
22. prnewswire.com
23. readwrite.com-internet-of-things-developers-jobs-opportunity (June 27,2016)
24. statista.com- Global IT Services Revenue forecast
25. statista.com- worldwide-it-spending-growth-forecast
26. Unified District Information System for Education,2014-15
27. Woldrobotics.org

60
Notes
_____________________________________________________________________________
_____________________________________________________________________________
_____________________________________________________________________________
_____________________________________________________________________________
_____________________________________________________________________________
_____________________________________________________________________________
_____________________________________________________________________________
_____________________________________________________________________________
_____________________________________________________________________________
_____________________________________________________________________________
_____________________________________________________________________________
_____________________________________________________________________________
_____________________________________________________________________________
_____________________________________________________________________________
_____________________________________________________________________________
_____________________________________________________________________________
_____________________________________________________________________________
_____________________________________________________________________________
_____________________________________________________________________________
_____________________________________________________________________________
_____________________________________________________________________________
_____________________________________________________________________________
_____________________________________________________________________________
_____________________________________________________________________________
_____________________________________________________________________________

Analysis of Talent Demand and Supply 61
_____________________________________________________________________________
_____________________________________________________________________________
_____________________________________________________________________________
_____________________________________________________________________________
_____________________________________________________________________________
_____________________________________________________________________________
_____________________________________________________________________________
_____________________________________________________________________________
_____________________________________________________________________________
_____________________________________________________________________________
_____________________________________________________________________________
_____________________________________________________________________________
_____________________________________________________________________________
_____________________________________________________________________________
_____________________________________________________________________________
_____________________________________________________________________________
_____________________________________________________________________________
_____________________________________________________________________________
_____________________________________________________________________________
_____________________________________________________________________________
_____________________________________________________________________________
_____________________________________________________________________________
_____________________________________________________________________________
_____________________________________________________________________________
_____________________________________________________________________________
_____________________________________________________________________________

4E-Vandana Building (4th Floor)11, Tolstoy Marg, Connaught PlaceNew Delhi 110 001, IndiaT +91 11 4151 9230; F +91 11 4151 9240E [email protected] www.nasscom.in


![ABLEFS: Enhancing Metadata Efficiency in the Local File …kair/papers/tablefs.pdfof XFS, NetApp’s WAFL and Sun’s ZFS[3, 18], Btrfs copies any B-tree node to an unallocated location](https://img.pdfslide.us/doc/110x75/5e8c47ee69bb5d44c9426c51/ablefs-enhancing-metadata-eficiency-in-the-local-file-kairpapers-of-xfs-netappas.jpg)


![YCSB++ : Benchmarking and Performance Debugging Advanced ...kair/papers/ycsb++.pdf · Both are inspired by Google’s BigTable system [12]. HBase is being developed as a part of the](https://img.pdfslide.us/doc/110x75/5f0ba5047e708231d43184ee/ycsb-benchmarking-and-performance-debugging-advanced-kairpapersycsbpdf.jpg)