Embed Size (px)
Citation preview

Health Portfolio Committee
NHLS as a Provider of Public Health Laboratory Services
John Robertson CEO
Health Portfolio Committee
NHLS as a Provider of Public Health Laboratory Services
John Robertson CEO

PurposePurpose
Provide cost-effective health laboratory services
Provide training for health science education
Support health research

OfficesOffices

Head Office & NICDHead Office & NICD

NHLS SitesNHLS Sites

StructureStructureNHLS Board
Operations Corporate Surveillance
Central RegionGerrit Coetzee
Coastal RegionSipho Mahlati
Northern regionJoyce Mogale
Finance & AdministrationSuliman Minty
Human ResourcesElsje Greyling
Information TechnologyStelios Michas
Quality Assurance &
Academic AffairsMartin Hale
NICDBarry Schoub
NIOHMary Ross
CEOJohn Robertson
Kwazulu Natal
National Cancer Registry

NHLS ServicesNHLS Services
Community Clinics
Community Hospitals
Regional Hospitals
Tertiary Hospitals
National Institute for Communicable Diseases
National Institute for Occupational Health

FacilitiesFacilities
Laboratories
265 laboratories across nine provinces
Personnel
3800 Total personnel +1000 KZN
1530 Technologists and Technicians
138 Pathologists
137 Registrars

NHLS Service ModelNHLS Service Model
Fee for Service
Sole Provider
Training
Research

Financial Financial DimensionsDimensions
Income 0.5% Derived from teaching
2.0% Research grants
5.8% Derived from govt grants
91.1% Derived from fees
0.6% Other income
Expenditure 7% Teaching and Research
3% Occupational Health
5% Surveillance & Epidemiology
74% Laboratory Services
11% Administration

Laboratory ServicesExpenditure by Province 04-05
WC NC FS GP MP NW EC KZN LP RSA
Payments & Estimates 04-05 R 4,739 R 815 R 2,745 R 8,731 R 2,306 R 2,599 R 5,410 R 9,036 R 4,241 R 40,622
NHLS Invoicing incl Vat R 225 R 33 R 108 R 343 R 62 R 70 R 132 R 200 R 70 R 1,243
Population Census 2001 4,524 823 2,707 8,837 3,123 3,669 6,437 9,426 5,274 44,820
# NHLS labs 22 5 12 40 17 27 54 52 36 265
Population per Laboratory 205,652 164,545 225,565 220,929 183,705 135,902 119,199 181,270 146,490 169,131
Health Expenditure per Capita R 1,048 R 990 R 1,014 R 988 R 738 R 708 R 840 R 959 R 804 R 906
Lab Expenditure per Capita R 50 R 40 R 40 R 39 R 20 R 19 R 21 R 21 R 13 R 28
Lab Expenditure % Budget 4.7% 4.0% 3.9% 3.9% 2.7% 2.7% 2.4% 2.2% 1.7% 3.1%

Provincial Spend and per Provincial Spend and per Capita SpendCapita Spend
R 0
R 50
R 100
R 150
R 200
R 250
R 300
R 350
GP WC KZN EC FS LP NW MP NC
R m
-
10
20
30
40
50
60
R p
er
pe
rso
n
NHLS Invoicing incl Vat Lab Expenditure per Capita

Provincial Vote and % Spend Provincial Vote and % Spend on Laboratory Serviceson Laboratory Services
R 0
R 1,000
R 2,000
R 3,000
R 4,000
R 5,000
R 6,000
R 7,000
R 8,000
R 9,000
R 10,000
WC NC FS GP MP NW EC KZN LP
R m
0.0%
1.0%
2.0%
3.0%
4.0%
5.0%
6.0%
7.0%
8.0%
9.0%
10.0%
% o
f b
ud
ge
t
Healthcare spend LabSpend as a % of budget

Tariff DevelopmentTariff Development
Discipline 2004 2005 CMS
Chemistry R 445,894,444 R 455,619,266 2.18% R 608,767,874 33.61%
Microbiology R 321,762,966 R 337,151,430 4.78% R 412,698,133 22.41%
Haematology R 174,943,443 R 192,039,256 9.77% R 263,564,238 37.24%
Anatomical R 93,891,245 R 98,159,466 4.55% R 104,815,349 6.78%
Human Genetics R 12,022,756 R 12,646,865 5.19% R 13,312,501 5.26%
R 1,048,514,854 R 1,095,616,283 4.49% R 1,403,158,095 28.07%
Test Description
CD4 PLG R 60.00 R 147.80 146%
EasyQ Viral Load R 300.00 R 590.60 97%
Micro TB Misc. R 35.10 R 54.00 54%
R/M Culture TB R 82.60 R 108.70 32%
EXF Cytology (Gynae) R 62.20 R 88.80 43%

Financial Impact of extension Financial Impact of extension of servicesof services
Turnover 2003-2004 (000's) R 891,056
7.8% Tariff Increase 2004 R 71,284
CCTP R 49,000
NIOH Grant R 12,000
4% Increased Service Delivery R 35,642
Total R 1,058,983
Turnover 2004-2005 R 1,060,670
Difference R 1,687

Summary of Group ResultsSummary of Group Results
Summary of Group Results (R'000s)2001-2005
Cumulative12 months
200512 months
200418 months
2003
External revenue R 2,870,894 R 1,060,670 R 891,056 R 919,168
Cost of sales R 1,769,827 R 649,993 R 592,719 R 527,115
Gross profit R 1,101,067 R 410,677 R 298,337 R 392,053
Operating Expenses R 1,238,112 R 398,857 R 369,830 R 469,425
Other operating Income R 183,880 R 86,694 R 58,350 R 38,836
Operating profits (loss) R 46,835 R 98,514 R 13,143 R 38,536
Transfer payments for CCTP R 40,000 R 20,000 R 20,000
Income from SAIMR trust R 30,000 R 30,000
Investment Income R 7,279 R 158 R 70 R 7,367
Provision for post retirement medical-aid R 149,523 R 20,945 R 25,309 R 103,269Net profit (loss) R 25,409 R 97,411 R 18,382 R 104,438
Investment in property plant & equipment R 96,283 R 56,859 R 22,583 R 16,841
Working capital R 41,701 R 84,711 R 29,709 R 13,301
Non cash Items R 50,175 R 20,122 R 17,329 R 12,724
Grants received R 59,837 R 2,216 R 17,808 R 39,813
Provision for post retirement medical-aid R 149,523 R 20,945 R 25,309 R 103,269
Disposal of investment R 4 R 4
Transfer of cash from SAIMR R 14,382 R 14,382
Ascquisition University of Pretoria IP R 21,933 R 21,933Net increase in cash R 88,595 R 876 R 49,194 R 40,277

Financial Structure NHLSFinancial Structure NHLS
• At inception• Post Retirement liabilities measured at fair value
Employees transferred from Provincial Departments of Health were transferred without funding for post retirement benefits
• Retirement age of employees were not uniform
• Assets were acquired at no or low historical cost
• Actions• Acturial valuation of post retirement medical aid liability
• Revaluation of Land & Buildings
• Negotiate uniform conditions of service
• Obtain approval of stakeholders and legislative authorities

Annual ReportAnnual Report
A M J J A S O N D J F M A M J J A S O N D J F M A M J J A
2003 Financial audit
2004 Financial audit
2005 Financial audit
Audit period Post retirement Retirement age Revaluation Properties Treasury Submission
Annual Report2003 2004 2005

NHLS People Management NHLS People Management PhilosophyPhilosophy
Creation of a culture of growth & accountability
Continuous organisational development and empowerment
Attraction, retention and development of highly talented people
Respect for human values, diversity and relations

Human ResourcesHuman Resources
OverviewOverview
• Headcount:Headcount:
– March 2003: 3 509March 2003: 3 509
– March 2004: 3 797 March 2004: 3 797
– March 2005: 3 880March 2005: 3 880
• Payroll:Payroll:
– March 2003: R 489 971 millionMarch 2003: R 489 971 million
– March 2004: R 559 358 millionMarch 2004: R 559 358 million
– March 2005: R 584 932 millionMarch 2005: R 584 932 million

Human ResourcesHuman Resources
Achievements 2003 to 2005Achievements 2003 to 2005
• Developed and implemented comprehensive Human Developed and implemented comprehensive Human Resources Strategic Plan (2003 to 2006).Resources Strategic Plan (2003 to 2006).
• Developed, consulted and implemented a wide range of Developed, consulted and implemented a wide range of new Human Resources Management policies and new Human Resources Management policies and collective agreements.collective agreements.
• Developed and implemented macro organisational Developed and implemented macro organisational structure.structure.
• Completed transfer and absorption of all designated staff Completed transfer and absorption of all designated staff (excluding KZN).(excluding KZN).

Human Resources Human Resources Achievements 2003 to 2005Achievements 2003 to 2005
• Single set of conditions of employment implemented for Single set of conditions of employment implemented for all staff all staff
• Development and implementation of single job grading, Development and implementation of single job grading, career advancement and remuneration systemscareer advancement and remuneration systems
• Implementation of performance scorecards for Executive Implementation of performance scorecards for Executive ManagementManagement
• Employment Equity Plan negotiated with unions in the Employment Equity Plan negotiated with unions in the Labour Forum and implementedLabour Forum and implemented

Workforce ProfileWorkforce Profile
OVERALL NHLS: 2004 TO 2008
0
5
10
15
20
25
30
35
40
African male African female Coloured male Coloured female Indian male Indian female White male White female
Race and Gender
Per
cent
age
March 2004
March 2005
March 2008

EMPLOYMENT EQUITY INDICATORS: 2004 TO 2008
0
10
20
30
40
50
60
70
80
90
100
Black employees Designated employees Non designated employees
Indicator
Per
cent
age
March 2004
March 2005
March 2008
Workforce ProfileWorkforce Profile

EXECUTIVE MANAGEMENT: 2004 TO 2008
0.0
10.0
20.0
30.0
40.0
50.0
60.0
70.0
African male African female Indian male White male White female
Race and Gender
Per
cen
tag
e
Mar-04
Mar-05
Mar-08
Workforce ProfileWorkforce Profile

SENIOR MANAGEMENT: 2004 TO 2008 (Business managers and senior corporate managers)
0.0
5.0
10.0
15.0
20.0
25.0
30.0
35.0
African male African female Coloured male Coloured female Indian male Indian female White male White female
Race and Gender
Per
cen
tag
e
Mar-04
Mar-05
Mar-08
Workforce ProfileWorkforce Profile

MEDICAL DOCTORS AND SPECIALISTS: 2004 TO 2008
0.0
5.0
10.0
15.0
20.0
25.0
30.0
35.0
40.0
45.0
50.0
African male African female Coloured male Coloured female Indian male Indian female White male White female
Race and Gender
Per
cen
tag
e
Mar-04
Mar-05
Mar-08
Workforce ProfileWorkforce Profile

REGISTRARS: 2004 TO 2008
0.0
5.0
10.0
15.0
20.0
25.0
30.0
35.0
40.0
45.0
African male African female Coloured male Coloured female Indian male Indian female White male White female
Race and Gender
Per
cen
tag
e
Mar-04
Mar-05
Mar-08
Workforce ProfileWorkforce Profile

MEDICAL TECHNOLOGISTS: 2004 TO 2008
0.0
5.0
10.0
15.0
20.0
25.0
30.0
35.0
40.0
African male African female Coloured male Coloured female Indian male Indian female White male White female
Race and Gender
Per
cent
age
Mar-04
Mar-05
Mar-08
Workforce ProfileWorkforce Profile

STUDENT MEDICAL TECHNOLOGISTS: 2004 TO 2008
0.0
10.0
20.0
30.0
40.0
50.0
60.0
70.0
African male African female Coloured male Coloured female Indian male Indian female White male White female
Race and Gender
Per
cen
tag
e
Mar-04
Mar-05
Mar-08
Workforce ProfileWorkforce Profile

Skills DevelopmentSkills Development
SKILLS TRAINING EXPENDITURE: 2003 TO 2005
0
100,000
200,000
300,000
400,000
500,000
600,000
700,000
800,000
900,000
Skills courses Conferences Bursaries
Category
Ran
d March 2003
March 2004
March 2005

INTERNS AND REGISTRARS: 2004 AND 2005
0
5,000,000
10,000,000
15,000,000
20,000,000
25,000,000
30,000,000
35,000,000
40,000,000
45,000,000
Interns Registrars
Category
Ran
d
March 2004
March 2005
Skills DevelopmentSkills Development

TrainingTraining
Affiliated to 9 Medical Universities
Affiliated to 11 Technikons
50 HoD’s Training Under & Post Graduate
Graduate 25 Pathologists annually
Graduate 100 Technologists annually

Training DimensionsTraining Dimensions
Income
R 5m Universities
R 50m NHLS
R 55m Total
Expenditure
R 32m Heads of Department
R 23m Principal, Senior & Registrars
R 55m Total

Lab support services
Technicians
Technologists
Medical scientists
Specialists
Sub specialists
National Health Laboratory Service
Pathology Service Delivery
Internal Trainees

Medical students
Dental students
Subspecialists
Nurses
Specialists
Biom
edical HC
W
National Health Laboratory Service
Health Care Delivery
External Trainees

ResearchResearch
6 MRC units
1 NRF Centre of Excellence
Cancer Registry
183 Scientists
400 Research publications annually

Research DimensionsResearch Dimensions
Income
R 17m NHLS
R 50m Funding Agencies
R 67m Total
Expenditure
R 67m HIV, TB, Malaria, Cancer etc
R 67m Total
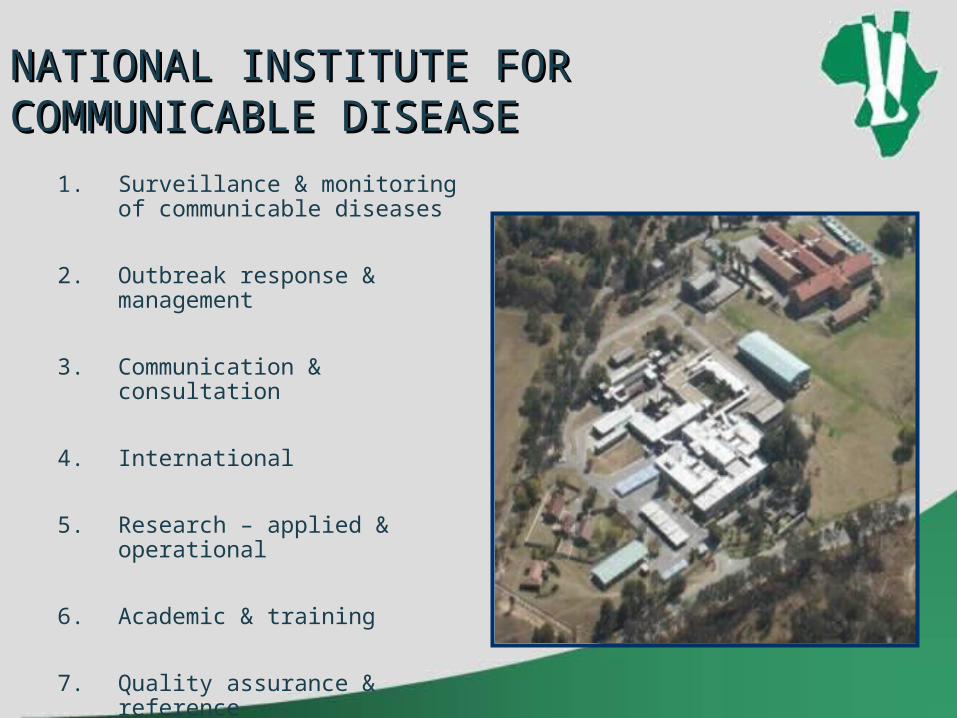
NATIONAL INSTITUTE FOR NATIONAL INSTITUTE FOR COMMUNICABLE DISEASECOMMUNICABLE DISEASE
1. Surveillance & monitoring of communicable diseases
2. Outbreak response & management
3. Communication & consultation
4. International
5. Research – applied & operational
6. Academic & training
7. Quality assurance & reference

1.1. SURVEILLANCE & MONITORING SURVEILLANCE & MONITORING OF COMMUNICABLE DISEASES - OF COMMUNICABLE DISEASES - MEASLESMEASLES
Weeks
3233
3435
3637
3839
4041
4243
4445
4647
4849
5051
521
23
45
678
910
1112
1314
1516
171819
2021
2223
2425
2627
2829
3031
3233
3435
3637
3839
4041
4243
4445
4647
4849
5051
521
23
45
67
8910
1112
1314
1516
1718
1920
2122
2324
2526
2728
2930
3132
330
20
40
60
80
100
Aug 2003 - 29 August 2005 per week
Measles IgM positive results
Aug 2003 Jan 2004 Jan 2005
MPP
KZP
ECP
WCP
Mass Immunizationcampaign
GAP

1.1. SURVEILLANCE & MONITORING SURVEILLANCE & MONITORING OF COMMUNICABLE DISEASES - OF COMMUNICABLE DISEASES - MEASLES MEASLES
2003
2004
2005

41415
116191938
22
101143
1977314287
4728
35
6935
5447
9439
12
No. of isolates received
ZimbabweUganda
TogoTanzania
SwazilandSudan
SomaliaSouth Africa
SenegalSierra Leone
RwandaRDC
NigerNigeria
MozambiqueMalawi
MaliLiberiaKenya
GuineaGhana
EthiopiaEritreaCongo
Cote D'IvoireChad
Central african republicCameroon
BurundiBotswana
Burkina FasoBenin
Angola
0 500 1000 1500 2000
Poliovirus samples received in 2004
1.1. SURVEILLANCE & MONITORING SURVEILLANCE & MONITORING OF COMMUNICABLE DISEASES - OF COMMUNICABLE DISEASES - POLIOPOLIO

1.1. SURVEILLANCE & MONITORING SURVEILLANCE & MONITORING OF COMMUNICABLE DISEASES - OF COMMUNICABLE DISEASES - POLIOPOLIO

1.1. SURVEILLANCE & SURVEILLANCE & MONITORING OF MONITORING OF COMMUNICABLE DISEASES - COMMUNICABLE DISEASES - MALARIAMALARIA

2. 2. OUTBREAK OUTBREAK RESPONSE & RESPONSE & MANAGEMENTMANAGEMENT
Dr Gillian de JongDr Gillian de JongEpidemiology UnitEpidemiology Unit
National Institute for Communicable National Institute for Communicable Diseases (NICD) Diseases (NICD)
A Laboratory Based Outbreak Network A Laboratory Based Outbreak Network for South Africafor South Africa

3. 3. COMMUNICATION & COMMUNICATION & CONSULTATIONCONSULTATION

44. INTERNATIONAL. INTERNATIONAL
• WORLD HEALTH ORGANIZATION– Collaborating Centres– Regional Reference Laboratory (AFRO)– Training Courses (AFRO)– EQA Programmes (AFRO)– Expert Advisory Committee
• CDC (USA)
• RESEARCH COLLABORATIONS

5. 5. RESEARCH - APPLIED & RESEARCH - APPLIED & OPERATIONALOPERATIONAL
.10
98ZACTN298ZACTN298za179du98za179du
98za422du98za422du98za151du98za151du
96BW15B03
97TZ05
A_SE6594A_Q43
A_UG037A_U455Ib_DJ264Ib_DJ263
Ib_IbNG
E_E4002E_CM240
E_TH253G_G6165
G_NG083G_HH8793
J_SE9173_3
J_SE9280-9
H_VI991
B_MNB_LAI B_D31
B_896
B_OYIB_SF2
B_CAM1
D_Z2Z6
D_ELI
D_NDKD_ZR85
D_UG114
F_VI850
F_F9363
K.CM.MP535
K.ZR.EQTB196BW17B0396BW17B05
C_BR025C_ETH2220
97TZ0496BW0402
96BW040796BW0409
96BW110696BW1104
96BW1210
94IN1124695IN2106893IN999
96BW01B2296BW050496BW0502
96BW16B0196BW16D14
96BW1626
93IN30190493IN905
100
100
100
100
100
100
100
100 100 84
100
100
100100
100
100100
10096100
100
100
100
1009782
Full length HIV genome phylogenetic tree Full length HIV genome phylogenetic tree
Subtype CSubtype C
J van Harmelen, et al, 2001
South AfricaSouth Africa
IndiaIndia

5. RESEARCH – APPLIED & 5. RESEARCH – APPLIED & OPERATIONALOPERATIONAL
KEY AREA :Scaling Up Access for Infant Diagnosis for KEY AREA :Scaling Up Access for Infant Diagnosis for HIV: Dried Blood Spots (DBS) Plus AutomationHIV: Dried Blood Spots (DBS) Plus Automation
A simple protocol using DBS to identify HIV infection status in infants and children less than 1.5 yrs of age

6. ACADEMIC & TRAINING6. ACADEMIC & TRAINING

Functions of Functions of NIOHNIOH
Advisory servicesAdvisory services
Information servicesInformation services
Technical and specialist servicesTechnical and specialist services
LaboratoriesLaboratories
Health hazard evaluationsHealth hazard evaluations
Clinical servicesClinical services
Applied researchApplied research
SurveillanceSurveillance
Development of OH professionalsDevelopment of OH professionals
Statutory autopsy serviceStatutory autopsy service

Occupational Health Occupational Health ResourcesResources

National Priorities and Statutory National Priorities and Statutory ObligationsObligations
Capacity Development
DOH, MPH, MMed, MTech
Workshops, seminars
Courses
On-site, in-service training
National reference facilities
Surveillance
PATHAUT
SORDSA, SAMOSA
Sentinel industry surveys
Research
Priority OH problems
30 concurrent projects
Workplace surveys
Statutory Examination of cardio-
respiratory organs under
Occupational Diseases in Mines and
Works Act 1973 – 3000 per year.
Diagnose compensable occupational
cardio-respiratory disease
Pathology
Advisory Services
Serve on panels
International training site
PATHOUT database
90 000 autopsy results
Annual surveilance reporting
Internationally recognised applied
research

Diagnostic Services

Extension of service to all Extension of service to all the communities in the the communities in the countrycountry
• Transport logistics deployed to service the Transport logistics deployed to service the Primary Health Care (PHC) facilitiesPrimary Health Care (PHC) facilities
• Extend consultation and outreach Extend consultation and outreach pprogrammes to rural provinces rogrammes to rural provinces

Primary Health Care Primary Health Care CoverageCoverage
BranchBranch Total number of clinics Total number of clinics (Incl small hospitals)(Incl small hospitals)
Number Number
Clinics coveredClinics covered
% %
Clinics coveredClinics covered
CentralCentral 10841084 870870 80%80%
CoastalCoastal 21702170 15561556 70%70%
NorthernNorthern 900900 848848 90%90%
TotalTotal 41544154 32743274 79%79%

Provision of Quality Provision of Quality ServiceService
ProgrammeProgramme
• Quality Assessment conducted in all laboratories Quality Assessment conducted in all laboratories
• Turn-around-Times of laboratory results Turn-around-Times of laboratory results measured measured
• Training programs conducted for HCW’sTraining programs conducted for HCW’s
• Regular communication meetings with clients Regular communication meetings with clients
• Client satisfaction surveys conducted and Client satisfaction surveys conducted and remedial action taken on areas of poor remedial action taken on areas of poor performanceperformance

Provincial ProgramsProvincial Programs
• Support both national and provincial health Support both national and provincial health programsprograms
• Information resource to provincial coordinators.Information resource to provincial coordinators.
• Focussed TB, Cervical Cancer Screening, CD4 and Focussed TB, Cervical Cancer Screening, CD4 and Viral load managementViral load management

Cytology

Cervical cancer in SACervical cancer in SA
• Cancer of the cervix one of the commonest cancers in SA.
• NDoH policy: 3 pap smears in a lifetime at 10 yearly intervals starting at age 30 for all women
• Cervical screening programmes, where effectively implemented, have markedly reduced cervical cancer.
• NHLS building capacity for implementation of NDoH policy.

Cytology in the NHLSCytology in the NHLS
Cytology 2004 2005Serious
AbnormalityMinor
Abnormality
Pap Smears 168,209 210,160 24.9% 5,265 2.5% 11,558 5.5%
Non Gynae 71,829 70,255 -2.2%
Total 240,038 280,415 16.8% 5,265 1.9% 11,558 4.1%

Fine needle aspiration Fine needle aspiration biopsy (FNAB)biopsy (FNAB)
Breast FNAB 2005Malignant
Breast
Tygerberg 1,282 247 19.3%
Johannesburg 3,333 469 14.1%
Total 4,615 716 15.5%

The Comprehensive Care Management and
Treatment Programme for HIV and AIDS

CD4 Data CD4 Data 2004/20052004/2005
Total number CD4 tests per month
0
10000
20000
30000
40000
50000
60000
Month
Nu
mb
er
CD
4 t
es
ts

Viral load data 2004/2005Viral load data 2004/2005
Total number of viral loads performed per Month
0
2000
4000
6000
8000
10000
12000
Month
Nu
mb
er
VL
tests
per
sit
e

HIV PCR tests 2004/2005HIV PCR tests 2004/2005
Number of HIV PCR tests done per province
19 38 164 154 11 43
9781
6140
0
2000
4000
6000
8000
10000
12000
LP FSP NWP ECP NCP MP WCP GP
Province
Num
ber
of P
CR
test
s
TB
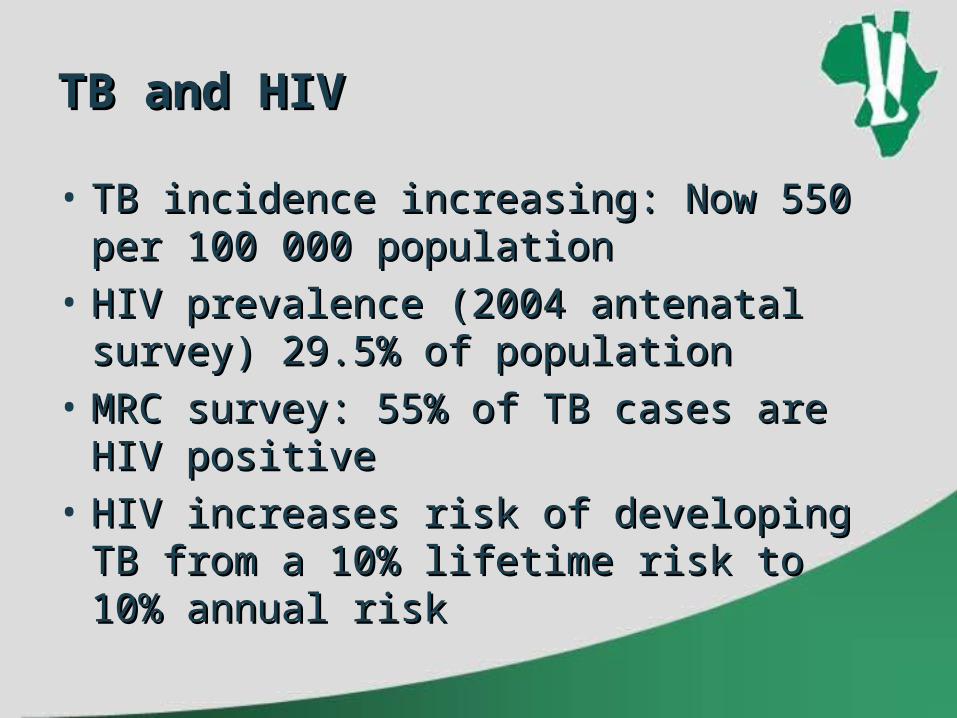
TB and HIVTB and HIV
• TB incidence increasing: Now 550 per TB incidence increasing: Now 550 per 100 000 population100 000 population
• HIV prevalence (2004 antenatal survey) HIV prevalence (2004 antenatal survey) 29.5% of population29.5% of population
• MRC survey: 55% of TB cases are HIV MRC survey: 55% of TB cases are HIV positivepositive
• HIV increases risk of developing TB from HIV increases risk of developing TB from a 10% lifetime risk to 10% annual riska 10% lifetime risk to 10% annual risk

Volume of TB microscopy Volume of TB microscopy
2,004 2,005 Negative Positive
Microscopy 1,167,362 1,290,123 10.5% 1,079,432 83.7% 210,691 16.3%
2,004 2,005 Negative Positive
Microscopy 34,425 200,853 483.5% 164,754 82.0% 36,099 18.0%
Fee for Service
Flat Rate

TB smears per 100 000 TB smears per 100 000 population 2005population 2005
0
2,000
4,000
6,000
8,000
10,000
Per
100
000

Positive TB smear rate per 100 Positive TB smear rate per 100 000 population 2005000 population 2005
0
200
400
600
800
1,000
1,200
1,400
1,600

NHLS IT Network

ENDEND