Embed Size (px)
Citation preview
health.govt.nz
Health of the Health Workforce2015
A report by Health Workforce New Zealand
Health of the Health Workforce2015 A report by Health Workforce New Zealand

Citation: Ministry of Health. 2016. Health of the Health Workforce 2015. Wellington: Ministry of Health.
Published in February 2016 by the Ministry of Health
PO Box 5013, Wellington 6145, New Zealand
ISBN 978-0-947491-53-6 (print) ISBN 978-0-947491-54-3 (online)
HP 6317
This document is available at health.govt.nz
This work is licensed under the Creative Commons Attribution 4.0 International licence. In essence, you are free to: share, ie, copy and redistribute the material in any medium or format; adapt, ie, remix, transform and build upon the material. You must give appropriate credit, provide a link to the licence and indicate if changes were made.
iiiHealth of the Health Workforce 2015
Foreword from the Board Executive Chair, Health Workforce New ZealandThe Board of Health Workforce New Zealand is pleased to release this second report on the health of New Zealand’s health workforce. Health Workforce New Zealand was set up in 2009 to provide strategic leadership and oversight in a sector-wide response to New Zealand’s workforce challenges. I am pleased to say that we have had a successful year working with stakeholders on a range of strategies that strengthen our health workforce in a numbers of ways.
Health Workforce New Zealand’s workforce taskforces have made good progress in coordinating the energy and focus of the large number of stakeholders that have an interest in the development of a sustainable and effective health workforce. Our common goal is to ensure the health workforce is appropriately trained and configured to meet current and future needs so that New Zealanders can be confident of receiving the best care possible.
The Voluntary Bonding Scheme continues to encourage doctors, nurses and midwives into the specialties and areas that have traditionally been hard to staff. There has been a positive uptake of the Nurse Entry to Practice Programme by nurses in their first postgraduate year, with more nurses than ever before taking up employment opportunities in aged residential care. Another critical area that has experienced growth in uptake by new graduate nurses is mental health and addiction nursing. In addition, our universities are producing more medical graduates and more doctors are entering general practice training than ever before.
These examples are part of a number of changes to the health of our health workforce over the past six years. The Board is pleased to be associated with the health workforce at this dynamic and critical time and looks forward to continuing to work with the sector to ensure a sustainable and fit for purpose health workforce for all New Zealanders.
Professor Des Gorman BSc MBChB MD (Auckland) PhD (Sydney) Board Executive Chair, Health Workforce New Zealand

iv Health of the Health Workforce 2015
Foreword from the Acting Director, Health Workforce New ZealandThis is Health Workforce New Zealand’s report on the state of New Zealand’s health and disability workforce. As with the first Health of the Health Workforce report, released in 2014, it sets out what we know about the main occupational groups – doctors, dentists, nurses, midwives, allied health science and technical workers, and non-regulated workers.
The 2014 report has had a significant impact across the health sector in raising understanding of the issues facing New Zealand’s health workforce and the various ways the sector and the Ministry of Health is addressing those issues. It has contributed to the development of strategies and programmes to improve New Zealanders’ health and wellbeing.
Health Workforce New Zealand’s focus continues to be on strengthening the health and disability workforce by improving the recruitment, retention and distribution of health professionals. It works across the sector and at a regional level to align workforce development with service demand.
Another key objective is to strengthen the health workforce intelligence and data we need to provide high-quality support and advice on current and projected gaps in the health workforce. The Health of the Health Workforce report contributes to this by providing data about a wide range of health professions within one publication.
We are grateful to the stakeholder organisations that contributed the data and advice that made this report possible. This year we have also integrated independent contributions from each stakeholder group on the state of their particular workforce. This brings an additional perspective to the report that complements and enhances our knowledge about the health of New Zealand’s health workforce.
Dr Ruth Anderson PhD Acting Director, Health Workforce New Zealand
vHealth of the Health Workforce 2015
ContentsForeword from the Board Executive Chair, Health Workforce New Zealand iii
Foreword from the Acting Director Health Workforce New Zealand iv
Introduction 1
Role of Health Workforce New Zealand 1
Data sources 1
General workforce facts and figures 2
Doctors 3
Ageing medical workforce 4
General practitioners 6
Managing the medical pipeline 6
New Zealand-trained doctors 7
Overseas-trained doctors 7
Dentists 8
New Zealand-trained dentists 8
Nurses 9
Hard-to-staff specialties 9
Scopes of practice 9
Nursing workforce priorities 10
Nurse Entry to Practice and Specialist Practice 11
Ageing nursing workforce 11
Māori and Pacific nurses 12
Overseas-trained nurses 12
Midwives 13
Expanded midwifery student intake 13
Midwifery First Year of Practice 14
Ageing midwifery workforce 15
Midwifery profile 15
Overseas-trained midwives 16
Allied health, science and technical professionals 17
Allied health role in addressing health targets 17
Vulnerability of the allied health workforce 18
Allied Health, Science and Technical Taskforce 19
Kaiāwhina (non-regulated) workers 20
Profile of kaiāwhina workforce 20
Development of five-year action plan 21

vi Health of the Health Workforce 2015
Future prospects for joining the workforce 22
Medical workforce 22
Nursing 22
Midwifery 23
Allied health 23
Kaiāwhina (non-regulated) 23
References 24
Appendix 1: List of responsible authorities and professions regulated 25
Appendix 2: Ratios of trainee doctors to specialists 26
Appendix 3: Number of nurses per 100,000 population 27
Appendix 4: List of allied health, science and technical professionals 28
Appendix 5: List of kaiāwhina (non-regulated) roles 29
Appendix 6: HWNZ current priorities 30
List of figuresFigure 1: Hard-to-staff communities for doctors on the 2015 Voluntary Bonding Scheme 3
Figure 2: Hard-to-staff communities for GP trainees on the 2015 Voluntary Bonding Scheme 4
Figure 3: Percentage of doctors aged 55+ in 29 OECD countries, 2000 and 2013 5
Figure 4: Trends in number of GPs and non-GP specialists 6
Figure 5: Hard-to-staff communities for nurses on the 2015 Voluntary Bonding Scheme 10
Figure 6: Distribution of levels of experience for nurses trained overseas and in New Zealand 12
Figure 7: Hard-to-staff DHBs for DHB-employed midwives on the 2015 Voluntary Bonding Scheme 14
Figure 8: Hard-to-staff communities for lead maternity carer midwives on the 2015 Voluntary Bonding Scheme 16
Figure 9: Percentage of home and community support service workers with a recorded qualification 21
List of tablesTable 1: Medical workforce statistics 5
Table 2: Nursing workforce statistics 11
Table 3: Midwifery workforce statistics 13
Table 4: Allied health workforce statistics 18

1Health of the Health Workforce 2015
IntroductionThe Health of the Health Workforce 2015, is the second of Health Workforce New Zealand’s yearly reports on the state of the New Zealand health and disability workforce, hereafter referred to as the workforce.
Role of Health Workforce New Zealand Health Workforce New Zealand (HWNZ) was established in 2009 to lead and coordinate the planning and development of New Zealand’s health and disability workforce. HWNZ is a business unit within the Ministry of Health. It has an independent board chaired by Professor Des Gorman and is made up of representatives from the health and disability workforce sector.
The sector is made up of responsible authorities (regulatory bodies), professional colleges, representative bodies, tertiary education providers, unions and health workforce employers, including the district health boards (DHBs). HWNZ liaises with the sector about their common interest in the planning, recruitment and retention of a workforce that is fit for purpose, equitably distributed and capable of meeting government health care priorities for New Zealanders, now and into the future.
You can find out more about HWNZ in The Role of Health Workforce New Zealand, published in 2014 and available at www.health.govt.nz/publication/role-health-workforce-new-zealand
HWNZ is the primary provider of funding for post-entry clinical training in New Zealand, with an allocation of $174.3 million from Vote Health in the 2015/16 financial year for postgraduate training, workforce development and innovation.
Data sourcesEvidence from a variety of sources contributes to HWNZ’s ability to synthesise information about the workforce and the environment it operates in, and from there to identify trends.
The data and workforce intelligence cited in these reports are drawn from multiple sources, including regulatory bodies such as: the Medical Council of New Zealand (MCNZ) and the Nursing Council of New Zealand (NCNZ); the wider Ministry of Health; DHBs and other employers; OECD1 reports; and New Zealand Census data.
We have aimed to publish the most recent data in this report, but because the relevant organisations publish their reports at different times of the year and use a range of methodologies, there is some variation in the dates and content of the workforce data.
1 Organisation for Economic Cooperation and Development.

2 Health of the Health Workforce 2015
General workforce facts and figuresThe workforce is made up of a wide variety of occupational groups and is generally grouped under the following occupational headings:
• doctors and dentists – the medical workforce
• nurses
• midwives
• allied health, science and technical workers
• kaiāwhina (non-regulated) workers.
Regulated workforceDoctors, dentists, nurses, midwives and a number of allied health (including allied health science and technical) professions are covered by the Health Practitioners Competence Assurance (HPCA) Act 2003, and are together referred to as the regulated workforce (see Appendix 1). Practitioners must be registered with the relevant regulatory body that issues annual practising certificates, determines appropriate qualifications, considers complaints and takes disciplinary action when needed.
The regulated workforce numbered 97,786 in 2015, based on annual practising certificate data for all regulated professions. This included:
• 52,729 nurses
• 14,678 doctors
• 2236 dentists
• 3068 midwives (based on 2014 data).
DHBs are a key employer of the regulated workforce, with estimated employed full-time equivalent (FTE) workforces in March 2015 (compared to 2008 data) that included:2
• 21,200 (17,523) nurses
• 7648 (5930) doctors
• 892 (801) midwives.
Allied health science and technical statistics are included in table 4 on page 18.
Voluntary Bonding SchemeThe Voluntary Bonding Scheme, administered by HWNZ, incentivises medical, nursing and midwifery graduates to work in hard-to-staff specialties or communities for three to five postgraduate years. Medical physicists, sonographers and radiation therapists working in New Zealand are also eligible in 2015. This may be subject to change. More information is available at www.health.govt.nz.
2 These figures are DHB clinical staffing numbers and are available at www.health.govt.nz. The employed FTE methodology is based on contracted hours, in which one FTE is a person working 40 hours a week or more, not headcount. However if a person works less than 40 hours per week the proportion of hours worked will be counted (eg 30 hours is 0.75FTE).
3Health of the Health Workforce 2015
Northland
WhakataneHospital
Tairawhiti
Wairarapa
Whanganui
TaranakiLakes
South Canterbury
West Coast
Thames Hospital
Wairau Hospital
Southland
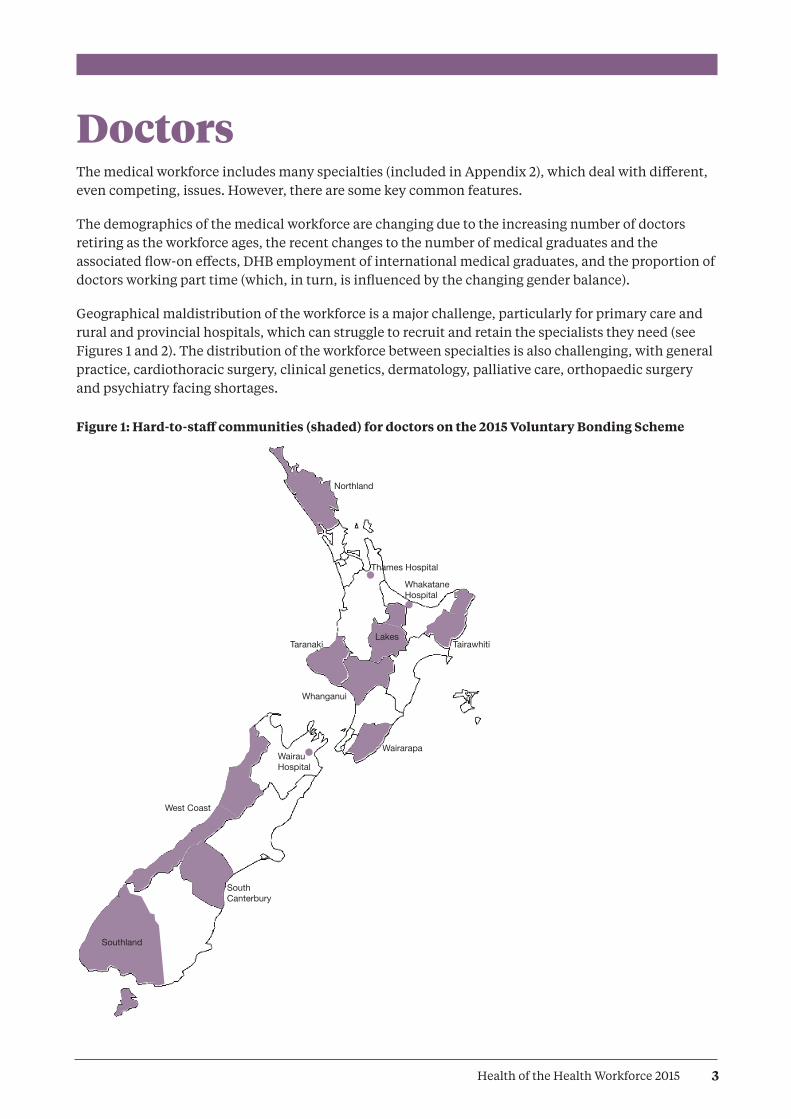
DoctorsThe medical workforce includes many specialties (included in Appendix 2), which deal with different, even competing, issues. However, there are some key common features.
The demographics of the medical workforce are changing due to the increasing number of doctors retiring as the workforce ages, the recent changes to the number of medical graduates and the associated flow-on effects, DHB employment of international medical graduates, and the proportion of doctors working part time (which, in turn, is influenced by the changing gender balance).
Geographical maldistribution of the workforce is a major challenge, particularly for primary care and rural and provincial hospitals, which can struggle to recruit and retain the specialists they need (see Figures 1 and 2). The distribution of the workforce between specialties is also challenging, with general practice, cardiothoracic surgery, clinical genetics, dermatology, palliative care, orthopaedic surgery and psychiatry facing shortages.
Figure 1: Hard-to-staff communities (shaded) for doctors on the 2015 Voluntary Bonding Scheme
4 Health of the Health Workforce 2015
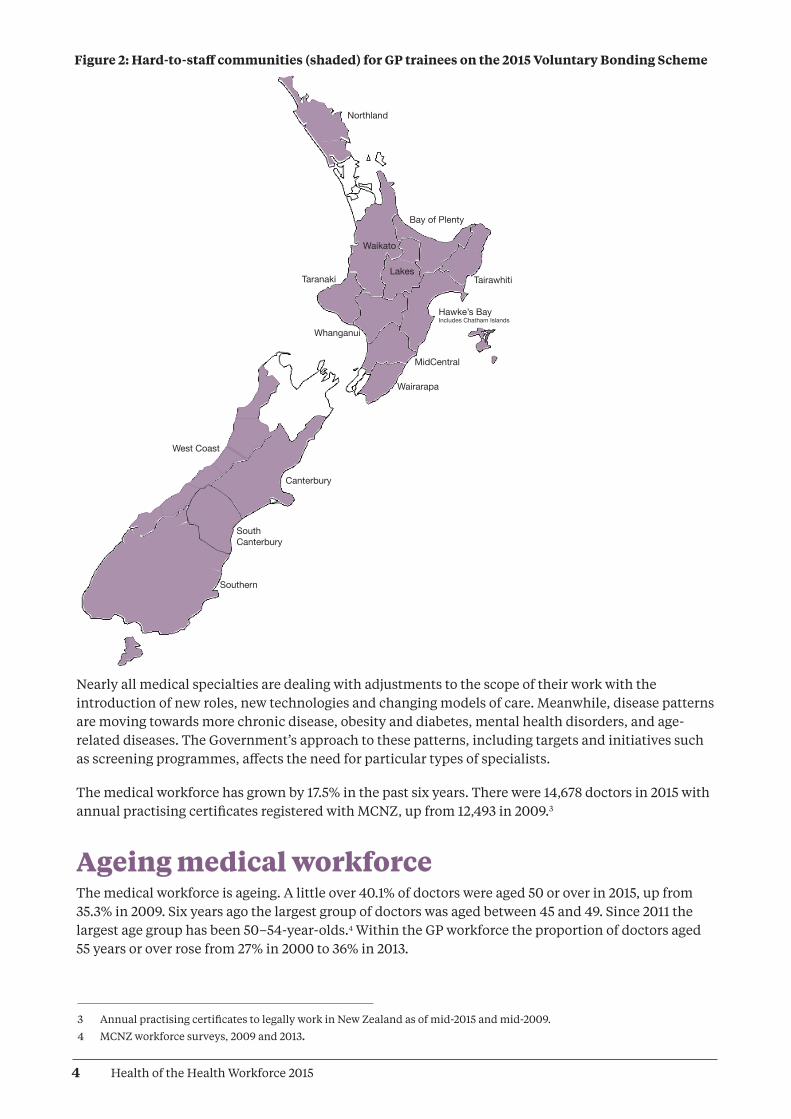
Figure 2: Hard-to-staff communities (shaded) for GP trainees on the 2015 Voluntary Bonding Scheme
Northland
Bay of Plenty
Tairawhiti
Hawke’s BayIncludes Chatham Islands
MidCentral
Wairarapa
Whanganui
TaranakiLakes
Waikato
Canterbury
South Canterbury
Southern
West Coast
3 Annual practising certificates to legally work in New Zealand as of mid-2015 and mid-2009.
4 MCNZ workforce surveys, 2009 and 2013.
Nearly all medical specialties are dealing with adjustments to the scope of their work with the introduction of new roles, new technologies and changing models of care. Meanwhile, disease patterns are moving towards more chronic disease, obesity and diabetes, mental health disorders, and age-related diseases. The Government’s approach to these patterns, including targets and initiatives such as screening programmes, affects the need for particular types of specialists.
The medical workforce has grown by 17.5% in the past six years. There were 14,678 doctors in 2015 with annual practising certificates registered with MCNZ, up from 12,493 in 2009.3
Ageing medical workforceThe medical workforce is ageing. A little over 40.1% of doctors were aged 50 or over in 2015, up from 35.3% in 2009. Six years ago the largest group of doctors was aged between 45 and 49. Since 2011 the largest age group has been 50–54-year-olds.4 Within the GP workforce the proportion of doctors aged 55 years or over rose from 27% in 2000 to 36% in 2013.
5Health of the Health Workforce 2015
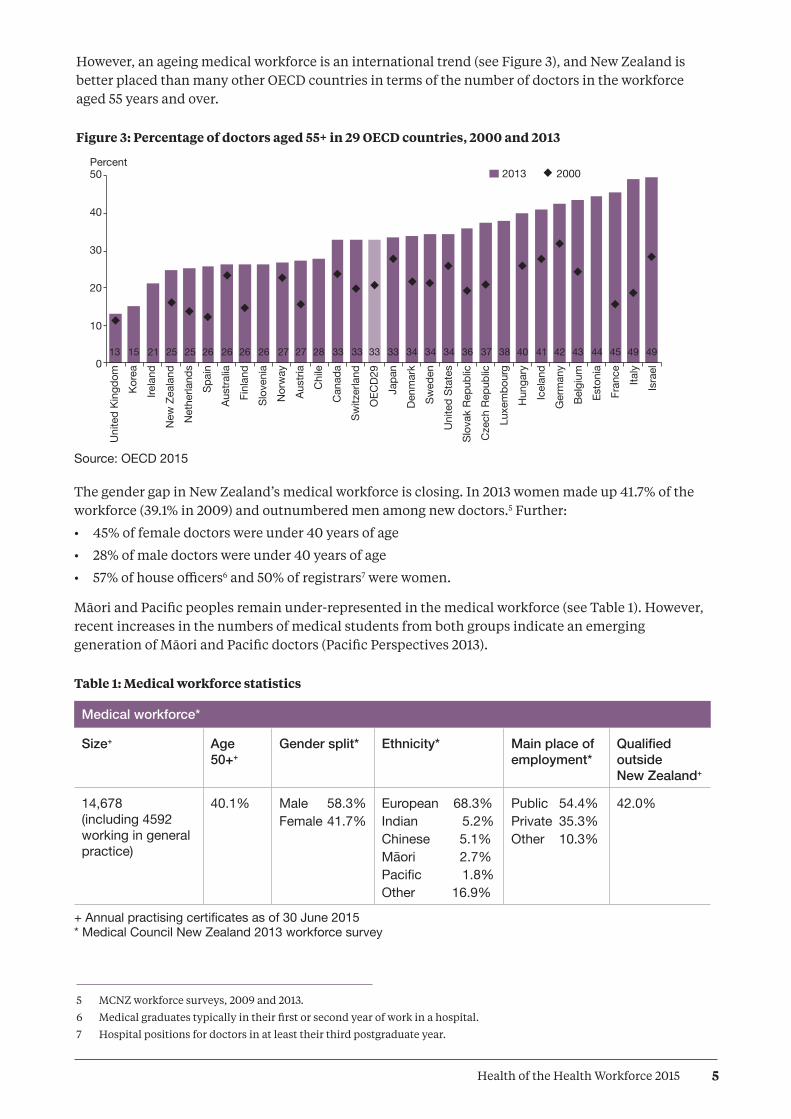
However, an ageing medical workforce is an international trend (see Figure 3), and New Zealand is better placed than many other OECD countries in terms of the number of doctors in the workforce aged 55 years and over.
Figure 3: Percentage of doctors aged 55+ in 29 OECD countries, 2000 and 2013
5 MCNZ workforce surveys, 2009 and 2013.
6 Medical graduates typically in their first or second year of work in a hospital.
7 Hospital positions for doctors in at least their third postgraduate year.
Source: OECD 2015
The gender gap in New Zealand’s medical workforce is closing. In 2013 women made up 41.7% of the workforce (39.1% in 2009) and outnumbered men among new doctors.5 Further:
• 45% of female doctors were under 40 years of age
• 28% of male doctors were under 40 years of age
• 57% of house officers6 and 50% of registrars7 were women.
Māori and Pacific peoples remain under-represented in the medical workforce (see Table 1). However, recent increases in the numbers of medical students from both groups indicate an emerging generation of Māori and Pacific doctors (Pacific Perspectives 2013).
Table 1: Medical workforce statistics
Medical workforce*
Size+ Age 50++
Gender split* Ethnicity* Main place of employment*
Qualified outside New Zealand+
14,678(including 4592 working in general practice)
40.1% Male 58.3%Female 41.7%
European 68.3%Indian 5.2%Chinese 5.1%Māori 2.7%Pacific 1.8%Other 16.9%
Public 54.4%Private 35.3%Other 10.3%
42.0%
+ Annual practising certificates as of 30 June 2015 * Medical Council New Zealand 2013 workforce survey
Percent50
40
30
20
10
0
HthofHthWkfce14/15 Fig 3
2013 2000
13 15 21 25 25 26 26 26 26 27 27 28 33 33 33 33 34 34 34 36 37 38 40 41 42 43 44 45 49 49
Uni
ted
King
dom
Kore
aIre
land
New
Zea
land
Net
herla
nds
Spai
nAu
stra
liaFi
nlan
dSl
oven
iaN
orw
ayAu
stria
Chi
leC
anad
aSw
itzer
land
OEC
D29
Japa
nDe
nmar
kSw
eden
Uni
ted
Stat
esSl
ovak
Rep
ublic
Cze
ch R
epub
licLu
xem
bour
gH
unga
ryIc
elan
dG
erm
any
Belg
ium
Esto
nia
Fran
ceIta
lyIs
rael
6 Health of the Health Workforce 2015
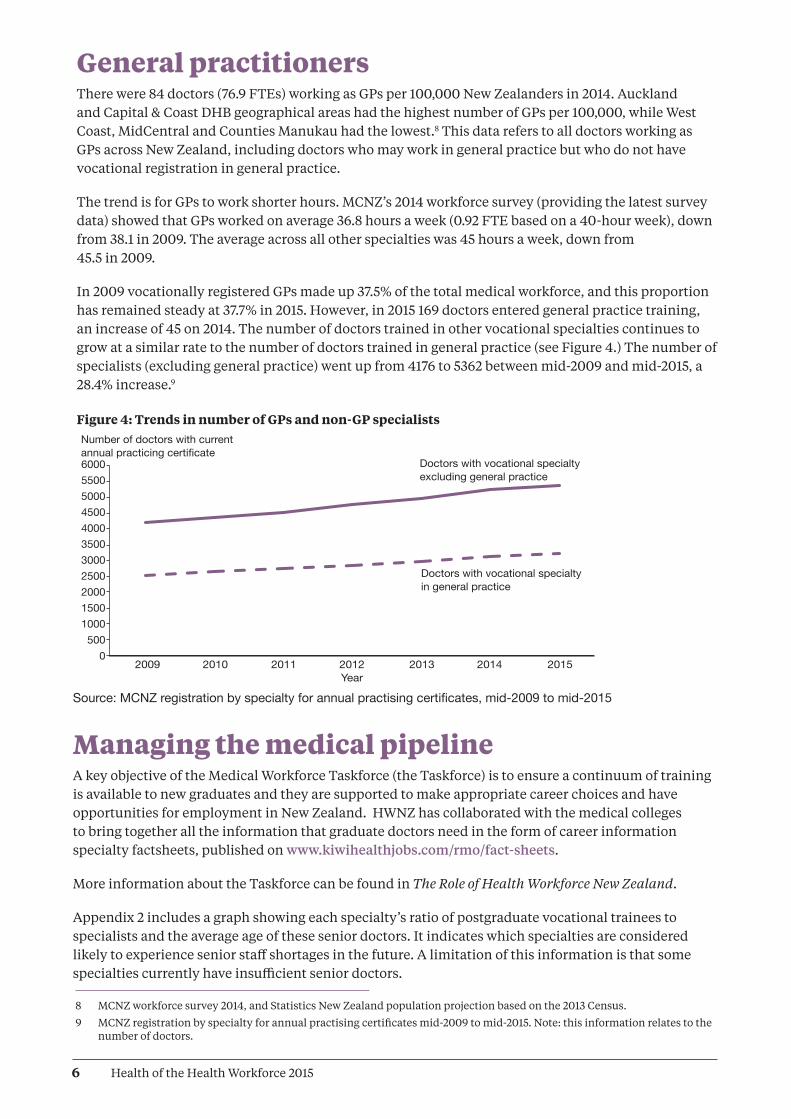
General practitionersThere were 84 doctors (76.9 FTEs) working as GPs per 100,000 New Zealanders in 2014. Auckland and Capital & Coast DHB geographical areas had the highest number of GPs per 100,000, while West Coast, MidCentral and Counties Manukau had the lowest.8 This data refers to all doctors working as GPs across New Zealand, including doctors who may work in general practice but who do not have vocational registration in general practice.
The trend is for GPs to work shorter hours. MCNZ’s 2014 workforce survey (providing the latest survey data) showed that GPs worked on average 36.8 hours a week (0.92 FTE based on a 40-hour week), down from 38.1 in 2009. The average across all other specialties was 45 hours a week, down from 45.5 in 2009.
In 2009 vocationally registered GPs made up 37.5% of the total medical workforce, and this proportion has remained steady at 37.7% in 2015. However, in 2015 169 doctors entered general practice training, an increase of 45 on 2014. The number of doctors trained in other vocational specialties continues to grow at a similar rate to the number of doctors trained in general practice (see Figure 4.) The number of specialists (excluding general practice) went up from 4176 to 5362 between mid-2009 and mid-2015, a 28.4% increase.9
Figure 4: Trends in number of GPs and non-GP specialists
8 MCNZ workforce survey 2014, and Statistics New Zealand population projection based on the 2013 Census.
9 MCNZ registration by specialty for annual practising certificates mid-2009 to mid-2015. Note: this information relates to the number of doctors.
Number of doctors with currentannual practicing certificate60005500500045004000350030002500200015001000500
0 2009 2010 2011 2012 2013 2014 2015 Year
HthofHthWkfce14/15 Fig 4
Doctors with vocational specialtyexcluding general practice
Doctors with vocational specialtyin general practice
Source: MCNZ registration by specialty for annual practising certificates, mid-2009 to mid-2015
Managing the medical pipelineA key objective of the Medical Workforce Taskforce (the Taskforce) is to ensure a continuum of training is available to new graduates and they are supported to make appropriate career choices and have opportunities for employment in New Zealand. HWNZ has collaborated with the medical colleges to bring together all the information that graduate doctors need in the form of career information specialty factsheets, published on www.kiwihealthjobs.com/rmo/fact-sheets.
More information about the Taskforce can be found in The Role of Health Workforce New Zealand.
Appendix 2 includes a graph showing each specialty’s ratio of postgraduate vocational trainees to specialists and the average age of these senior doctors. It indicates which specialties are considered likely to experience senior staff shortages in the future. A limitation of this information is that some specialties currently have insufficient senior doctors.
7Health of the Health Workforce 2015
Prospects are particularly good for general practice, especially in rural areas, as New Zealand’s population grows and ages. General practice provides doctors with the opportunity of working with a wide variety of patients and being the first point of contact for health care. Working arrangements have changed, with most GPs now working as contractors or employees and often pursuing a portfolio-style career. For example, this might involve a combination of general practice, special interest practice, clinical governance and teaching.
New Zealand continues to employ overseas-trained doctors to address staff shortages. Such doctors accounted for 42.6% of the medical workforce as of mid-2015, compared to 43.7% in 2013.10 This is in part due to increased numbers of New Zealand-trained medical graduates, and fewer overseas-trained doctors coming to work in New Zealand.
New Zealand-trained doctorsThe New Zealand-trained medical workforce is being boosted by an additional 200 government-funded medical student places, phased in between 2010 and 2018. This in turn means that more postgraduate year one (PGY1) employment positions are required in DHBs.
In 2013, for the first time, there were more applicants than PGY1 vacancies as increasing numbers of graduates entered the workforce. HWNZ and DHBs ensured that all New Zealand government-funded medical students who graduated in 2013, 2014 and 2015 received offers of employment. The Taskforce’s priority is to ensure this will continue in the years to come.
While the Taskforce initially focused on the immediate postgraduate period, a whole-of-career perspective has now been adopted. The most important issue is the impact of a prolonged period of medical labour market shortages on the workloads, wellbeing and productivity of DHB-employed senior doctors.
Other areas under consideration by the Taskforce include the distribution, long-term retention and retirement intentions of doctors trained in New Zealand and overseas. Leadership opportunities in systems improvement and innovation, consistent with the In Good Hands report on clinical leadership (Ministerial Task Group on Clinical Leadership 2009), are another focus for the Taskforce.
Overseas-trained doctorsOf all overseas-trained doctors who work in New Zealand, those from the United States of America have the lowest retention rates, followed by doctors from the United Kingdom and Oceania. Overseas-trained doctors from North Africa and the Middle East have the highest retention rates, followed by those from sub-Saharan Africa and Asia.
Retention rates for all overseas-trained doctors level out at about 30% four years after registration, with only gradual decreases thereafter. This was a consistent annual trend between 2000 and 2013, the period examined by MCNZ’s analysis of its 2000 to 2014 workforce.
10 MCNZ registration for annual practising certificates, mid-2009 to mid-2015.
8 Health of the Health Workforce 2015
Dentists In 2014 there were 2173 dentists with annual practising certificates registered with the Dental Council of New Zealand (DCNZ). This had grown by 63 to 2236 on 31 March 2015.11 The number of practising dentists per 100,000 New Zealanders rose from 48.2 to 48.8 per 100,000 during this period.12, 13
More than 80% of the dentist workforce is based in private practice. There are sufficient dentist numbers in New Zealand overall, but there remains a geographical maldistribution, particularly affecting rural areas. Distribution varies from 134 dentists per 100,000 people in Otago and 101 per 100,000 in Auckland, through to 30 per 100,000 in Tairāwhiti.
The 2010/11 workforce survey showed that 2.5% of dentists identified as Māori and 0.8% as Pacific people.14
New Zealand-trained dentistsNew Zealand has one dental school (the Faculty of Dentistry at the University of Otago). Entry to the undergraduate Bachelor of Dental Surgery programme is highly competitive (in excess of 700 applications for the 60 places). Entry is via the prerequisite first year Health Science course, and this requires very high levels of academic achievement (grade averages within the top few percent).
The increase in the dentist workforce stems from both New Zealand graduates and overseas-trained dentists, both via the New Zealand Dental Registration Exam (NZDREX) process and individual reciprocal recognition registration.
In terms of workforce supply and sufficient employment, the New Zealand dental workforce is expecting to be affected by the four new dental schools recently established in Australia (giving a total of nine dental schools), which have led to an oversupply of dentists. This has substantially altered the availability of employment for young dentists in Australia. With Australian dentist graduates having automatic right to registration in New Zealand through the trans-Tasman Mutual Recognition Arrangement, this is expected to have an impact within New Zealand over the next few years.
For information on other professions that provide dental care, particularly to children and young people, see the ‘Allied health, science and technical professions’ section of this report.
11 Dental Council of New Zealand annual report (provisional data).
12 Dental Council of New Zealand annual report (provisional data).
13 Statistics New Zealand population projection based on 2013 Census; 2014 update.
14 Dental Council of New Zealand workforce analysis 2010: reporting period dentists October 2010 to September 2011.

9Health of the Health Workforce 2015
NursesThe nursing workforce has grown steadily over the past six years. There were 52,729 nurses with annual practising certificates registered with the Nursing Council New Zealand (NCNZ) as of 31 March 2015, including:15
• 145 nurse practitioners
• 49,769 registered nurses
• 2815 enrolled nurses.
This represents an increase of 6764 nurses since 2009, when there were 45,965 practising nurses, and an increase of 4202 since 2011 (48,527).16 Figures cited in this section are from the New Zealand Nursing Council Register as of 31 March 2015, unless otherwise stated.
The number of practising nurses per 1000 population has increased from 10.6 in 2009 to 11.5 in 2015.17, 18 See Appendix 2 for numbers of nurses per 100,000 population by DHB and in New Zealand as a whole.
Nurses currently work an average of 29.9 hours a week (just under 0.75 FTE, based on a 40-hour week), down slightly on 2009’s average of 30.6 hours. The practice area with the highest percentage of nurses is surgical (9.6%), which is a slight decrease on the 10% in 2014. The lowest percentages are in youth health (0.23%) and family planning and sexual health (0.3%).19
Hard-to-staff specialtiesThe Voluntary Bonding Scheme includes aged care (aged residential care and older persons’ health services), primary care and mental health, including addiction services, as 2015’s hard-to-staff specialties for nurses (see Figure 5). The percentages of nurses currently working in these specialties are:
• 9% in aged care
• 7.6% in mental health services
• 5.2% in primary care
• 0.4% in addiction services.
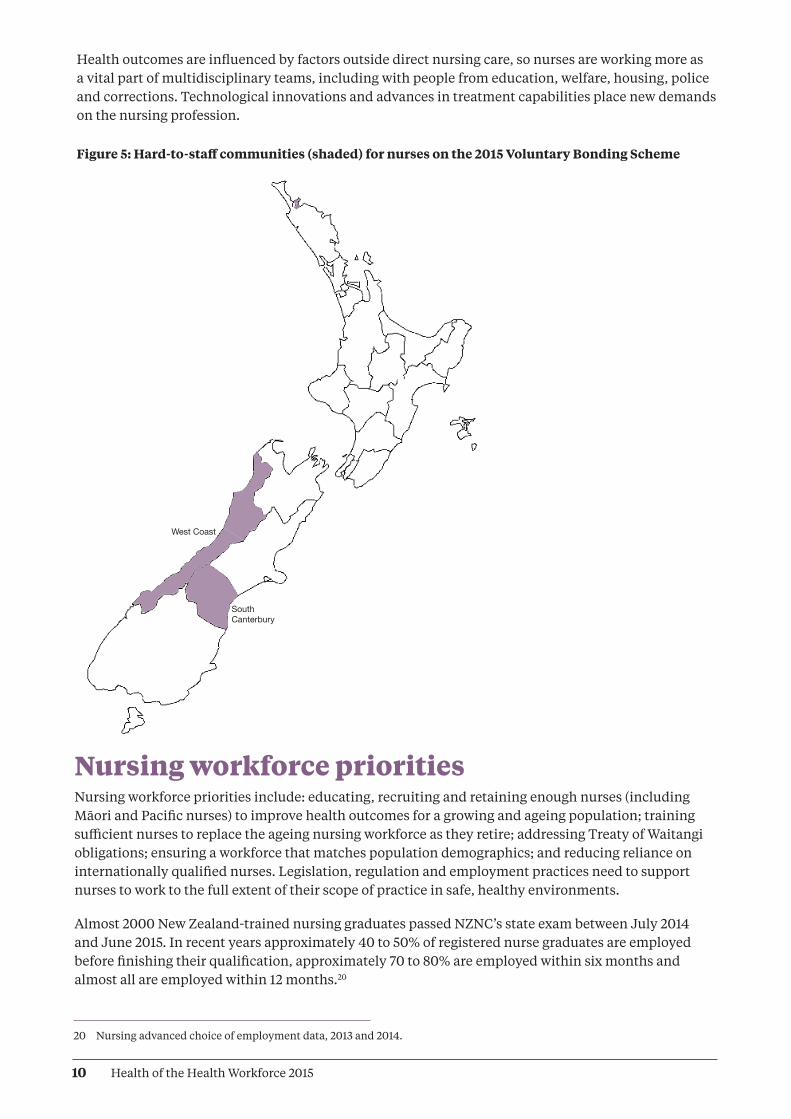
The 2015 hard-to-staff communities for nurses are West Coast DHB and South Canterbury DHB.
Scopes of practiceEnrolled nurse, registered nurse and nurse practitioner scopes of practice are flexible, generalist and responsive to meeting people’s changing health needs. Relationships based on partnerships are essential to nursing practice.
15 NCNZ end of year statistics as at 31 March 2015.
16 NCNZ annual reports 2009, 2011.
17 NCNZ end of year statistics as at 31 March 2015.
18 Statistics New Zealand population projection based on 2013 Census; 2014 update.
19 NCNZ end of year statistics as at 31 March 2015.
10 Health of the Health Workforce 2015
Health outcomes are influenced by factors outside direct nursing care, so nurses are working more as a vital part of multidisciplinary teams, including with people from education, welfare, housing, police and corrections. Technological innovations and advances in treatment capabilities place new demands on the nursing profession.
Figure 5: Hard-to-staff communities (shaded) for nurses on the 2015 Voluntary Bonding Scheme
20 Nursing advanced choice of employment data, 2013 and 2014.
South Canterbury
West Coast
Nursing workforce prioritiesNursing workforce priorities include: educating, recruiting and retaining enough nurses (including Māori and Pacific nurses) to improve health outcomes for a growing and ageing population; training sufficient nurses to replace the ageing nursing workforce as they retire; addressing Treaty of Waitangi obligations; ensuring a workforce that matches population demographics; and reducing reliance on internationally qualified nurses. Legislation, regulation and employment practices need to support nurses to work to the full extent of their scope of practice in safe, healthy environments.
Almost 2000 New Zealand-trained nursing graduates passed NZNC’s state exam between July 2014 and June 2015. In recent years approximately 40 to 50% of registered nurse graduates are employed before finishing their qualification, approximately 70 to 80% are employed within six months and almost all are employed within 12 months.20
11Health of the Health Workforce 2015
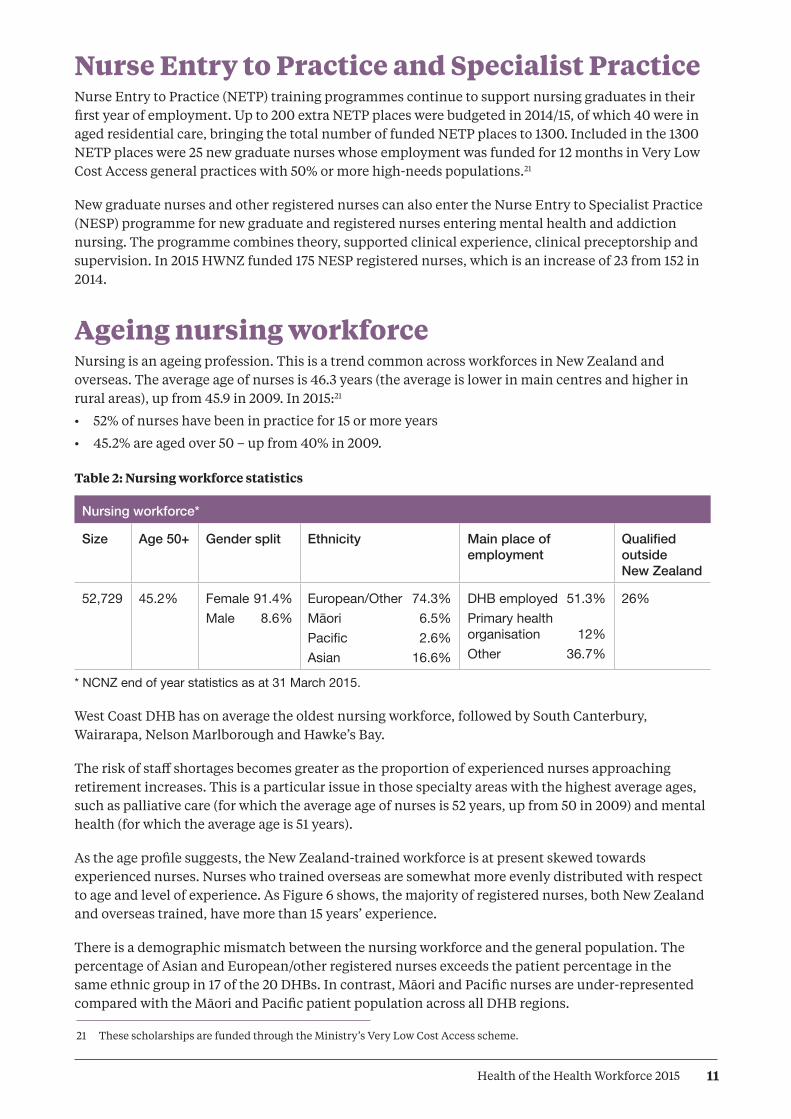
Nurse Entry to Practice and Specialist PracticeNurse Entry to Practice (NETP) training programmes continue to support nursing graduates in their first year of employment. Up to 200 extra NETP places were budgeted in 2014/15, of which 40 were in aged residential care, bringing the total number of funded NETP places to 1300. Included in the 1300 NETP places were 25 new graduate nurses whose employment was funded for 12 months in Very Low Cost Access general practices with 50% or more high-needs populations.21
New graduate nurses and other registered nurses can also enter the Nurse Entry to Specialist Practice (NESP) programme for new graduate and registered nurses entering mental health and addiction nursing. The programme combines theory, supported clinical experience, clinical preceptorship and supervision. In 2015 HWNZ funded 175 NESP registered nurses, which is an increase of 23 from 152 in 2014.
Ageing nursing workforceNursing is an ageing profession. This is a trend common across workforces in New Zealand and overseas. The average age of nurses is 46.3 years (the average is lower in main centres and higher in rural areas), up from 45.9 in 2009. In 2015:21
• 52% of nurses have been in practice for 15 or more years
• 45.2% are aged over 50 – up from 40% in 2009.
Table 2: Nursing workforce statistics
Nursing workforce*
Size Age 50+ Gender split Ethnicity Main place of employment
Qualified outside New Zealand
52,729 45.2% Female 91.4%Male 8.6%
European/Other 74.3%Māori 6.5%Pacific 2.6%Asian 16.6%
DHB employed 51.3%Primary health organisation 12%Other 36.7%
26%
* NCNZ end of year statistics as at 31 March 2015.
West Coast DHB has on average the oldest nursing workforce, followed by South Canterbury, Wairarapa, Nelson Marlborough and Hawke’s Bay.
The risk of staff shortages becomes greater as the proportion of experienced nurses approaching retirement increases. This is a particular issue in those specialty areas with the highest average ages, such as palliative care (for which the average age of nurses is 52 years, up from 50 in 2009) and mental health (for which the average age is 51 years).
As the age profile suggests, the New Zealand-trained workforce is at present skewed towards experienced nurses. Nurses who trained overseas are somewhat more evenly distributed with respect to age and level of experience. As Figure 6 shows, the majority of registered nurses, both New Zealand and overseas trained, have more than 15 years’ experience.
There is a demographic mismatch between the nursing workforce and the general population. The percentage of Asian and European/other registered nurses exceeds the patient percentage in the same ethnic group in 17 of the 20 DHBs. In contrast, Māori and Pacific nurses are under-represented compared with the Māori and Pacific patient population across all DHB regions.
21 These scholarships are funded through the Ministry’s Very Low Cost Access scheme.

12 Health of the Health Workforce 2015
A further issue for the nursing workforce is that when economic conditions improve, the trend has been for nurses to exit the New Zealand workforce. Some leave the profession, while others seek employment in countries such as Australia, where a shortage of nurses is forecast. This is expected to place further pressure on New Zealand’s future supply of nurses.
Māori and Pacific nursesThe percentage of Māori nurses within the nursing workforce is slowly rising – increasing from 3.6% in 2009 to 6.5% in 2015 – but the percentage of Pacific nurses has remained static at 2.6% since 2009. (The number of Pacific nurses is rising, but so is the size of the overall nursing workforce.) Nursing is the second largest occupational group for Pacific people in the health and disability workforce, behind care and support workers (Pacific Perspectives 2013). The majority of nurses who identify as Pacific people work in the greater Auckland area, home to 70% of New Zealand’s Pacific population.
Overseas-trained nursesOverseas-trained nurses make up 26% of New Zealand’s nursing workforce. Their average age is 43 years, compared with 47.5 years for New Zealand-trained nurses. Just over half of overseas-trained nurses come from the United Kingdom, the Philippines, India, Australia and South Africa.
Figure 6: Distribution of levels of experience for nurses trained overseas and in New Zealand
Source: NCNZ end of year statistics as at 31 March 2015
A Nursing Taskforce has been established, a partnership between HWNZ, the Office of the Chief Nurse and the National Nursing Organisation. See The Role of Health Workforce New Zealand for more information.
Percent 60
50
40
30
20
10
0 Unknown <12 months 1–5 years 6–10 years 11–15 years Over 15 years Length of time working as at 21 March 2015
HthofHthWkfce14/15 Fig 6
Overseas trainedNew Zealand trained
13Health of the Health Workforce 2015
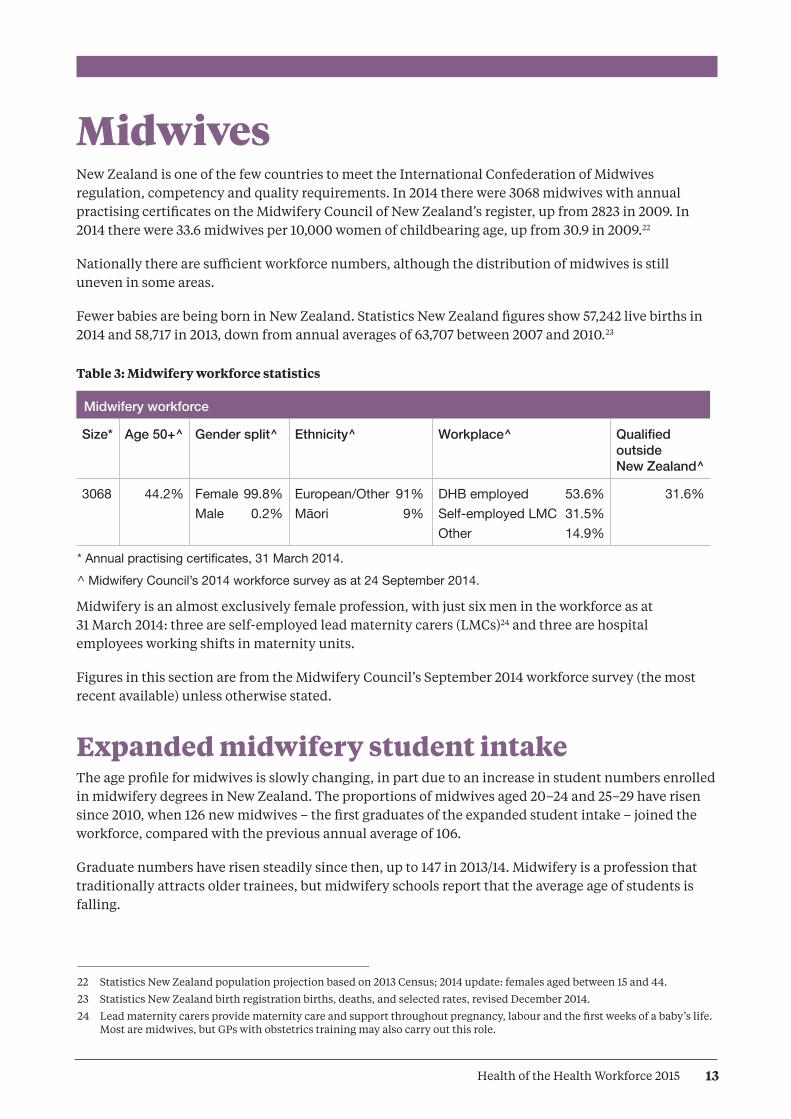
MidwivesNew Zealand is one of the few countries to meet the International Confederation of Midwives regulation, competency and quality requirements. In 2014 there were 3068 midwives with annual practising certificates on the Midwifery Council of New Zealand’s register, up from 2823 in 2009. In 2014 there were 33.6 midwives per 10,000 women of childbearing age, up from 30.9 in 2009.22
Nationally there are sufficient workforce numbers, although the distribution of midwives is still uneven in some areas.
Fewer babies are being born in New Zealand. Statistics New Zealand figures show 57,242 live births in 2014 and 58,717 in 2013, down from annual averages of 63,707 between 2007 and 2010.23
Table 3: Midwifery workforce statistics
Midwifery workforce
Size* Age 50+^ Gender split^ Ethnicity^ Workplace^ Qualified outside New Zealand^
3068 44.2% Female 99.8%Male 0.2%
European/Other 91%Māori 9%
DHB employed 53.6%Self-employed LMC 31.5%Other 14.9%
31.6%
* Annual practising certificates, 31 March 2014.^ Midwifery Council’s 2014 workforce survey as at 24 September 2014.
Midwifery is an almost exclusively female profession, with just six men in the workforce as at 31 March 2014: three are self-employed lead maternity carers (LMCs)24 and three are hospital employees working shifts in maternity units.
Figures in this section are from the Midwifery Council’s September 2014 workforce survey (the most recent available) unless otherwise stated.
Expanded midwifery student intakeThe age profile for midwives is slowly changing, in part due to an increase in student numbers enrolled in midwifery degrees in New Zealand. The proportions of midwives aged 20–24 and 25–29 have risen since 2010, when 126 new midwives – the first graduates of the expanded student intake – joined the workforce, compared with the previous annual average of 106.
Graduate numbers have risen steadily since then, up to 147 in 2013/14. Midwifery is a profession that traditionally attracts older trainees, but midwifery schools report that the average age of students is falling.
22 Statistics New Zealand population projection based on 2013 Census; 2014 update: females aged between 15 and 44.
23 Statistics New Zealand birth registration births, deaths, and selected rates, revised December 2014.
24 Lead maternity carers provide maternity care and support throughout pregnancy, labour and the first weeks of a baby’s life. Most are midwives, but GPs with obstetrics training may also carry out this role.

14 Health of the Health Workforce 2015
Northland
Tairawhiti
Hawke’s BayIncludes Chatham Islands
WairarapaHutt
Capital & Coast
Whanganui
Taranaki
Counties Manukau
South Canterbury
Southern
West Coast
Midwifery First Year of Practice The Midwifery First Year of Practice programme supports midwifery graduates in their first year of employment. The programme provides a framework for graduates to consolidate their knowledge, skills and clinical competencies, and includes compulsory and elective education and one-on-one mentoring with a New Zealand College of Midwives’ approved mentor. The programme is now compulsory for all new graduate midwives who wish to practise in New Zealand. In 2015, 161 new midwifery graduates were completing the programme.
Figure 7: Hard-to-staff DHBs (shaded) for DHB-employed midwives on the 2015 Voluntary Bonding Scheme

15Health of the Health Workforce 2015
Ageing midwifery workforceThe average age of midwives in 2014 was 47.3 years,25 a small increase from 47 years in 2009 and 47.2 years in 2010; 42.8% of midwives had been in practice for more than 15 years, and 44.2% of midwives were aged over 50.
Midwifery profileThe percentage of midwives identifying Māori as their first ethnicity in 2014 was 5.6%26 up from 4.6 % in 2009. Māori midwives are in demand, particularly in rural areas, where anecdotal reports suggest workloads are rising due to the increasing expectations of whānau (Kyle and Aileone 2013).
A total of 39.2% of midwives worked 32 hours a week or less in 2014 (0.75 FTE, based on a 40-hour week) – little change from 2009’s figure of 39.8% (Midwifery Council of New Zealand 2010). That year LMC midwives cared for an average of 45.1 women a year (Kyle and Aileone 2013). The recommended caseload is 40 to 60.
Midwives provide the majority of maternity services in rural areas, either as self-employed LMCs, who may travel from the nearest city, or as core midwives, who work shifts in hospitals.
About three-quarters of practising midwives work in the North Island, where a number of DHBs report staff shortages, according to the Midwifery and Maternity Provider Organisation’s (MMPO) annual workforce mapping project (Kyle and Aileone 2013).
The South Island’s workforce is more stable, but rural communities across the country are vulnerable to shortages if a midwife retires or leaves the area. It can take up to two years to recruit a replacement – especially if an experienced midwife with a large caseload departs. The Voluntary Bonding Scheme signals hard-to-staff communities for midwives (see Figures 7 and 8).
The MMPO’s mapping project found the number of hospital midwives dropped between 2011 and 2013, from 1444 down to 1345. This was in part due to some midwives in rural areas choosing to become self-employed LMCs.
25 Midwifery Council of New Zealand, 2014 midwifery workforce survey.
26 Midwifery Council of New Zealand, 2014 midwifery workforce survey.
16 Health of the Health Workforce 2015
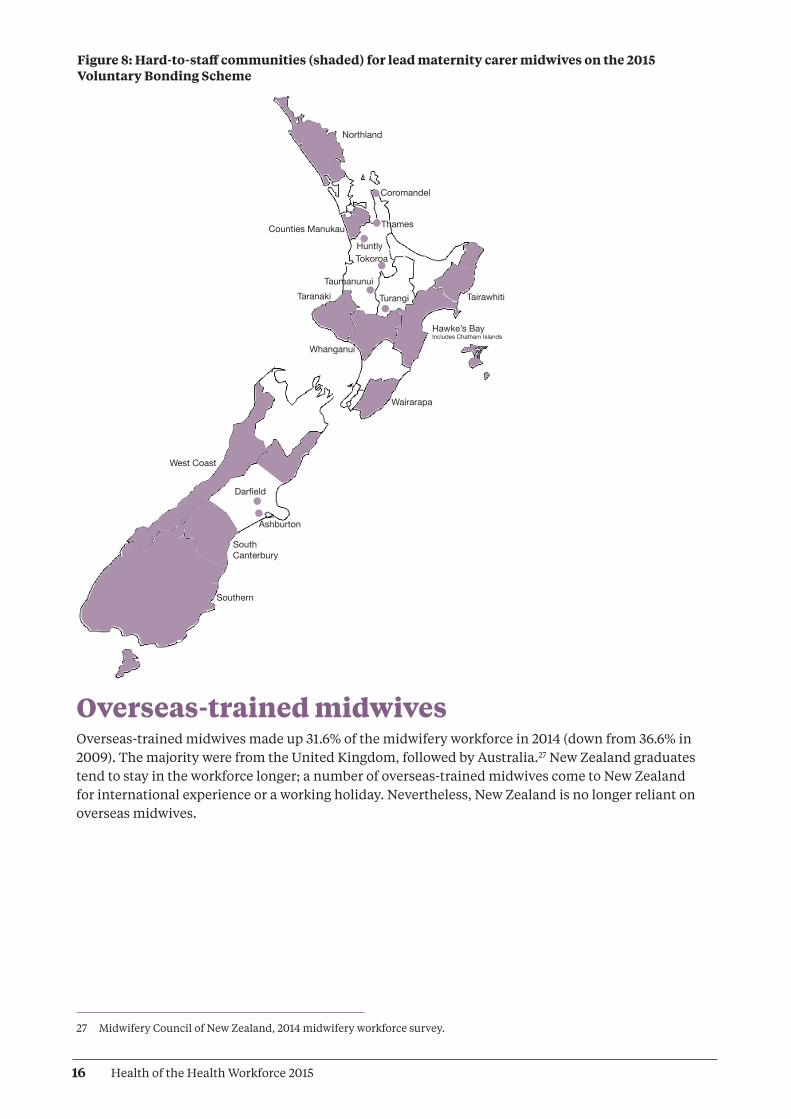
Figure 8: Hard-to-staff communities (shaded) for lead maternity carer midwives on the 2015 Voluntary Bonding Scheme
Northland
Tairawhiti
Hawke’s BayIncludes Chatham Islands
Wairarapa
Whanganui
Taranaki
Counties Manukau
South Canterbury
Southern
West Coast
Coromandel
Thames
HuntlyTokoroa
Taumanunui
Turangi
Darfield
Ashburton
Overseas-trained midwivesOverseas-trained midwives made up 31.6% of the midwifery workforce in 2014 (down from 36.6% in 2009). The majority were from the United Kingdom, followed by Australia.27 New Zealand graduates tend to stay in the workforce longer; a number of overseas-trained midwives come to New Zealand for international experience or a working holiday. Nevertheless, New Zealand is no longer reliant on overseas midwives.
27 Midwifery Council of New Zealand, 2014 midwifery workforce survey.

17Health of the Health Workforce 2015
28 See Appendix 4 for a list of professions included under the allied health umbrella. This is not intended to be an exhaustive list; there is a lack of agreement about which professions should be included.
Allied health, science and technical professionalsThis workforce is operating within a context of increasing expectations and ability to deliver health services and demographic changes that are adding both complexity and volume of demand. Technological innovations and advances in treatment capabilities place new demands on the workforce. Alongside these challenges there is the need to reduce growth in expenditure in order to deliver sustainable health services.
Allied health, science and technical (allied health) professions have evolving scopes of practice to provide more responsive and integrated care, both within hospital systems and closer to home. New health pathway coordinator roles are emerging, as are health information, communication and technology (ICT) and informatics roles.
Allied health professions work within almost all service areas and across multiple sectors, but some professions lack visibility. This leads to challenges with recruitment and resourcing. A lack of robust data can lead to poor workforce planning for capacity and capability.
For some professions, the lack of New Zealand training providers leads to training and recruitment challenges. The lack of career development frameworks contributes to difficulties retaining staff and building depth of expertise.
Allied health role in addressing health targetsA number of initiatives are in place to address these challenges, including: extended roles for assistants; new roles (such as checking technicians); advanced roles (such as prescribing dietitians and pharmacists); and revised patient pathways. The value of utilising allied health practitioners in pathway, referral and care coordination roles is also being recognised and applied in a growing number of areas.
There are more than 40 professions in the allied health workforce,28 which includes health professions that provide technical and scientific expertise to support the diagnosis, monitoring, management and treatment of health conditions. This workforce is becoming critical for addressing health targets, especially the diagnosis of chronic and non-communicable conditions such as cancer and heart disease. About 20 allied health professions are regulated under the HPCA Act. A list of these professions can be found in Appendix 4.
18 Health of the Health Workforce 2015
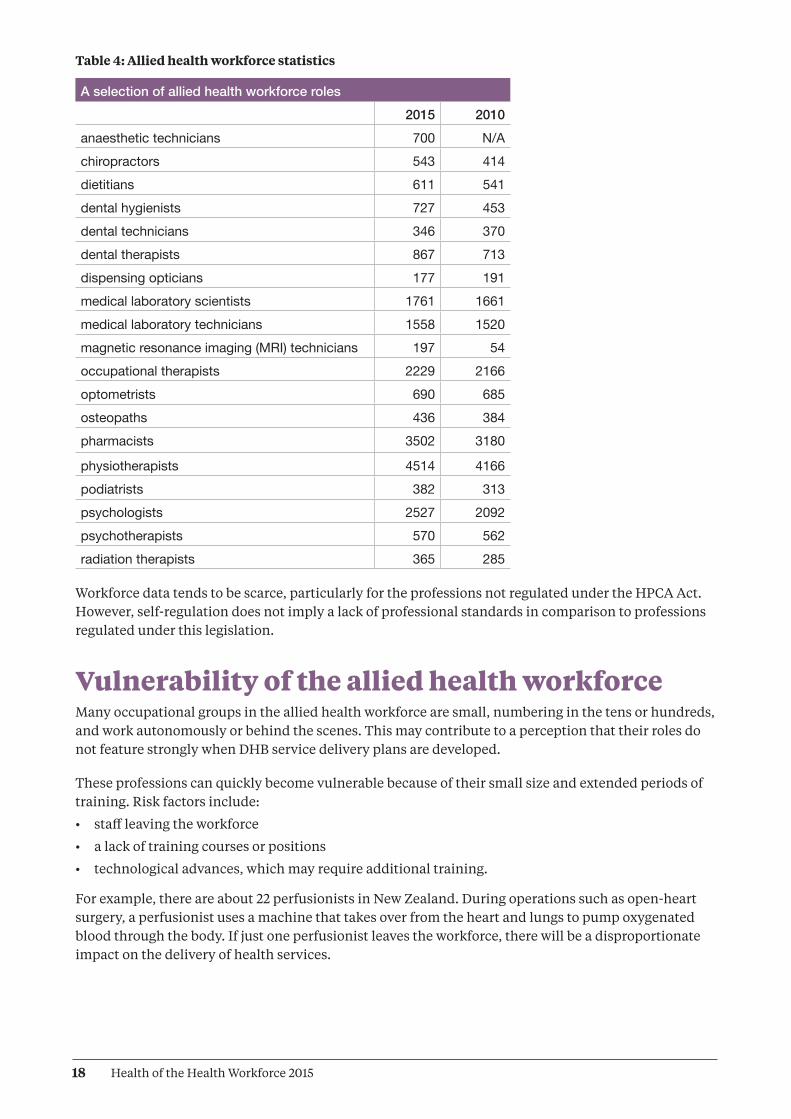
Table 4: Allied health workforce statistics
A selection of allied health workforce roles2015 2010
anaesthetic technicians 700 N/Achiropractors 543 414dietitians 611 541dental hygienists 727 453dental technicians 346 370dental therapists 867 713dispensing opticians 177 191medical laboratory scientists 1761 1661medical laboratory technicians 1558 1520magnetic resonance imaging (MRI) technicians 197 54occupational therapists 2229 2166optometrists 690 685osteopaths 436 384pharmacists 3502 3180
physiotherapists 4514 4166podiatrists 382 313psychologists 2527 2092psychotherapists 570 562 radiation therapists 365 285
Workforce data tends to be scarce, particularly for the professions not regulated under the HPCA Act. However, self-regulation does not imply a lack of professional standards in comparison to professions regulated under this legislation.
Vulnerability of the allied health workforceMany occupational groups in the allied health workforce are small, numbering in the tens or hundreds, and work autonomously or behind the scenes. This may contribute to a perception that their roles do not feature strongly when DHB service delivery plans are developed.
These professions can quickly become vulnerable because of their small size and extended periods of training. Risk factors include:
• staff leaving the workforce
• a lack of training courses or positions
• technological advances, which may require additional training.
For example, there are about 22 perfusionists in New Zealand. During operations such as open-heart surgery, a perfusionist uses a machine that takes over from the heart and lungs to pump oxygenated blood through the body. If just one perfusionist leaves the workforce, there will be a disproportionate impact on the delivery of health services.

19Health of the Health Workforce 2015
A number of allied health professions appear on Immigration New Zealand’s long-term skill shortage list. Because there are too few home-grown professionals to fill vacancies in specific professions at present, the percentage of overseas-trained practitioners tends to be high.
To address some critical shortages, sonographers, medical physicists and radiation therapists are included in 2015’s Voluntary Bonding Scheme. To be eligible for the Scheme’s annual incentive payments, allied health applicants must work in New Zealand for three to five years. (See www.health.govt.nz for more details.)
Allied Health, Science and Technical TaskforceRapid scientific and technical advances mean that new allied health careers are likely to arise in the coming years, or existing roles will be transformed. Providing viable education and training programmes is likely to become a challenge.
HWNZ has established an Allied Health, Science and Technical Taskforce and associated work programme. Three main workstreams have been identified:
• recruitment and retention
• education and training
• data, intelligence and information.
The Allied Health Work Programme will encompass earlier work developing a multidisciplinary education framework for a number of allied health qualifications. See The Role of Health Workforce New Zealand for more information.
A particular challenge facing this workforce is that school leavers are typically unaware of the wide range of health careers. It would appear that the majority think only of medicine or nursing, or of well-known allied health professions such as physiotherapy or dental hygiene.

20 Health of the Health Workforce 2015
Kaiāwhina (non-regulated) workers A wide and varied range of health workers are collectively referred to as kaiāwhina (non-regulated workforce) because these workers are not regulated under the HPCA Act. They are monitored and regulated in other ways (eg, through industry standards, health and safety legislation and employment agreements).
The kaiāwhina workforce roles include people working:
• in health-related corporate and administrative positions
• in drug and alcohol addiction support roles
• as aged or disabled carers in residential facilities
• as support workers for older, disabled or injured people living in their own homes.
A list of kaiāwhina workforce professions can be found in Appendix 5.
Workforce data is scarce, especially for non-regulated workers that have no professional body and work in the not-for-profit or private sector. Research undertaken for the industry training body Careerforce suggests that the non-regulated workforce consisted of 62,910 people in 2013 (BERL Economics 2014). This does not include informal carers, whose numbers exceed 400,000.
Approximately one-third of the non-regulated workforce are employed as support workers delivering home-based care to disabled or injured people, or people aged 65 years and over. Opportunities in the aged care workforce are expected to rise as the population grows and ages and as care moves closer to home.
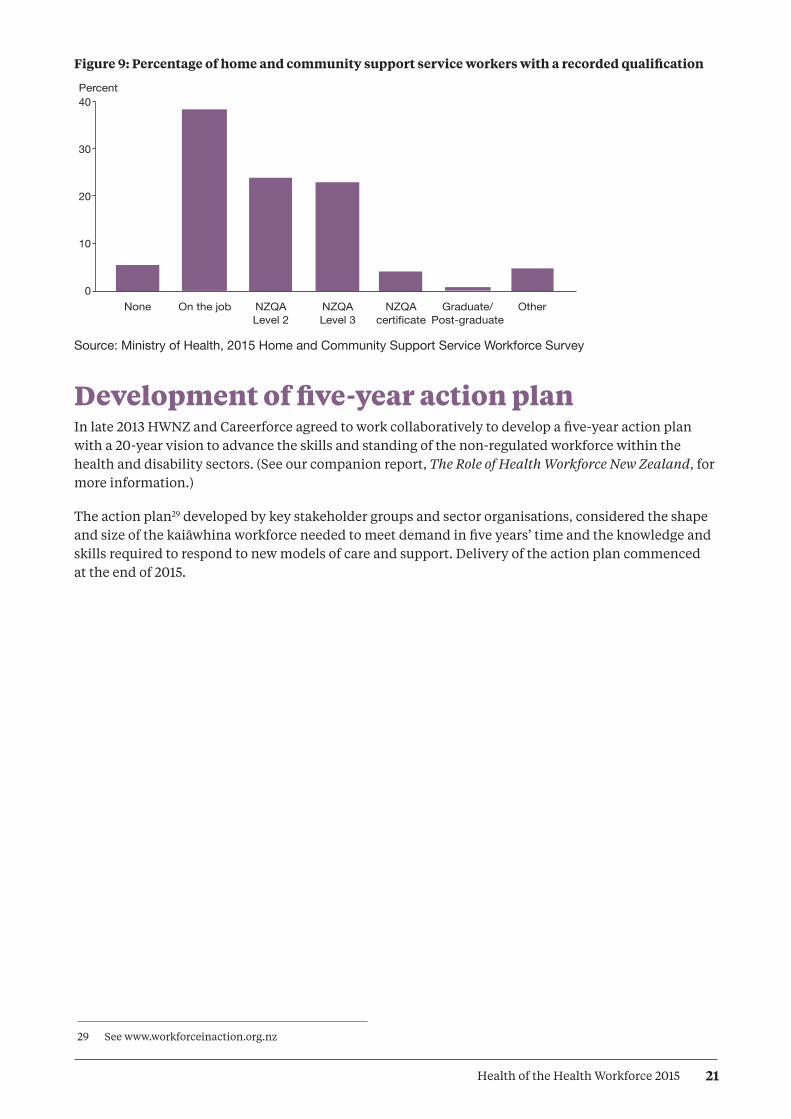
Profile of kaiāwhina workforceIn 2015 the Ministry of Health surveyed 76 providers of home and community support services to obtain demographic data. The Ministry received 33 responses to a standard questionnaire from a variety of small and large providers, a response rate of 42%, covering 11,288 support workers.
The information available suggests that the current support worker workforce:
• is female dominated (91% are women)
• has an older age profile compared to other New Zealand workforces (54% are aged between 45 and 64)
• consists mostly of part-time workers working an average of 21 hours a week
• is increasingly qualified, but continues to be paid an hourly rate close to the minimum wage.
21Health of the Health Workforce 2015
29 See www.workforceinaction.org.nz
Figure 9: Percentage of home and community support service workers with a recorded qualification
Source: Ministry of Health, 2015 Home and Community Support Service Workforce Survey
Development of five-year action planIn late 2013 HWNZ and Careerforce agreed to work collaboratively to develop a five-year action plan with a 20-year vision to advance the skills and standing of the non-regulated workforce within the health and disability sectors. (See our companion report, The Role of Health Workforce New Zealand, for more information.)
The action plan29 developed by key stakeholder groups and sector organisations, considered the shape and size of the kaiāwhina workforce needed to meet demand in five years’ time and the knowledge and skills required to respond to new models of care and support. Delivery of the action plan commenced at the end of 2015.
40
30
20
10
0 None On the job NZQA NZQA NZQA Graduate/ Other Level 2 Level 3 certificate Post-graduate
HthofHthWkfce14/15 Fig 9
Percent
22 Health of the Health Workforce 2015
Future prospects for joining the workforceHWNZ’s principal aim is to ensure the long-term sustainability of the health and disability workforce. The projections in this section assess job prospects for particular areas within the workforce in the next five years, to provide information to those interested in joining the workforce or those currently working in the health sector and thinking about future opportunities. The intention is to indicate overall trends rather than provide exact forecasts.
These projections are based on data and workforce intelligence from a range of sources. Note that workforce trends are affected by a complex range of events, some of which are very difficult to predict. For example, changes in the international medical labour market strongly influence New Zealand’s capacity to retain and recruit health care professionals. Sometimes job prospects can change in a short period of time.
For information on training requirements and pay rates for a number of health careers, see www.careers.govt.nz and the report on http://mbie.govt.nz/occupation-outlook
Medical workforceProspects are particularly good for:
• GPs, especially in rural areas
• clinical genetics
• pain medicine
• palliative care
• psychiatry
• sexual health medicine.
In general, the specialties with poorer job prospects are those that currently have higher ratios of postgraduate trainee doctors to senior staff.
However, this does not hold true for specialties that have a shortage of senior staff, such as general practice and urgent care, for which job prospects for trainees are excellent.
See Appendix 2 for a graph showing ratios of trainees to senior doctors for all specialties, including GPs.
NursingProspects are particularly good for advanced practice in areas including:
• cancer care
• long-term condition management
• aged care
• diabetes.
In recent years not all nursing graduates have found employment immediately, but workforce planning indicates New Zealand will need to train more nurses by 2017, when retirement among the ageing workforce will become a critical factor.

23Health of the Health Workforce 2015
MidwiferyOpportunities are available, particularly in rural areas.
Allied health Prospects are good for:
• sonographers
• psychologists
• dental hygienists
• dental therapists
• MRI technicians
• medical physicists.
Prospects are stable for:
• medical laboratory scientists
• occupational therapists
• pharmacists.
Prospects may be limited for dietitians.
Kaiāwhina (non-regulated) Demand for carers and support workers will continue to rise as the population ages and the trend for care to move out of hospitals and closer to people’s homes continues. For a list of non-regulated health occupations, see Appendix 5.
24 Health of the Health Workforce 2015
ReferencesBERL Economics. 2014. Health and Disability Kaiāwhina Worker Workforce 2013 Profile for Careerforce. Wellington: Business and Economic Research Ltd.
Kyle M, Aileone L. 2013. Mapping the Rural Midwifery Workforce in New Zealand. Christchurch: Midwifery and Maternity Provider Organisation.
Midwifery Council of New Zealand. 2010. Midwifery Workforce Report 2009. Wellington: Midwifery Council of New Zealand.
Ministerial Task Group on Clinical Leadership. 2009. In Good Hands: Transforming clinical governance in New Zealand. Wellington.
Ministry of Health. 2009. Our Oral Health. Wellington: Ministry of Health.
OECD. 2013. Health at a Glance 2013: OECD indicators. OECD Publishing.
Pacific Perspectives. 2013. Pacific Workforce Service Forecast for HWNZ. Wellington: Pacific Perspectives.
25Health of the Health Workforce 2015
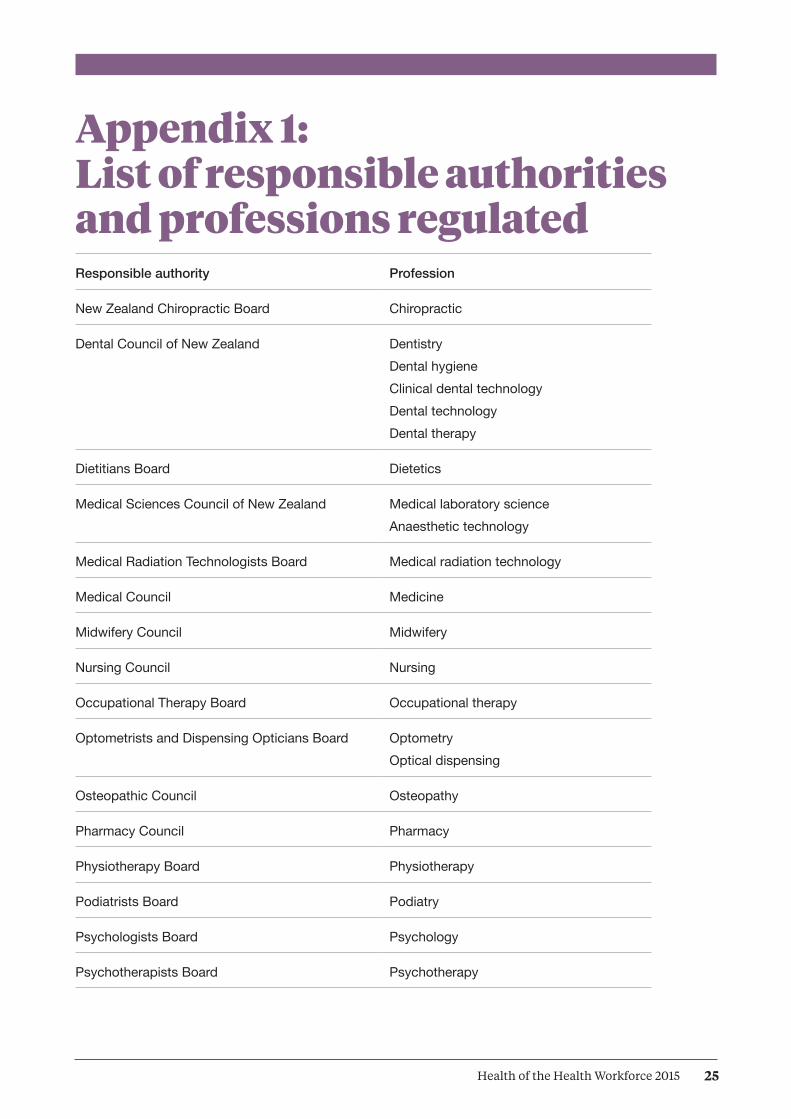
Appendix 1: List of responsible authorities and professions regulated
Responsible authority Profession
New Zealand Chiropractic Board Chiropractic
Dental Council of New Zealand DentistryDental hygieneClinical dental technologyDental technologyDental therapy
Dietitians Board Dietetics
Medical Sciences Council of New Zealand Medical laboratory scienceAnaesthetic technology
Medical Radiation Technologists Board Medical radiation technology
Medical Council Medicine
Midwifery Council Midwifery
Nursing Council Nursing
Occupational Therapy Board Occupational therapy
Optometrists and Dispensing Opticians Board Optometry Optical dispensing
Osteopathic Council Osteopathy
Pharmacy Council Pharmacy
Physiotherapy Board Physiotherapy
Podiatrists Board Podiatry
Psychologists Board Psychology
Psychotherapists Board Psychotherapy

26 Health of the Health Workforce 2015
Appendix 2: Ratios of trainee doctors to specialists In general, specialties with ratios closest to zero and/or in which senior medical officers have an average age of 50+ years are the most vulnerable to future shortages of senior staff, and therefore represent the best job prospects.
NotesThe number and average age of SMOs by vocational registration were provided by MCNZ, as of 30 June 2015.The number of trainees for musculoskeletal medicine (no current trainees, 20 SMOs) was provided by the New Zealand Association of Musculoskeletal Medicine, July 2015.The number of trainees in general practice, medical administration, occupational medicine, public health medicine, sports medicine and urgent care was provided by their representative medical colleges, February – July 2015. The number of trainees in family planning was calculated by using the number undertaking the Clinical Diploma in Sexual and Reproductive Health, July 2015. The number of trainees in cardiothoracic surgery, general surgery, neurosurgery, orthopaedic surgery, otolaryngology, paediatric surgery, plastic surgery, urology and vascular surgery was provided by the Royal Australasian College of Surgeons, September 2015. The number of trainees in all other specialties was provided by DHBs (RMO workforce profile data collection), March 2015.
Rate of trainees to senior medical officers1.00
0.80
0.60
0.40
0.20
0.00
HthofHthWkfce14/15 Fig Appx 2
70
60
50
40
30
20
10
0
Average age of senior medical officers
Anae
sthe
sia
Car
diot
hora
cic
surg
ery
Clin
ical
gen
etic
sDe
rmat
olog
yDi
agno
stic
and
inte
rven
tiona
l rad
iolo
gyEm
erge
ncy
med
icin
eFa
mily
pla
nnin
g an
d re
prod
uctiv
e he
alth
Gen
eral
pra
ctic
eG
ener
al s
urge
ryIn
tens
ive
care
med
icin
eIn
tern
al m
edic
ine
(gen
eral
med
icin
e)M
edic
al a
dmin
istra
tion
Mus
culo
skel
etal
med
icin
eN
euro
surg
ery
Obs
tetri
cs a
nd g
ynae
colo
gyO
ccup
atio
nal m
edic
ine
Oph
thal
mol
ogy
Ora
l and
max
illofa
cial
sur
gery
Orth
opae
dic
surg
ery
Oto
lary
ngol
ogy/
head
and
nec
k su
rger
yPa
edia
tric
surg
ery
Paed
iatri
cs (g
ener
al p
aedi
atric
s)
Pain
med
icin
ePa
lliativ
e m
edic
ine
Path
olog
yPl
astic
and
reco
nstru
ctiv
e su
rger
yPs
ychi
atry
Publ
ic h
ealth
med
icin
eRa
diat
ion
onco
logy
Reha
bilit
atio
n m
edic
ine
Rura
l hos
pita
l med
icin
eSe
xual
hea
lth m
edic
ine
Spor
ts m
edic
ine
Urg
ent c
are
(acc
iden
t and
med
ical
pra
ctic
e)U
rolo
gyVa
scul
ar s
urge
ry
27Health of the Health Workforce 2015
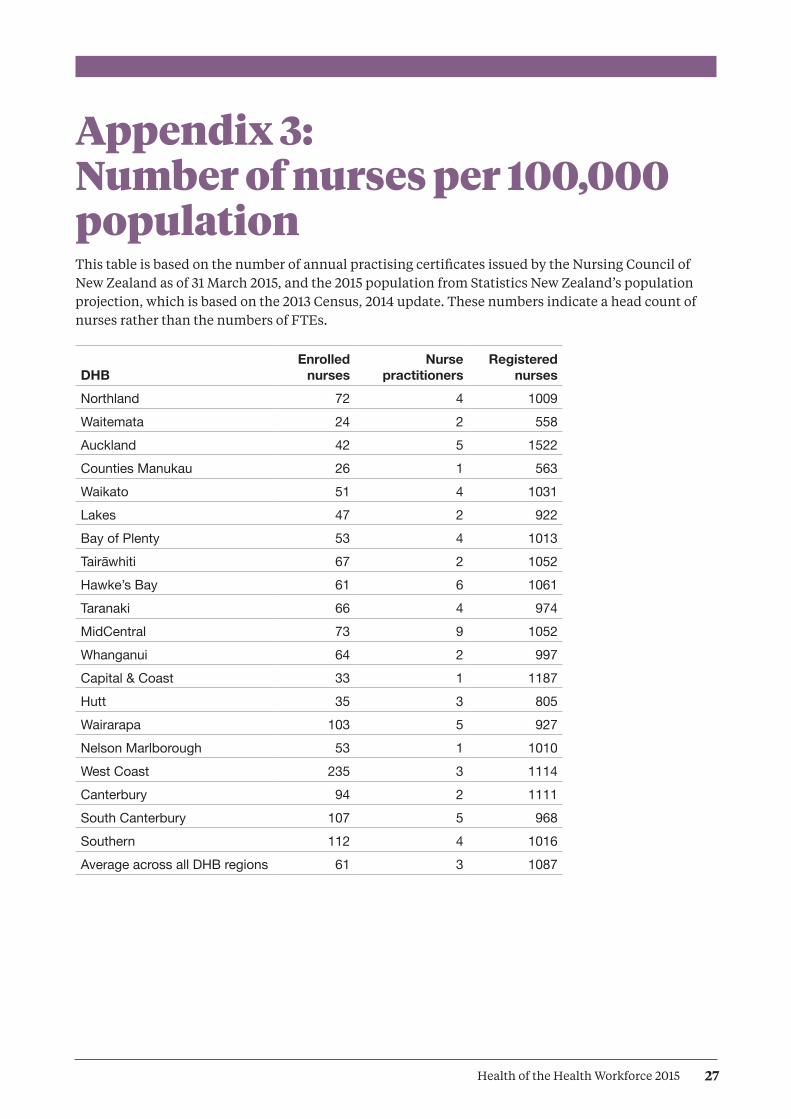
Appendix 3: Number of nurses per 100,000 population This table is based on the number of annual practising certificates issued by the Nursing Council of New Zealand as of 31 March 2015, and the 2015 population from Statistics New Zealand’s population projection, which is based on the 2013 Census, 2014 update. These numbers indicate a head count of nurses rather than the numbers of FTEs.
DHBEnrolled
nursesNurse
practitionersRegistered
nursesNorthland 72 4 1009Waitemata 24 2 558Auckland 42 5 1522Counties Manukau 26 1 563Waikato 51 4 1031Lakes 47 2 922Bay of Plenty 53 4 1013Tairawhiti 67 2 1052Hawke’s Bay 61 6 1061Taranaki 66 4 974MidCentral 73 9 1052Whanganui 64 2 997Capital & Coast 33 1 1187Hutt 35 3 805Wairarapa 103 5 927Nelson Marlborough 53 1 1010West Coast 235 3 1114Canterbury 94 2 1111South Canterbury 107 5 968Southern 112 4 1016Average across all DHB regions 61 3 1087
28 Health of the Health Workforce 2015
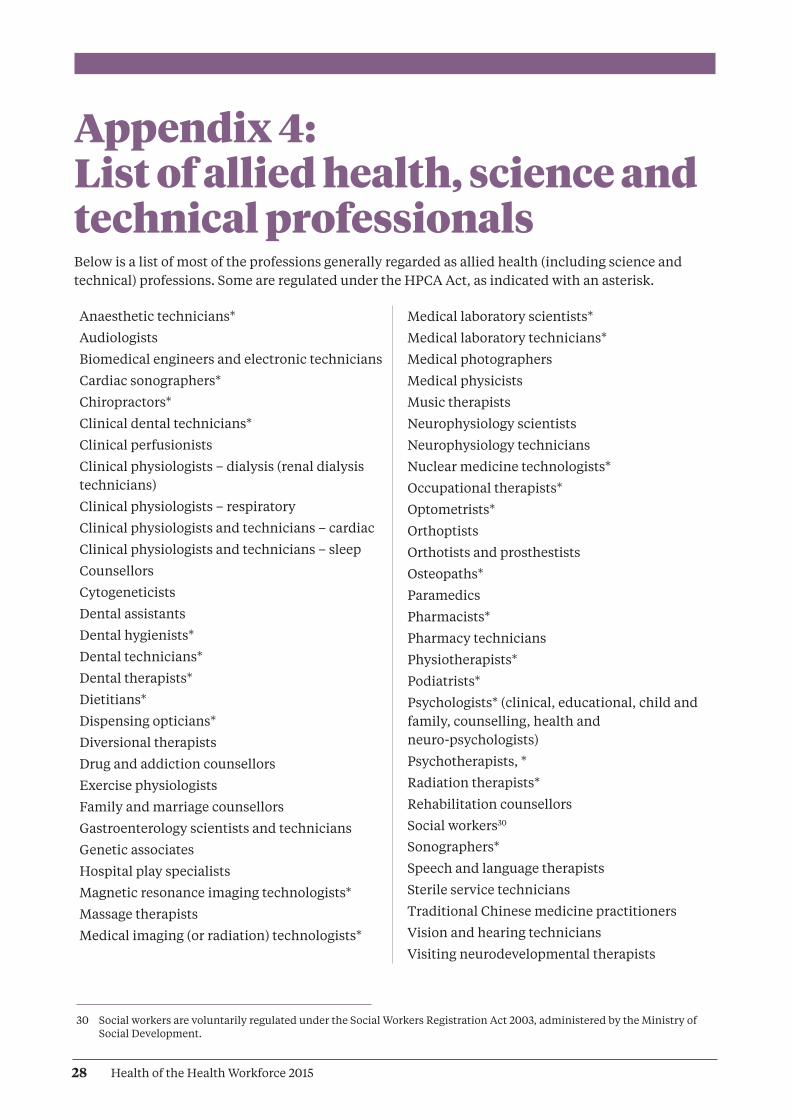
Appendix 4: List of allied health, science and technical professionals Below is a list of most of the professions generally regarded as allied health (including science and technical) professions. Some are regulated under the HPCA Act, as indicated with an asterisk.
Anaesthetic technicians*
Audiologists
Biomedical engineers and electronic technicians
Cardiac sonographers*
Chiropractors*
Clinical dental technicians*
Clinical perfusionists
Clinical physiologists – dialysis (renal dialysis technicians)
Clinical physiologists – respiratory
Clinical physiologists and technicians – cardiac
Clinical physiologists and technicians – sleep
Counsellors
Cytogeneticists
Dental assistants
Dental hygienists*
Dental technicians*
Dental therapists*
Dietitians*
Dispensing opticians*
Diversional therapists
Drug and addiction counsellors
Exercise physiologists
Family and marriage counsellors
Gastroenterology scientists and technicians
Genetic associates
Hospital play specialists
Magnetic resonance imaging technologists*
Massage therapists
Medical imaging (or radiation) technologists*
Medical laboratory scientists*
Medical laboratory technicians*
Medical photographers
Medical physicists
Music therapists
Neurophysiology scientists
Neurophysiology technicians
Nuclear medicine technologists*
Occupational therapists*
Optometrists*
Orthoptists
Orthotists and prosthestists
Osteopaths*
Paramedics
Pharmacists*
Pharmacy technicians
Physiotherapists*
Podiatrists*
Psychologists* (clinical, educational, child and family, counselling, health and neuro-psychologists)
Psychotherapists, *
Radiation therapists*
Rehabilitation counsellors
Social workers30
Sonographers*
Speech and language therapists
Sterile service technicians
Traditional Chinese medicine practitioners
Vision and hearing technicians
Visiting neurodevelopmental therapists
30 Social workers are voluntarily regulated under the Social Workers Registration Act 2003, administered by the Ministry of Social Development.
29Health of the Health Workforce 2015
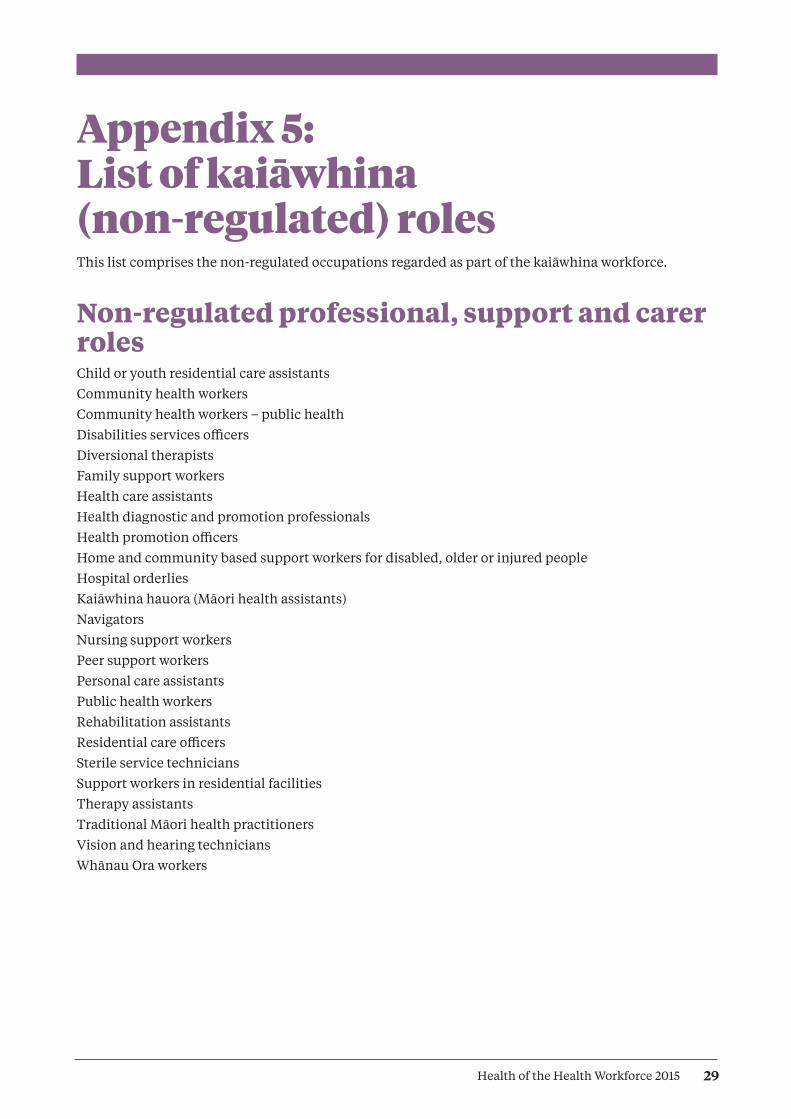
Appendix 5: List of kaiāwhina (non-regulated) rolesThis list comprises the non-regulated occupations regarded as part of the kaiāwhina workforce.
Non-regulated professional, support and carer rolesChild or youth residential care assistantsCommunity health workersCommunity health workers – public healthDisabilities services officersDiversional therapistsFamily support workersHealth care assistantsHealth diagnostic and promotion professionalsHealth promotion officers Home and community based support workers for disabled, older or injured peopleHospital orderliesKaiāwhina hauora (Māori health assistants)NavigatorsNursing support workersPeer support workersPersonal care assistantsPublic health workersRehabilitation assistantsResidential care officersSterile service techniciansSupport workers in residential facilitiesTherapy assistantsTraditional Māori health practitionersVision and hearing techniciansWhānau Ora workers
30 Health of the Health Workforce 2015
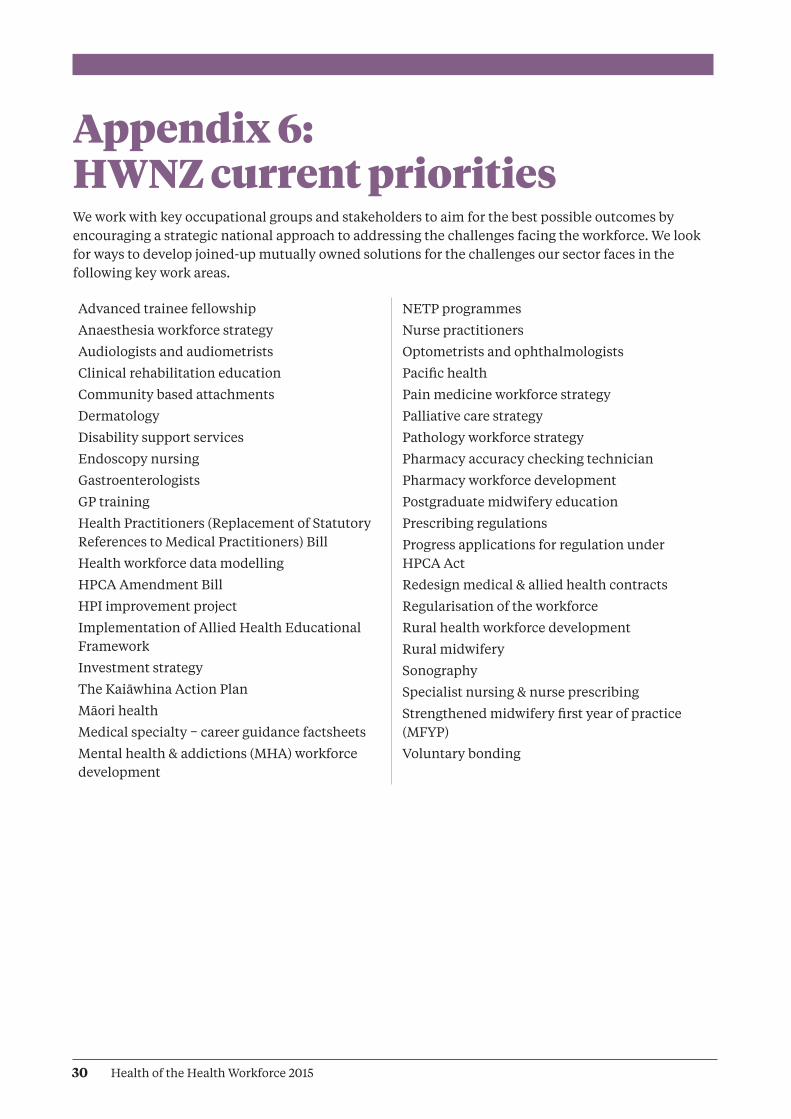
Appendix 6: HWNZ current prioritiesWe work with key occupational groups and stakeholders to aim for the best possible outcomes by encouraging a strategic national approach to addressing the challenges facing the workforce. We look for ways to develop joined-up mutually owned solutions for the challenges our sector faces in the following key work areas.
Advanced trainee fellowship
Anaesthesia workforce strategy
Audiologists and audiometrists
Clinical rehabilitation education
Community based attachments
Dermatology
Disability support services
Endoscopy nursing
Gastroenterologists
GP training
Health Practitioners (Replacement of Statutory References to Medical Practitioners) Bill
Health workforce data modelling
HPCA Amendment Bill
HPI improvement project
Implementation of Allied Health Educational Framework
Investment strategy
The Kaiāwhina Action Plan
Māori health
Medical specialty − career guidance factsheets
Mental health & addictions (MHA) workforce development
NETP programmes
Nurse practitioners
Optometrists and ophthalmologists
Pacific health
Pain medicine workforce strategy
Palliative care strategy
Pathology workforce strategy
Pharmacy accuracy checking technician
Pharmacy workforce development
Postgraduate midwifery education
Prescribing regulations
Progress applications for regulation under HPCA Act
Redesign medical & allied health contracts
Regularisation of the workforce
Rural health workforce development
Rural midwifery
Sonography
Specialist nursing & nurse prescribing
Strengthened midwifery first year of practice (MFYP)
Voluntary bonding

HP6317