Embed Size (px)
Citation preview
Health Literate Discharge Practices in Ontario Hospitals
by
Jennifer Anne Innis
A thesis submitted in conformity with the requirements for the degree of Doctor of Philosophy
Institute of Health Policy, Management and Evaluation University of Toronto
© Copyright by Jennifer Anne Innis 2016
ii
Health Literate Discharge Practices in Ontario Hospitals
Jennifer Anne Innis
Doctor of Philosophy
Institute of Health Policy, Management and Evaluation
University of Toronto
2016
Abstract
Health literate discharge practices meet the health literacy needs of patients and families
at the time of hospital discharge. This dissertation used a mixed methods, sequential design to
gain insight into the use of these practices in Ontario hospitals.
The Health Literate Care Model was used to guide the first two studies. The first study
used a Delphi panel to find the best indicators of health literate discharge practices, based on the
indicators of Project RED (Re-Engineered Discharge). This led to the development of 36
indicators, which were contextualized to Ontario, and were used to create an organizational
survey tool. This survey was sent to to nursing managers in all 143 hospitals in Ontario. There
were 99 participants from 79 hospitals (participation rate 55%). Exploratory factor analysis was
done and reliability of the survey was established.
The third study used organizational learning theory to examine how acute care hospitals
take on health literate discharge practices by interviewing managers, educators and front-line
staff in 10 hospitals that participated in the survey.
In the fourth study, multiple regression analysis was used to examine the relationship
between organizational characteristics and use of health literate discharge practices, as
determined by the survey results. Smaller hospital size was associated with greater use, and
iii
survey scores were found to be highest in the North region. A significant interaction was found
between size and location.
The development of the organizational survey tool could be used by researchers, hospitals
and policy makers to measure and monitor the use of health literate discharge practices in
Ontario hospitals. The results of the qualitative study offer insights into how organizational
learning is used by hospital managers and leaders to adopt health literate discharge practices.

iv
Acknowledgments
Thank you to my co-supervisors, Jan Barnsley and Whitney Berta, for their support,
guidance and encouragement. To Imtiaz Daniel, my committee member, thank you for your
mentorship and support. My thanks to Rhonda Cockerill and Jennifer Gibson for their thoughtful
feedback. Thank you to my external examiner, Michael Paasche-Orlow, for challenging me. I
would like to thank all of the nursing managers and health care providers who participated in this
research.
As well, I wish to thank Tyrone Perreira and Monique Herbert for their friendship,
support and camaraderie. I am grateful to my sisters, Caroline and Sarah Innis, for believing in
me. I especially want to thank my parents, Hugh and Lorraine Innis, for their encouragement to
return to school, for always listening to me and for always being supportive – I could not have
done this without you.
v
Table of Contents
Acknowledgments (if any) .............................................................................................................. ii
Table of Contents ........................................................................................................................... iv
List of Tables ................................................................................................................................ vii
List of Figures ............................................................................................................................. viiii
List of Appendices ....................................................................................................................... viii
Chapter 1: Background ................................................................................................................... 1
Chapter 2: Health Literate Discharge Practices and Project RED ............................................... 99
Chapter 3: Development of Indicators of health literate discharge practices in Ontario
Hospitals Using a Delphi Panel ................................................................................................ 29
Chapter 4: Use of Health Literate Discharge Practices in Ontario Hospitals .............................. 51
Chapter 5: Absorptive Capacity and the Uptake of New Discharge Practices in Ontario
Hospitals ................................................................................................................................... 98
Chapter 6: Relationships between Organizational Characteristics and use of Health Literate
Discharge Practices in Ontario Hospitals ............................................................................... 155
Chapter 7: Adoption and Use of Health Literate Discharge Practices in Ontario Hospitals ..... 186
References ................................................................................................................................... 199
Appendices .................................................................................................................................. 222
Copyright Acknowledgements .................................................................................................... 475
vi
List of Tables
Table Page
Table 1. Roles of Participants on the Delphi Panel 31
Table 2. Indicators of Health Literate Discharge Practices for Round 1 32
Table 3. Roles and Work Location of Participants on the Delphi Panel (self-identified),
Round 1 37
Table 4. Median Values for Health Literate Discharge Practices – Round 1 37
Table 5. Themes from Round 1 40
Table 6. Roles of participants on the Delphi panel (self-identified), Round 2 43
Table 7. Health Literate Discharge Practices – Round 2 43
Table 8. Median Values for New/Revised Health Literate Discharge Practices
– Round 2 44
Table 9. Indicators of Health Literate Discharge Practices 45
Table 10. Baseline Characteristics of Participants and Hospitals 60
Table 11. Characteristics of Hospitals with More Than One Response 62
Table 12. Survey Results 64
Table 13. Reliability Testing for 9 Factor Solution 73
Table 14. Reliability testing for Five Factor Solution 77
Table 15. Factor Correlation Matrix for 6 Factor Solution 81
Table 16. Summary of Items and Factor Loadings for Direct Oblimin Oblique
Six Factor Solution 82
Table 17. Summary of Items and Factor Loadings Greater Than .3 for Six
Factor Solution 86
Table 18. Reliability Testing for Six Factor Solution 89
Table 19. Inter-rater Reliability Testing for Hospital with 2 Responses 92
Table 20. Inter-rater Reliability Testing for Hospital with More Than 2 Responses 92
vii
Table 21. Factors from 6 Factor Solution 93
Table 22. Indicators of Health Literate Discharge Practices with Corresponding
Factors 93
Table 23. List of participants 110
Table 24. Absorptive Capacity Metaroutines and Routines Used in the
Adoption and Use of Health Literate Discharge Practices 142
Table 25. Regions in Ontario 164
Table 26. Continuous Variables 166
Table 27. Categorical Variables 167
Table 28. Characteristics of Hospitals in Each Region 167
Table 29. Summary of Hierarchical Linear Regression Analyses for Relationship
between Size and Health Literate Survey Score 172
Table 30. Relationship between Teaching Status and Health Literate Survey
Score 173
Table 31. Relationship between Region and Health Literate Survey Score 174
Table 32. Relationship between Rurality and Health Literate Survey Score 174
Table 33. Summary of Stepwise Backward Regression Analyses for Size as
Predictor of Health Literate Survey Score 175
Table 34. Summary of Stepwise Backward Regression Analyses for Variables
Predicting Health Literate Survey Score 177
Table 35. Summary of Regression Analysis for Interaction between Size and
Region as Predictors of Health Literate Survey Score 179
Table 36. Summary of Regression Analysis for Interaction between
Size and Rurality as Predictors of Health Literate Survey Score 180
viii
List of Figures
Figures Page
Figure 1. Health Literate Care Model 9
Figure 2. Health Literate Care Model with Health Literate Discharge Practices 48
Figure 3. Distribution of Health Literate Survey Scores 68
Figure 4. Absorptive Capacity Metaroutines for the Uptake of Evidence-Based
Practice 101
Figure 5. Absorptive Capacity Metaroutines for the Uptake of Health Literate
Discharge Practices 141
Figure 6. Distribution of the Health Literate Survey Scores 168
ix
List of Appendices
Appendix Page
A: Email for Round 1, Delphi Panel 222
B: Participant Information Letter, Round 1 223
C: Reminder Notice, Round 1 225
D: Email for Round 2, Delphi Panel 226
E: Participant Information Letter, Round 2 227
F: Reminder Notice, Round 2 229
G: Delphi Panel, Results of Round 1 230
H: Delphi Panel, Results of Round 2 235
I: Health Literate Discharge Practices Survey 237
J: Teaching Hospitals 243
K: Large Community Hospitals 244
L: Small Community Hospitals 246
M: Email 249
N: Participant Information Letter 250
O: Endorsement Letter from the Ontario Hospital Association 253
P: Reminder Notice 254
Q: Rurality Distributions 255
R: Descriptives, Survey Items 257
x
S: Tests of Normality of Survey Items 268
T: Data Dictionary 346
U: Correlations between Survey Items 350
V: Factor Correlation Matrix for 9 Factor Solution 383
W: Scree Plot 384
X: Summary of Items and Factor Loadings for Direct Oblimin Nine Factor
Solution 385
Y: Summary of Items and Factor Loadings Greater than .3, for Nine Factor
Solution 390
Z: Factor Correlation Matrix for 5 Factor Solution 395
AA: Summary of Items and Factor Loadings for Direct Oblimin Five Factor
Solution 396
BB: Summary of Items and Factor Loadings Greater than .3, for Five Factor
Solution 400
CC: Seven Factor Solution 403
DD: Eight Factor Solution 406
EE: Email Communication for Interview 409
FF: Informed Consent 410
GG: Interview Questions 414
HH: Test of Normality 416
II: Distribution of Health Literate Survey Scores for Categorical Independent
Variables 417
JJ: Tests of Normality for Continuous Independent Variables and Base-10
Logarithm Transformations of Independent Variables 434
KK: Scatterplots of Continuous Independent Variables 454
xi
LL: Regression Analysis for Size and Size-Squared 456
MM: Relationship between Teaching Status and Health Literate Survey Score 458
NN: Relationship between Region and Health Literate Survey Score 459
OO: Relationship between Rurality and Health Literate Survey Score 461
PP: Relationship between Organizational Size, Teaching Status and
Rurality with Health Literate Survey Score 463
QQ: Relationship between Organizational Size, Teaching Status and
Region with Health Literate Survey Score 465
RR: Post Hoc Analyses to Examine Differences in Number of Acute
Beds between Regions 470
SS: Regression Analysis to Examine Interaction between Region and
Size as Predictors of Health Literate Survey Score 473
TT: Regression Analysis to Examine Interaction between Rurality and
Size as Predictors of Health Literate Survey Score 474
1
Chapter 1: Background
1.1 Health literacy and health literate organizations
Health literacy is the ability to obtain, use and understand information to make
decisions that maintain and promote health (Berkman, Sheridan, Donahue, Halpern, & Crotty,
2011; Nielsen-Bohlman, Panzer, & Kindig, 2004). Studies that have evaluated the health
literacy levels of patients have found that a lack of health literacy is associated with poor health
outcomes (Berkman, Sheridan, Donahue, Halpern, & Crotty, 2011) as well as increased mortality
(Baker et al., 2007; Berkman, Sheridan, Donahue, Halpern, & Crotty, 2011; McNaughton et al.,
2015; Sudore et al., 2006). In addition, a low level of health literacy is associated with increased
hospital readmission and increased health care costs (Bailey et al., 2015; Berkman, Sheridan,
Donahue, Halpern, & Crotty, 2011; Clark, 2011; McNaughton et al., 2015; Mitchell, Sadikova,
Jack, & Paasche-Orlow, 2012; Moser et al., 2015).
Generally speaking, health literacy is thought of as a characteristic of an individual or a
group of people and is therefore most often referred to in the context of a patient’s health
literacy. However, the concept of health literacy has recently been applied to organizations.
“Health literate organizations” is a term created by the Institute of Medicine in 2012 to refer to
organizations that create environments which individuals can easily navigate to find the services
that they need and that make it easier for people to obtain and understand information about their
health. The concept of health literate organizations recognizes that organizations have a
responsibility to be responsive to the health literacy needs of patients (Brach et al., 2012;
Institute of Medicine, 2012). The idea that healthcare organizations have an obligation to meet
the health literacy needs of their users is a new one, and it is only beginning to be addressed by
hospitals in North America (Koh, Baur, Brach, Harris, & Rowden, 2013). By meeting this
2
responsibility, hospitals have the opportunity to improve outcomes and to reduce the rate of
hospital readmission (Berkman, Sheridan, Donahue, Halpern, & Crotty, 2011; Brach, Dreyer, &
Schillinger, 2014; Brach et al., 2012; Mitchell et al., 2012).
Upwards of sixty percent of Canadians lack an adequate level of health literacy (Murray,
Hagey, Willms, Shillington, & Desjardins, 2008; Rootman & Gordon-El-Bihbety, 2008) and the
stress of illness and hospitalization can compromise a normally adequate level (Koh, Brach,
Harris, & Parchman, 2013; Kowalski et al., 2015). There is a recognized need to ensure that
patients are given information and instructions at the time of discharge that they understand and
can use to manage their own health once they leave the hospital.
When patients return to the hospital within 30 days of discharge, this often indicates that
the discharge process was done poorly (Vashi et al., 2013). Although there is a lack of research
on discharge practices in Ontario hospitals, there is evidence that discharge processes that meet
the health literacy needs of patients and families, and that work to ensure a smooth transition of
care between the settings of hospital and home, are associated with improved health outcomes
and reduced readmission rates (Baker, 2011; Coleman, Parry, Chalmers, & Min, 2006; Jack et
al., 2009; Markley et al., 2013; Naylor et al., 2004; Naylor et al., 1994).
1.2 Hospital readmission
This dissertation is defining hospital readmission as returning to the hospital and being
admitted within 30 days of discharge. North America has rates of hospital readmission that are as
high as 25% (Bernheim et al., 2010).
3
A 2012 Canadian study found that 8.5% of all patients discharged from acute care in an
eleven month period from 2010-111 required readmission to hospital for inpatient care. During
the same time period, 13.3% of adult medical patients, that is, patients over 19 years of age
discharged with a medical diagnosis, returned to the hospital for inpatient readmission within 30
days. It was estimated that the cost of these readmissions was $1.8 billion, not including
physician fees for billed services (Canadian Institute for Health Information, 2012).
The Canadian Institute for Health Information has more recently reported that this
readmission rate increased between 2011 and 2014. In an 11 month time period from 2013-14,
8.9% of all patients discharged from acute care required readmission. In Ontario, this rate was
higher at 9.1% (Canadian Institute for Health Information, 2016).
In Ontario and Canada, readmission is highest for medical patients (Baker, 2011;
Canadian Institute for Health Information, 2012). In Ontario, the 30-day hospital readmission
rate for patients with the medical diagnoses of pneumonia, chronic obstructive pulmonary
disease (COPD), congestive heart failure (CHF), stroke, gastrointestinal disease, diabetes and
cardiac conditions (excluding myocardial infarction) was 13.5% for patients in 2013-14.
Although Ontario’s Ministry of Health and Long-Term Care (MOHLTC) has made substantial
investments to reduce hospital readmission and improve quality of care for patients (Ministry of
Health and Long-Term Care, 2013d, 2015a). the readmission rate has increased every year since
it was first measured in 2009-10 at 12% (Health Quality Ontario, 2015a).
1 11 month time period is defined by CIHI as the fiscal year between April 1 and March 1 (Canadian Institute of
Health Information 2012, 2016)
4
In the United States, studies using Medicare data have found readmission rates for
patients hospitalized with acute myocardial infarction (AMI) to range from 19.1 to 19.9%
(Bernheim et al., 2010; Krumholz et al., 2009) and for patients hospitalized with heart failure to
range from 23.6 to 24.5% (Bernheim et al., 2010; Keenan et al., 2008; Krumholz et al., 2009).
This readmission is an expensive and inefficient use of acute care resources (Baker, 2011;
Canadian Institute for Health Information, 2012, 2016; Jencks, Williams, & Coleman, 2009;
Vashi et al., 2013).
There are efforts to reduce readmission in Canada and the United States. In Ontario, the
Ministry of Health and Long-Term Care (MOHLTC) has focused on reducing avoidable
hospitalizations, as identified in the 2010 Excellent Care for All Act (Ministry of Health and
Long-Term Care, 2014a). In the United States, the 2010 Affordable Care Act has set up a
Hospital Readmission Reduction Program. In 2012, the Center for Medicare and Medicaid
Services (CMS) began reducing payments to hospitals that have high readmission rates for
patients diagnosed with congestive heart failure, acute myocardial infarction and pneumonia
(Centers for Medicare & Medicaid Services, 2016; Cloonan, Wood, & Riley, 2013; Kocher &
Adashi, 2011).
There is a lack of consensus on how to determine how many readmissions are avoidable.
A review of studies that examined avoidable readmissions found that the rate varied from 5 to
79% (van Walraven, Bennett, Jennings, Austin, & Forster, 2011). Two reasons why different
studies have found such variable rates is that they use different populations as well as different
definitions of avoidable readmission (Greenwald & Jack, 2009). As stated earlier, there is a
growing awareness that how patients are discharged contributes to their readmission, and that
meeting the health literacy needs of patients and families at the time of discharge contributes to
5
decreased readmission (Adams, Stephens, Whiteman, Kersteen, & Katruska, 2014; Jack, Chetty,
Anthony, Greenwald, Sanchez, Johnson, Forsythe, O'Donnell, Paasche-Orlow, & Manasseh,
2009; Vashi et al., 2013). Hospitals that are adept at meeting the health literacy needs of patients
and families upon discharge may be considered health literate organizations.
1.3 Health literate best practices
In health literate organizations, health literate best practices are centered on the use of
“universal precautions” (Brach et al., 2012). Using universal precautions means assuming that all
health care users have inadequate health literacy since everyone will benefit from education that
is clear and easy to understand (DeWalt et al., 2010; Paasche-Orlow & Wolf, 2008; U.S.
Department of Health and Human Services, 2010). This recognizes that health literacy is not
static, but dynamic depending on one’s circumstances. For example, a patient may generally
have an adequate level of health literacy, however the stress that accompanies a new diagnosis or
disease exacerbation can challenge one’s ability to obtain, use and understand information about
one’s health, (Koh, Brach, et al., 2013; Kowalski et al., 2015).
More specifically, universal precautions recommend that health care providers employ
teach back (see description below), use plain language, speak slowly, avoid the use of medical
jargon and use written materials to highlight important information in interactions with patients
and families (Baker, 2011; Cua & Kripalani, 2008; Harper, Cook, & Makoul, 2007; Koh, Brach,
et al., 2013; Makaryus & Friedman, 2005; Nielsen, Rutherford, & Taylor, 2009; Williams,
Davis, Parker, & Weiss, 2002).
In the use of “teach back,” patients and families are asked to restate what a health care
provider has told and/or taught them about their health, in their own words. This allows
clinicians to verify that patients and families understand information and offers an opportunity to
6
provide any needed clarification (Baker, 2011; DeWalt et al., 2010; Koh, Brach, et al., 2013;
Nielsen et al., 2009; Schillinger et al., 2003; Shojania, Duncan, McDonald, Wachter, &
Markowitz, 2001). Teach back has been found to be an effective way to confirm patient
understanding of discharge instructions (Kripalani, Jackson, Schnipper, & Coleman, 2007).
This dissertation defines health literate best practices as the use of universal precautions.
Health literate discharge practices help patients and their families to obtain, use and understand
information to manage their health at the time of discharge. In the United States, the use of a
discharge process named “Project RED” (Re-Engineered Discharge) that is based on health
literate discharge practices, has been found to be associated with decreased hospital readmission
(Adams et al., 2014; Jack, Chetty, Anthony, Greenwald, Sanchez, Johnson, Forsythe, O'Donnell,
Paasche-Orlow, & Manasseh, 2009; Markley et al., 2013). .
1.4 Care transition efforts in Ontario
There are various ongoing efforts in the community to improve care transitions (Health
Quality Ontario, 2013a, 2013b). There are 13 “Home At Last” programs in place across Ontario.
These programs help to transition older adults as well as adults with complex needs from the
hospital to the home, with the support of CCAC (Community Care Access Centres) and
community support services (Central East Local Health Integration Network, 2014; Ministry of
Health and Long-Term Care, 2014b). As an example, in an Ontario community in 2010-11,
there was a nurse practitioner-led care transition intervention that supported seniors through the
discharge process from hospital to home (Lane, Pitzul, Laporte, Nauenberg, & Wodchis, 2013).
In 2012, the MOHLTC introduced an initiative called Health Links to Ontario, which is
specifically designed to improve the coordination of care for patients with multiple complex
conditions who are high users of the health care system. At present, there are 69 community
7
Health Links in the province. Two goals of the Health Links are to reduce avoidable ED visits
and to reduce 30-day readmission rates through improving care coordination between primary,
community and acute care services (Ministry of Health and Long-Term Care, 2015c)
1.5 Discharge practices in Ontario hospitals
The use of health literate discharge practices has not been studied in Ontario hospitals,
however, there is evidence that hospitals in Ontario have begun to address the issue of health
literacy (Health Quality Ontario, 2013b; St. Michael's Hospital, 2010).
We do not know if discharge practices used in Ontario hospitals meet the health literacy
needs of patients and families. In other words, it is unknown whether hospitals in Ontario are
using discharge practices that help patients and families to obtain, use and understand
information to make decisions that maintain and promote health (Berkman, Sheridan, Donahue,
Halpern, Viera, et al., 2011; Nielsen-Bohlman et al., 2004).
1.6 Introduction to the three studies
This dissertation uses a mixed methods, sequential design to address the following
research objectives:
1) To identify the best indicators of health literate discharge practices;
2) To determine whether hospitals in Ontario use health literate discharge practices;
3) To find out how Ontario hospitals adopt and use health literate discharge practices;
4) To examine the relationship between organizational characteristics and the use of health
literate discharge practices.
The first study (chapter 3) used a Delphi panel to find the best indicators of health literate
discharge practices; this study was based on, and extended, work to date on Project RED (Jack et
8
al., 2009). In the second study (chapter 4), these indicators were used to create a survey. This
survey was distributed to all adult, acute care hospitals in Ontario that have a general medicine
inpatient unit. This study was guided by the Health Literate Care Model (Koh, Brach, et al.,
2013). Exploratory factor analysis of the survey results was completed to determine the factors
that constitute the use of health literate discharge practices in Ontario hospitals.
The third study (chapter 5) examined how acute care hospitals take on health literate
discharge practices. To examine this question, health literate discharge practices were cast as
practice innovations, and organizational learning theory was used as a framework by which to
analyze data collected from key informant interviews with a subset of clinicians who participated
in the survey. These interviews examined the relationship between the organizational
characteristics of hospitals and their use of health literate discharge practices. The fourth and
final study examined the relationship between the organizational characteristics of hospitals and
the use of health literate discharge practices.
9
Chapter 2:
Health Literate Discharge Practices and Project RED
2.1 Theoretical framework: The Health Literate Care Model
The theoretical framework used to guide the first two studies of this dissertation was the
Health Literate Care Model. The Health Literate Care Model is an adaptation of Wagner’s
Chronic Care Model (Koh et al., 2013). The Chronic Care Model is a conceptual framework that
has been widely tested and has been used to enhance patient care delivery (Barr et al., 2003;
Wagner, Austin, & Von Korff, 1996).
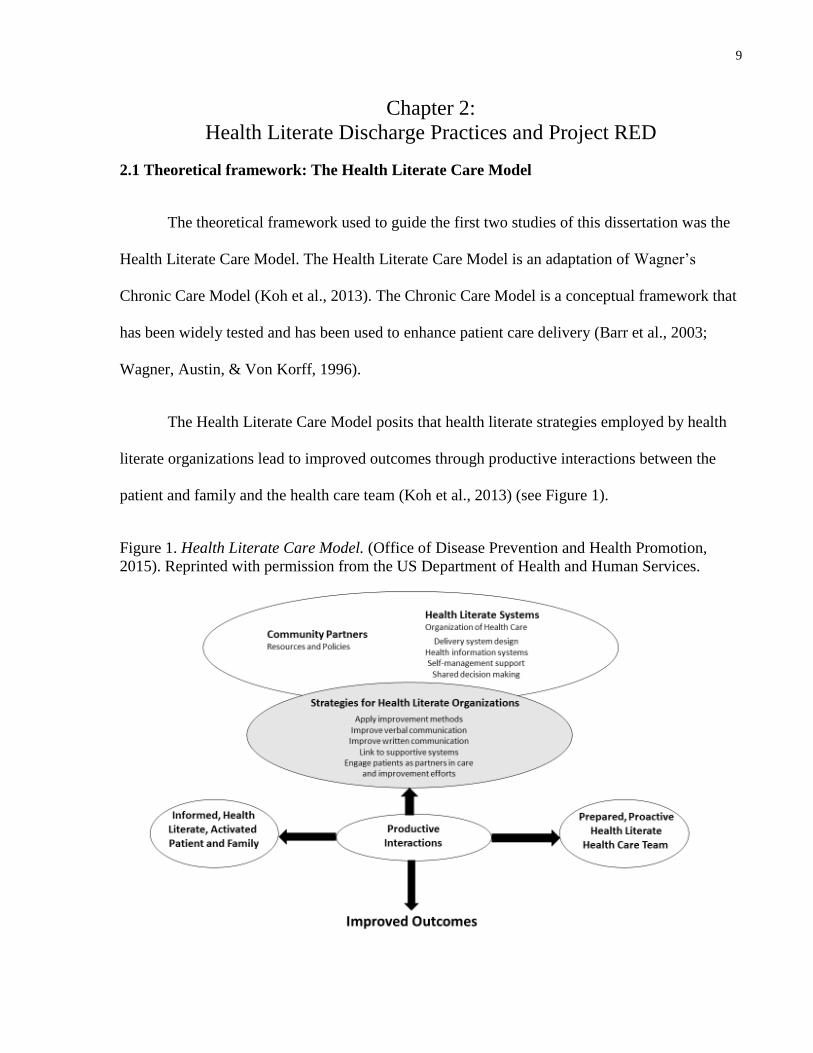
The Health Literate Care Model posits that health literate strategies employed by health
literate organizations lead to improved outcomes through productive interactions between the
patient and family and the health care team (Koh et al., 2013) (see Figure 1).
Figure 1. Health Literate Care Model. (Office of Disease Prevention and Health Promotion,
2015). Reprinted with permission from the US Department of Health and Human Services.
10
Health literate discharge practices may be thought of as health literate strategies for
health literate organizations (Koh et al., 2013). An example of a discharge strategy that is
consistent with meeting the health literacy needs of patients and families would be to review a
medication regimen with the use of “teach back.” As described in the introductory chapter,
patients and families would be asked to restate what a health care provider has told and/or taught
them about their medication regimen, in their own words. This allows clinicians to verify that
patients and families understand their medications and how the medications are used, and it
offers an opportunity to provide any needed clarification (DeWalt et al., 2010). Communicating
about the need for follow-up consultation appointments, and ensuring that the patient and family
understand the importance of this follow-up and can identify a plan to attend these appointments,
are other examples of health literature discharge practices. These examples are consistent with
the components of Project RED that will be described in the following sections (Jack et al.,
2013).
2.2 Introduction to Project RED
In an effort to improve the discharge process of acute care hospitals, in 2001, a team of
health care providers, researchers and administrators at Boston University and Boston Medical
Center, in conjunction with the Agency for Healthcare Research and Quality’s Developmental
Center for Patient Safety Research, began to examine factors at the time of discharge that led to
hospital readmission.
This team included a broad range of stakeholders. These stakeholders included the chief
medical officer, the directors of nursing, research, case management and quality improvement as
well as the nurse manager and clinical pharmacist from the medical wards of Boston Medical
Center. They reviewed the literature on hospital discharge practices and examined the process of
11
discharge from Boston Medical Center using a number of approaches that included probabilistic
risk assessment, failure mode and effects analysis, qualitative interviews and root cause analysis
(Anthony et al., 2005). Probabilistic risk assessment is a quantitative method for evaluating the
presence of possible risks and the consequences of these risks occurring (Freudenburg, 1988).
Failure mode and effects analysis is a qualitative method; it entails locating and naming areas of
potential failure in a process, such as a discharge process, and evaluating the possible outcomes
of the failures (Stephans, 2004). In addition, interviews with patients who were admitted to the
general medicine unit of Boston Medical Center were done. These patients had been readmitted
to hospital within 90 days of discharge. The interviews used a semi-structured interview guide
and were kept open-ended in an effort to find out about the experiences of patients with hospital
discharge and readmission (Anthony et al, 2005; Jack et al, 2008).
Following these approaches, the team of providers, researchers and administrators then
used an iterative group process to develop a process map that detailed all steps of hospital
discharge. Working in smaller groups, and as a larger team, they began to identify and describe
areas of possible failure that lead to hospital readmission, and they were then able to develop and
pinpoint ways to avoid or deter possible errors (Anthony et al., 2005; Greenwald, Denham, &
Jack, 2007; Jack et al., 2008).
This led to the development of Project RED, which consists of 12 components that
address patient education, medication regimens, follow-up appointments and diagnostic testing,
the need for written instructions, use of the teach-back method to confirm patient understanding
of the discharge plan, and the need for a discharge summary to be sent to patients’ primary care
providers (Jack et al., 2009; Jack et al., 2013):
Components of Project RED (Jack et al., 2013, page 11):
1. Ascertain need for and obtain language assistance.
12
2. Make appointments for follow up care (e.g., medical appointments, post discharge tests/labs).
3. Plan for the follow up of results from tests or labs that are pending at discharge.
4. Organize post discharge outpatient services and medical equipment.
5. Identify the correct medicines and a plan for the patient to obtain them.
6. Reconcile the discharge plan with national guidelines.
7. Teach a written discharge plan the patient can understand.
8. Educate the patient about his or her diagnosis and medicines.
9. Review with the patient what to do if a problem arises.
10. Assess the degree of the patient’s understanding of the discharge plan.
11. Expedite transmission of the discharge summary to clinicians accepting care of the patient.
12. Provide telephone reinforcement of the discharge plan.
In a randomized controlled trial, this program was found to significantly reduce acute
care service (as defined by hospital readmission and ED use within 30 days of discharge) by 30%
for patients discharged from a medical unit of a large teaching hospital (Jack et al, 2009). A 2013
study in Brownsville, Texas found that this program reduced hospital readmission rates by 50%
in a 240 bed hospital (Markley et al., 2013). In addition, a more recent study of the use of
Project RED in a rural 77 bed hospital in Pennsylvania found that it reduced hospital readmission
by 32% (Adams et al., 2014).
The practices used in Project RED have been found to be consistent with the practices of
health literate organizations (Institute of Medicine, 2012; Weidmer, Brach, Slaughter, & Hays,
2012). Project RED has been funded and endorsed by the Agency for Healthcare Research and
Quality in the United States as it has been associated with significant decreases in hospital
readmission, as well as decreased costs (Adams et al., 2014; Jack, Chetty, Anthony, Greenwald,
Sanchez, Johnson, Forsythe, O'Donnell, Paasche-Orlow, & Manasseh, 2009; Markley et al.,
2013).
2.3 Current state of hospital discharge
While the components of Project RED have been found to improve care throughout the
discharge process for patients and their families (Institute of Medicine, 2012; Jack et al., 2009;
13
Jack et al, 2013; Markley et al., 2013), there has been no widespread uptake of these components
in North American hospitals. Researchers have remarked upon the suboptimal discharge
processes in Canadian and American acute care hospitals. Unfortunately, when patients are
discharged home from an inpatient medicine ward in an acute care hospital, most are given little
if any information related to their follow-up care and their discharge medication plans, and the
information they are given is often inadequate and at times incorrect (Greenwald et al., 2007;
Kripalani et al., 2010). The day of discharge from an acute care hospital is frequently a
confusing and chaotic time (Soong et al., 2013) and patients have reported hurried processes with
a lack of attention to how their care will be managed following discharge (Hesselink et al., 2012;
Robert Wood Johnson Foundation, 2013).
Family members are defined by the patient, and they refer to those individuals who are
involved in the patient’s care. It is commonly assumed that only the patient needs to receive
education about discharge, and family members who provide care are often ignored in this
process (Neilsen et al., 2009). However, many patients rely on support that they receive from
family members once they are discharged home (Arbaje et al., 2014; Calvillo–King et al., 2013),
and it is important that these individuals be recognized and included in discharge education, as
they may be helping patients to manage their health (Coleman & Roman, 2015; Doctoroff &
McNally, 2014; Hesselink et al., 2012; Nielsen et al., 2009).
After patients are discharged home, they often have new health care issues to self-
manage, medication changes to grasp and follow-up appointments to make and attend. Often
this is at the same time that they are recovering from illness or a disease exacerbation (Dudas,
Bookwalter, Kerr, & Pantilat, 2001; Meyers et al., 2014). It is therefore not surprising that the
14
care transition from the acute care hospital to home is a period when patients may experience
increased adverse events (Coleman et al., 2013).
Even when patients are given information on their discharge plan, it is often not in a form
they understand. Due to their lack of health literacy, patients may not understand complex
medical issues and may have difficulty navigating the health care system to obtain further care.
This is in addition to the stress and anxiety that patients and families may experience when
coping with information about diagnoses, treatments and follow-up plans (Nielsen et al., 2009).
2.4 Evidence for components of Project RED
As described above, Project RED consists of 12 components. The following sections
describe evidence for each of the 12 components of Project RED.
2.4.1 Language assistance
The first component of Project RED is “ascertain need for and obtain language
assistance” (Jack et al., 2013, page 11). A barrier to understanding discharge information is
language, particularly if patients and families do not speak English or French. A recent study
examined level of understanding among patients being discharged from two urban hospitals in
California with limited English proficiency. It is not surprising that the authors found that these
patients had limited understanding of their follow-up care and their medications (Karliner et al.,
2012). Another study that took place in a teaching hospital in Massachusetts found that when
patients who had limited English proficiency were provided with translation services at
admission and at discharge, their length of stay and readmission rates were significantly lower
than patients who did not receive these services (Lindholm, Hargraves, Ferguson, & Reed, 2012)
15
During hospitalization and at the time of discharge, it is recommended that translation
services be made available for both oral and written education to ensure that patients and
families understand the discharge plan (Baker, 2011; Jack et al., 2013; Karliner et al., 2012).
2.4.2 Follow-up care: appointments and tests
The second component of Project RED is: “make appointments for follow up care” (Jack
et al, 2013, page 11). Moore, McGinn & Halm (2007) found that more than 1/3 of patients being
discharged from a medical or geriatrics service did not receive recommended follow-up care
consisting of diagnostic testing and specialist consultation. Reasons for this high rate may be that
patients are unaware that they need to make appointments and need to follow-up with testing and
consultations, or that they do not understand their discharge plan or how to navigate the health
care system to make these appointments (Jack et al., 2013).
2.4.3 Test results
The third component of Project RED is “plan for the follow up of results from tests or
labs that are pending at discharge” (Jack et al, 2013, page 11). Roy et al., (2005) found that
patients are often discharged from hospital with test results pending and with no plan for follow-
up of these results. This is particularly a problem when tests are ordered on the day of discharge
(Ong, Magrabi, Jones, & Coiera, 2012). Clearly this is a quality and safety issue as abnormal test
results may then not be seen by health care providers (Ong et al., 2012; Roy et al., 2005).
A 2013 study examined strategies used by 599 hospital in the United States in a
“Hospital-to-Home” quality campaign led by the American College of Cardiology that were
significantly associated with reduced readmission rates. Assigning hospital staff to follow up on
16
pending test results at the time of discharge was significantly associated with reduced
readmission (Bradley et al., 2013).
2.4.4 Coordination of post discharge services
The fourth component of Project RED is “organize post discharge outpatient services and
medical equipment” (Jack et al, 2013, page 11). A study that took placed in the United States
used a qualitative approach to find out about the difficulties experienced by cognitively impaired
patients and their family members in the hospital discharge process. Participants described
difficulty obtaining necessary patient equipment, and coordinating services (Naylor, Stephens,
Bowles, & Bixby, 2005).
Another study that took place in a teaching hospital in Cleveland, Ohio used a quasi-
experimental design. It introduced an intervention led by an advanced practice nurse. The nurse
met with patients who had been admitted to the intensive care unit and who had required
mechanical ventilation for at least 72 hours, and with their families. The nurse was responsible
for providing education and coordinating outpatient services. The patients who received this
intervention had higher scores on a measure of physical health-related quality of life, and also
had decreased readmission rates, compared to a control group (Douglas, Daly, Kelley, O’Toole,
& Montenegro, 2007).
A similar study took place in a Hong Kong hospital. This study examined the use of a
nurse-led intervention that provided the planning and coordination of outpatient services for
patients with end stage renal disease being discharged from hospital. The patients also received
an educational intervention. The patients who received the intervention had significantly higher
17
levels of patient satisfaction and quality of life compared to the control group (Chow & Wong,
2010).
2.4.5 Medication
2.4.5.1 Medication review
The fifth component of Project RED is “identify the correct medicines and a plan for the
patient to obtain them” and the eighth component is “educate the patient about his or her
diagnosis and medicines” (Jack et al., 2013, page 11). Ensuring that patients understand how to
obtain and use their medications is an important part of hospital discharge. Patients in the
hospital have been found to have a low level of knowledge regarding the medications that they
are being administered (Marvanova et al., 2011). Thus, it may not be surprising that the most
common post-discharge adverse events are related to medications (Forster et al., 2004; Forster,
Murff, Peterson, Gandhi, & Bates, 2003; Greenwald et al., 2007).
2.4.5.2 Medication teaching
Several studies have found that the reason for medication-related adverse events and non-
adherence to discharge medications is due to inadequate or inaccurate education about the
regimen (Forster et al., 2004; Kripalani, Jackson, et al., 2007; Lindquist et al., 2011). A number
of studies have found that medication counseling and teaching at the time of discharge are
associated with improved patient outcomes. In a quasi-experimental study, Paasche-Orlow et al
(2005) looked at the effect of a focused education session on the use of a meter-dose inhaler
(MDI) with asthma patients at the time of discharge in two urban teaching hospitals in the United
States. This study used a “teach to goal” strategy meaning that the education was repeated until
participants were able to demonstrate understanding of the medication regimen and skill in using
18
the MDI. This study found that tailored medication teaching at the time of discharge improved
understanding and use of the MDI, and that an inadequate level of health literacy was not
associated with greater difficulty learning or retaining this knowledge, compared to having an
adequate level (Paasche-Orlow et al., 2005)
A 2010 study done in the Netherlands examined the effect of medication teaching at the
time of discharge, as well as written medication instructions given to the patient. This was found
to have a significant impact on decreasing the number of medication discrepancies within 30-
days of discharge (Eggink, Lenderink, Widdershoven, & Bernt, 2010).
A similar study was completed in the UK in which patients received medication teaching
while they were hospitalized and were given a written medication list, discharge summary and
medication reminder card. These measures were found to be associated with fewer unplanned
visits to a primary care provider as well as decreased hospital readmissions (Al-Rashed, Wright,
Roebuck, Sunter, & Chrystyn, 2002).
In a study conducted in the United States, hospitalized patients received medication
counseling by a pharmacist at the time of discharge followed by a phone call 3-5 days post-
discharge. This intervention was associated with decreased adverse events (Schnipper et al.,
2006). An earlier study conducted in the United States found that when a pharmacist called
patients 2 days post-discharge, there was a reduction in 30-day ED use (Dudas et al., 2001).
These studies demonstrate that medication teaching at the time of discharge, with and without a
follow-up phone call, is associated with improved outcomes.
2.4.5.3 Medication reconciliation
19
In order to ensure that patients are taking the correct medications, it is imperative that
medication reconciliation be done upon discharge from hospital. The goal is to prevent errors by
reconciling medications, including natural remedies, which patients were taking before
hospitalization with discharge medications. This process of reconciliation allows health care
providers to ensure that patients are taking the correct medications and that any unnecessary or
incorrect ones have been discontinued (Accreditation Canada, Canadian Institute for Health
Information, & Institute for Safe Medication Practices Canada, 2012; Baker, 2011; Jack et al.,
2013).
All changes to a patient’s medication regimen need to be clearly communicated to the
patient and family to prevent confusion about which medications are to be taken once the patient
is home. Without this communication, patients may miss essential medications, may take
unnecessary ones and may have adverse events (Fallis, Dhalla, Klemensberg, & Bell, 2013;
Forster et al., 2004; Jack et al., 2013; Jencks et al., 2009; Levinson, 2008).
2.4.6 Use of guidelines
The sixth component of Project RED is “reconcile the discharge plan with national
guidelines” (Jack et al., 2013, page 11). The use of national guidelines refers to the use of
evidence-based practices (Jack et al., 2013). Evidence-based practices refer to routines or work
practices that comprise clinical practice guidelines or “care bundles”2 in health service
organizations. They are based on scientific evidence, and require the expertise of clinicians to
2 Care bundles is a term used for sets of evidence-based guidelines aimed at improving outcomes in hospitals
(Institute for Healthcare Improvement, 2014).
20
implement (Berta & Baker, 2004; Berta et al., 2005, 2010; Fineout-Overholt, Levin, & Melnyk,
2004; Graham, Mancher, Wolman, Greenfield, & Steinberg, 2011; Institute for Healthcare
Improvement, 2014). Although traditionally this has not been the case, ideally, evidence-based
practices take into consideration the choices and values of patients and families, in other words,
the end users of health care services (Fineout-Overholt et al., 2004).
The purpose of using evidence-based practices is to improve patient care and outcomes.
Evidence-based practices consist of interventions that have been studied and shown to be
effective. These interventions are standardized into work processes that help health care
providers make decisions that improve care for patients (Berta et al., 2005; Grimshaw & Eccles,
2004; Hoomans, Severens, Evers, & Ament, 2009; Tucker, Nembhard, & Edmondson, 2007).
When evidence-based practices are introduced, they have the potential to enhance the quality of
patient care and to improve organizational performance (Berta et al., 2005; Grimshaw & Eccles,
2004; Okafor & Thomas, 2008).
Despite repeated findings that the use of evidence-based practices has been associated
with improved patient care, quality and outcomes, numerous studies have found that patients do
not receive care that is based on strong, scientific evidence. It can take over a decade for
research findings to be adopted and used by healthcare organizations (Berta et al., 2005;
Dobbins, Ciliska, Cockerill, Barnsley, & DiCenso, 2002; Grol & Grimshaw, 2003; Okafor &
Thomas, 2008; Smith, Saunders, Stuckhardt, & McGinnis, 2013).
2.4.7 Use of written discharge instructions
The seventh component of Project RED is “teach a written discharge plan the patient can
understand” (Jack et al, 2013, page 11). As described earlier, the time of hospital discharge is
21
typically a chaotic one in which patients and families receive an overwhelming amount of
information (Soong et al., 2013). As it is difficult for patients and families to remember verbal
instructions at this time (Baker, 2011; Makaryus & Friedman, 2005), it may be helpful to provide
them with a written discharge plan containing the key information that patients will need to
manage their own care once they leave the hospital (Makaryus & Friedman, 2005). One study
found that providing patients over 65 years of age with a written discharge summary that
included details on their medications was significantly associated with reduced readmission and
fewer unplanned outpatient physician visits (Al-Rashed et al., 2002).
2.4.8 Patient and family teaching
The eight component of Project RED is “educate the patient about his or her diagnosis
and medicines” (Jack et al., 2013, page 11). Medication teaching is reviewed in section 2.3.5.2.
There is evidence that patients receive inadequate discharge education. A 2012 study
qualitative study examined the care patients and families receive at the time of discharge. This
study was conducted in 5 EU countries, and consisted of 192 individual interviews and 26 focus
groups with patients, family members, hospital nurses and physicians, and community nurses
and physicians. Patients and family members reported that discharge instructions were often
given with medical jargon that they could not understand. Health care providers in the hospital
and the community reported that patients often received inadequate teaching regarding their
follow up care. Both patients and providers reported that the information given was unclear, was
given in a hurried manner, and that patients and family members did not have an opportunity to
ask questions (Hesselink et al., 2012).
22
Health care providers may not provide education because they are unaware that patients
and their families may not understand health information. There is evidence that health care
providers overestimate patients’ understanding and patients’ levels of health literacy (Cua &
Kriplani, 2008; Dickens et al, 2013). In interviews that the Canadian Public Health Association
conducted with Canadians who have low levels of health literacy about their health care
experiences, participants consistently reported that they did not have enough time to ask
questions and to share concerns in their interactions with providers (Canadian Public Health
Association, 2006).
There is evidence from two studies to show that educational workshops in health literacy
can improve participants’ knowledge of effective health literacy communication techniques as
well as their confidence in using these techniques. Kriplani and colleagues (2011) looked at the
use of interactive educational sessions for medical residents in a large acute care hospital in
Atlanta, Georgia. This workshop had a small didactic portion that taught principles of health
literacy to medical residents. This was followed by a larger interactive component that allowed
the attendees to practice the teach back technique in groups of three, as described above in the
proposed workshop. It was found that these educational sessions were effective in increasing
participants' confidence in providing medication counseling and in their reported use of teach
back one month later.
Another study examined the use of similar educational workshops with social workers,
nurses, health educators, office staff and administrators in various health care settings in Texas.
It had a small didactic component that provided education on principles of health literacy. A
video in which individuals with low health literacy described their experience with the health
care system was included. This was followed by a role playing exercise that is also described by
23
the proposed workshop for the proposed strategy. Following the workshop, participants reported
increased knowledge of health literacy principles and indicated that they planned to use the
communication techniques that they had learned (Mackert, Ball & Lopez, 2011). It is not known
whether this intention translated to actual change in communication with patients and families.
A large number of studies have examined the impact of patient teaching. Disease-specific
teaching was addressed by the nurse-led intervention that took place in Hong Kong that focused
on the hospital discharge of patients with end stage renal disease. Patients received education on
disease management from study nurses, and this education, with the coordination of outpatient
services, was associated with increased patient satisfaction and quality of life (Chow & Wong,
2010).
A randomized controlled trial looked at the impact of a one-hour individualized teaching
session led by a nurse educator with heart failure patients in a Michigan teaching hospital. This
intervention was found to be associated with improved clinical outcomes and improved patient
adherence to a disease management plan (Koelling, Johnson, Cody, & Aaronson, 2005).
2.4.9 Review of potential problems
The ninth component of Project RED is “Review with the patient what to do if a problem
arises” (Jack et al., 2013, page 11). Teaching patients about health-related problems was part of
the disease and medication teaching that was evaluated in the studies that have been described.
For example, disease-specific teaching was addressed by the nurse-led intervention that
took place in Hong Kong that focused on the hospital discharge of patients with end stage renal
disease. Patients received education on disease management from study nurses, and this
24
education, with the coordination of outpatient services, was associated with increased patient
satisfaction and quality of life (Chow & Wong, 2010).
This component also includes establishing a plan for patients and families of what to do if
a problem arises (Jack et al., 2009; Jack et al., 2013).
2.4.10 Patient and family education with the use of teach back
The tenth component of Project RED is “assess the degree of the patient’s understanding
of the discharge plan” (Jack et al., 2013, page 11). As patients with heart failure have among the
highest rates of hospital readmission (Canadian Institute for Health Information, 2012; Jencks et
al., 2009), studies of hospital discharge often focus on patients with this condition. Two recent
studies examined the use of teach back in preparing patients with heart failure for discharge
home. In the first study, although the use of teach back as a single intervention was not
associated with decreased readmission, it was found to be significantly associated with
knowledge retention and it was found to be a valuable way to assess patient learning (White,
Garbez, Carroll, Brinker, & Howie-Esquivel, 2013).
The second study examined the use of teach back in heart failure patients at a large
Pennsylvania teaching hospital. In this study, 469 patients received some kind of teaching about
heart failure, and teach back was used with 180 of the patients. Those patients who received
teach back had significantly reduced readmission rates compared to the other 289 patients in the
study (Peter et al., 2015).
2.4.11 Transfer of discharge summary
25
The eleventh component of Project RED is “expedite transmission of the discharge
summary to clinicians accepting care of the patient” (Jack et al., 2013, page 11). At the time of
discharge from hospital to home, responsibility for the patient’s care is being transferred from
the inpatient health care provider team to the patient, family and the primary care provider
(Shoeb, Merel, Jackson, & Anawalt, 2012). In addition to the need for clear communication
between inpatient care providers and the patient and family, it is imperative that there be
information continuity between the inpatient team and the patient’s primary care provider. The
discharge summary is an important tool that primary care providers require to ensure continuity
of care for patients (Jack et al., 2008).
Physicians discharging patients from acute care hospitals in Ontario are legally required
to complete a discharge summary (Ministry of Health and Long-Term Care, 2006), however,
these summaries are frequently not sent to primary care providers. This means that the primary
care provider will not necessarily know about the hospitalization and the care that the patient
received which has the potential to lead to poor patient outcomes (Baker, 2011; Coleman &
Berenson, 2004; Forster et al., 2003; Jack et al., 2013; Kripalani, LeFevre, et al., 2007; Van
Walraven, Mamdani, Fang, & Austin, 2004; van Walraven et al., 2010). .
Interestingly, a 2002 Canadian study found that there was a decrease in hospital
readmissions for patients when their primary care physician had received a discharge summary
prior to seeing the patient in a follow-up encounter, although this relationship was not significant
(Van Walraven, Seth, Austin, & Laupacis, 2002). The 2013 study that examined strategies used
by hospitals in the United States to reduce readmission found that having a standardized process
to send discharge summaries to primary care providers was significantly associated with
decreased readmission (Bradley et al., 2013).
26
2.4.12 Telephone reinforcement of the discharge plan
The twelfth and last component of Project RED is “provide telephone reinforcement of
the discharge plan”. A 2006 Cochrane review examined the use of follow-up phone calls and was
unable to make any conclusions on the use of telephone reinforcement because of the wide range
of study methods and outcome measures (Mistiaen & Poot, 2006). More recent studies have
found a significant relationship between the use of hospital follow-up phone calls to patients and
decreased rates of readmission (Costantino, Frey, Hall, & Painter, 2013; Harrison, Auerbach,
Quinn, Kynoch, & Mourad, 2014). Harrison et al (2014) found a significant relationship, but
determined that the significance disappeared when the analysis controlled for patients who were
able to answer the phone. This may mean that patients who are able to answer the phone are
healthier, and have a decreased likelihood of being readmitted to hospital. Interestingly,
Costantino et al (2013) found that although Medicare patients who received a call had
significantly decreased rates of readmission and emergency department use following discharge,
they also had a significantly higher (3%) increase in physician office visits.
2.5 Need for complex interventions
A number of studies have examined the use of single interventions on hospital
readmission, such as medication teaching, or ensuring that patients receive follow-up
appointments prior to discharge. Single interventions have largely not been found to be
associated with decreased readmission. However, several studies have found that complex
interventions consisting of multiple steps are effective in reducing rates of 30 day readmission
(Baker, 2011; Coleman, Parry, Chalmers, & Min, 2006; Hansen, Young, Hinami, Leung, &
Williams, 2011; Mudge, Shakhovskoy, & Karrasch, 2013; Naylor et al., 1994; Naylor et al.,
2004; Shepperd et al., 2013).
27
A 2015 study examined the use of multiple interventions with heart failure patients in a
prospective cohort design that compared an intervention group (n=548) to an historical group
(n=485) in a teaching hospital in San Francisco. The intervention group received discharge
teaching with the use of teach-back, follow-up appointments within one week of discharge,
organization of post-discharge services and follow-up telephone calls within one week. There
were significantly reduced readmissions, which was associated with decreased hospital costs
(Howie-Esquivel et al., 2015).
A similar study took place in a Chicago teaching hospital. This study, led by a
pharmacist, examined the use of medication reconciliation with patients, development of a
patient-specific discharge plan, pharmacist counseling and three phone calls on days 3, 14 and 30
of discharge in a prospective, randomized controlled study of 278 patients. Patients who received
the intervention had significantly fewer readmissions and emergency department visits, as well
as significantly fewer adverse drug events and medication errors than the control group (Phatak
et al., 2016).
The nature of the relationship between discharge practices and readmission is a complex
and requires an approach that recognizes the complexity of this relationship. A strength of
Project RED is that it takes a complex approach and contains multiple steps that are
individualized to the needs of the patient and family. The adoption and use of the health literate
discharge practices contained in Project RED can be conceptualized using the Health Literate
Care Model that is described in section 2.1. The tenets of this framework provided a guide for
the first two studies.
2.6 Need for research
28
The use of health literate best practices has been associated with improved patient
satisfaction, increased adherence to medications, and reduced use of acute care services,
including use within 30 days of hospital discharge (Berkman, Sheridan, Donahue, Halpern,
Viera, et al., 2011; Jack, Chetty, Anthony, Greenwald, Sanchez, Johnson, Forsythe, O'Donnell,
Paasche-Orlow, Manasseh, et al., 2009). Despite the known linkage between health literate best
practices and these outcomes, high rates of readmission persist in North America. This
dissertation examines what hospitals in Ontario are doing to meet the health literacy needs of
their patients and families on discharge.
29
Chapter 3:
Development of Indicators of Health Literate Discharge Practices in
Ontario Hospitals Using a Delphi Panel
3.1 Purpose
The purpose of this study was to develop indicators of health literate discharge practices
in acute care hospitals. The research question was: What are the essential indicators of health
literate discharge practices in acute care hospitals? The 34 indicators from Project RED were
used as the initial set of elements which was then elaborated upon using the approach described
below. The purpose of developing this set of indicators was to create an organizational survey
tool to evaluate the use of health literate discharge practices in Ontario hospitals. To date, the
practices of Project RED have only been evaluated in hospitals in the United States. The use of a
Delphi panel, composed largely of experts from Ontario and Canada, would allow for the
practices of Project RED to be evaluated in the Canadian context.
3.2 Methods
A Delphi method was used to develop indicators of health literate discharge practices
(Boulkedid, Abdoul, Loustau, Sibony, & Alberti, 2011; Fink, Kosecoff, Chassin, & Brook, 1984;
Mullen, 2003). The study received ethics approval from the Office of Research Ethics at the
University of Toronto on September 15, 2014.
3.2.1 Sample
Convenience sampling was used to recruit participants from Ontario, as well as across
North America. The professional network of the investigator, which included members who had
knowledge of research, and researchers in the areas of health literacy and hospital discharge
practices, were the source of potential participants. Potential respondents were contacted by
30
email, and were informed as to why they had been selected to participate. In addition, North
American experts on health literacy and the discharge process were identified through contacts
made at health literacy and health services research conferences in Canada and the United States.
The email addresses of contacts were publicly available from conference attendee lists and from
publications.
An effort was made to include representation from “Health Links.” In 2012, the Ministry
of Health and Long-Term Care in Ontario introduced an initiative called Health Links, which is
specifically designed to improve the coordination of care for patients with multiple complex
conditions who are high users of the health care system, and who have been found to be at high
risk for hospital readmission (Ministry of Health and Long-Term Care, 2015c). As well,
representation was sought from Health Quality Ontario, a government agency that monitors and
reports on health system performance and supports quality improvement in the province of
Ontario (Health Quality Ontario, 2015b).
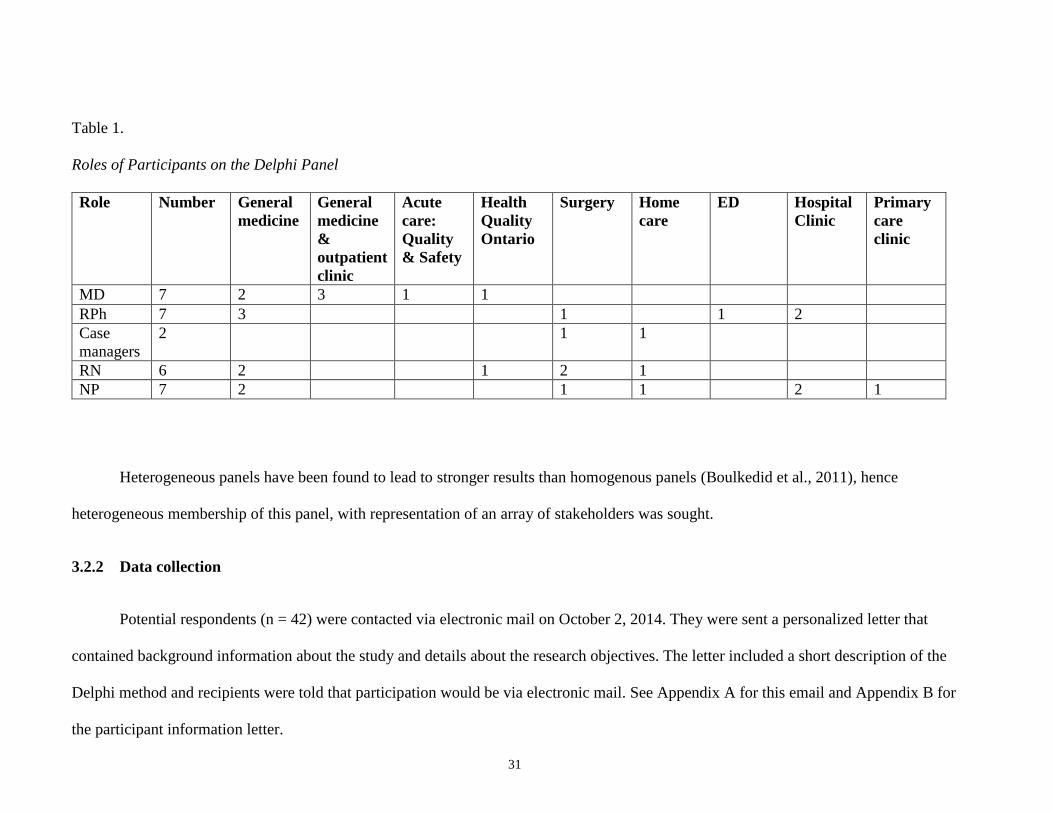
A total of 55 health care providers, managers and health service researchers were
contacted by email on September 23, 2014. Forty-two potential participants responded that they
would be willing to consider participation. The panel consisted of physicians (7), pharmacists
(7), a discharge planner (1), case managers (2), nurses (5), nurse practitioners (7), hospital
administrators (4) and health service researchers (9). Several panel members are considered
experts on health literacy and/or the hospital discharge process in North America. One hospital
administrator held a position that was cross-appointed to the Health Links in their region. In
addition, two panel members were representatives from Health Quality Ontario. See Table 1 for
the roles of participants.
31
Table 1.
Roles of Participants on the Delphi Panel
Role Number General
medicine
General
medicine
&
outpatient
clinic
Acute
care:
Quality
& Safety
Health
Quality
Ontario
Surgery Home
care
ED Hospital
Clinic
Primary
care
clinic
MD 7 2 3 1 1
RPh 7 3 1 1 2
Case
managers
2 1 1
RN 6 2 1 2 1
NP 7 2 1 1 2 1
Heterogeneous panels have been found to lead to stronger results than homogenous panels (Boulkedid et al., 2011), hence
heterogeneous membership of this panel, with representation of an array of stakeholders was sought.
3.2.2 Data collection
Potential respondents (n = 42) were contacted via electronic mail on October 2, 2014. They were sent a personalized letter that
contained background information about the study and details about the research objectives. The letter included a short description of the
Delphi method and recipients were told that participation would be via electronic mail. See Appendix A for this email and Appendix B for
the participant information letter.
32
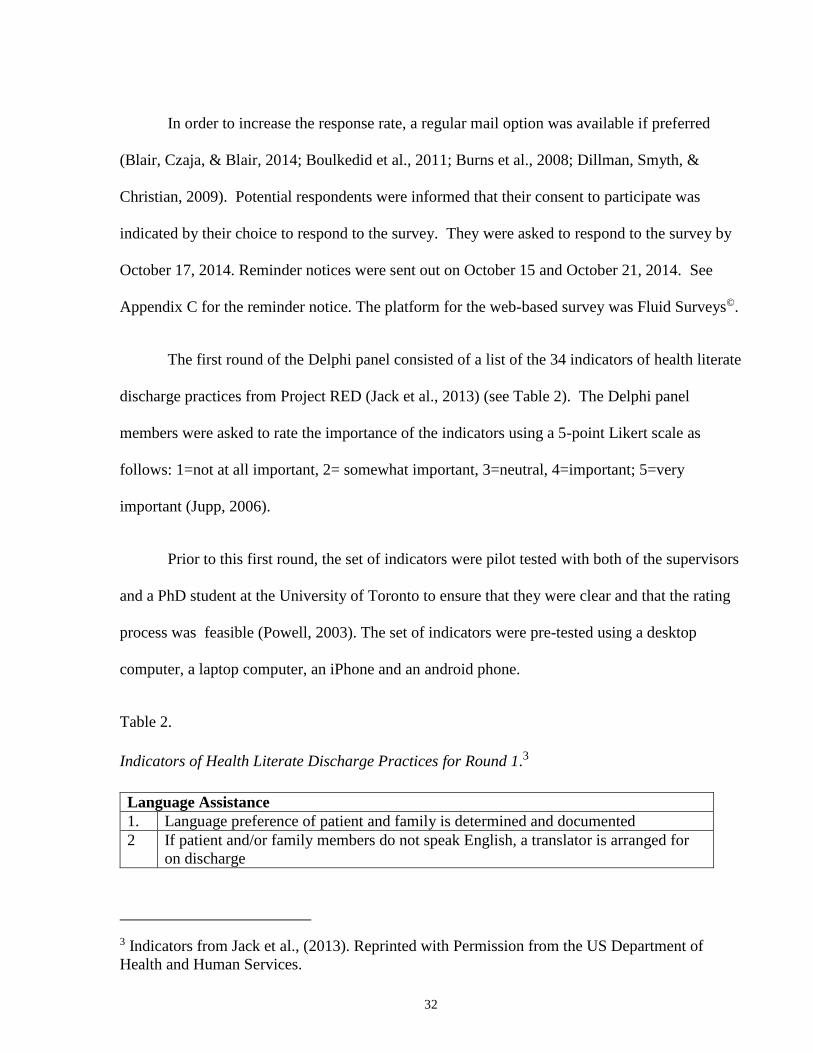
In order to increase the response rate, a regular mail option was available if preferred
(Blair, Czaja, & Blair, 2014; Boulkedid et al., 2011; Burns et al., 2008; Dillman, Smyth, &
Christian, 2009). Potential respondents were informed that their consent to participate was
indicated by their choice to respond to the survey. They were asked to respond to the survey by
October 17, 2014. Reminder notices were sent out on October 15 and October 21, 2014. See
Appendix C for the reminder notice. The platform for the web-based survey was Fluid Surveys©.
The first round of the Delphi panel consisted of a list of the 34 indicators of health literate
discharge practices from Project RED (Jack et al., 2013) (see Table 2). The Delphi panel
members were asked to rate the importance of the indicators using a 5-point Likert scale as
follows: 1=not at all important, 2= somewhat important, 3=neutral, 4=important; 5=very
important (Jupp, 2006).
Prior to this first round, the set of indicators were pilot tested with both of the supervisors
and a PhD student at the University of Toronto to ensure that they were clear and that the rating
process was feasible (Powell, 2003). The set of indicators were pre-tested using a desktop
computer, a laptop computer, an iPhone and an android phone.
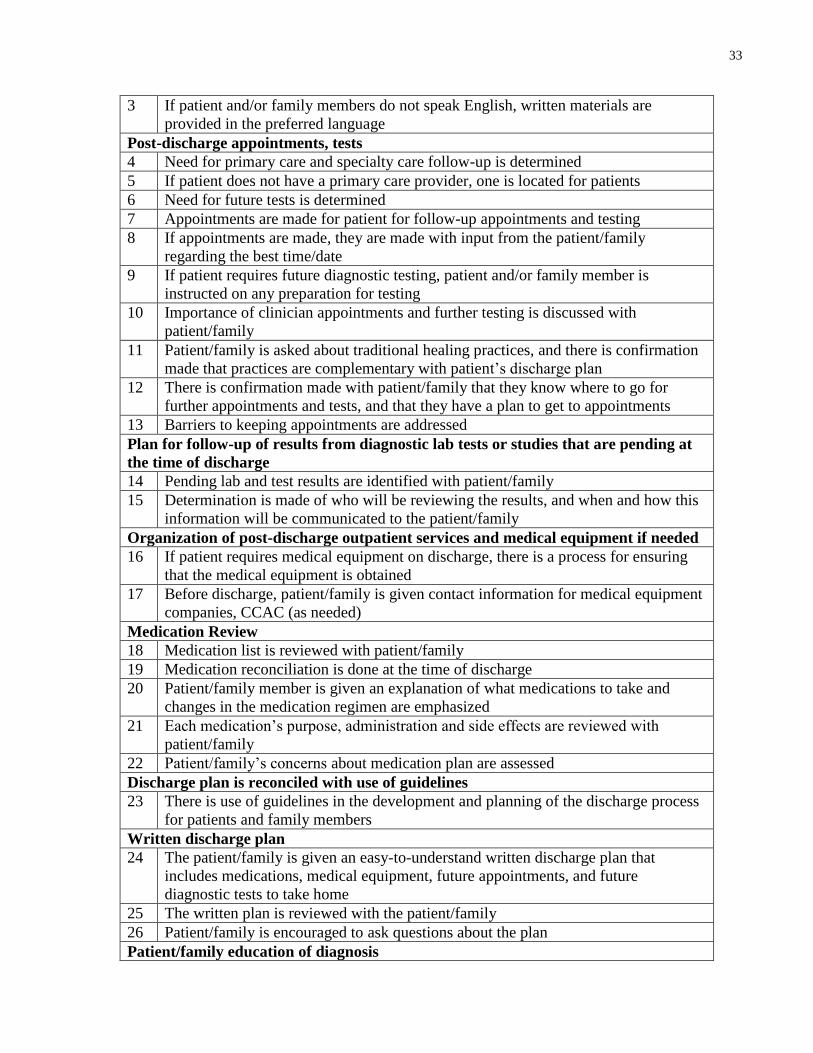
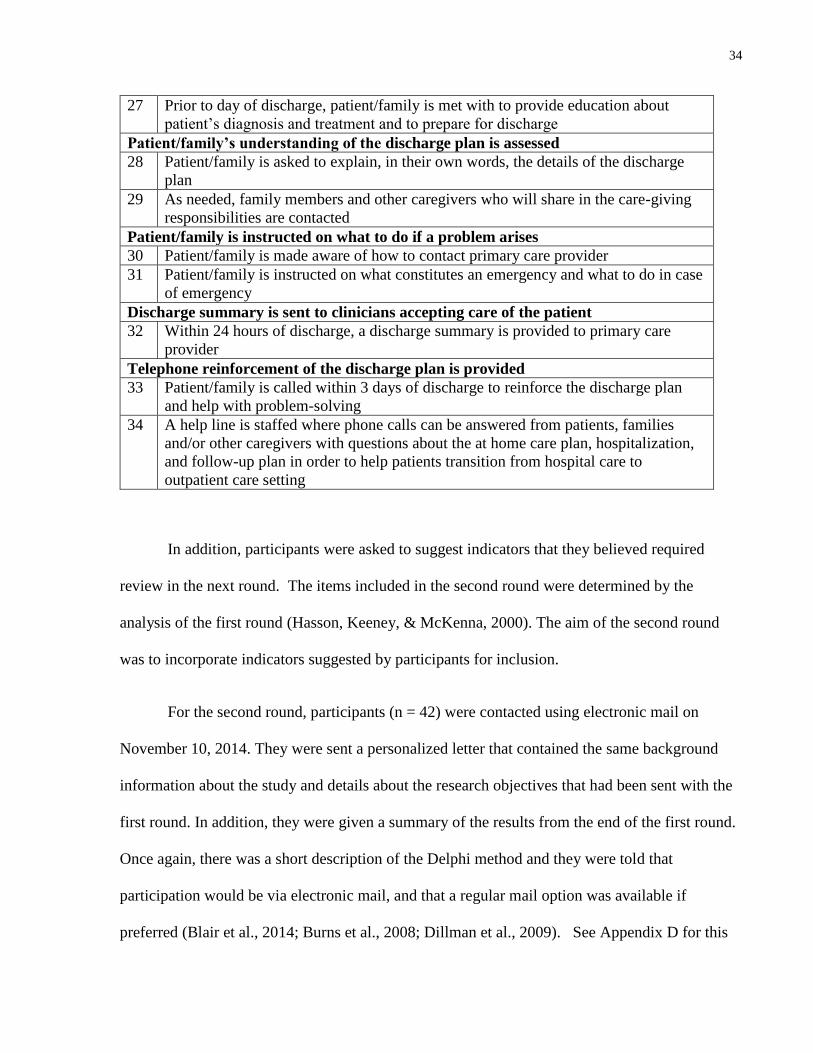
Table 2.
Indicators of Health Literate Discharge Practices for Round 1.3
Language Assistance
1. Language preference of patient and family is determined and documented
2 If patient and/or family members do not speak English, a translator is arranged for
on discharge
3 Indicators from Jack et al., (2013). Reprinted with Permission from the US Department of
Health and Human Services.
33
3 If patient and/or family members do not speak English, written materials are
provided in the preferred language
Post-discharge appointments, tests
4 Need for primary care and specialty care follow-up is determined
5 If patient does not have a primary care provider, one is located for patients
6 Need for future tests is determined
7 Appointments are made for patient for follow-up appointments and testing
8 If appointments are made, they are made with input from the patient/family
regarding the best time/date
9 If patient requires future diagnostic testing, patient and/or family member is
instructed on any preparation for testing
10 Importance of clinician appointments and further testing is discussed with
patient/family
11 Patient/family is asked about traditional healing practices, and there is confirmation
made that practices are complementary with patient’s discharge plan
12 There is confirmation made with patient/family that they know where to go for
further appointments and tests, and that they have a plan to get to appointments
13 Barriers to keeping appointments are addressed
Plan for follow-up of results from diagnostic lab tests or studies that are pending at
the time of discharge
14 Pending lab and test results are identified with patient/family
15 Determination is made of who will be reviewing the results, and when and how this
information will be communicated to the patient/family
Organization of post-discharge outpatient services and medical equipment if needed
16 If patient requires medical equipment on discharge, there is a process for ensuring
that the medical equipment is obtained
17 Before discharge, patient/family is given contact information for medical equipment
companies, CCAC (as needed)
Medication Review
18 Medication list is reviewed with patient/family
19 Medication reconciliation is done at the time of discharge
20 Patient/family member is given an explanation of what medications to take and
changes in the medication regimen are emphasized
21 Each medication’s purpose, administration and side effects are reviewed with
patient/family
22 Patient/family’s concerns about medication plan are assessed
Discharge plan is reconciled with use of guidelines
23 There is use of guidelines in the development and planning of the discharge process
for patients and family members
Written discharge plan
24 The patient/family is given an easy-to-understand written discharge plan that
includes medications, medical equipment, future appointments, and future
diagnostic tests to take home
25 The written plan is reviewed with the patient/family
26 Patient/family is encouraged to ask questions about the plan
Patient/family education of diagnosis
34
27 Prior to day of discharge, patient/family is met with to provide education about
patient’s diagnosis and treatment and to prepare for discharge
Patient/family’s understanding of the discharge plan is assessed
28 Patient/family is asked to explain, in their own words, the details of the discharge
plan
29 As needed, family members and other caregivers who will share in the care-giving
responsibilities are contacted
Patient/family is instructed on what to do if a problem arises
30 Patient/family is made aware of how to contact primary care provider
31 Patient/family is instructed on what constitutes an emergency and what to do in case
of emergency
Discharge summary is sent to clinicians accepting care of the patient
32 Within 24 hours of discharge, a discharge summary is provided to primary care
provider
Telephone reinforcement of the discharge plan is provided
33 Patient/family is called within 3 days of discharge to reinforce the discharge plan
and help with problem-solving
34 A help line is staffed where phone calls can be answered from patients, families
and/or other caregivers with questions about the at home care plan, hospitalization,
and follow-up plan in order to help patients transition from hospital care to
outpatient care setting
In addition, participants were asked to suggest indicators that they believed required
review in the next round. The items included in the second round were determined by the
analysis of the first round (Hasson, Keeney, & McKenna, 2000). The aim of the second round
was to incorporate indicators suggested by participants for inclusion.
For the second round, participants (n = 42) were contacted using electronic mail on
November 10, 2014. They were sent a personalized letter that contained the same background
information about the study and details about the research objectives that had been sent with the
first round. In addition, they were given a summary of the results from the end of the first round.
Once again, there was a short description of the Delphi method and they were told that
participation would be via electronic mail, and that a regular mail option was available if
preferred (Blair et al., 2014; Burns et al., 2008; Dillman et al., 2009). See Appendix D for this
35
email and Appendix E for the participant information letter. Participants were again notified that
their consent to participate in the study was indicated by their choice to respond to the survey.
They were asked to respond to the survey by November 21, 2014. Two reminder notices were
sent out on November 17 and November 24, 2014. See Appendix F for the reminder notice.
To be retained in the survey, an indicator had to receive a median rating of 3.0 or higher
during the round(s) (Fink et al., 1984). It was anticipated that this study would require two to
three rounds to reach consensus.
A response rate of 85% was required for each of the rounds. There is no established
recommended response rate for the Delphi method (Mullen, 2003). The rate of 85% appeared
reasonable in light of a recent systematic review of 80 studies that used a Delphi method which
found that, for studies reporting a response rate, the median response rates for the first, second,
and third rounds were as follows: 90%, 92% and 88% (Boulkedid et al., 2011). The purpose of
using reminders was to increase response rates (J. Van Geest & Johnson, 2011).
Using the Delphi method offered several advantages for this study. This method is
particularly good for attaining consensus in an area where there has been a lack of research and
where ambiguity exists (Boulkedid et al., 2011; Hasson et al., 2000; Powell, 2003; Skulmoski,
Hartman, & Krahn, 2007), as is the case with health literate hospital discharge practices. The
components of Project RED have been found to be associated with significantly decreased
hospital readmission (Adams et al., 2014; Jack et al., 2009; Markley et al., 2013), but it is not
known which components are the most important. In addition, as most of the panel members
were from Ontario, the Delphi method offered insight into the use of these practices in the
context of Ontario. It was anticipated that the expert opinions obtained using the Delphi method
36
would help to provide some clarity in order to develop a set of indicators of health literate
discharge practices.
The Delphi method relies on anonymity. The group members were not identified and
there was no physical meeting of the group. This was to ensure that no one participant was able
to direct the rankings of other participants (Boulkedid et al., 2011; Fink et al., 1984; Rowe &
Wright, 1999). This is particularly useful in a group consensus method as it prevents one expert
from dominating the process (Fink et al., 1984; Keeney, Hasson, & McKenna, 2006).
3.2.3 Data analysis
Median ratings for each of the indicators were computed, for each round, and summaries
of ratings these were distributed to the panel participants. Median ratings were chosen as Likert
scales were used, which provide an ordinal level of measurement (Field, 2013). In round 1,
participants were asked to suggest indicators for inclusion. The suggested indicators were
categorized using qualitative analysis, and included in material distributed in round 2.
3.3 Results
3.3.1 Round 1
3.3.1.1 Descriptive statistics
For round 1, there were a total of 37 responses (88% response rate). See Table 3.
Most of the respondents were Canadian, and 4 (11%) were from the United States. In
addition, 29 (78.4%) of the respondents worked in the acute care hospital setting. Four (10.8%)
worked in the university setting, 2 (5.4%) worked in the community and 2 (5.4%) worked at
Health Quality Ontario. There was consensus in the responses between these 4 settings.
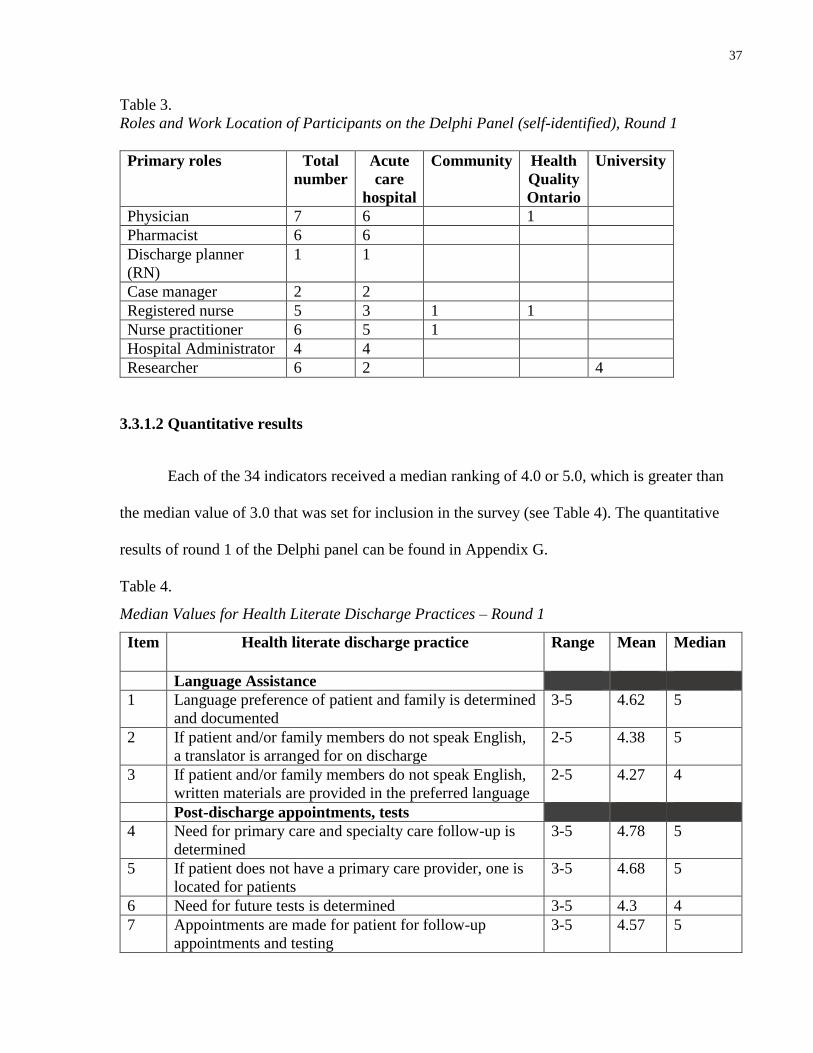
37
Table 3.
Roles and Work Location of Participants on the Delphi Panel (self-identified), Round 1
Primary roles Total
number
Acute
care
hospital
Community Health
Quality
Ontario
University
Physician 7 6 1
Pharmacist 6 6
Discharge planner
(RN)
1 1
Case manager 2 2
Registered nurse 5 3 1 1
Nurse practitioner 6 5 1
Hospital Administrator 4 4
Researcher 6 2 4
3.3.1.2 Quantitative results
Each of the 34 indicators received a median ranking of 4.0 or 5.0, which is greater than
the median value of 3.0 that was set for inclusion in the survey (see Table 4). The quantitative
results of round 1 of the Delphi panel can be found in Appendix G.
Table 4.
Median Values for Health Literate Discharge Practices – Round 1
Item Health literate discharge practice Range Mean Median
Language Assistance
1 Language preference of patient and family is determined
and documented
3-5 4.62 5
2 If patient and/or family members do not speak English,
a translator is arranged for on discharge
2-5 4.38 5
3 If patient and/or family members do not speak English,
written materials are provided in the preferred language
2-5 4.27 4
Post-discharge appointments, tests
4 Need for primary care and specialty care follow-up is
determined
3-5 4.78 5
5 If patient does not have a primary care provider, one is
located for patients
3-5 4.68 5
6 Need for future tests is determined 3-5 4.3 4
7 Appointments are made for patient for follow-up
appointments and testing
3-5 4.57 5
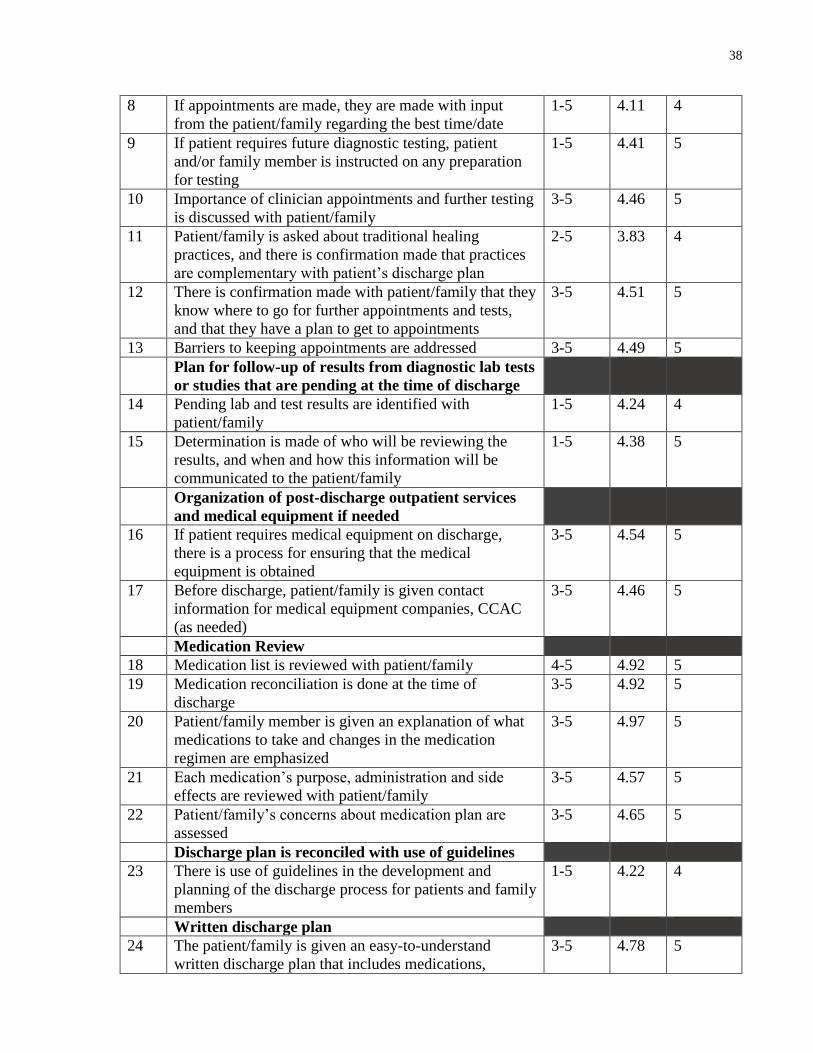
38
8 If appointments are made, they are made with input
from the patient/family regarding the best time/date
1-5 4.11 4
9 If patient requires future diagnostic testing, patient
and/or family member is instructed on any preparation
for testing
1-5 4.41 5
10 Importance of clinician appointments and further testing
is discussed with patient/family
3-5 4.46 5
11 Patient/family is asked about traditional healing
practices, and there is confirmation made that practices
are complementary with patient’s discharge plan
2-5 3.83 4
12 There is confirmation made with patient/family that they
know where to go for further appointments and tests,
and that they have a plan to get to appointments
3-5 4.51 5
13 Barriers to keeping appointments are addressed 3-5 4.49 5
Plan for follow-up of results from diagnostic lab tests
or studies that are pending at the time of discharge
14 Pending lab and test results are identified with
patient/family
1-5 4.24 4
15 Determination is made of who will be reviewing the
results, and when and how this information will be
communicated to the patient/family
1-5 4.38 5
Organization of post-discharge outpatient services
and medical equipment if needed
16 If patient requires medical equipment on discharge,
there is a process for ensuring that the medical
equipment is obtained
3-5 4.54 5
17 Before discharge, patient/family is given contact
information for medical equipment companies, CCAC
(as needed)
3-5 4.46 5
Medication Review
18 Medication list is reviewed with patient/family 4-5 4.92 5
19 Medication reconciliation is done at the time of
discharge
3-5 4.92 5
20 Patient/family member is given an explanation of what
medications to take and changes in the medication
regimen are emphasized
3-5 4.97 5
21 Each medication’s purpose, administration and side
effects are reviewed with patient/family
3-5 4.57 5
22 Patient/family’s concerns about medication plan are
assessed
3-5 4.65 5
Discharge plan is reconciled with use of guidelines
23 There is use of guidelines in the development and
planning of the discharge process for patients and family
members
1-5 4.22 4
Written discharge plan
24 The patient/family is given an easy-to-understand
written discharge plan that includes medications,
3-5 4.78 5
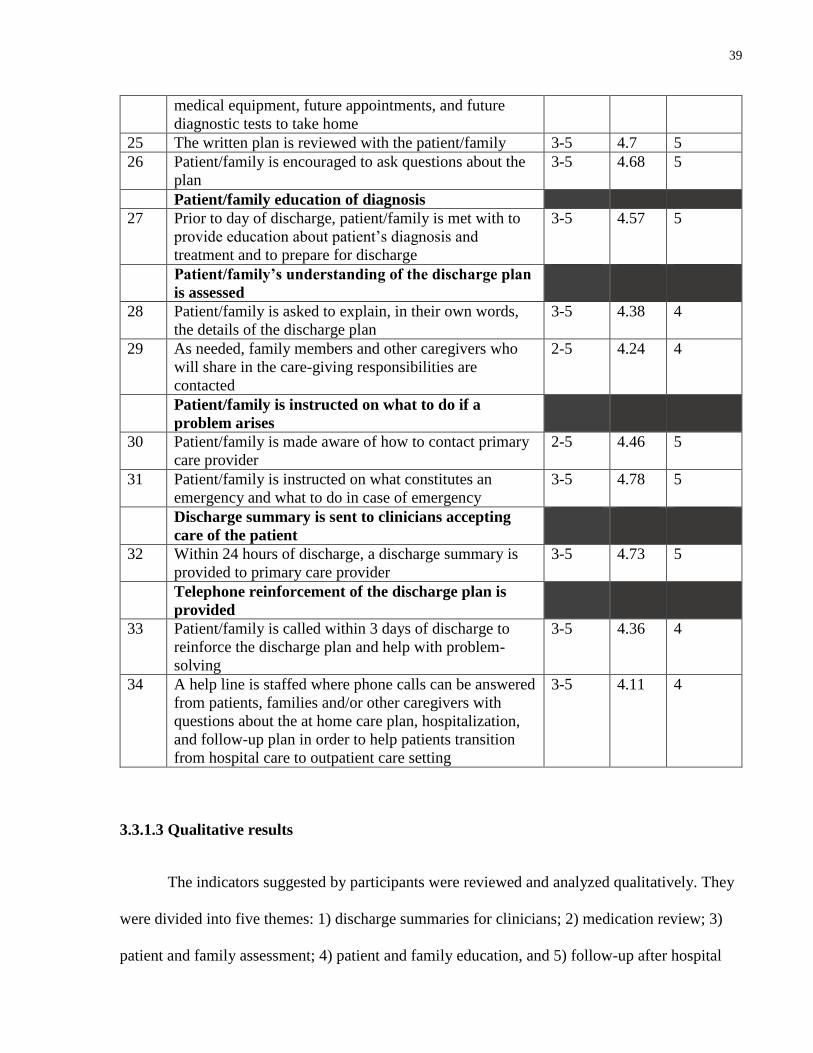
39
medical equipment, future appointments, and future
diagnostic tests to take home
25 The written plan is reviewed with the patient/family 3-5 4.7 5
26 Patient/family is encouraged to ask questions about the
plan
3-5 4.68 5
Patient/family education of diagnosis
27 Prior to day of discharge, patient/family is met with to
provide education about patient’s diagnosis and
treatment and to prepare for discharge
3-5 4.57 5
Patient/family’s understanding of the discharge plan
is assessed
28 Patient/family is asked to explain, in their own words,
the details of the discharge plan
3-5 4.38 4
29 As needed, family members and other caregivers who
will share in the care-giving responsibilities are
contacted
2-5 4.24 4
Patient/family is instructed on what to do if a
problem arises
30 Patient/family is made aware of how to contact primary
care provider
2-5 4.46 5
31 Patient/family is instructed on what constitutes an
emergency and what to do in case of emergency
3-5 4.78 5
Discharge summary is sent to clinicians accepting
care of the patient
32 Within 24 hours of discharge, a discharge summary is
provided to primary care provider
3-5 4.73 5
Telephone reinforcement of the discharge plan is
provided
33 Patient/family is called within 3 days of discharge to
reinforce the discharge plan and help with problem-
solving
3-5 4.36 4
34 A help line is staffed where phone calls can be answered
from patients, families and/or other caregivers with
questions about the at home care plan, hospitalization,
and follow-up plan in order to help patients transition
from hospital care to outpatient care setting
3-5 4.11 4
3.3.1.3 Qualitative results
The indicators suggested by participants were reviewed and analyzed qualitatively. They
were divided into five themes: 1) discharge summaries for clinicians; 2) medication review; 3)
patient and family assessment; 4) patient and family education, and 5) follow-up after hospital
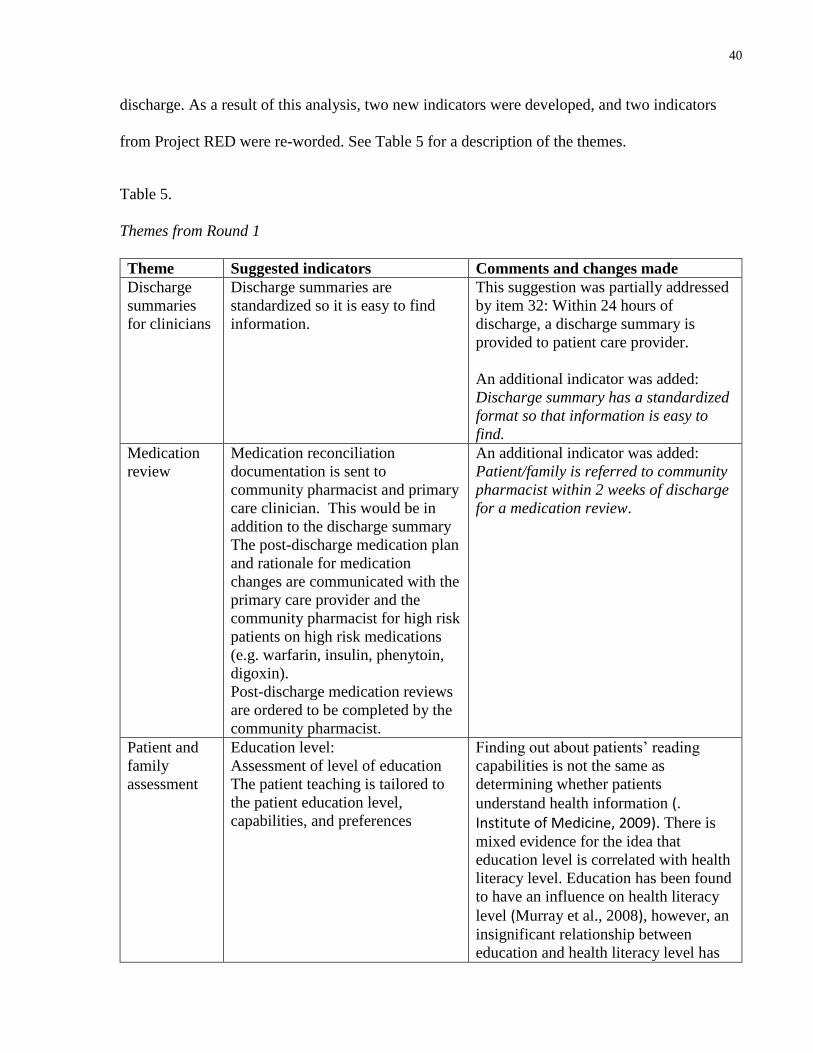
40
discharge. As a result of this analysis, two new indicators were developed, and two indicators
from Project RED were re-worded. See Table 5 for a description of the themes.
Table 5.
Themes from Round 1
Theme Suggested indicators Comments and changes made
Discharge
summaries
for clinicians
Discharge summaries are
standardized so it is easy to find
information.
This suggestion was partially addressed
by item 32: Within 24 hours of
discharge, a discharge summary is
provided to patient care provider.
An additional indicator was added:
Discharge summary has a standardized
format so that information is easy to
find.
Medication
review
Medication reconciliation
documentation is sent to
community pharmacist and primary
care clinician. This would be in
addition to the discharge summary
The post-discharge medication plan
and rationale for medication
changes are communicated with the
primary care provider and the
community pharmacist for high risk
patients on high risk medications
(e.g. warfarin, insulin, phenytoin,
digoxin).
Post-discharge medication reviews
are ordered to be completed by the
community pharmacist.
An additional indicator was added:
Patient/family is referred to community
pharmacist within 2 weeks of discharge
for a medication review.
Patient and
family
assessment
Education level:
Assessment of level of education
The patient teaching is tailored to
the patient education level,
capabilities, and preferences
Finding out about patients’ reading
capabilities is not the same as
determining whether patients
understand health information (. Institute of Medicine, 2009). There is
mixed evidence for the idea that
education level is correlated with health
literacy level. Education has been found
to have an influence on health literacy
level (Murray et al., 2008), however, an
insignificant relationship between
education and health literacy level has
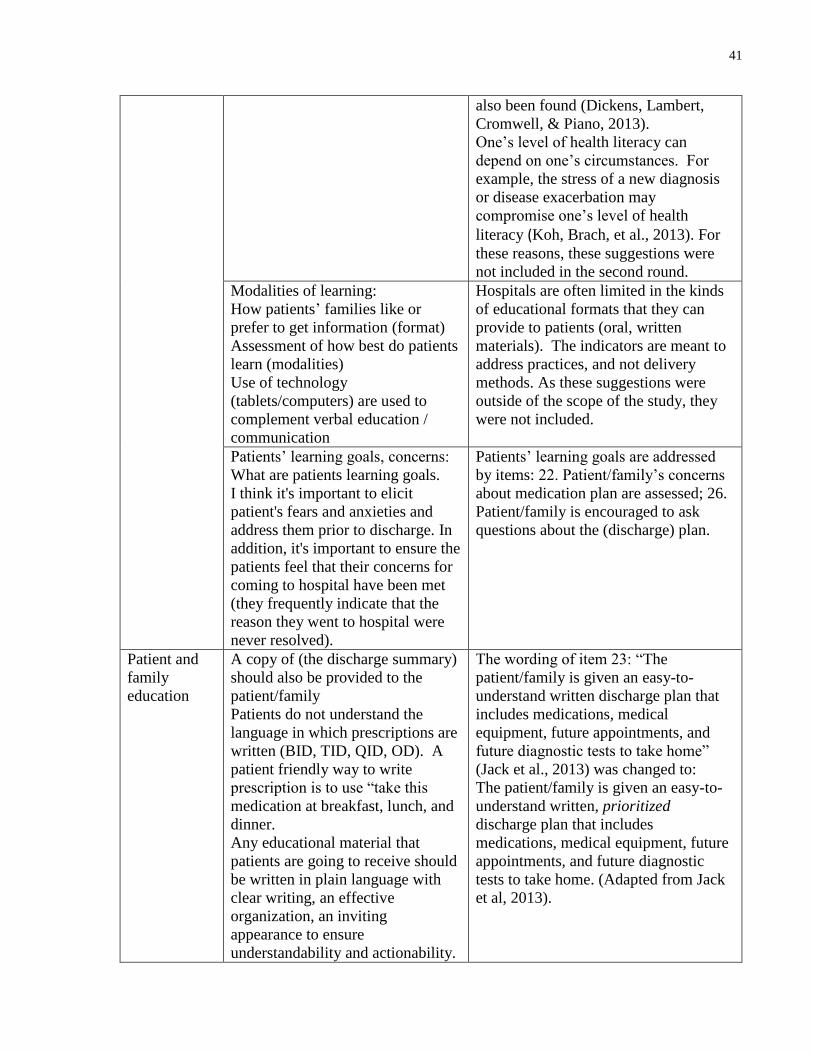
41
also been found (Dickens, Lambert,
Cromwell, & Piano, 2013).
One’s level of health literacy can
depend on one’s circumstances. For
example, the stress of a new diagnosis
or disease exacerbation may
compromise one’s level of health
literacy (Koh, Brach, et al., 2013). For
these reasons, these suggestions were
not included in the second round.
Modalities of learning:
How patients’ families like or
prefer to get information (format)
Assessment of how best do patients
learn (modalities)
Use of technology
(tablets/computers) are used to
complement verbal education /
communication
Hospitals are often limited in the kinds
of educational formats that they can
provide to patients (oral, written
materials). The indicators are meant to
address practices, and not delivery
methods. As these suggestions were
outside of the scope of the study, they
were not included.
Patients’ learning goals, concerns:
What are patients learning goals.
I think it's important to elicit
patient's fears and anxieties and
address them prior to discharge. In
addition, it's important to ensure the
patients feel that their concerns for
coming to hospital have been met
(they frequently indicate that the
reason they went to hospital were
never resolved).
Patients’ learning goals are addressed
by items: 22. Patient/family’s concerns
about medication plan are assessed; 26.
Patient/family is encouraged to ask
questions about the (discharge) plan.
Patient and
family
education
A copy of (the discharge summary)
should also be provided to the
patient/family
Patients do not understand the
language in which prescriptions are
written (BID, TID, QID, OD). A
patient friendly way to write
prescription is to use “take this
medication at breakfast, lunch, and
dinner.
Any educational material that
patients are going to receive should
be written in plain language with
clear writing, an effective
organization, an inviting
appearance to ensure
understandability and actionability.
The wording of item 23: “The
patient/family is given an easy-to-
understand written discharge plan that
includes medications, medical
equipment, future appointments, and
future diagnostic tests to take home”
(Jack et al., 2013) was changed to:
The patient/family is given an easy-to-
understand written, prioritized
discharge plan that includes
medications, medical equipment, future
appointments, and future diagnostic
tests to take home. (Adapted from Jack
et al, 2013).
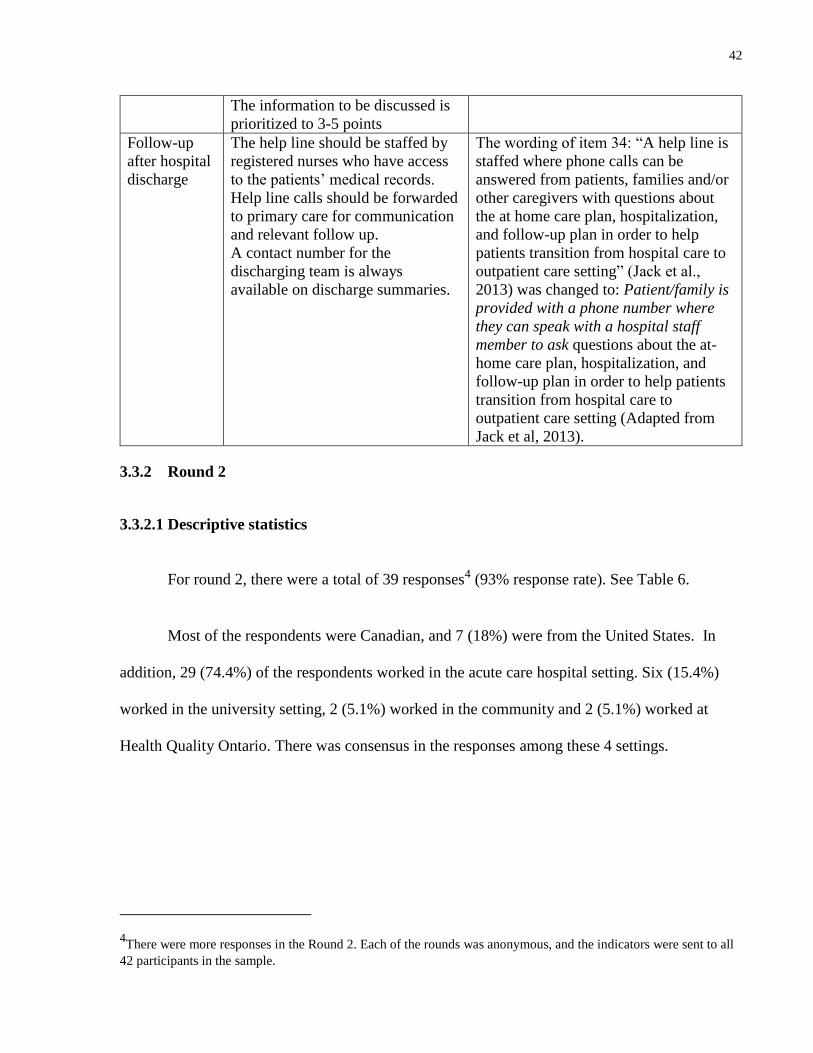
42
The information to be discussed is
prioritized to 3-5 points
Follow-up
after hospital
discharge
The help line should be staffed by
registered nurses who have access
to the patients’ medical records.
Help line calls should be forwarded
to primary care for communication
and relevant follow up.
A contact number for the
discharging team is always
available on discharge summaries.
The wording of item 34: “A help line is
staffed where phone calls can be
answered from patients, families and/or
other caregivers with questions about
the at home care plan, hospitalization,
and follow-up plan in order to help
patients transition from hospital care to
outpatient care setting” (Jack et al.,
2013) was changed to: Patient/family is
provided with a phone number where
they can speak with a hospital staff
member to ask questions about the at-
home care plan, hospitalization, and
follow-up plan in order to help patients
transition from hospital care to
outpatient care setting (Adapted from
Jack et al, 2013).
3.3.2 Round 2
3.3.2.1 Descriptive statistics
For round 2, there were a total of 39 responses4 (93% response rate). See Table 6.
Most of the respondents were Canadian, and 7 (18%) were from the United States. In
addition, 29 (74.4%) of the respondents worked in the acute care hospital setting. Six (15.4%)
worked in the university setting, 2 (5.1%) worked in the community and 2 (5.1%) worked at
Health Quality Ontario. There was consensus in the responses among these 4 settings.
4There were more responses in the Round 2. Each of the rounds was anonymous, and the indicators were sent to all
42 participants in the sample.
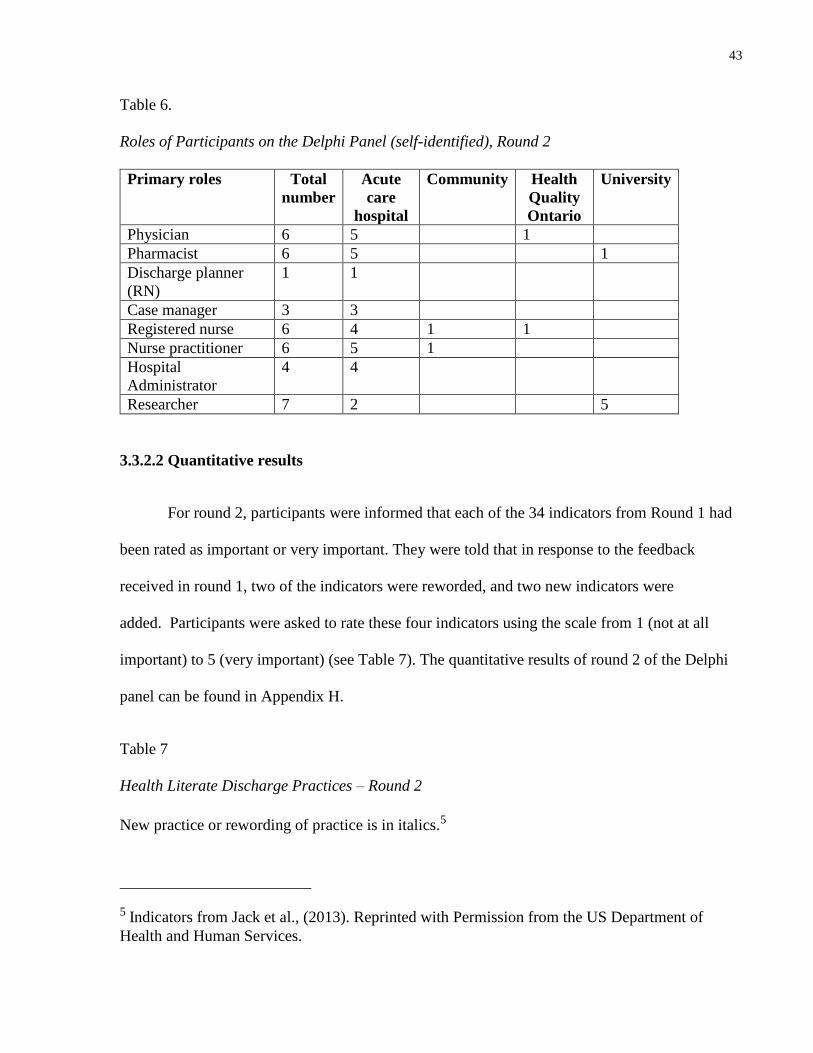
43
Table 6.
Roles of Participants on the Delphi Panel (self-identified), Round 2
Primary roles Total
number
Acute
care
hospital
Community Health
Quality
Ontario
University
Physician 6 5 1
Pharmacist 6 5 1
Discharge planner
(RN)
1 1
Case manager 3 3
Registered nurse 6 4 1 1
Nurse practitioner 6 5 1
Hospital
Administrator
4 4
Researcher 7 2 5
3.3.2.2 Quantitative results
For round 2, participants were informed that each of the 34 indicators from Round 1 had
been rated as important or very important. They were told that in response to the feedback
received in round 1, two of the indicators were reworded, and two new indicators were
added. Participants were asked to rate these four indicators using the scale from 1 (not at all
important) to 5 (very important) (see Table 7). The quantitative results of round 2 of the Delphi
panel can be found in Appendix H.
Table 7
Health Literate Discharge Practices – Round 2
New practice or rewording of practice is in italics.5
5 Indicators from Jack et al., (2013). Reprinted with Permission from the US Department of
Health and Human Services.
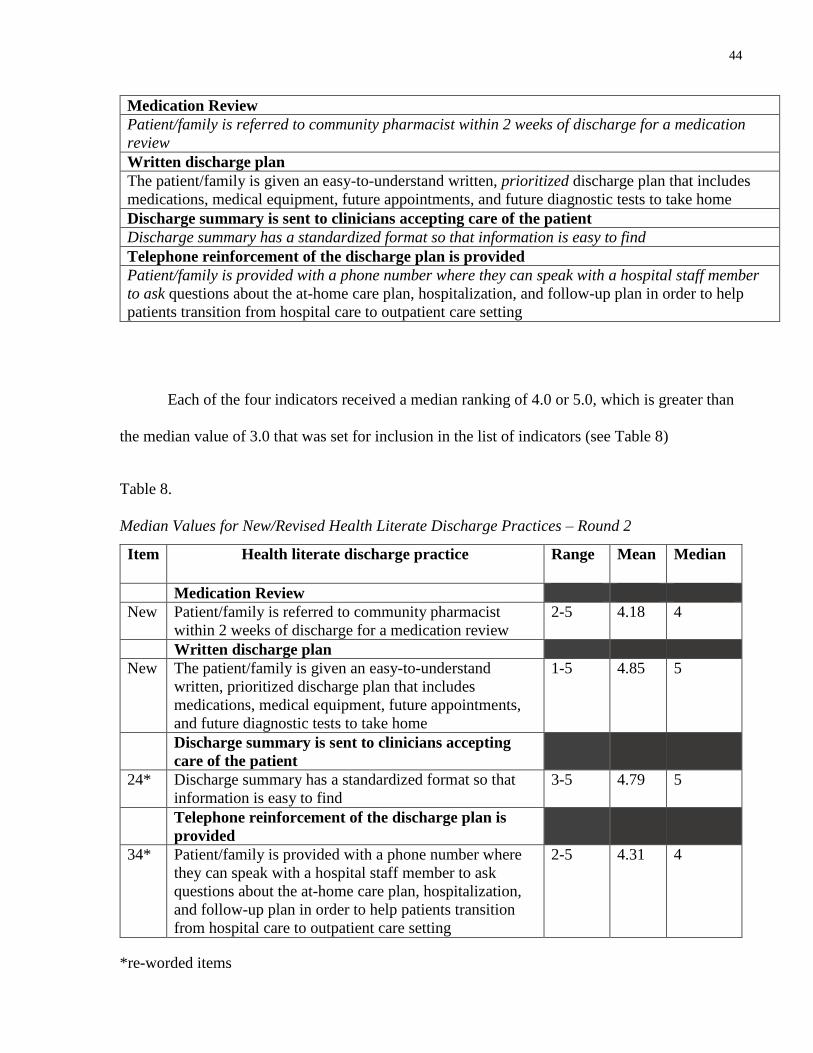
44
Medication Review
Patient/family is referred to community pharmacist within 2 weeks of discharge for a medication
review
Written discharge plan
The patient/family is given an easy-to-understand written, prioritized discharge plan that includes
medications, medical equipment, future appointments, and future diagnostic tests to take home
Discharge summary is sent to clinicians accepting care of the patient
Discharge summary has a standardized format so that information is easy to find
Telephone reinforcement of the discharge plan is provided
Patient/family is provided with a phone number where they can speak with a hospital staff member
to ask questions about the at-home care plan, hospitalization, and follow-up plan in order to help
patients transition from hospital care to outpatient care setting
Each of the four indicators received a median ranking of 4.0 or 5.0, which is greater than
the median value of 3.0 that was set for inclusion in the list of indicators (see Table 8)
Table 8.
Median Values for New/Revised Health Literate Discharge Practices – Round 2
Item Health literate discharge practice Range Mean Median
Medication Review
New Patient/family is referred to community pharmacist
within 2 weeks of discharge for a medication review
2-5 4.18 4
Written discharge plan
New The patient/family is given an easy-to-understand
written, prioritized discharge plan that includes
medications, medical equipment, future appointments,
and future diagnostic tests to take home
1-5 4.85 5
Discharge summary is sent to clinicians accepting
care of the patient
24* Discharge summary has a standardized format so that
information is easy to find
3-5 4.79 5
Telephone reinforcement of the discharge plan is
provided
34* Patient/family is provided with a phone number where
they can speak with a hospital staff member to ask
questions about the at-home care plan, hospitalization,
and follow-up plan in order to help patients transition
from hospital care to outpatient care setting
2-5
4.31 4
*re-worded items
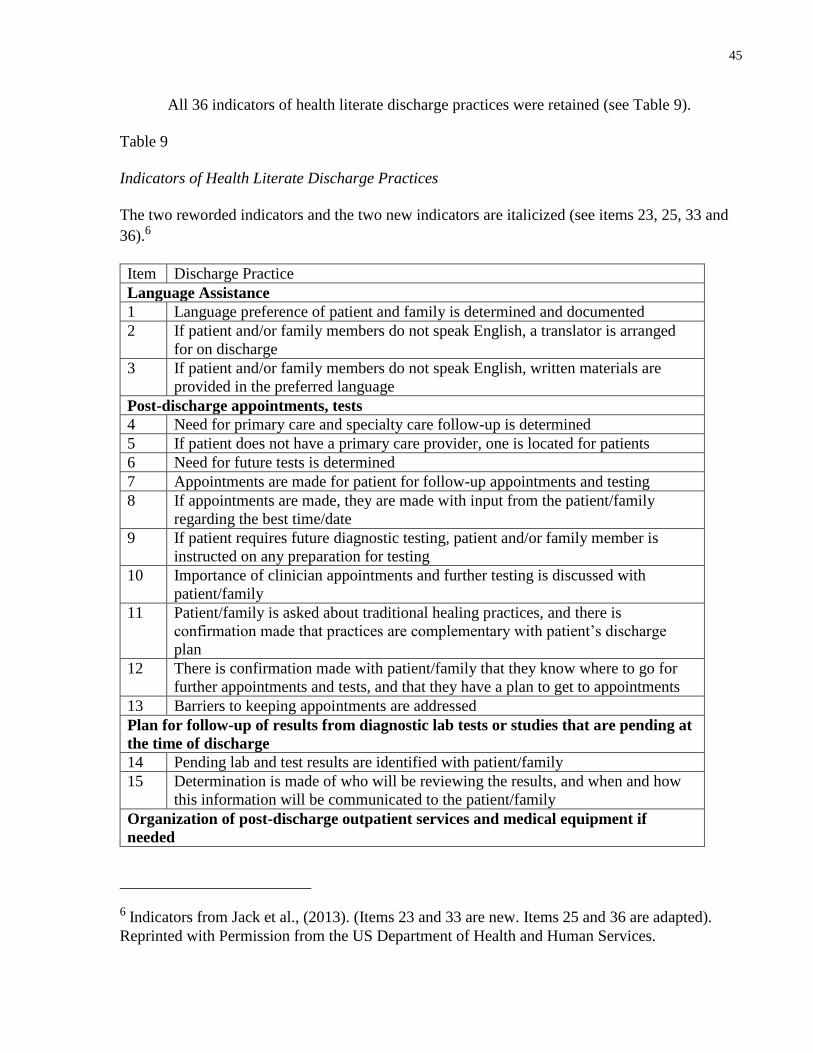
45
All 36 indicators of health literate discharge practices were retained (see Table 9).
Table 9
Indicators of Health Literate Discharge Practices
The two reworded indicators and the two new indicators are italicized (see items 23, 25, 33 and
36).6
Item Discharge Practice
Language Assistance
1 Language preference of patient and family is determined and documented
2 If patient and/or family members do not speak English, a translator is arranged
for on discharge
3 If patient and/or family members do not speak English, written materials are
provided in the preferred language
Post-discharge appointments, tests
4 Need for primary care and specialty care follow-up is determined
5 If patient does not have a primary care provider, one is located for patients
6 Need for future tests is determined
7 Appointments are made for patient for follow-up appointments and testing
8 If appointments are made, they are made with input from the patient/family
regarding the best time/date
9 If patient requires future diagnostic testing, patient and/or family member is
instructed on any preparation for testing
10 Importance of clinician appointments and further testing is discussed with
patient/family
11 Patient/family is asked about traditional healing practices, and there is
confirmation made that practices are complementary with patient’s discharge
plan
12 There is confirmation made with patient/family that they know where to go for
further appointments and tests, and that they have a plan to get to appointments
13 Barriers to keeping appointments are addressed
Plan for follow-up of results from diagnostic lab tests or studies that are pending at
the time of discharge
14 Pending lab and test results are identified with patient/family
15 Determination is made of who will be reviewing the results, and when and how
this information will be communicated to the patient/family
Organization of post-discharge outpatient services and medical equipment if
needed
6 Indicators from Jack et al., (2013). (Items 23 and 33 are new. Items 25 and 36 are adapted).
Reprinted with Permission from the US Department of Health and Human Services.
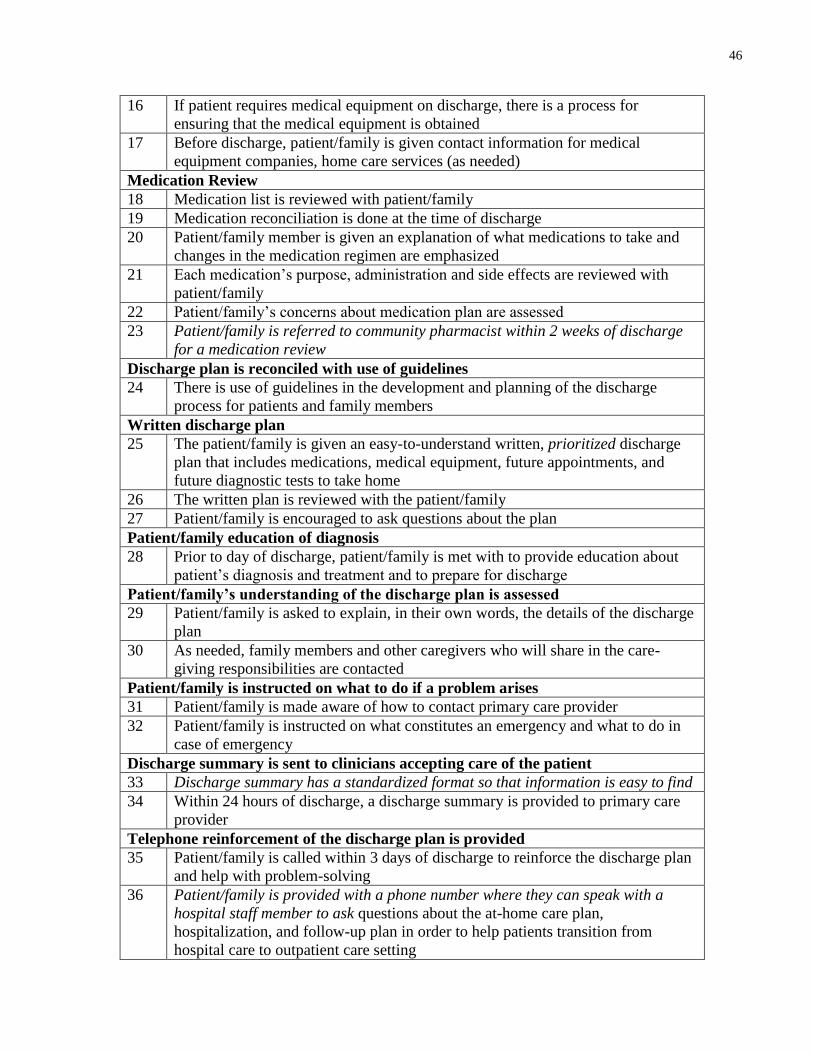
46
16 If patient requires medical equipment on discharge, there is a process for
ensuring that the medical equipment is obtained
17 Before discharge, patient/family is given contact information for medical
equipment companies, home care services (as needed)
Medication Review
18 Medication list is reviewed with patient/family
19 Medication reconciliation is done at the time of discharge
20 Patient/family member is given an explanation of what medications to take and
changes in the medication regimen are emphasized
21 Each medication’s purpose, administration and side effects are reviewed with
patient/family
22 Patient/family’s concerns about medication plan are assessed
23 Patient/family is referred to community pharmacist within 2 weeks of discharge
for a medication review
Discharge plan is reconciled with use of guidelines
24 There is use of guidelines in the development and planning of the discharge
process for patients and family members
Written discharge plan
25 The patient/family is given an easy-to-understand written, prioritized discharge
plan that includes medications, medical equipment, future appointments, and
future diagnostic tests to take home
26 The written plan is reviewed with the patient/family
27 Patient/family is encouraged to ask questions about the plan
Patient/family education of diagnosis
28 Prior to day of discharge, patient/family is met with to provide education about
patient’s diagnosis and treatment and to prepare for discharge
Patient/family’s understanding of the discharge plan is assessed
29 Patient/family is asked to explain, in their own words, the details of the discharge
plan
30 As needed, family members and other caregivers who will share in the care-
giving responsibilities are contacted
Patient/family is instructed on what to do if a problem arises
31 Patient/family is made aware of how to contact primary care provider
32 Patient/family is instructed on what constitutes an emergency and what to do in
case of emergency
Discharge summary is sent to clinicians accepting care of the patient
33 Discharge summary has a standardized format so that information is easy to find
34 Within 24 hours of discharge, a discharge summary is provided to primary care
provider
Telephone reinforcement of the discharge plan is provided
35 Patient/family is called within 3 days of discharge to reinforce the discharge plan
and help with problem-solving
36 Patient/family is provided with a phone number where they can speak with a
hospital staff member to ask questions about the at-home care plan,
hospitalization, and follow-up plan in order to help patients transition from
hospital care to outpatient care setting
47
3.4 Discussion
This study used a consensus method to evaluate the use of the 34 practices contained in
Project RED as indicators of health literate discharge practices. Members of the Delphi panel
were invited to contribute additional items.
All 34 practices from Project RED were rated as “important” or “very important” using a
5-point Likert scale. The additional items that were contributed by panel members were analyzed
qualitatively. Two items from Project RED were re-worded, and two additional indicators were
added.
In this way, the indicators are contextualized to Ontario hospitals. Several participants
identified the need to refer patients to a community pharmacist upon discharge to review
medications. This may be seen as Ontario-specific measure, as the MedsCheck program was
established by the Ministry of Health and Long-Term Care in 2007. Through this program,
community pharmacists consult with patients to review medications and ensure patient
understanding of medication regimens (Ministry of Health and Long-Term Care, 2008).
In addition, several participants identified the need for patients to be given a phone
number that they can use following discharge to have questions and concerns addressed. The
original indicator from Project RED states that a help line be staffed to answer calls from patients
and family members following discharge (Jack et al., 2013). As hospitals in Ontario are not
likely to have a help line that is staffed, this indicator was adjusted, and the wording was
changed to providing patients and family members with a phone number where they can speak
with a hospital staff member to ask questions.
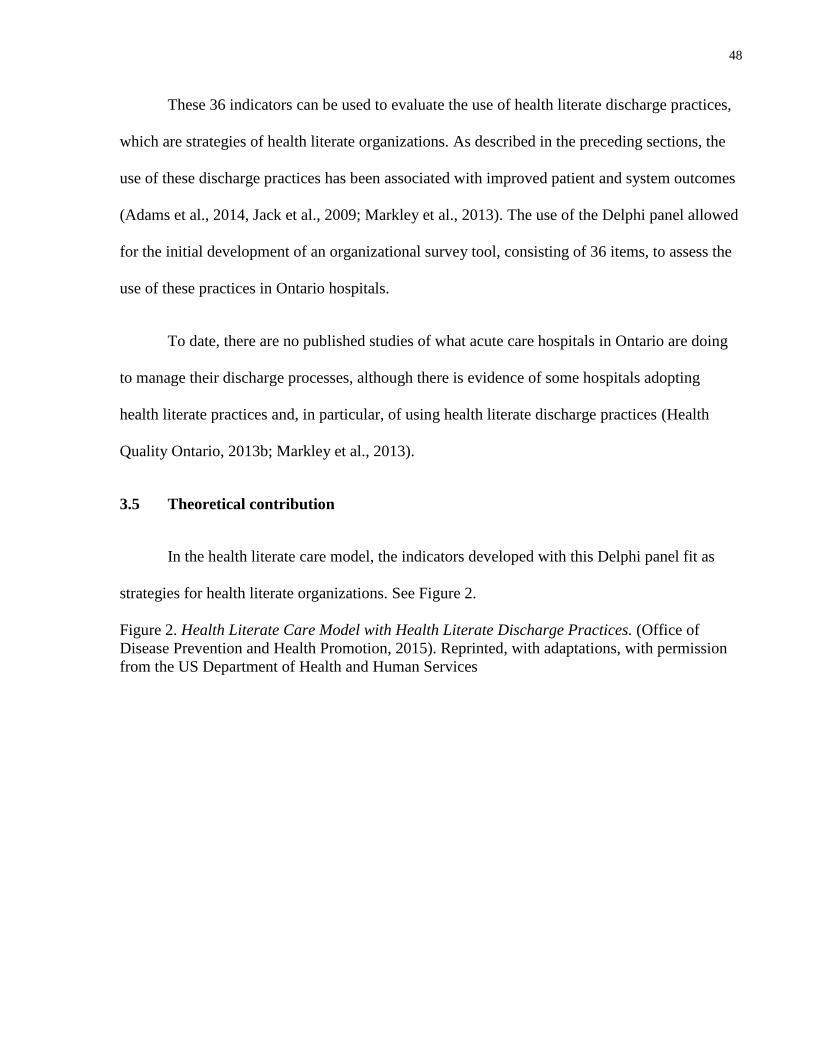
48
These 36 indicators can be used to evaluate the use of health literate discharge practices,
which are strategies of health literate organizations. As described in the preceding sections, the
use of these discharge practices has been associated with improved patient and system outcomes
(Adams et al., 2014, Jack et al., 2009; Markley et al., 2013). The use of the Delphi panel allowed
for the initial development of an organizational survey tool, consisting of 36 items, to assess the
use of these practices in Ontario hospitals.
To date, there are no published studies of what acute care hospitals in Ontario are doing
to manage their discharge processes, although there is evidence of some hospitals adopting
health literate practices and, in particular, of using health literate discharge practices (Health
Quality Ontario, 2013b; Markley et al., 2013).
3.5 Theoretical contribution
In the health literate care model, the indicators developed with this Delphi panel fit as
strategies for health literate organizations. See Figure 2.
Figure 2. Health Literate Care Model with Health Literate Discharge Practices. (Office of
Disease Prevention and Health Promotion, 2015). Reprinted, with adaptations, with permission
from the US Department of Health and Human Services
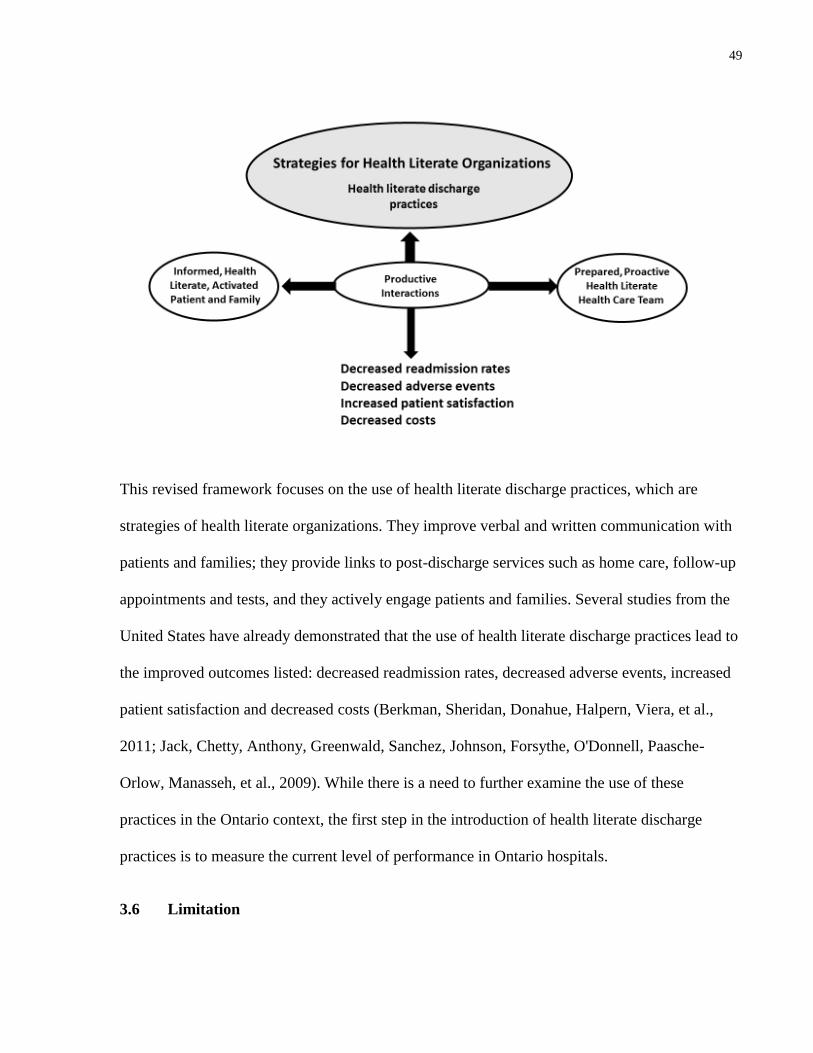
49
This revised framework focuses on the use of health literate discharge practices, which are
strategies of health literate organizations. They improve verbal and written communication with
patients and families; they provide links to post-discharge services such as home care, follow-up
appointments and tests, and they actively engage patients and families. Several studies from the
United States have already demonstrated that the use of health literate discharge practices lead to
the improved outcomes listed: decreased readmission rates, decreased adverse events, increased
patient satisfaction and decreased costs (Berkman, Sheridan, Donahue, Halpern, Viera, et al.,
2011; Jack, Chetty, Anthony, Greenwald, Sanchez, Johnson, Forsythe, O'Donnell, Paasche-
Orlow, Manasseh, et al., 2009). While there is a need to further examine the use of these
practices in the Ontario context, the first step in the introduction of health literate discharge
practices is to measure the current level of performance in Ontario hospitals.
3.6 Limitation
50
Although several members of the Delphi panel were from across Canada, and there were
several members from the United States, most of the panel members were from Ontario, Canada.
This list of indicators would likely require modification for use in acute care hospital settings
outside of North America.
3.7 Practice implications
Hospital managers and health care providers are increasingly aware of the need to meet
the health literacy needs of their patients and families (Koh, Brach, et al., 2013). The Institute of
Medicine has identified the need for health care organizations to become health literate (Institute
of Medicine, 2012). To date, there is no means of measuring the use of health literature
discharge practices in acute care hospitals. Examining current practices and processes is a
logical first step toward becoming a health literate hospital. Measuring current performance
identifies areas for improvement, and provides a baseline with which to check for improvements
(Kripalani et al., 2014). The indicators developed here may be used by hospitals as a means of
doing so, and may identify areas that need improvement (Kowalski et al., 2015). Together, these
indicators comprise a tool with the potential to allow policy makers and hospitals to monitor the
performance of hospital discharge, as well as their progress in using and promoting health
literate strategies.
51
Chapter 4:
Use of Health Literate Discharge Practices in Ontario Hospitals
4.1 Background
At present, there is no organizational survey to measure the use of health literate
discharge practices. The preceding chapter describes the development of a set of health literate
discharge practice indicators. The Delphi technique was used to establish construct and content
validity of the indicators with a panel of health care providers, managers and researchers who
have experience and expertise in the hospital discharge and/or health literacy. The development
of this set of indicators, through the use of the Delphi panel, was the first step in the creation of
the organizational survey consisting of 36 items. For each survey item, the respondents are asked
to rate the use of the discharge practice at their hospital with the following scale: 1=never,
2=seldom, 3= undecided, 4=often, 5=almost always (Burns et al., 2008; Jupp, 2006). See
Appendix I.
As described in Chapter 2, this survey is based on the 12 components of Project RED Jack et
al., 2013, p.11):
1. Language assistance
2. Post discharge appointments, tests
3. Plan for the follow up of results from diagnostic lab tests or studies that are pending at
discharge.
4. Organization of post discharge outpatient services and medical equipment if needed.
5. Medication review.
6. Discharge plan is reconciled with use of guidelines.
7. Written discharge plan.
8. Patient/family education of diagnosis.
9. Patient/family’s understanding of the discharge plan is assessed.
10. Patient/family is instructed on what to do if a problem arises.
11. Discharge summary is sent to clinicians accepting care of the patient.
12. Telephone reinforcement of the discharge plan is provided.
52
Each of these components contain one to ten survey items (as shown in Appendix I). The items
belong to the component with which they conceptually fit, however, this “fit” has not been
tested.
4.2 Research goals
The goals of this study were to find out about the use of health literate discharge practices
in Ontario hospitals and to determine the psychometric properties of the organizational survey as
this was the first time it was being administered to hospitals. In addition, a goal of this study was
to develop an understanding of the construct of “health literate discharge practices” in acute care
hospitals.
The research questions were:
1. To what extent do Ontario hospitals use health literate discharge practices?
2. Using the results of the survey of health literate discharge practices, what are the
factors that constitute the construct “use of health literate discharge practices” in
Ontario hospitals?
2a. What is the reliability of this survey?
2b. Do the factors that measure the construct “use of health literate discharge
practices” in Ontario hospitals match the components contained in Project RED?
4.3 Methods
This study received ethics approval from the Office of Research Ethics at the University
of Toronto on January 29, 2015. In addition, it received ethics approval from the Research
Ethics Board at St. Michael’s Hospital on June 29, 2015.
4.3.1 Sample
53
The sample consisted of the nursing managersof adult, general medicine units in the 143
Ontario acute care hospitals. There are 15 teaching hospitals, 48 large community hospitals
(hospitals with 100 beds or more) and 80 small community hospitals (hospitals with less than
100 beds) (Ministry of Health and Long-Term Care, 2013a, 2013b, 2013c). See Appendices J, K
and L for lists of the hospitals. Nursing managers were asked to complete the survey, or to share
the survey with a health care provider on their unit who had knowledge of the discharge process
at their hospitals. Nursing managers were chosen as they were considered the central point of
access to information about hospital discharge on inpatient medical units.
To identify nursing managers and to obtain their contact information, every hospital in
Ontario was contacted by phone. The name and email address of the nursing manager(s) for the
general medicine unit(s) was obtained from the inpatient medicine ward, or the locating
department of the hospital. The survey was emailed to potential participants with a request to
either complete the survey or to share it with a health care provider on the general medicine
patient care unit who has experience in the hospital discharge process.
4.3.2 Data collection
Pre-testing of the survey tool was done prior to its administration. The survey was pilot-
tested using the web based platform Fluid Surveys© with two nurses, a nurse practitioner, one
pharmacist who was also a health services researcher and a non-clinician health services
researcher. This testing was done to evaluate the survey items and to ensure that the questions
were clearly written so that they would be correctly interpreted by respondents (Burns et al.,
2008). As with the pre-testing done for the Delphi panel, the survey was pre-tested using a
desktop computer, a laptop computer, an iPhone and an android phone.
54
Potential respondents (n = 212) were contacted via electronic mail between March 17 and
August 14, 2015. There were a greater number of surveys (212) distributed than hospitals (143)
as a number of hospitals had more than one medicine unit or more than one nursing manager for
the medical unit(s). They were sent a personalized letter that contained background information
about the study and details about the research objectives. The letter included a short description
of the survey and recipients were told that participation would be via electronic mail. In order to
increase the response rate, a regular mail option was available if preferred (Blair et al., 2014;
Boulkedid et al., 2011; Burns et al., 2008; Dillman et al., 2009). See Appendix M for this email
and Appendix N for the participant information letter.
Sponsorship from a professional association has been found to be associated with
increased response rates (J Van Geest, Johnson, & Welch, 2007), and sponsorship for the survey
was obtained from the Ontario Hospital Association. See Appendix O for the letter of
endorsement that was sent to all potential respondents.
Potential respondents were informed that their consent to participate was indicated by
their choice to respond to the survey. They were asked to respond to the survey within 2 weeks.
Reminder notices were sent out after one and two weeks. As with the pilot testing, the platform
for the web-based survey was Fluid Surveys©. See Appendix P for the reminder notice.
The survey was electronic, and each question required an answer. If a participant missed
a question, the survey did not let them proceed until they had answered the question that was
missed. In the case where one participant missed a question on a paper version of the survey, the
principal investigator followed up with the participant to obtain an answer for the missing
question. Incomplete surveys were not included in this analysis.
55
4.3.3 Analysis
4.3.3.1 Characteristics of participants and hospitals
Descriptive statistics were produced to determine the baseline characteristics of
participants and hospitals. These characteristics included: role of participant and hospital group
(i.e. teaching hospital, large community hospital and small community hospital). Hospitals’
locations were categorized by the Local Health Integration Network (LHINs) in which they are
located. There are 14 LHINs in Ontario. The LHINs receive their funding from Ontario’s
Ministry of Health and Long-Term Care. They are responsibility for planning, funding and
integrating hospital, home and community services (Deber, 2014).
In addition, characteristics of the hospitals included rurality scores. The rurality score is a
composite value that reflects a community’s location with respect to population density and
travel times for basic and advanced health care services. The rurality index ranges from 0
(highest population density, lowest travel times) to 99 (lowest population density, highest travel
times) (Kralj, 2009).
4.3.3.2 Survey items and total scores
Descriptive statistics were produced for the survey items and total scores. For the survey
items, number and percentages of scores are calculated. For the total scores, the mean, standard
deviation and median values are presented as well as the distribution of the scores.
It was anticipated that there would be hospitals with multiple responses. For hospitals
with multiple responses, the median value for the health literate survey score was used.
4.3.3.3 Testing assumptions
56
Assumptions of normality for the distribution of scores was checked by examining the
distribution and the tests for skewness and kurtosis. Correlations between items were checked by
using Spearman’s rho to ensure that there was sufficient correlation between the variables to
proceed with analysis. Sampling adequacy was assessed using the Kaiser-Meyer-Olkin (Field,
2013). It is particularly important to check sampling adequacy with small samples (Gorsuch,
1997).
4.3.3.4 Exploratory factor analysis
Exploratory factor analysis was undertaken to gain an understanding of the structure of
the construct of interest, that is, the organizational use of health literate discharge practices
(Field, 2013). This was the first time this organizational survey was being administered to
hospitals. Another purpose of exploratory factor analysis is to reduce the number of items or
measures in a measurement instrument. In a survey, this could consist of reducing the number of
survey items (Field, 2013). As this was the analysis of a new survey, the purpose of this analysis
did not include reducing the number of survey items (Hinkin, 1998).
Exploratory factor analysis was done with principal axis factors extraction. Principal axis
factors extraction is recommended when results are non-normal, and it was anticipated that the
results would be non-normal. In addition, it has the benefit of being widely used and understood
(Costello & Osborne, 2005; Tabachnick & Fidell, 2007). Exploratory factor analysis was first
done without rotation, to determine the number of factors, and was then done with rotation.
Rotation is used to maximize the loading of items on as few factors as possible. This helps
improve the interpretability of the results (Meyers, Gaust, & Guarino, 2013; Tabachnick &
Fidell, 2007).
57
The assumption was made that the factors underlying the items in the survey are
correlated, as all of the survey items are measuring the use of a health literate discharge practice,
hence oblique rotation was used. As Costello & Osborne (2005) point out, in the social sciences,
some correlation between factors is expected as the items making up the factors are unlikely to
be completely independent of one another. Several authors contend that an orthogonal rotation
should only be done if there is a clear reason to do so and that otherwise, an oblique rotation is
preferred (Conway & Huffcutt, 2003; Costello & Osborne, 2005; Fabrigar, Wegener,
MacCallum, & Strahan, 1999; Floyd & Widaman, 1995; Gaskin & Happell, 2014; Tabachnick &
Fidell, 2007).
Factor correlation matrices were examined to confirm that the items were correlated
(Meyers et al., 2013). According to Meyers et al (2013), factor correlations equal to or greater
than .32 are considered appropriate for oblique rotation. When values are between .1 and .3, it is
less clear whether factors have enough correlation to rule out orthogonal rotation. These authors
state that when the results are not clear, the safest and most conservative route is to proceed with
oblique rotation. In addition, Meyers et al (2013) reinforce the notion that this decision to
proceed with oblique or orthogonal rotation should be based on the underlying theory. As stated
above, oblique rotation was chosen because the assumption is being made that the survey items
measuring the use of health literate discharge practices are correlated with each other.
Because the sample size was relatively small for performing factor analysis (less than
200), direct oblimin was chosen, as recommended by Field (2013). Promax is an alternate
method of performing oblique rotation however it is best suited to large data sets; Meyers et al.,
(2013) point out that the two methods will nearly always produce similar solutions.
58
To determine the number of factors to be considered in the analysis, both Kaiser’s
criterion7 and the scree plot were considered (Costello & Osborne, 2005; Fabrigar et al., 1999;
Field, 2013; Tabachnick & Fidell, 2007). This is consistent with the recommendation that more
than one test be used to determine the number of factors (Conway & Huffcutt, 2003; Fabrigar et
al., 1999). Parallel analysis is another technique to determine the number of variables (Costello
& Osborne, 2005; Courtney & Gordon, 2013; Gaskin & Happell, 2014). It was not performed as
this is only meant to be an initial analysis of the survey items.
The determination of the number of factors was also made based on the sample size.
Arrindell & Ende (1985) make the recommendation that the sample size should be used to
determine the number of factors. Their work demonstrates that stable factor solutions are found
when the sample size is approximately 20 times the number of factors. For example, with a
sample of 100, the authors recommend using a 5 factor solution.
Factor loadings greater than 0.3 were considered in the interpretation, based on
recommendations by a number of authors. Factor loadings are correlations of the items or
variables with the factors.(Costello & Osborne, 2005; Fabrigar et al., 1999; Field, 2013; Floyd &
Widaman, 1995; Kline, 2014; Tabachnick & Fidell, 2007). Costello & Osborne (2005) make the
point that a factor loading of .5 or higher reflects a strongly loaded item. This means that the item
is highly correlated with the factor.
4.3.3.4.1 Sample size for exploratory factor analysis
7 Kaiser’s criterion states that those factors with an eigenvalue of greater than 1 should be kept (Field, 2013)
59
When considering sample size in factor analysis, there are two sets of recommendations
to consider. One set of recommendations is focused on the size of the total sample. The second
set focuses on the subject to variable ratio.
Several authors recommend a sample of at least 300 (Comrey & Lee, 1992; Conway &
Huffcutt, 2003; Tabachnick & Fidell, 2007), although several authors note that smaller samples
can be considered if there are variables with high factor loadings and high communalities
(Fabrigar et al., 1999; MacCallum, Widaman, Zhang, & Hong, 1999; Tabachnick & Fidell,
2007). However, as Costello & Osborne (2005) note, this is an unlikely situation with data in the
social sciences.
There are two main issues with a low sample size in performing factor analysis. If the
sample is too small, the results are less likely to be generalizable to the population. Secondly, in
exploratory factor analysis, items are associated with factors, and with smaller samples, there is a
greater chance that items will be associated with the wrong factor (Costello & Osborne, 2005).
With respect to the subject to variable ratio, several authors recommend a ratio of 10:1
(Costello & Osborne, 2005; Everitt, 1975; Field, 2013; Kass & Tinsley, 1979; Nunnally, 1978).
Gorsuch (1983) states that an absolute minimum subject to variable ratio is 5:1, with a sample of
at least 100. Hatcher (1994) also recommends that the sample size be the larger of two criteria:
either 1) have a 5:1 ratio, or 2) be at least 100. Catell (1978) states that a subject to variable ratio
of 3:1 may be acceptable, but only with an absolute minimum sample size of 250 (Cattell, 1978).
Arrindell & van der Ende (1985) point out that subject to variable ratio recommendations
are inconsistent and vague. Their work found that a 1.3:1 was an acceptable subject to variable
ratio with a minimum sample size of 100, and that a 3.9:1 was an acceptable subject to variable
60
ratio with a minimum sample size of 78. As noted in the preceding section, the authors couple
this recommendation with the recommendation that the sample size should be 20 times the
number of factors (Arrindell & Van der Ende, 1985). This recommendation was considered in
determining the factor solution that had the best fit for the survey data.
4.3.3.5 Reliability testing
Reliability testing was done to assess whether the survey is consistently reflecting the
construct being measured (Field, 2013). It was first done with all 36 survey items, and then for
each factor as it is recommended that reliability testing be applied separately to subscales
(Cronbach, 1951). A reliability level of at least .7 is regarded as acceptable (Cortina, 1993; Field,
2009).
4.3.3.5.1 Inter-rater reliability testing
It was anticipated that there would be hospitals that had more than one response as there
are hospitals in Ontario with more than one medicine unit. For hospitals with 2 survey responses,
inter-rater reliability testing was done using Cohen’s kappa (Meyers et al., 2013). For hospitals
with more than 2 survey responses, inter-rater reliability testing was done using the intraclass
correlation coefficient (Field, 2013).
4.4 Results
4.4.1 Baseline characteristics of participants and hospitals
See Table 10 for baseline characteristics of participants.
Table 10.
Baseline Characteristics of Participants and Hospitals
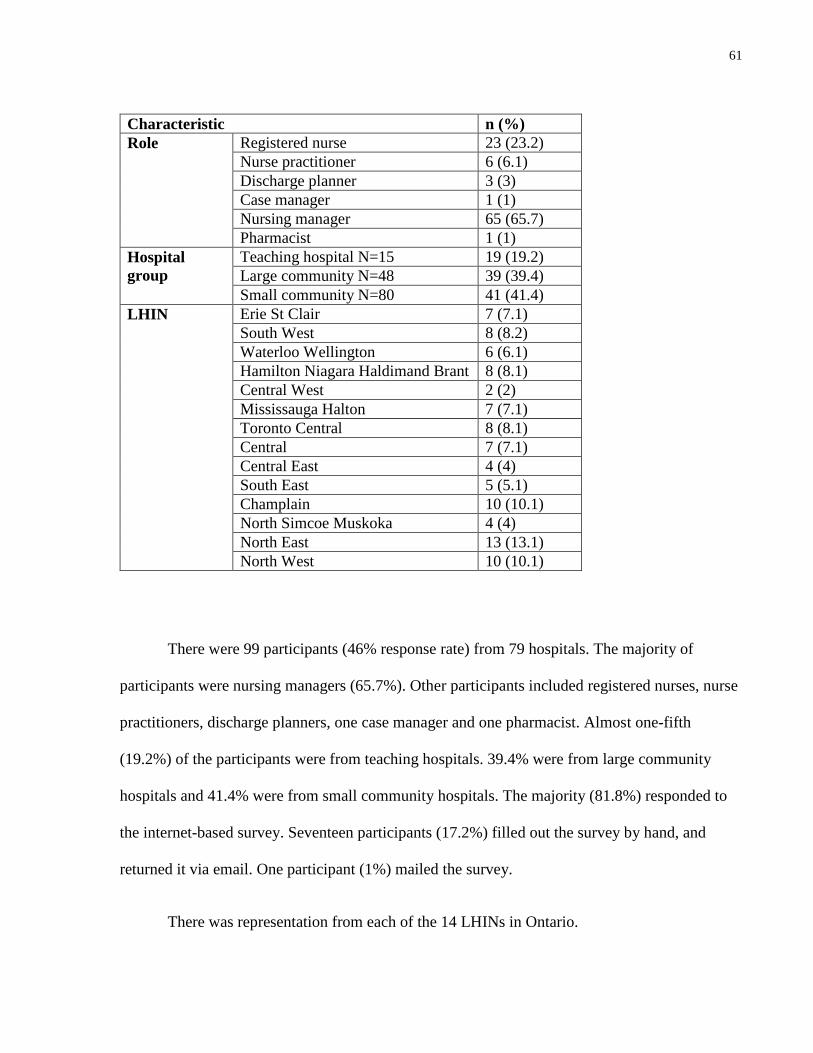
61
Characteristic n (%)
Role Registered nurse 23 (23.2)
Nurse practitioner 6 (6.1)
Discharge planner 3 (3)
Case manager 1 (1)
Nursing manager 65 (65.7)
Pharmacist 1 (1)
Hospital
group
Teaching hospital N=15 19 (19.2)
Large community N=48 39 (39.4)
Small community N=80 41 (41.4)
LHIN Erie St Clair 7 (7.1)
South West 8 (8.2)
Waterloo Wellington 6 (6.1)
Hamilton Niagara Haldimand Brant 8 (8.1)
Central West 2 (2)
Mississauga Halton 7 (7.1)
Toronto Central 8 (8.1)
Central 7 (7.1)
Central East 4 (4)
South East 5 (5.1)
Champlain 10 (10.1)
North Simcoe Muskoka 4 (4)
North East 13 (13.1)
North West 10 (10.1)
There were 99 participants (46% response rate) from 79 hospitals. The majority of
participants were nursing managers (65.7%). Other participants included registered nurses, nurse
practitioners, discharge planners, one case manager and one pharmacist. Almost one-fifth
(19.2%) of the participants were from teaching hospitals. 39.4% were from large community
hospitals and 41.4% were from small community hospitals. The majority (81.8%) responded to
the internet-based survey. Seventeen participants (17.2%) filled out the survey by hand, and
returned it via email. One participant (1%) mailed the survey.
There was representation from each of the 14 LHINs in Ontario.
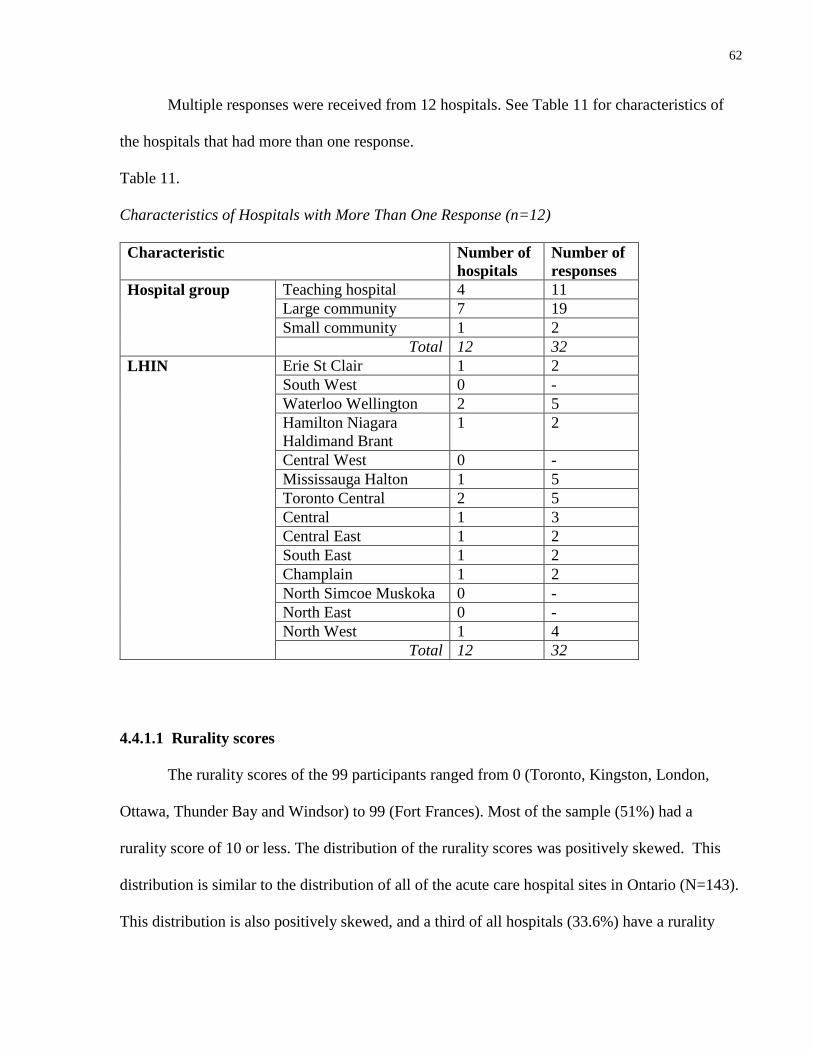
62
Multiple responses were received from 12 hospitals. See Table 11 for characteristics of
the hospitals that had more than one response.
Table 11.
Characteristics of Hospitals with More Than One Response (n=12)
Characteristic Number of
hospitals
Number of
responses
Hospital group Teaching hospital 4 11
Large community 7 19
Small community 1 2
Total 12 32
LHIN Erie St Clair 1 2
South West 0 -
Waterloo Wellington 2 5
Hamilton Niagara
Haldimand Brant
1 2
Central West 0 -
Mississauga Halton 1 5
Toronto Central 2 5
Central 1 3
Central East 1 2
South East 1 2
Champlain 1 2
North Simcoe Muskoka 0 -
North East 0 -
North West 1 4
Total 12 32
4.4.1.1 Rurality scores
The rurality scores of the 99 participants ranged from 0 (Toronto, Kingston, London,
Ottawa, Thunder Bay and Windsor) to 99 (Fort Frances). Most of the sample (51%) had a
rurality score of 10 or less. The distribution of the rurality scores was positively skewed. This
distribution is similar to the distribution of all of the acute care hospital sites in Ontario (N=143).
This distribution is also positively skewed, and a third of all hospitals (33.6%) have a rurality

63
score of 10 or less. See Appendix Q for the distribution of the rurality scores of the sample, and
for the distribution of the rurality scores of all adult, acute care hospitals in Ontario.
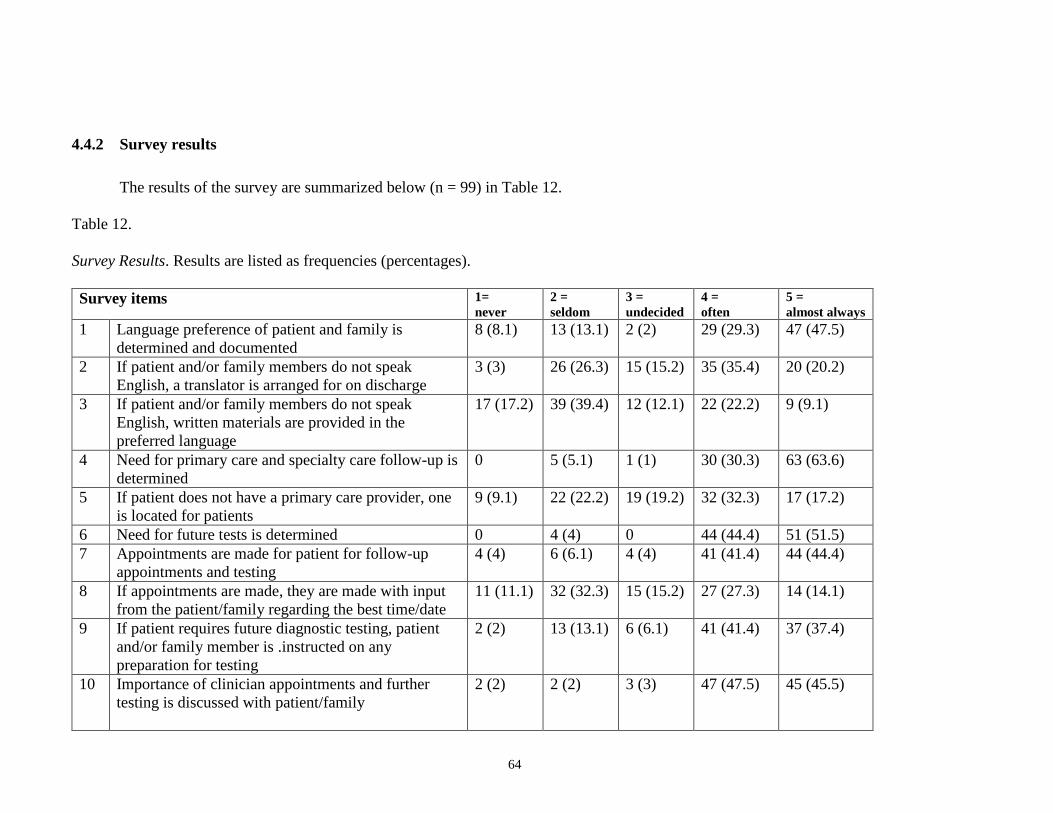
64
4.4.2 Survey results
The results of the survey are summarized below (n = 99) in Table 12.
Table 12.
Survey Results. Results are listed as frequencies (percentages).
Survey items 1=
never
2 =
seldom
3 =
undecided
4 =
often
5 =
almost always
1 Language preference of patient and family is
determined and documented
8 (8.1) 13 (13.1) 2 (2) 29 (29.3) 47 (47.5)
2 If patient and/or family members do not speak
English, a translator is arranged for on discharge
3 (3) 26 (26.3) 15 (15.2) 35 (35.4) 20 (20.2)
3 If patient and/or family members do not speak
English, written materials are provided in the
preferred language
17 (17.2) 39 (39.4) 12 (12.1) 22 (22.2) 9 (9.1)
4 Need for primary care and specialty care follow-up is
determined
0 5 (5.1) 1 (1) 30 (30.3) 63 (63.6)
5 If patient does not have a primary care provider, one
is located for patients
9 (9.1) 22 (22.2) 19 (19.2) 32 (32.3) 17 (17.2)
6 Need for future tests is determined 0 4 (4) 0 44 (44.4) 51 (51.5)
7 Appointments are made for patient for follow-up
appointments and testing
4 (4) 6 (6.1) 4 (4) 41 (41.4) 44 (44.4)
8 If appointments are made, they are made with input
from the patient/family regarding the best time/date
11 (11.1) 32 (32.3) 15 (15.2) 27 (27.3) 14 (14.1)
9 If patient requires future diagnostic testing, patient
and/or family member is .instructed on any
preparation for testing
2 (2) 13 (13.1) 6 (6.1) 41 (41.4) 37 (37.4)
10 Importance of clinician appointments and further
testing is discussed with patient/family
2 (2) 2 (2) 3 (3) 47 (47.5) 45 (45.5)
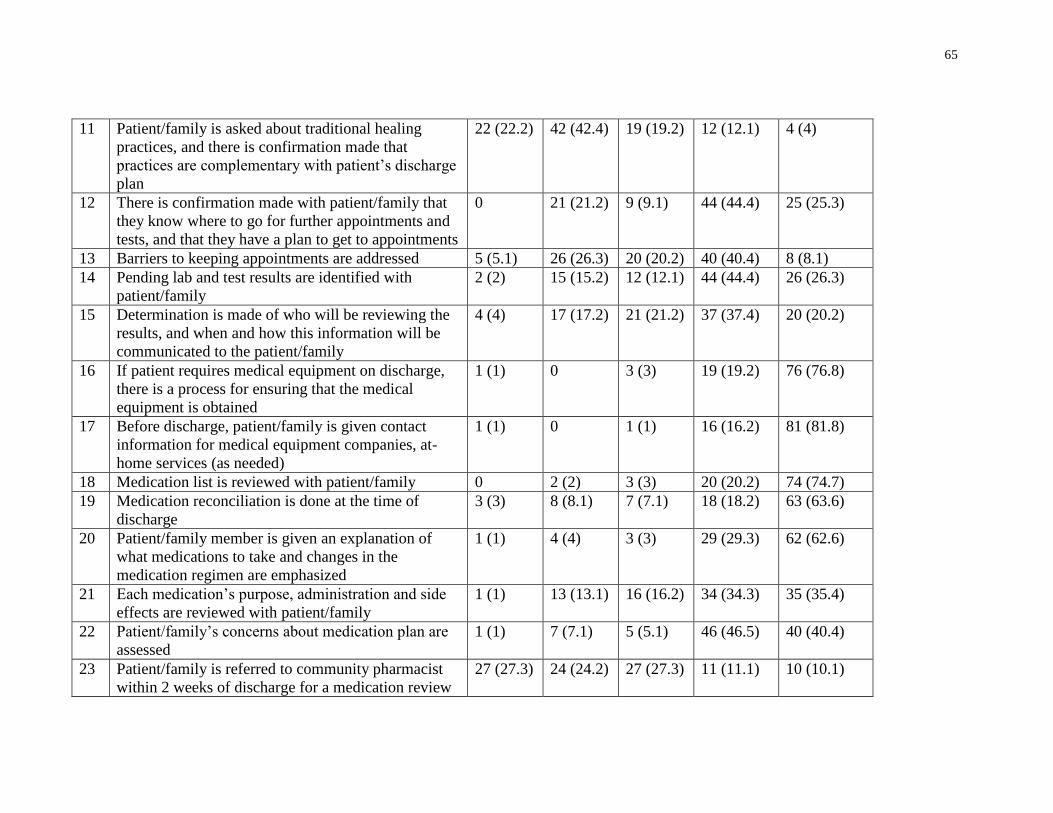
65
11 Patient/family is asked about traditional healing
practices, and there is confirmation made that
practices are complementary with patient’s discharge
plan
22 (22.2) 42 (42.4) 19 (19.2) 12 (12.1) 4 (4)
12 There is confirmation made with patient/family that
they know where to go for further appointments and
tests, and that they have a plan to get to appointments
0 21 (21.2) 9 (9.1) 44 (44.4) 25 (25.3)
13 Barriers to keeping appointments are addressed 5 (5.1) 26 (26.3) 20 (20.2) 40 (40.4) 8 (8.1)
14 Pending lab and test results are identified with
patient/family
2 (2) 15 (15.2) 12 (12.1) 44 (44.4) 26 (26.3)
15 Determination is made of who will be reviewing the
results, and when and how this information will be
communicated to the patient/family
4 (4) 17 (17.2) 21 (21.2) 37 (37.4) 20 (20.2)
16 If patient requires medical equipment on discharge,
there is a process for ensuring that the medical
equipment is obtained
1 (1) 0 3 (3) 19 (19.2) 76 (76.8)
17 Before discharge, patient/family is given contact
information for medical equipment companies, at-
home services (as needed)
1 (1) 0 1 (1) 16 (16.2) 81 (81.8)
18 Medication list is reviewed with patient/family 0 2 (2) 3 (3) 20 (20.2) 74 (74.7)
19 Medication reconciliation is done at the time of
discharge
3 (3) 8 (8.1) 7 (7.1) 18 (18.2) 63 (63.6)
20 Patient/family member is given an explanation of
what medications to take and changes in the
medication regimen are emphasized
1 (1) 4 (4) 3 (3) 29 (29.3) 62 (62.6)
21 Each medication’s purpose, administration and side
effects are reviewed with patient/family
1 (1) 13 (13.1) 16 (16.2) 34 (34.3) 35 (35.4)
22 Patient/family’s concerns about medication plan are
assessed
1 (1) 7 (7.1) 5 (5.1) 46 (46.5) 40 (40.4)
23 Patient/family is referred to community pharmacist
within 2 weeks of discharge for a medication review
27 (27.3) 24 (24.2) 27 (27.3) 11 (11.1) 10 (10.1)
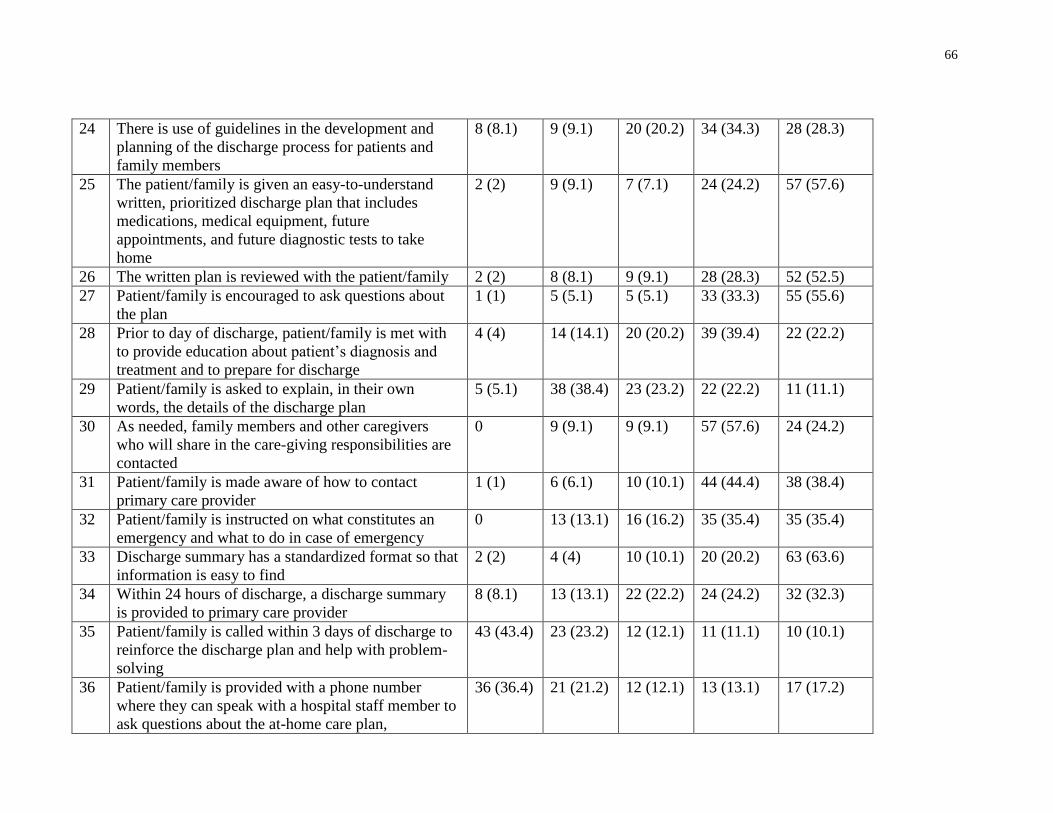
66
24 There is use of guidelines in the development and
planning of the discharge process for patients and
family members
8 (8.1) 9 (9.1) 20 (20.2) 34 (34.3) 28 (28.3)
25 The patient/family is given an easy-to-understand
written, prioritized discharge plan that includes
medications, medical equipment, future
appointments, and future diagnostic tests to take
home
2 (2) 9 (9.1) 7 (7.1) 24 (24.2) 57 (57.6)
26 The written plan is reviewed with the patient/family 2 (2) 8 (8.1) 9 (9.1) 28 (28.3) 52 (52.5)
27 Patient/family is encouraged to ask questions about
the plan
1 (1) 5 (5.1) 5 (5.1) 33 (33.3) 55 (55.6)
28 Prior to day of discharge, patient/family is met with
to provide education about patient’s diagnosis and
treatment and to prepare for discharge
4 (4) 14 (14.1) 20 (20.2) 39 (39.4) 22 (22.2)
29 Patient/family is asked to explain, in their own
words, the details of the discharge plan
5 (5.1) 38 (38.4) 23 (23.2) 22 (22.2) 11 (11.1)
30 As needed, family members and other caregivers
who will share in the care-giving responsibilities are
contacted
0 9 (9.1) 9 (9.1) 57 (57.6) 24 (24.2)
31 Patient/family is made aware of how to contact
primary care provider
1 (1) 6 (6.1) 10 (10.1) 44 (44.4) 38 (38.4)
32 Patient/family is instructed on what constitutes an
emergency and what to do in case of emergency
0 13 (13.1) 16 (16.2) 35 (35.4) 35 (35.4)
33 Discharge summary has a standardized format so that
information is easy to find
2 (2) 4 (4) 10 (10.1) 20 (20.2) 63 (63.6)
34 Within 24 hours of discharge, a discharge summary
is provided to primary care provider
8 (8.1) 13 (13.1) 22 (22.2) 24 (24.2) 32 (32.3)
35 Patient/family is called within 3 days of discharge to
reinforce the discharge plan and help with problem-
solving
43 (43.4) 23 (23.2) 12 (12.1) 11 (11.1) 10 (10.1)
36 Patient/family is provided with a phone number
where they can speak with a hospital staff member to
ask questions about the at-home care plan,
36 (36.4) 21 (21.2) 12 (12.1) 13 (13.1) 17 (17.2)
67
hospitalization, and follow-up plan in order to help
patients transition from hospital care to outpatient
care setting
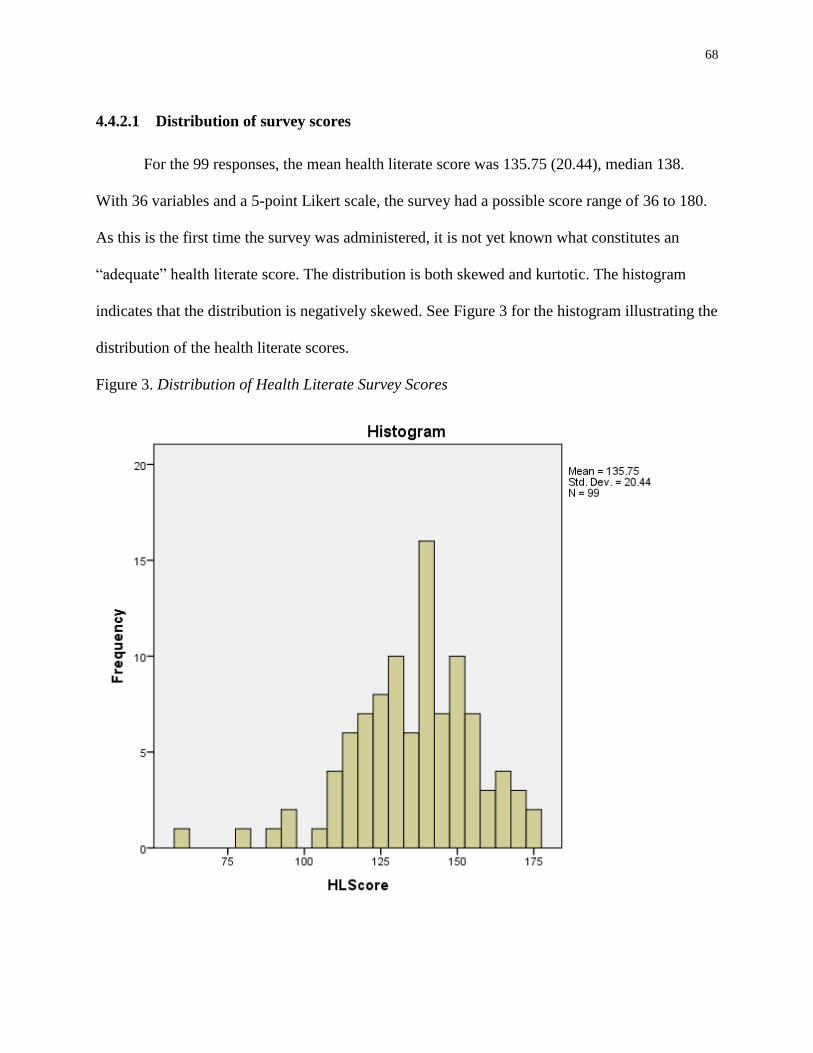
68
4.4.2.1 Distribution of survey scores
For the 99 responses, the mean health literate score was 135.75 (20.44), median 138.
With 36 variables and a 5-point Likert scale, the survey had a possible score range of 36 to 180.
As this is the first time the survey was administered, it is not yet known what constitutes an
“adequate” health literate score. The distribution is both skewed and kurtotic. The histogram
indicates that the distribution is negatively skewed. See Figure 3 for the histogram illustrating the
distribution of the health literate scores.
Figure 3. Distribution of Health Literate Survey Scores
69
The distributions of each of the 36 items of the survey were examined by reviewing the
tests for skewness and kurtosis, the Kolmogorov-Smirnov statistics, the histogram and the Q-Q
plots. Only 4 items (items 13, 15, 23 and 29) had normal distributions according to the tests for
skewness and kurtosis. However, the Kolmogorov-Smirnov statistics for each of the items
indicated that they all had non-normal distributions. The review of the histograms and the Q-Q
plots also indicated that each of the distributions, items 13, 15 23 and 29, had non-normal
distributions. See Appendix R for reports of the descriptives, and Appendix S for the tests of
normality, for the survey items.
4.4.2.2 Correlations between survey items
Correlations between items were checked by using Spearman’s rho. See Appendix T for a
data dictionary for the table of correlations, and see Appendix U for the table of correlations.
There were a number of correlations below 0.3, particularly for items 1, 2, 3, 5, 6, 17, 18, 19, 23,
25, 30, 33, 34, 35 and 36, although not all of these low correlations were significant. A large
number of low correlations may indicate that the items are measuring different aspects of health
literate discharge practices (Field, 2013).
The highest correlation was .844 (p < .001), between items 25 and 26:
Item 25. The patient/family is given an easy-to-understand written, prioritized discharge plan that
includes medications, medical equipment, future appointments, and future diagnostic tests to take
home
Item 26. The written plan is reviewed with the patient/family
Although this correlation is high, Field (2013) states that correlations above .9 indicate
multicollinearity. Bartlett’s test of sphericity was significant (p < .001), indicating sufficient
70
correlation between the variables to proceed with analysis. Factor analysis is based on
correlations between items, and if there is a lack of correlation, factor analysis should be
reconsidered. Bartlett’s test indicates that the levels of correlations between the survey items are
adequate for factor analysis to proceed (Field, 2013).
4.4.3 Exploratory factor analysis
An exploratory factor analysis of the 36 items of the survey was performed on the data
from the 99 participants, using principal axis factor analysis for the extraction, and with direct
oblimin rotation. The Kaiser-Meyer-Olkin measure of sampling adequacy was .84, which is
above the acceptable level of .5. This indicates that the data were acceptable for exploratory
factor analysis (Field, 2013). As alluded to above, Bartlett’s test of sphericity χ2 (630) = 2165.26,
p < .001 which indicated that there was sufficient correlation between the variables to carry out
the analysis. An initial analysis was completed to obtain eigenvalues for each factor. Kaiser’s
criterion advises that those factors with an eigenvalue of greater than 1 should be kept (Field,
2013).
4.4.3.1 Nine factor solution
Nine factors had eigenvalues greater than 1.00, accounting for 61.05% of the total
variance. A factor correlation matrix confirmed that the items were correlated (see Appendix V).
The presence of 9 factors was confirmed with the scree plot (see Appendix W).
See Appendix X for the factor loadings after rotation, with the communalities.
71
The results of the communalities indicate that items 1, 2, 3, 5, 11, 23, 24 and 30 have a
communality value of less than .50. This indicates that they are not substantially captured by the
factor structure and could be possible candidates for removal from the analysis (Meyers et al.,
2013). In addition, all of the items contained one, or at the most two, factor loadings greater than
.3, except for item 11. Item 11, which involves asking the patient and family about traditional
healing practices, did not have any factor loadings greater than .245 and the communality was
also slightly low at .44. As this is the initial study of a new survey, and data reduction was not a
goal, no items were removed (Hinkin, 1998). The construct and content validity of the items was
established in the development of Project RED (Anthony et al., 2005). The Delphi panel
provided additional evidence for the construct and content validity of the items (see Study 1).
Furthermore, the reliability of the survey items is discussed in a following section.
Appendix Y shows the items re-ordered, so that it is clear which items load on each of the
factors. The nine factors are: 1) medication review; 2) use of a written plan with the
patient/family; 3) co-ordination of services; 4) preparation for follow-up appointments and tests;
5) use of a discharge summary; 6) primary and specialty care follow-up; 7) patient/family
education and telephone reinforcement; 8) test results and emergencies, and 9) language
assistance and referral to community pharmacist. Not surprisingly, these factors are consistent
with the 12 components of Project RED.
The survey items that load to each of these factors will be further described in the next
section.
4.4.3.1.1 Reliability testing
72
Reliability testing was first done with all 36 survey items. Although a high level of
reliability was found, with a Cronbach’s 𝛼 = .93, it is important to note that the value of Cronbach’s
𝛼 increases with the number of survey items (Cortina, 1993).
As described, the survey has 9 factors or sub-scales. It is recommended that reliability
testing should be applied separately to each of the subscales (Cronbach, 1951). As stated in the
methods section, a reliability level of at least .7 is regarded as acceptable (Cortina, 1993; Field,
2009). As noted in the following table, each of the factors has an acceptable level of
measurement except “use of a discharge summary” and “language assistance and referral to
community pharmacist.” “Use of a discharge summary” has a level of .68, which is very close to
acceptable. The level for “language assistance and referral to community pharmacist” is below
the level of acceptability at .59. Field (2013) points out that in the early stages of questionnaire
development, a level greater than .5 is acceptable. In addition, Hull & Nie (1981) and Nunnally
(1978) point out that an alpha level of less than .7 is acceptable with new scales (Hull and Nie,
1981; Nunnally, 1978).
The low level of reliability for this factor is perhaps not surprising as the four items of
this sub-scale had low communalities. In addition, the referral to a community pharmacist is not
a natural fit with language assistance.
Table 13 lists each factor, with the survey items, their communalities, and the reliability
testing for each factor:
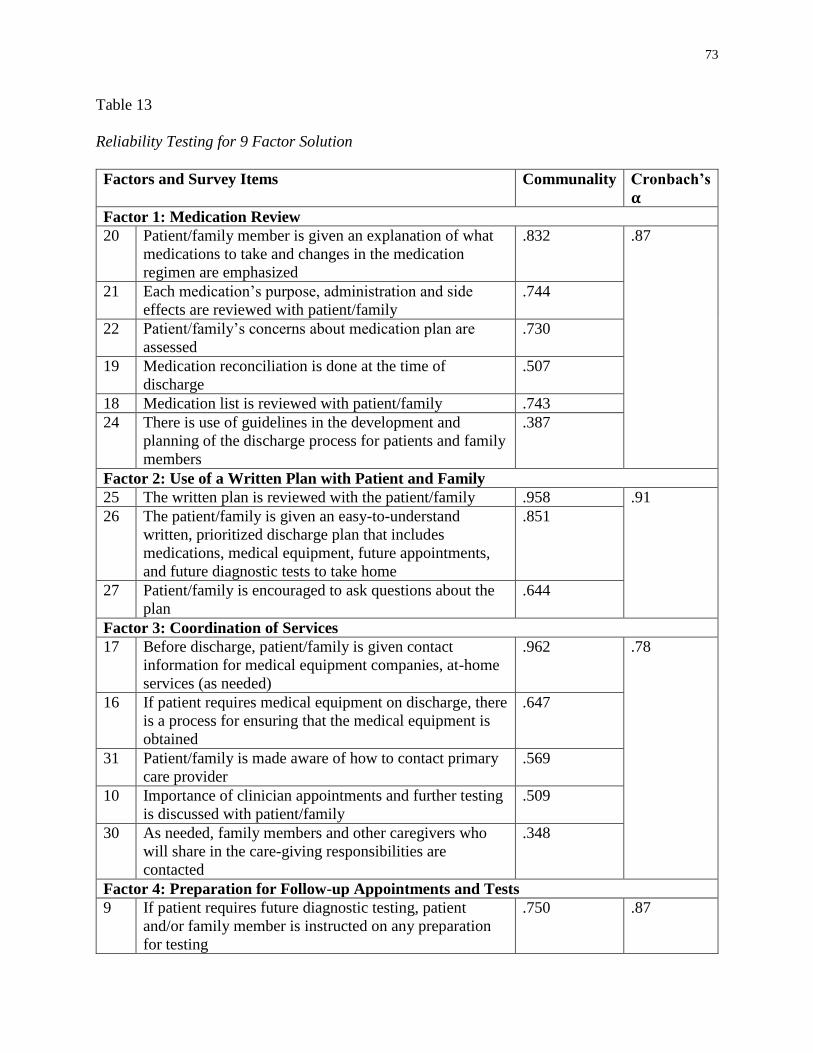
73
Table 13
Reliability Testing for 9 Factor Solution
Factors and Survey Items Communality Cronbach’s
𝛂 Factor 1: Medication Review
20 Patient/family member is given an explanation of what
medications to take and changes in the medication
regimen are emphasized
.832 .87
21 Each medication’s purpose, administration and side
effects are reviewed with patient/family
.744
22 Patient/family’s concerns about medication plan are
assessed
.730
19 Medication reconciliation is done at the time of
discharge
.507
18 Medication list is reviewed with patient/family .743
24 There is use of guidelines in the development and
planning of the discharge process for patients and family
members
.387
Factor 2: Use of a Written Plan with Patient and Family
25 The written plan is reviewed with the patient/family .958 .91
26 The patient/family is given an easy-to-understand
written, prioritized discharge plan that includes
medications, medical equipment, future appointments,
and future diagnostic tests to take home
.851
27 Patient/family is encouraged to ask questions about the
plan
.644
Factor 3: Coordination of Services
17 Before discharge, patient/family is given contact
information for medical equipment companies, at-home
services (as needed)
.962 .78
16 If patient requires medical equipment on discharge, there
is a process for ensuring that the medical equipment is
obtained
.647
31 Patient/family is made aware of how to contact primary
care provider
.569
10 Importance of clinician appointments and further testing
is discussed with patient/family
.509
30 As needed, family members and other caregivers who
will share in the care-giving responsibilities are
contacted
.348
Factor 4: Preparation for Follow-up Appointments and Tests
9 If patient requires future diagnostic testing, patient
and/or family member is instructed on any preparation
for testing
.750 .87
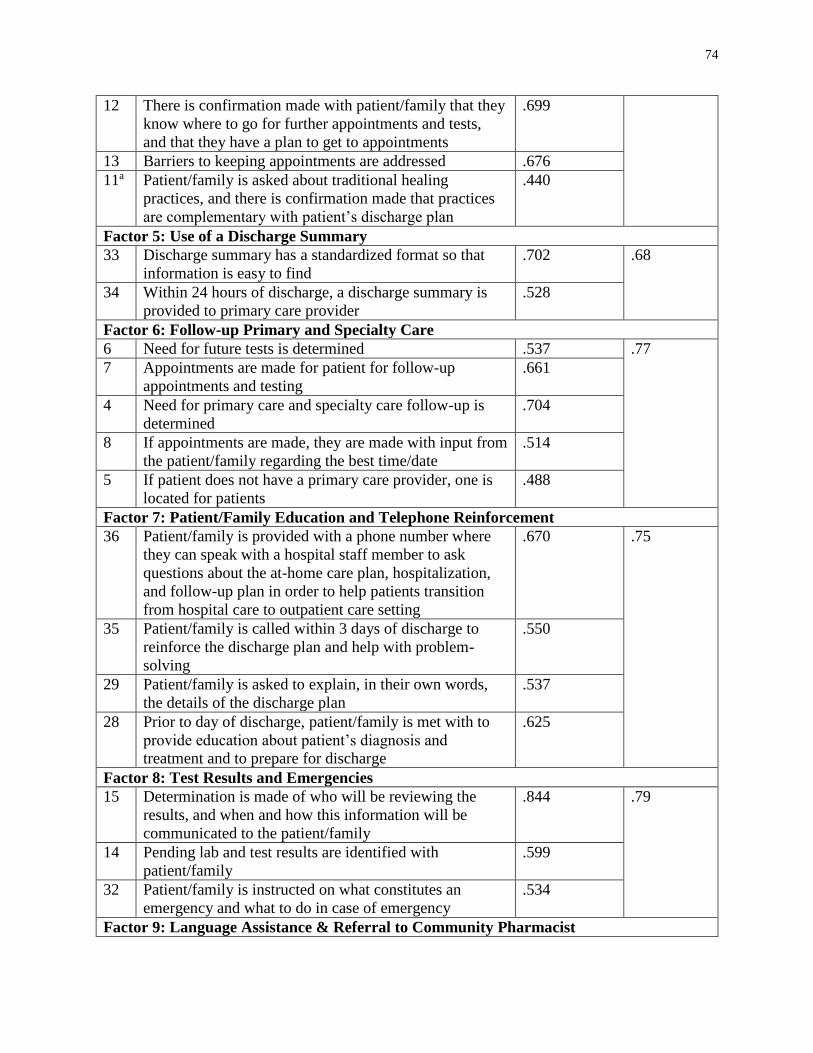
74
12 There is confirmation made with patient/family that they
know where to go for further appointments and tests,
and that they have a plan to get to appointments
.699
13 Barriers to keeping appointments are addressed .676
11a Patient/family is asked about traditional healing
practices, and there is confirmation made that practices
are complementary with patient’s discharge plan
.440
Factor 5: Use of a Discharge Summary
33 Discharge summary has a standardized format so that
information is easy to find
.702 .68
34 Within 24 hours of discharge, a discharge summary is
provided to primary care provider
.528
Factor 6: Follow-up Primary and Specialty Care
6 Need for future tests is determined .537 .77
7 Appointments are made for patient for follow-up
appointments and testing
.661
4 Need for primary care and specialty care follow-up is
determined
.704
8 If appointments are made, they are made with input from
the patient/family regarding the best time/date
.514
5 If patient does not have a primary care provider, one is
located for patients
.488
Factor 7: Patient/Family Education and Telephone Reinforcement
36 Patient/family is provided with a phone number where
they can speak with a hospital staff member to ask
questions about the at-home care plan, hospitalization,
and follow-up plan in order to help patients transition
from hospital care to outpatient care setting
.670 .75
35 Patient/family is called within 3 days of discharge to
reinforce the discharge plan and help with problem-
solving
.550
29 Patient/family is asked to explain, in their own words,
the details of the discharge plan
.537
28 Prior to day of discharge, patient/family is met with to
provide education about patient’s diagnosis and
treatment and to prepare for discharge
.625
Factor 8: Test Results and Emergencies
15 Determination is made of who will be reviewing the
results, and when and how this information will be
communicated to the patient/family
.844 .79
14 Pending lab and test results are identified with
patient/family
.599
32 Patient/family is instructed on what constitutes an
emergency and what to do in case of emergency
.534
Factor 9: Language Assistance & Referral to Community Pharmacist
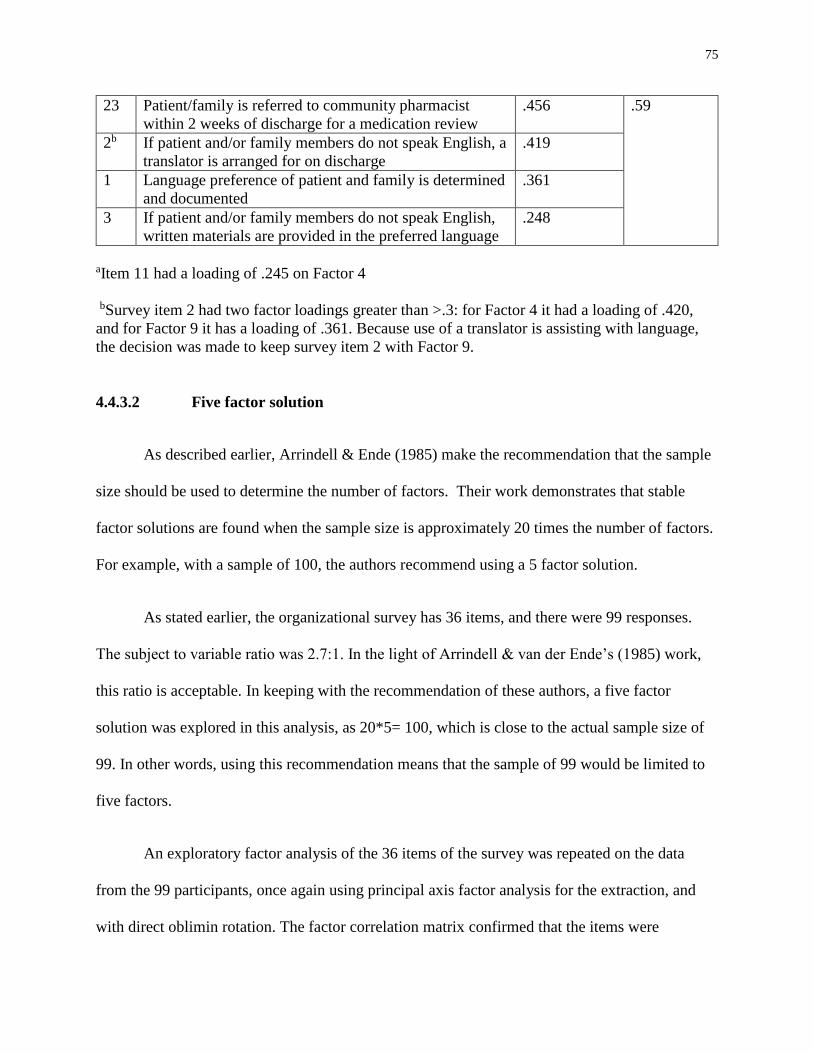
75
23 Patient/family is referred to community pharmacist
within 2 weeks of discharge for a medication review
.456 .59
2b If patient and/or family members do not speak English, a
translator is arranged for on discharge
.419
1 Language preference of patient and family is determined
and documented
.361
3 If patient and/or family members do not speak English,
written materials are provided in the preferred language
.248
aItem 11 had a loading of .245 on Factor 4
bSurvey item 2 had two factor loadings greater than >.3: for Factor 4 it had a loading of .420,
and for Factor 9 it has a loading of .361. Because use of a translator is assisting with language,
the decision was made to keep survey item 2 with Factor 9.
4.4.3.2 Five factor solution
As described earlier, Arrindell & Ende (1985) make the recommendation that the sample
size should be used to determine the number of factors. Their work demonstrates that stable
factor solutions are found when the sample size is approximately 20 times the number of factors.
For example, with a sample of 100, the authors recommend using a 5 factor solution.
As stated earlier, the organizational survey has 36 items, and there were 99 responses.
The subject to variable ratio was 2.7:1. In the light of Arrindell & van der Ende’s (1985) work,
this ratio is acceptable. In keeping with the recommendation of these authors, a five factor
solution was explored in this analysis, as 20*5= 100, which is close to the actual sample size of
99. In other words, using this recommendation means that the sample of 99 would be limited to
five factors.
An exploratory factor analysis of the 36 items of the survey was repeated on the data
from the 99 participants, once again using principal axis factor analysis for the extraction, and
with direct oblimin rotation. The factor correlation matrix confirmed that the items were
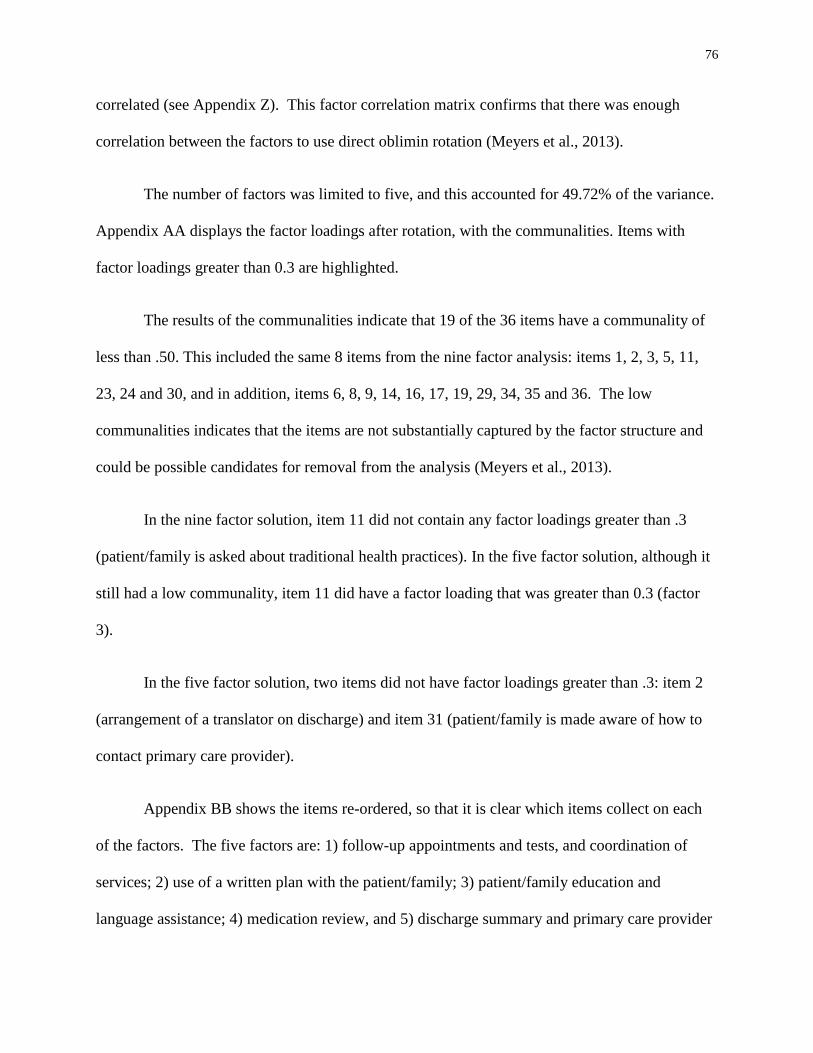
76
correlated (see Appendix Z). This factor correlation matrix confirms that there was enough
correlation between the factors to use direct oblimin rotation (Meyers et al., 2013).
The number of factors was limited to five, and this accounted for 49.72% of the variance.
Appendix AA displays the factor loadings after rotation, with the communalities. Items with
factor loadings greater than 0.3 are highlighted.
The results of the communalities indicate that 19 of the 36 items have a communality of
less than .50. This included the same 8 items from the nine factor analysis: items 1, 2, 3, 5, 11,
23, 24 and 30, and in addition, items 6, 8, 9, 14, 16, 17, 19, 29, 34, 35 and 36. The low
communalities indicates that the items are not substantially captured by the factor structure and
could be possible candidates for removal from the analysis (Meyers et al., 2013).
In the nine factor solution, item 11 did not contain any factor loadings greater than .3
(patient/family is asked about traditional health practices). In the five factor solution, although it
still had a low communality, item 11 did have a factor loading that was greater than 0.3 (factor
3).
In the five factor solution, two items did not have factor loadings greater than .3: item 2
(arrangement of a translator on discharge) and item 31 (patient/family is made aware of how to
contact primary care provider).
Appendix BB shows the items re-ordered, so that it is clear which items collect on each
of the factors. The five factors are: 1) follow-up appointments and tests, and coordination of
services; 2) use of a written plan with the patient/family; 3) patient/family education and
language assistance; 4) medication review, and 5) discharge summary and primary care provider
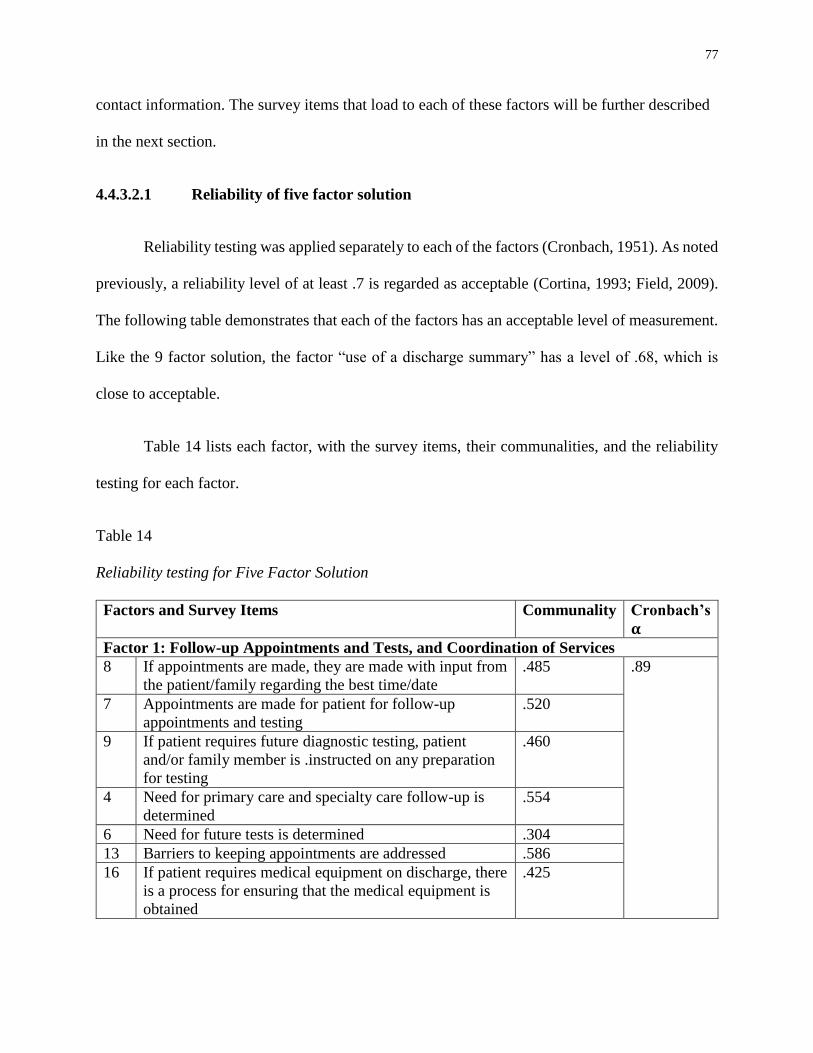
77
contact information. The survey items that load to each of these factors will be further described
in the next section.
4.4.3.2.1 Reliability of five factor solution
Reliability testing was applied separately to each of the factors (Cronbach, 1951). As noted
previously, a reliability level of at least .7 is regarded as acceptable (Cortina, 1993; Field, 2009).
The following table demonstrates that each of the factors has an acceptable level of measurement.
Like the 9 factor solution, the factor “use of a discharge summary” has a level of .68, which is
close to acceptable.
Table 14 lists each factor, with the survey items, their communalities, and the reliability
testing for each factor.
Table 14
Reliability testing for Five Factor Solution
Factors and Survey Items Communality Cronbach’s
𝛂
Factor 1: Follow-up Appointments and Tests, and Coordination of Services
8 If appointments are made, they are made with input from
the patient/family regarding the best time/date
.485 .89
7 Appointments are made for patient for follow-up
appointments and testing
.520
9 If patient requires future diagnostic testing, patient
and/or family member is .instructed on any preparation
for testing
.460
4 Need for primary care and specialty care follow-up is
determined
.554
6 Need for future tests is determined .304
13 Barriers to keeping appointments are addressed .586
16 If patient requires medical equipment on discharge, there
is a process for ensuring that the medical equipment is
obtained
.425
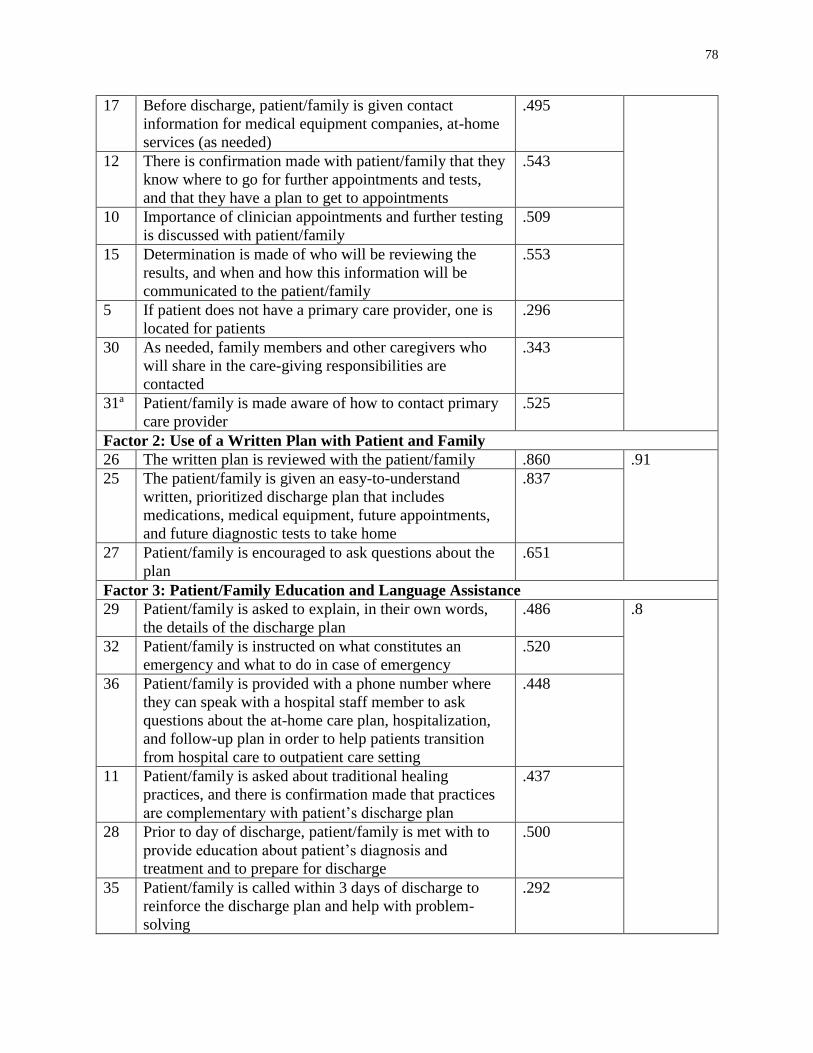
78
17 Before discharge, patient/family is given contact
information for medical equipment companies, at-home
services (as needed)
.495
12 There is confirmation made with patient/family that they
know where to go for further appointments and tests,
and that they have a plan to get to appointments
.543
10 Importance of clinician appointments and further testing
is discussed with patient/family
.509
15 Determination is made of who will be reviewing the
results, and when and how this information will be
communicated to the patient/family
.553
5 If patient does not have a primary care provider, one is
located for patients
.296
30 As needed, family members and other caregivers who
will share in the care-giving responsibilities are
contacted
.343
31a Patient/family is made aware of how to contact primary
care provider
.525
Factor 2: Use of a Written Plan with Patient and Family
26 The written plan is reviewed with the patient/family .860 .91
25 The patient/family is given an easy-to-understand
written, prioritized discharge plan that includes
medications, medical equipment, future appointments,
and future diagnostic tests to take home
.837
27 Patient/family is encouraged to ask questions about the
plan
.651
Factor 3: Patient/Family Education and Language Assistance
29 Patient/family is asked to explain, in their own words,
the details of the discharge plan
.486 .8
32 Patient/family is instructed on what constitutes an
emergency and what to do in case of emergency
.520
36 Patient/family is provided with a phone number where
they can speak with a hospital staff member to ask
questions about the at-home care plan, hospitalization,
and follow-up plan in order to help patients transition
from hospital care to outpatient care setting
.448
11 Patient/family is asked about traditional healing
practices, and there is confirmation made that practices
are complementary with patient’s discharge plan
.437
28 Prior to day of discharge, patient/family is met with to
provide education about patient’s diagnosis and
treatment and to prepare for discharge
.500
35 Patient/family is called within 3 days of discharge to
reinforce the discharge plan and help with problem-
solving
.292
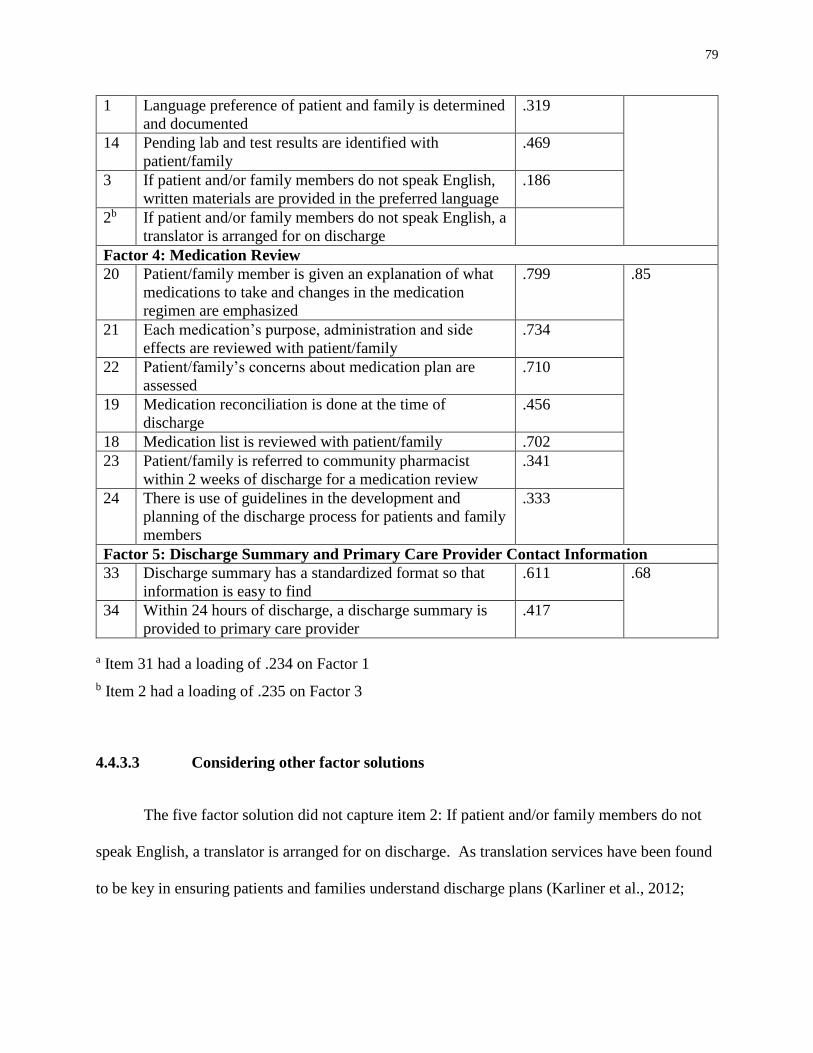
79
1 Language preference of patient and family is determined
and documented
.319
14 Pending lab and test results are identified with
patient/family
.469
3 If patient and/or family members do not speak English,
written materials are provided in the preferred language
.186
2b If patient and/or family members do not speak English, a
translator is arranged for on discharge
Factor 4: Medication Review
20 Patient/family member is given an explanation of what
medications to take and changes in the medication
regimen are emphasized
.799 .85
21 Each medication’s purpose, administration and side
effects are reviewed with patient/family
.734
22 Patient/family’s concerns about medication plan are
assessed
.710
19 Medication reconciliation is done at the time of
discharge
.456
18 Medication list is reviewed with patient/family .702
23 Patient/family is referred to community pharmacist
within 2 weeks of discharge for a medication review
.341
24 There is use of guidelines in the development and
planning of the discharge process for patients and family
members
.333
Factor 5: Discharge Summary and Primary Care Provider Contact Information
33 Discharge summary has a standardized format so that
information is easy to find
.611 .68
34 Within 24 hours of discharge, a discharge summary is
provided to primary care provider
.417
a Item 31 had a loading of .234 on Factor 1
b Item 2 had a loading of .235 on Factor 3
4.4.3.3 Considering other factor solutions
The five factor solution did not capture item 2: If patient and/or family members do not
speak English, a translator is arranged for on discharge. As translation services have been found
to be key in ensuring patients and families understand discharge plans (Karliner et al., 2012;
80
Lindholm et al., 2012), the factor analysis was repeated, to assess solutions with 6, 7 and 8
factors.
The best solution was found with the six factor solution. It was determined to be the best
of these possible solutions as it captured all of the survey items, except for item 31:
Patient/family is made aware of how to contact primary care provider. While intuitively, this
may seem to be an important point, there is a lack of empirical evidence on the relationship
between patients and families being aware of the contact information of their primary care
provider, and patient and hospital outcomes.
The 7 factor solution did not capture item 15: Determination is made of who will be
reviewing the results, and when and how this information will be communicated to the
patient/family. This survey item is important, as it is a quality and safety issue when abnormal
tests results are not assessed by health care providers (Ong et al., 2012; Roy et al., 2005). See
Appendix CC for the 7 factor solution.
The 8 factor solution did not capture item 11: Patient/family is asked about traditional
healing practices, and there is confirmation made that practices are complementary with patient’s
discharge plan. This survey item is important, as traditional healing practices need to be assessed
in case they interfere with patients’ discharge plans (Gardiner, Filippelli, Sadikova, White, &
Jack, 2015; Jack et al., 2013). See Appendix DD for the 8 factor solution.
4.4.3.4 Six factor solution
An exploratory factor analysis of the 36 items of the survey was repeated on the data
from the 99 participants, once again using principal axis factor analysis for the extraction, and
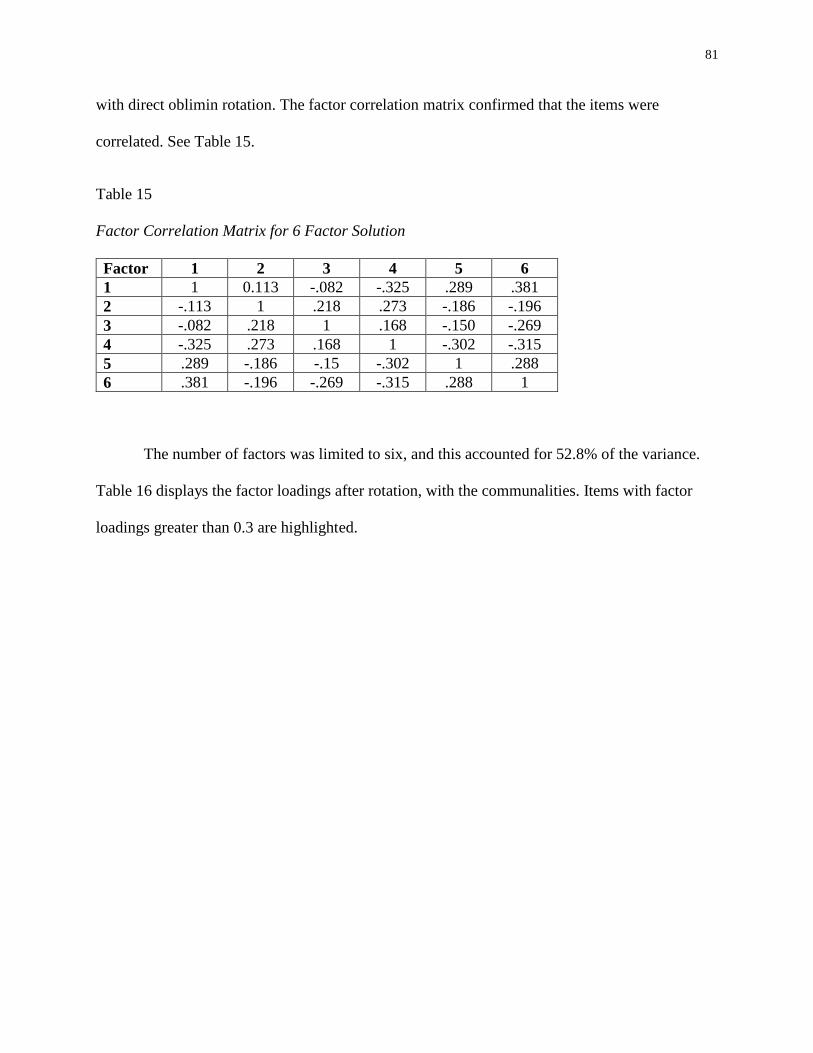
81
with direct oblimin rotation. The factor correlation matrix confirmed that the items were
correlated. See Table 15.
Table 15
Factor Correlation Matrix for 6 Factor Solution
Factor 1 2 3 4 5 6
1 1 0.113 -.082 -.325 .289 .381
2 -.113 1 .218 .273 -.186 -.196
3 -.082 .218 1 .168 -.150 -.269
4 -.325 .273 .168 1 -.302 -.315
5 .289 -.186 -.15 -.302 1 .288
6 .381 -.196 -.269 -.315 .288 1
The number of factors was limited to six, and this accounted for 52.8% of the variance.
Table 16 displays the factor loadings after rotation, with the communalities. Items with factor
loadings greater than 0.3 are highlighted.
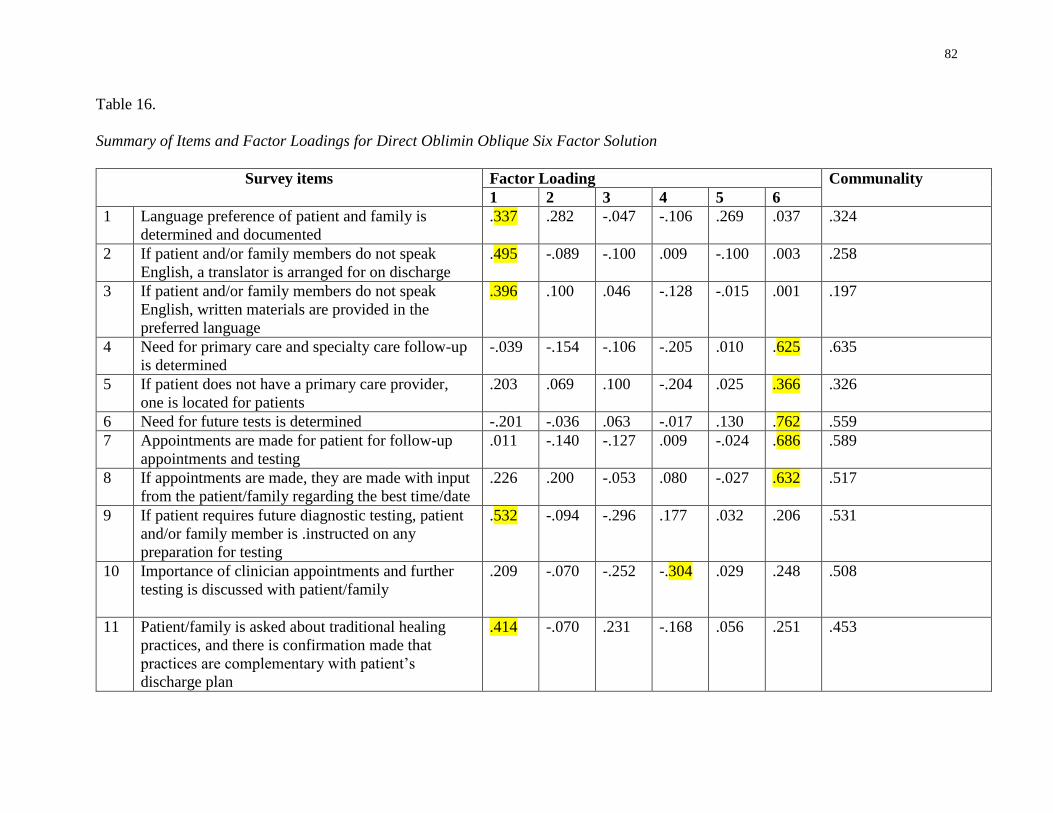
82
Table 16.
Summary of Items and Factor Loadings for Direct Oblimin Oblique Six Factor Solution
Survey items
Factor Loading Communality
1 2 3 4 5 6
1 Language preference of patient and family is
determined and documented
.337 .282 -.047 -.106 .269 .037 .324
2 If patient and/or family members do not speak
English, a translator is arranged for on discharge
.495 -.089 -.100 .009 -.100 .003 .258
3 If patient and/or family members do not speak
English, written materials are provided in the
preferred language
.396 .100 .046 -.128 -.015 .001 .197
4 Need for primary care and specialty care follow-up
is determined
-.039 -.154 -.106 -.205 .010 .625 .635
5 If patient does not have a primary care provider,
one is located for patients
.203 .069 .100 -.204 .025 .366 .326
6 Need for future tests is determined -.201 -.036 .063 -.017 .130 .762 .559
7 Appointments are made for patient for follow-up
appointments and testing
.011 -.140 -.127 .009 -.024 .686 .589
8 If appointments are made, they are made with input
from the patient/family regarding the best time/date
.226 .200 -.053 .080 -.027 .632 .517
9 If patient requires future diagnostic testing, patient
and/or family member is .instructed on any
preparation for testing
.532 -.094 -.296 .177 .032 .206 .531
10 Importance of clinician appointments and further
testing is discussed with patient/family
.209 -.070 -.252 -.304 .029 .248 .508
11 Patient/family is asked about traditional healing
practices, and there is confirmation made that
practices are complementary with patient’s
discharge plan
.414
-.070 .231 -.168 .056 .251 .453
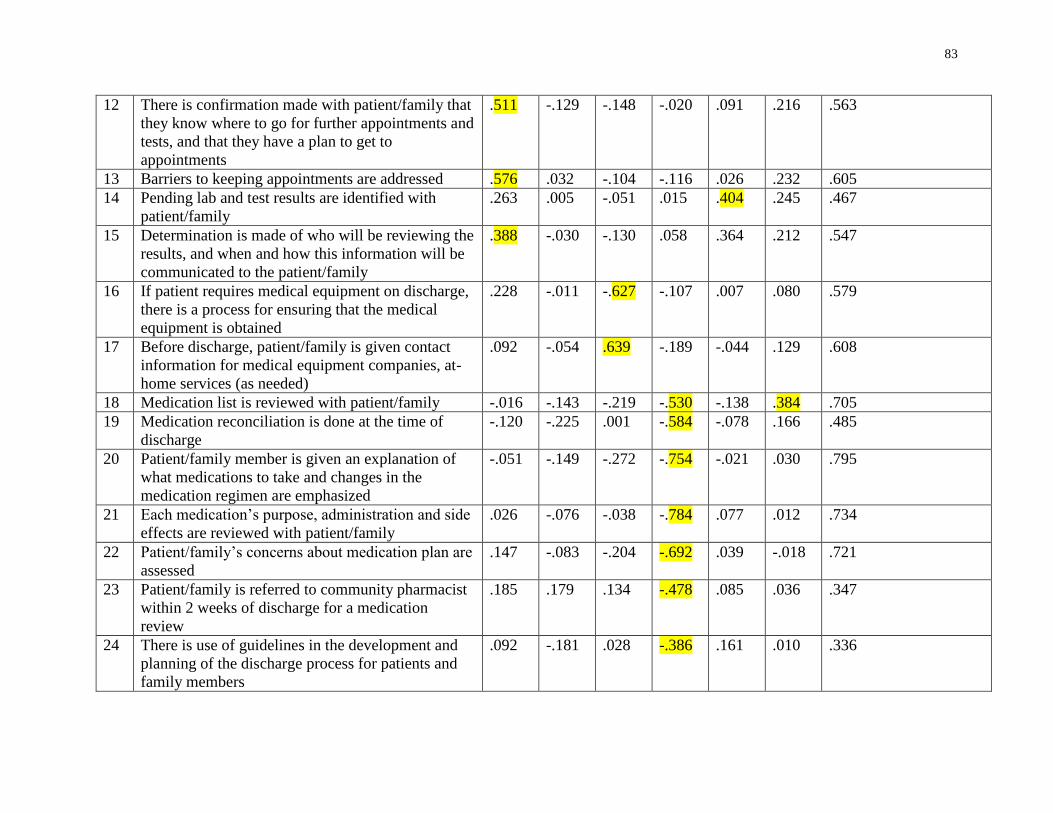
83
12 There is confirmation made with patient/family that
they know where to go for further appointments and
tests, and that they have a plan to get to
appointments
.511 -.129 -.148 -.020 .091 .216 .563
13 Barriers to keeping appointments are addressed .576 .032 -.104 -.116 .026 .232 .605
14 Pending lab and test results are identified with
patient/family
.263 .005 -.051 .015 .404 .245 .467
15 Determination is made of who will be reviewing the
results, and when and how this information will be
communicated to the patient/family
.388 -.030 -.130 .058 .364 .212 .547
16 If patient requires medical equipment on discharge,
there is a process for ensuring that the medical
equipment is obtained
.228 -.011 -.627 -.107 .007 .080 .579
17 Before discharge, patient/family is given contact
information for medical equipment companies, at-
home services (as needed)
.092 -.054 .639 -.189 -.044 .129 .608
18 Medication list is reviewed with patient/family -.016 -.143 -.219 -.530 -.138 .384 .705
19 Medication reconciliation is done at the time of
discharge
-.120 -.225 .001 -.584 -.078 .166 .485
20 Patient/family member is given an explanation of
what medications to take and changes in the
medication regimen are emphasized
-.051 -.149 -.272 -.754 -.021 .030 .795
21 Each medication’s purpose, administration and side
effects are reviewed with patient/family
.026 -.076 -.038 -.784 .077 .012 .734
22 Patient/family’s concerns about medication plan are
assessed
.147 -.083 -.204 -.692 .039 -.018 .721
23 Patient/family is referred to community pharmacist
within 2 weeks of discharge for a medication
review
.185 .179 .134 -.478 .085 .036 .347
24 There is use of guidelines in the development and
planning of the discharge process for patients and
family members
.092 -.181 .028 -.386 .161 .010 .336
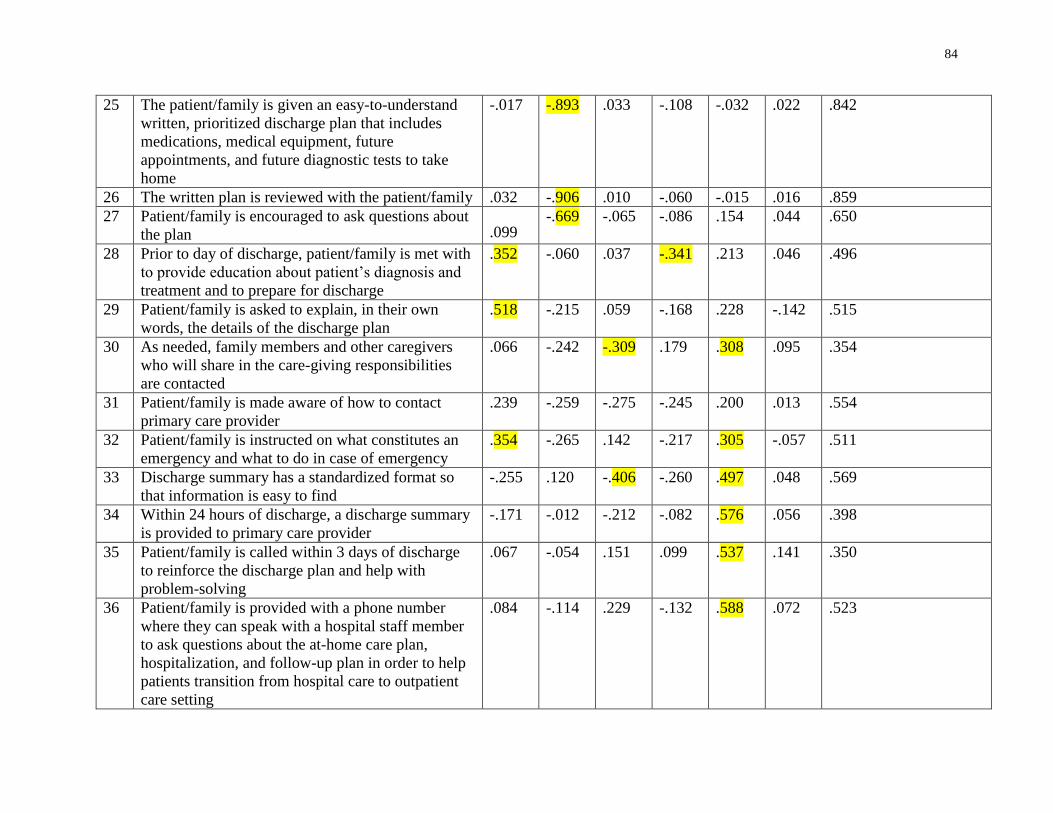
84
25 The patient/family is given an easy-to-understand
written, prioritized discharge plan that includes
medications, medical equipment, future
appointments, and future diagnostic tests to take
home
-.017 -.893 .033 -.108 -.032 .022 .842
26 The written plan is reviewed with the patient/family .032 -.906 .010 -.060 -.015 .016 .859
27 Patient/family is encouraged to ask questions about
the plan .099 -.669 -.065 -.086 .154 .044 .650
28 Prior to day of discharge, patient/family is met with
to provide education about patient’s diagnosis and
treatment and to prepare for discharge
.352 -.060 .037 -.341 .213 .046 .496
29 Patient/family is asked to explain, in their own
words, the details of the discharge plan
.518 -.215 .059 -.168 .228 -.142 .515
30 As needed, family members and other caregivers
who will share in the care-giving responsibilities
are contacted
.066 -.242 -.309 .179 .308 .095 .354
31 Patient/family is made aware of how to contact
primary care provider
.239 -.259 -.275 -.245 .200 .013 .554
32 Patient/family is instructed on what constitutes an
emergency and what to do in case of emergency
.354 -.265 .142 -.217 .305 -.057 .511
33 Discharge summary has a standardized format so
that information is easy to find
-.255 .120 -.406 -.260 .497 .048 .569
34 Within 24 hours of discharge, a discharge summary
is provided to primary care provider
-.171 -.012 -.212 -.082 .576 .056 .398
35 Patient/family is called within 3 days of discharge
to reinforce the discharge plan and help with
problem-solving
.067 -.054 .151 .099 .537 .141 .350
36 Patient/family is provided with a phone number
where they can speak with a hospital staff member
to ask questions about the at-home care plan,
hospitalization, and follow-up plan in order to help
patients transition from hospital care to outpatient
care setting
.084 -.114 .229 -.132 .588 .072 .523
85
The results of the communalities indicate that 12 of the 36 items have a communality of
less than .50. This is less than the 5 factor solution, which found that 19 of the 36 items had a
communality of less than .50.
The 12 items include the same 8 items that are included in the 9 factor and the 5 factor
solutions: 1, 2, 3, 5, 11, 23, 24 and 30. In addition, it included 4 items that were included in the 5
factor solution: 14, 19, 34, and 35. (Item 28, with a communality of .496 is not included, as this
is very close to .5). As stated earlier, when items have a low communality, it indicates that the
items are not substantially captured by the factor structure and could be possible candidates for
removal from the analysis (Meyers et al., 2013).
With respect to factor loadings, in the nine factor solution, item 11 did not contain any
factor loadings greater than .3 (patient/family is asked about traditional health practices). In the
five factor solution, although it still had a low communality, item 11 did include an acceptable
factor loading.
In the five factor solution, two items did not have factor loadings greater than .3: item 2
(arrangement of a translator on discharge) and item 31 (patient/family is made aware of how to
contact primary care provider).
Table 17 shows the items re-ordered, so that it is clear which items collect on each of the
factors.
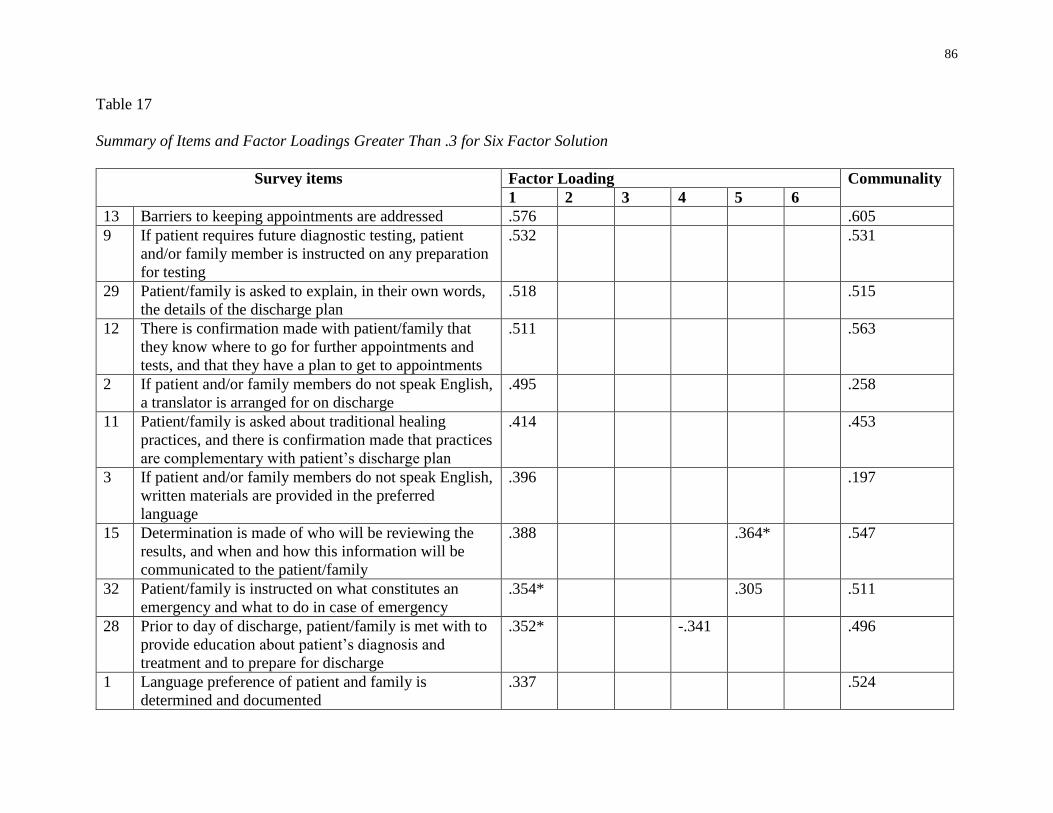
86
Table 17
Summary of Items and Factor Loadings Greater Than .3 for Six Factor Solution
Survey items Factor Loading Communality
1 2 3 4 5 6
13 Barriers to keeping appointments are addressed .576 .605
9 If patient requires future diagnostic testing, patient
and/or family member is instructed on any preparation
for testing
.532 .531
29 Patient/family is asked to explain, in their own words,
the details of the discharge plan
.518 .515
12 There is confirmation made with patient/family that
they know where to go for further appointments and
tests, and that they have a plan to get to appointments
.511 .563
2 If patient and/or family members do not speak English,
a translator is arranged for on discharge
.495 .258
11 Patient/family is asked about traditional healing
practices, and there is confirmation made that practices
are complementary with patient’s discharge plan
.414 .453
3 If patient and/or family members do not speak English,
written materials are provided in the preferred
language
.396 .197
15 Determination is made of who will be reviewing the
results, and when and how this information will be
communicated to the patient/family
.388 .364* .547
32 Patient/family is instructed on what constitutes an
emergency and what to do in case of emergency
.354* .305 .511
28 Prior to day of discharge, patient/family is met with to
provide education about patient’s diagnosis and
treatment and to prepare for discharge
.352* -.341 .496
1 Language preference of patient and family is
determined and documented
.337 .524
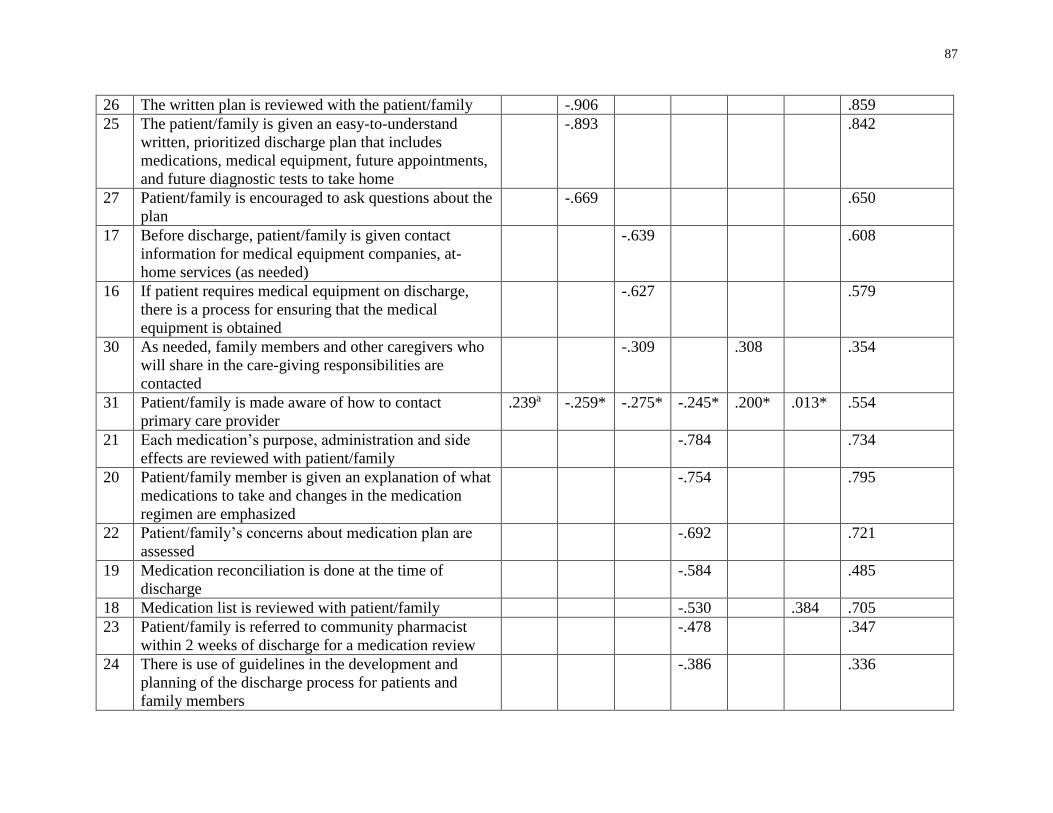
87
26 The written plan is reviewed with the patient/family -.906 .859
25 The patient/family is given an easy-to-understand
written, prioritized discharge plan that includes
medications, medical equipment, future appointments,
and future diagnostic tests to take home
-.893 .842
27 Patient/family is encouraged to ask questions about the
plan
-.669 .650
17 Before discharge, patient/family is given contact
information for medical equipment companies, at-
home services (as needed)
-.639 .608
16 If patient requires medical equipment on discharge,
there is a process for ensuring that the medical
equipment is obtained
-.627 .579
30 As needed, family members and other caregivers who
will share in the care-giving responsibilities are
contacted
-.309 .308 .354
31 Patient/family is made aware of how to contact
primary care provider
.239a -.259* -.275* -.245* .200* .013* .554
21 Each medication’s purpose, administration and side
effects are reviewed with patient/family
-.784 .734
20 Patient/family member is given an explanation of what
medications to take and changes in the medication
regimen are emphasized
-.754 .795
22 Patient/family’s concerns about medication plan are
assessed
-.692 .721
19 Medication reconciliation is done at the time of
discharge
-.584 .485
18 Medication list is reviewed with patient/family -.530 .384 .705
23 Patient/family is referred to community pharmacist
within 2 weeks of discharge for a medication review
-.478 .347
24 There is use of guidelines in the development and
planning of the discharge process for patients and
family members
-.386 .336
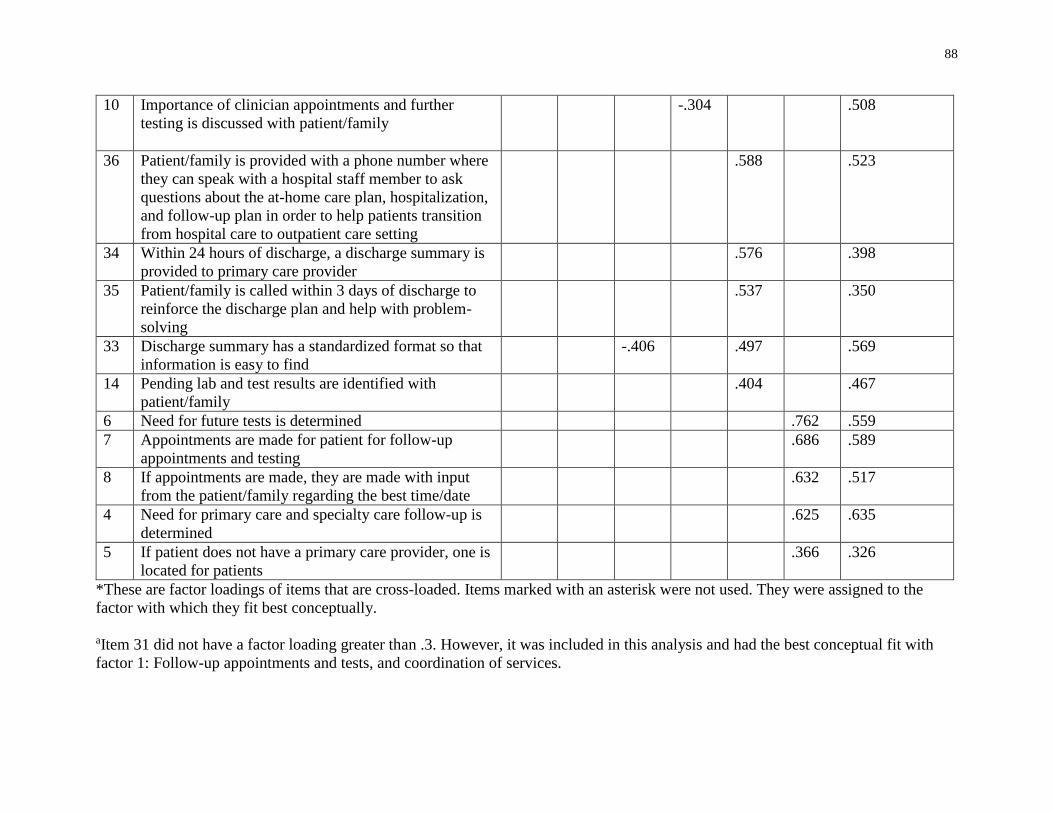
88
10 Importance of clinician appointments and further
testing is discussed with patient/family
-.304 .508
36 Patient/family is provided with a phone number where
they can speak with a hospital staff member to ask
questions about the at-home care plan, hospitalization,
and follow-up plan in order to help patients transition
from hospital care to outpatient care setting
.588 .523
34 Within 24 hours of discharge, a discharge summary is
provided to primary care provider
.576 .398
35 Patient/family is called within 3 days of discharge to
reinforce the discharge plan and help with problem-
solving
.537 .350
33 Discharge summary has a standardized format so that
information is easy to find
-.406 .497 .569
14 Pending lab and test results are identified with
patient/family
.404 .467
6 Need for future tests is determined .762 .559
7 Appointments are made for patient for follow-up
appointments and testing
.686 .589
8 If appointments are made, they are made with input
from the patient/family regarding the best time/date
.632 .517
4 Need for primary care and specialty care follow-up is
determined
.625 .635
5 If patient does not have a primary care provider, one is
located for patients
.366 .326
*These are factor loadings of items that are cross-loaded. Items marked with an asterisk were not used. They were assigned to the
factor with which they fit best conceptually.
aItem 31 did not have a factor loading greater than .3. However, it was included in this analysis and had the best conceptual fit with
factor 1: Follow-up appointments and tests, and coordination of services.
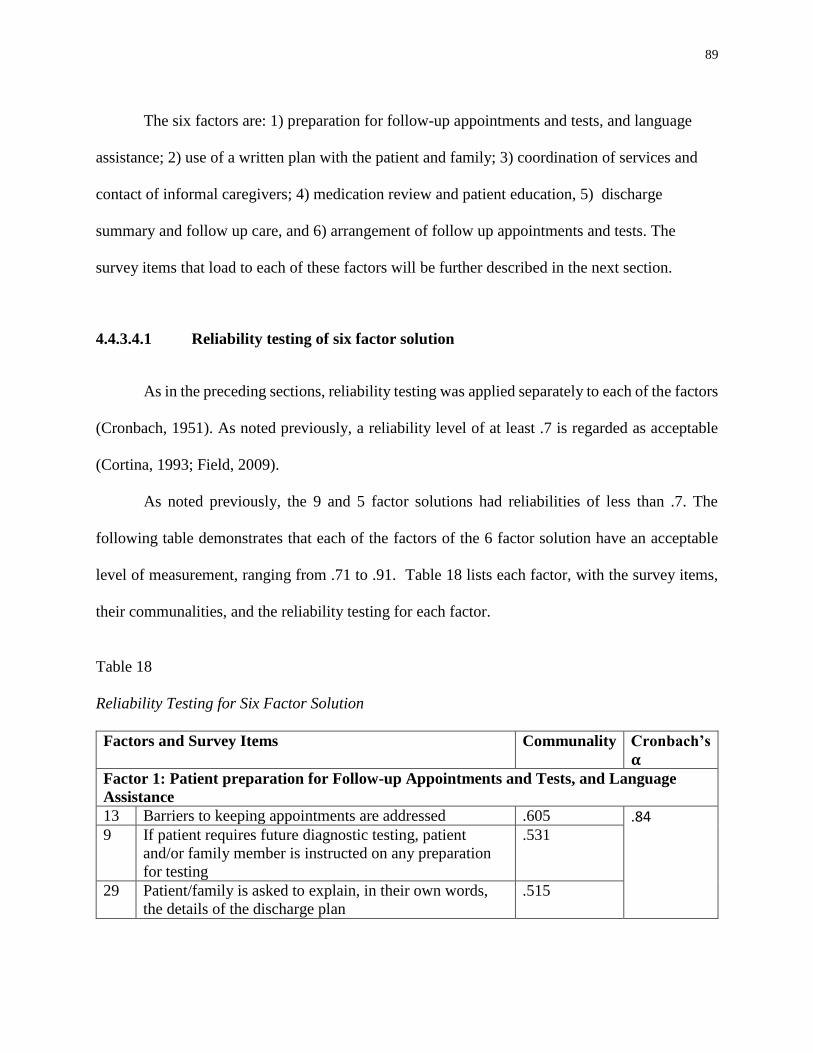
89
The six factors are: 1) preparation for follow-up appointments and tests, and language
assistance; 2) use of a written plan with the patient and family; 3) coordination of services and
contact of informal caregivers; 4) medication review and patient education, 5) discharge
summary and follow up care, and 6) arrangement of follow up appointments and tests. The
survey items that load to each of these factors will be further described in the next section.
4.4.3.4.1 Reliability testing of six factor solution
As in the preceding sections, reliability testing was applied separately to each of the factors
(Cronbach, 1951). As noted previously, a reliability level of at least .7 is regarded as acceptable
(Cortina, 1993; Field, 2009).
As noted previously, the 9 and 5 factor solutions had reliabilities of less than .7. The
following table demonstrates that each of the factors of the 6 factor solution have an acceptable
level of measurement, ranging from .71 to .91. Table 18 lists each factor, with the survey items,
their communalities, and the reliability testing for each factor.
Table 18
Reliability Testing for Six Factor Solution
Factors and Survey Items Communality Cronbach’s
𝛂
Factor 1: Patient preparation for Follow-up Appointments and Tests, and Language
Assistance
13 Barriers to keeping appointments are addressed .605 .84
9 If patient requires future diagnostic testing, patient
and/or family member is instructed on any preparation
for testing
.531
29 Patient/family is asked to explain, in their own words,
the details of the discharge plan
.515
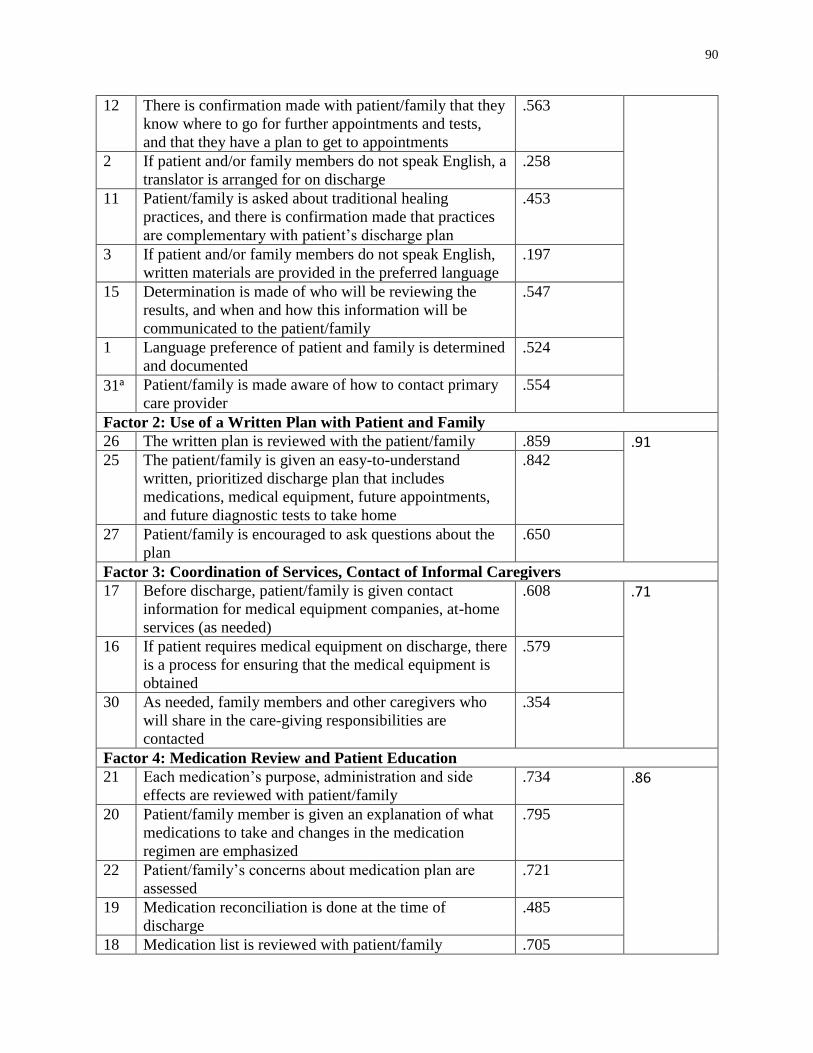
90
12 There is confirmation made with patient/family that they
know where to go for further appointments and tests,
and that they have a plan to get to appointments
.563
2 If patient and/or family members do not speak English, a
translator is arranged for on discharge
.258
11 Patient/family is asked about traditional healing
practices, and there is confirmation made that practices
are complementary with patient’s discharge plan
.453
3 If patient and/or family members do not speak English,
written materials are provided in the preferred language
.197
15 Determination is made of who will be reviewing the
results, and when and how this information will be
communicated to the patient/family
.547
1 Language preference of patient and family is determined
and documented
.524
31a Patient/family is made aware of how to contact primary
care provider
.554
Factor 2: Use of a Written Plan with Patient and Family
26 The written plan is reviewed with the patient/family .859 .91
25 The patient/family is given an easy-to-understand
written, prioritized discharge plan that includes
medications, medical equipment, future appointments,
and future diagnostic tests to take home
.842
27 Patient/family is encouraged to ask questions about the
plan
.650
Factor 3: Coordination of Services, Contact of Informal Caregivers
17 Before discharge, patient/family is given contact
information for medical equipment companies, at-home
services (as needed)
.608 .71
16 If patient requires medical equipment on discharge, there
is a process for ensuring that the medical equipment is
obtained
.579
30 As needed, family members and other caregivers who
will share in the care-giving responsibilities are
contacted
.354
Factor 4: Medication Review and Patient Education
21 Each medication’s purpose, administration and side
effects are reviewed with patient/family
.734 .86
20 Patient/family member is given an explanation of what
medications to take and changes in the medication
regimen are emphasized
.795
22 Patient/family’s concerns about medication plan are
assessed
.721
19 Medication reconciliation is done at the time of
discharge
.485
18 Medication list is reviewed with patient/family .705
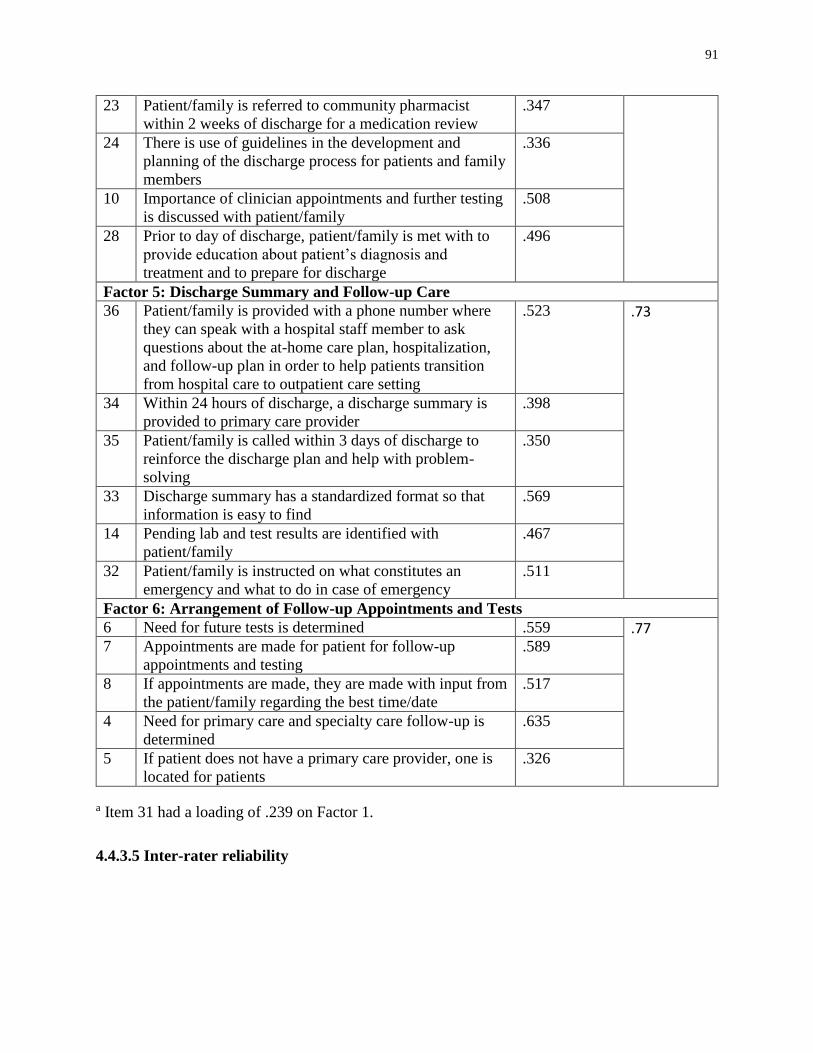
91
23 Patient/family is referred to community pharmacist
within 2 weeks of discharge for a medication review
.347
24 There is use of guidelines in the development and
planning of the discharge process for patients and family
members
.336
10 Importance of clinician appointments and further testing
is discussed with patient/family
.508
28 Prior to day of discharge, patient/family is met with to
provide education about patient’s diagnosis and
treatment and to prepare for discharge
.496
Factor 5: Discharge Summary and Follow-up Care
36 Patient/family is provided with a phone number where
they can speak with a hospital staff member to ask
questions about the at-home care plan, hospitalization,
and follow-up plan in order to help patients transition
from hospital care to outpatient care setting
.523 .73
34 Within 24 hours of discharge, a discharge summary is
provided to primary care provider
.398
35 Patient/family is called within 3 days of discharge to
reinforce the discharge plan and help with problem-
solving
.350
33 Discharge summary has a standardized format so that
information is easy to find
.569
14 Pending lab and test results are identified with
patient/family
.467
32 Patient/family is instructed on what constitutes an
emergency and what to do in case of emergency
.511
Factor 6: Arrangement of Follow-up Appointments and Tests
6 Need for future tests is determined .559 .77 7 Appointments are made for patient for follow-up
appointments and testing
.589
8 If appointments are made, they are made with input from
the patient/family regarding the best time/date
.517
4 Need for primary care and specialty care follow-up is
determined
.635
5 If patient does not have a primary care provider, one is
located for patients
.326
a Item 31 had a loading of .239 on Factor 1.
4.4.3.5 Inter-rater reliability
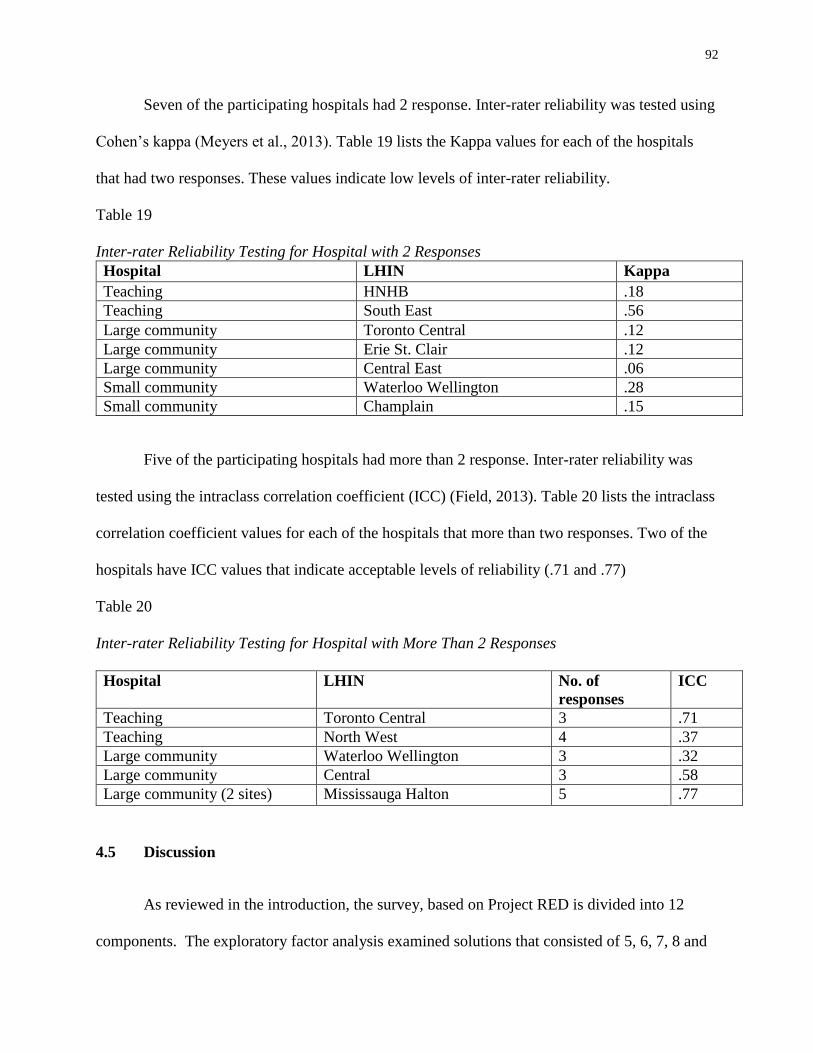
92
Seven of the participating hospitals had 2 response. Inter-rater reliability was tested using
Cohen’s kappa (Meyers et al., 2013). Table 19 lists the Kappa values for each of the hospitals
that had two responses. These values indicate low levels of inter-rater reliability.
Table 19
Inter-rater Reliability Testing for Hospital with 2 Responses
Hospital LHIN Kappa
Teaching HNHB .18
Teaching South East .56
Large community Toronto Central .12
Large community Erie St. Clair .12
Large community Central East .06
Small community Waterloo Wellington .28
Small community Champlain .15
Five of the participating hospitals had more than 2 response. Inter-rater reliability was
tested using the intraclass correlation coefficient (ICC) (Field, 2013). Table 20 lists the intraclass
correlation coefficient values for each of the hospitals that more than two responses. Two of the
hospitals have ICC values that indicate acceptable levels of reliability (.71 and .77)
Table 20
Inter-rater Reliability Testing for Hospital with More Than 2 Responses
Hospital LHIN No. of
responses
ICC
Teaching Toronto Central 3 .71
Teaching North West 4 .37
Large community Waterloo Wellington 3 .32
Large community Central 3 .58
Large community (2 sites) Mississauga Halton 5 .77
4.5 Discussion
As reviewed in the introduction, the survey, based on Project RED is divided into 12
components. The exploratory factor analysis examined solutions that consisted of 5, 6, 7, 8 and
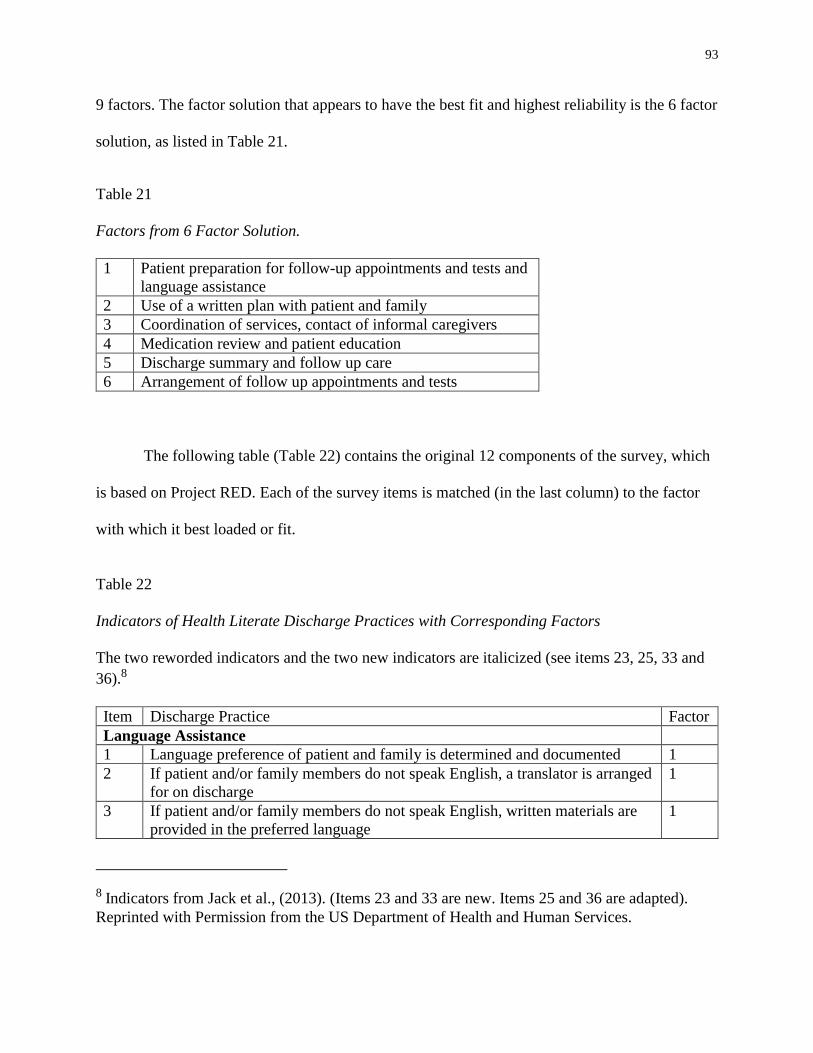
93
9 factors. The factor solution that appears to have the best fit and highest reliability is the 6 factor
solution, as listed in Table 21.
Table 21
Factors from 6 Factor Solution.
1 Patient preparation for follow-up appointments and tests and
language assistance
2 Use of a written plan with patient and family
3 Coordination of services, contact of informal caregivers
4 Medication review and patient education
5 Discharge summary and follow up care
6 Arrangement of follow up appointments and tests
The following table (Table 22) contains the original 12 components of the survey, which
is based on Project RED. Each of the survey items is matched (in the last column) to the factor
with which it best loaded or fit.
Table 22
Indicators of Health Literate Discharge Practices with Corresponding Factors
The two reworded indicators and the two new indicators are italicized (see items 23, 25, 33 and
36).8
Item Discharge Practice Factor
Language Assistance
1 Language preference of patient and family is determined and documented 1
2 If patient and/or family members do not speak English, a translator is arranged
for on discharge
1
3 If patient and/or family members do not speak English, written materials are
provided in the preferred language
1
8 Indicators from Jack et al., (2013). (Items 23 and 33 are new. Items 25 and 36 are adapted).
Reprinted with Permission from the US Department of Health and Human Services.
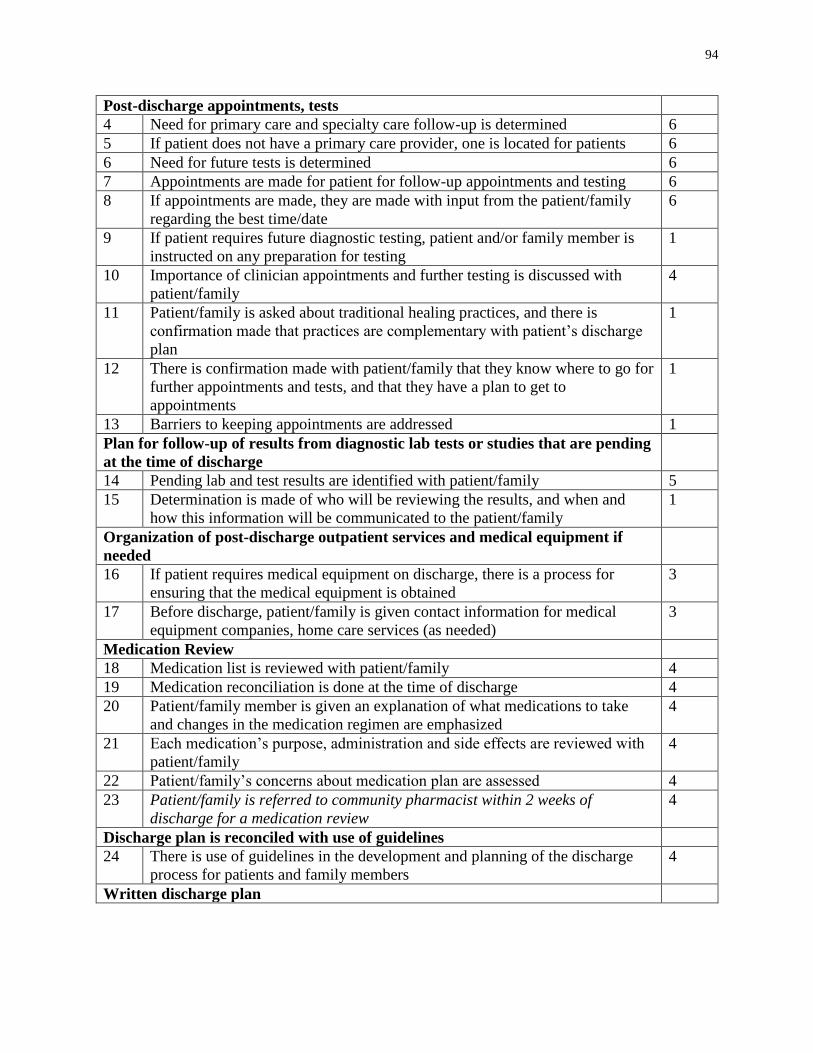
94
Post-discharge appointments, tests
4 Need for primary care and specialty care follow-up is determined 6
5 If patient does not have a primary care provider, one is located for patients 6
6 Need for future tests is determined 6
7 Appointments are made for patient for follow-up appointments and testing 6
8 If appointments are made, they are made with input from the patient/family
regarding the best time/date
6
9 If patient requires future diagnostic testing, patient and/or family member is
instructed on any preparation for testing
1
10 Importance of clinician appointments and further testing is discussed with
patient/family
4
11 Patient/family is asked about traditional healing practices, and there is
confirmation made that practices are complementary with patient’s discharge
plan
1
12 There is confirmation made with patient/family that they know where to go for
further appointments and tests, and that they have a plan to get to
appointments
1
13 Barriers to keeping appointments are addressed 1
Plan for follow-up of results from diagnostic lab tests or studies that are pending
at the time of discharge
14 Pending lab and test results are identified with patient/family 5
15 Determination is made of who will be reviewing the results, and when and
how this information will be communicated to the patient/family
1
Organization of post-discharge outpatient services and medical equipment if
needed
16 If patient requires medical equipment on discharge, there is a process for
ensuring that the medical equipment is obtained
3
17 Before discharge, patient/family is given contact information for medical
equipment companies, home care services (as needed)
3
Medication Review
18 Medication list is reviewed with patient/family 4
19 Medication reconciliation is done at the time of discharge 4
20 Patient/family member is given an explanation of what medications to take
and changes in the medication regimen are emphasized
4
21 Each medication’s purpose, administration and side effects are reviewed with
patient/family
4
22 Patient/family’s concerns about medication plan are assessed 4
23 Patient/family is referred to community pharmacist within 2 weeks of
discharge for a medication review
4
Discharge plan is reconciled with use of guidelines
24 There is use of guidelines in the development and planning of the discharge
process for patients and family members
4
Written discharge plan
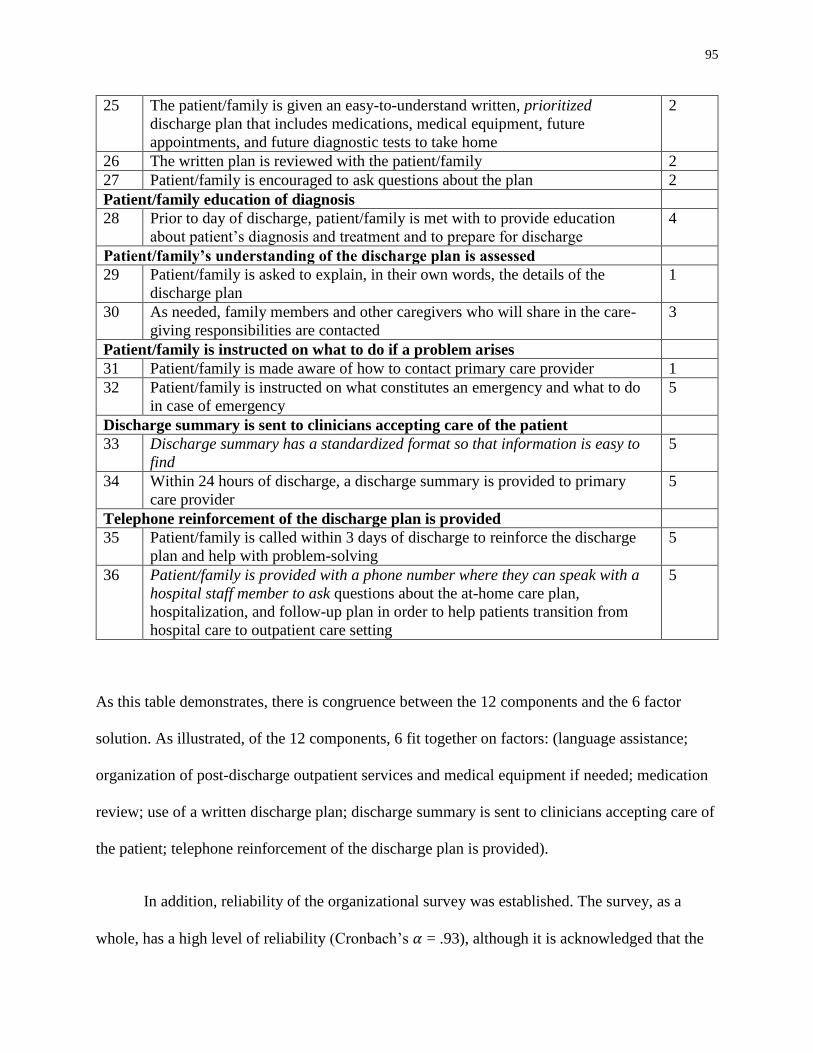
95
25 The patient/family is given an easy-to-understand written, prioritized
discharge plan that includes medications, medical equipment, future
appointments, and future diagnostic tests to take home
2
26 The written plan is reviewed with the patient/family 2
27 Patient/family is encouraged to ask questions about the plan 2
Patient/family education of diagnosis
28 Prior to day of discharge, patient/family is met with to provide education
about patient’s diagnosis and treatment and to prepare for discharge
4
Patient/family’s understanding of the discharge plan is assessed
29 Patient/family is asked to explain, in their own words, the details of the
discharge plan
1
30 As needed, family members and other caregivers who will share in the care-
giving responsibilities are contacted
3
Patient/family is instructed on what to do if a problem arises
31 Patient/family is made aware of how to contact primary care provider 1
32 Patient/family is instructed on what constitutes an emergency and what to do
in case of emergency
5
Discharge summary is sent to clinicians accepting care of the patient
33 Discharge summary has a standardized format so that information is easy to
find
5
34 Within 24 hours of discharge, a discharge summary is provided to primary
care provider
5
Telephone reinforcement of the discharge plan is provided
35 Patient/family is called within 3 days of discharge to reinforce the discharge
plan and help with problem-solving
5
36 Patient/family is provided with a phone number where they can speak with a
hospital staff member to ask questions about the at-home care plan,
hospitalization, and follow-up plan in order to help patients transition from
hospital care to outpatient care setting
5
As this table demonstrates, there is congruence between the 12 components and the 6 factor
solution. As illustrated, of the 12 components, 6 fit together on factors: (language assistance;
organization of post-discharge outpatient services and medical equipment if needed; medication
review; use of a written discharge plan; discharge summary is sent to clinicians accepting care of
the patient; telephone reinforcement of the discharge plan is provided).
In addition, reliability of the organizational survey was established. The survey, as a
whole, has a high level of reliability (Cronbach’s 𝛼 = .93), although it is acknowledged that the
96
value of Cronbach’s 𝛼 increases with the number of survey items (Cortina, 1993). Each of the
factors or “sub-scales” of the 6 factor solution had acceptable levels of reliability, ranging from
.71 to .91.
The inter-rater reliability testing indicated low levels of inter-rater reliability. When there
were multiple responses from hospitals, participants typically had different roles, or were
working on different units of the hospital. This may account for the differences in their ratings.
4.6 Limitations
A limitation to this analysis was the small sample size. The small size limits the ability to
generalize the findings to all hospitals in Ontario (Field, 2013). There is a need to replicate this
analysis with a larger sample size, to see if the factor solution remains stable.
As reported in the descriptive statistics section, there were 12 hospitals that had more
than one response. This may have influenced the results and this study did not examine the
impact of having multiple responses from hospitals.
4.7 Theoretical contribution
In Chapter 3, the Health Literate Care Model was revised to focus on the use of health
literate discharge practices as strategies of health literate organizations. This exploratory factor
analysis was done to understand the construct “use of health literate discharge practices.” This
analysis contributes to our understanding of the factors that constitute health literate discharge
practices.
4.8 Conclusion
97
The indicators that were developed in the first study were used to create an organizational
survey tool to measure the use of health literate discharge practices in Ontario hospitals. These
indicators were based on Project RED, and with the use of a Delphi panel, 2 indicators were
reworded, and 2 indicators were added. The administration of this 36-item survey offers insight
into the wide range of use of health literate discharge practices in Ontario. In addition,
psychometric testing was done to establish the reliability of this survey.
This survey could be used by Ontario hospitals to measure and monitor their use of health
literate discharge practices, and to identify areas for improvement. In addition, this survey could
be tested in other provinces and territories in Canada. It could be used in benchmarking, to
compare hospitals’ progress in using these practices. The use of health literate discharge
practices have been associated with decreased readmission rates and improved care for patients
and families, and by measuring and adopting these practices, hospitals have the opportunity to
reach these important outcomes.
98
Chapter 5:
Absorptive Capacity and the Uptake of New Discharge Practices in
Ontario Hospitals
5.1 Introduction
Most of the research on health literacy to date has focused on the rates of low health
literacy among patients and their consequent poor health outcomes (Berkman, Sheridan,
Donahue, Halpern, & Crotty, 2011; Nielsen-Bohlman et al., 2004) or has examined the ways in
which health care providers do not meet the health literacy needs of patients and families (Cua &
Kripalani, 2008; Schillinger et al., 2003). Rather than focusing solely on the group levels of
patients and providers in hospitals, it is important to extend our lens to the organizational level
where there are both barriers and facilitators that will influence whether or not new knowledge,
such as health literate discharge practices, is utilized (Damschroder et al., 2009; Grol, Bosch,
Hulscher, Eccles, & Wensing, 2007). This study uses an organizational learning lens to examine
how Ontario hospitals adopt and use health literate discharge practices,
5.2 Organizational learning
Health literate discharge practices, like other evidence-based practices, may be
conceptualized as an innovation in that knowledge is encountered by an organization for the first
time (Damanpour, Walker, & Avellaneda, 2009; Panzano & Roth, 2006). When an organization
such as a hospital adopts and implements an innovation, it is engaging in organizational learning.
Organizational learning theory is a meta-theory that places an emphasis on the
organizational context in which learning about an innovation occurs. The organizational context
includes those facilitators and barriers to learning that exist at the individual, organizational and
99
environmental levels (Argote, 2012; Berta, Ginsburg, Gilbart, Lemieux-Charles, & Davis, 2013;
Berta et al., 2010; March, 1991; Nonaka, 1994). In order to successfully introduce innovations, it
is imperative that organizations pay attention to these contextual factors (Argote, 2012).
5.2.1 Absorptive Capacity
How organizations introduce, adopt and implement innovations will depend upon their
“learning” or “absorptive” capacity, that is, their ability to recognize the value of new knowledge
and to integrate it into their work (Cohen & Levinthal, 1990; Lewin, Massini, & Peeters, 2011).
This concept of absorptive capacity has been associated, in the health services literature, with an
organization’s ability to integrate innovations like best practices (Barnsley, Lemieux-Charles, &
McKinney, 1998; Berta et al., 2010).
Absorptive capacity can manifest as routines. Routines refer to the practices, procedures
and customs that are used to carry out work and make work-related decisions. Routines are a
form of knowledge and they come from inside or outside of the organization (Cohen &
Levinthal, 1990; March, 1991). There are different levels of routines.
Straightforward, lower level routines may be thought of as the everyday practices that are
carried out in the organization’s work. They are particular to the organization, and they
represent activities that can actually be observed (Lewin et al, 2011).
Metaroutines are higher-order, large scale routines that influence the ability to perform
lower level routines. As well, metaroutines influence organizational practices and how
organizations use new knowledge (Lewin et al., 2011). Lewin et al. (2011) describe metaroutines
as the basis or underpinning of absorptive capacity. Absorptive capacity metaroutines in an
organization are directed externally or internally.
100
External absorptive capacity routines can be employed by organizations to examine the
external environment to find new knowledge that may benefit it, or to find potential solutions for
existing challenges. Internal absorptive capacity routines are applied to new knowledge that is in
the organization, whether that new knowledge has been imported as a consequence of enacting
external routines, or emerged through actions carried out from within the organization. Internal
absorptive capacity metaroutines are used to consider new practices to implement, to exchange
ideas and information between organizational members, and to reflect on, and revise, established
practices (Lewin et al., 2011; Peeters, Massini, & Lewin, 2014). Over time, both external and
internal routines may be modified in response to new challenges, new practices and
organizational learning, or they may be abandoned for new routines. As routines change, develop
and grow, new organizational aptitudes can develop (Lewin et al., 2011).
Peeters, Massini & Lewin (2014) point out that current models using absorptive capacity
routines have not been tested empirically. However, the construct of absorptive capacity
routines has been used to understand how health care organizations implement new practices
(Berta & Baker, 2004; Berta et al., 2013; Innis & Berta, 2016), and a purpose of this study is to
investigate the use of routines in hospitals in the uptake of health literate discharge practices.
5.2.2 Metaroutines for the uptake and use of evidence-based practices
As described above, health literate discharge practices are evidence-based practices. In
the Spring of 2014, a scoping literature review (Arksey & O'Malley, 2005) was undertaken to
gain an understanding of the factors, contexts and processes that influence the uptake and use of
evidence based practice in health care organizations (Innis, Dryden-Palmer, Perreira, & Berta,
2015). Based on the scoping review, this study chose to focus on four metaroutines when
developing the semi-structured interview questions that were used to collect data. These four
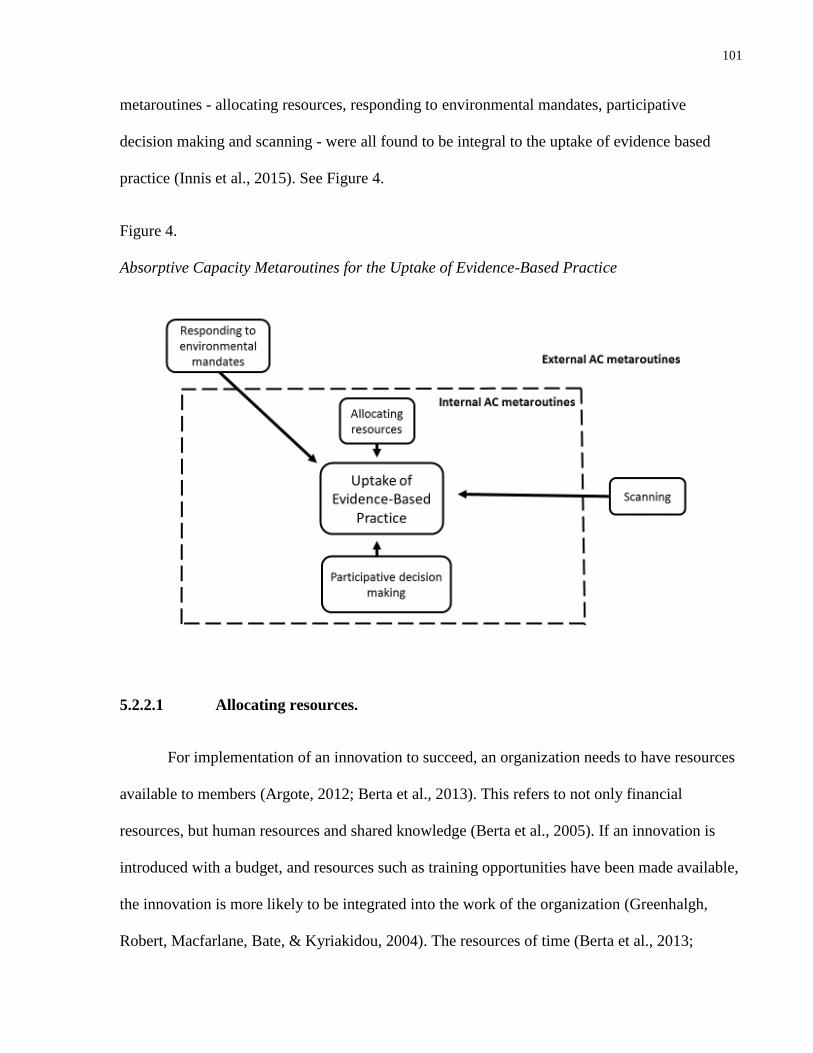
101
metaroutines - allocating resources, responding to environmental mandates, participative
decision making and scanning - were all found to be integral to the uptake of evidence based
practice (Innis et al., 2015). See Figure 4.
Figure 4.
Absorptive Capacity Metaroutines for the Uptake of Evidence-Based Practice
5.2.2.1 Allocating resources.
For implementation of an innovation to succeed, an organization needs to have resources
available to members (Argote, 2012; Berta et al., 2013). This refers to not only financial
resources, but human resources and shared knowledge (Berta et al., 2005). If an innovation is
introduced with a budget, and resources such as training opportunities have been made available,
the innovation is more likely to be integrated into the work of the organization (Greenhalgh,
Robert, Macfarlane, Bate, & Kyriakidou, 2004). The resources of time (Berta et al., 2013;
102
Fineout-Overholt et al., 2004; Panzano & Roth, 2006), education and training (Berta et al., 2013;
Ellen et al., 2013; Greenhalgh et al., 2004), information technology (Fineout-Overholt et al.,
2004; Lau et al., 1999; Lukas et al., 2007), financial resources, resources for patient care (Angus,
Hodnett, & O'Brien-Pallas, 2003; Ploeg, Davies, Edwards, Gifford, & Miller, 2007) and staff
qualifications have all been found to facilitate the adoption of innovations in health care.
Time is identified as a resource to plan and consult with stakeholders (Berta et al., 2013;
Panzano & Roth, 2006); to obtain and read research (Fineout-Overholt et al., 2004) and to
implement new practices (Kimber, Barwick, & Fearing, 2012; Plath, 2013).
In order to adopt and implement an innovation, the use of resources for training and
education of staff has been found to be a facilitating factor (Berentson-Shaw & Price, 2007;
Berta et al., 2013; Ellen et al., 2013; Greenhalgh et al., 2004). In a 2013 study of protocol
implementation in long term care homes in Ontario, it was found that for-profit homes and not-
for-profit homes provided a higher level of resources for staff in the form of in-service education
and opportunities to attend external conferences, than did government-operated homes. This
study found that providing adequate resources for staff to receive training in the use of the new
protocols was vital to the success of the protocol implementation (Berta et al., 2013).
Three studies found that the presence of IT infrastructure, including computer resources,
IT support and the availability of training, were facilitators to the adoption of evidence-based
practice (Fineout-Overholt et al., 2004; Lau et al., 1999; Lukas et al., 2007).
As staff time, education and training, and IT are all associated with enhancing the uptake
and implementation of evidence-based practice, it is not surprising that a lack of financial
resources is a barrier. A 2004 literature review identified financial resources as a facilitating
103
factor to the use of research by nurses (Olade, 2004) and two other studies identified the lack of
financial resources as a barrier. In a survey of nurses’ ability to understand and use research
findings in the United States, nurses reported that a common barriers to research utilization was
the absence of a hospital budget to fund training and educational opportunities (Cadmus et al.,
2008).
Following a largely failed attempt at implementation of evidence-based practice in ten
Ontario hospitals, a 2003 follow-up qualitative study was done to examine the reasons for the
failure at one hospital, and the limited success at a comparison hospital. Through observation
and interviews with staff nurses and nursing managers, it was discovered that the hospital where
the intervention failed had been undergoing financial difficulties at the time of the intervention,
which had actually threatened to close the hospital. The second comparator hospital was not
having financial issues (Angus et al., 2003). It is quite possible that the hospital’s failure to
implement the evidence-based practice was associated with the hospital’s lack of financial
resources.
The adoption of evidence-based practice often involves the introduction of resources that
are needed for patient care, such as new therapies. Both of the Ontario hospitals described in the
preceding paragraph were challenged to find ways to meet the language and cultural needs of
patient populations that were culturally diverse. In the first hospital, where the intervention
largely failed, it was found there were limited resources to provide translation services or
culturally appropriate care. In the second hospital, where the intervention had some success,
there were no financial difficulties and the hospital was actively engaged in the delivery of
outreach programs to several cultural community groups (Angus et al., 2003).
104
A study of Ontario hospitals, in which nursing clinical best practice guidelines had been
implemented over a two year period, found that providing patient equipment resources, such as
pressure mattresses and wound care products, was a facilitating factor to the implementation of
the guidelines (Ploeg et al., 2007).
The Contingency Model of Innovation Adoption proposes that the probability of clinical
practice guideline adoption and use increases as the number of registered, professional nursing
staff increases (Berta et al., 2005). Although this model is referring to the use of innovations in
the long term care setting and to nursing staff, there is evidence in other study settings that the
use of evidence-based practices increases as staffing qualifications increase. A 2012 study
compared the features of high- and low-performing anticoagulation clinics in Veterans’ Affairs
hospitals in the United States. It was found that in the high-performing clinics, pharmacists were
significantly more likely to have completed a pharmacy residency, which is typically a one-year
additional training period in a teaching hospital following completion of a pharmacy degree
(Rose et al., 2012).
5.2.2.2 Responding to environmental mandates
Environmental mandates refer to those factors in the environment that influence how
organizations adopt and use innovations (Berta et al., 2005). Health service organizations
respond to triggers, which may come from the internal or external environment. Examples of
external triggers are changes in regulatory or accreditation requirements or a shift in government
policy (Berta et al., 2005; Zahra & George, 2002). As an example of responding to government
policy, Ellen et al (2013) found that participants from Ontario health service organizations
reported that the establishment of quality assurance departments was partly due to the provincial
government’s emphasis on quality monitoring.
105
Regulatory requirements have been found to influence the adoption of clinical practice
guidelines (Davis & Taylor-Vaisey, 1997) as well as increase the use of research by nurses
(Gifford, Davies, Edwards, Griffin, & Lybanon, 2007). A survey of nurses from a trauma
hospital in Minnesota found that respondents stated that regulation was a negative motivator for
adopting practice change, however, the study did not examine whether this finding had actually
influenced the adoption of new practices (Gale & Schaffer, 2009).
5.2.2.3 Participative decision making to select innovations
How an organization decides to select an innovation will depend on the processes in
place to consider innovations and how resources can be used (Argote, 2012). Several studies
have found that using a participative approach to include front-line staff, management and
leadership in selecting new evidence-based practices is central to the successful implementation
of the practices (Berta et al., 2013; Leape et al., 2006; Ruffolo, Savas, Neal, Capobianco, &
Reynolds, 2009).
A 2013 study examined the organizational and contextual factors that affect adoption of
new practices in long-term care homes in Ontario. Using a participative approach that included
staff and managers in choosing clinical practice guidelines was found to be vital to the success of
a guideline’s implementation (Berta et al., 2013).
Involving staff in protocol selection was also found to be beneficial in the study of
hospitals in Massachusetts, in which hospitals were asked to select two safe practice policies to
implement in their organization. The two practices selected were protocols for medication
reconciliation and the communication of critical test results. A facilitator to the program’s
106
success was determined to be the involvement of leadership and staff, particularly hospital
physicians, in the selection process (Leape et al., 2006).
A participative approach was also demonstrated in the case study of a behavioural health
care organization in the United States that used a community-centred process to select
innovations for adoption. This selection process included a wide range of stakeholders that
included clients, families, other mental health organizations, housing support services and
substance use programs. Although this process was found to be time-consuming, it was found to
be invaluable in decreasing opposition from staff to innovations and it ultimately increased
services for families (Ruffolo et al., 2009).
5.2.2.4 Scanning
Scanning is a concept in organizational learning theory that describes the routines that
organizations employ to scan or observe the external environment for innovations that could be
used to meet challenges or improve performance (Lewin et al., 2011). Titler et al., (1994) refer
to these innovations as “triggers.” Triggers come from information that is new, or that is being
newly recognized (Titler et al., 1994).
The role of scanning in the uptake and adoption of evidence-based practice was examined
in the following two studies. A 2010 study examined the introduction of evidence-based clinical
practice guidelines in long-term care homes in Ontario. It was found that prior to the adoption of
the guidelines, there was a phase in which key members of the organization, whether asked to by
management or self-directed, scanned sources of information in the environment to find out
about current protocols and recommendations that were associated with clinical concerns (Berta
et al., 2010).
107
A second study used a mixed methods approach of surveys and interviews to examine
how public sector mental health service organizations (n=66) in Ohio made decisions to adopt
practice changes. It was found that organizations which made an effort to stay informed of new
practices by scanning the environment and examining activities in other organizations were more
likely to adopt new practices (Panzano & Roth, 2006).
5.3 Use of health literate discharge practices in Ontario
Despite the growing realization that there is a relationship between how patients are
discharged from hospital and their subsequent readmission (Vashi et al., 2013), little research has
examined how hospitals discharge patients. Given the relationship observed between the use of
health literate discharge practices and improved patient outcomes, including decreased
readmission (Adams et al., 2014; Coleman et al., 2006; Jack, Chetty, Anthony, Greenwald,
Sanchez, Johnson, Forsythe, O'Donnell, Paasche-Orlow, Manasseh, et al., 2009; Markley et al.,
2013; Naylor et al., 2004), there is a need to understand how hospitals adopt and use these
practices.
As previously described in chapter 4, a survey that measured the use of health literate
discharge practices was administered to nursing managers of general medicine inpatient wards in
the 143 adult, acute care hospital sites in Ontario, Canada in spring 2015. Medical units were
chosen as they have the highest rates of readmission (Canadian Institute for Health Information,
2012). A total of 99 nursing managers or designates responded to the survey, representing 79
hospitals (participation rate 55%). Of the 99 participants, 55 participants from 52 hospital sites
agreed to be contacted for a follow-up interview.
5.4 Research question
108
The research question for this study was: What are the absorptive capacity metaroutines
that hospitals in Ontario use in the adoption and uptake of health literate discharge practices? A
goal of this study was to use the findings to generate propositions for future study.
5.5 Methods
The study received ethics approval from the Office of Research Ethics at the University
of Toronto on June 23, 2015.
5.5.1 Sample
Key informant interviews were conducted with 20 participants from 10 hospital sites.
Stratified purposeful sampling was used (Patton, 2002) to select hospital sites for the interviews,
from among 52 hospitals where participants had agreed to be contacted. Stratification was done
according to hospital type, location, rurality, and level of health literate discharge practices as
determined by the organizational survey. These were characteristics known to influence
performance in earlier studies (Berta et al., 2013; Canadian Institute for Health Information,
2012; Damschroder et al., 2009; Greenhalgh et al., 2004), and generally in the organization
theory literature (Argote, 2012; Cohen, March, & Olsen, 1972; Cyert & March, 1963; Jiménez-
Jiménez & Sanz-Valle, 2011).
There are three types of acute care hospitals in Ontario: teaching hospitals, large
community hospitals with at least 100 beds, and small community hospitals with less than 100
beds (Ministry of Health and Long-Term Care, 2013a, 2013b, 2013c). Hospitals’ locations are
described by the Local Health Integration Network or LHINs in which they are located. There
are 14 LHINs in Ontario. The LHINs are regional health authorities. They receive funding from
109
Ontario’s Ministry of Health and Long-Term Care and are responsible for planning, funding and
integrating hospital, home and community services (Deber, 2014).
Hospitals locations are also described by their rurality. The rurality index is a composite
value that reflects a community’s location with respect to population density and travel times for
basic and advanced health care services. The rurality index ranges from 0 (highest population
density, lowest travel times) to 99 (lowest population density, highest travel times) (Kralj, 2009).
Participants from eleven hospitals were initially contacted via email (see Appendix EE).
Participants at two hospitals refused and participants from two other hospitals did not respond.
Using the stratification criteria, participants from three additional hospitals were contacted, and
these responded and agreed to participate. Each respondent was asked to identify a second
organizational member to also be interviewed. Informed consent was obtained prior to the start
of the interview (see Appendix FF).
See Table 23 for a list of the participants.
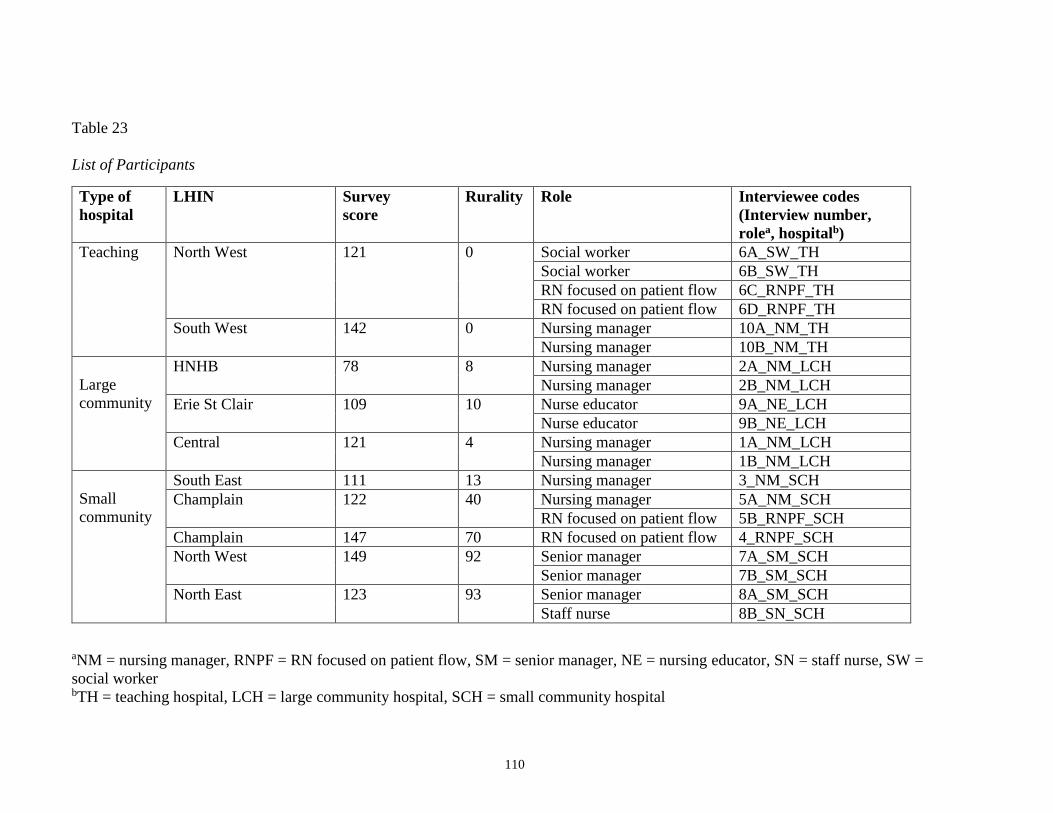
110
Table 23
List of Participants
aNM = nursing manager, RNPF = RN focused on patient flow, SM = senior manager, NE = nursing educator, SN = staff nurse, SW =
social worker bTH = teaching hospital, LCH = large community hospital, SCH = small community hospital
Type of
hospital
LHIN Survey
score
Rurality Role Interviewee codes
(Interview number,
rolea, hospitalb)
Teaching North West 121 0 Social worker 6A_SW_TH
Social worker 6B_SW_TH
RN focused on patient flow 6C_RNPF_TH
RN focused on patient flow 6D_RNPF_TH
South West 142 0 Nursing manager 10A_NM_TH
Nursing manager 10B_NM_TH
Large
community
HNHB 78 8 Nursing manager 2A_NM_LCH
Nursing manager 2B_NM_LCH
Erie St Clair 109 10 Nurse educator 9A_NE_LCH
Nurse educator 9B_NE_LCH
Central 121 4 Nursing manager 1A_NM_LCH
Nursing manager 1B_NM_LCH
Small
community
South East 111 13 Nursing manager 3_NM_SCH
Champlain 122 40 Nursing manager 5A_NM_SCH
RN focused on patient flow 5B_RNPF_SCH
Champlain 147 70 RN focused on patient flow 4_RNPF_SCH
North West 149 92 Senior manager 7A_SM_SCH
Senior manager 7B_SM_SCH
North East 123 93 Senior manager 8A_SM_SCH
Staff nurse 8B_SN_SCH
111
The participants consisted of: 8 nursing managers, 4 registered nurses who had a role focused on
patient flow, 3 senior managers, two nurse educators, two social workers and one staff nurse. Of
note, 18 of the 20 participants were nurses. All of the participants worked in unionized
environments.
5.5.2 Data collection
5.5.2.1 Interviews
Interviews were conducted in-person, at the participant’s work site in the summer and fall
of 2015 by the principal investigator. The interview questions were guided by the scoping
literature review that provided evidence for the four metaroutines: allocating resources,
responding to environmental mandates, participative decision making and scanning (Innis et al.,
2015). See Appendix GG for the interview questions that were used.
5.5.2.2 Documents
Participants were asked to provide documents used in the discharge process at their
hospital. A total of 46 documents were collected. Across all participant hospitals the following
documents were collected: patient discharge forms, discharge summary templates, medication
profiles, checklists, order sets, referral forms for consultation and home care services, and patient
education materials. Photographs (4) were taken at those hospitals where signage and white
boards were used for communication.
5.5.3 Data analysis
The analysis was guided by the research question: What are the absorptive capacity
metaroutines that hospitals use in the uptake of health literate discharge practices? Thematic
112
analysis was used in analyzing the interview data. The processes of data collection and analysis
of the interviews and documents took place concurrently, in an iterative process (Jackson &
Gillis, 2003; Teddlie & Tashakkori, 2009). This enabled the authors to identify points that
needed clarification or questions that required further exploration with study participants
(Jackson & Gillis, 2003; Sandelowski, 1995).
Data from the interviews and the documents was coded with descriptive labels to
distinguish elements that appeared relevant to the study (Braun & Clarke, 2006; Sandelowski,
1995). These codes were informed by the literature review (Innis et al., 2015), and included any
evidence regarding allocating resources, responding to environmental mandates, participative
decision making and scanning. The coding was used to form categories, and these categories led
to the development of themes (Creswell, 2008; Thomas, 2006). Both the transcripts and the
documents were coded using deductive and inductive analysis.
Deductive analysis was used to determine if there was a relationship between the
absorptive capacity metaroutines of: allocating resources, responding to environmental
mandates, participative decision making and scanning, and the uptake of health literate discharge
practices. The analysis was open to unexpected themes and inductive analysis was used to look
for other themes that emerged from the data (Thomas, 2006).
The first two interview transcripts were read and coded independently by the principal
investigator and the two co-supervisors to ensure that coding was consistent and to develop a
tentative coding scheme. The principal investigator was responsible for the bulk of reading and
coding of the transcripts. To ensure the consistency of the coding, there were coding checks and
further development of the coding scheme with the co-supervisors after 4 interviews, after 16
113
interviews, and at the conclusion of the interviews. This process was manual; the NVivo 11
software program was used for data management only.
The findings of the study were used to inform propositions. Although the initial focus of
this study was on the four metaroutines of allocating resources, responding to environmental
mandates, participative decision making and scanning, it was anticipated that other metaroutines
would arise in the interviews. A goal of the analysis was to develop propositions to further our
conceptual understanding of the uptake of health literate discharge practices in hospitals.
5.6 Results
5.6.1 Allocating resources
Participants described the importance of the resources of information technology, staff,
space, and professional development to facilitating the uptake of health literature discharge
practices.
5.6.1.1 Information technology (IT)
Two nursing managers described how IT was used to share information between the
hospital and primary care providers, as well as with home care services, while other participants
described shortcomings with IT. A nursing manager described how the IT system being used was
notifying primary care providers of patients’ hospitalization weeks after the discharge had
actually occurred: “People think that the IT piece is in there, and that it’s capable, they’re
relying on (the software), but (the software) doesn’t work like it’s supposed to
work.”(2B_NM_LCH)
114
Only one participant described the use of electronic health records (HER) to share
information between hospitals. At a small community hospital, a director of nursing described
how her hospital was connected to five others with the same EHR:
There's a group of six hospitals, and we're all connected… it’s a network of the hospitals
that we can see each other's EMR (electronic medical records), so if somebody went to (a
different hospital in the network) and they had a visit, then we can go in, look at that date
and pull up information on what happened in (that hospital). (8A_SM_SCH)
While all of the hospitals used electronic health records to some extent, the
communication between hospitals and the community health care providers was largely by
facsimile. In addition, at five of the hospitals, including one teaching hospital, the discharge
instructions or medication reconciliation record were completed using carbon paper. At two of
these hospitals, patients received the carbon copy, and not the original sheet that was filled in by
staff.
Although only one hospital, a large community hospital, used an electronic discharge
instruction form that nursing staff completed online and then printed to give to patients and
families, participants at three other hospitals described the presence of online resources for
patient discharge education. A nursing manager at a large community hospital described how the
hospital provided Lexicomp©, an online resource for medications, to provide patient education at
discharge:
We have Lexicomp. The staff know that Lexicomp has information, if there are questions
(from patients and families) about any drugs, we get information from Lexicomp, and
they (nursing staff) print out patient education. (1B_NM_LCH)
At two other small community hospitals, participants also described the use of Lexicomp©, and
Meditec© to provide patient education on medications. At one small community hospital, nursing
115
staff had access to the online platforms Mosby Nurse© and UpToDate©, to provide patients with
disease-specific education.
5.6.1.2 Space
In three of the hospitals, participants referred to the importance of space that was
designated for patient care for discharge planning activities. A discharge planner in a small
community hospital discussed working in a palliative care patient lounge. A social worker in a
teaching hospital lamented the lack of space: “There's no physical place for a person to work on
a project” (6A_SW_TH).
Having space for staff to meet and to work on projects was the norm in most of the other
hospitals. Participants described having space in the form of conference rooms, board rooms or
libraries that staff could access.
5.6.1.3 Staff
A number of interviewees noted that when work processes were adopted or changed,
there was a need to identify who would be carrying out the work. Almost all of the hospitals had
a nursing role that was dedicated to discharge planning and patient flow. The only two hospitals
that did not were small community hospitals that each had 10 acute care beds. The organizations
used different titles for this role, such as discharge planner, patient flow navigator, utilization
coordinator, flow nurse and rapid admission nurse, however, the responsibilities of this role were
similar across hospitals. A nursing manager at a teaching hospital described the role in this way:
They just stay right on top of each patient. They work alongside the teams, alongside
nursing, alongside allied health, kind of the coordinator of each kind of team is how I
would describe it. They also concentrate on facilitating discharge, and moving things
forward, and getting appropriate equipment or whatever they need from (home care) or
whatever barriers we can break down. (10A_NM_TH).
116
Participants were asked if there was enough staff available to give patients and families
information about discharge and to answer their questions and concerns. Generally speaking,
nurses in managerial roles felt that there was staff available, while nurses in non-managerial
roles did not agree. This was illustrated in a small community hospital. In response to this
question, the CEO responded: “Yes, for sure. Generally our staffing mix is constant, and if a
person calls in sick, that person will be replaced, so that would be available” (8A_SM_SCH).
When a charge nurse at the same hospital was asked about the availability of nursing staff, she
responded: “You're so short of nursing staff at the best of times” (8B_SN_SCH).
A number of participants identified workload as being a barrier to the use of new
discharge practices, and to educating patients and families about hospital discharge. The value of
the new practices was acknowledged, and it was coupled with the caveat that carrying out these
practices is difficult when nurses already have heavy workloads. A nursing educator at a large
community hospital described the difficulty in carrying out new discharge practices while facing
multiple demands on the ward. In describing the use of a new discharge teaching tool for patients
and families she stated:
We do these new initiatives, but we're not taking anything else away from the nurses. I
would say that's a big barrier. It's just we don't have the time… Just coming from a
nursing role, it's very frustrating because you want to give them the best chance that you
have, but when you've got three people who are confused, waiting to go to the bathroom
who might fall, you've got another person who's supposed to be coming up to you from
emerg, and now I'm supposed to (discharge a patient)... It's having more time. Nurses,
from my experience, genuinely want to do a better job. It's just there is so much on our
plates. (9A_NE_LCH)
Nursing managers from two different community hospitals acknowledged that nurses had a
heavy workload, and that there was not funding available to increase staffing. A manager at a
small community hospital stated that having more staff was not an option, and that the process of
117
hospital discharge needed to change. When asked if there were enough staff available to
discharge patients, she responded:
I think if you ask that question to my staff, my staff would say we need more nurses if we
really want to be able to do it effectively. In my mind, on a med-surg unit you're never
going to get a ratio better than five (patients) to one (nurse). We have that ratio straight
through until 11:00 at night. We have to find a process of doing our work better.
(5A_NM_SCH).
Patients receive nursing care on inpatient units 7 days a week, 24 hours a day. However,
participants at most of the hospitals expressed the concern that because of lack of allied health
staff on the weekends, that discharges were either delayed until Monday, or if they were
discharged over the weekend, the discharges were not done well. A social worker at a teaching
hospital described the situation:
What happens is on the weekend everything is at a standstill. And a lot of times people
are discharged (on the weekend) without the appropriate referrals…I wouldn't mind
working 5 (days) on, 2 (days) off. To cover the weekends. (6A_SW_TH)
5.6.1.4 Professional development
Participants at each of the hospitals reported that professional development was
encouraged for staff and managers. However, staff and managers had different levels of
resources, with respect to time and money, to take courses or to attend conferences. Managers
spoke of receiving funding to further their education, and being able to attend workshops and
conferences during working hours. For example, at two community hospitals (one large and one
small), nursing managers described recently attending a patient flow conference in the United
States.
Generally speaking, staff nurses did not have the same access to these resources. An
exception was in a small community hospital where a staff nurse described having the possibility
of being supported to participate in professional development:
118
If I wanted to go to a discharge planning workshop that would really benefit my work and
the work I do for the hospital, then maybe I think they would support that. I would put the
application in. I think they would support that. (8B_SN_SCH)
At other hospitals, managers described promoting professional development opportunities for
staff, while being unable to provide resources, and requiring staff to attend events on their own
unpaid time. A nursing manager in a large community hospital bluntly noted: “So we endeavor,
we endeavor to give them days off, we don’t” (1B_NM_LCH). Repeatedly, managers described
helping staff re-arrange their work schedule so that staff could attend an educational event on
their own unpaid time.
These findings lead to the following proposition:
Proposition 1. Hospitals with internal absorptive capacity metaroutines to allocate resources for
IT, space, staffing and professional development will facilitate the uptake of health literate
discharge practices.
5.6.2 Building and nurturing external relationships
5.6.2.1 Community organizations
All participants spoke of their relationships with community organizations, including
home care, rehabilitation and complex continuing care facilities, and group homes. A nursing
manager in a small community hospital stressed the importance of relationships with her
community partners:
My whole time in my position in the last three years has been linking with our
(community) partners. Having amazing relationships, coming to the table as equals.
Really putting all of our egos at the door and saying, this is my part of the job, that's your
part of the job, we're going to have some overlap in how we're going to make that as safe
as we can for patients and get them out of here. (5A_NM_SCH)
119
In a large community hospital, a nursing manager described the location of the hospital in
an area with a heavy concentration of group homes. She described the challenges of working
with a population that has a high level of mental health issues, and the regular communication
established with the group homes in the region to facilitate discharge from hospital and prevent
readmission:
We have one of the largest concentration of group homes in the province...they’re
estranged from their families, they age in place and they age younger, faster than the
normal population, so we have some real challenges with that population…We have
meetings with (the group homes) quarterly. Because mental health has challenges too.
They bounce in and out like rubber balls so we’ve been working really hard with them to
try and make that transition (from the hospital to the community). (1A_NM_LCH)
When patients require home care following hospitalization, or they require a referral to
complex continuing care or long-term care, the CCAC is responsible for arranging these services
and making these referrals. Lack of home care services from CCAC was identified as a barrier to
hospital discharge to home in half of the hospitals where interviews took place. Participants
spoke of the lack of resources that the CCAC is able to provide, with respect to nursing and
personal support worker (PSW) services, as well as supplies needed for patient care.
At the small community hospital, where the number of alternate level of care (ALC) beds
had decreased from 50% of the patients to none, the nursing manager described the importance
of mutual respect between the hospital and the CCAC, and the need to work together towards a
common goal:
What we like to do is make other people the enemy. CCAC (says) "Oh that hospital’s
discharging them too early." The hospital says, "I can't send them in the community,
CCAC can't get services, they’re never there." We've just come to the table and said,
what’s your job? This is what my job is. Can you trust me in my job? I'll trust you in your
job... We meet with CCAC regularly. I've never thrown CCAC under the bus. We're going
to link together and say, okay, this is what I'm owning, what are you owning? How are
we going to make this better? We work at making it better together for our patients
(5A_NM_SCH).
120
Participants at four of the hospitals described sending the prescriptions and the discharge
instruction sheet to the patient’s community pharmacy. The participants reported that the
communication with the community pharmacist has been helpful, and a nursing educator at a
large community hospital described how this helped to avoid medication errors:
We have lots of great pharmacists (in the community) who will call up and say, "Is this
the right dosing?" We've gotten calls going, "Oh, you gave this, but did you know this?"
Then it’s, "Oh, well, let's talk to the doctor before the patient's discharged," or to get
clarification.” (9A_NE_LCH)
5.6.2.2 Professional association
Participants from three of the hospitals surveyed spoke of the benefits of becoming a
Registered Nurses’ Association of Ontario (RNAO) Spotlight Organization. Becoming a
spotlight organization means that hospitals agree to adopt and evaluate best practice guidelines
from the RNAO. The RNAO provides training and educational resources for staff nurses to
facilitate the adoption of the best practice guidelines (Registered Nurses’ Association of Ontario,
2015). A nursing manager from a large community hospital reported:
We are actually right in the middle of being, trying to be recognized as a best practice
hospital, from the BPSO (best practice spotlight organization), from the RNAO. That’s
definitely front line staff directed, that’s taking our front line staff and making them
invested in being a better hospital, and to incorporating all of those (best practices).
(1B_NM_LCH)
5.6.2.3 Educational institutions
Participants at each of the hospitals reported that there were medical and nursing students
from universities and community colleges at their sites. Having students was identified as
contributing to a learning culture. As a nurse manager in a hospital that had recently aligned with
121
nursing and medical schools in two universities reported: “(It’s) helpful, really helpful. I think it
creates a culture of ongoing learning.” (2B_NM_LCH).
5.6.2.4 Communities of Practices
Communities of practice are informal groups of individuals who share common work.
They have been shown to facilitate learning between organizational members and to improve
organizational performance (Brown & Duguid, 1991). Three participants from small community
hospitals described having communities of practice. A discharge planner reported meeting with
other discharge planners in her area several times a year to find out about new discharge
processes and to discuss barriers and solutions to problems. Senior leaders from two small
community hospitals described participating in informal communities of practices with other
senior leaders in their regions to share ideas and work through common barriers.
These results lead to the second proposition:
Proposition 2: Hospitals with external absorptive capacity metaroutines for building and
nurturing external relationships with community organizations, educational institutions and
communities of practice facilitate the uptake of health literate discharge practices.
5.6.3 Fostering internal networks
5.6.3.1 Use of hospital rounds
Participants at five of the hospitals described weekly hospital rounds to discuss complex
discharges. These meetings were attended by nursing managers, staff nurses, other members of
the intraprofessional team, and home care service coordinators. The goals of these meetings were
to discuss complex discharge plans, to share resources and to find solutions for patients who no
122
longer needed acute care services, but could not return home. A nursing manager in a large
community hospital described the use of weekly discharge rounds:
We started it so we could review all the patients in the hospital who we were having
challenging discharges. We didn’t want to discuss the ones like Mr. Jones he’ll be fine
tomorrow, we wanted to discuss Mrs. Brown (who) lives alone, has dementia, family lives
in California, no finances, can’t reach the family, want to go to long-term care and the
wait is 3 years, so those are the ones (we discuss). (1A_NM_LCH).
5.6.3.2 Daily unit rounds
Most of the hospitals described rounds that happened every morning on the nursing unit.
These were meetings of the intraprofessional team, and included nurses, rehabilitation therapists,
social workers, dietitians, and pharmacists as well as home care service coordinators. The
meetings were short, lasting between 15-35 minutes and were used to share information about
discharge plans and to ensure that patients were receiving the services that they needed. A nurse
manager at a teaching hospital described the meetings:
They just go through every patient. It only takes about 15 minutes to go through probably
25 patients, and they just literally go through to say, "Where are we at? What are we
missing? What do they need? How are we getting them out for discharge? How are we
preparing them? What's that look like? Is it two more days? One more day? Can they go
today? What can we do today to make it happen,” those kind of things. (2B_NM_LCH).
Physicians did not usually attend these daily rounds, however it was physicians who were
responsible for writing orders to discharge patients home. This lack of communication between
physicians and other members of the intraprofessional team had the potential to lead to tension.
A nursing manager at a teaching hospital described how physicians had the authority, and the
need to maintain open, respectful communication:
Do (physicians) make the final decision? Of course, they're writing the discharge order…
I think you’ve got to be open to have the discussion, and it's, "No, we're not going to do
that, we’ve got to do this," then that's okay, but let's talk about it. I think that's where
123
we're improving is to say, “It's okay that you want to discharge today.” The allied health
or whoever is saying: “It's got to be tomorrow because of this and this.” You (the
physician) could still discharge because you’re the man. You can do it. We can do it.
Knowing that they're probably not going to be successful, they're going to come back.
(10A_NM_TH).
A nursing educator noted the link between physicians not participating in the daily unit
rounds and not having the same plans for patients as the team:
Sometimes it's the team has a plan and then the physician comes in after. In their defense,
too, if they're not part of the conversation, then they never get the context.
(9B_NE_LCH).
As described earlier, participants described how a lack of home care services from CCAC
was as a barrier to hospital discharge to home in half of the hospitals where interviews took
place. The frustrations that were expressed did not extend to relationships with CCAC
coordinators in the hospitals. At most of the hospitals, a CCAC coordinator had her or his office
on site. Participants from four of the hospitals stated that CCAC attended the daily morning
patient care rounds with the intraprofessional team. At three of the hospitals, participants
described good working relationships with the CCAC coordinators, and they described
interacting with them on a regular, daily basis.
5.6.3.3 Internal social networks
Several participants described how their work, or the work of others, depended upon their
social networks within the hospital. At a large community hospital, a nursing manager described
how the patient flow navigators had been at the hospital for years and had good relationships
with physicians as well as with managers in diagnostic imaging. They were able to leverage
these relationships to ensure that patients were seen by consultant physicians and had access to
diagnostic testing on a timely basis.
124
At the same hospital, another nursing manager described how she was able to use her
network to find out information to help patient flow: “I’ve been here a long time so I know a lot
of people. I know people in the organization, so I know where to pull resources.”
(1B_NM_LCH)
These findings suggest a third proposition:
Proposition 3: Hospitals with internal absorptive capacity metaroutines to foster internal
networks will facilitate the uptake of health literate discharge practices.
5.6.4 Standardizing processes
5.6.4.1 Discharge forms
At three of the hospitals, participants described the use of discharge forms throughout the
hospitalization, to ensure that information about the patient’s care did not get lost, and that issues
that affect discharge, such as housing or family support, were identified at the beginning of the
admission. At a large community hospital, a nursing manager described how a nurse practitioner
and two physicians on the inpatient medicine ward developed a new discharge form that had just
been implemented:
They came up with a different process to discharge our patients which provides them with
a better discharge sheet so when a patient gets admitted now in the ER the doctor writes
on the sheet why they were admitted, any co-morbidities…and on the back of that sheet is
actually their discharge summary sheet. So right from the get go, they’re starting to write
things on the discharge summary sheet and even our consulting doctors (are using it).
(1B_NM_LCH).
In a small community hospital, a nursing manager had developed a discharge process tool with
nurses on the unit. The tool identifies issues that influence hospital discharge at the time of
admission:
125
…we've color coded it (the discharge process tool) so that there's risk indicators that
maybe this is going to be a complicated discharge. If they have impaired mobility, they
have frequent falls, recurrent admissions within the past 3 months, delirium, lives alone
with few supports or evidence of a care deficit, caregiver burnout or patient and family
concerns. Those are all risk indicators that we need to know about on admission, so that
we can start addressing them. (3_NM_SCH).
The same nurse manager spoke of the need for this tool to cue staff and to ensure that all steps of
discharge planning were taking place:
It'll ensure that staff are cued to make sure that family are involved during the health
teaching and they're present, and then being able to go through "Do you understand what
your admission was about for the past few days? Did you learn anything?" A lot of
talkback type of discussion, so that we know that we're getting that information to the
patient. (3_NM_SCH).
The need for a standardized record of discharge teaching was echoed by other
participants. At a small community hospital and at a teaching hospital, participants spoke of the
need for a record of what discharge teaching had been done by other staff members. A discharge
planner at the small community hospital expressed the concern that staff were not, or did not
have a way of, recording the details of patient teaching:
I'll go in and talk to Mr. Smith, and he'll say, "Oh, nurse so and so talked to me about
that already," but I don't necessarily have any documentation. There's consistent
discharge specific documentation that should take place. (4_RNPF_SCH)
The nursing manager at the teaching hospital stated:
I think nursing teaches a lot and are doing it every day. It's just, we don't document well,
and I don't know what Sally taught, and then I don't know what Jane's going to teach at
night, and it's just crazy. I think we need better documentation to what we're actually
teaching our patients, and then we know, oh, that's covered, concentrate on something
else. We'll get more information to them if we're not repeating ourselves, or if we're just
avoiding it because we thought somebody else did it. (10A_NM_TH).
At a large community hospital, a nursing manager described how discharge practices
126
were developed and used on individual units or services, rather than being standardized across
the hospital. This led to problems when patients were bed-spaced, or transferred to other units
where there were available beds, to make room on the unit for new admissions from the
emergency department. She stated: “That’s a discharge nightmare for us. That patient will
probably come back, they were discharged from (another unit) without the right information.”
(1B_NM_LCH).
5.6.4.2 Checklists
Participants at three of the hospitals described the use of a discharge checklist by nursing
staff to ensure that patients had received the information they required. A senior manager
remarked on the value of this practice: “It all gets missed if you don't have a checklist.”
(7B_SM_SCH).
5.6.4.3 Standardized order sets
At three hospitals, participants spoke of the value of incorporating discharge planning
into the standardized order sets. At a large community hospital, a nursing manager described
how adopting an electronic health record system had required the hospital to develop
standardized order sets which led to the development of standardized discharge instructions as a
component of the order sets.
The use of checklists and order sets illustrates how standardizing processes can facilitate
the use of health literate discharge practices, and leads to the following proposition:
Proposition 4: Hospitals with internal absorptive capacity metaroutines to standardize processes
will facilitate the uptake of health literate discharge practices.
127
5.6.5 Responding to environmental mandates
5.6.5.1 Accreditation
Although the accreditation of hospitals in North America is voluntary, it has become a
standard of care (Saufl & Fieldus, 2003) and can be considered a mandate in today’s health care
environment. Participants at eight of the ten hospitals identified accreditation as a force that
drives improvements in patient care. A discharge planner at a small community hospital
remarked on the helpfulness of the accreditation process to improve practices:
Accreditation is a big one (driver), we're going through that now…Updating policies to
make sure and just going through everything to make sure that we're on par with it. I
think it's a positive thing. Big-time positive thing, because it helps us recognize where
we're potentially having those deficiencies, or we're not doing things to the best of our
ability. (4_RNPF_SCH)
A director of nursing described how preparing for accreditation had led to the new
practice of telephoning patients at home after they were discharged from hospital. At a teaching
hospital, two nursing managers spoke of using accreditation as a force to sustain new practices.
One of them stated:
We're not being accredited again for quite some time, but let's not fall off the radar. That
whole of, put your eggs all in one basket, and carry your basket, shaking it to the end of
the line, because we've just been working on it for three months rather than building and
continuing all the time. We're doing things like mock tracers that, as leads, we go around
…and see what we're missing. (10A_NM_TH)
5.6.5.2 Mandates from Ontario’s Ministry of Health and Long-Term Care
Several managers described how mandates from the Ministry of Health and Long-Term
Care (MOHLTC) were leading to improvements in the hospital discharge process. In 2010, the
MOHLTC enacted the Excellent Care for All legislation, which requires hospitals to formulate
128
quality improvement plans (Ministry of Health and Long-Term Care, 2014c). A manager in a
small community hospital described how this initiative had helped to drive a new practice of
telephoning patients within 5 days of hospital discharge:
In the Excellent Care for All legislation, every hospital has quality indicators that is
monitored by the LHIN. All of our senior leaders have paid for performance tied to these
indicators in the hospital. …Our new quality indicator plan started in April. (The
discharge follow-up phone call is) on our QIP (Quality Improvement Plan) for 2015-
2016. (5A_NM_SCH).
The influence of the MOHLTC was echoed by a discharge planner at the same hospital who
clearly voiced the sentiments of the Ministry’s 2015 Action Plan for Health Care (Ministry of
Health and Long-Term Care, 2015b):
Within the last two or three years, there's been a huge, huge cascade of change for our
discharge planning. It's been very impactful for our community and for our hospital. Our
ALC numbers have dropped dramatically…I think a lot of it comes from the legislation,
from the government saying that we're funded to have the right patient, right bed, right
time. That's our mantra that we're going to go by, is we want to make sure our patients
are the right ones in the right beds at the right time. We know hospital's not the best
place for everybody, so we try to facilitate (discharge). (5B_RNPF_SCH)
At a large community hospital, a nursing manager stated that within the first 48 hours of
a patient’s admission, there was a discussion with the patient about length of stay and hospital
discharge, in response to “Home First.” Home First is a provincial initiative to decrease the
number of inpatients with complex needs waiting for long-term care placement. Each LHIN
works with home care services to provide community supports, so that patients can return home
with the appropriate care (Ministry of Health and Long-Term Care, 2014a).
Participants from 7 of the 10 hospitals interviewed described how the introduction of
Quality Based Procedures (QBPs) had led to improvements in care for patients with the common
medical diagnoses of pneumonia, COPD, CHF and stroke. In an effort to improve health care
129
quality, and increase efficiencies in the health care system, the MOHLTC introduced Quality-
Based Procedures (QBPs) to Ontario in 2012. These refer to specific diagnoses and procedures.
Hospitals are reimbursed for the care of patients with these diagnoses, or who require these
procedures, and this reimbursement depends upon hospitals’ use of standardized, evidence-based
practices. QBPs have been released for several diagnostic groups that are commonly admitted to
inpatient medical units and that have been found to have the highest rates of readmission in
Ontario: pneumonia, COPD, CHF and stroke (Ministry of Health and Long-Term Care, 2015a).
At three hospitals, participants described developing and using patient education
materials in response to the QBP initiative. A nursing educator in a large community hospital
remarked: “The QBPs have changed the way we (discharge patients) ... Because we've pretty
much been forced. You have to do better discharge.” (9B_NE_LCH). At this hospital, nurses had
been taught the use of “teach back” in providing discharge education for patients with COPD.
Nursing staff were given “COPD Teach Back” forms. The forms contained essential teaching
points, and they asked nurses to assess the patient’s performance of teach back. This assessment
contributed to decision-making regarding the need for home care services for patients.
A nursing manager in a small community hospital spoke of how QBPs were leading to
improved care for patients, and she highlighted that QBPs are tied to funding for hospitals: “It
makes it complicated when they start tying funding to it. Although without tying funding, how do
you make anybody do anything?” (5A_NM_LCH)
5.6.5.3 Funding models
The MOHLTC introduced the Emergency Department Process Improvement Plan in
2010 to help hospitals reduce patient waiting times in the emergency department and to improve
patient flow (Ministry of Health and Long-Term Care, 2013e). Two community hospitals
130
described how pay for results had led to improved patient flow processes. At a small community
hospital, a nursing manager commented:
…things that affect us are the new funding formulas that the ministry's put out. We have
to find ways of providing high quality care more efficiently. That drives change.
(3_NM_SCH)
This manager was able to introduce a new role, the rapid admission nurse, which had been
successful in improving patient flow at the hospital that was funded by pay for results. After
analyzing data on admission and discharge times, and staffing ratios, he identified the need for a
nursing position that worked during the hours when the majority of hospital admissions occurred,
in the afternoon and early evening:
The rapid admission nurse matches those hours…It's a P4R project (having a rapid
admission nurse), but it's wonderful so far…Pay for results, the ministry gives you
funding dependent on certain measures that you work towards. One of our measures is
from time of admission to getting the patient to the bed, and if our measure is within that
standard, we get so much money for our results…Pulling your patients up and getting
them admitted is the other side of patient discharges and flow. (3_NM_SCH)
Participants spoke of the need to improve performance in an era of fiscal constraint. At a
small community hospital that had implemented a number of health literate discharge practices, a
nursing manager stated:
Our twenty nine acute care beds are less than a ward in the (urban) hospital. We have to
be amazing. Because we're at risk of the government coming in and saying, "This
actually costs us too much to keep your hospital here."…That's what I tell my teams.
We've got to freaking be amazing. (5A_NM_SCH)
As these participants describe, environmental mandates can lead to improvements in how
hospital discharge is carried out:
131
Proposition 5: Hospitals with external absorptive capacity metaroutines to respond to
environmental mandates will facilitate the uptake of health literate discharge practices.
5.6.6 Scanning
As described earlier, two nursing managers from different hospitals spoke of the value of
learning new processes for hospital discharge at an annual patient flow summit held in the
United States every spring. One of the managers, from a small community hospital, spoke of the
value of the conference:
It was amazing. I would highly recommend it. Came out with a lot of good information,
gave me a lot of ideas to think about, and look up, and look into. What happened was I
learned that one of the things that we need to do is really start our discharge at the time
of admission. What we've done is we've really implemented that, and we've really tried to
push that. (3_NM_SCH)
Several nursing managers described how they find out about new practices through reading and
through online resources. One of the managers described how she used social media to stay
abreast of current trends:
“I mind a bunch of groups on LinkedIn for healthcare executives. What's happening out
there? Are there some neat practices? How can we guide it? Can we beg, borrow and
steal from people? See what's really working great for others. Is there any way for us to
do something like that here?” (5A_NM_SCH)
This led to the sixth proposition:
Proposition 6: Hospitals with external absorptive capacity metaroutines for scanning will
facilitate the uptake of health literate discharge practices.
5.6.7 Engaging patients and families
132
The need to help patients and family find and understand the information that they need was
expressed by a nursing educator at a large community hospital:
Sometimes we find (that) families and patients (say) "You're the expert. You just tell me."
They don't want to take any ownership. I think it's overwhelming for them, too.
Sometimes they don't even know where to start to ask and they're scared to look silly or
stupid. (9A_NE_LCH)
At this hospital, a discharge checklist is currently being developed. This checklist is for patients
and families to use, to ensure that they know what questions to ask, and that they have received
the education that they need. The same nursing educator stated:
This is the discharge teaching checklist. Things I need to ask my nurse. We're trying to
put the ownership back on the patient. What kind of diet? Do I understand the care for
my ostomy? Those types of things. (9A_NE_LCH)
A similar process to increase patient and family engagement with hospital discharge was
being undertaken at a small community hospital. On the unit, signs were posted that had
questions for patients and families. The nursing manager described the purpose of the signs:
Letting them know upfront what information that we need them to know. We have posters
that are up now and it says: Patients and families, can you answer these questions before
discharge? We have it on the doors before you exit. They're up on the walls. People are
wandering around. They get kicked out of a room because care was going to be provided
or something. They read them. Their family member's going to go home and they say,
"Hey, did we answer this question? Do we know what the answer to this question is
before we can get discharged?" (5A_NM_SCH).
At five of the hospitals, participants stated that they asked patients and families about their living
situations, and their use of home care and community services on admission. Two participants
described a formal process to collect this information. At a small community hospital, a nursing
manager described the use of a paper discharge process tool that was to be used to assess and
133
plan for discharge throughout the hospitalization. At another small community hospital, a charge
nurse described how information was collected on assessment using a standardized form:
Are you going to need services in the home like home care services, CCAC (Community
Care Access Centres)? That's all part of our admission history. Also the nursing
admission history is that when you get home, do you think you're going to need services?
That's part of the admission history process. We start that process right off when we're
starting to do care planning. (8B_SN_SCH)
Participants from two large community hospitals described involving family in the
assessment of the patient’s needs and in discharge planning “when they show up.”
(1B_NM_LCH, 2B_NM_LCH). At one of these hospitals, a nursing manager described how not
assessing a patient’s family situation had led to misunderstanding:
We thought the family wasn’t involved but they all had mental health issues and the
mother did (have mental health problems) so it wasn’t that they weren’t, it was because
they had so many problems of their own, they wanted to be involved, they didn’t know
how…we labeled them as estranged and…they couldn’t be involved, just because of their
own mental health issues… there could be trauma you don’t know about, there’s lots of
stuff. (1A_NM_LCH)
Participants at only four hospitals described actively involving the family in discharge planning.
At a small community hospital, a charge nurse described how she ensured the family was
involved in this process:
The discharge planning happens each time that I go into a patient room with the doctor
… I make sure I bring it up…Usually, I hope, when the family is there then I make sure to
go and talk to them. If the family is not there in the morning when we do a round, then I
make sure I'll go in and talk to the family…If it's a caregiver of an elderly parent or
something, you want them to know what the plan is. (8B_SN_SCH)
At two of the hospital, participants spoke of the need for nurses to start bedside reporting,
that is, sharing information about the patient’s care between nurses working different shifts, at
the patient’s bedside. A nursing manager at a teaching hospital stated:

134
The verbal bedside reporting, that's one thing that we need to make more meaningful
again. I think that nurses need to hear that patient's story. (As the manager) I get the
patient's story. It comes to me, but they don't always hear that. (10B_NM_TH)
A nursing manager at a large community hospital also spoke of the need for bedside reporting, so
that the patient understands their own care:
I think bedside reporting is the way to go, making the patient be aware of everything
that’s going on, so when I go into the room, and I haven’t had you for 5 days, you the
patient can tell me what’s going on. (1B_NM_LCH)
Participants at three of the hospitals described how the demographics of the community
served by the hospital drive change. Although the largest concentration of Aboriginals in Canada
is located in Ontario (Government of Canada, 2014), only one hospital described efforts to meet
the needs of this population. Participants from this hospital spoke of the creation of an
Aboriginal Advisory Committee as part of the hospital’s strategic plan. This engagement had led
to the development of a new role within the hospital of Aboriginal Patient Navigator who was
charged with facilitating the discharge process for Aboriginal patients:
We have an Aboriginal navigator to help us with our First Nations people. They navigate
through the hospital, talk to them (Aboriginal patients), what's going on, and just helping
them discharge because a lot of the time they'll be discharged and they have not a clue of
what happened, what's wrong with them, and then they're a bounce back…It's helped us
out immensely. (6C_RNFP_TH)
A social worker at a teaching hospital described how the hospital used “Patient Family
Advisors.” She shared a document that reported the hospital has 76 Patient Family Advisors,
who have been involved in more than 200 working groups and committees. Their participation
has led to several improvement activities that included “better discharge information for
patients.” (6A_SW_TH)
These results lead to the seventh proposition:
135
Proposition 7: Hospitals with internal absorptive capacity metaroutines to engage patients and
families will facilitate the uptake of health literate discharge practices.
5.6.8 Fostering an inclusive culture
Participants from three community hospitals spoke of the tensions, misunderstandings
and different values that existed on their hospital units. An inclusive organizational culture is one
that values open communication and shares information (Schein, 2010).
Participants from two hospitals spoke of the changes in the pace of health care, and the
resulting tensions between senior and junior staff members. A manager in a small community
hospital described the changes that had been made to reduce their ALC beds from half of the
inpatient unit to being a rare occurrence, and the impact on team members
We have long term staff members here (who have) been here twenty five, thirty five years.
They have seen now a massive change in healthcare in the last few years. If we continue
to try and do our work the same way we did our work when half of our population was
ALC, versus now where we can admit and discharge three to five people a day, we need a
different way of doing our work. That's a mind shift. We also have a number of staff who
have been here three to five years…they're used to fast change, ready to go, “What's
happening, where do we go? I can handle things coming at me. I'm good. You just keep
them flowing.” I have another part of my team that's like, "Whoa. Slow down the change.
What's going on? This isn't how we used to do it." It creates a team dynamic. People get
frustrated and they struggle with that. I think because of that a barrier to discharge
becomes everybody's just in a fluster… (5A_NM_SCH)
In conjunction with the tension between generations, participants at two hospitals spoke
of the tension between the philosophy of care of senior staff members, and the current pressures
facing hospitals. A discharge planner at a small community hospital spoke of the barrier that the
mindsets of senior staff posed:
A lot of our older docs and our older nurses are still of the belief that hospital is best
place for people. I would say that's our hugest barrier. (5B_RNPF_SCH)
136
At a large community hospital, a nursing manager also spoke of the differing
philosophies of care between generations of staff:
We have a lot of, senior staff that nursed when nursing was a little bit different, and they
really feel the need, they really see, they don’t understand acute care, right? So they get
very focused on things like cutting people’s hair, and they sort of lose track of the whole
(discharge) education piece. (2B_NM_LCH)
This same manager described how front line staff was not aware of the reasons for the pressures
facing hospitals, and the need for organizational changes: “The problem is I think my personal
feeling is, we haven’t given that information to the front line.” (2B_NM_LCH)
The values and beliefs of staff members could also be seen to pose a barrier to patient
discharge. This was described by a manager at a small community hospital:
(What’s) helpful is getting the (staff) to understand the process of discharge. What we
have to do. Trying to say that a huge one for the nursing staff, and it goes against their
grain in nature, is that people have the right to live at-risk. If a person has an
understanding of the risk, and they're willing to assume that, then they're allowed to go
home and live in the condition that they've lived in. I find my staff are extremely caring,
compassionate. They don't want to see somebody that has been living in a home with dirt
floors for 20 years go back to that, but that's the way they've been living and they've
chose to live for 20 years. It's not a problem to send them back. Set up community
supports. It's not a reason for them to stay in the hospital. That's really difficult for the
nursing staff. They can actually become a barrier to discharge. (3_NM_SCH)
These findings led to the eighth proposition:
Proposition 8: Hospitals with internal absorptive capacity metaroutines to foster an inclusive
organizational culture that values open communication will facilitate the uptake of health
literate discharge practices.
5.6.9 Participative decision making to select discharge practices
137
Three participants reported that decisions were made at a senior level, and that, in the
words of a nursing manager at a large community hospital: “…front line staff sort of get told
what to do.” (1B_NM_LCH). However, the majority of participants reported that their hospital
actively sought their feedback.
Three participants described the use of unit-based councils or teams as providing
opportunities for staff to participate in making decisions. In a small community hospital, a
nursing manager used a unit-based team of nurses to develop and introduce a discharge process
tool. He attributed the success of the tool partly to a hospital culture that embraced staff
engagement: “I find that you're going to have better investment. You're going to have better
ownership if you engage the staff. A lot of times these are the experts around a lot of the issues.
(3_NM_SCH).
Participants from two hospitals reported that setting up a formal process for different
professional groups to participate in decision making was key to making effective changes to the
discharge process. A director of nursing at a small community hospital reported that involving
physicians at the outset of a discharge planning project was integral to the project’s success.
Several participants spoke of processes that were put in place to encourage staff members
to suggest new ways of working. A large community hospital had providing Lean training for
staff nurses as well as managers. A nursing educator at the hospital stated:
We have a Lean board in every unit, so sometimes its nurses saying, "Hey, this is not
(working), we could do this way better, and this is my idea," so it's trying to make things
more efficient or better based on the knowledge that you have. (9A_NE_LCH)
A similar process was described in a more informal manner in a small community hospital. A
nursing manager described meeting with staff in his large office that was located on the nursing
138
unit to discuss new ideas and ways to manage problems relating to discharge:
This is just brainstorming with the staff, and talking about changes, and how we can do
stuff. We just throw ideas on the board. We talk about it...Let's just work on this guys.
Here's a problem that I've been presented with. We need to come up with a solution, so
let's do this. (3_NM_SCH).
These findings led to the ninth proposition:
Proposition 9: Hospitals with internal absorptive capacity metaroutines to foster participative
decision making to select new practices will facilitate the uptake of health literate discharge
practices.
5.6.10 Providing leadership
The support of senior leadership to new discharge practices was seen as being key to their
success. Two nursing managers described how senior leadership supported them in discharge
planning. A nursing manager at a large community hospital described the problem of patients
waiting in hospital for a long-term care bed. Although it had not been used, a policy had been
developed to prevent this from happening, and this process depended on the support of the
executive leadership team:
…waiting in hospital for long term care bed, because that’s a big problem for us, is not
an option. You can’t wait for long term care in the hospital, it’s a process that has go up
to the senior team now, you have to be approved by the vice president, so the VP of all (of
the hospital) sites has to approve you to wait in the hospital. (2B_NM_LCH)
At a small community hospital, a nursing manager described a number of steps that had
been taken to reduce the number of ALC beds from half of the inpatient unit to being a rare
occurrence, and the support she received from senior leadership when she faced opposition from
physicians or family members to discharge plans:
139
I can tell you that if I'm in conflict with a physician, a family, my VP and my CEO are not
going back over my head. It's not that if you just are cranky enough or you jump me and
get to the CEO (that) the decision is going to be over turned. It's not. He's going to say…
go back to the team. (5A_NM_SCH)
The importance of being visible to staff and responsive to their concerns was voiced by
nursing managers who were interviewed. A nursing manager in a small community hospital
stated:
I used to be in the administration wing. I felt that part of being manager on the floor is to
be visible and accessible to the staff. I felt that was lacking…I ended up assuming this
room. It's right on the floor. Staff can come. I have an open door policy. They come in,
they come out at all times. They know they can, it's not disruptive for me. (3_NM_SCH)
These findings led to the tenth proposition:
Proposition 10: Hospitals with internal absorptive capacity metaroutines to provide leadership
that is supportive and responsive will facilitate the uptake of health literate discharge practices.
5.6.11 Evaluating
Several participants described the value of including patients and staff in evaluation
activities. Participants from four different hospitals spoke of engaging patients when evaluating
current or new processes. A manager from a small community hospital described the use of new
patient education materials on the nursing unit:
We've trialed this (patient educational resource materials) for a month. Right now, we're
going to take it down. We're going to review it. I've met with some patients already and
asked them how they feel about it. (3_NM_SCH)
A manager from a teaching hospital described the introduction of patient advisors to the
unit’s continuous quality improvement council. She described the benefits to nursing staff of
engaging patients in their work:
140
I think that nurses need to hear that patient's story…When nurses are engaged and hear
that, because we're all here to look after the patients, it makes more meaning, and they're
more engaged in the change rather than me saying, "Here you go, do this." …I think it's
hearing that patient's story is what will really make the change more meaningful and the
staff will be more engaged. (10B_NM_TH).
Participants from two hospitals spoke of the benefit of having staff engaged in evaluating
new processes. A manager of a small community hospital spoke of introducing a new program to
phone patients at home following their discharge from hospital, and ensuring that patients knew
the answers to questions about their follow-up care. She involved staff in evaluating the results
of the phone calls:
They're able to see, "Wow, why are we always missing this one question?” When you
keep seeing a tool that's going out the door and people are missing it, it makes it hit
home. You start focusing on, I need to make sure that I'm getting that question done.
Really ties it back around. It just brings a bit of ownership back home. (5A_NM_SCH)
A director of nursing at a small community hospital described the process of involving
staff in the evaluation of a new discharge pamphlet:
If we're deciding to change something, what we'll do is, we'll sit down, try to figure out
what the best way is to do it. Then, we'll involve the staff by saying this is going to be a
three month trial. Okay let’s see how you like it. If you don't we're going to sit down and
talk about what went right and what went wrong. I can tell you our discharge planning
pamphlet that we fill out has probably changed four times. Based on staff input.
(7A_SM_SCH)
These findings led to the eleventh proposition:
Proposition 11: Hospitals with internal absorptive capacity metaroutines to evaluate processes
with patients and staff will facilitate the uptake of health literate discharge practices.
The results and propositions of this study are illustrated in Figure 5.
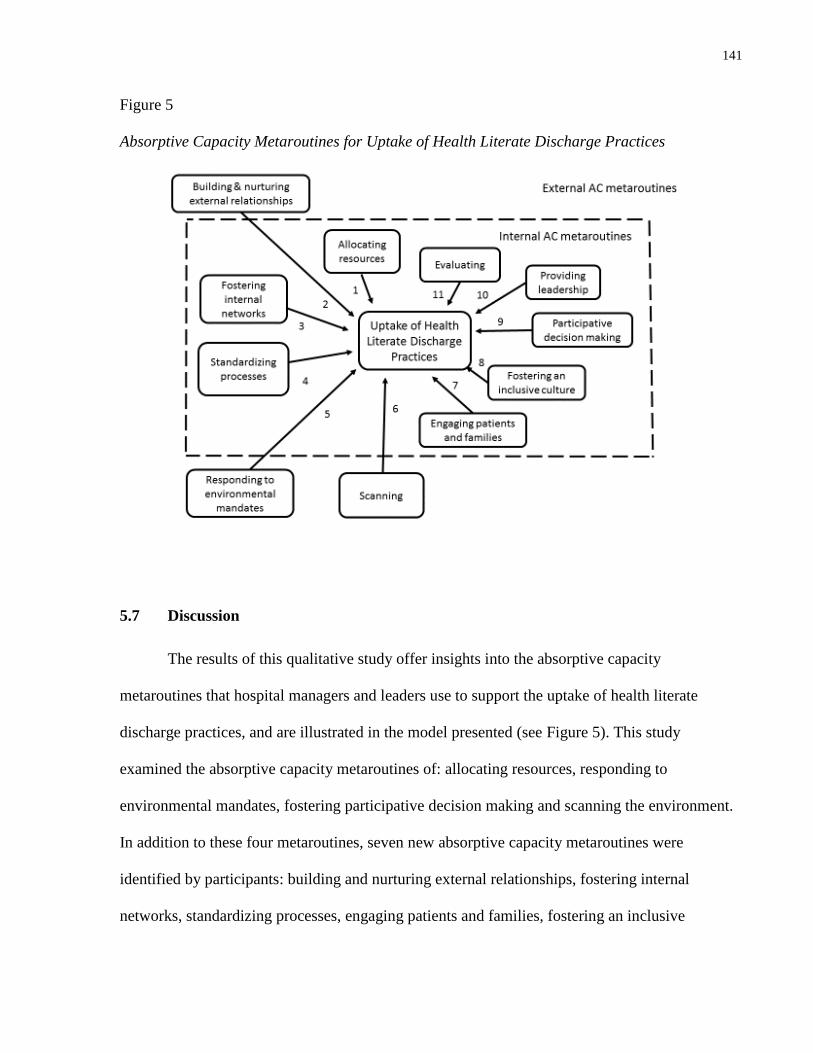
141
Figure 5
Absorptive Capacity Metaroutines for Uptake of Health Literate Discharge Practices
5.7 Discussion
The results of this qualitative study offer insights into the absorptive capacity
metaroutines that hospital managers and leaders use to support the uptake of health literate
discharge practices, and are illustrated in the model presented (see Figure 5). This study
examined the absorptive capacity metaroutines of: allocating resources, responding to
environmental mandates, fostering participative decision making and scanning the environment.
In addition to these four metaroutines, seven new absorptive capacity metaroutines were
identified by participants: building and nurturing external relationships, fostering internal
networks, standardizing processes, engaging patients and families, fostering an inclusive
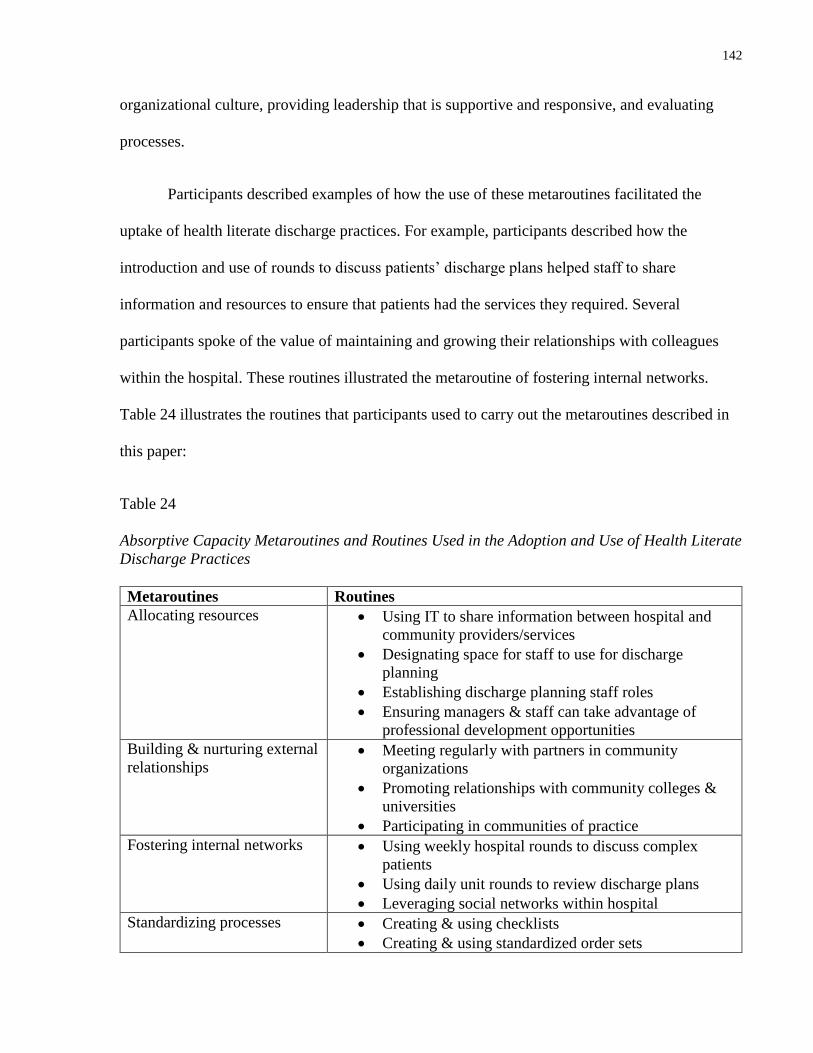
142
organizational culture, providing leadership that is supportive and responsive, and evaluating
processes.
Participants described examples of how the use of these metaroutines facilitated the
uptake of health literate discharge practices. For example, participants described how the
introduction and use of rounds to discuss patients’ discharge plans helped staff to share
information and resources to ensure that patients had the services they required. Several
participants spoke of the value of maintaining and growing their relationships with colleagues
within the hospital. These routines illustrated the metaroutine of fostering internal networks.
Table 24 illustrates the routines that participants used to carry out the metaroutines described in
this paper:
Table 24
Absorptive Capacity Metaroutines and Routines Used in the Adoption and Use of Health Literate
Discharge Practices
Metaroutines Routines
Allocating resources Using IT to share information between hospital and
community providers/services
Designating space for staff to use for discharge
planning
Establishing discharge planning staff roles
Ensuring managers & staff can take advantage of
professional development opportunities
Building & nurturing external
relationships Meeting regularly with partners in community
organizations
Promoting relationships with community colleges &
universities
Participating in communities of practice
Fostering internal networks Using weekly hospital rounds to discuss complex
patients
Using daily unit rounds to review discharge plans
Leveraging social networks within hospital
Standardizing processes Creating & using checklists
Creating & using standardized order sets
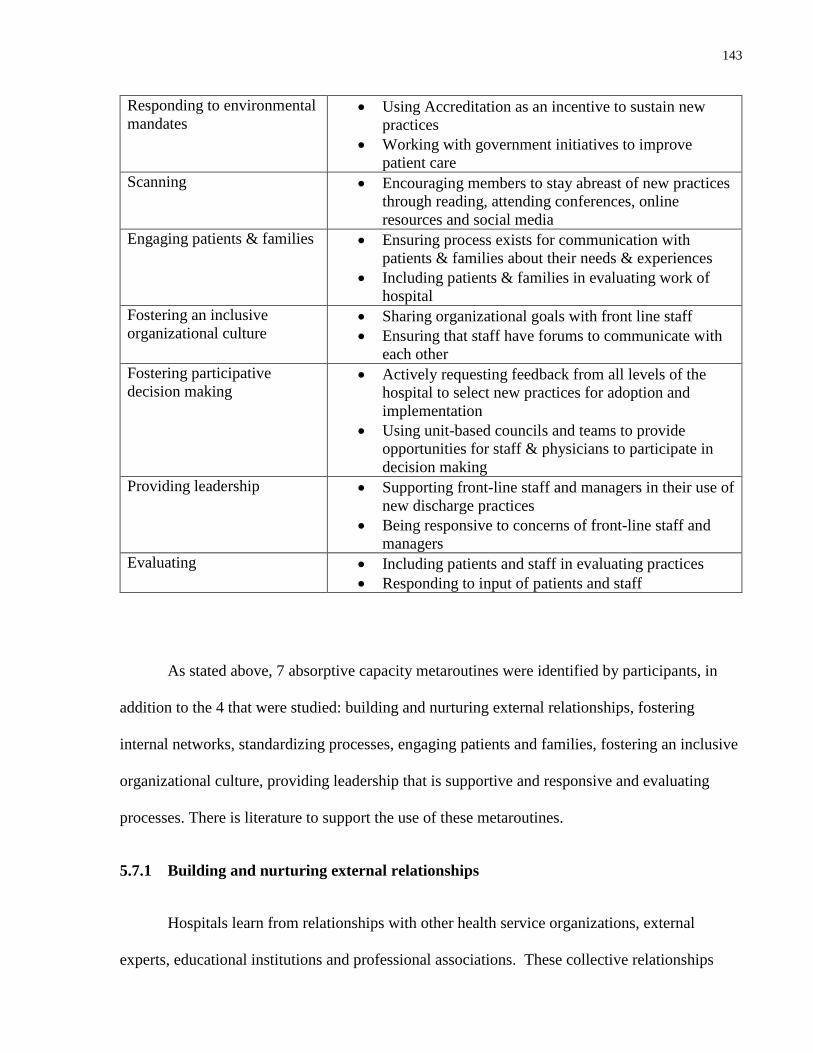
143
Responding to environmental
mandates Using Accreditation as an incentive to sustain new
practices
Working with government initiatives to improve
patient care
Scanning Encouraging members to stay abreast of new practices
through reading, attending conferences, online
resources and social media
Engaging patients & families Ensuring process exists for communication with
patients & families about their needs & experiences
Including patients & families in evaluating work of
hospital
Fostering an inclusive
organizational culture Sharing organizational goals with front line staff
Ensuring that staff have forums to communicate with
each other
Fostering participative
decision making Actively requesting feedback from all levels of the
hospital to select new practices for adoption and
implementation
Using unit-based councils and teams to provide
opportunities for staff & physicians to participate in
decision making
Providing leadership Supporting front-line staff and managers in their use of
new discharge practices
Being responsive to concerns of front-line staff and
managers
Evaluating Including patients and staff in evaluating practices
Responding to input of patients and staff
As stated above, 7 absorptive capacity metaroutines were identified by participants, in
addition to the 4 that were studied: building and nurturing external relationships, fostering
internal networks, standardizing processes, engaging patients and families, fostering an inclusive
organizational culture, providing leadership that is supportive and responsive and evaluating
processes. There is literature to support the use of these metaroutines.
5.7.1 Building and nurturing external relationships
Hospitals learn from relationships with other health service organizations, external
experts, educational institutions and professional associations. These collective relationships
144
form the hospital’s social capital. Several studies have found that a relationship with a university
(Everett & Sitterding, 2011; Olade, 2004; Plath, 2013) or with a professional association (Berta
et al., 2013; Parsons et al., 2013; Ploeg et al., 2007) was a facilitator to the use of research-based
evidence within health service organizations. In addition, two studies found that there was a
positive relationship between a hospital’s use of evidence and its teaching status (Okafor &
Thomas, 2008; Parsons et al., 2013).
In addition, both Ellen et al. (2013) and Berta et al. (2013) found that an important
resource for the introduction of evidence-based practice was the presence of external experts
who were able to teach staff and transfer knowledge into the organization.
Similar to communities of practice, the formation of collaboratives between organizations
has been found to be a facilitating factor to the uptake of new evidence. A 2003 study reported
on the development of a collaborative between multiple neonatal intensive care units in 34
different hospitals to improve quality and safety. The formation of this multidisciplinary
collaborative was found to be time-consuming, however, it was also found to help develop and
share tools and resources to make improvements (Horbar, Plsek, & Leahy, 2003). A
collaborative model was also a facilitating factor in the uptake of evidence-based safety practices
in Massachusetts hospitals. Hospital CEOs and team leaders reported that the collaborative
meetings offered the chance to learn from peer organizations (Leape et al., 2006).
Poor outcomes can result when hospitals and primary care organizations do not
communicate. Hesselink et al (2013) examined the use of evidence-based discharge practices in
five European countries. It was found that one of the barriers to providing optimal care
transitions between the acute and primary care sites was the lack of relationships between the
two settings. In the acute care setting, physicians and nurses stated they did not value
145
communication with primary care providers nor did they value what was considered
“administrative work,” which included planning a patient’s discharge and sending a discharge
summary or letter to the primary care provider. Physicians and nurses working in the community
expressed frustration that the acute care providers seemed to overestimate the information they
were given and the resources that were available. The lack of communication between the
settings was seen to contribute to a sense of exclusion between these two settings, and was
viewed as contributing to inefficient and ineffective care transitions for patients (Hesselink et al.,
2013).
5.7.2 Fostering internal networks
Internal networks are the formal and informal routes that members of an organization
may use to exchange information and communicate about innovations (Lewin, 2011). A
facilitator to adopting evidence-based practice is active encouragement on the part of the
organization to encourage its members to form networks. In a 2013 Canadian study that explored
the features of health service organizations that successfully took on new practices, participants
reported that the organizations created awareness of members with key expertise, and made it
easy for staff to form relationships with librarians, researchers and epidemiologists (Ellen et al.,
2013). In a study that compared the characteristics of high- and low-performing anticoagulation
clinics in Veteran Affairs’ hospitals in the United States, it was found that in the clinics with the
highest level of performance, that health care providers were openly encouraged to discuss and
seek advice about challenging patients (Rose et al., 2012).
The benefits of internal collaboration and multidisciplinary engagement in achieving
project goals were reported in the case studies of a hand hygiene strategy in a California teaching
hospital (Day, 2009) and the introduction of a new ventilation therapy mode into a neonatal
146
intensive care unit (Jackson, Vellucci, Johnson, & Kilbride, 2003). Internal collaboration was
also a key factor in the implementation of clinical practice guidelines in Ontario long-term care
homes (Berta et al., 2013) and in the uptake of multiple practice changes over a 4 year period in
a Canadian pediatric hospital (Kimber et al., 2012). Similarly, the development of CoPs
(communities of practice) within an Australian disability services organization helped members
to connect around practice topics and provided a way to communicate about evidence-based
changes (Plath, 2013).
5.7.3 Standardizing processes
The standardization of documentation and care processes has been done with goals of
promoting consistent practice, increasing organizational efficiency and delivering quality care
(Berta et al., 2010; Rose et al., 2012; Stoeckle-Roberts et al., 2006). The Contingency Model of
Innovation Adoption points out that the standardization and documentation of practices are
structural capabilities that promote the implementation and spread of innovations within
organizations (Berta et al., 2005).
Seven studies of evidence-based practice changes within health service organizations
found that standardized documentation in the form of patient or client assessment forms, flow
sheets, medication charting forms and checklists were associated with the uptake and
implementation of change (Berta et al., 2010; Dufault, 2004; Jackson et al., 2003; Ploeg et al.,
2007; Rose et al., 2012; Stoeckle-Roberts et al., 2006; Taylor, Hepworth, Buerhaus, Dittus, &
Speroff, 2007).
5.7.4 Engaging patients and families
147
Although traditionally this has not been the case, ideally, the adoption of evidence-based
practices takes into consideration the choices and values of patients and families, in other words,
the end users of health care services (Fineout-Overholt et al., 2004). When health care providers
collaborate with patients and families, there is evidence that patient safety, quality of care, and
patient satisfaction increases (Hesselink et al., 2012; Longtin et al., 2010; Oates, Weston, &
Jordan, 2000).
Two participants spoke of value of nurses engaging in bedside reporting with patients.
Nurses engage in reporting when patients’ care is being transferred between nursing staff, such
as at shift handover, or when a patient is being transferred to a different unit in the hospital.
Conventionally, this reporting has taken place in a staff lounge, the nursing station, or another
site away from the patient (Ferguson & Howell, 2015). When nurses engage in reporting at the
patient’s bedside, this has been found to increase patient satisfaction, and patients and families
are able to ask questions and to clarify points of care (Baker, 2010; Evans, Grunawalt, McClish,
Wood, & Friese, 2012; Tobiano, Chaboyer, & McMurray, 2013).
5.7.5 Fostering an inclusive culture
Organizational culture has been defined as the values and norms of an organization that
may be expressed in its behaviours and/or attitudes (Dobbins et al., 2002; Hesselink et al., 2013;
Kimber et al., 2012; Lukas et al., 2007). A 2010 study examined the introduction of evidence-
based clinical practice guidelines into long-term care homes in Ontario. A facilitator to the
adoption of the practice guidelines was having a learning culture in place, and a lack of a
learning culture was found to be a barrier to change (Berta et al., 2010).
148
A 2013 Canadian study interviewed managers, librarians and managers in three different
settings: administrative (provincial health authorities in Ontario and Quebec), acute care and
primary care. It was found that a culture that valued research and learning was fostered by
regular meetings held throughout the organization to present and share research evidence (Ellen
et al., 2013). In order for learning to take place across an organization, it is imperative that
there be an inter-organizational culture that fosters learning and teamwork between units
(Barnsley et al., 1998). In a four year case study of a Canadian pediatric hospital that
implemented multiple nursing best practice guidelines, it was found that an inclusive culture that
involved both direct care providers and management was a facilitator to introducing evidence-
based practices (Kimber et al., 2012).
An exclusive culture, that is, one in which there is a lack of collaboration between units,
can be a barrier to introducing an innovation. The 2004 study that examined the facilitators and
barriers to introducing a screening program to patients attending a medical clinic in a network of
six Veteran Affairs’ hospitals in the United States found that one of the barriers to the success of
this evidence-based practice change was poor communication between services, and in
particular, between the clinic and pharmacy staff (Sharp, Pineros, Hsu, Starks, & Sales, 2004).
5.7.6 Providing leadership
A 2015 study examined the implementation of Project RED in 10 hospitals in the United
States. Strong leadership was found to be associated with successful implementation. The two
hospitals that had the highest level of implementation fidelity had a senior leader on the
implementation team. This was perceived as sending a strong message to staff about the
importance of Project RED. In total, 8 of the sites were able to successfully implement the
practices contained in Project RED. Each of these sites had a team leader who was a middle
149
manager that was well respected and that reported directly to senior management. This was not
the case in the hospitals where implementation was not successful. In one hospital, the manager
did not report to senior management and lacked authority, and in the other hospital, the team
leader was a nurse educator who was not situated in a position to work effectively with hospital
physicians or to coordinate needed IT resources (Mitchell et al., 2016).
The support of leaders and managers has been consistently found to increase the uptake
and implementation of evidence-based practice in nursing care settings. According to the
Contingency Model of Innovation Adoption, the characteristics of clinical leaders may influence
knowledge transfer (Berta et al., 2005). Although this model refers to long-term care settings,
this relationship has been demonstrated in a number of studies in other settings.
A 4 year case study of a Canadian pediatric hospital that implemented multiple nursing
best practice guidelines found that nursing, administrative and managerial staff reported that the
role of leadership was essential to the adoption of the guidelines (Kimber et al., 2012).
In a large survey of clinicians and case managers (n= 303) working in 49 mental health
service organizations in California, it was found that there was a significant relationship between
positive rankings of organizational leadership and positive attitudes towards evidence-based
practice (Aarons, 2006).
In the Massachusetts statewide hospital initiative, it was found that successful
implementation of the practice change within hospitals was correlated with the active
involvement and participation of a senior administrator (Leape et al., 2006). This positive
relationship between leadership and adoption of change was echoed in the survey of pharmacy
directors that examined the relationship between “innovation adoption elements” and the use of
150
evidence-based practices. It was found that the receptivity of leadership roles to change was
significantly associated with the number of innovation adoption elements that were in place
(Okafor & Thomas, 2008).
5.7.7 Evaluating
Once an organization has adopted and implemented an innovation, it needs to evaluate its
use. In this study, the metaroutine of evaluating is synonymous to the metaroutines of reflecting
and updating that Lewin et al (2011) describe. According to Lewin et al (2011), the metaroutines
of reflecting and updating allow an organization to evaluate the utility of an innovation.
Reflecting and updating are necessary precursors to replication or spread, since they allow an
organization to study the relationship between the application of knowledge and its influence on
performance.
Evaluating, or reflecting and updating, needs to include collecting and using feedback
from organizational members. The evaluation of practice changes in a disability services
organization in Australia demonstrates the importance of involving front-line staff in the
evaluation process. Their feedback was essential to discerning contextual factors that influenced
the implementation of changes. In addition, Plath et al (2013) highlight the need to demonstrate
to front-line staff that changes are adapted in response to their feedback. These routines of
evaluating and obtaining feedback from front-line staff not only help to adapt the use of
evidence-based practices, they also help to ensure the use and growth of new knowledge (Lewin
et al., 2011).
5.8 Barriers to the use of health literate discharge practices
151
Barriers to the use of health literate discharge practices were described in the interviews.
For example, although all of the interviews took place in hospitals that used electronic health
records, half of the hospitals relied on the use of facsimile to communicate with community
providers, and on the use of carbon paper for writing patients’ discharge instructions. In other
industries, the use of facsimile and carbon paper are regarded as antiquated modalities. Clearly,
there is a need for hospitals in Ontario to adopt new modes of communication to ensure that
community providers are able to help patients in their transition from the hospital to the
community, and to guarantee that patients and families have a clear record of discharge
instructions.
Another barrier to the use of health literate discharge practices was workload.
Participants who worked in managerial roles felt that staffing was adequate. However, this view
was not shared by participants in non-managerial roles who viewed health literate discharge
practices as being valuable, and who also identified workload as being a barrier to their use.
While the intraprofessional team is involved in planning and carrying out hospital
discharge, it is the nurse who holds the primary responsibility for discharge teaching (Bobay,
Bahr, Weiss, Hughes, & Costa, 2015; McHugh et al., 2013; S. Stevens, 2015). There is evidence
supporting the relationship between nurse staffing in hours per patient day and the quality of
patients’ preparation for discharge and their subsequent hospital readmission and emergency
department use within 30 days of discharge (Nosbusch, Weiss, & Bobay, 2011; Weiss,
Yakusheva, & Bobay, 2011). Nosbusch et al (2011) point out that the role of nursing in hospital
discharge is crucial, however nurses are not given the resources they need, in terms of time and
decreased workload, to educate patients and families prior to discharge. Several participants
echoed this finding. If the uptake of health literate discharge practices is to be successful, it is
152
imperative that nurse to patient staffing ratios allow for nurses to execute them (Bobay et al.,
2015).
In addition, ensuring that staff and managers are able to take advantage of professional
development opportunities is known to increase the adoption and use of evidence-based practices
(Berta et al., 2013; Ellen et al., 2013; Greenhalgh et al., 2004). However, only managers had
ready access to the resources of time and money to attend conferences or to take courses. Front-
line staff were encouraged to attend educational events on their days off, and managers described
only how they were willing to re-arrange schedules for staff. In this era of fiscal constraint, these
are barriers that will require an examination of how current resources are being used.
This study highlights the need to be cognizant of the absorptive capacity metaroutines
and routines that are highlighted in Table 24. Participants described how the routines listed led to
improved discharge processes for patients and families, such as through sharing tools and
resources within the hospital and between organizations. They led to improved communication
within and between teams, as well as improved communication between staff and patients and
families.
5.9 Limitations
A limitation to this study was that two of the small community hospitals had only one
participant. A goal of this study was to interview two health care providers or managers at each
of the hospitals. At one of the small community hospitals, a participant refused to be interviewed
despite agreeing to the interview previously. At the second community hospital, a second
participant was not available on the scheduled date. This limited the amount of data that could be
collected from these two hospitals for this study.
153
Triangulation was not used in this study. The findings from the interviews could be
triangulated with objective measures such as patient satisfaction with discharge processes, as
measured by the Picker© survey that is used by hospitals in Ontario. In addition, questions
related to “therapeutic self care – readiness for discharge” are asked of inpatients in a number of
Ontario hospitals as part of the HOBIC program (Health Outcomes for Better Information and
Care), an initiative of ICES (Institute for Clinical Evaluative Sciences). This data could have
been used for triangulation purposes.
5.10 Future research
In two recent studies of the characteristics of high performing hospitals, performance
monitoring and establishing clear lines of accountability were identified as being key (Luxford,
Safran, & Delbanco, 2011; Taylor, Clay-Williams, Hogden, Braithwaite, & Groene, 2015). In
addition, the 2015 study that examined the implementation of Project RED in hospitals in the
United States found that successful implementation of Project RED was associated with creating
accountability for performance (Mitchell et al., 2016)
Other than identifying accreditation as a driver to monitor hospital care and to introduce
new practices, participants did not describe if and how performance is monitored in the hospital.
Performance measurement, as through the use of an organizational survey, is integral to the
adoption of health literate practices. As organizations, hospitals need to be able to assess current
levels of performance in order to take on new practices and measure changes in performance
(Kripalani et al., 2014).
154
In addition, participants did not speak of accountability. This may be a limitation of the
interview guide that did not examine the use of accountability, however, it may also indicate that
there is a lack of accountability in the hospitals where the interviews took place.
Finally, there is a need to understand how health care organizations sustain such
practices. While it may seem self-evident that the use of the absorptive capacity metaroutines
described in this study would lead to continued growth and change within the organization, there
is a need for longitudinal research to demonstrate this relationship
The model that is presented in Figure 5 includes the absorptive capacity metaroutines that
hospitals in the study used to adopt and implement health literate discharge practices. However,
this model could be extended to the adoption and use of any evidence-based practice. Examining
the use of absorptive capacity metaroutines in health care organizations can be used to gauge
whether they have the capacity to take on and successfully implement evidence-based practices.
Furthermore, examining how different health care organizations use absorptive capacity
metaroutines could be used to understand why health care organizations have different
experiences with the implementation of evidence-based practices.
.
155
Chapter 6:
Relationships between Organizational Characteristics and Use of Health
Literate Discharge Practices in Ontario Hospitals
6.1 Background
To hospitals that have yet to incorporate such practices, health literate discharge
practices represent an innovation – as does any knowledge, including evidence based practices,
that is encountered by an organization for the first time (Damanpour et al., 2009; Panzano &
Roth, 2006). When an organization such as a hospital adopts and implements an innovation, it is
engaging in organizational learning. For implementation of an innovation to succeed, and for
learning to occur that is beneficial or that improves performance, an organization needs to have
resources available to members (Argote, 2012; Berta et al., 2013).
Size, teaching status, and location are characteristics of hospitals that have been
associated with their organizational performance and their uptake and use of innovations
(Damanpour, 1992; Dijkstra et al., 2006; Dupree, Neimeyer, & McHugh, 2014; Greenhalgh et
al., 2004; Heidenreich, Zhao, Hernandez, Yancy, & Fonarow, 2012). A recent systematic review
found that there was a lack of high quality evidence for a relationship between the organizational
characteristics of hospitals and performance (Brand, Barker et al., 2014). In addition, there is a
lack of research on the relationship between hospital characteristics and performance, including
uptake of innovation, in the Canadian context. The purpose of this study was to examine the
relationship between the organizational characteristics of hospitals and one aspect of their
performance; their use of health literate discharge practices as reflected by their score on the
survey developed and administered in earlier chapters.
6.2 Theory and hypotheses
156
6.2.1 Organizational characteristics and hospital readmission
There has been limited study of organizational characteristics associated with hospital
readmission. A recent study of hospitals in the United States examined the relationship between
hospital characteristics including number of hospital beds, financial status (that is, non-profit,
for-profit, or government), and medical school affiliation and found that these three
characteristics accounted for less than 1% of hospital readmissions (Singh, Lin, Kuo, Nattinger,
& Goodwin, 2014). An earlier study examined the relationship between hospital characteristics
and readmission of patients who had an index hospitalization for acute myocardial infarction or
heart failure. Hospital characteristics were defined as number of hospital beds, ownership
(government, non-profit or propriety), teaching status and availability of bypass surgery in the
hospital. This study found that these four characteristics accounted for less than 3% of hospital
readmissions for these patients (Krumholz et al., 2009). Neither of these studies examined
discharge practices and the findings are limited by the focus on a small number of explanatory
variables.
Hospital size has been found to be related to 30-day readmission. Smaller hospitals are
found to have higher readmission rates than larger hospitals in Ontario, however small hospitals
have a higher proportion of medical patients and this may be a reason for this relationship
(Canadian Institute for Health Information, 2012).
6.2.2 Slack resources and organizational size
Slack resources refer to those resources or capacities that are not needed by the
organization to meet the organization’s immediate demands, but can be used to allow the
organization to learn, change and make adaptations to new and existing processes (Cohen et al.,
1972; Cyert & March, 1963; Lawson, 2001). For implementation of an innovation to succeed,
157
the organization needs to have resources or tools available to members of the organization
(Argote, 2012; Berta et al., 2013). While it is difficult to measure slack directly (Nohria &
Gulati, 1996), organizational size may be considered as a proxy measure. The presence of slack
resources, and larger organizational size, have been associated with increased research utilization
and adoption of innovations (Cummings, Estabrooks, Midodzi, Wallin, & Hayduk, 2007;
Damschroder et al., 2009; Greenhalgh et al., 2004; Jiménez-Jiménez & Sanz-Valle, 2011).
Organizational size may be positively correlated with innovation development and use because
larger organizations may have more resources to invest in examining and using new knowledge
(Damschroder et al., 2009; Greenhalgh et al., 2004; Jimenez-Jimenez & Sanz-Valle, 2011).
The positive relationship between organizational size and increased research utilization
and adoption of innovations was found in a 1992 meta-analysis, although the positive effect was
more pronounced in organizations that were for-profit and focused on manufacturing, compared
to organizations that were non-profit and service-oriented. In addition, Damanpour et al (1992)
found that there were both benefits and drawbacks to having a large organizational size. While
large organizations had more resources to invest in innovation and learning, they also had larger
administrations that were less receptive to change. The authors also found that organizational
research typically used number of personnel to measure size, instead of examining volume
measures of size (Damanpour, 1992).
A more recent meta-analysis of 53 studies that built on this 1992 paper found that there
was a clear significant, relationship between increased organizational size and increased
innovation (Camisón-Zornoza, Lapiedra-Alcamí, Segarra-Ciprés, & Boronat-Navarro, 2004).
158
Similarly, a 2006 study of 1200 public organizations in the United States, Damanpour and
Schneider found that there was a positive relationship between organizational size and all stages
of innovation adoption (Damanpour & Schneider, 2006).
However, this positive relationship has not been consistently found in the non-profit
sector and specifically, with hospitals. In a study of the relationship between administrative and
technological innovation with size in 79 non-profit organizations in the United States, size was
not found to be a significant predictor of innovation (Jaskyte, 2013).
Two studies examining the relationship between hospital size and use of best practices
had divergent results. A 2012 study of hospitals in the United States looked at the relationship
between the use of four quality measures for heart failure patients, including the use of patient
discharge instructions. Hospitals with fewer than 200 beds had the lowest levels of performance
on all measures (Heidenreich et al., 2012). In a study that examined the relationship between
performance on quality care measures and hospital characteristics, small hospital size was found
to be associated with higher performance scores (Dupree et al., 2014). Another study of
hospitals in the United States did not provide clarification on this point. This study examined the
relationship between hospital characteristics and performance on clinical care measures, and
found that the hospitals with the highest performance had less than 100 beds, or more than 200
beds (Lehrman et al., 2010).
A 2013 study examined the uptake and usage of evidence-based protocols in long term
care homes in Ontario. Organizational size was associated with approaches to protocol
implementation, but no significant relationship was found between organizational size and
protocol use (Berta et al., 2013).
159
Although there appears to be a clear positive relationship between organizational size and
innovation in the manufacturing and service sectors, the relationship is not as clear for hospitals.
Furthermore, with respect to performance outcomes, there is conflicting evidence of a positive
and negative relationship between organizational size and performance in hospitals. While it was
anticipated that a significant relationship would be found, the nature of this relationship is
unknown.
Hypothesis 1. There is a significant relationship between organizational size and the health
literate survey score.
Although the presence of slack resources has been found to be associated with greater
organizational learning and adoption of innovations, a high level of slack resources has been
associated with poor performance, with respect to learning and innovation. It has been theorized
that an abundant supply of slack resources may indicate waste and inefficiency (Leibenstein,
1969; Williamson, 1964). An inverted U-shaped relationship has been found between the
presence of slack resources and innovation in multinational manufacturing and for-profit service
organizations, suggesting that while slack resources may enhance innovation, extreme levels
may detract from it (Geiger & Cashen, 2002; Nohria & Gulati, 1996). There are no published
studies that this author has found that have looked for such a relationship in non-profit
organizations or hospitals.
Hypothesis 2. The nature of the relationship between organizational size and health literate
survey score is non-monotonic.
6.2.3 Hospital teaching status and performance

160
Similar to the relationship between size and performance, there have been inconsistent
findings when the relationship between performance and teaching status of hospitals is
examined. As noted in the preceding section, teaching status was one of the characteristics
included in the two studies that examined the relationship between hospital characteristics and
readmission. Teaching status was not found to have a strong relationship with the performance
measure of hospital readmission (Krumholz et al., 2009; Singh et al., 2014).
Two studies that examined the relationship between teaching status and performance
found opposing results. The 2012 study that examined the relationship between the use of quality
measures for heart failure patients, found that higher performance was associated with teaching
status (Heidenreich et al., 2012). Conversely, in the study that examined the relationship between
performance on quality care measures and hospital characteristics, non-teaching status was found
to be associated with higher performance scores (Dupree et al., 2014).
A 2006 meta-analysis examined 53 trials that evaluated the influence of organizational
characteristics on the implementation of clinical practice guidelines. All of the trials examined
provider behaviour and patient outcomes as a measure of implementation. The only
organizational characteristic that was found to have an association with implementation was
teaching status. When compared to community hospitals, teaching hospitals had greater
improvements in patient care (Dijkstra et al., 2006).
Being affiliated with a medical school would appear to offer resources to hospitals.
Several studies have found that a relationship with a university is a facilitator to the use of best
practices within health care organizations (Everett & Sitterding, 2011; Olade, 2004; Plath, 2013).
161
Hypothesis 3. Hospitals with teaching status have significantly higher health literate survey
scores than non-teaching hospitals.
6.2.4 Location and organizational performance and uptake of innovation
The geographical location of a hospital may have an influence on its performance
outcomes and its uptake of new practices. Different regions may have different funding sources
as well as different priorities (OECD, 2014). Using hospital readmission as an indicator of
performance, there are significant differences in readmission rates, ranging from 13 to 18%,
among the 14 LHINs in Ontario (Baker, 2011). The different levels of resources between
locations may be contributing to this difference.
Regional differences, and differences between rural and urban settings, have been found
in studies of performance outcomes in hospitals in the United States. In the study that examined
the relationship between surgical performance and hospital characteristics, hospitals that were
located in non-rural locations and in the Northeast and Southern states were found to have higher
performance scores (Dupree et al., 2014). The positive relationship between performance and
non-rural locations was also found in a 2007 study of the relationship between urban and rural
hospitals on quality performance indicators (Lutfiyya et al., 2007).
Conversely, Lehrman et al (2010) found that rural location was positively associated with
performance on clinical care measures. This study also found a regional affect, with location in
the New England or West North Central census areas being associated with the highest levels of
performance (Lehrman et al., 2010).
162
A 2008 study examined the adoption of information technology in Florida hospitals. It
found that geographic location was not associated with adoption of information technology
(Hikmet, Bhattacherjee, Menachemi, Kayhan, & Brooks, 2008).
Hypothesis 4. There is a relationship between the hospital’s geographic location and the health
literate survey score.
6.3 Methods
6.3.1 Sample
The survey measuring use of health literate discharge practices was administered to 143
acute care hospitals in Ontario. Seventy nine hospitals responded, and it is these hospitals that
constitute the sample for this study. The participation rate for hospitals in Ontario was 55%.
6.3.2 Dependent variable: health literate survey score
The dependent variable for this analysis is the health literate survey score generated from
the responses to a 36-item survey measuring use of health literate discharge practices.
Participants were asked to rate the use of 36 practices with a 5-point Likert scale. The survey had
a possible score range of 36 to 180.
As described in Chapter 3, there were multiple responses from 12 hospitals. For each of
these hospitals, the median value for the health literate survey score was used.
6.3.3 Independent variables
6.3.3.1 Organizational size
163
Three variables were considered as measures of organizational size. The first two
variables were measures of the acute and total number of beds for each hospital. This data was
obtained from the Canadian Institute of Health Information’s (CIHI) Canadian Management
Information Systems Database that is available online, and refers to the number of beds staffed
and in operation in the 2013-2014 fiscal year. The acute number of beds includes intensive care
and other acute. “Other acute” includes all acute care beds that are not intensive care beds. The
total number of beds includes intensive care, obstetrics, pediatrics, psychiatric, rehabilitation,
long-term care and other acute (Canadian Institute for Health Information, 2015). The third
variable examined as a measure of organizational size was hospital budget for the 2014-2015
fiscal year. This data was obtained from the Ontario Hospital Association. As will be described
in the results section, the measure of acute care beds was ultimately used.
6.3.3.2 Teaching status
Teaching hospitals are affiliated with medical schools. There are 15 teaching hospitals
and 128 non-teaching hospitals in Ontario. Both large and small community hospitals are
considered non-teaching hospitals (Ministry of Health and Long-Term Care, 2013a, 2013b,
2013c). Dummy coding was used for this variable. Teaching was coded as 0 and non-teaching
was coded as 1.
6.3.3.3 Location
This refers to the geographical location where the hospital is located. This study defined
location with the categorical variable of region and the continuous variable of rurality.
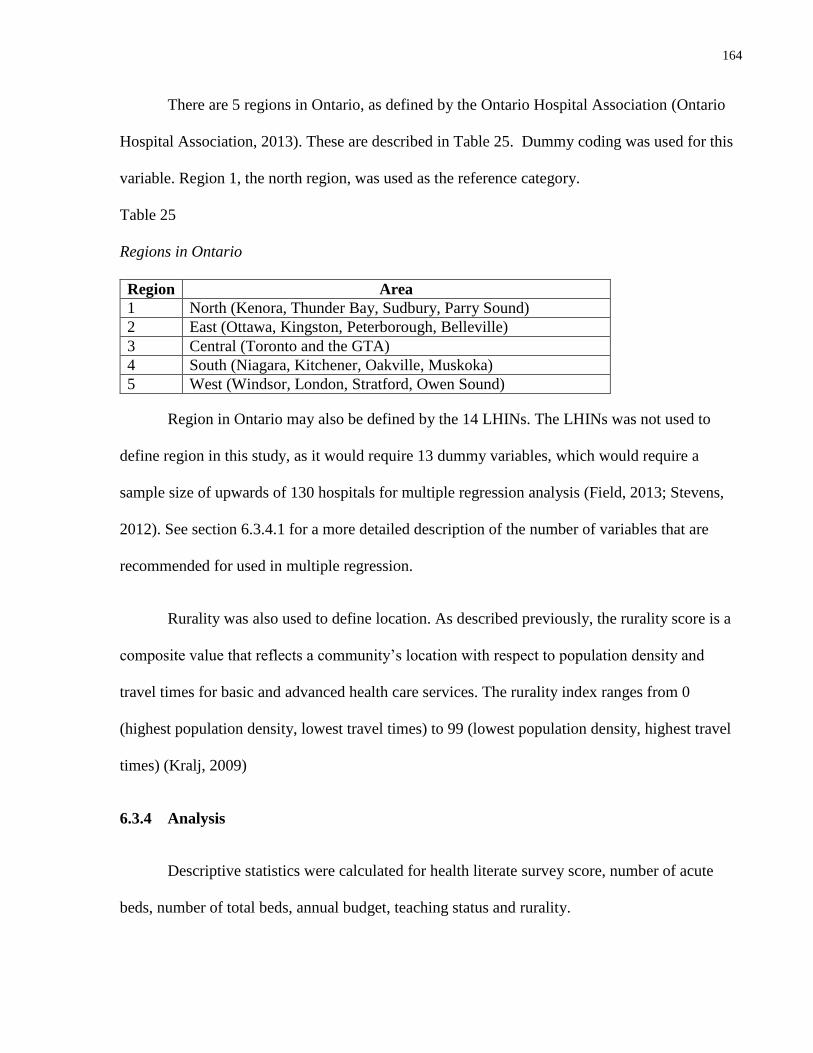
164
There are 5 regions in Ontario, as defined by the Ontario Hospital Association (Ontario
Hospital Association, 2013). These are described in Table 25. Dummy coding was used for this
variable. Region 1, the north region, was used as the reference category.
Table 25
Regions in Ontario
Region Area
1 North (Kenora, Thunder Bay, Sudbury, Parry Sound)
2 East (Ottawa, Kingston, Peterborough, Belleville)
3 Central (Toronto and the GTA)
4 South (Niagara, Kitchener, Oakville, Muskoka)
5 West (Windsor, London, Stratford, Owen Sound)
Region in Ontario may also be defined by the 14 LHINs. The LHINs was not used to
define region in this study, as it would require 13 dummy variables, which would require a
sample size of upwards of 130 hospitals for multiple regression analysis (Field, 2013; Stevens,
2012). See section 6.3.4.1 for a more detailed description of the number of variables that are
recommended for used in multiple regression.
Rurality was also used to define location. As described previously, the rurality score is a
composite value that reflects a community’s location with respect to population density and
travel times for basic and advanced health care services. The rurality index ranges from 0
(highest population density, lowest travel times) to 99 (lowest population density, highest travel
times) (Kralj, 2009)
6.3.4 Analysis
Descriptive statistics were calculated for health literate survey score, number of acute
beds, number of total beds, annual budget, teaching status and rurality.
165
Hierarchical linear regression was used to examine the relationship between
organizational size and health literate survey score, and to determine if there was a significant
non-monotonic relationship between these variables.
Linear regression was used to examine the relationship between teaching status and
health literate survey score, region and health literate survey score, and rurality and health
literate score.
Stepwise backward multiple regression was used to examine the relationship between
organizational size, teaching status and region with the health literate survey score. Stepwise
backward multiple regression was also used to examine the relationship between organizational
size, teaching status and rurality with the health literate survey score. Region and rurality were
examined in separate analyses as they are both measures of location. The advantage of using
stepwise regression is that it obtains the best combination of predictors that have the greatest
variance (Field, 2013, Meyers et al., 2013)
6.3.4.1 Consideration of number of variables in analysis
For multiple regression analysis, it is recommended that there be 10-15 cases per
predictor in the model file (Field, 2013; Stevens, 2012). Other authors are more conservative,
and recommend that the sample size be equivalent to, or greater than, 50 + 8*(number of
independent variables) (Green, 1991; Nelson & Rudestam, 1999). There were 79 hospitals that
responded to the organizational survey. The conservative approach would be to limit the number
of variables to 3 with this sample size (Green, 1991; Nelson & Rudestam, 1999). The approach
in this analysis was to use the recommendations of Field (2013) and Stevens (2012) and limit the
number of variables to 7 or less.
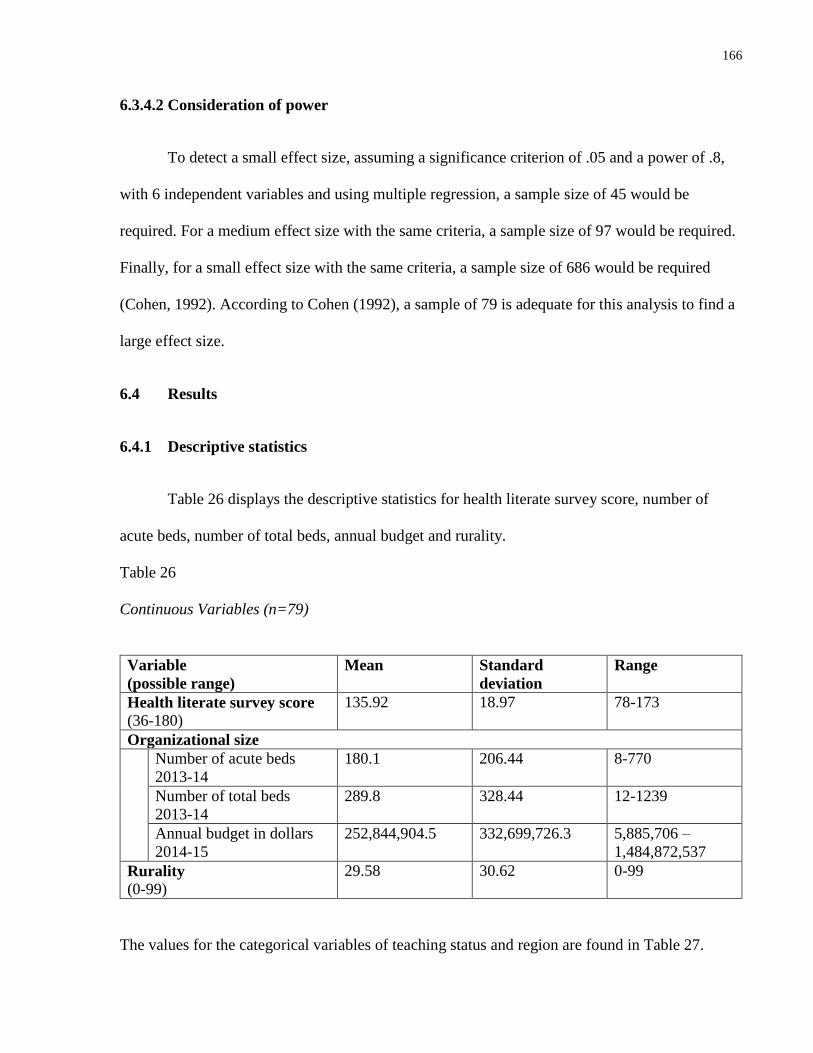
166
6.3.4.2 Consideration of power
To detect a small effect size, assuming a significance criterion of .05 and a power of .8,
with 6 independent variables and using multiple regression, a sample size of 45 would be
required. For a medium effect size with the same criteria, a sample size of 97 would be required.
Finally, for a small effect size with the same criteria, a sample size of 686 would be required
(Cohen, 1992). According to Cohen (1992), a sample of 79 is adequate for this analysis to find a
large effect size.
6.4 Results
6.4.1 Descriptive statistics
Table 26 displays the descriptive statistics for health literate survey score, number of
acute beds, number of total beds, annual budget and rurality.
Table 26
Continuous Variables (n=79)
Variable
(possible range)
Mean Standard
deviation
Range
Health literate survey score
(36-180)
135.92 18.97 78-173
Organizational size
Number of acute beds
2013-14
180.1 206.44 8-770
Number of total beds
2013-14
289.8 328.44 12-1239
Annual budget in dollars
2014-15
252,844,904.5 332,699,726.3 5,885,706 –
1,484,872,537
Rurality
(0-99)
29.58 30.62 0-99
The values for the categorical variables of teaching status and region are found in Table 27.
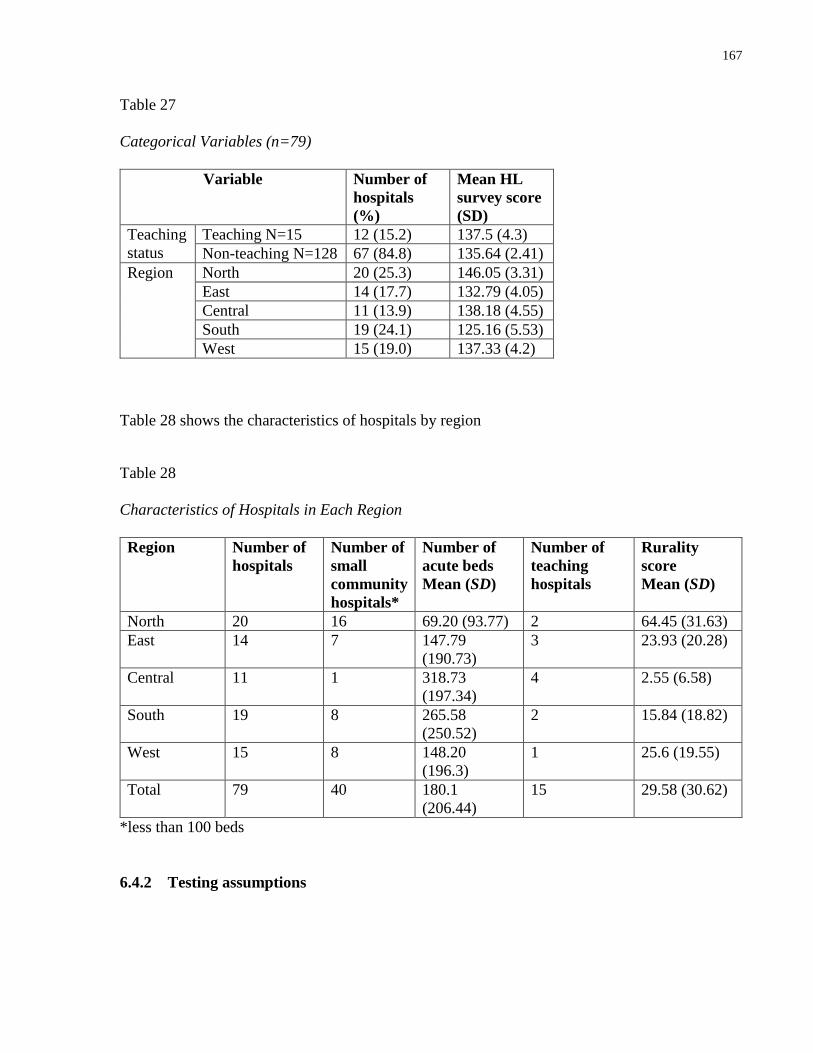
167
Table 27
Categorical Variables (n=79)
Variable Number of
hospitals
(%)
Mean HL
survey score
(SD)
Teaching
status
Teaching N=15 12 (15.2) 137.5 (4.3)
Non-teaching N=128 67 (84.8) 135.64 (2.41)
Region North 20 (25.3) 146.05 (3.31)
East 14 (17.7) 132.79 (4.05)
Central 11 (13.9) 138.18 (4.55)
South 19 (24.1) 125.16 (5.53)
West 15 (19.0) 137.33 (4.2)
Table 28 shows the characteristics of hospitals by region
Table 28
Characteristics of Hospitals in Each Region
Region Number of
hospitals
Number of
small
community
hospitals*
Number of
acute beds
Mean (SD)
Number of
teaching
hospitals
Rurality
score
Mean (SD)
North 20 16 69.20 (93.77) 2 64.45 (31.63)
East 14 7 147.79
(190.73)
3 23.93 (20.28)
Central 11 1 318.73
(197.34)
4 2.55 (6.58)
South 19 8 265.58
(250.52)
2 15.84 (18.82)
West 15 8 148.20
(196.3)
1 25.6 (19.55)
Total 79 40 180.1
(206.44)
15 29.58 (30.62)
*less than 100 beds
6.4.2 Testing assumptions
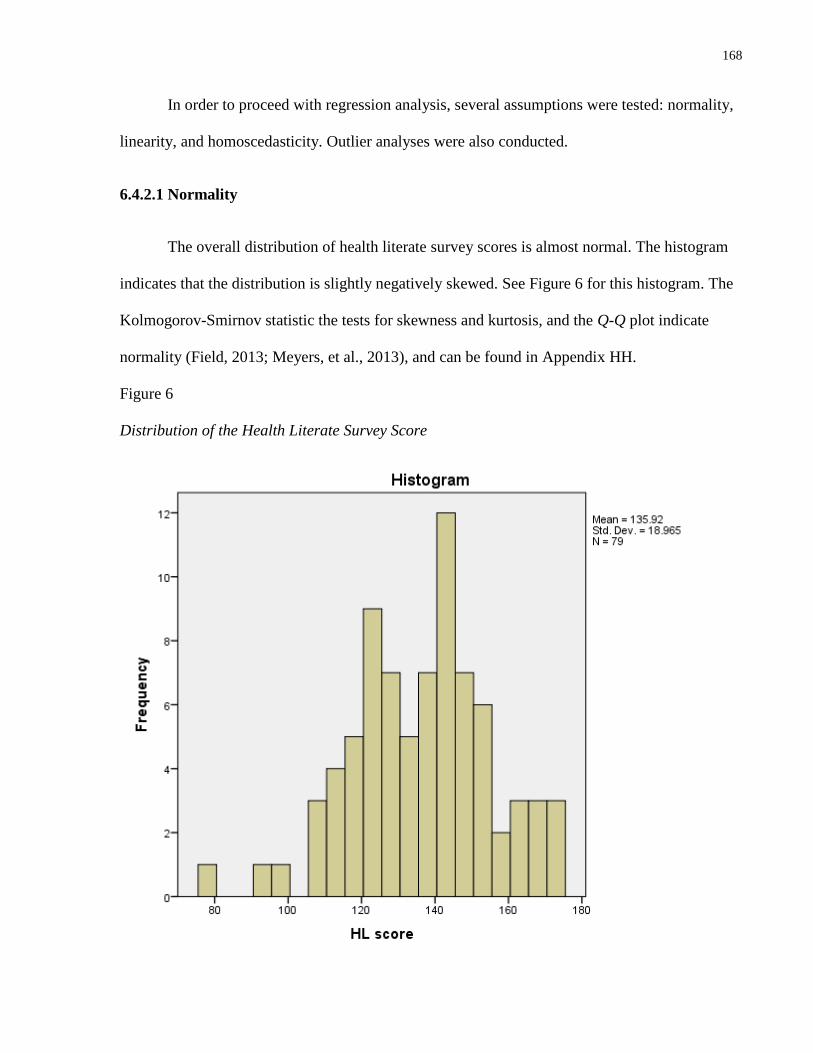
168
In order to proceed with regression analysis, several assumptions were tested: normality,
linearity, and homoscedasticity. Outlier analyses were also conducted.
6.4.2.1 Normality
The overall distribution of health literate survey scores is almost normal. The histogram
indicates that the distribution is slightly negatively skewed. See Figure 6 for this histogram. The
Kolmogorov-Smirnov statistic the tests for skewness and kurtosis, and the Q-Q plot indicate
normality (Field, 2013; Meyers, et al., 2013), and can be found in Appendix HH.
Figure 6
Distribution of the Health Literate Survey Score
169
The distribution of health literate survey scores is normal for teaching, non-teaching
hospitals, as well as each of the 5 regions. See Appendix II for the histograms, the Kolmogorov-
Smirnov statistics, the tests for skewness and kurtosis, and the Q-Q plots (Field, 2013; Meyers et
al., 2013).
The distributions of number of acute care beds, total number of beds, budget and rurality
scores are non-normal, and positively skewed. Because the distributions are positively skewed,
they were transformed with a base-10 logarithm to achieve normality (Meyers et al., 2013). This
transformation created distributions that were almost normal, and that demonstrated kurtosis.
For the measure of organizational size, the distribution for the log transformation of the
number of acute beds had the least amount of kurtosis (-1.07). This was less than the log
transformation of the budget (-1.26) and the log transformation of the number of acute beds
(-1.13). Because of this, the log transformation of the number of acute beds was determined to
be the best measure of organizational size.
For the measure of location, a log transformation of rurality was calculated. Log
transformations cannot be done for values of zero, and there were 19 hospitals that had a rurality
of zero. To conduct the log transformation, a constant measure of 1 was added to each value in
the rurality distribution. The log transformation of the rurality score was found to be almost
normal. It was slightly negatively skewed with a skewness of -.48. This level is suitable for
analysis, as several authors recommend that a conservative threshold for skewness lies between
the values of -0.5 and +0.5 (Hair, Black, Babin, & Anderson, 2010; Meyers et al., 2013; Runyon,
Coleman, & Pittenger, 2000).
170
See Appendix JJ for descriptive statistics and histograms for the tests of normality of
acute care beds, total number of beds, budget and rurality, and the base-10 logarithm
transformations of these independent variables.
6.4.2.2 Linearity
Scatterplots were generated to determine if there was a linear relationship between the
independent variable (log transformation of number of acute beds) and the dependent variable
(health literate survey score), and if there was a linear relationship between the independent
variable (log transformation of rurality) and the dependent variable (health literate survey score).
No linear relationships were found. See Appendix KK for the scatterplots.
6.4.2.3 Homoscedasticity
Examination of the residual scatter plot did not support the assumption of
homoscedasticity.
6.4.2.4 Outlier analysis
Outlier analysis, using the three residual statistics: standardized residuals, Cook’s
distance and Leverage, revealed no influential data points or outliers.
6.4.2.5 Multicollinearity
The correlation between the log transformation of the number of acute beds and the
health literate survey score was -.223, p = .02. This indicates that there is a small negative
correlation between the number of acute beds and the health literate survey score. The
correlations between the log transformation of rurality and the health literate survey score was
.13 and this value was non-significant. This indicates that there is a lack of correlation between
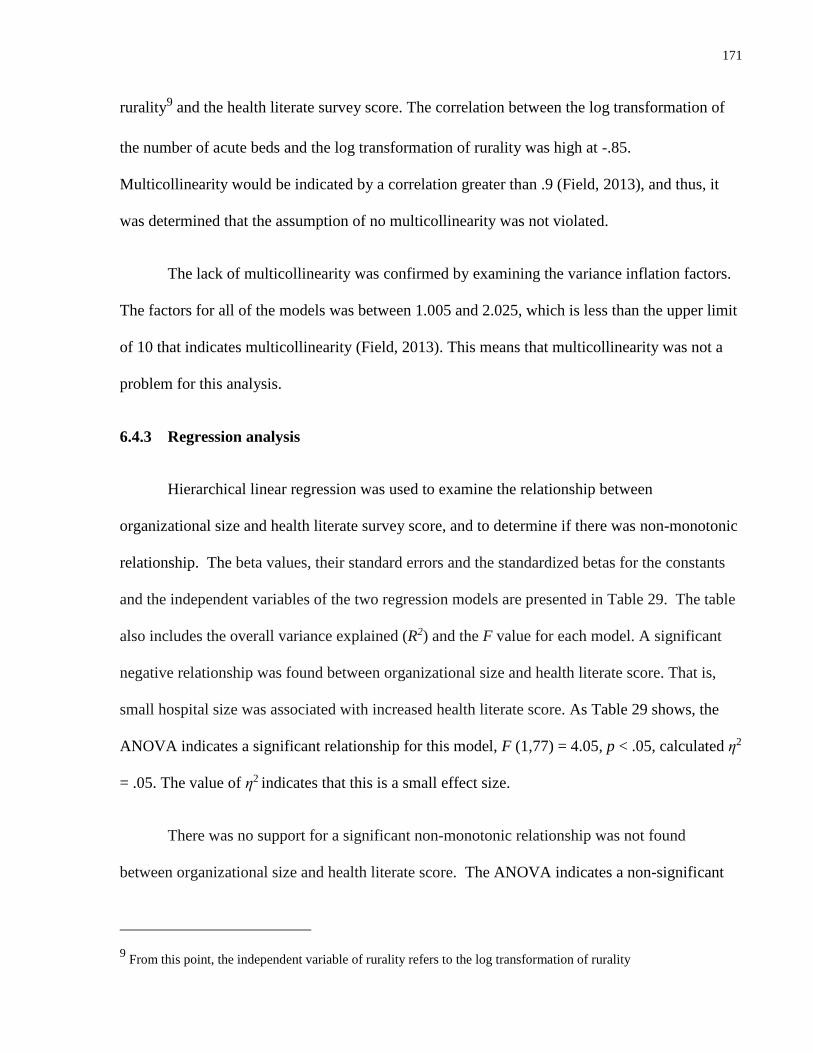
171
rurality9 and the health literate survey score. The correlation between the log transformation of
the number of acute beds and the log transformation of rurality was high at -.85.
Multicollinearity would be indicated by a correlation greater than .9 (Field, 2013), and thus, it
was determined that the assumption of no multicollinearity was not violated.
The lack of multicollinearity was confirmed by examining the variance inflation factors.
The factors for all of the models was between 1.005 and 2.025, which is less than the upper limit
of 10 that indicates multicollinearity (Field, 2013). This means that multicollinearity was not a
problem for this analysis.
6.4.3 Regression analysis
Hierarchical linear regression was used to examine the relationship between
organizational size and health literate survey score, and to determine if there was non-monotonic
relationship. The beta values, their standard errors and the standardized betas for the constants
and the independent variables of the two regression models are presented in Table 29. The table
also includes the overall variance explained (R2) and the F value for each model. A significant
negative relationship was found between organizational size and health literate score. That is,
small hospital size was associated with increased health literate score. As Table 29 shows, the
ANOVA indicates a significant relationship for this model, F (1,77) = 4.05, p < .05, calculated η2
= .05. The value of η2 indicates that this is a small effect size.
There was no support for a significant non-monotonic relationship was not found
between organizational size and health literate score. The ANOVA indicates a non-significant
9 From this point, the independent variable of rurality refers to the log transformation of rurality
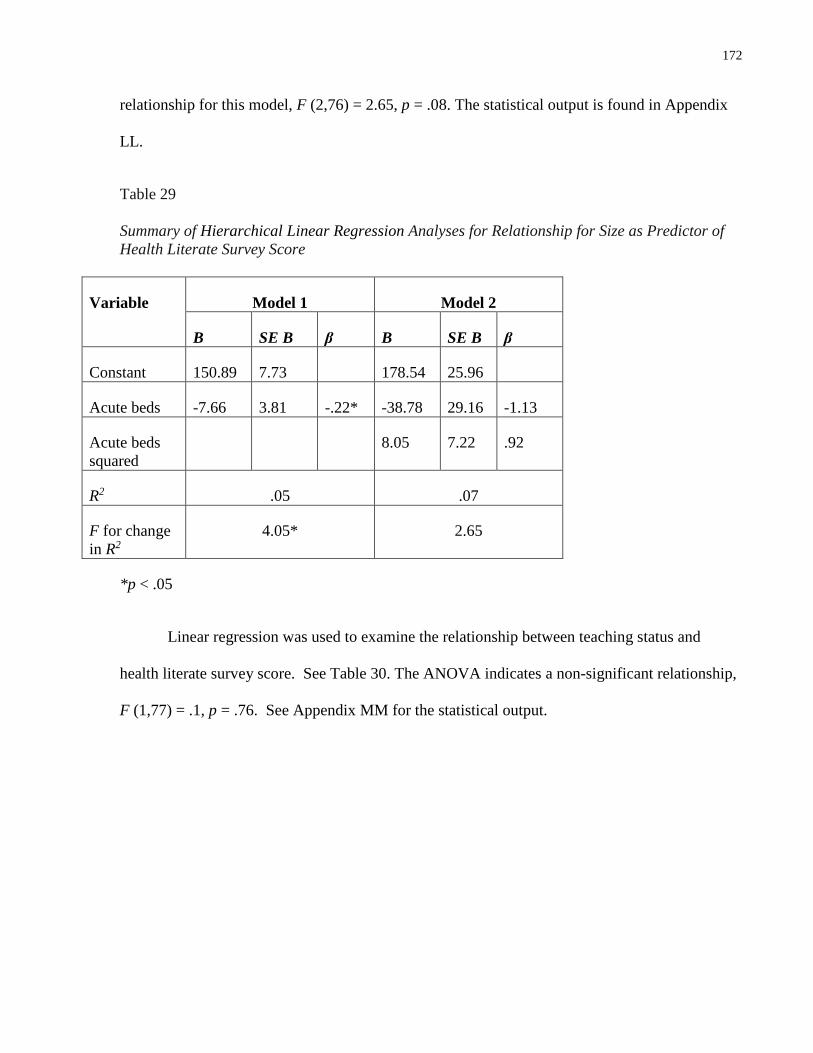
172
relationship for this model, F (2,76) = 2.65, p = .08. The statistical output is found in Appendix
LL.
Table 29
Summary of Hierarchical Linear Regression Analyses for Relationship for Size as Predictor of
Health Literate Survey Score
Variable Model 1 Model 2
B SE B β B SE B β
Constant 150.89 7.73 178.54 25.96
Acute beds -7.66 3.81 -.22* -38.78 29.16 -1.13
Acute beds
squared
8.05 7.22 .92
R2 .05 .07
F for change
in R2
4.05* 2.65
*p < .05
Linear regression was used to examine the relationship between teaching status and
health literate survey score. See Table 30. The ANOVA indicates a non-significant relationship,
F (1,77) = .1, p = .76. See Appendix MM for the statistical output.
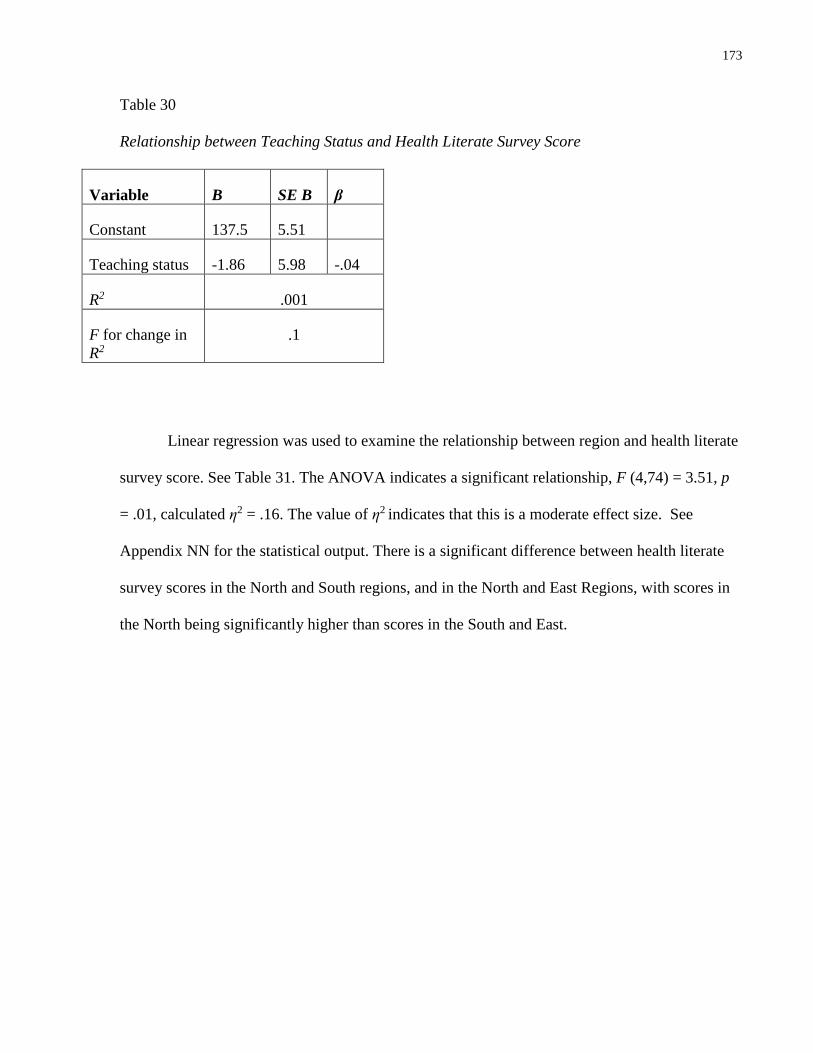
173
Table 30
Relationship between Teaching Status and Health Literate Survey Score
Variable B SE B β
Constant 137.5 5.51
Teaching status -1.86 5.98 -.04
R2 .001
F for change in
R2
.1
Linear regression was used to examine the relationship between region and health literate
survey score. See Table 31. The ANOVA indicates a significant relationship, F (4,74) = 3.51, p
= .01, calculated η2 = .16. The value of η2 indicates that this is a moderate effect size. See
Appendix NN for the statistical output. There is a significant difference between health literate
survey scores in the North and South regions, and in the North and East Regions, with scores in
the North being significantly higher than scores in the South and East.
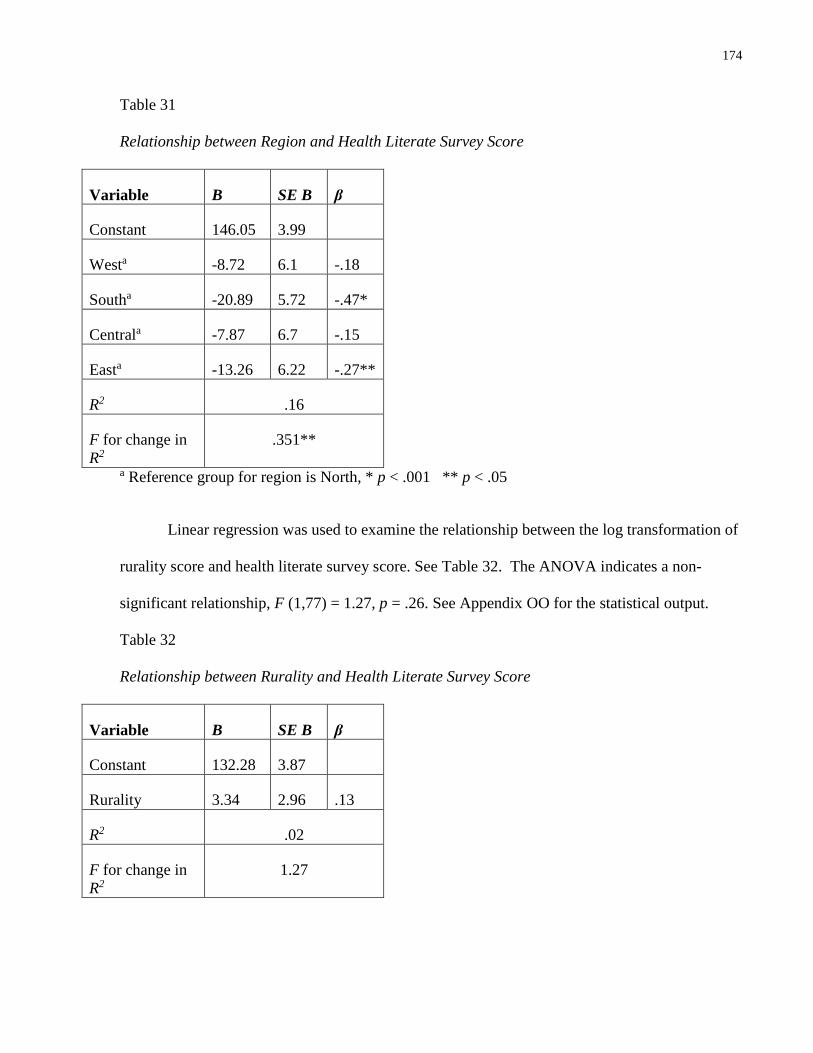
174
Table 31
Relationship between Region and Health Literate Survey Score
Variable B SE B β
Constant 146.05 3.99
Westa -8.72 6.1 -.18
Southa -20.89 5.72 -.47*
Centrala -7.87 6.7 -.15
Easta -13.26 6.22 -.27**
R2 .16
F for change in
R2
.351**
a Reference group for region is North, * p < .001 ** p < .05
Linear regression was used to examine the relationship between the log transformation of
rurality score and health literate survey score. See Table 32. The ANOVA indicates a non-
significant relationship, F (1,77) = 1.27, p = .26. See Appendix OO for the statistical output.
Table 32
Relationship between Rurality and Health Literate Survey Score
Variable B SE B β
Constant 132.28 3.87
Rurality 3.34 2.96 .13
R2 .02
F for change in
R2
1.27
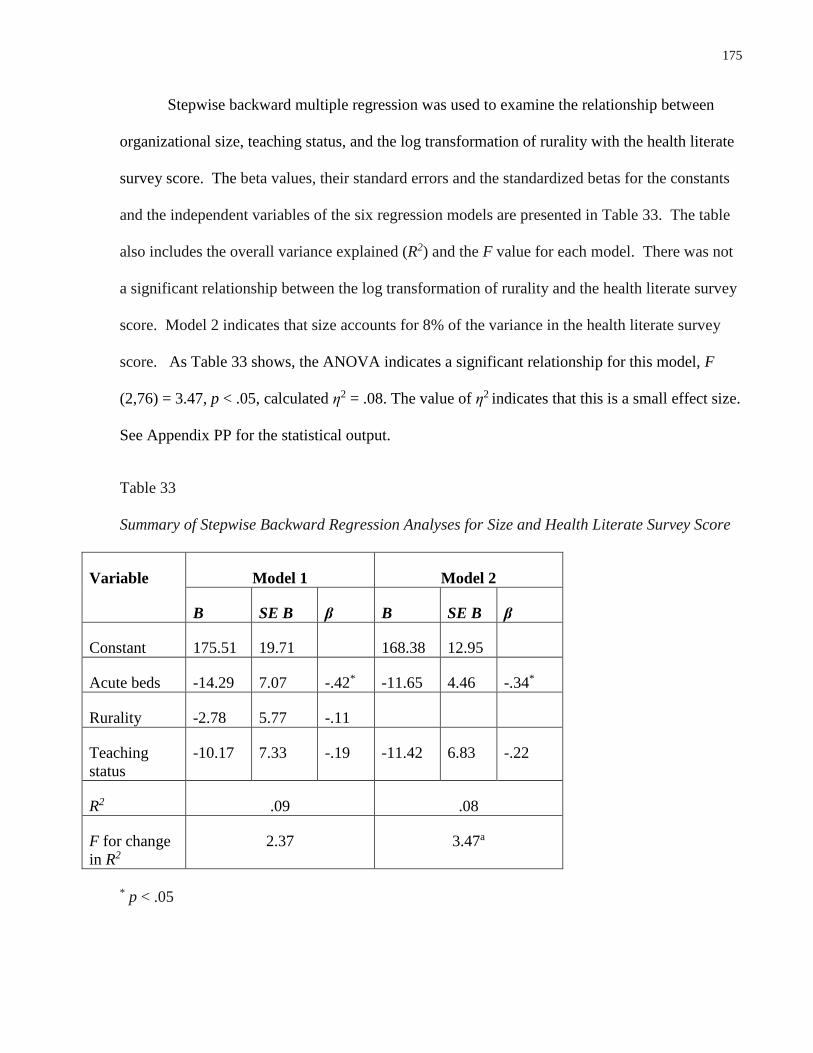
175
Stepwise backward multiple regression was used to examine the relationship between
organizational size, teaching status, and the log transformation of rurality with the health literate
survey score. The beta values, their standard errors and the standardized betas for the constants
and the independent variables of the six regression models are presented in Table 33. The table
also includes the overall variance explained (R2) and the F value for each model. There was not
a significant relationship between the log transformation of rurality and the health literate survey
score. Model 2 indicates that size accounts for 8% of the variance in the health literate survey
score. As Table 33 shows, the ANOVA indicates a significant relationship for this model, F
(2,76) = 3.47, p < .05, calculated η2 = .08. The value of η2 indicates that this is a small effect size.
See Appendix PP for the statistical output.
Table 33
Summary of Stepwise Backward Regression Analyses for Size and Health Literate Survey Score
Variable Model 1 Model 2
B SE B β B SE B β
Constant 175.51 19.71 168.38 12.95
Acute beds -14.29 7.07 -.42* -11.65 4.46 -.34*
Rurality -2.78 5.77 -.11
Teaching
status
-10.17 7.33 -.19 -11.42 6.83 -.22
R2 .09 .08
F for change
in R2
2.37 3.47a
* p < .05
176
Stepwise backward multiple regression was used to examine the relationship between
organizational size, teaching status and region. The beta values, their standard errors and the
standardized betas for the constants and the independent variables of the six regression models
are presented in Table 34. The table also includes the overall variance explained (R2) and the F
value for each model. See Appendix QQ for the statistical output.
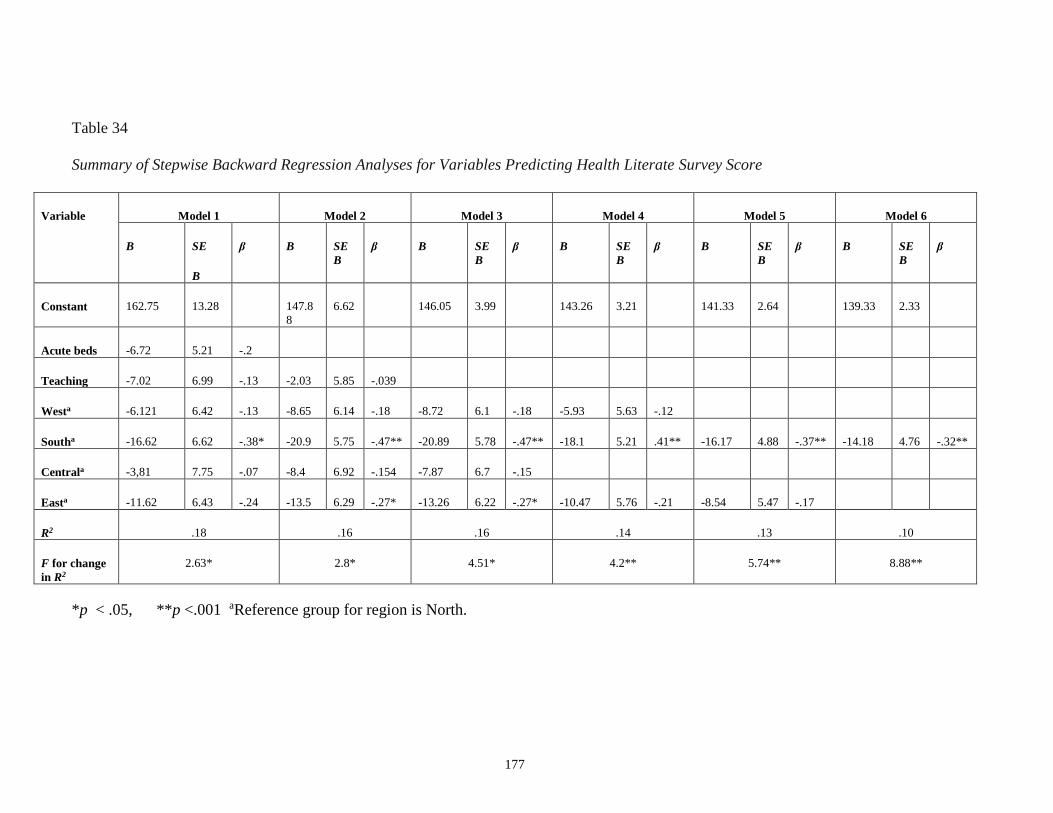
177
Table 34
Summary of Stepwise Backward Regression Analyses for Variables Predicting Health Literate Survey Score
Variable Model 1 Model 2 Model 3 Model 4 Model 5 Model 6
B SE
B
β B SE
B
β B SE
B
β B SE
B
β B SE
B
β B SE
B
β
Constant 162.75 13.28 147.8
8
6.62 146.05 3.99 143.26 3.21 141.33 2.64 139.33 2.33
Acute beds -6.72 5.21 -.2
Teaching -7.02 6.99 -.13 -2.03 5.85 -.039
Westa -6.121 6.42 -.13 -8.65 6.14 -.18 -8.72 6.1 -.18 -5.93 5.63 -.12
Southa -16.62 6.62 -.38* -20.9 5.75 -.47** -20.89 5.78 -.47** -18.1 5.21 .41** -16.17 4.88 -.37** -14.18 4.76 -.32**
Centrala -3,81 7.75 -.07 -8.4 6.92 -.154 -7.87 6.7 -.15
Easta -11.62 6.43 -.24 -13.5 6.29 -.27* -13.26 6.22 -.27* -10.47 5.76 -.21 -8.54 5.47 -.17
R2 .18 .16 .16 .14 .13 .10
F for change
in R2
2.63* 2.8* 4.51* 4.2** 5.74** 8.88**
*p < .05, **p <.001 aReference group for region is North.

178
The results of the regression analysis show 6 models. Hospitals in the North region had
the highest mean score, and hospitals in the South region had the lowest mean score. Each of the
six models demonstrates that this difference is significant. This demonstrates that there is a
significant difference in health literate survey scores between hospitals in the South region and
hospitals in the North region. Hospitals in the South region had significantly lower scores than
hospitals in the North region.
Hospitals in the East region had the second lowest mean on the health literate survey
score. Models 2 and 3 indicate a significant difference in health literate survey scores between
hospitals in the North region and hospitals in the East region. Hospitals in the East region had
significantly lower scores than hospitals in the North region.
The final model indicates that the difference between the North region and the South
region accounts for 10% of the variance in the health literate survey score. As Table 34 shows,
the ANOVA indicates a significant relationship for this model, F (1,77) = 8.88, p < .01,
calculated η2 = .1. The value of η2 indicates that this is a medium effect size.
Post-hoc analyses were done to examine the differences in number of acute beds between
the North and South regions, and the North and East regions. This was examined as there is a
greater number of small community hospitals in the North Region, compared to the South and
East regions. There was a significant difference in number of acute beds between the North and
South regions, t = -3.94 (37), p < .001 (using log transformation of acute beds). There was a
significant difference between the number of acute beds between the North and East regions,
although this relationship was not as strong (as between the North and South regions), t = -2.12
(32), p = .05 (using log transformation of acute beds). See Appendix RR for the statistical output
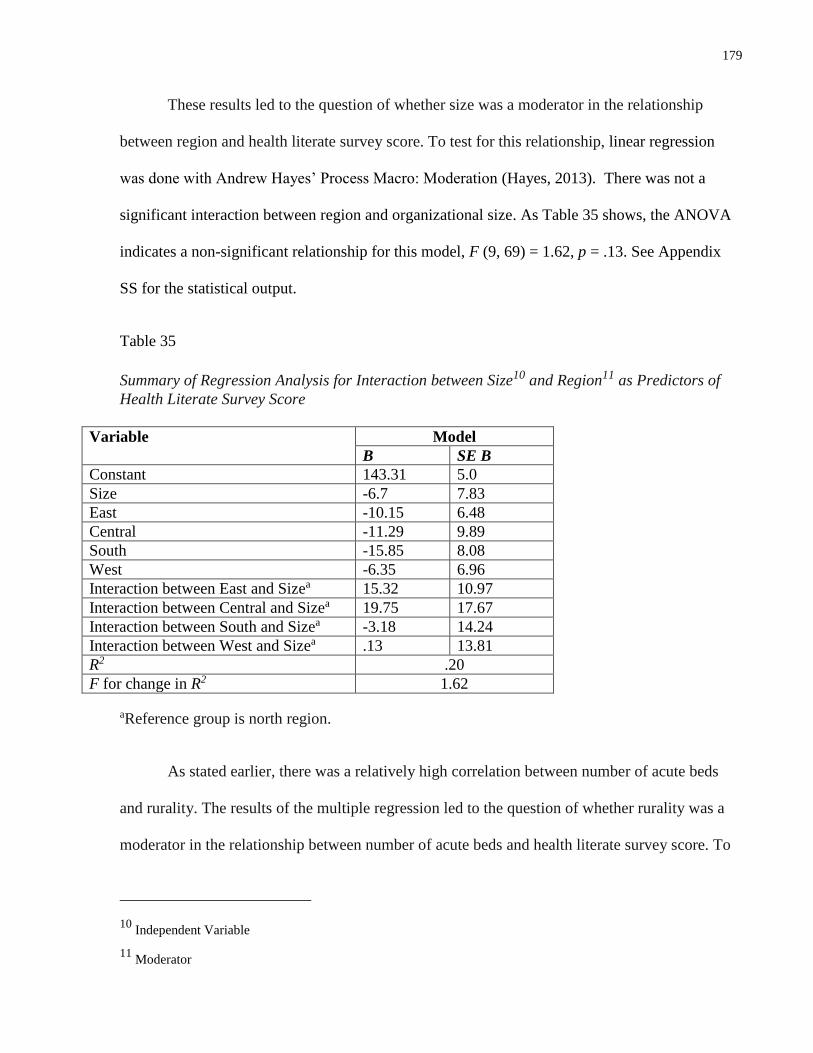
179
These results led to the question of whether size was a moderator in the relationship
between region and health literate survey score. To test for this relationship, linear regression
was done with Andrew Hayes’ Process Macro: Moderation (Hayes, 2013). There was not a
significant interaction between region and organizational size. As Table 35 shows, the ANOVA
indicates a non-significant relationship for this model, F (9, 69) = 1.62, p = .13. See Appendix
SS for the statistical output.
Table 35
Summary of Regression Analysis for Interaction between Size10 and Region11 as Predictors of
Health Literate Survey Score
Variable Model
B SE B
Constant 143.31 5.0
Size -6.7 7.83
East -10.15 6.48
Central -11.29 9.89
South -15.85 8.08
West -6.35 6.96
Interaction between East and Sizea 15.32 10.97
Interaction between Central and Sizea 19.75 17.67
Interaction between South and Sizea -3.18 14.24
Interaction between West and Sizea .13 13.81
R2 .20
F for change in R2 1.62
aReference group is north region.
As stated earlier, there was a relatively high correlation between number of acute beds
and rurality. The results of the multiple regression led to the question of whether rurality was a
moderator in the relationship between number of acute beds and health literate survey score. To
10 Independent Variable
11 Moderator
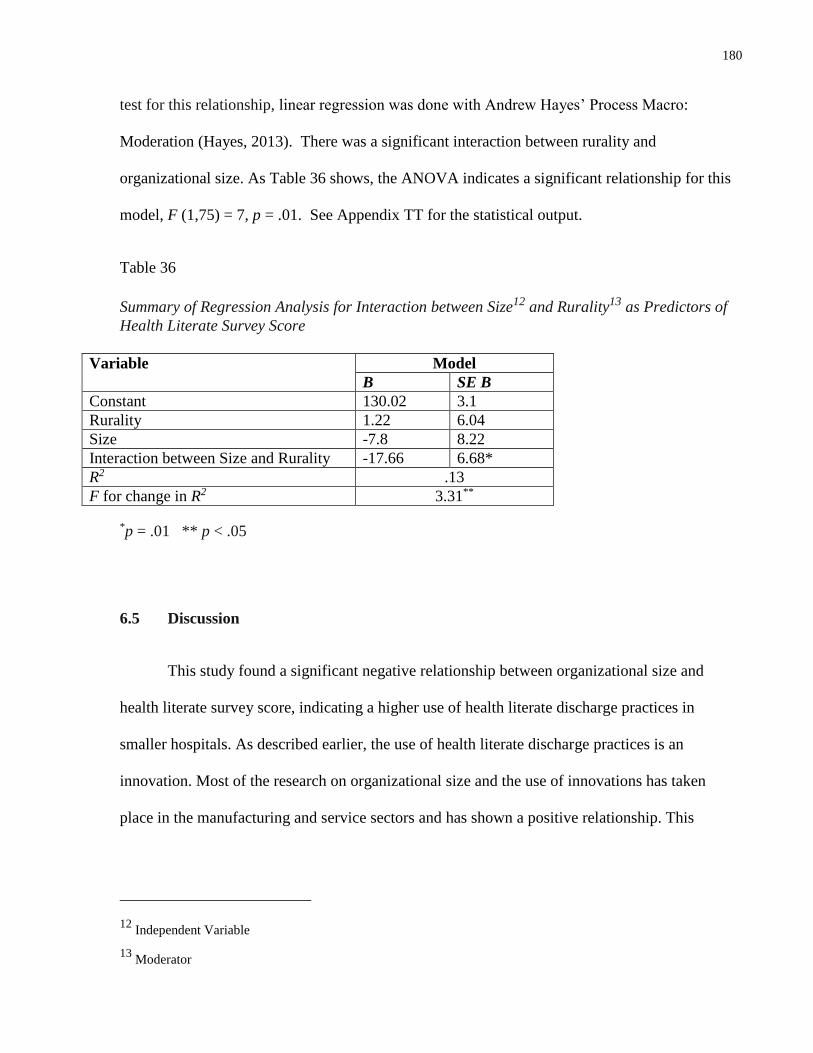
180
test for this relationship, linear regression was done with Andrew Hayes’ Process Macro:
Moderation (Hayes, 2013). There was a significant interaction between rurality and
organizational size. As Table 36 shows, the ANOVA indicates a significant relationship for this
model, F (1,75) = 7, p = .01. See Appendix TT for the statistical output.
Table 36
Summary of Regression Analysis for Interaction between Size12 and Rurality13 as Predictors of
Health Literate Survey Score
Variable Model
B SE B
Constant 130.02 3.1
Rurality 1.22 6.04
Size -7.8 8.22
Interaction between Size and Rurality -17.66 6.68*
R2 .13
F for change in R2 3.31**
*p = .01 ** p < .05
6.5 Discussion
This study found a significant negative relationship between organizational size and
health literate survey score, indicating a higher use of health literate discharge practices in
smaller hospitals. As described earlier, the use of health literate discharge practices is an
innovation. Most of the research on organizational size and the use of innovations has taken
place in the manufacturing and service sectors and has shown a positive relationship. This
12 Independent Variable
13 Moderator
181
positive relationship has not been consistently found in the limited research that has examined
the use of innovations in hospitals. The findings of this study are consistent with the work of
Dupree et al (2014) who found that there was a higher level of quality performance in smaller
hospitals.
While a significant relationship was found between organizational size and the health
literate survey score, this relationship was not found to be non-monotonic. Although this finding
is inconsistent with studies of multinational manufacturing and for-profit service organizations
(Nohria & Gulati, 1996; Geiger & Cashen, 2002), Ontario hospitals are operating in a very
different context.
There was no significant relationship found between a hospital’s teaching status and its
health literate survey score. This finding is inconsistent with the findings of Dijkstra et al (2006)
who found a positive relationship in their meta-analysis between hospital teaching status and
uptake of clinical practice guidelines. However, as described, the limited literature that is
available has shown mixed results when examining the influence of teaching status of hospitals
on innovation adoption and performance.
With respect to the relationship between location and health literate survey score, a
significant relationship was found between region and the survey score. In addition, rurality was
found to be a significant moderator in the relationship between organizational size and the health
literate survey score. In other words, there is a significant interaction between size and rurality
in predicting the use of health literate discharge practices.
As illustrated by the findings, hospitals in the North of Ontario had significantly higher
health literate survey scores than hospitals in the South. In addition, hospitals in the North had
182
significantly fewer acute care beds than hospitals in the South. This relationship was also found
between hospitals in the North and hospitals in the East, although it was not as strong as the
relationship between the hospitals in the North and South regions.
This finding is somewhat surprising. As acknowledged by the Ministry of Health and
Long-Term Care, rural and northern communities have decreased access to quality health care.
The Ministry began examining this issue in the 1990s, and has introduced numerous programs
since that time to improve health care access in rural and northern areas (Ministry of Health and
Long-Term Care, 2011). The analysis of the interviews found in Chapter 5 found that the only
participants who described relationships with external hospitals and being members of
communities of practice were working in hospitals that were in rural and/or northern areas of
Ontario. There may be higher levels of external relationships and increased use of social
networks in small, rural hospitals. This is an area for future exploration.
There has been limited investigation of regional differences in the uptake of best
practices. Differences between the regions of Ontario may be due to governance differences
between the LHINs. Each of the 14 LHINs have different levels of performance (Office of the
Auditor General of Ontario, 2015), and there is a need to find out the reasons for these different
levels. Three studies from the United States have found differences between regions of the
country and performance (Dupree et al., 2014; Lutifyya et al., 2007; Lehrman et al., 2010),
however, there has been a lack of investigation into regional differences and performance in
Canada. This study indicates that there is a higher level of use of health literate discharge
practices in the north region of Ontario, which has the lowest number of acute care beds, as well
as the greatest number of rural, small community hospitals.
183
This higher level of performance that was found in the North region is not consistent with
the findings of the 2015 Auditor General’s report, which examined the functioning of LHINs in
Ontario in 2015. They examined the performance of LHINs on 15 indicators, which included
wait times for surgery, unplanned emergency department visits, readmission rates and wait times
for CCAC in-home services. The indicators measured different time periods that ranged from
2007 to 2015. The North East and North West LHINs, which constitute the North region, met
performance targets in only 4 of the 15 areas, which was the lowest level of performance. The
highest level of performance was in the Central LHIN, which is in the South region. This LHIN
met targets in 10 of the 15 areas (Office of the Auditor General, 2015).
The performance targets that were examined are not the same as the indicator used in this
study, that is, the survey score that measured the use of health literate discharge practices. In
addition, the health literate survey score was determined by the participants. In effect, it was a
subjective measure of hospital performance, in contrast to the objective performance indicators
used by the Office of the Auditor General (2015).
There is a need for further study into the differences between the LHINs. While
differences clearly exist, the reasons for the differences are less clear.
6.6 Future Research
There are other organizational characteristics that may have an influence on the health
literate survey score that were not examined in this study.
Hospital discharge is largely carried out by nurses (Bobay et al., 2015). Nursing staff to
patient ratios have been associated with improved patient outcomes (Blegen, Goode, Spetz,
Vaughn, & Park, 2011), increased care quality, increased patient satisfaction (Aiken et al., 2012)
184
and decreased mortality (Shekelle, 2013). Future research could examine the relationship
between nurse to patient ratios and uptake of best practices. The volume of nursing staff within
hospitals could also be used as a measure of organizational size. In their meta-analysis,
Damanpour et al., (1996) noted that the number of personnel has been a common measure of
organizational size in the organizational studies literature. While this has not been the case in the
studies of organizational characteristics of hospitals, it would be interesting to find out if there is
a relationship between the volume of nurses in an organization and the uptake of best practices.
All of the hospitals were unionized. Early research has indicated that when organizations
consider innovations, unions are rarely consulted, and that subsequently, they are not supportive
of them (Fennell, 1984). The more recent study that examined innovation adoption in 1200
municipal governmental bodies in the United States found that the existence of unions was
associated with a lack of support for innovations in the adoption stage, but it did not have a
negative effect on the actual uptake of the innovation (Damanpour & Scheider, 2006). As the
vast majority of nurses working in Ontario hospitals are unionized, it would be interesting to
further explore the relationship between unionization and adoption of health literate discharge
practices.
6.7 Limitations
A limitation of this study is the small sample size. Although significant relationships
were found between region and health literate survey score, and size and health literate survey
score, there may be other significant relationships that would have been found if the sample had
been larger
185
Another limitation was that the health literate survey score is not an objective measure.
Hospitals that participated agreed to participate in the study, and the survey was completed by
members of the hospital organizations.
6.8 Conclusion
These results indicate that there is a significant relationship between hospital size and
location with the use of health literate discharge practices. Smaller hospitals were found to have
increased use of health literate discharge practices compared to larger hospitals, and there was a
significant interaction between size and rurality in predicting the use of health literate discharge
practices.
In addition, the hospitals that indicated they had the highest use of these practices were
located in the North region of Ontario. This indicates that the uptake of health literate discharge
practices was highest in a region with the lowest number of acute care beds, and the highest
number of small rural hospitals. These results were not expected as the adoption and use of
innovations have historically been found to be greater in larger organizations, and in
organizations located in urban regions. There is a need to further investigate these relationships,
in order to determine why the use of health literate discharge practices was higher in small, rural
hospitals, and was higher in the North region.
186
Chapter 7:
Adoption and Use of Health Literate Discharge Practices in Ontario
Hospitals
7.1 Use of health literate discharge practices in Ontario hospitals
The purpose of these studies was to contribute to our understanding of the use of health
literate discharge practices in Ontario hospitals. As previously described, these practices have
been associated with improved patient and hospital outcomes, including decreased readmission
rates. The four studies contained in this thesis demonstrate how these practices can be measured
in Ontario hospitals, and describe how their adoption and use can be facilitated.
The first study determined the essential indicators of health literate discharge practices in
acute care hospitals in Ontario using a Delphi panel. Construct and content validity were
established for the indicators. The panel membership included experts in health literacy and
hospital discharge from across North America, and most of the members were researchers,
providers and managers working in Ontario. This helped to ground the indicators in the context
of Ontario’s health care system.
For example, several participants identified the need to refer patients to a community
pharmacist upon discharge to review medications in adherence to the MedsCheck program which
has been in existence in Ontario since 2008. Through this program, pharmacists conduct a
billable 20-30 minute medication consultation with patients (Ministry of Health and Long-Term
Care, 2008). In other words, providing a patient with a referral to a community pharmacist upon
discharge is a health literate discharge practice specific to the Ontario context.
The second study used the indicators that were developed with the Delphi panel to create
a survey designed to facilitate hospitals’ assessment of their use of each of the indicators. This
187
survey was sent to all adult, acute care hospitals in Ontario, and had a response rate of 55%. The
responses indicate that there is a wide range of use of health literate discharge practices across
Ontario.
Exploratory factor analysis was completed to determine the factor structure of the
construct “use of health literate discharge practices.” Six factors were identified: 1) patient
preparation for follow-up appointments and tests; language assistance; 2) use of a written plan
with the patient and family; 3) coordination of services; contact of informal caregivers; 4)
medication review and patient education; 5) discharge summary and follow up care, and 6)
arrangement of follow up appointments and tests. In addition, reliability of the survey was
established, for all of the 36 items, and for each of these 6 factors.
The surveys were followed by key informant interviews with nursing managers,
educators and front-line staff in ten Ontario hospitals who were participants in the survey. These
interviews led to an understanding of the facilitators and barriers to the use of health literate
discharge practices in Ontario hospitals. Organizational learning theory was used to understand
the absorptive capacity metaroutines that are used in hospitals to adopt and implement new
practices.
The fourth and final study gives insight into the relationship between organizational and
micro-environmental characteristics and use of health literate discharge practices. Most studies
that have explored the relationship between organizational size and use of innovations have been
in the manufacturing and for-profit service sectors and there has been little investigation of this
relationship in health care. The little work that has been done to date in this area has taken place
in the United States, and the results are ambiguous. In this study, it was found that smaller
hospitals reported greater use of health literate discharge practices than their larger counterparts.
188
In addition, rurality was found to be a moderator in the negative relationship between
organizational size and use of health literate discharge practices. This is understandable, as
smaller hospitals, which had higher use of health literate discharge practices, are more likely to
be located in rural locations. However, as will be discussed in a following section, there is a need
to further explore these relationships.
7.2 Conceptual and theoretical implications
The Health Literate Care Model is a relatively new model; to date there has been limited
work to test it. This model has not been applied in the Canadian context. According to this
model, strategies of health literate organizations lead to productive interactions between patients
and the health care team. In this study, the model was adapted to focus on health literate
discharge practices as strategies of health literate organizations in the context of Ontario. While
these strategies have been associated with improved outcomes in hospitals in the United States,
particularly in relationship to readmission rates, there is a need to determine whether the same
association exists in the considerably different Canadian health care context.
Organizational learning theory and the concept of absorptive capacity metaroutines were
used to advance our understanding of how hospitals in Ontario adopt and use health literate
discharge practices. The thematic analysis led to the identification of 11 metaroutines and these
metaroutines were used to develop propositions, which were represented in a new conceptual
framework. This framework illustrates how hospitals in Ontario adopt and use health literate
discharge practices, and it could be used as a guide for future studies that seek to further advance
our understanding of how hospitals adopt and use other evidence-based practices. In addition, it
could be extended to other settings, such as primary and long-term care organizations. Testing of
the propositions comprising the framework stands to provide further insight into how health care
189
organizations use organizational learning metaroutines to increase their adoption of evidence-
based practices.
7.3 Implications for hospital managers and administrators
The survey of health literate discharge practices could be used by managers and
administrators to measure the use of health literate discharge practices in hospitals to obtain a
baseline measure of their use. This would identify areas that need improvement and that could be
addressed through quality improvement plans. Survey results could also be used to develop staff
education sessions, as hospital staff may lack awareness of these practices, and may lack
experience using practices such as teach back.
The key informant interviews identified several areas that need attention on the part of
hospital managers and administrators, to facilitate the uptake of new practices. Communication
between hospital providers was found to be key in planning patients’ discharge from hospital.
Several participants described a lack of communication between physicians, nurses and allied
health team members. On several units, nurses and allied health team members held daily unit
rounds on the inpatient unit to review patient discharge plans. Although it was physicians who
were actually responsible for writing discharge orders, physicians rarely attended these meetings.
This had the potential to lead to patients receiving conflicting information, and being discharged
without plans being completed. This finding highlights a need for improved communication
between physicians, nurses, and members of the allied health team to avoid these problems.
A facilitator to the use of health literate discharge practices was the use of
standardization. In hospitals where health literate discharge practices had been adopted
successfully, participants described the use of standardized checklists, order sets and patient
190
education materials. This standardization helped to ensure that patients received the information
that they needed and that there was communication between patients’ hospital and community
health providers.
Another facilitator to the use of health literate discharge practices for nursing staff and
managers was the ability to take advantage of educational opportunities. This is a known
facilitator to the adoption and use of evidence-based practices in health care (Berta et al., 2013;
Ellen et al., 2013; Greenhalgh et al., 2004). However, as both nursing staff and managers
described, typically only managers, to the exclusion of staff, were able to take advance of
professional development opportunities. There is a need for managers and administrators to find
and allocate time and financial resources for nurses to participate in educational opportunities.
7.4 Implications for policy makers
Ontario hospitals have a high rate of hospital readmission. The survey results show a
wide range of use of health literate discharge practices across Ontario hospitals. This may be a
reflection of the variation of hospital readmission rates across Ontario and is a topic for future
research. As stated earlier, how patients are discharged influences their likelihood of returning to
the hospital within one month of discharge (Vashi et al., 2013). If hospitals in Ontario are able to
increase their uptake of health literate discharge practices, there is the possibility that the high
rate of readmission will decrease.
The survey of health literate discharge practices that was developed is the first tool to
measure the use of these practices in acute care hospitals. As Kripalini et al (2014) notes, in
order to become a health literate organization, it is necessary to establish a baseline, and to assess
the current level of performance. Going forward, the survey could be used in quality
191
improvement efforts in Ontario hospitals, where measuring hospitals’ use of health literate
discharge practices prior to implementing an improvement initiative would identify areas in
which to focus improvement efforts, and would offer a reference point that could be used to
check for improvement upon a post-implementation application of the survey tool.
A number of implications for policy makers were also identified through the analysis of
the key informant interview data. While all of the hospitals used electronic health records, there
was a lack of ability to share electronic records between hospitals and health care providers in
the community, and between hospitals. Only one hospital in the North East LHIN described
being able to share electronic records with 5 other hospitals in their region. This communication
was found to be helpful in sharing important health information about patients, including
previous hospital admissions.
There is a need for policy makers to address the information technology needs of
hospitals. Several hospitals described using carbon paper in their communication with patients
and other health care providers. Carbon paper is notoriously difficult to read. There is a need to
ensure that hospitals, providers and patients have access to electronic resources to share
information.
Policy makers also need to address the issue of health human resources in Ontario. All of
the interviewees referred to the key role that nursing plays in the discharge process, and as
previously described, there is a significant relationship between nurse staffing in hours per
patient day and the quality of patients’ preparation for discharge and their subsequent hospital
readmission and emergency department use within 30 days of discharge (Nosbusch et al., 2011;
Weiss et al., 2011).
192
Several interviewees identified the workload of nurses as a barrier to the use of new
discharge practices, and to educating patients and families about hospital discharge. Using
health literate discharge practices requires increased nursing time. The 2009 study of Project
RED estimated that study nurses spent 90 minutes per study participant and this included
communication with patients and family members throughout the hospitalization (Jack et al.,
2009). Interestingly, a 2003 study that took place in Ontario teaching hospitals found that
patients who were discharged from units that had higher proportions of registered nursing and
registered practical nursing staff had better clinical outcomes, compared to units with lower
proportions (McGillis Hall et al., 2003). There is a need to ensure that there are adequate nursing
staff resources to carry out health literate discharge practices.
7.5 Limitations
A limitation to these studies is that they did not incorporate the experiences of patients
and families. Engaging patients and families in health care has been associated with improved
patient outcomes, as well as improved quality of care and patient safety (Carman et al., 2013;
Koh, Brach, et al., 2013). Project RED was developed with patients, and qualitative work was
done to ensure that the needs of patients and families were being met (Jack et al., 2008).
However, to date, there has been no study of the experiences of patients and families with the
practices contained in Project RED.
A limitation to the exploratory factor analysis that is contained in the second study was
the small sample size. The small sample size limits the ability to generalize the findings of this
study from the sample to all hospitals in Ontario.
193
A limitation of the survey is the subjective nature of the tool. The survey was developed
for use by participants to self-rate their hospitals’ use of health literate discharge practices. It is
possible that the ratings that participants provided do not reflect the reality of their actual use.
This was illustrated during one of the site visits. A large community hospital in the Erie St Clair
LHIN had a health literate survey score of 109, which was the 5th lowest score of the 79 hospitals
in the sample. Two interviews took place with educators at this hospital, and it was noted that
this hospital actually had a high level of use of health literate discharge practices. One of the
interviewees, who had participated in the survey, had recently completed a one-year project
where she was focused on improving the hospital discharge process as her full-time role. This
hospital had developed an electronic template for discharge instructions that nurses were using to
provide discharge instructions to patients and families. It is possible that hospitals that are high
performing may actually be more self-critical, although this was not explored. In summary, the
subjective nature of the survey may limit the ability to make comparisons between hospitals.
7.6 Need for future research
There have been few studies examining the experience of patients and families with
hospital discharge (Coleman, Roman, Hall, & Min, 2015), however the limited literature
indicates that hospital discharge is not performed well. As referred to earlier, a 2012 European
study interviewed patients, families and community health providers about their experience of
hospital discharge to find patients and families are poorly prepared or educated at the time of
discharge regarding their care and follow-up instructions. The education that they are given is
delivered in technical language that is difficult for patients and families to understand.
Furthermore, the education is typically unorganized and is delivered immediately prior to
discharge, in a hurried manner (Hesselink et al., 2012). These findings were reiterated in a more
194
recent qualitative study of patients and family members that took place in the United States
(Coleman & Roman, 2015). In addition, there is a lack of study on the relationship between the
use of health literate discharge practices and patient outcomes such as patient satisfaction and
patients’ ability to self-manage their care. There is a need to explore the experiences of patients
and family members with the use of these practices (Coleman et al., 2015).
A larger study, with a greater number of hospitals, would facilitate further understanding
of the construct “use of health literate discharge practices.” The survey might usefully be
administered to all medical and surgical inpatient units in Ontario, as well as to all units in
Canada. This would afford insights into the current use of health literate discharge practices in
Ontario and Canada, and highlight areas that need improvement. In addition, a larger sample size
would allow for further reliability testing of this survey instrument.
Factor analysis was done with the purpose of understanding the construct “use of health
literate discharge practices.” Another goal of factor analysis is to reduce the size of a data set.
The exploratory factor analysis indicated that there were items that could be removed from the
survey to improve the tool’s parsimony. This was the first time the survey was administered, and
it was not a goal of this study to reduce the survey items. However, reducing the number of
items, and creating a shortened version could help hospitals and policy makers to use the survey
by making it easier to measure current levels of health literate discharge practice use, as well as
changes in the level of use.
Furthermore, the exploratory factor analysis identified 6 factors that defined the construct
“use of health literate discharge practices in Ontario hospitals.” There is a need for future
research to use confirmatory factor analysis, to confirm the relationship between these factors
and this construct (Field, 2013).
195
In the third study, interviews of health care providers and managers were used to find out
about how hospitals in Ontario adopt and use health literate discharge practices. The interview
guide was focused on the four absorptive capacity metaroutines identified in the work of Lewin
et al (2011) of allocating resources, responding to environmental mandates, participative
decision making and scanning. Analysis of the qualitative interview data revealed seven
additional absorptive capacity metaroutines that were integral to the uptake of health literate
discharge practices. There is a need to meet with health care providers and managers to further
explore how the use of these metaroutines can facilitate the adoption and use of health literate
discharge practices
A 2015 study examined the implementation of Project RED in 10 hospitals in the United
States. A key factor of successful implementation was establishing accountability (Mitchell et
al., 2016). Interestingly, accountability was not directly addressed in any of the interviews, nor
did it emerge as a key theme. This may be because of a lack of clear accountability, and
accountability structures, in Ontario hospitals (Kraetschmer et al., 2014; Wachter, 2013). There
is a need to include a focus on accountability in follow-up qualitative work, as it plays a key role
in the uptake of evidence-based practice (Grol & Grimshaw, 2003, Fleiszer et al., 2015).
There has been little study of how health care organizations sustain evidence-based
practices (Innis et al., 2015). While sustainment and sustainability were not within the scopes of
these studies, there is a need for longitudinal research to examine how hospitals sustain their use
of health literate discharge practices.
In addition, a case study approach could be used to focus on how individual hospitals
adopt and use health literate discharge practices. This approach could include interviewing health
care providers, managers, administrative staff and community care providers, as well as patients
196
and families. This would give a more detailed understanding of how hospitals adopt and
implement these practices, and of the experiences of patients and families with these processes.
Organizational characteristics have been found to significantly influence the uptake of
innovation, as well as performance, in other study settings. While the literature in the
manufacturing and for-profit service sectors has shown a positive relationship between
organizational size and the adoption of innovations, the results are not as clear with hospitals.
The results of the little research done to date are mixed. The fourth study found a negative
relationship between hospital size and use of health literate discharge practices. This result
conflicts with some of the studies conducted in other sectors, however it was consistent with the
findings of Dupree et al. (2014) in their study of performance in hospitals in the United States.
The findings from the qualitative data analysis reported and discussed in Chapter 5
corroborate the findings from the regression analysis, where organizational size emerged as an
important factor relating to the use of health literate discharge practices, with smaller hospitals
reporting increased use. Participants from smaller hospitals described external relationships with
managers and providers in other hospitals. Of the ten hospitals, participants in only three
hospitals described being part of a community of practice, where they could meet and share ideas
with managers and health care providers from different hospitals in their region. Each of these
was a small community hospital located in a rural area.
In addition, although a number of interviewees from across the province spoke of the
need for improved IT resources to communicate with other hospitals, there was only one
interviewee, in a small rural hospital in the North, who described such a resource. This senior
manager described how her hospital was connected to five other hospitals through the same
system of electronic health records.
197
These findings highlight that there may be improved information continuity and sharing
of resources between smaller hospitals in rural settings. In addition, there appears to be increased
inter-facility cooperation between small community hospitals. These are areas for future
exploration. This could give insight into how hospitals develop and use relationships with other
hospitals and health care organizations.
7.7 Conclusion
This dissertation had several purposes. I set out to determine the essential indicators of
health literate discharge practices in Ontario hospitals, using the indicators from Project RED,
and a Delphi panel that consisted of health care providers, managers and researchers from across
Ontario, as well as researchers who have expertise in health literacy, hospital readmission and
hospital discharge from Canada and the United States. This set of indicators, contextualized to
Ontario, were then used to measure the use of health literate discharge practices in Ontario
hospitals. I was able to define the construct of “use of health literate discharge practices” through
exploratory factor analysis, and to establish reliability for the survey.
The administration of the survey in Ontario hospitals was followed with key informant
interviews in ten hospitals throughout the province that participated in the survey. Semi-
structured interviews explored the absorptive capacity metaroutines that hospitals in Ontario use
in the adoption and uptake of health literate discharge practices. I used the findings from these
interviews to generate propositions for a new conceptual framework that can be used to guide
future research.
I examined the relationship between organizational characteristics and the use of health
literate discharge practices. Contrary to expectations, a significant negative relationship was
198
found between hospital size and use of health literate discharge practices, with decreased size
being associated with an increased use of health literate discharge practices. In addition, a
significant interaction was found between size and rurality, which is not surprising, as small
hospitals are more likely to be located in rural locations. As described, participants in smaller
hospitals, in rural locations, described increased external relationships with other hospitals
through communities of practice and shared IT resources. This is an area for future research, as
these are strategies that may facilitate the uptake of health literate discharge practices in larger
hospitals.
To date, there are no published studies of how acute care hospitals in Ontario are
managing their discharge processes. The development of the organizational survey tool could be
used by researchers, hospitals and policy makers to measure and monitor the use of health
literate discharge practices in Ontario hospitals. This would help to identify areas of strength as
well as areas that need improvement.
The results of the qualitative study offer insights into how hospital managers and leaders
use absorptive capacity metaroutines to adopt and use health literate discharge practices. There
were varying levels of practice use across hospitals, and there is a need for hospitals in Ontario to
share practices that are working in their organization, so that they can be examined and tailored
for use in other hospitals.
The work done to date in these studies can be used to advance the adoption and use of
health literate discharge practices in acute care hospitals. This has the potential to improve
patient care, enhance patient satisfaction, reduce use of acute care resources, decrease
readmission and lower costs for Ontario’s health care system.
199
References
Aarons, G. A. (2006). Transformational and Transactional Leadership: Association With
Attitudes Toward Evidence-Based Practice. Psychiatric Services, 57(8), 1162-1169.
Accreditation Canada, Canadian Institute for Health Information, & Institute for Safe Medication
Practices Canada. (2012). Medication reconciliation in Canada: Raising the bar –
progress to date and the course ahead. Ottawa, ON: Accreditation Canada.
Adams, C. J., Stephens, K., Whiteman, K., Kersteen, H., & Katruska, J. (2014). Implementation
of the Re-Engineered Discharge (RED) toolkit to decrease all-cause readmission rates at
a rural community hospital. Quality Management in Healthcare, 23(3), 169-177.
Aiken, L. H., Sermeus, W., Van den Heede, K., Sloane, D. M., Busse, R., McKee, M., . . .
Kutney-Lee, A. (2012). Patient safety, satisfaction, and quality of hospital care: cross
sectional surveys of nurses and patients in 12 countries in Europe and the United States.
British Medical Journal, 344, e1717.
Al-Rashed, S. A., Wright, D. J., Roebuck, N., Sunter, W., & Chrystyn, H. (2002). The value of
inpatient pharmaceutical counselling to elderly patients prior to discharge. British
Journal of Clinical Pharmacology, 54(6), 657-664.
Angus, J., Hodnett, E., & O'Brien-Pallas, L. (2003). Implementing evidence-based nursing
practice: a tale of two intrapartum nursing units. Nursing Inquiry, 10(4), 218-228.
Anthony, D., Chetty, V., Kartha, A., McKenna, K., DePaoli, M. R., & Jack, B. (2005). Re-
engineering the hospital discharge: An example of a multifaceted process evaluation. In:
Henriksen K, Battles, JB, Marks ES, et al., (eds.). Advances in patient safety: From
research to implementation. (Volume 2: concepts and methodology). Rockville, MD:
Agency for Healthcare Research and Quality.
Arbaje, A. I., Kansagara, D. L., Salanitro, A. H., Englander, H. L., Kripalani, S., Jencks, S. F., &
Lindquist, L. A. (2014). Regardless of age: Incorporating principles from geriatric
medicine to improve care transitions for patients with complex needs. Journal of General
Internal Medicine, 29(6), 1-8.
Argote, L. (2012). Organizational learning: Creating, retaining and transferring knowledge.
New York: Springer.
Arksey, H., & O'Malley, L. (2005). Scoping studies: Towards a methodological framework.
International Journal of Social Research Methodology, 8(1), 19-32.
Arrindell, W. A., & Van der Ende, J. (1985). An empirical test of the utility of the observations-
to-variables ratio in factor and components analysis. Applied Psychological
Measurement, 9(2), 165-178.
Bailey, S. C., Fang, G., Annis, I. E., O'Conor, R., Paasche-Orlow, M. K., & Wolf, M. S. (2015).
Health literacy and 30-day hospital readmission after acute myocardial infarction. BMJ
Open, 5(6), e006975.
200
Baker, S. J. (2010). Bedside shift report improves patient safety and nurse accountability.
Journal of Emergency Nursing, 36(4), 355-358.
Baker, G. R. (2011). Enhacing the continuum of care: Report of the avoidable hospitalization
advisory panel. . Retrieved from
http://www.health.gov.on.ca/en/common/ministry/publications/reports/baker_2011/baker
_2011.pdf
Baker, D. W., Wolf, M. S., Feinglass, J., Thompson, J. A., Gazmararian, J. A., & Huang, J.
(2007). Health literacy and mortality among elderly persons. Archives of Internal
Medicine, 167(14), 1503-1509.
Barnsley, J., Lemieux-Charles, L., & McKinney, M. M. (1998). Integrating learning into
integrated delivery systems. Health Care Management Review, 23(1), 18-28.
Barr, V. J., Robinson, S., Marin-Link, B., Underhill, L., Dotts, A., Ravensdale, D., & Salivaras,
S. (2003). The expanded Chronic Care Model: An integration of concepts and strategies
from population health promotion and the Chronic Care Model. Healthcare Quarterly,
7(1), 73-82.
Berentson-Shaw, J., & Price, K. (2007). Facilitating effective health promotion practice in a
public health unit: Lessons from the field. Australian & New Zealand Journal of Public
Health, 31(1), 81-86.
Berkman, N. D., Sheridan, S. L., Donahue, K. E., Halpern, D. J., & Crotty, K. (2011). Low
health literacy and health outcomes: An updated systematic review. Annals of Internal
Medicine, 155(2), 97-107.
Berkman, N. D., Sheridan, S. L., Donahue, K. E., Halpern, D. J., Viera, A., Crotty, K., . . .
Harden, E. (2011). Health literacy interventions and outcomes: An updated systematic
review. Evidence Report/Technology Assessment No. 199. (Prepared by RTI
International University of North Carolina Evidence-Based Practice Center under
contract No. 290-2007-10056-I. AHRQ Publication Number 11-E006). Rockville, MD:
Agency for Healthcare Research and Quality.
Bernheim, S. M., Grady, J. N., Lin, Z., Wang, Y., Wang, Y., Savage, S. V., . . . Merrill, A. R.
(2010). National patterns of risk-standardized mortality and readmission for acute
myocardial infarction and heart failure update on publicly reported outcomes measures
based on the 2010 release. Circulation: Cardiovascular Quality and Outcomes, 3(5), 459-
467.
Berta, W., & Baker, R. (2004). Factors that impact the transfer and retention of best practices for
reducing error in hospitals. Health Care Management Review, 29(2), 90-97.
Berta, W., Ginsburg, L., Gilbart, E., Lemieux-Charles, L., & Davis, D. (2013). What, why, and
how care protocols are implemented in Ontario nursing homes. Canadian Journal of
Aging, 32(1), 73-85.
201
Berta, W., Teare, G. F., Gilbart, E., Ginsburg, L. S., Lemieux-Charles, L., Davis, D., & Rappolt,
S. (2005). The contingencies of organizational learning in long-term care: Factors that
affect innovation adoption. Health Care Management Review, 30(4), 282-292.
Berta, W., Teare, G. F., Gilbart, E., Ginsburg, L. S., Lemieux-Charles, L., Davis, D., & Rappolt,
S. (2010). Spanning the know-do gap: Understanding knowledge application and capacity
in long-term care homes. Social Science & Medicine, 70(9), 1326-1334.
Blair, J., Czaja, R. F., & Blair, E. A. (2014). Designing surveys: A guide to decisions and
procedures (Third ed.). Los Angeles: Sage.
Blegen, M. A., Goode, C. J., Spetz, J., Vaughn, T., & Park, S. H. (2011). Nurse staffing effects
on patient outcomes: Safety-net and non-safety-net hospitals. Medical Care, 49(4), 406-
414.
Bobay, K., Bahr, S. J., Weiss, M. E., Hughes, R., & Costa, L. (2015). Models of discharge care
in Magnet® hospitals. Journal of Nursing Administration, 45(10), 485-491.
Boulkedid, R., Abdoul, H., Loustau, M., Sibony, O., & Alberti, C. (2011). Using and reporting
the Delphi method for selecting healthcare quality indicators: a systematic review. PLoS
ONE, 6(6), e20476.
Brach, C., Dreyer, B. P., & Schillinger, D. (2014). Physicians’ roles in creating health literate
organizations: A call to action. Journal of General Internal Medicine, 29(2), 273-275.
Brach, C., Keller, D., Hernandez, L. M., Baur, C., Parker, R., Dreyer, B., . . . Schillinger, D.
(2012). Ten attributes of health literate health care organizations. Washinton DC:
National Academies Press.
Bradley, E. H., Curry, L., Horwitz, L. I., Sipsma, H., Wang, Y., Walsh, M. N., . . . Krumholz, H.
M. (2013). Hospital strategies associated with 30-day readmission rates for patients with
heart failure. Circulation: Cardiovascular Quality & Outcomes, 6(4), 444-450.
Braun, V., & Clarke, V. (2006). Using thematic analysis in psychology. Qualitative Research in
Psychology, 3(2), 77-101.
Brown, J. S., & Duguid, P. (1991). Organizational learning and communities-of-practice:
Toward a unified view of working, learning, and innovation. Organization Science, 2(1),
40-57.
Burns, K. E., Duffett, M., Kho, M. E., Meade, M. O., Adhikari, N. K., Sinuff, T., & Cook, D. J.
(2008). A guide for the design and conduct of self-administered surveys of clinicians. .
Canadian Medical Association Journal, 179, 245-252.
Cadmus, E., Van Wynen, E. A., Chamberlain, B., Steingall, P., Kilgallen, M. E., Holly, C., &
Gallagher-Ford, L. (2008). Nurses' skill level and access to evidence-based practice.
Journal of Nursing Administration, 38(11), 494-503.
202
Calvillo–King, L., Arnold, D., Eubank, K. J., Lo, M., Yunyongying, P., & Halm, E. A. (2013).
Impact of social factors on risk of readmission or mortality in pneumonia and heart
failure: systematic review. Journal of General Internal Medicine, 28(2), 269-282.
Camisón-Zornoza, C., Lapiedra-Alcamí, R., Segarra-Ciprés, M., & Boronat-Navarro, M. (2004).
A meta-analysis of innovation and organizational size. Organization Studies, 25(3), 331-
361.
Canadian Institute for Health Information. (2012). All-cause readmission to acute care and
return to the emergency department. Retrieved from
https://secure.cihi.ca/free_products/Readmission_to_acute_care_en.pdf
Canadian Institute for Health Information. (2015). Quick stats. Retrieved from
https://www.cihi.ca/en/quick-stats?xQSType=Pre-
formatted%252520Table&xTopic=Spending&pageNumber=1&resultCount=10&filterTy
peBy=1&filterTopicBy=14&autorefresh=1
Canadian Institute for Health Information. (2016). Your health system. Retrieved from
http://yourhealthsystem.cihi.ca/hsp/inbrief?lang=en
Carman, K. L., Dardess, P., Maurer, M., Sofaer, S., Adams, K., Bechtel, C., & Sweeney, J.
(2013). Patient and family engagement: A framework for understanding the elements and
developing interventions and policies. Health Affairs, 32(2), 223-231.
Cattell, R. (1978). The scientific use of factor analyses. New York: Plenum Press.
Centers for Medicare & Medicaid Services. (2016). Readmissions reduction program (HRRP).
Retrieved from https://www.cms.gov/medicare/medicare-fee-for-service-
payment/acuteinpatientpps/readmissions-reduction-program.html
Central East Local Health Integration Network. (2014). Central East Home at Last. Retrieved
from http://www.centraleastlhin.on.ca/page.aspx?id=10252.
Chow, S. K. Y., & Wong, F. K. (2010). Health‐related quality of life in patients undergoing
peritoneal dialysis: Effects of a nurse‐led case management programme. Journal of
Advanced Nursing, 66(8), 1780-1792.
Clark, B. R. (2011). Using law to fight a silent epidemic: The role of health literacy in health
care access, quality, and cost. Annals of Health Law, 20, 253-237.
Cloonan, P., Wood, J., & Riley, J. B. (2013). Reducing 30-day readmissions: Health literacy
strategies. Journal of Nursing Administration, 43(7/8), 382-387.
Cohen, J. (1992). A power primer. Psychological Bulletin, 112(1), 155.
Cohen, W. M. & Levinthal, D. A. (1990). Absorptive capacity: A new perspective on learning
and innovation. Administrative Science Quarterly, 35, 128-152.
203
Cohen, W. M., March, J. G., & Olsen, J. P. (1972). A garbage can model of organizational
choice. Administrative Science Quarterly, 17, 1-25.
Coleman, E. & Berenson, R. A. (2004). Lost in transition: Challenges and opportunities for
improving the quality of transitional care. Annals of Internal Medicine, 141(7), 533-536.
Coleman, E., Chugh, A., Williams, M. V., Grigsby, J., Glasheen, J. J., McKenzie, M., & Min, S.-
J. (2013). Understanding and execution of discharge instructions. American Journal of
Medical Quality, 28, 383-391.
Coleman, E., Parry, C., Chalmers, S., & Min, S. (2006). The care transitions intervention:
Results of a randomized controlled trial. Archives of Internal Medicine, 166, 1822 - 1828.
Coleman, E. & Roman, S. P. (2015). Family caregivers' experiences during transitions out of
hospital. Journal for Healthcare Quality, 37(1), 12-21.
Coleman, E, Roman, S. P., Hall, K. A., & Min, S.-j. (2015). Enhancing the Care Transitions
Intervention protocol to better address the needs of family caregivers. Journal for
Healthcare Quality, 37(1), 2-11.
Comrey, A. L., & Lee, H. B. (1992). A first course in factor analysis (2nd. ed.). Hillsdale, NJ:
Erlbaum.
Conway, J. M., & Huffcutt, A. I. (2003). A review and evaluation of exploratory factor analysis
practices in organizational research. Organizational Research Methods, 6(2), 147-168.
Cortina, J. M. (1993). What is coefficient alpha? An examination of theory and applications.
Journal of Applied Psychology, 78(1), 98.
Costantino, M. E., Frey, B., Hall, B., & Painter, P. (2013). The influence of a postdischarge
intervention on reducing hospital readmissions in a Medicare population. Population
Health Management, 16(5), 310-316.
Costello, A. B., & Osborne, J. W. (2005). Best practices in exploratory factor analysis: Four
recommendations for getting the most from your analysis. Practical Assessment,
Research & Evaluation, 10(7), 1-9.
Courtney, M. G. R., & Gordon, M. (2013). Determining the number of factors to retain in EFA:
Using the SPSS R-Menu v2. 0 to make more judicious estimations. Practical Assessment,
Research & Evaluation, 18(8), 1-14.
Creswell, J. W. (2008). Educational research: Planning, conducting and evaluating quantitative
and qualitative research. (Third ed.). Toronto: Pearson.
Cronbach, L. J. (1951). Coefficient alpha and the internal structure of tests. Psychometrika,
16(3), 297-334.
Cua, Y. M., & Kripalani, S. (2008). Medication use in the transition from hospital to home.
Annals of the Academy of Medicine Singapore, 37(2), 136.
204
Cummings, G. G., Estabrooks, C. A., Midodzi, W. K., Wallin, L., & Hayduk, L. (2007).
Influence of organizational characteristics and context on research utilization. Nursing
Research, 56(4), S24-S39.
Cyert, R. M., & March, J. G. (1963). A behavioral theory of the firm. Englewood Cliffs, NJ:
Prentice-Hall.
Damanpour, F. (1992). Organizational size and innovation. Organization Studies, 13(3), 375-
402.
Damanpour, F., & Schneider, M. (2006). Phases of the adoption of innovation in organizations:
Effects of environment, organization and top managers. British Journal of Management,
17(3), 215-236.
Damanpour, F., Walker, R. M., & Avellaneda, C. N. (2009). Combinative effects of innovation
types and organizational performance: A longitudinal study of service organizations.
Journal of Management Studies, 46(4), 650-675.
Damschroder, L. J., Aron, D. C., Keith, R. E., Kirsh, S. R., Alexander, J. A., & Lowery, J. C.
(2009). Fostering implementation of health services research findings into practice: A
consolidated framework for advancing implementation science. Implementation Science,
4(1), 50.
Davis, D. A., & Taylor-Vaisey, A. (1997). Translating guidelines into practice: A systematic
review of theoretic concepts, practical experience and research evidence in the adoption
of clinical practice guidelines. Canadian Medical Association Journal, 157(4), 408-416.
Day, C. (2009). Engaging the nursing workforce: An evidence-based tool kit. Nursing
Administration Quarterly, 33(3), 238-244.
Deber, R. (2014). Concepts for the policy analyst. In R. Deber & C. Mah (Eds.), Case Studies in
Canadian Health Policy and Management (2nd edition ed., pp. 1-93). Toronto, Canada:
University of Toronto Press.
DeWalt, D. A., Callahan, L., Hawk, V., K, B., A, H., R, R., & Brach, C. (2010). Health literacy
universal precautions toolkit. (Prepared by North Carolina Network Consortium, The
Cecil G. Sheps Center for Health Services Research. The University of North Carolina at
Chapel Hill under Contract No. HHSA290200710014). AHRQ Publication No. 10-0046-
EF). Rockville, MD: Agency for Healthcare Research and Quality.
Dickens, C., Lambert, B. L., Cromwell, T., & Piano, M. R. (2013). Nurse overestimation of
patients' health literacy. Journal of Health Communication, 18(sup1), 62-69.
Dijkstra, R., Wensing, M., Thomas, R., Akkermans, R., Braspenning, J., Grimshaw, J., & Grol,
R. (2006). The relationship between organisational characteristics and the effects of
clinical guidelines on medical performance in hospitals, a meta-analysis. BMC Health
Services Research, 6(1), 53.
205
Dillman, D. A., Smyth, J. D., & Christian, L. M. (2009). Internet, mail and mixed-mode surveys:
The tailored design method. (3rd ed.). Hoboken, NJ: Wiley.
Dobbins, M., Ciliska, D., Cockerill, R., Barnsley, J., & DiCenso, A. (2002). A framework for the
dissemination and utilization of research for health-care policy and practice. Online
Journal of Knowledge Synthesis for Nursing, 9(7).
Doctoroff, L., & McNally, D. (2014). Handoffs in hospital medicine. Hospital Medicine Clinics,
3, e1-e14.
Douglas, S. L., Daly, B. J., Kelley, C. G., O’Toole, E., & Montenegro, H. (2007). Chronically
critically ill patients: Health-related quality of life and resource use after a disease
management intervention. American Journal of Critical Care, 16(5), 447-457.
Dudas, V., Bookwalter, T., Kerr, K. M., & Pantilat, S. Z. (2001). The impact of follow-up
telephone calls to patients after hospitalization. American Journal of Medicine, 111(9),
26-30.
Dufault, M. (2004). Testing a collaborative research utilization model to translate best practices
in pain management. Worldviews on Evidence-Based Nursing, 1 Suppl 1, S26-32.
Retrieved from
Dupree, J. M., Neimeyer, J., & McHugh, M. (2014). An advanced look at surgical performance
under Medicare's Hospital-Inpatient Value-Based Purchasing Program: Who is winning
and who is losing? Journal of the American College of Surgeons, 218(1), 1-7.
Eggink, R., Lenderink, A., Widdershoven, J., & Bernt, P. (2010). The effect of a clinical
pharmacist discharge service on medication discrepancies in patients with heart failure.
Pharmacy World & Science, 32(6), 759-766.
Ellen, M. E., Leon, G., Bouchard, G., Lavis, J. N., Ouimet, M., & Grimshaw, J. M. (2013). What
supports do health system organizations have in place to facilitate evidence-informed
decision-making? A qualitative study. Implementation Science, 8, 84.
Estabrooks, C. A., Squires, J. E., Cummings, G. G., Birdsell, J. M., & Norton, P. G. (2009).
Development and assessment of the Alberta Context Tool. BMC Health Services
Research, 9(1), 234.
Evans, D., Grunawalt, J., McClish, D., Wood, W., & Friese, C. R. (2012). Bedside shift-to-shift
nursing report: Implementation and outcomes. Medsurg Nursing, 21(5), 281.
Everett, L. Q., & Sitterding, M. C. (2011). Transformational leadership required to design and
sustain evidence-based practice: a system exemplar. Western Journal of Nursing
Research, 33(3), 398-426.
Everitt, B. (1975). Multivariate analysis: The need for data, and other problems. The British
Journal of Psychiatry, 126(3), 237-240.
206
Fabrigar, L. R., Wegener, D. T., MacCallum, R. C., & Strahan, E. J. (1999). Evaluating the use
of exploratory factor analysis in psychological research. Psychological Methods, 4(3),
272.
Fallis, B. A., Dhalla, I. A., Klemensberg, J., & Bell, C. M. (2013). Primary medication non-
adherence after discharge from a general internal medicine service. PLoS ONE, 8(5),
e61735.
Fennell, M. L. (1984). Synergy, influence, and information in the adoption of administrative
innovations. Academy of Management Journal, 27(1), 113-129.
Ferguson, T. D., & Howell, T. L. (2015). Bedside reporting: Protocols for improving patient
care. Nursing Clinics of North America, 50(4), 735-747.
Field, A. (2009). Discovering statistics using SPSS (Third ed.). Thousand Oaks, CA: Sage
Publications.
Field, A. (2013). Discovering statistics using IBM SPSS statistics. Thousand Oaks, CA: Sage.
Fineout-Overholt, E., Levin, R. F., & Melnyk, B. M. (2004). Strategies for advancing evidence-
based practice in clinical settings. Journal of the New York State Nurses Association,
35(2), 28-32.
Fink, A., Kosecoff, J., Chassin, M., & Brook, R. H. (1984). Consensus methods: Characteristics
and guidelines for use. American Journal of Public Health, 74(9), 979-983.
Floyd, F. J., & Widaman, K. F. (1995). Factor analysis in the development and refinement of
clinical assessment instruments. Psychological Assessment, 7(3), 286.
Forster, A. J., Clark, H. D., Menard, A., Dupuis, N., Chernish, R., Chandok, N., . . . van
Walraven, C. (2004). Adverse events among medical patients after discharge from
hospital. Canadian Medical Association Journal, 170(3), 345-349.
Forster, A. J., Murff, H., Peterson, J., Gandhi, T., & Bates, D. (2003). The incidence and severity
of adverse events affecting patients after discharge from the hospital. Annals of Internal
Medicine, 138, 161 - 167.
Freudenburg, W. (1988). Perceived risk, real risk: Social science and the art of probabilistic risk
assessment. Science, 242(4875), 44-49.
Gale, B. V., & Schaffer, M. A. (2009). Organizational readiness for evidence-based practice.
Journal of Nursing Administration, 39(2), 91-97.
Gardiner, P., Filippelli, A. C., Sadikova, E., White, L. F., & Jack, B. W. (2015). Medication and
dietary supplement interactions among a low-income, hospitalized patient population
who take cardiac medications. Evidence-Based Complementary and Alternative
Medicine, 2015. Retrieved from http://www.hindawi.com/journals/ecam/2015/429826/
207
Gaskin, C. J., & Happell, B. (2014). On exploratory factor analysis: A review of recent evidence,
an assessment of current practice, and recommendations for future use. International
Journal of Nursing Studies, 51(3), 511-521.
Geiger, S. W., & Cashen, L. H. (2002). A multidimensional examination of slack and its impact
on innovation. Journal of Managerial Issues, 14(1), 68-84.
Gifford, W., Davies, B., Edwards, N., Griffin, P., & Lybanon, V. (2007). Managerial leadership
for nurses' use of research evidence: an integrative review of the literature. Worldviews
on Evidence-Based Nursing, 4(3), 126-145.
Gorsuch, R. L. (1997). Exploratory factor analysis: Its role in item analysis. Journal of
Personality Assessment, 68(3), 532-560.
Government of Canada. (2014). Indigenous and Northern Affairs Canada: Ontario region.
Retrieved from https://www.aadnc-aandc.gc.ca/eng/1100100020284/1100100020288
Graham, R., Mancher, M., Wolman, D. M., Greenfield, S., & Steinberg, E. (2011). Clinical
practice guidelines we can trust. Washington DC: National Academies Press.
Green, S. B. (1991). How many subjects does it take to do a regression analysis. Multivariate
Behavioral Research, 26(3), 499-510.
Greenhalgh, T., Robert, G., Macfarlane, F., Bate, P., & Kyriakidou, O. (2004). Diffusion of
innovations in service organizations: Systematic review and recommendations. Milbank
Quarterly, 82(4), 581-629.
Greenwald, J., Denham, C. R., & Jack, B. W. (2007). The hospital discharge: A review of a high
risk care transition with highlights of a reengineered discharge process. Journal of
Patient Safety, 3(2), 97-106.
Greenwald, J. & Jack, B. W. (2009). Preventing the preventable: Reducing rehospitalizations
through coordinated, patient-centered discharge processes. Professional Case
Management, 14(3), 135-140.
Grimshaw, J., & Eccles, M. P. (2004). Is evidence-based implementation of evidence-based care
possible? Medical Journal of Australia, 180(6 Suppl), S50-51.
Grol, R., Bosch, M. C., Hulscher, M. E., Eccles, M. P., & Wensing, M. (2007). Planning and
studying improvement in patient care: The use of theoretical perspectives. Milbank
Quarterly, 85(1), 93-138.
Grol, R., & Grimshaw, J. (2003). From best evidence to best practice: Effective implementation
of change in patients' care. The Lancet, 362(9391), 1225-1230.
Hair, J. F., Black, W. C., Babin, B. J., & Anderson, R. E. (2010). Multivariate data analysis (7th
ed.). Upper Saddle River, NJ: Prentice Hall.
208
Hansen, L. O., Young, R. S., Hinami, K., Leung, A., & Williams, M. V. (2011). Interventions to
reduce 30-day rehospitalization: A systematic review. Annals of Internal Medicine,
155(8), 520-528.
Harper, W., Cook, S., & Makoul, G. (2007). Teaching medical students about health literacy: 2
Chicago initiatives. American Journal of Health Behavior, 31(Supplement 1), S111-
S114.
Harrison, J. D., Auerbach, A. D., Quinn, K., Kynoch, E., & Mourad, M. (2014). Assessing the
impact of nurse post-discharge telephone calls on 30-day hospital readmission rates.
Journal of General Internal Medicine, 29(11), 1519-1525.
Hasson, F., Keeney, S., & McKenna, H. (2000). Research guidelines for the Delphi survey
technique. Journal of Advanced Nursing, 32(4), 1008-1015.
Hayes, A. F. (2013). Introduction to mediation, moderation and conditional process analysis.
New York: The Guilford Press.
Health Quality Ontario. (2013a). An analysis for improvement, 2013-2014. Retrieved from
http://www.hqontario.ca/portals/0/documents/qi/qip-analysis-hospitals-2013-en.pdf
Health Quality Ontario. (2013b). Health literacy and its effect on health outcomes. Paper
presented at the Health Quality Transformation 2013, Toronto, Canada.
http://www.hqontario/portals/0/Documents/home/hqt2013-session-10-en.pdf
Health Quality Ontario. (2015a). 30-day redmission. Retrieved from
http://www.hqontario.ca/Public-Reporting/Primary-Care/Quality-Indicators/30-day-
readmission
Health Quality Ontario. (2015b). About us. Retrieved from http://www.hqontario.ca/About-
Us/Our-Mandate
Heidenreich, P. A., Zhao, X., Hernandez, A. F., Yancy, C. W., & Fonarow, G. C. (2012). Patient
and hospital characteristics associated with traditional measures of inpatient quality of
care for patients with heart failure. American Heart Journal, 163(2), 239-245.e233.
Hesselink, G., Flink, M., Olsson, M., Barach, P., Dudzik-Urbaniak, E., Orrego, C., . . .
Schoonhoven, L. (2012). Are patients discharged with care? A qualitative study of
perceptions and experiences of patients, family members and care providers. BMJ
Quality & Safety, 21(Suppl 1), i39-i49.
Hesselink, G., Vernooij-Dassen, M., Pijnenborg, L., Barach, P., Gademan, P., Dudzik-Urbaniak,
E., . . . Johnson, J. K. (2013). Organizational culture: an important context for addressing
and improving hospital to community patient discharge. Medical Care, 51(1), 90-98.
Hikmet, N., Bhattacherjee, A., Menachemi, N., Kayhan, V. O., & Brooks, R. G. (2008). The role
of organizational factors in the adoption of healthcare information technology in Florida
hospitals. Health Care Management Science, 11(1), 1-9.
209
Hinkin, T. R. (1998). A brief tutorial on the development of measures for use in survey
questionnaires. Organizational Research Methods, 1(1), 104-121.
Hoomans, T., Severens, J. L., Evers, S. M., & Ament, A. J. (2009). Value for money in changing
clinical practice: Should decisions about guidelines and implementation strategies be
made sequentially or simultaneously? Medical Decision Making, 29(2), 207-216.
Horbar, J. D., Plsek, P. E., & Leahy, K. (2003). NIC/Q 2000: Establishing habits for
improvement in neonatal intensive care units. Pediatrics, 111(4), e397-410.
Howie-Esquivel, J., Carroll, M., Brinker, E., Kao, H., Pantilat, S., Rago, K., & De Marco, T.
(2015). A strategy to reduce heart failure readmissions and inpatient costs. Cardiology
Research, 6(1), 201-208.
Innis, J., & Berta, W. (2016). Routines for change: how managers can use absorptive capacity to
adopt and implement evidence-based practice. Journal of Nursing Management.
doi:10.1111/jonm.12368
Innis, J., Dryden-Palmer, K., Perreira, T., & Berta, W. (2015). How do health care organizations
take on best practices? A scoping literature review. International Journal of Evidence-
Based Healthcare, 13, 254-272.
Institute for Healthcare Improvement. (2014). Evidence-based care bundles. Retrieved from
http://www.ihi.org/Topics/Bundles/Pages/default.aspx
Institute of Medicine. (2009). Measures of health literacy: Workshop summary. Washington DC:
National Academies Press.
Institute of Medicine. (2012). How can health care organizations become more health literate? .
Retrieved from Washington DC.:
Jack, B. W., Chetty, V., Anthony, D., Greenwald, J., Sanchez, G., Johnson, A., . . . Culpepper, L.
(2009). A reengineered hospital discharge program to decrease rehospitalization: a
randomized trial. Annals of Internal Medicine, 150, 178 - 187.
Jack, B. W., Chetty, V. K., Anthony, D., Greenwald, J. L., Sanchez, G. M., Johnson, A. E., . . .
Manasseh, C. (2009). A Reengineered Hospital Discharge Program to Decrease
RehospitalizationA Randomized Trial. Annals of Internal Medicine, 150(3), 178-187.
Jack, B. W., Greenwald, J., Forsythe, S., O'Donnell, J., Johnson, A., Schipelliti, L., . . . Chetty,
V. K. (2008). Developing the tools to administer a comprehensive hospital discharge
program: the ReEngineered Discharge (RED) program. In K. Henriksen, J. B. Battles, &
M. A. Keyes (Eds.), Advances in patient safety: New directions and alternative
approaches. (Vol. 3). Rockville, MD: Agency for Healthcare Resarch and Quality.
Jack, B. W., Paasche-Orlow, M., Mitchell, S. A., Forsythe, S. R., Martin, J., & Brach, C. (2013).
An overview of the Re-Engineered Discharge (RED) toolkit. Rockville, MD: Agnecy for
Healthcare Research and Quality.
210
Jackson, & Gillis, A. (2003). Qualitative research strategies. In W. Jackson (Ed.), Methods:
Doing social research. (pp. 134-189). Toronto: Pearson.
Jackson, Vellucci, J., Johnson, P., & Kilbride, H. W. (2003). Evidence-based approach to change
in clinical practice: Introduction of expanded nasal continuous positive airway pressure
use in an intensive care nursery. Pediatrics, 111(4), e542-547.
Jaskyte, K. (2013). Does size really matter? Organizational size and innovations in nonprofit
organizations. Nonprofit Management and Leadership, 24(2), 229-247.
Jencks, S., Williams, M., & Coleman, E. (2009). Rehospitalizations among patients in the
Medicare fee-for-services program. New England Journal of Medicine, 360, 1418 - 1428.
Jiménez-Jiménez, D., & Sanz-Valle, R. (2011). Innovation, organizational learning, and
performance. Journal of Business Research, 64(4), 408-417.
Jupp, V. (Ed.) (2006). The Sage dictionary of social research methods. Thousand Oaks, CA:
Sage.
Karliner, L. S., Auerbach, A., Nápoles, A., Schillinger, D., Nickleach, D., & Pérez-Stable, E. J.
(2012). Language barriers and understanding of hospital discharge instructions. Medical
Care, 50(4), 283.
Kass, R. A., & Tinsley, H. E. (1979). Factor analysis. Journal of Leisure Research, 11(2), 120-
138.
Keenan, P. S., Normand, S.-L. T., Lin, Z., Drye, E. E., Bhat, K. R., Ross, J. S., . . . Epstein, A. J.
(2008). An administrative claims measure suitable for profiling hospital performance on
the basis of 30-day all-cause readmission rates among patients with heart failure.
Circulation: Cardiovascular Quality and Outcomes, 1(1), 29-37.
Keeney, S., Hasson, F., & McKenna, H. (2006). Consulting the oracle: Ten lessons from using
the Delphi technique in nursing research. Journal of Advanced Nursing, 53(2), 205-212.
Kimber, M., Barwick, M., & Fearing, G. (2012). Becoming an evidence-based service provider:
Staff perceptions and experiences of organizational change. The Journal of Behavioral
Health Services & Research, 39(3), 314-332.
Kline, P. (2014). An easy guide to factor analysis. New York: Routledge.
Kocher, R. P., & Adashi, E. Y. (2011). Hospital readmissions and the affordable care act: Paying
for coordinated quality care. JAMA, 306(16), 1794-1795.
Koelling, T. M., Johnson, M. L., Cody, R. J., & Aaronson, K. D. (2005). Discharge education
improves clinical outcomes in patients with chronic heart failure. Circulation, 111(2),
179-185.
Koh, Baur, C., Brach, C., Harris, L. M., & Rowden, J. N. (2013). Toward a systems approach to
health literacy research. Journal of Health Communication, 18(1), 1-5.
211
Koh, Brach, C., Harris, L. M., & Parchman, M. L. (2013). A proposed ‘Health Literate Care
Model’ would constitute a systems approach to improving patients’ engagement In care.
Health Affairs, 32(2), 357-367. doi:10.1377/hlthaff.2012.1205
Kowalski, C., Lee, S.-Y. D., Schmidt, A., Wesselmann, S., Wirtz, M. A., Pfaff, H., &
Ernstmann, N. (2015). The health literate health care organization 10 item questionnaire
(HLHO-10): Development and validation. BMC Health Services Research, 15(1), 47.
Kraetschmer, N., Jass, J., Woodman, C., Koo, I., Kromm, S., & Deber, R. (2014). Hospitals'
internal accountability. Healthcare Policy, 10(Special issue), 36-44.
Kralj, B. (2009). Measuring rurality – RIO2008_BASIC: Methodology and results. Retrieved
from https://www.oma.org/Resources/Documents/2008RIO-FullTechnicalPaper.pdf
Kripalani, S., Jackson, A. T., Schnipper, J. L., & Coleman, E. A. (2007). Promoting effective
transitions of care at hospital discharge: a review of key issues for hospitalists. Journal of
Hospital Medicine, 2(5), 314-323.
Kripalani, S., Jacobson, T. A., Mugalla, I. C., Cawthon, C. R., Niesner, K. J., & Vaccarino, V.
(2010). Health literacy and the quality of physician‐patient communication during
hospitalization. Journal of Hospital Medicine, 5(5), 269-275.
Kripalani, S., LeFevre, F., Phillips, C. O., Williams, M. V., Basaviah, P., & Baker, D. W. (2007).
Deficits in communication and information transfer between hospital-based and primary
care physicians. JAMA, 297(8), 831-841.
Kripalani, S., Wallston, K. A., Cavanaugh, K., Osborn, C. Y., Mulvaney, S., McDougald Scott,
A., & Rothman, R. (2014). Measures to assess a health-literate organization.
Washington DC: National Academies Press.
Krumholz, H., Merrill, A., Schone, E., Schreiner, G., Chen, J., Bradley, E., . . . Drye, E. (2009).
Patterns of hospital performance in acute myocardial infarction and heart failure 30-day
mortality and readmission. Circulation: Cardiovascular Quality & Outcomes, 2(5), 407-
413.
Lane, N., Pitzul, K., Laporte, A., Nauenberg, E., & Wodchis, W. (2013, May 2013). Cost-
effectiveness of a nurse practitioner-led care transition intervention. Paper presented at
the Canadian Association of Health Services Research and Policy, Vancouver, BC.
Lau, F., Doze, S., Vincent, D., Wilson, D., Noseworthy, T., Hayward, R., & Penn, A. (1999).
Patterns of improvisation for evidence-based practice in clinical settings. Information
Technology & People, 12(3), 287-303.
Lawson, M. B. (2001). In praise of slack: Time is of the essence. Academy of Management
Executive, 15, 125-135.
Leape, L. L., Rogers, G., Hanna, D., Griswold, P., Federico, F., Fenn, C. A., . . . Clarridge, B. R.
(2006). Developing and implementing new safe practices: Voluntary adoption through
statewide collaboratives. Quality & Safety in Health Care, 15(4), 289-295.
212
Lehrman, W., Elliott, M., Goldstein, E., Beckett, M., Klein, D., & Giordano, L. (2010).
Characteristics of hospitals demonstrating superior performance in patient experience and
clinical process measures of care. Medical Care Research and Review, 67(1), 38-55.
Leibenstein, H. (1969). Organizational or frictional equilibria, X-efficiency, and the rate of
innovation. The Quarterly Journal of Economics, 600-623.
Levinson, D. (2008). Adverse events in hospitals: Overview of key issues. Retrieved from
Washington, DC: http://oig.hhs.gov/oei/reports/oei-06-07-00470.pdf
Lewin, A. Y., Massini, S., & Peeters, C. (2011). Microfoundations of internal and external
absorptive capacity routines. Organization Science, 22(1), 81-98.
Lindholm, M., Hargraves, J. L., Ferguson, W. J., & Reed, G. (2012). Professional language
interpretation and inpatient length of stay and readmission rates. Journal of General
Internal Medicine, 27(10), 1294-1299.
Lindquist, L. A., Go, L., Fleisher, J., Jain, N., Friesema, E., & Baker, D. W. (2011). Relationship
of health literacy to intentional and unintentional non-adherence of hospital discharge
medications. Journal of General Internal Medicine, 27(2), 173-178.
Longtin, Y., Sax, H., Leape, L. L., Sheridan, S. E., Donaldson, L., & Pittet, D. (2010). Patient
participation: Current knowledge and applicability to patient safety. Mayo Clinic
Proceedings, 85(1), 53-62.
Lukas, C. V., Holmes, S. K., Cohen, A. B., Restuccia, J., Cramer, I. E., Shwartz, M., & Charns,
M. P. (2007). Transformational change in health care systems: An organizational model.
Health Care Management Review, 32(4), 309-320.
Lutfiyya, M. N., Bhat, D. K., Gandhi, S. R., Nguyen, C., Weidenbacher-Hoper, V. L., & Lipsky,
M. S. (2007). A comparison of quality of care indicators in urban acute care hospitals and
rural critical access hospitals in the United States. International Journal for Quality in
Health Care, 19(3), 141-149.
Luxford, K., Safran, D. G., & Delbanco, T. (2011). Promoting patient-centered care: A
qualitative study of facilitators and barriers in healthcare organizations with a reputation
for improving the patient experience. International Journal for Quality in Health Care,
23(5), 510-515.
MacCallum, R. C., Widaman, K. F., Zhang, S., & Hong, S. (1999). Sample size in factor
analysis. Psychological methods, 4(1), 84.
Makaryus, A. N., & Friedman, E. A. (2005). Patients' understanding of their treatment plans and
diagnosis at discharge. Mayo Clinic Proceedings, 80(8), 991-994.
March, J. G. (1991). Exploration and exploitation in organizational learning. Organization
Science, 2(1), 71-87.
213
Markley, J., Andow, V., Sabharwal, K., Wang, Z., Fennell, E., & Dusek, R. (2013). A project to
reengineer discharges reduces 30-day readmission rates. American Journal of Nursing,
113(7), 55-64.
Marvanova, M., Roumie, C. L., Eden, S. K., Cawthon, C., Schnipper, J. L., & Kripalani, S.
(2011). Health literacy and medication understanding among hospitalized adults. Journal
of Hospital Medicine, 6(9), 488-493.
McGillis Hall, L., Doran, D., Baker, G. R., Pink, G. H., Sidani, S., O’Brien-Pallas, L., & Donner,
G. J. (2003). Nurse staffing models as predictors of patient outcomes. Medical Care,
41(9), 1096-1109.
McHugh, M. D., Kelly, L. A., Smith, H. L., Wu, E. S., Vanak, J. M., & Aiken, L. H. (2013).
Lower mortality in magnet hospitals. Medical Care, 51(5), 382-388.
McNaughton, C. D., Cawthon, C., Kripalani, S., Liu, D., Storrow, A. B., & Roumie, C. L.
(2015). Health literacy and mortality: A cohort study of patients hospitalized for acute
heart failure. Journal of the American Heart Association, 4, e001799.
Meyers, Gaust, G., & Guarino, A. J. (2013). Applied multivariate research: Design and
interpretation. Thousand Oaks, CA: Sage.
Meyers, Salanitro, A., Wallston, K. A., Cawthon, C., Vasilevskis, E. E., Goggins, K. M., . . .
Donato, K. M. (2014). Determinants of health after hospital discharge: Rationale and
design of the Vanderbilt Inpatient Cohort Study (VICS). BMC Health Services Research,
14(1), 10.
Ministry of Health and Long-Term Care. (2006). A guide to better physician documentation:
Physician documentation expert panel. Retrieved from
http://www.health.gov.on.ca/transformation/providers/information/pdf/guide_bpd.pdf
Ministry of Health and Long-Term Care. (2008, January 14, 2014). MedsCheck. Retrieved from
http://www.health.gov.on.ca/en/pro/programs/drugs/medscheck/medscheck_original.aspx
Ministry of Health and Long-Term Care. (2011). Rural and northern health care
framework/plan: Final report. Retrieved from
http://health.gov.on.ca/en/public/programs/ruralnorthern/docs/report_rural_northern_EN.
Ministry of Health and Long-Term Care. (2013a). Classification of hospitals: Group A hospitals.
Retrieved from
http://www.health.gov.on.ca/en/common/system/services/hosp/hospcode.aspx
Ministry of Health and Long-Term Care. (2013b). Classification of hospitals: Group B hospitals.
Retrieved from
http://www.health.gov.on.ca/en/common/system/services/hosp/group_b.aspx

214
Ministry of Health and Long-Term Care. (2013c). Classification of hospitals: Group C hospitals.
Retrieved from
http://www.health.gov.on.ca/en/common/system/services/hosp/group_c.aspx
Ministry of Health and Long-Term Care. (2013d). Excellent care for all act updates - Quality
Committees: Best practice resources to support quality committee roles and
responsibilities. . Retrieved from
http://www.health.gov.on.ca/en/pro/programs/ecfa/legislation/qualitycommittee/bp_resou
rces.aspx
Ministry of Health and Long-Term Care. (2013e). Excellent care for all: Real change in action –
Emergency Department Process Improvement. Retrieved from
http://www.health.gov.on.ca/en/pro/programs/ecfa/quality/research/cst_ed_process.aspx
Ministry of Health and Long-Term Care. (2014a). Excellent care for all: Home first – putting
patients at the centre of their health care. Retrieved from
http://www.health.gov.on.ca/en/pro/programs/ecfa/action/community/com_homefirst.asp
x
Ministry of Health and Long-Term Care. (2014b). Home at Last (HAL): Back to the basics.
Retrieved from
http://www.health.gov.on.ca/en/pro/programs/ecfa/action/acute/pri_hal.aspx
Ministry of Health and Long-Term Care. (2014c). Indicator technical specifications: Quality
Improvement Plan 2015/16. Retrieved from
http://www.health.gov.on.ca/en/pro/programs/ecfa/legislation/qualityimprove/qip_tech.p
df
Ministry of Health and Long-Term Care. (2015a). Health system funding reform: Quality-Based
Procedures. Retrieved from
http://www.health.gov.on.ca/en/pro/programs/ecfa/funding/hs_funding_qbp.aspx
Ministry of Health and Long-Term Care. (2015b). Patients first: Action plan for health care.
Toronto, ON: Ministry of Health and Long-Term Care Retrieved from
http://www.health.gov.on.ca/en/ms/ecfa/healthy_change/docs/rep_patientsfirst.pdf.
Ministry of Health and Long-Term Care. (2015c). Transforming Ontario’s health care system.
Retrieved from
http://www.health.gov.on.ca/en/pro/programs/transformation/community.aspx
Mistiaen, P., & Poot, E. (2006). Telephone follow-up, initiated by a hospital-based health
professional, for postdischarge problems in patients discharged from hospital to home.
Cochrane Database Systematic Review, 4(4).
Mitchell, S. E., Martin, J., Holmes, S., van Deusen, L. C., Cancino, R., Paasche-Orlow, M., . . .
Jack, B. (2016). How hospitals reengineer their discharge processes to reduce
readmissions. Journal for Healthcare Quality, 38(2), 116-126.
215
Mitchell, S. E., Sadikova, E., Jack, B. W., & Paasche-Orlow, M. K. (2012). Health literacy and
30-day postdischarge hospital utilization. Journal of Health Communication, 17(sup3),
325-338.
Moser, D. K., Robinson, S., Biddle, M. J., Pelter, M. M., Nesbitt, T., Southard, J., . . . Dracup, K.
(2015). Health literacy predicts morbidity and mortality in rural patients with heart
failure. Journal of Cardiac Failure, 21, 612-618.
Mudge, A. M., Shakhovskoy, R., & Karrasch, A. (2013). Quality of transitions in older medical
patients with frequent readmissions: Opportunities for improvement. European Journal
of Internal Medicine, 24(8), 779-783.
Mullen, P. M. (2003). Delphi: myths and reality. Journal of Health Organization and
Management, 17(1), 37-52.
Murray, T., Hagey, J., Willms, D., Shillington, R., & Desjardins, R. (2008). Health literacy in
Canada: A healthy understanding Ottawa, ON: Canadian Council on Learning.
Naylor, M., Brooten, D., Jones, R., Lavizzo-Mourey, R., Mezey, M., & Pauly, M. (1994).
Comprehensive discharge planning for the hospitalized elderlya randomized clinical trial.
Annals of Internal Medicine, 120(12), 999-1006.
Naylor, M., Brooten, D. A., Campbell, R. L., Maislin, G., McCauley, K. M., & Schwartz, J. S.
(2004). Transitional care of older adults hospitalized with heart failure: a randomized,
controlled trial. Journal of the American Geriatrics Society, 52(5), 675-684.
Naylor, M., Stephens, C., Bowles, K. H., & Bixby, M. B. (2005). Cognitively impaired older
adults, from hospital to home: An exploratory study of these patients and their caregivers.
American Journal of Nursing, 105(2), 52-61.
Nelson, R. R., & Rudestam, K. E. (1999). Your statistical consultant: Answers to your data
analysis quesitons. London: Sage.
Nielsen-Bohlman, L., Panzer, A. M., & Kindig, D. A. (2004). Health literacy: A prescription to
end confusion. Washington DC: National Academies Press.
Nielsen, G. A., Rutherford, P., & Taylor, J. (2009). How-to-guide: Creating an ideal transition
home. Retrieved from http://ah.cms-
plus.com/files/IHI_How_to_Guide_Creating_an_Ideal_Transition_Home.pdf
Nohria, N., & Gulati, R. (1996). Is slack good or bad for innovation? Academy of Management
Journal, 39(5), 1245-1264.
Nonaka, I. (1994). A dynamic theory of organizational knowledge creation. Organization
Science, 5, 14-37.
Nosbusch, J. M., Weiss, M. E., & Bobay, K. L. (2011). An integrated review of the literature on
challenges confronting the acute care staff nurse in discharge planning. Journal of
Clinical Nursing, 20(5‐6), 754-774.
216
Nunnally, J. (1978). Psychometric methods. New York: McGraw-Hill.
Oates, J., Weston, W. W., & Jordan, J. (2000). The impact of patient-centered care on outcomes.
Family Practice, 49, 796-804.
OECD. (2014). Geographic variations in health care: What do we know and what can be done to
improve health system performance? Retrieved from
http://dx.doi.org/10.1787/978264216594-en
Office of the Auditor General of Ontario. (2015). Annual Report. Retrieved from
http://www.auditor.on.ca/en/reports_en/en15/3.08en15.pdf
Okafor, M. C., & Thomas, J., 3rd. (2008). Presence of innovation adoption-facilitating elements
in hospitals, and relationship to implementation of clinical guidelines. Annals of
Pharmacotherapy, 42(3), 354-360.
Olade, R. A. (2004). Strategic collaborative model for evidence-based nursing practice.
Worldviews on Evidence-Based Nursing, 1(1), 60-68.
Ong, M. S., Magrabi, F., Jones, G., & Coiera, E. (2012). Last orders: Follow-up of tests ordered
on the day of hospital discharge. Archives of Internal Medicine, 172, 1347-1348.
Ontario Hospital Association. (2013). Regional affairs. Retrieved from
https://www.oha.com/AboutUs/RegionalAffairs/Pages/RegionalAffairs.aspx
Paasche-Orlow, Riekert, K. A., Bilderback, A., Chanmugam, A., Hill, P., Rand, C. S., &
Krishnan, J. A. (2005). Tailored education may reduce health literacy disparities in
asthma self-management. American Journal of Respiratory and Critical Care Medicine,
172, 980-986.
Paasche-Orlow, & Wolf, M. S. (2008). Evidence does not support clinical screening of literacy.
Journal of General Internal Medicine, 23(1), 100-102.
Panzano, P., & Roth, D. (2006). The decision to adopt evidence-based and other innovative
mental health practices: Risky business? Psychiatric Services, 57(8), 1153-1161.
Parsons, H. M., Begun, J. W., McGovern, P. M., Tuttle, T. M., Kuntz, K. M., & Virnig, B. A.
(2013). Hospital characteristics associated with maintenance or improvement of
guideline-recommended lymph node evaluation for colon cancer. Medical Care, 51(1),
60-67.
Patton, M. Q. (2002). Qualitative research and evaluation methods. Thousand Oaks, CA: Sage
Publications.
Peeters, C., Massini, S., & Lewin, A. (2014). Sources of variation in the efficiency of adopting
management innovation: The role of absorptive capacity routines, managerial attention
and organizational legitimacy. Organization Studies, 35(9), 1343-1371.
217
Peter, D., Robinson, P., Jordan, M., Lawrence, S., Casey, K., & Salas-Lopez, D. (2015).
Reducing readmissions using teach-back: enhancing patient and family education.
Journal of Nursing Administration, 45(1), 35-42.
Phatak, A., Prusi, R., Ward, B., Hansen, L. O., Williams, M. V., Vetter, E., . . . Postelnick, M.
(2016). Impact of pharmacist involvement in the transitional care of high‐risk patients
through medication reconciliation, medication education, and postdischarge call‐backs
(IPITCH Study). Journal of Hospital Medicine, 11(1), 39-44.
Plath, D. (2013). Organizational processes supporting evidence-based practice. Administration in
Social Work, 37(2), 171-188.
Ploeg, J., Davies, B., Edwards, N., Gifford, W., & Miller, P. E. (2007). Factors influencing best-
practice guideline implementation: lessons learned from administrators, nursing staff, and
project leaders. Worldviews on Evidence-Based Nursing, 4(4), 210-219.
Powell, C. (2003). The Delphi technique: Myths and realities. Journal of Advanced Nursing,
41(4), 376-382.
Registered Nurses’ Association of Ontario. (2015). Best practice spotlight organizations
Retrieved from http://rnao.ca/bpg/bpso
Robert Wood Johnson Foundation. (2013). The revolving door: A report on U.S. hospital
readmissions. Retrieved from
www.rwjf.org/content/dam/farm/reports/reports/2013/rwjf404178
Rootman, I., & Gordon-El-Bihbety, D. (2008). A vision for a health literate Canada. Ottawa,
ON: Canadian Public Health Association.
Rose, A. J., Petrakis, B. A., Callahan, P., Mambourg, S., Patel, D., Hylek, E. M., & Bokhour, B.
G. (2012). Organizational characteristics of high- and low-performing anticoagulation
clinics in the veterans health administration. Health Services Research, 47(4), 1541-1560.
Rowe, G., & Wright, G. (1999). The Delphi technique as a forecasting tool: Issues and analysis.
International Journal of Forecasting, 15(4), 353-375.
Roy, Poon, E. G., Karson, A. S., Ladak-Merchant, Z., Johnson, R. E., Maviglia, S. M., &
Ghandi, T. K. (2005). Patient safety concerns arising from test results that return after
hospital dischage. Annals of Internal Medicine, 143, 121-128.
Ruffolo, M. C., Savas, S. A., Neal, D., Capobianco, J., & Reynolds, K. (2009). The challenges of
implementing an evidence-based practice to meet consumer and family needs in a
managed behavioral health care environment. Social Work in Mental Health, 7(1-3), 30-
41.
Runyon, R. P., Coleman, K. A., & Pittenger, D. J. (2000). Fundamentals of behavioral statistics
(9th ed.). New York, NY: McGraw-Hill.
218
Sandelowski, M. (1995). Qualitative analysis: What it is and how to begin. Research in Nursing
& Health, 18(4), 371-375.
Saufl, N. M., & Fieldus, M. H. (2003). Accreditation: A "voluntary" regulatory requirement.
Journal of PeriAnesthesia Nursing, 18(3), 152-159.
Schein, E. H. (2010). Organizational culture and leadership (4th ed.). Hoboken, NJ: John Wiley
& Sons.
Schillinger, Piette, J., Grumbach, K., Wang, F., Wilson, C., Daher, C., . . . Bindman, A. (2003).
Closing the loop. Physician communication with diabetic patients who have low health
literacy. Archives of Internal Medicine, 163, 83 - 90.
Schnipper, J., Kirwin, J., Cotugno, M., Wahlstrom, S., Brown, B., Tarvin, E., . . . Bates, D.
(2006). Role of pharmacist counseling in preventing adverse drug events after
hospitalization. Archives of Internal Medicine, 166, 565 - 571.
Sharp, N. D., Pineros, S. L., Hsu, C., Starks, H., & Sales, A. E. (2004). A qualitative study to
identify barriers and facilitators to implementation of pilot interventions in the Veterans
Health Administration (VHA) Northwest Network. Worldviews on Evidence-Based
Nursing, 1(2), 129-139.
Shekelle, P. G. (2013). Nurse–patient ratios as a patient safety strategy: A systematic review.
Annals of Internal Medicine, 158(5, Part 2), 404-409.
Shepperd, S., Lannin, N. A., Clemson, L. M., McCluskey, A., Cameron, I. D., & Barras, S. L.
(2013). Discharge planning from hospital to home. Cochrane Database Systematic
Reviews, 1.
Shoeb, M., Merel, S. E., Jackson, M. B., & Anawalt, B. D. (2012). “Can we just stop and talk?”
Patients value verbal communication about discharge care plans. Journal of Hospital
Medicine, 7(6), 504-507.
Shojania, K. G., Duncan, B. W., McDonald, K. M., Wachter, R. M., & Markowitz, A. J. (2001).
Making health care safer: A critical analysis of patient safety practices. Rockville, MD:
Agency for Healthcare Research and Quality
Singh, S., Lin, Y. L., Kuo, Y., Nattinger, A. B., & Goodwin, J. S. (2014). Variation in the risk of
readmission among hospitals: The relative contribution of patient, hospital and inpatient
provider characteristics. Journal of General Internal Medicine, 29, 572-578.
Skulmoski, G. J., Hartman, F. T., & Krahn, J. (2007). The Delphi method for graduate research.
Journal of Information Technology Education, 6, 1.
Smith, M., Saunders, R., Stuckhardt, L., & McGinnis, J. M. (2013). Best care at lower cost: The
path to continuously learning health care in America. Washington DC: National
Academies Press.
219
Soong, C., Daub, S., Lee, J., Majewski, C., Musing, E., Nord, P., . . . Bell, C. M. (2013).
Development of a checklist of safe discharge practices for hospital patients. Journal of
Hospital Medicine, 8(8), 444-449.
St. Michael's Hospital. (2010). Quality healthcare for all. Retrieved from
http://www.stmichaelshospital.com/pdf/corporate/equity_report_2010.pdf
Stephans, R. A. (2004). Systems safety for the 21st century: The updated and revised edition of
system safety 2000. Hoboken, NJ: Wiley.
Stevens, J. P. (2012). Applied multivariate statistics for the social sciences. New York:
Routledge.
Stevens, S. (2015). Preventing 30-day readmissions. Nursing Clinics of North America, 50(1),
123-137.
Stoeckle-Roberts, S., Reeves, M. J., Jacobs, B. S., Maddox, K., Choate, L., Wehner, S., &
Mullard, A. J. (2006). Closing gaps between evidence-based stroke care guidelines and
practices with a collaborative quality improvement project. Joint Commission Journal on
Quality & Patient Safety, 32(9), 517-527.
Sudore, R. L., Yaffe, K., Satterfield, S., Harris, T. B., Mehta, K. M., Simonsick, E. M., . . .
Rubin, S. M. (2006). Limited literacy and mortality in the elderly: The health, aging, and
body composition study. Journal of General Internal Medicine, 21(8), 806-812.
Tabachnick, B. G., & Fidell, L. S. (2007). Using multivariate statistics (5th ed.). Boston:
Pearson.
Taylor, N., Clay-Williams, R., Hogden, E., Braithwaite, J., & Groene, O. (2015). High
performing hospitals: a qualitative systematic review of associated factors and practical
strategies for improvement. BMC health services research, 15(1), 244.
Taylor, C. R., Hepworth, J. T., Buerhaus, P. I., Dittus, R., & Speroff, T. (2007). Effect of crew
resource management on diabetes care and patient outcomes in an inner-city primary care
clinic. Quality & Safety in Health Care, 16(4), 244-247.
Teddlie, C., & Tashakkori, A. (2009). Foundations of mixed methods research. Thousand Oaks,
CA: Sage.
Thomas, D. R. (2006). A general inductive approach for analyzing qualitative evaluation data.
American Journal of Evaluation, 27(2), 237-246.
Titler, M., Kleiber, C., Steelman, V., Goode, C., Rakel, B., Barry-Walker, J., . . . Buckwalter, K.
(1994). Infusing research into practice to promote quality care. Nursing Research, 43(5),
307-313.
Tobiano, G., Chaboyer, W., & McMurray, A. (2013). Family members’ perceptions of the
nursing bedside handover. Journal of Clinical Nursing, 22(1-2), 192-200.
220
Tucker, A. L., Nembhard, I. M., & Edmondson, A. C. (2007). Implementing new practices: An
empirical study of organizational learning in hospital intensive care units. Management
Science, 53(6), 894-907.
U.S. Department of Health and Human Services, O. o. D. P. a. H. P., . (2010). National Action
Plan to Improve Health Literacy. Washington, DC: US Department of Health and Human
Services, Office of Disease Prevention and Health Promotion.
Van Geest, J., & Johnson, T. P. (2011). Surveying nurses: Identifying strategies to improve
participation. Evaluation & the Health Professions, 34, 487-511.
Van Geest, J., Johnson, T. P., & Welch, V. L. (2007). Methodologies for improving response
rates in surveys of physicians a systematic review. Evaluation & the Health Professions,
30(4), 303-321.
van Walraven, C., Bennett, C., Jennings, A., Austin, P. C., & Forster, A. J. (2011). Proportion of
hospital readmissions deemed avoidable: A systematic review. Canadian Medical
Association Journal, 183(7), E391-E402.
Van Walraven, C., Mamdani, M., Fang, J., & Austin, P. C. (2004). Continuity of care and patient
outcomes after hospital discharge. Journal of General Internal Medicine, 19(6), 624-631.
Van Walraven, C., Seth, R., Austin, P. C., & Laupacis, A. (2002). Effect of discharge summary
availability during post-discharge visits on hospital readmission. Journal of General
Internal Medicine, 17(3), 186-192.
van Walraven, C., Taljaard, M., Bell, C. M., Etchells, E., Stiell, I. G., Zarnke, K., & Forster, A. J.
(2010). A prospective cohort study found that provider and information continuity was
low after patient discharge from hospital. Journal of clinical epidemiology, 63(9), 1000-
1010.
Vashi, A. A., Fox, J. P., Carr, B. G., D’Onofrio, G., Pines, J. M., Ross, J. S., & Gross, C. P.
(2013). Use of hospital-based acute care among patients recently discharged from the
hospital: acute care use after recent hospital discharge. JAMA, 309(4), 364-371.
Wachter, R. M. (2013). Personal accountability in healthcare: Searching for the right balance.
BMJ Quality & Safety, 22(2), 176-180.
Wagner, E. H., Austin, B. T., & Von Korff, M. (1996). Organizing care for patients with chronic
illness. The Milbank Quarterly, 74(4), 511-544.
Weiss, M. E., Yakusheva, O., & Bobay, K. L. (2011). Quality and cost analysis of nurse staffing,
discharge preparation, and postdischarge utilization. Health Services Research, 46(5),
1473-1494.
White, M., Garbez, R., Carroll, M., Brinker, E., & Howie-Esquivel, J. (2013). Is “teach-back”
associated with knowledge retention and hospital readmission in hospitalized heart failure
patients? Journal of Cardiovascular Nursing, 28(2), 137-146.

221
Williams, M. V., Davis, T., Parker, R. M., & Weiss, B. D. (2002). The role of health literacy in
patient-physician communication. Family Medicine, 34(5), 383-389.
Williamson, O. E. (1964). The economics of discretionary behavior: Managerial objectives in a
theory of the firm. New Jersey: Prentice-Hall.
Zahra, S. A., & George, G. (2002). Absorptive capacity: A review, reconceptualization, and
extension. Academy of Management Review, 27(2), 185-203.
222
Appendix A: Email for Round 1, Delphi panel
Dear (name of potential participant),
I am contacting you to request your participation in a study that will lead to the
development of a tool to assess how well hospitals discharge patients from the acute care
hospital setting to home. This study is part of my dissertation research at the Institute of Health
Policy, Management and Evaluation at the University of Toronto. This research is being
supervised by Dr. Jan Barnsley and Dr. Whitney Berta.
As you are likely aware, Ontario has a high rate of hospital readmission, particularly for
medical patients, and there is a growing understanding that hospital discharge processes
contribute to this readmission rate. When patients do not understand discharge instructions or
have difficulty following treatment plans, there is an increased chance that they will return to
hospital within 30 days of discharge. At present, there is no organizational tool to assess hospital
discharge practices. Such a tool could be used in quality improvement efforts, and would help
hospital managers and policy makers to monitor hospitals’ performance of discharge.
You have been identified as an expert in (hospital discharge/care transitions/health
literacy) (research/practice), and I would be grateful for your help to develop the
assessment tool.
Please refer to the attached Participant Information Sheet. If you have any questions or
concerns please contact me at [email protected].
Thank you for your consideration,
Jennifer Innis
Email: [email protected]
Phone: (416) 571-3248
223
Appendix B: Participant Information Letter, Round 1
Participant Information Sheet
Health Literate Discharge Practices in Ontario Hospitals
My thanks for your interest in this study. Please read the information provided below carefully.
Background
This study seeks to develop an organizational tool to assess how hospitals discharge patients
from general medicine units to home. As you are likely aware, Ontario has a high rate of hospital
readmission particularly for medical patients, and there is a growing understanding that hospital
discharge processes contribute to this readmission rate. When patients do not understand
discharge instructions or have difficulty following treatment plans, there is an increased chance
that they will return to hospital within 30 days of discharge.
At present, there is no organizational tool to assess hospital discharge practices. Such a tool
could be used in quality improvement efforts, and would help hospitals and policy makers to
monitor hospitals’ performance of discharge. The initial items for this survey will based on the
components of Project RED (Re-Engineered Discharge), a program that has been found to be
significantly associated with decreased hospital readmission.
Methods
A virtual consultation process will be used to examine items that need to be included in this
organizational tool by a diverse group of experts. It is anticipated that this process will take 2-3
rounds. On the first round, you will be asked to rank the importance of the items, and to suggest
additional items that you think are important. Participation will be via electronic mail and you
will be asked to complete an internet based survey. If you prefer, a regular mail option will be
available and you will be mailed a questionnaire with a stamped envelope for reply. After the
results of the first round have been analyzed, you will be sent rankings of the items. Items that
have received poor rankings will not be included. Although suggested additional items will be
included, it is expected that there will be fewer items to rate following the first round. Each
round will take 15-30 minutes to complete, and there will be 2-3 rounds. This Delphi process
will take place from September to December, 2014. The input that you provide will be used to
create an organizational survey tool to measure health literate discharge practices in hospitals.
This tool will allow hospitals and policy makers to measure performance of hospital discharge.
224
Participation in this study is voluntary and there are no risks to you from being involved. Your
identity will be known only to the investigators, not to other participants, and your responses will
be kept strictly anonymous. Any information that could be used to identify you or the
organization you are affiliated with will be removed. You may withdraw from the study at any
time, and if you withdraw, your responses will not be used. If you have any questions about
your rights as a research participant, you may contact the Office of Office of Research Ethics
([email protected] or 416-946-3273).
If you have any questions regarding this research, please contact me at the email address
provided below.
Thank you in advance for your time and cooperation.
Sincerely,
Jennifer Innis, PhD(c)
Institute of Health Policy, Management and Evaluation
Health Sciences Building, Suite 425
155 College Street, Toronto ON M5T 3M6
Email address: [email protected]
Jan Barnsley, Associate Professor
Institute of Health Policy, Management and Evaluation
Email address: [email protected]
Whitney Berta, Associate Professor
Institute of Health Policy, Management and Evaluation
Email address: [email protected]
Your participation
Given your knowledge and experience with discharge practices, your participation will greatly
enhance expert dialogue and the study’s results. You may also find participating in this study a
unique opportunity to learn about, critique, and shape a new organizational assessment tool.
If you choose to participate, you have 3 options for submitting your questionnaire:
1. Complete on the Web at
http://fluidsurveys.com/surveys/whit-3hx/hospital-discharge/
2. Complete the word document provided and send via email to
3. Contact [email protected] for a paper copy of the questionnaire and a
stamped envelope.
Please submit your completed questionnaire by Friday, October 17, 2014.
225
Appendix C: Reminder Notice, Round 1
Dear (participant),
I contacted you earlier this month to request your participation in a study that will lead to the
development of a tool to assess how well hospitals discharge patients from the acute care
hospital setting to home. This study is part of my dissertation research at the Institute of Health
Policy, Management and Evaluation at the University of Toronto. This research is being
supervised by Dr. Jan Barnsley and Dr. Whitney Berta.
If you have already responded, please disregard this email.
If you have not yet responded, please refer to the attached Participant Information Sheet.
The web based link to the survey can be found at:
http://fluidsurveys.com/surveys/whit-3hx/hospital-discharge/
If you have any questions or concerns please contact me at [email protected].
Thank you,
Jennifer Innis
226
Appendix D: Email for Round 2, Delphi panel
Dear (participant)
Thank you for participating in the first round of the Delphi study. As you may recall, in Round 1
you were asked to rate a list of 34 indicators for their importance to health literate discharge
practices. All of the indicators received ratings of important or very important.
In response to the feedback received in Round 1, two of the indicators have been reworded, and
two new indicators have been added. In Round 2, I ask that you rate these 4 indicators using a
scale from 1 (least important) to 5 (most important). It will take approximately 10 minutes to
complete this rating process.
You have 3 options for submitting the Round 2 questionnaire:
1. Complete on the Web at
http://fluidsurveys.com/surveys/whit-3hx/health-literate-discharge-practices-round-
2/
2. Complete the word document provided and send via email to
3. Contact [email protected] for a paper copy of the questionnaire and a
stamped envelope.
Please submit your completed questionnaire by Friday November 21.
If you have any questions or concerns please contact me at [email protected].
Thank you for your participation,
Jennifer Innis
227
Appendix E: Participant Information Letter, Round 2
Participant Information Sheet Health Literate Discharge Practices in Ontario Hospitals
My thanks for your interest in this study. Please read the information provided below carefully.
Background
This study seeks to develop an organizational tool to assess how hospitals discharge patients
from general medicine units to home. As you are likely aware, Ontario has a high rate of hospital
readmission particularly for medical patients, and there is a growing understanding that hospital
discharge processes contribute to this readmission rate. When patients do not understand
discharge instructions or have difficulty following treatment plans, there is an increased chance
that they will return to hospital within 30 days of discharge.
At present, there is no organizational tool to assess hospital discharge practices. Such a tool
could be used in quality improvement efforts, and would help hospitals and policy makers to
monitor hospitals’ performance of discharge. The initial items for this survey will based on the
components of Project RED (Re-Engineered Discharge), a program that has been found to be
significantly associated with decreased hospital readmission.
Methods
A virtual consultation process will be used to examine items that need to be included in this
organizational tool by a diverse group of experts. It is anticipated that this process will take 2-3
rounds. On the first round, you will be asked to rank the importance of the items, and to suggest
additional items that you think are important. Participation will be via electronic mail and you
will be asked to complete an internet based survey. If you prefer, a regular mail option will be
available and you will be mailed a questionnaire with a stamped envelope for reply. After the
results of the first round have been analyzed, you will be sent rankings of the items. Items that
have received poor rankings will not be included. Although suggested additional items will be
included, it is expected that there will be fewer items to rate following the first round. Each
round will take 15-30 minutes to complete, and there will be 2-3 rounds. This Delphi process
will take place from September to December, 2014. The input that you provide will be used to
create an organizational survey tool to measure health literate discharge practices in hospitals.
This tool will allow hospitals and policy makers to measure performance of hospital discharge.
228
Participation in this study is voluntary and there are no risks to you from being involved. Your
identity will be known only to the investigators, not to other participants, and your responses will
be kept strictly anonymous. Any information that could be used to identify you or the
organization you are affiliated with will be removed. You may withdraw from the study at any
time, and if you withdraw, your responses will not be used. If you have any questions about
your rights as a research participant, you may contact the Office of Office of Research Ethics
([email protected] or 416-946-3273).
If you have any questions regarding this research, please contact me at the email address
provided below.
Thank you in advance for your time and cooperation.
Sincerely,
Jennifer Innis, PhD(c)
Institute of Health Policy, Management and Evaluation
Health Sciences Building, Suite 425
155 College Street, Toronto ON M5T 3M6
Email address: [email protected]
Jan Barnsley, Associate Professor
Institute of Health Policy, Management and Evaluation
Email address: [email protected]
Whitney Berta, Associate Professor
Institute of Health Policy, Management and Evaluation
Email address: [email protected]
Your participation
Given your knowledge and experience with discharge practices, your participation will greatly
enhance expert dialogue and the study’s results. You may also find participating in this study a
unique opportunity to learn about, critique, and shape a new organizational assessment tool.
If you choose to participate, you have 3 options for submitting your questionnaire:
4. Complete on the Web at
http://fluidsurveys.com/surveys/whit-3hx/health-literate-discharge-practices-round-2/
5. Complete the word document provided and send via email to
6. Contact [email protected] for a paper copy of the questionnaire and a
stamped envelope.
Please submit your completed questionnaire by Friday, November 14, 2014.
229
Appendix F: Reminder Notice, Round 2
Dear (participant),
I contacted you two weeks ago to request your participation in the second round of the Delphi
study. If you have already responded, please disregard this email. In this second round, I am
asking you to rate the importance of 4 indicators.
You have 3 options for submitting the Round 2 questionnaire:
1. Complete on the Web at http://fluidsurveys.com/surveys/whit-3hx/health-literate-discharge-practices-round-2/
2. Complete the word document provided and send via email to [email protected]
3. Contact [email protected] for a paper copy of the questionnaire and a stamped envelope.
If you have any questions or concerns please contact me at [email protected].
Thank you,
Jennifer Innis
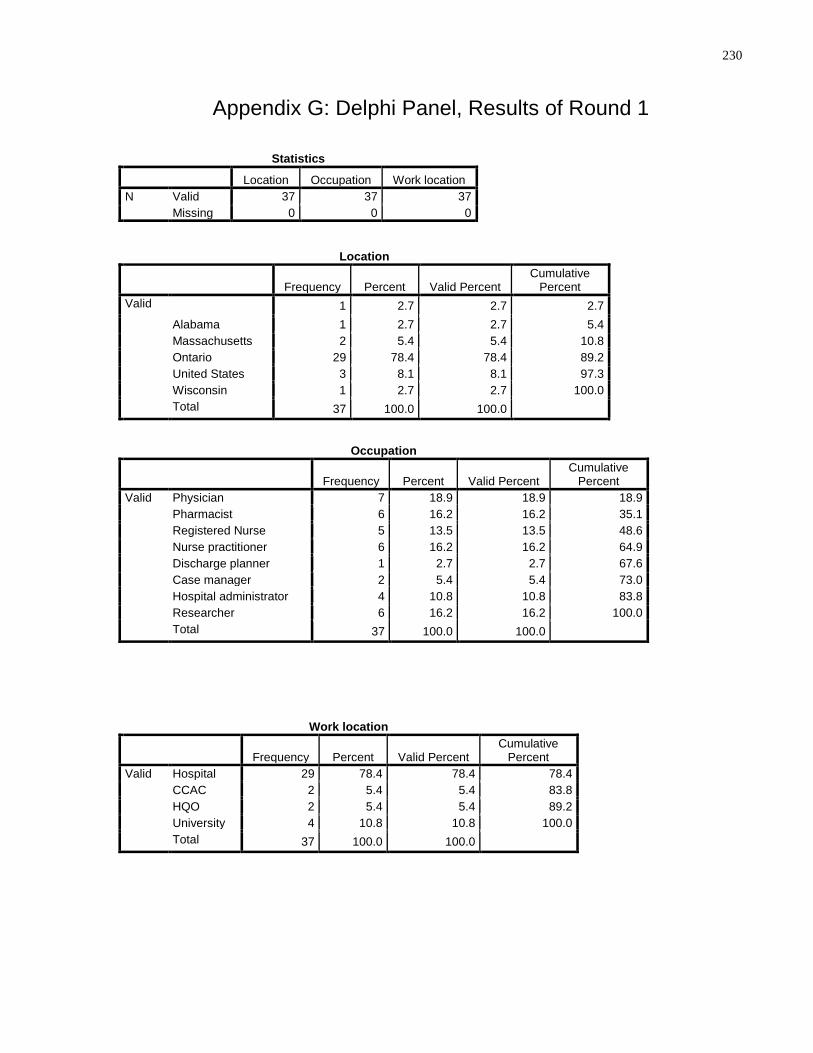
230
Appendix G: Delphi Panel, Results of Round 1
Statistics
Location Occupation Work location
N Valid 37 37 37
Missing 0 0 0
Location
Frequency Percent Valid Percent Cumulative
Percent
Valid 1 2.7 2.7 2.7
Alabama 1 2.7 2.7 5.4
Massachusetts 2 5.4 5.4 10.8
Ontario 29 78.4 78.4 89.2
United States 3 8.1 8.1 97.3
Wisconsin 1 2.7 2.7 100.0
Total 37 100.0 100.0
Occupation
Frequency Percent Valid Percent Cumulative
Percent
Valid Physician 7 18.9 18.9 18.9
Pharmacist 6 16.2 16.2 35.1
Registered Nurse 5 13.5 13.5 48.6
Nurse practitioner 6 16.2 16.2 64.9
Discharge planner 1 2.7 2.7 67.6
Case manager 2 5.4 5.4 73.0
Hospital administrator 4 10.8 10.8 83.8
Researcher 6 16.2 16.2 100.0
Total 37 100.0 100.0
Work location
Frequency Percent Valid Percent Cumulative
Percent
Valid Hospital 29 78.4 78.4 78.4
CCAC 2 5.4 5.4 83.8
HQO 2 5.4 5.4 89.2
University 4 10.8 10.8 100.0
Total 37 100.0 100.0
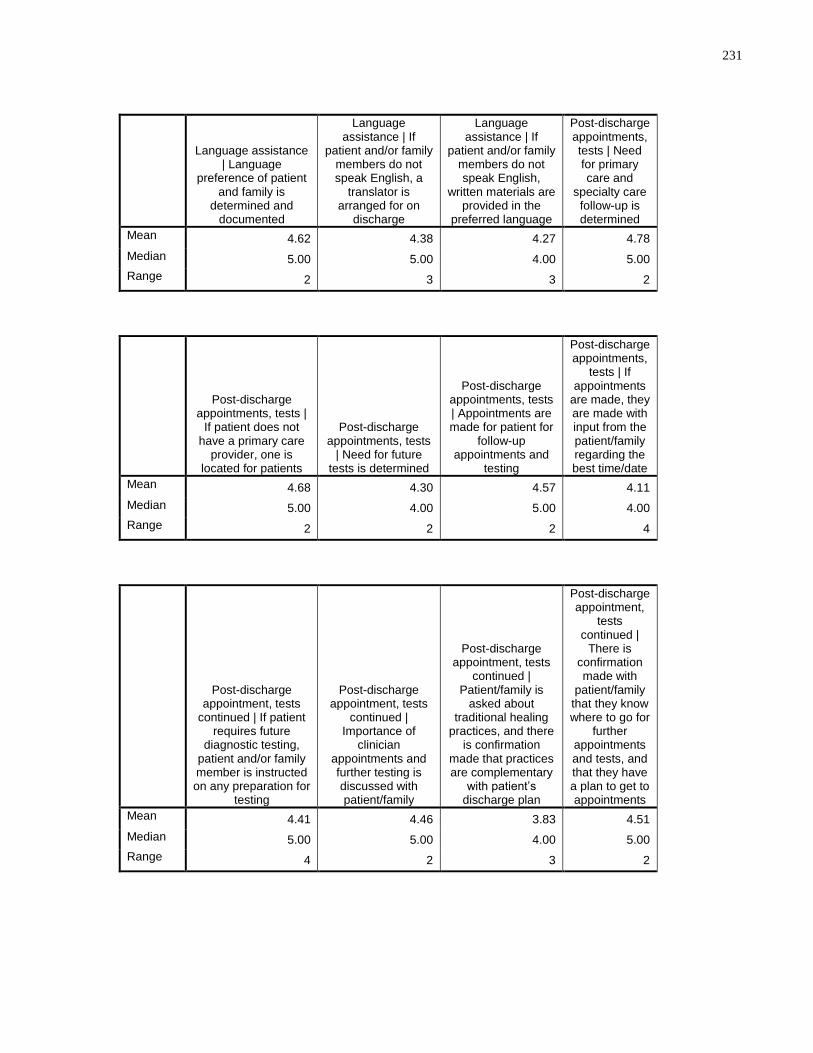
231
Language assistance | Language
preference of patient and family is
determined and documented
Language assistance | If
patient and/or family members do not speak English, a
translator is arranged for on
discharge
Language assistance | If
patient and/or family members do not speak English,
written materials are provided in the
preferred language
Post-discharge appointments, tests | Need for primary care and
specialty care follow-up is determined
Mean 4.62 4.38 4.27 4.78
Median 5.00 5.00 4.00 5.00
Range 2 3 3 2
Post-discharge appointments, tests |
If patient does not have a primary care
provider, one is located for patients
Post-discharge appointments, tests
| Need for future tests is determined
Post-discharge appointments, tests | Appointments are made for patient for
follow-up appointments and
testing
Post-discharge appointments,
tests | If appointments
are made, they are made with input from the patient/family regarding the best time/date
Mean 4.68 4.30 4.57 4.11
Median 5.00 4.00 5.00 4.00
Range 2 2 2 4
Post-discharge appointment, tests
continued | If patient requires future
diagnostic testing, patient and/or family member is instructed on any preparation for
testing
Post-discharge appointment, tests
continued | Importance of
clinician appointments and further testing is discussed with patient/family
Post-discharge appointment, tests
continued | Patient/family is
asked about traditional healing
practices, and there is confirmation
made that practices are complementary
with patient’s discharge plan
Post-discharge appointment,
tests continued |
There is confirmation made with
patient/family that they know where to go for
further appointments and tests, and that they have a plan to get to appointments
Mean 4.41 4.46 3.83 4.51
Median 5.00 5.00 4.00 5.00
Range 4 2 3 2
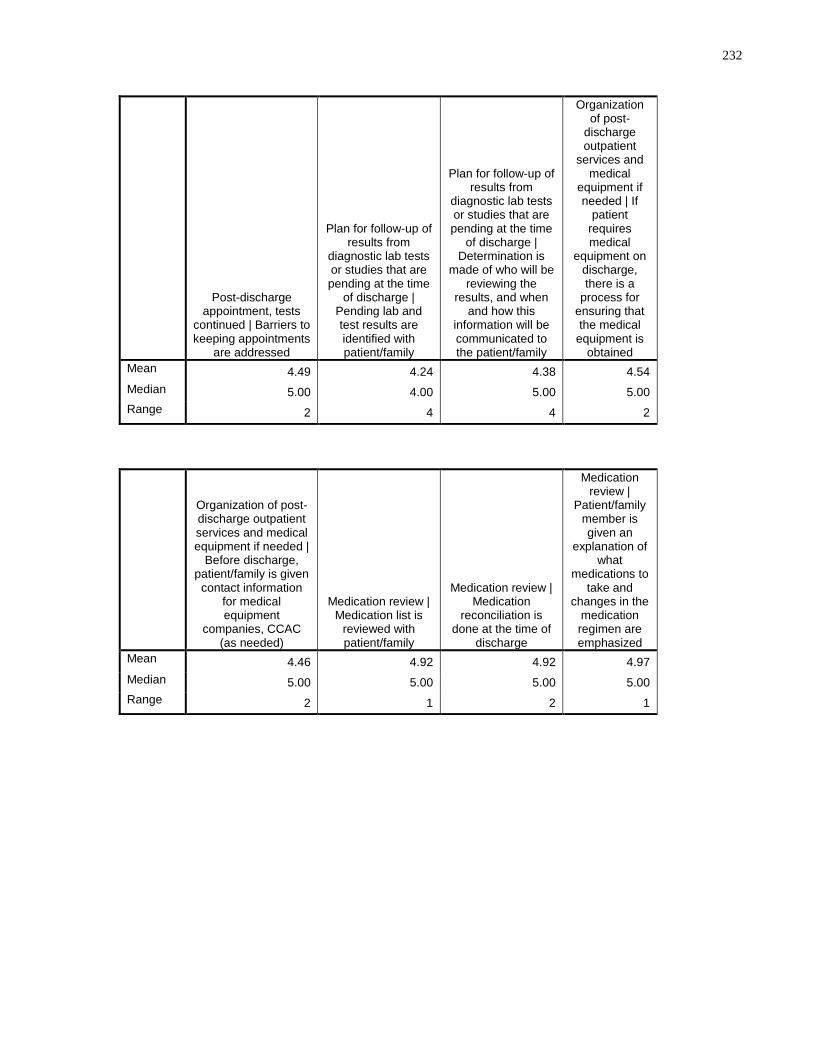
232
Post-discharge appointment, tests
continued | Barriers to keeping appointments
are addressed
Plan for follow-up of results from
diagnostic lab tests or studies that are pending at the time
of discharge | Pending lab and test results are identified with patient/family
Plan for follow-up of results from
diagnostic lab tests or studies that are pending at the time
of discharge | Determination is
made of who will be reviewing the
results, and when and how this
information will be communicated to the patient/family
Organization of post-
discharge outpatient
services and medical
equipment if needed | If
patient requires medical
equipment on discharge, there is a
process for ensuring that the medical
equipment is obtained
Mean 4.49 4.24 4.38 4.54
Median 5.00 4.00 5.00 5.00
Range 2 4 4 2
Organization of post-discharge outpatient services and medical equipment if needed |
Before discharge, patient/family is given
contact information for medical equipment
companies, CCAC (as needed)
Medication review | Medication list is
reviewed with patient/family
Medication review | Medication
reconciliation is done at the time of
discharge
Medication review |
Patient/family member is given an
explanation of what
medications to take and
changes in the medication regimen are emphasized
Mean 4.46 4.92 4.92 4.97
Median 5.00 5.00 5.00 5.00
Range 2 1 2 1
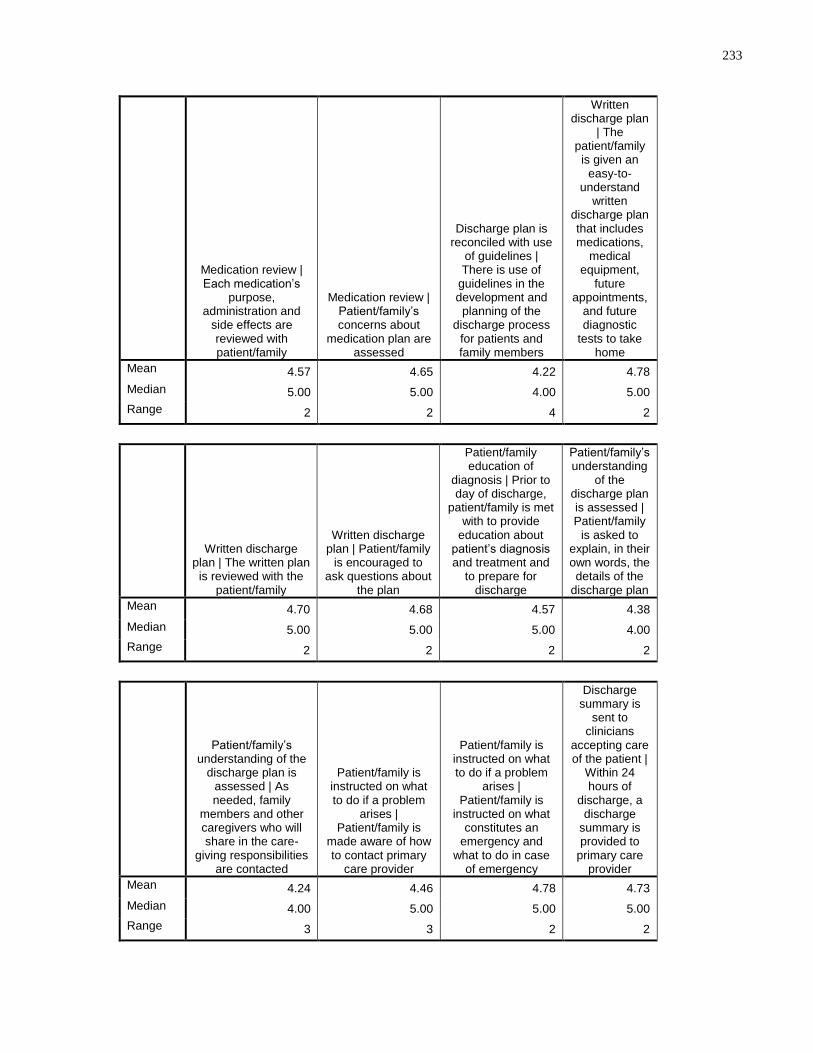
233
Medication review | Each medication’s
purpose, administration and
side effects are reviewed with patient/family
Medication review | Patient/family’s concerns about
medication plan are assessed
Discharge plan is reconciled with use
of guidelines | There is use of
guidelines in the development and planning of the
discharge process for patients and family members
Written discharge plan
| The patient/family is given an
easy-to-understand
written discharge plan that includes medications,
medical equipment,
future appointments,
and future diagnostic
tests to take home
Mean 4.57 4.65 4.22 4.78
Median 5.00 5.00 4.00 5.00
Range 2 2 4 2
Written discharge plan | The written plan is reviewed with the
patient/family
Written discharge plan | Patient/family
is encouraged to ask questions about
the plan
Patient/family education of
diagnosis | Prior to day of discharge,
patient/family is met with to provide
education about patient’s diagnosis and treatment and
to prepare for discharge
Patient/family’s understanding
of the discharge plan is assessed | Patient/family
is asked to explain, in their own words, the details of the
discharge plan
Mean 4.70 4.68 4.57 4.38
Median 5.00 5.00 5.00 4.00
Range 2 2 2 2
Patient/family’s understanding of the
discharge plan is assessed | As needed, family
members and other caregivers who will share in the care-
giving responsibilities are contacted
Patient/family is instructed on what to do if a problem
arises | Patient/family is
made aware of how to contact primary
care provider
Patient/family is instructed on what to do if a problem
arises | Patient/family is
instructed on what constitutes an
emergency and what to do in case
of emergency
Discharge summary is
sent to clinicians
accepting care of the patient |
Within 24 hours of
discharge, a discharge
summary is provided to
primary care provider
Mean 4.24 4.46 4.78 4.73
Median 4.00 5.00 5.00 5.00
Range 3 3 2 2
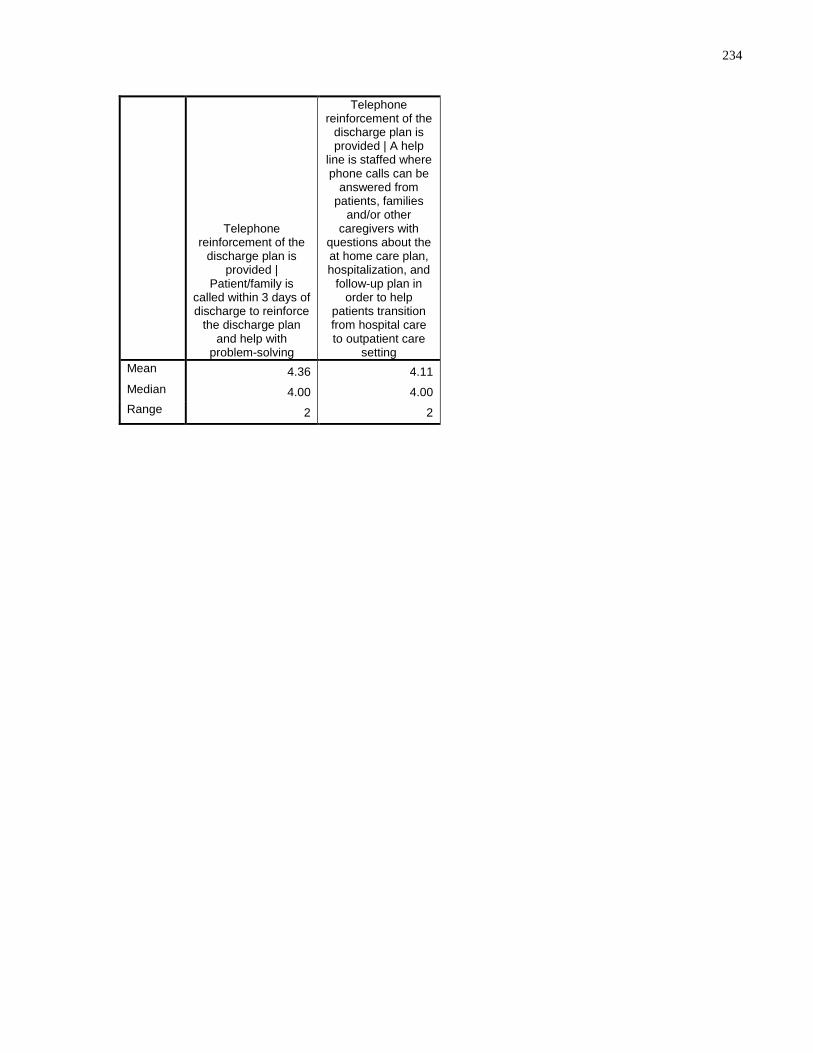
234
Telephone reinforcement of the
discharge plan is provided |
Patient/family is called within 3 days of discharge to reinforce
the discharge plan and help with
problem-solving
Telephone reinforcement of the
discharge plan is provided | A help
line is staffed where phone calls can be
answered from patients, families
and/or other caregivers with
questions about the at home care plan, hospitalization, and
follow-up plan in order to help
patients transition from hospital care to outpatient care
setting
Mean 4.36 4.11
Median 4.00 4.00
Range 2 2
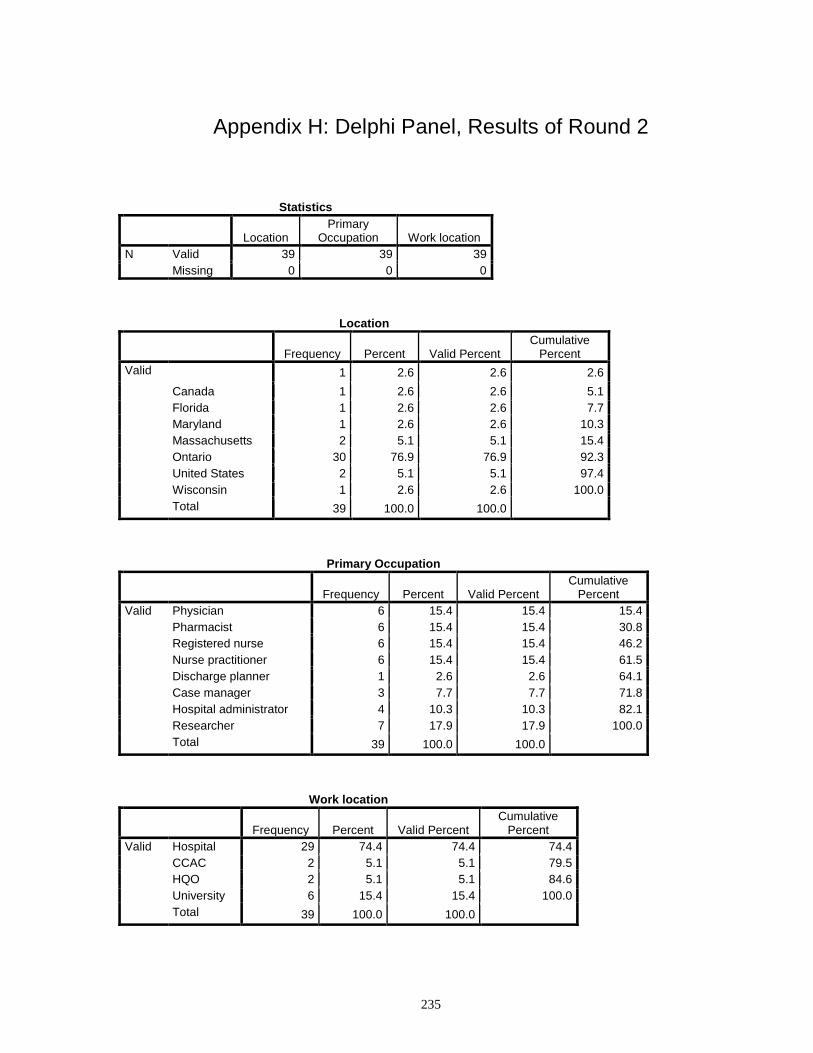
235
Appendix H: Delphi Panel, Results of Round 2
Statistics
Location Primary
Occupation Work location
N Valid 39 39 39
Missing 0 0 0
Location
Frequency Percent Valid Percent Cumulative
Percent
Valid 1 2.6 2.6 2.6
Canada 1 2.6 2.6 5.1
Florida 1 2.6 2.6 7.7
Maryland 1 2.6 2.6 10.3
Massachusetts 2 5.1 5.1 15.4
Ontario 30 76.9 76.9 92.3
United States 2 5.1 5.1 97.4
Wisconsin 1 2.6 2.6 100.0
Total 39 100.0 100.0
Primary Occupation
Frequency Percent Valid Percent Cumulative
Percent
Valid Physician 6 15.4 15.4 15.4
Pharmacist 6 15.4 15.4 30.8
Registered nurse 6 15.4 15.4 46.2
Nurse practitioner 6 15.4 15.4 61.5
Discharge planner 1 2.6 2.6 64.1
Case manager 3 7.7 7.7 71.8
Hospital administrator 4 10.3 10.3 82.1
Researcher 7 17.9 17.9 100.0
Total 39 100.0 100.0
Work location
Frequency Percent Valid Percent Cumulative
Percent
Valid Hospital 29 74.4 74.4 74.4
CCAC 2 5.1 5.1 79.5
HQO 2 5.1 5.1 84.6
University 6 15.4 15.4 100.0
Total 39 100.0 100.0
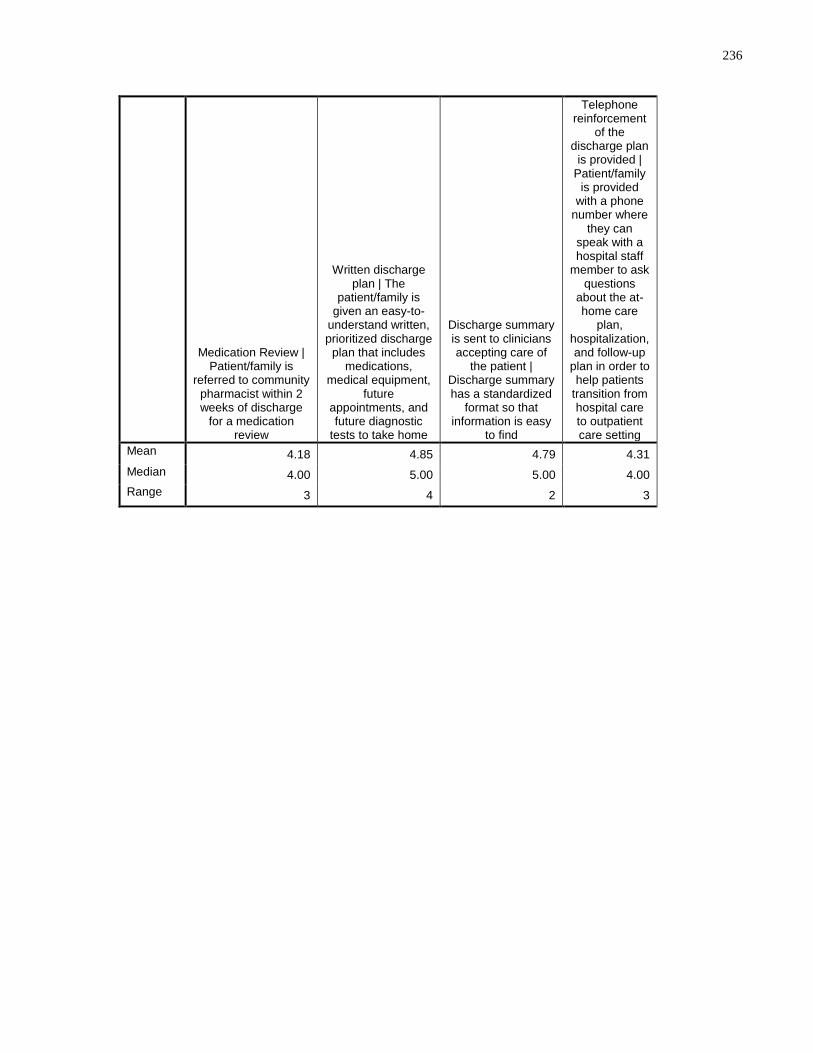
236
Medication Review | Patient/family is
referred to community pharmacist within 2 weeks of discharge
for a medication review
Written discharge plan | The
patient/family is given an easy-to-
understand written, prioritized discharge
plan that includes medications,
medical equipment, future
appointments, and future diagnostic
tests to take home
Discharge summary is sent to clinicians accepting care of
the patient | Discharge summary has a standardized
format so that information is easy
to find
Telephone reinforcement
of the discharge plan
is provided | Patient/family
is provided with a phone
number where they can
speak with a hospital staff
member to ask questions
about the at-home care
plan, hospitalization, and follow-up
plan in order to help patients
transition from hospital care to outpatient care setting
Mean 4.18 4.85 4.79 4.31
Median 4.00 5.00 5.00 4.00
Range 3 4 2 3
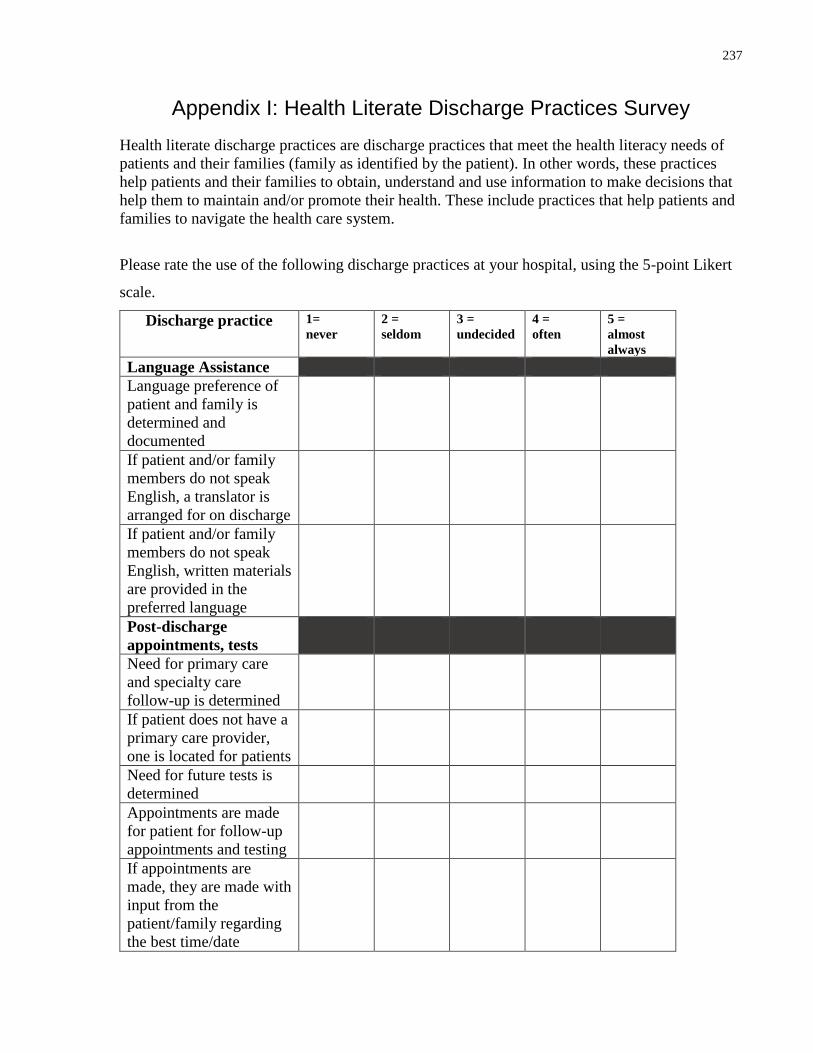
237
Appendix I: Health Literate Discharge Practices Survey
Health literate discharge practices are discharge practices that meet the health literacy needs of
patients and their families (family as identified by the patient). In other words, these practices
help patients and their families to obtain, understand and use information to make decisions that
help them to maintain and/or promote their health. These include practices that help patients and
families to navigate the health care system.
Please rate the use of the following discharge practices at your hospital, using the 5-point Likert
scale.
Discharge practice 1=
never
2 =
seldom
3 =
undecided
4 =
often
5 =
almost
always
Language Assistance
Language preference of
patient and family is
determined and
documented
If patient and/or family
members do not speak
English, a translator is
arranged for on discharge
If patient and/or family
members do not speak
English, written materials
are provided in the
preferred language
Post-discharge
appointments, tests
Need for primary care
and specialty care
follow-up is determined
If patient does not have a
primary care provider,
one is located for patients
Need for future tests is
determined
Appointments are made
for patient for follow-up
appointments and testing
If appointments are
made, they are made with
input from the
patient/family regarding
the best time/date
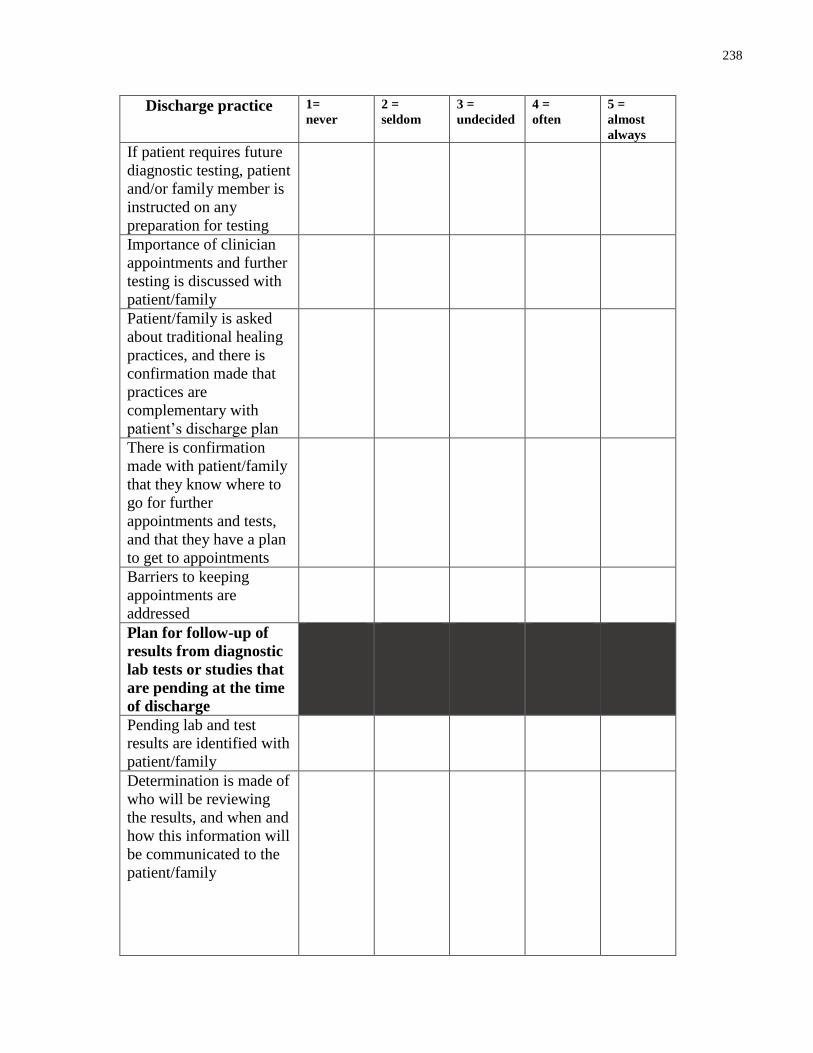
238
Discharge practice 1=
never
2 =
seldom
3 =
undecided
4 =
often
5 =
almost
always
If patient requires future
diagnostic testing, patient
and/or family member is
instructed on any
preparation for testing
Importance of clinician
appointments and further
testing is discussed with
patient/family
Patient/family is asked
about traditional healing
practices, and there is
confirmation made that
practices are
complementary with
patient’s discharge plan
There is confirmation
made with patient/family
that they know where to
go for further
appointments and tests,
and that they have a plan
to get to appointments
Barriers to keeping
appointments are
addressed
Plan for follow-up of
results from diagnostic
lab tests or studies that
are pending at the time
of discharge
Pending lab and test
results are identified with
patient/family
Determination is made of
who will be reviewing
the results, and when and
how this information will
be communicated to the
patient/family
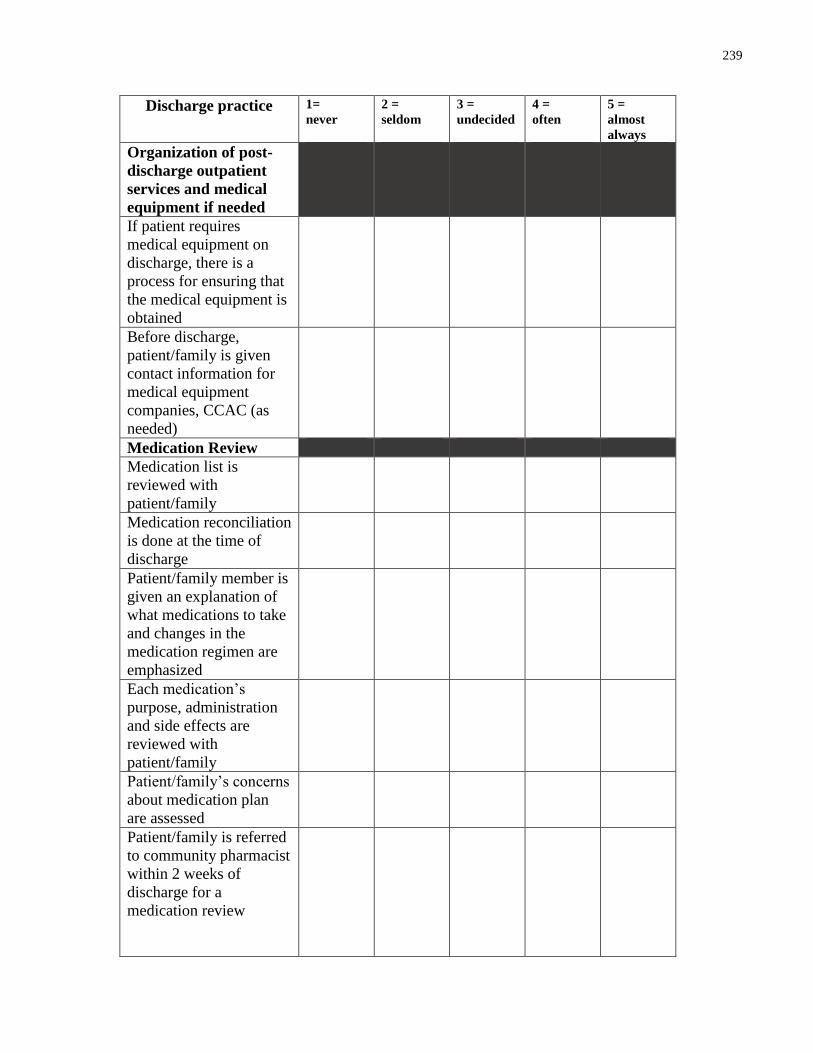
239
Discharge practice 1=
never
2 =
seldom
3 =
undecided
4 =
often
5 =
almost
always
Organization of post-
discharge outpatient
services and medical
equipment if needed
If patient requires
medical equipment on
discharge, there is a
process for ensuring that
the medical equipment is
obtained
Before discharge,
patient/family is given
contact information for
medical equipment
companies, CCAC (as
needed)
Medication Review
Medication list is
reviewed with
patient/family
Medication reconciliation
is done at the time of
discharge
Patient/family member is
given an explanation of
what medications to take
and changes in the
medication regimen are
emphasized
Each medication’s
purpose, administration
and side effects are
reviewed with
patient/family
Patient/family’s concerns
about medication plan
are assessed
Patient/family is referred
to community pharmacist
within 2 weeks of
discharge for a
medication review
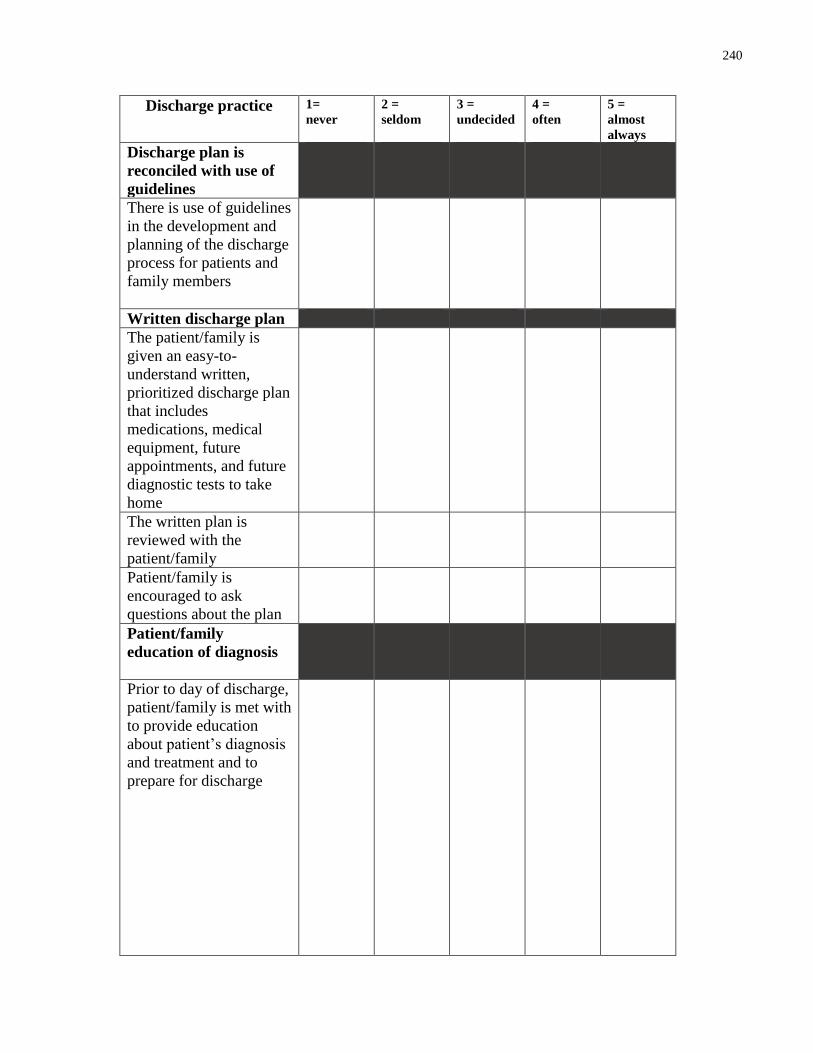
240
Discharge practice 1=
never
2 =
seldom
3 =
undecided
4 =
often
5 =
almost
always
Discharge plan is
reconciled with use of
guidelines
There is use of guidelines
in the development and
planning of the discharge
process for patients and
family members
Written discharge plan
The patient/family is
given an easy-to-
understand written,
prioritized discharge plan
that includes
medications, medical
equipment, future
appointments, and future
diagnostic tests to take
home
The written plan is
reviewed with the
patient/family
Patient/family is
encouraged to ask
questions about the plan
Patient/family
education of diagnosis
Prior to day of discharge,
patient/family is met with
to provide education
about patient’s diagnosis
and treatment and to
prepare for discharge
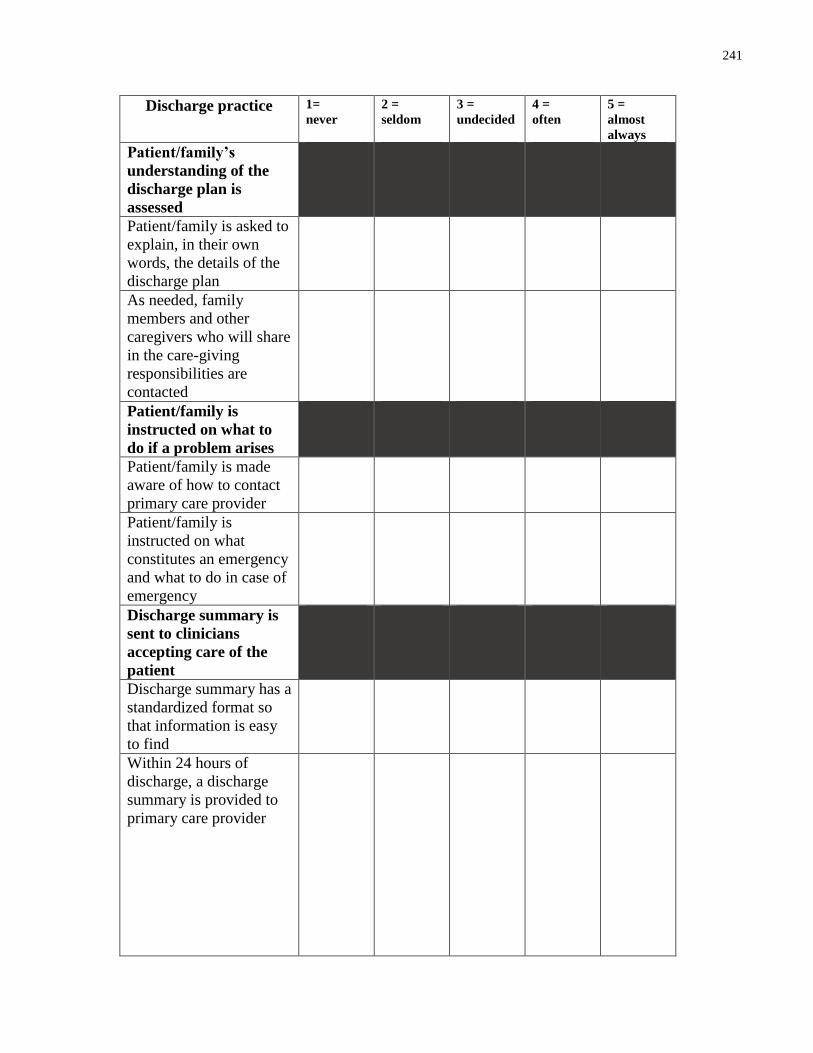
241
Discharge practice 1=
never
2 =
seldom
3 =
undecided
4 =
often
5 =
almost
always
Patient/family’s
understanding of the
discharge plan is
assessed
Patient/family is asked to
explain, in their own
words, the details of the
discharge plan
As needed, family
members and other
caregivers who will share
in the care-giving
responsibilities are
contacted
Patient/family is
instructed on what to
do if a problem arises
Patient/family is made
aware of how to contact
primary care provider
Patient/family is
instructed on what
constitutes an emergency
and what to do in case of
emergency
Discharge summary is
sent to clinicians
accepting care of the
patient
Discharge summary has a
standardized format so
that information is easy
to find
Within 24 hours of
discharge, a discharge
summary is provided to
primary care provider
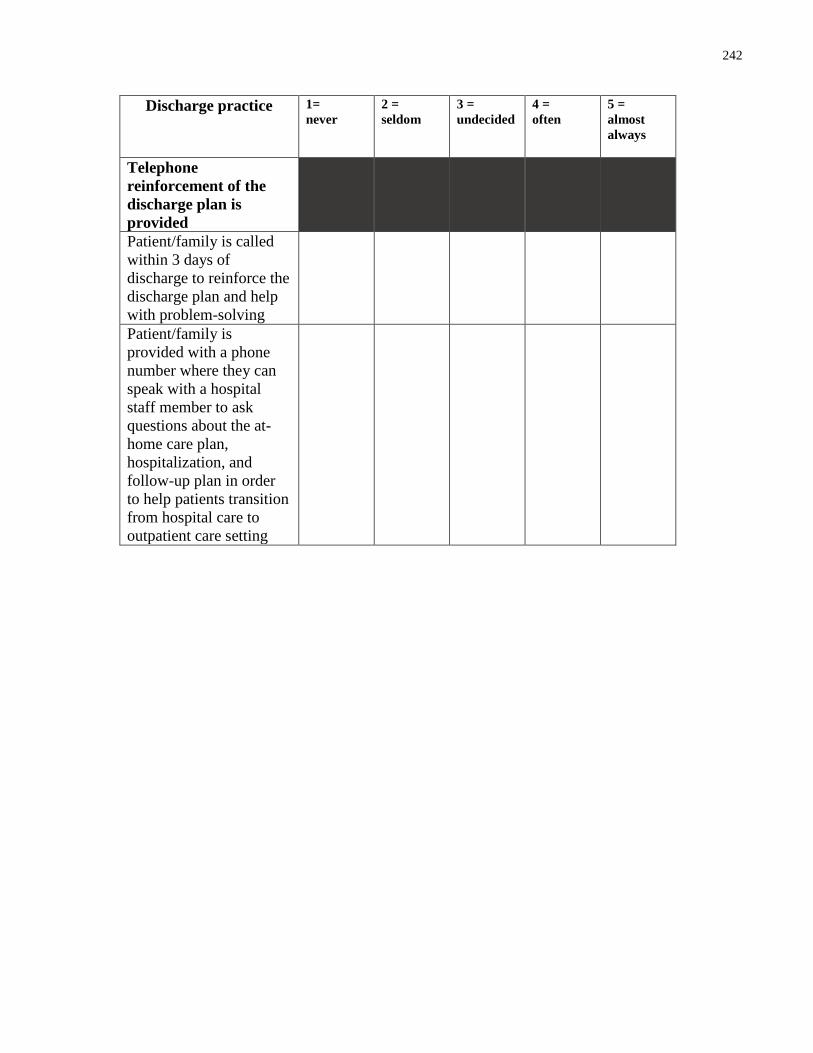
242
Discharge practice 1=
never
2 =
seldom
3 =
undecided
4 =
often
5 =
almost
always
Telephone
reinforcement of the
discharge plan is
provided
Patient/family is called
within 3 days of
discharge to reinforce the
discharge plan and help
with problem-solving
Patient/family is
provided with a phone
number where they can
speak with a hospital
staff member to ask
questions about the at-
home care plan,
hospitalization, and
follow-up plan in order
to help patients transition
from hospital care to
outpatient care setting
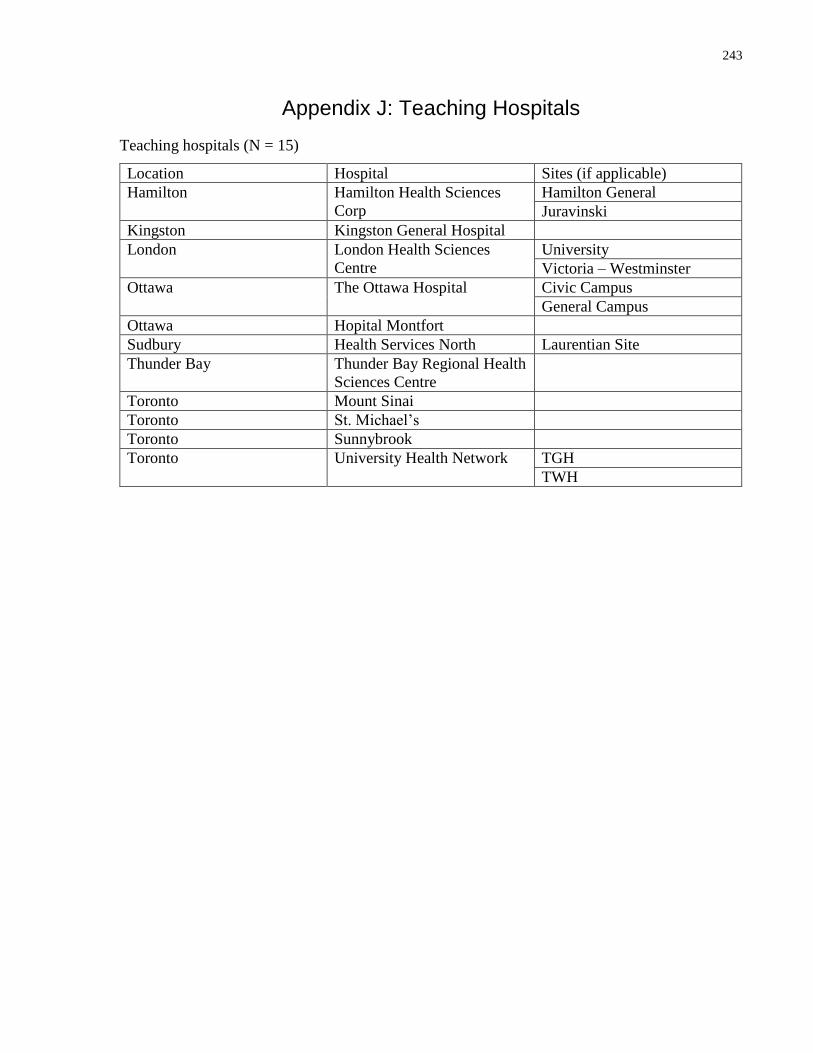
243
Appendix J: Teaching Hospitals
Teaching hospitals (N = 15)
Location Hospital Sites (if applicable)
Hamilton Hamilton Health Sciences
Corp
Hamilton General
Juravinski
Kingston Kingston General Hospital
London London Health Sciences
Centre
University
Victoria – Westminster
Ottawa The Ottawa Hospital Civic Campus
General Campus
Ottawa Hopital Montfort
Sudbury Health Services North Laurentian Site
Thunder Bay Thunder Bay Regional Health
Sciences Centre
Toronto Mount Sinai
Toronto St. Michael’s
Toronto Sunnybrook
Toronto University Health Network TGH
TWH
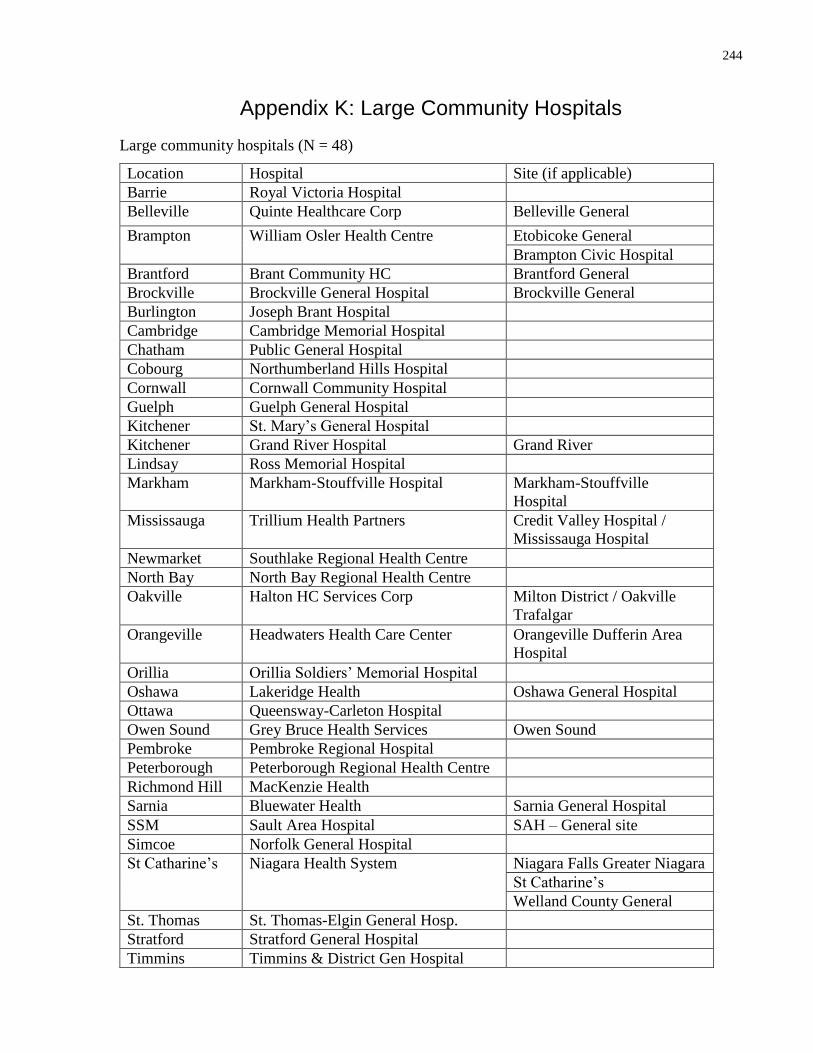
244
Appendix K: Large Community Hospitals
Large community hospitals (N = 48)
Location Hospital Site (if applicable)
Barrie Royal Victoria Hospital
Belleville Quinte Healthcare Corp Belleville General
Brampton William Osler Health Centre Etobicoke General
Brampton Civic Hospital
Brantford Brant Community HC Brantford General
Brockville Brockville General Hospital Brockville General
Burlington Joseph Brant Hospital
Cambridge Cambridge Memorial Hospital
Chatham Public General Hospital
Cobourg Northumberland Hills Hospital
Cornwall Cornwall Community Hospital
Guelph Guelph General Hospital
Kitchener St. Mary’s General Hospital
Kitchener Grand River Hospital Grand River
Lindsay Ross Memorial Hospital
Markham Markham-Stouffville Hospital Markham-Stouffville
Hospital
Mississauga Trillium Health Partners Credit Valley Hospital /
Mississauga Hospital
Newmarket Southlake Regional Health Centre
North Bay North Bay Regional Health Centre
Oakville Halton HC Services Corp Milton District / Oakville
Trafalgar
Orangeville Headwaters Health Care Center Orangeville Dufferin Area
Hospital
Orillia Orillia Soldiers’ Memorial Hospital
Oshawa Lakeridge Health Oshawa General Hospital
Ottawa Queensway-Carleton Hospital
Owen Sound Grey Bruce Health Services Owen Sound
Pembroke Pembroke Regional Hospital
Peterborough Peterborough Regional Health Centre
Richmond Hill MacKenzie Health
Sarnia Bluewater Health Sarnia General Hospital
SSM Sault Area Hospital SAH – General site
Simcoe Norfolk General Hospital
St Catharine’s Niagara Health System Niagara Falls Greater Niagara
St Catharine’s
Welland County General
St. Thomas St. Thomas-Elgin General Hosp.
Stratford Stratford General Hospital
Timmins Timmins & District Gen Hospital
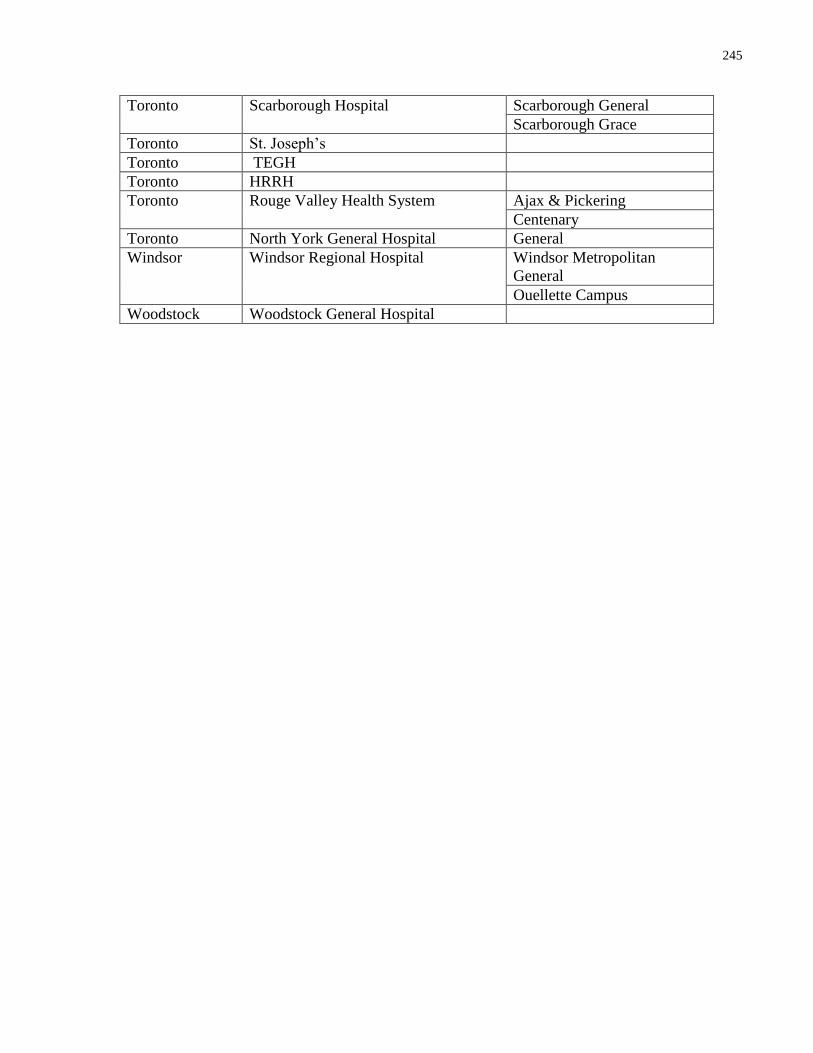
245
Toronto Scarborough Hospital Scarborough General
Scarborough Grace
Toronto St. Joseph’s
Toronto TEGH
Toronto HRRH
Toronto Rouge Valley Health System Ajax & Pickering
Centenary
Toronto North York General Hospital General
Windsor Windsor Regional Hospital Windsor Metropolitan
General
Ouellette Campus
Woodstock Woodstock General Hospital
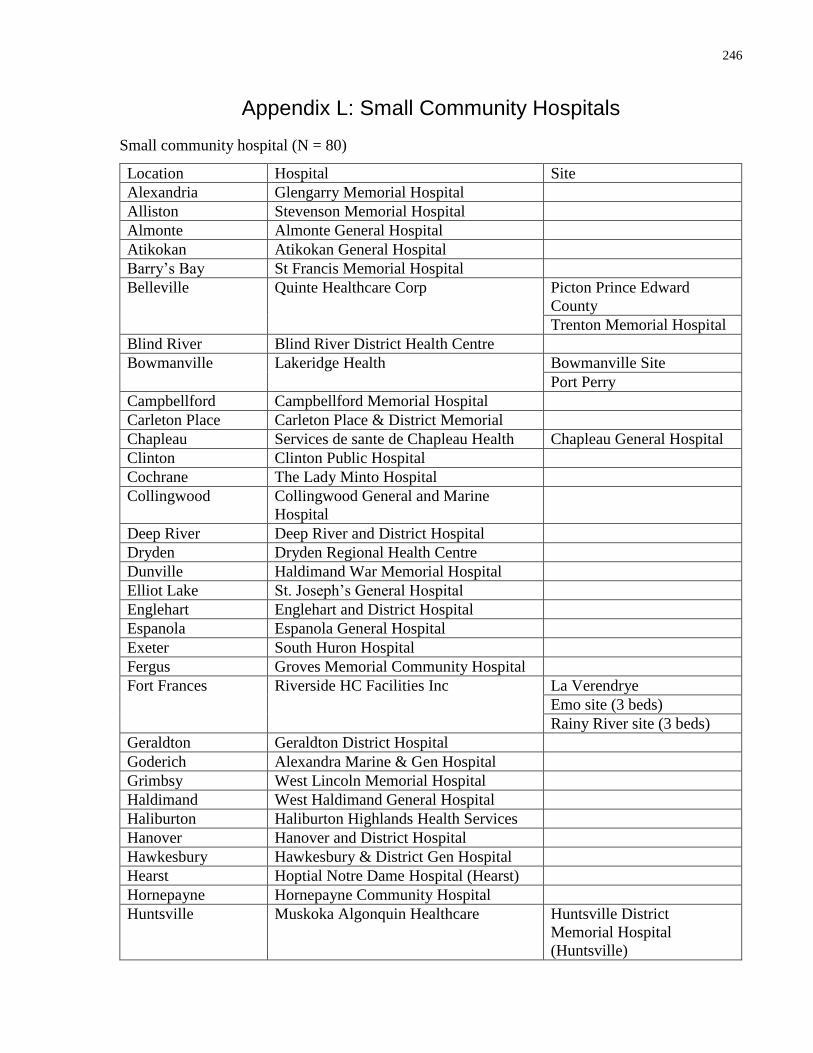
246
Appendix L: Small Community Hospitals
Small community hospital (N = 80)
Location Hospital Site
Alexandria Glengarry Memorial Hospital
Alliston Stevenson Memorial Hospital
Almonte Almonte General Hospital
Atikokan Atikokan General Hospital
Barry’s Bay St Francis Memorial Hospital
Belleville Quinte Healthcare Corp Picton Prince Edward
County
Trenton Memorial Hospital
Blind River Blind River District Health Centre
Bowmanville Lakeridge Health Bowmanville Site
Port Perry
Campbellford Campbellford Memorial Hospital
Carleton Place Carleton Place & District Memorial
Chapleau Services de sante de Chapleau Health Chapleau General Hospital
Clinton Clinton Public Hospital
Cochrane The Lady Minto Hospital
Collingwood Collingwood General and Marine
Hospital
Deep River Deep River and District Hospital
Dryden Dryden Regional Health Centre
Dunville Haldimand War Memorial Hospital
Elliot Lake St. Joseph’s General Hospital
Englehart Englehart and District Hospital
Espanola Espanola General Hospital
Exeter South Huron Hospital
Fergus Groves Memorial Community Hospital
Fort Frances
Riverside HC Facilities Inc
La Verendrye
Emo site (3 beds)
Rainy River site (3 beds)
Geraldton Geraldton District Hospital
Goderich Alexandra Marine & Gen Hospital
Grimbsy West Lincoln Memorial Hospital
Haldimand West Haldimand General Hospital
Haliburton Haliburton Highlands Health Services
Hanover Hanover and District Hospital
Hawkesbury Hawkesbury & District Gen Hospital
Hearst Hoptial Notre Dame Hospital (Hearst)
Hornepayne Hornepayne Community Hospital
Huntsville Muskoka Algonquin Healthcare Huntsville District
Memorial Hospital
(Huntsville)
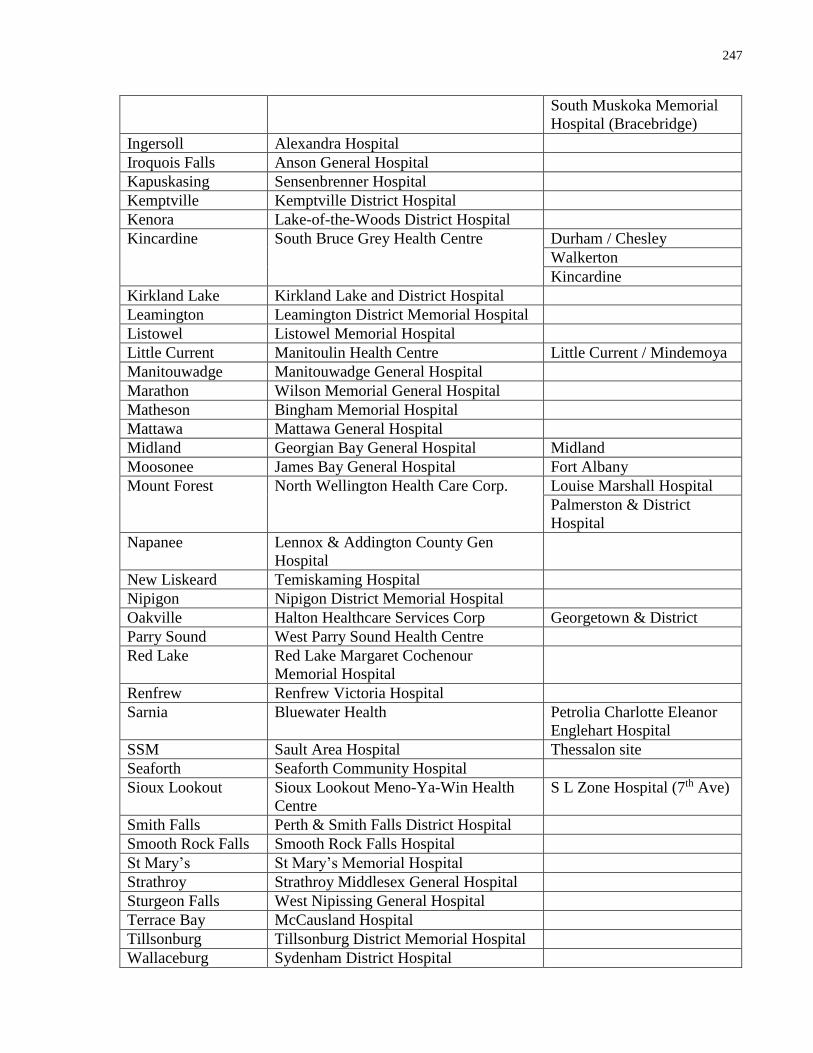
247
South Muskoka Memorial
Hospital (Bracebridge)
Ingersoll Alexandra Hospital
Iroquois Falls Anson General Hospital
Kapuskasing Sensenbrenner Hospital
Kemptville Kemptville District Hospital
Kenora Lake-of-the-Woods District Hospital
Kincardine South Bruce Grey Health Centre Durham / Chesley
Walkerton
Kincardine
Kirkland Lake Kirkland Lake and District Hospital
Leamington Leamington District Memorial Hospital
Listowel Listowel Memorial Hospital
Little Current Manitoulin Health Centre Little Current / Mindemoya
Manitouwadge Manitouwadge General Hospital
Marathon Wilson Memorial General Hospital
Matheson Bingham Memorial Hospital
Mattawa Mattawa General Hospital
Midland Georgian Bay General Hospital Midland
Moosonee James Bay General Hospital Fort Albany
Mount Forest North Wellington Health Care Corp. Louise Marshall Hospital
Palmerston & District
Hospital
Napanee Lennox & Addington County Gen
Hospital
New Liskeard Temiskaming Hospital
Nipigon Nipigon District Memorial Hospital
Oakville Halton Healthcare Services Corp Georgetown & District
Parry Sound West Parry Sound Health Centre
Red Lake Red Lake Margaret Cochenour
Memorial Hospital
Renfrew Renfrew Victoria Hospital
Sarnia Bluewater Health Petrolia Charlotte Eleanor
Englehart Hospital
SSM Sault Area Hospital Thessalon site
Seaforth Seaforth Community Hospital
Sioux Lookout Sioux Lookout Meno-Ya-Win Health
Centre
S L Zone Hospital (7th Ave)
Smith Falls Perth & Smith Falls District Hospital
Smooth Rock Falls Smooth Rock Falls Hospital
St Mary’s St Mary’s Memorial Hospital
Strathroy Strathroy Middlesex General Hospital
Sturgeon Falls West Nipissing General Hospital
Terrace Bay McCausland Hospital
Tillsonburg Tillsonburg District Memorial Hospital
Wallaceburg Sydenham District Hospital

248
Wawa Lady Dunn Health Centre
Winchester Winchester District Memorial Hospital
Wingham Wingham & District Hospital
249
Appendix M: Email
Dear (name of potential participant),
I am contacting you to request your participation in a study that is using a survey to
assess how well hospitals discharge patients from the acute care hospital setting to home. This
study is part of my dissertation research at the Institute of Health Policy, Management and
Evaluation at the University of Toronto and it is endorsed by the Ontario Hospital Association.
This research is being supervised by Dr. Jan Barnsley and Dr. Whitney Berta.
As you are likely aware, Ontario has a high rate of hospital readmission, particularly for
medical patients, and there is a growing understanding that hospital discharge processes
contribute to this readmission rate. When patients do not understand discharge instructions or
have difficulty following treatment plans, there is an increased chance that they will return to
hospital within 30 days of discharge. The use of a survey tool to measure the use of hospital
discharge practices could be used in quality improvement efforts, and would help hospital
managers and policy makers to monitor hospitals’ performance of discharge.
You have been identified as a stakeholder in the hospital discharge process, and I
would be grateful for your assistance with this survey. Please complete this survey or share
it with a health care provider on the general medicine patient care unit who has experience
in the hospital discharge process.
Please refer to the attached Participant Information Sheet. If you have any questions or
concerns please contact me at [email protected].
Thank you for your consideration,
Jennifer Innis
Email: [email protected]
Phone: (416) 571-3248
250
Appendix N: Participant Information Letter
Participant Information Sheet
Health Literate Discharge Practices in Ontario Hospitals
My thanks for your interest in this study. Please read the information provided below carefully.
Background
This study seeks to use a survey to assess how hospitals discharge patients from general
medicine inpatient nursing units to home in Ontario. As you are likely aware, Ontario has a high
rate of hospital readmission particularly for medical patients, and there is a growing
understanding that hospital discharge processes contribute to this readmission rate. When
patients do not understand discharge instructions or have difficulty following treatment plans,
there is an increased chance that they will return to hospital within 30 days of discharge.
At present, there is no tool to assess hospital discharge practices. Such a tool could be used in
quality improvement efforts, and would help hospitals and policy makers to monitor hospitals’
performance of discharge. The items on this survey are based on the components of Project RED
(Re-Engineered Discharge), a program that has been found to be significantly associated with
decreased hospital readmission. The items have been reviewed and refined through a Delphi
process with hospital, government, and research-based stakeholders.
Methods
This survey tool is being used to determine the extent of hospital discharge practices that meet
the health literacy needs of patients and families, which are being called “health literate
discharge practices.” This survey has 36 items, and you will be asked to rate how often the
practices are used, in your experience. Participation will be via electronic mail and you will be
asked to complete an internet based survey. If you prefer, a regular mail option will be available
and you will be mailed a questionnaire with a stamped envelope for reply. The survey will take
10-20 minutes to complete.
Participants will be offered mini-summaries of the final study findings. This summary will
contain feedback on the general medicine patient care unit’s use of health literate discharge
practices relative to aggregate levels of use from other hospital sites in Ontario. Your hospital
name will be kept anonymous. Hospitals will only be identified by 3 categories: 1) teaching
hospitals, 2) community hospitals with 100 beds or more; 3) community hospitals with less than
100 beds.
251
Participation in this study is voluntary and there are no risks to you from being involved. Your
identity will be known only to the investigators, not to other participants, and your responses will
be kept strictly anonymous. Any information that could be used to identify you or the
organization you are affiliated with will be removed. You may withdraw from the study at any
time, and if you withdraw, your responses will not be used. Your consent to participate in the
study will be indicated by your choice to respond to the survey. If you have any questions about
your rights as a research participant, you may contact the Office of Office of Research Ethics
([email protected] or 416-946-3273).
Your participation
Given your knowledge and experience with the use of discharge practices, your participation
will greatly enhance the understanding of how hospital discharge practices are used on general
medicine inpatient nursing units in hospitals.
If you choose to participate, you have 3 options for submitting your questionnaire:
7. Complete on the Web at: http://worklife.fluidsurveys.com/surveys/wb/health-
literate-discharge-practices/
8. Complete the word document provided and send via email to
9. Contact [email protected] for a paper copy of the questionnaire and
a stamped envelope.
252
If you have any questions regarding this research, please contact me at the email address
provided below.
Thank you in advance for your time and cooperation.
Sincerely,
Jennifer Innis, PhD(c)
Institute of Health Policy, Management and Evaluation
Health Sciences Building, Suite 425
155 College Street, Toronto ON M5T 3M6
Email address: [email protected]
Jan Barnsley, Associate Professor
Institute of Health Policy, Management and Evaluation
Email address: [email protected]
Whitney Berta, Associate Professor
Institute of Health Policy, Management and Evaluation
Email address: [email protected]
Imtiaz Daniel, Adjunct Lecturer Institute of Health Policy, Management and Evaluation
Senior Consultant, Ontario Hospital Association
Email address: [email protected]
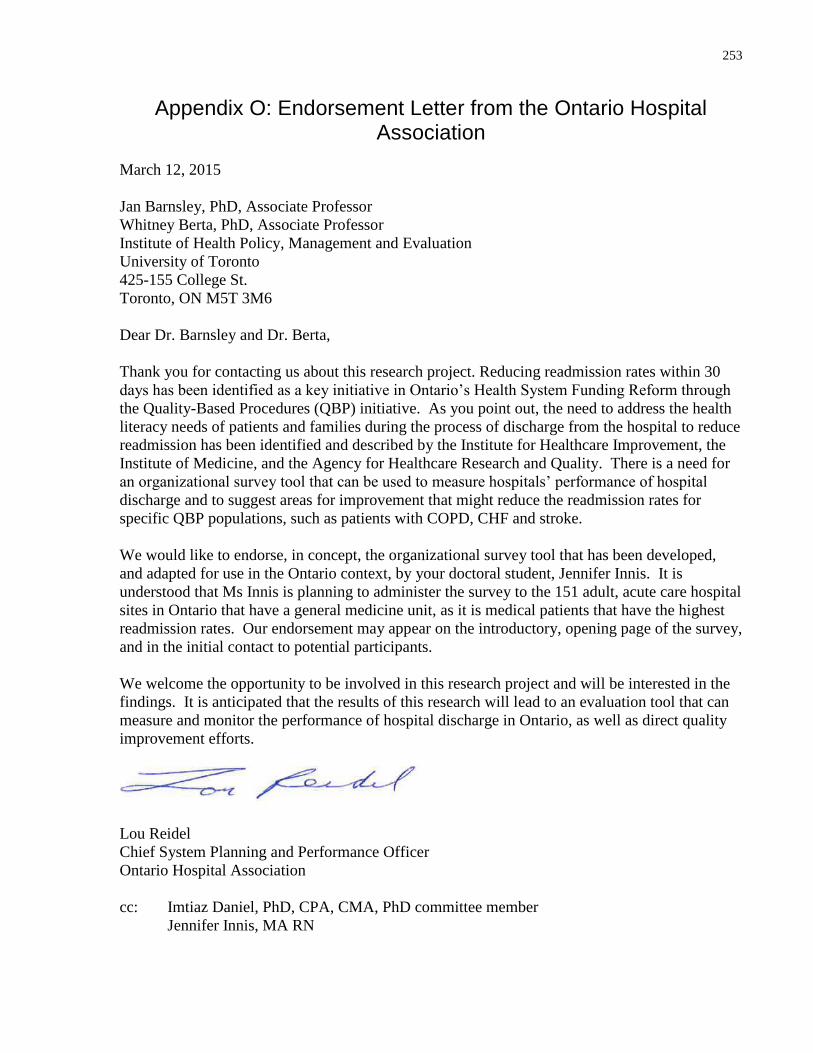
253
Appendix O: Endorsement Letter from the Ontario Hospital Association
March 12, 2015
Jan Barnsley, PhD, Associate Professor
Whitney Berta, PhD, Associate Professor
Institute of Health Policy, Management and Evaluation
University of Toronto
425-155 College St.
Toronto, ON M5T 3M6
Dear Dr. Barnsley and Dr. Berta,
Thank you for contacting us about this research project. Reducing readmission rates within 30
days has been identified as a key initiative in Ontario’s Health System Funding Reform through
the Quality-Based Procedures (QBP) initiative. As you point out, the need to address the health
literacy needs of patients and families during the process of discharge from the hospital to reduce
readmission has been identified and described by the Institute for Healthcare Improvement, the
Institute of Medicine, and the Agency for Healthcare Research and Quality. There is a need for
an organizational survey tool that can be used to measure hospitals’ performance of hospital
discharge and to suggest areas for improvement that might reduce the readmission rates for
specific QBP populations, such as patients with COPD, CHF and stroke.
We would like to endorse, in concept, the organizational survey tool that has been developed,
and adapted for use in the Ontario context, by your doctoral student, Jennifer Innis. It is
understood that Ms Innis is planning to administer the survey to the 151 adult, acute care hospital
sites in Ontario that have a general medicine unit, as it is medical patients that have the highest
readmission rates. Our endorsement may appear on the introductory, opening page of the survey,
and in the initial contact to potential participants.
We welcome the opportunity to be involved in this research project and will be interested in the
findings. It is anticipated that the results of this research will lead to an evaluation tool that can
measure and monitor the performance of hospital discharge in Ontario, as well as direct quality
improvement efforts.
Lou Reidel
Chief System Planning and Performance Officer
Ontario Hospital Association
cc: Imtiaz Daniel, PhD, CPA, CMA, PhD committee member
Jennifer Innis, MA RN
254
Appendix P: Reminder Notice
Dear (participant),
I contacted you earlier this month to request your participation in a study that is using a survey to
assess how well hospitals discharge patients from the acute care hospital setting to home. This
study is part of my dissertation research at the Institute of Health Policy, Management and
Evaluation at the University of Toronto. This research is being supervised by Dr. Jan Barnsley
and Dr. Whitney Berta, and is endorsed by the Ontario Hospital Association.
If you have not yet responded, please refer to the attached Participant Information Sheet.
The web based link to the survey can be found at:
http://worklife.fluidsurveys.com/surveys/wb/health-literate-discharge-practices/. If you have any
questions or concerns please contact me at [email protected].
Thank you,
Jennifer Innis
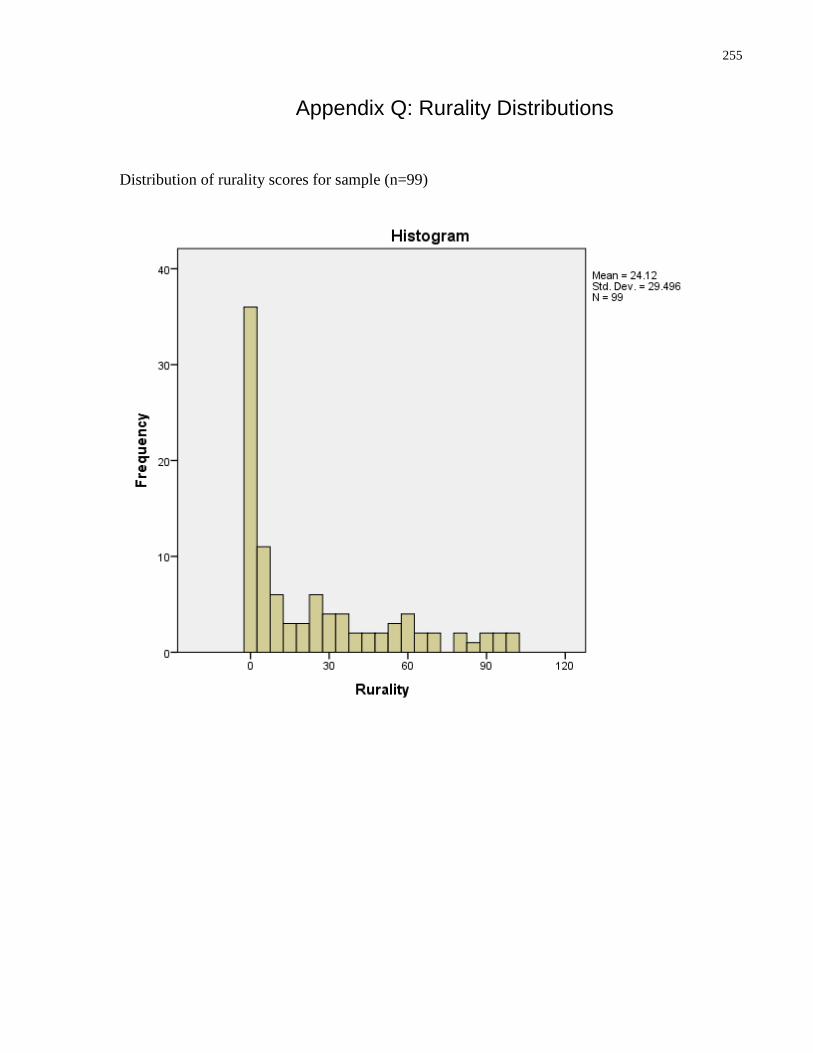
255
Appendix Q: Rurality Distributions
Distribution of rurality scores for sample (n=99)
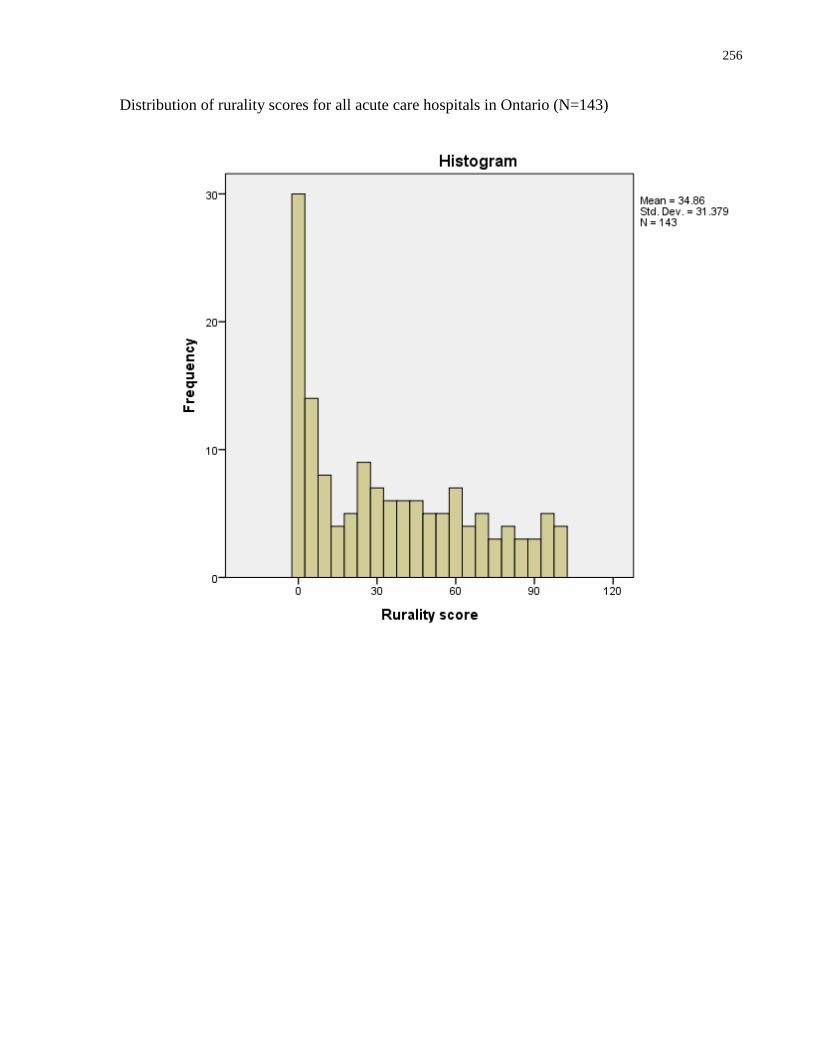
256
Distribution of rurality scores for all acute care hospitals in Ontario (N=143)
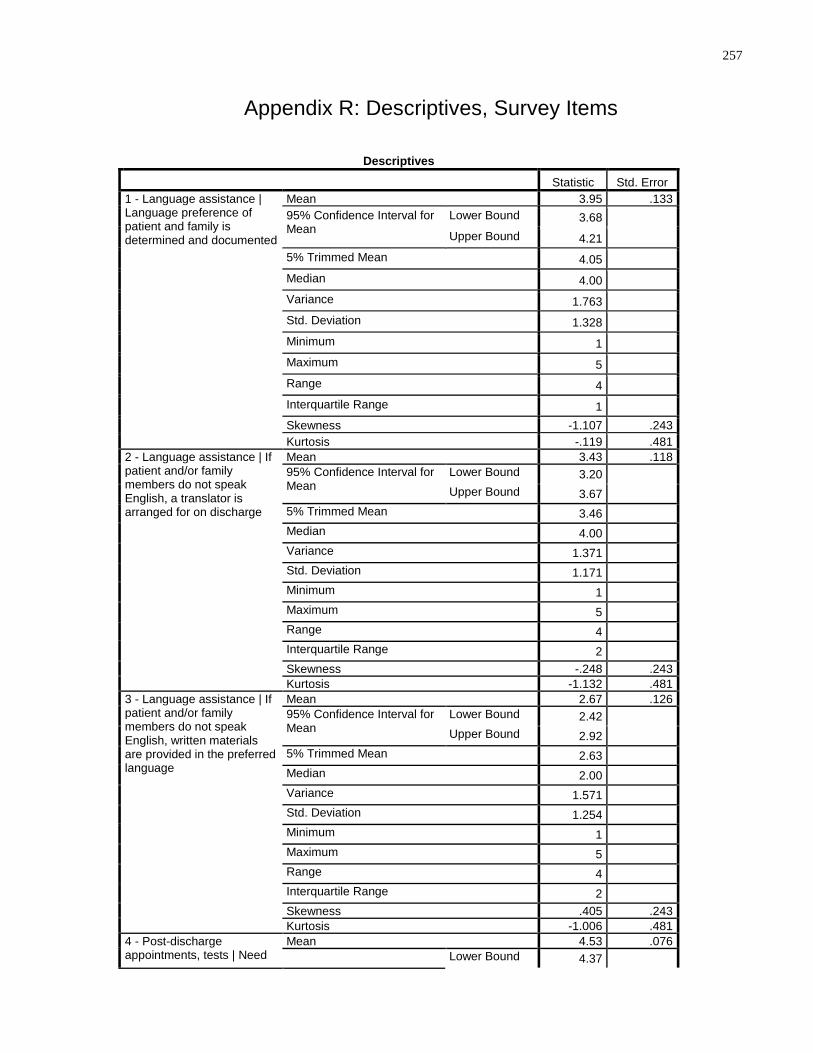
257
Appendix R: Descriptives, Survey Items
Descriptives
Statistic Std. Error
1 - Language assistance | Language preference of patient and family is determined and documented
Mean 3.95 .133
95% Confidence Interval for Mean
Lower Bound 3.68 Upper Bound 4.21
5% Trimmed Mean 4.05 Median 4.00 Variance 1.763 Std. Deviation 1.328 Minimum 1 Maximum 5 Range 4 Interquartile Range 1 Skewness -1.107 .243
Kurtosis -.119 .481
2 - Language assistance | If patient and/or family members do not speak English, a translator is arranged for on discharge
Mean 3.43 .118
95% Confidence Interval for Mean
Lower Bound 3.20 Upper Bound 3.67
5% Trimmed Mean 3.46 Median 4.00 Variance 1.371 Std. Deviation 1.171 Minimum 1 Maximum 5 Range 4 Interquartile Range 2 Skewness -.248 .243
Kurtosis -1.132 .481
3 - Language assistance | If patient and/or family members do not speak English, written materials are provided in the preferred language
Mean 2.67 .126
95% Confidence Interval for Mean
Lower Bound 2.42 Upper Bound 2.92
5% Trimmed Mean 2.63 Median 2.00 Variance 1.571 Std. Deviation 1.254 Minimum 1 Maximum 5 Range 4 Interquartile Range 2 Skewness .405 .243
Kurtosis -1.006 .481
4 - Post-discharge appointments, tests | Need
Mean 4.53 .076
Lower Bound 4.37
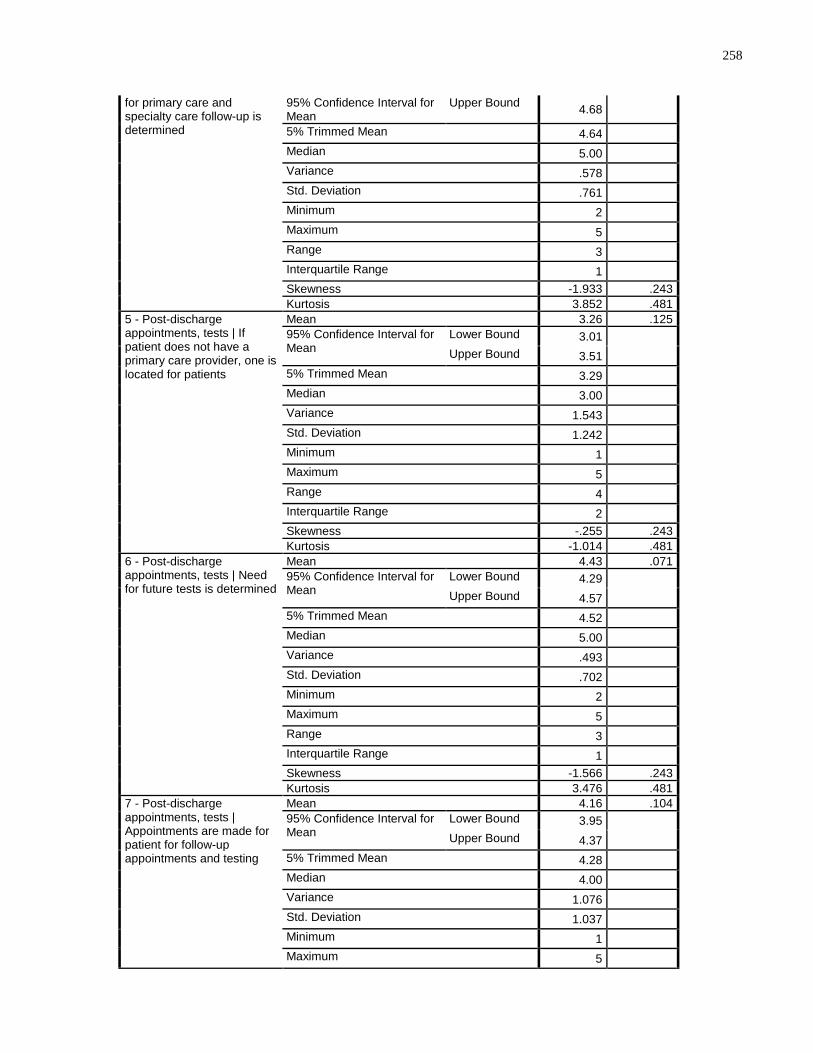
258
for primary care and specialty care follow-up is determined
95% Confidence Interval for Mean
Upper Bound 4.68
5% Trimmed Mean 4.64 Median 5.00 Variance .578 Std. Deviation .761 Minimum 2 Maximum 5 Range 3 Interquartile Range 1 Skewness -1.933 .243
Kurtosis 3.852 .481
5 - Post-discharge appointments, tests | If patient does not have a primary care provider, one is located for patients
Mean 3.26 .125
95% Confidence Interval for Mean
Lower Bound 3.01 Upper Bound 3.51
5% Trimmed Mean 3.29 Median 3.00 Variance 1.543 Std. Deviation 1.242 Minimum 1 Maximum 5 Range 4 Interquartile Range 2 Skewness -.255 .243
Kurtosis -1.014 .481
6 - Post-discharge appointments, tests | Need for future tests is determined
Mean 4.43 .071
95% Confidence Interval for Mean
Lower Bound 4.29 Upper Bound 4.57
5% Trimmed Mean 4.52 Median 5.00 Variance .493 Std. Deviation .702 Minimum 2 Maximum 5 Range 3 Interquartile Range 1 Skewness -1.566 .243
Kurtosis 3.476 .481
7 - Post-discharge appointments, tests | Appointments are made for patient for follow-up appointments and testing
Mean 4.16 .104
95% Confidence Interval for Mean
Lower Bound 3.95 Upper Bound 4.37
5% Trimmed Mean 4.28 Median 4.00 Variance 1.076 Std. Deviation 1.037 Minimum 1 Maximum 5
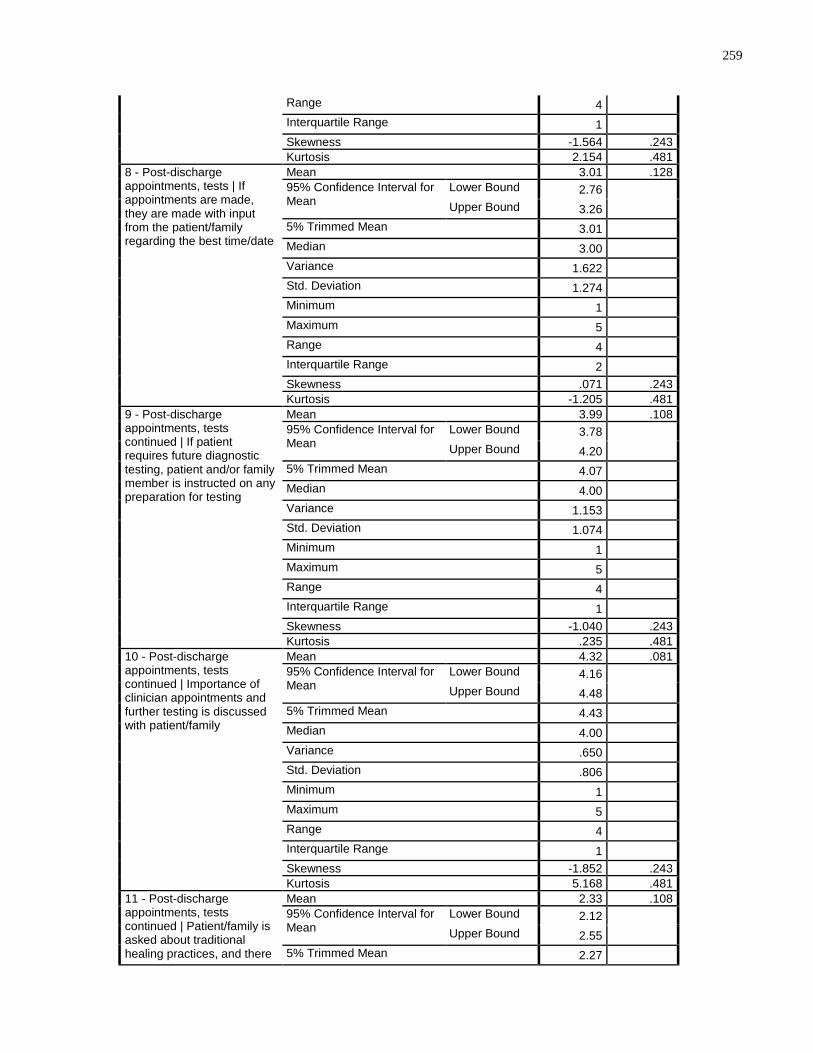
259
Range 4 Interquartile Range 1 Skewness -1.564 .243
Kurtosis 2.154 .481
8 - Post-discharge appointments, tests | If appointments are made, they are made with input from the patient/family regarding the best time/date
Mean 3.01 .128
95% Confidence Interval for Mean
Lower Bound 2.76 Upper Bound 3.26
5% Trimmed Mean 3.01 Median 3.00 Variance 1.622 Std. Deviation 1.274 Minimum 1 Maximum 5 Range 4 Interquartile Range 2 Skewness .071 .243
Kurtosis -1.205 .481
9 - Post-discharge appointments, tests continued | If patient requires future diagnostic testing, patient and/or family member is instructed on any preparation for testing
Mean 3.99 .108
95% Confidence Interval for Mean
Lower Bound 3.78 Upper Bound 4.20
5% Trimmed Mean 4.07 Median 4.00 Variance 1.153 Std. Deviation 1.074 Minimum 1 Maximum 5 Range 4 Interquartile Range 1 Skewness -1.040 .243
Kurtosis .235 .481
10 - Post-discharge appointments, tests continued | Importance of clinician appointments and further testing is discussed with patient/family
Mean 4.32 .081
95% Confidence Interval for Mean
Lower Bound 4.16 Upper Bound 4.48
5% Trimmed Mean 4.43 Median 4.00 Variance .650 Std. Deviation .806 Minimum 1 Maximum 5 Range 4 Interquartile Range 1 Skewness -1.852 .243
Kurtosis 5.168 .481
11 - Post-discharge appointments, tests continued | Patient/family is asked about traditional healing practices, and there
Mean 2.33 .108
95% Confidence Interval for Mean
Lower Bound 2.12 Upper Bound 2.55
5% Trimmed Mean 2.27
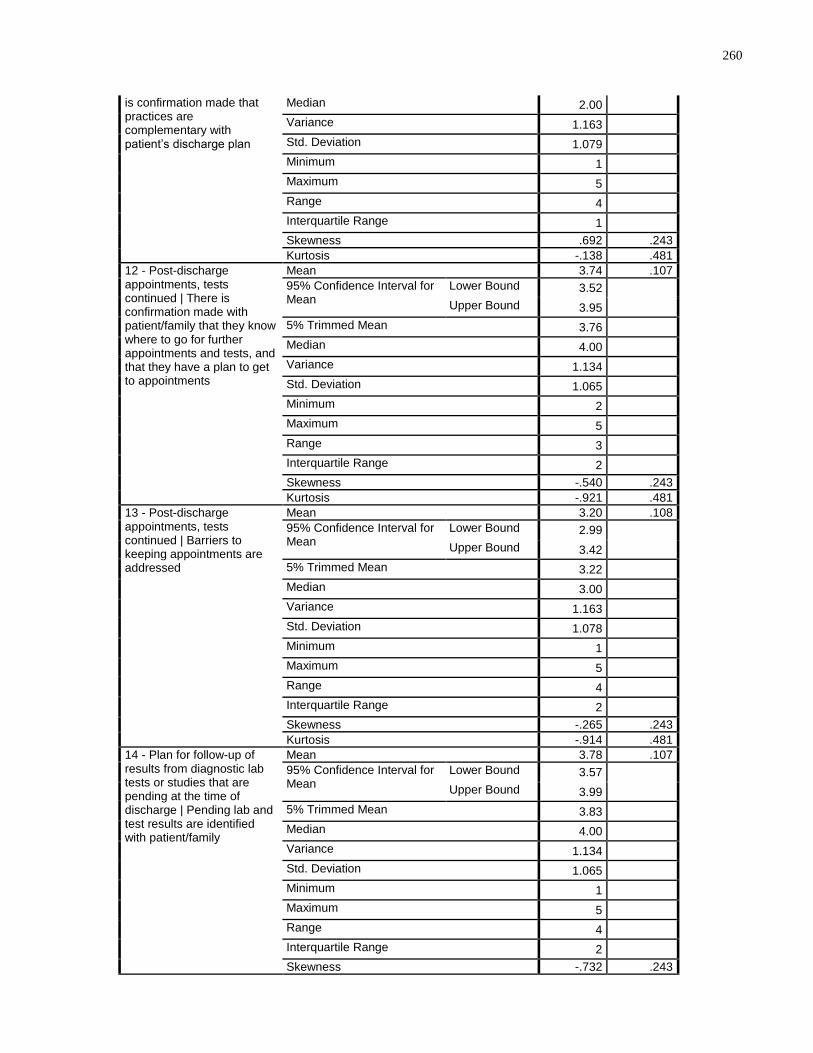
260
is confirmation made that practices are complementary with patient’s discharge plan
Median 2.00 Variance 1.163 Std. Deviation 1.079 Minimum 1 Maximum 5 Range 4 Interquartile Range 1 Skewness .692 .243
Kurtosis -.138 .481
12 - Post-discharge appointments, tests continued | There is confirmation made with patient/family that they know where to go for further appointments and tests, and that they have a plan to get to appointments
Mean 3.74 .107
95% Confidence Interval for Mean
Lower Bound 3.52 Upper Bound 3.95
5% Trimmed Mean 3.76 Median 4.00 Variance 1.134 Std. Deviation 1.065 Minimum 2 Maximum 5 Range 3 Interquartile Range 2 Skewness -.540 .243
Kurtosis -.921 .481
13 - Post-discharge appointments, tests continued | Barriers to keeping appointments are addressed
Mean 3.20 .108
95% Confidence Interval for Mean
Lower Bound 2.99 Upper Bound 3.42
5% Trimmed Mean 3.22 Median 3.00 Variance 1.163 Std. Deviation 1.078 Minimum 1 Maximum 5 Range 4 Interquartile Range 2 Skewness -.265 .243
Kurtosis -.914 .481
14 - Plan for follow-up of results from diagnostic lab tests or studies that are pending at the time of discharge | Pending lab and test results are identified with patient/family
Mean 3.78 .107
95% Confidence Interval for Mean
Lower Bound 3.57 Upper Bound 3.99
5% Trimmed Mean 3.83 Median 4.00 Variance 1.134 Std. Deviation 1.065 Minimum 1 Maximum 5 Range 4 Interquartile Range 2 Skewness -.732 .243
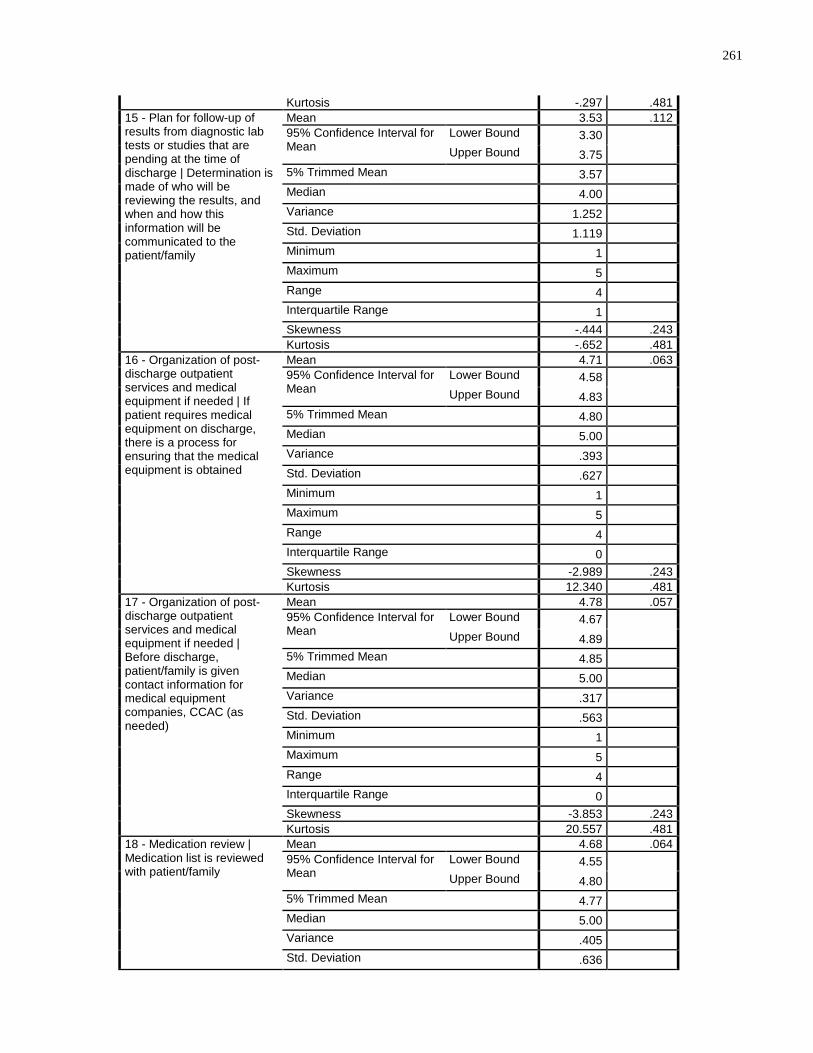
261
Kurtosis -.297 .481
15 - Plan for follow-up of results from diagnostic lab tests or studies that are pending at the time of discharge | Determination is made of who will be reviewing the results, and when and how this information will be communicated to the patient/family
Mean 3.53 .112
95% Confidence Interval for Mean
Lower Bound 3.30 Upper Bound 3.75
5% Trimmed Mean 3.57 Median 4.00 Variance 1.252 Std. Deviation 1.119 Minimum 1 Maximum 5 Range 4 Interquartile Range 1 Skewness -.444 .243
Kurtosis -.652 .481
16 - Organization of post-discharge outpatient services and medical equipment if needed | If patient requires medical equipment on discharge, there is a process for ensuring that the medical equipment is obtained
Mean 4.71 .063
95% Confidence Interval for Mean
Lower Bound 4.58 Upper Bound 4.83
5% Trimmed Mean 4.80 Median 5.00 Variance .393 Std. Deviation .627 Minimum 1 Maximum 5 Range 4 Interquartile Range 0 Skewness -2.989 .243
Kurtosis 12.340 .481
17 - Organization of post-discharge outpatient services and medical equipment if needed | Before discharge, patient/family is given contact information for medical equipment companies, CCAC (as needed)
Mean 4.78 .057
95% Confidence Interval for Mean
Lower Bound 4.67 Upper Bound 4.89
5% Trimmed Mean 4.85 Median 5.00 Variance .317 Std. Deviation .563 Minimum 1 Maximum 5 Range 4 Interquartile Range 0 Skewness -3.853 .243
Kurtosis 20.557 .481
18 - Medication review | Medication list is reviewed with patient/family
Mean 4.68 .064
95% Confidence Interval for Mean
Lower Bound 4.55 Upper Bound 4.80
5% Trimmed Mean 4.77 Median 5.00 Variance .405 Std. Deviation .636
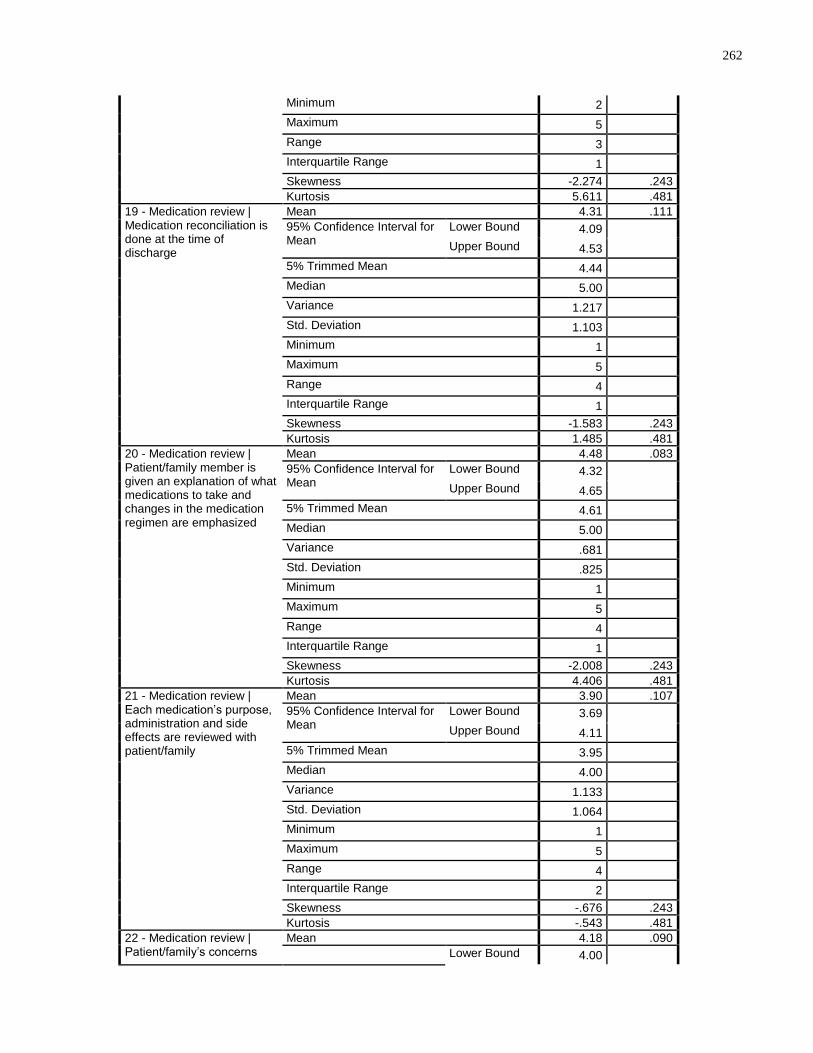
262
Minimum 2 Maximum 5 Range 3 Interquartile Range 1 Skewness -2.274 .243
Kurtosis 5.611 .481
19 - Medication review | Medication reconciliation is done at the time of discharge
Mean 4.31 .111
95% Confidence Interval for Mean
Lower Bound 4.09 Upper Bound 4.53
5% Trimmed Mean 4.44 Median 5.00 Variance 1.217 Std. Deviation 1.103 Minimum 1 Maximum 5 Range 4 Interquartile Range 1 Skewness -1.583 .243
Kurtosis 1.485 .481
20 - Medication review | Patient/family member is given an explanation of what medications to take and changes in the medication regimen are emphasized
Mean 4.48 .083
95% Confidence Interval for Mean
Lower Bound 4.32 Upper Bound 4.65
5% Trimmed Mean 4.61 Median 5.00 Variance .681 Std. Deviation .825 Minimum 1 Maximum 5 Range 4 Interquartile Range 1 Skewness -2.008 .243
Kurtosis 4.406 .481
21 - Medication review | Each medication’s purpose, administration and side effects are reviewed with patient/family
Mean 3.90 .107
95% Confidence Interval for Mean
Lower Bound 3.69 Upper Bound 4.11
5% Trimmed Mean 3.95 Median 4.00 Variance 1.133 Std. Deviation 1.064 Minimum 1 Maximum 5 Range 4 Interquartile Range 2 Skewness -.676 .243
Kurtosis -.543 .481
22 - Medication review | Patient/family’s concerns
Mean 4.18 .090
Lower Bound 4.00
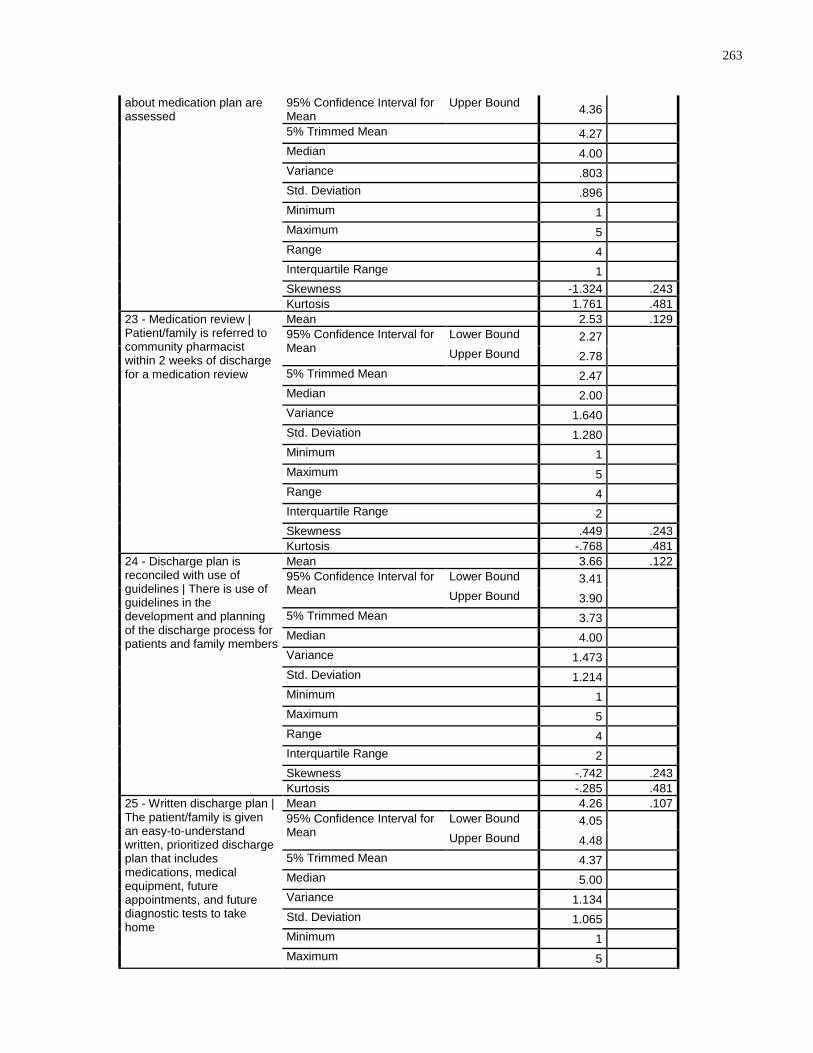
263
about medication plan are assessed
95% Confidence Interval for Mean
Upper Bound 4.36
5% Trimmed Mean 4.27 Median 4.00 Variance .803 Std. Deviation .896 Minimum 1 Maximum 5 Range 4 Interquartile Range 1 Skewness -1.324 .243
Kurtosis 1.761 .481
23 - Medication review | Patient/family is referred to community pharmacist within 2 weeks of discharge for a medication review
Mean 2.53 .129
95% Confidence Interval for Mean
Lower Bound 2.27 Upper Bound 2.78
5% Trimmed Mean 2.47 Median 2.00 Variance 1.640 Std. Deviation 1.280 Minimum 1 Maximum 5 Range 4 Interquartile Range 2 Skewness .449 .243
Kurtosis -.768 .481
24 - Discharge plan is reconciled with use of guidelines | There is use of guidelines in the development and planning of the discharge process for patients and family members
Mean 3.66 .122
95% Confidence Interval for Mean
Lower Bound 3.41 Upper Bound 3.90
5% Trimmed Mean 3.73 Median 4.00 Variance 1.473 Std. Deviation 1.214 Minimum 1 Maximum 5 Range 4 Interquartile Range 2 Skewness -.742 .243
Kurtosis -.285 .481
25 - Written discharge plan | The patient/family is given an easy-to-understand written, prioritized discharge plan that includes medications, medical equipment, future appointments, and future diagnostic tests to take home
Mean 4.26 .107
95% Confidence Interval for Mean
Lower Bound 4.05 Upper Bound 4.48
5% Trimmed Mean 4.37 Median 5.00 Variance 1.134 Std. Deviation 1.065 Minimum 1 Maximum 5
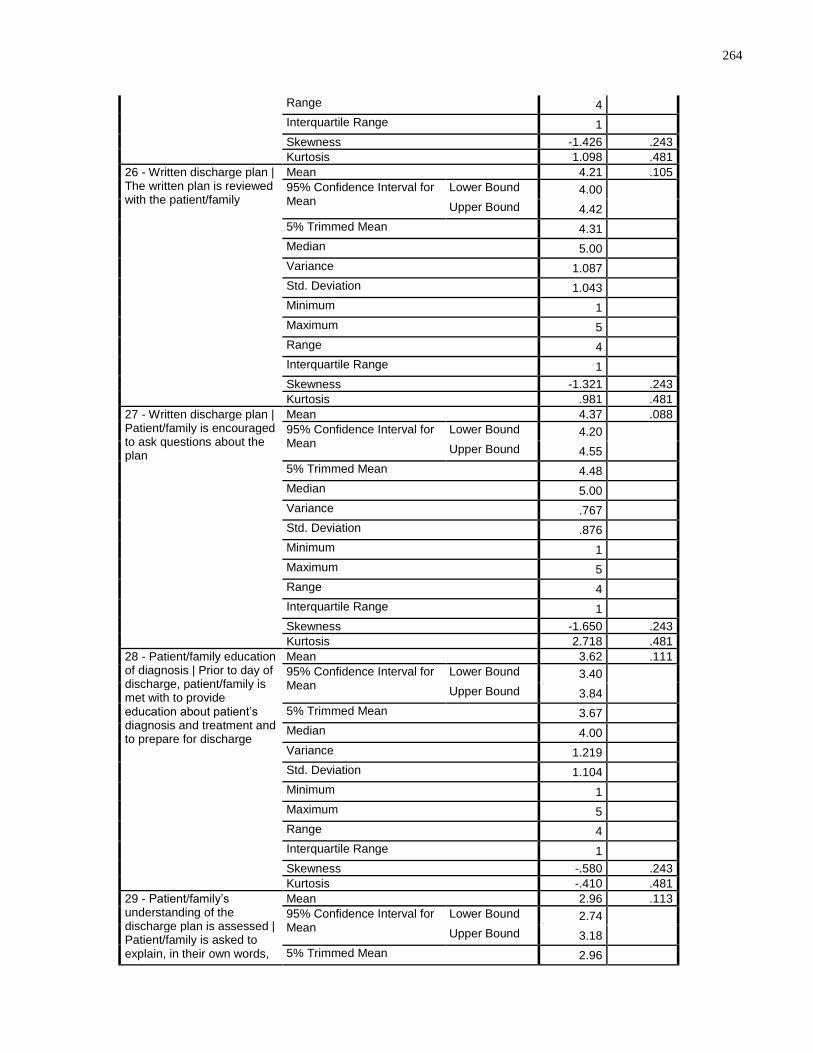
264
Range 4 Interquartile Range 1 Skewness -1.426 .243
Kurtosis 1.098 .481
26 - Written discharge plan | The written plan is reviewed with the patient/family
Mean 4.21 .105
95% Confidence Interval for Mean
Lower Bound 4.00 Upper Bound 4.42
5% Trimmed Mean 4.31 Median 5.00 Variance 1.087 Std. Deviation 1.043 Minimum 1 Maximum 5 Range 4 Interquartile Range 1 Skewness -1.321 .243
Kurtosis .981 .481
27 - Written discharge plan | Patient/family is encouraged to ask questions about the plan
Mean 4.37 .088
95% Confidence Interval for Mean
Lower Bound 4.20 Upper Bound 4.55
5% Trimmed Mean 4.48 Median 5.00 Variance .767 Std. Deviation .876 Minimum 1 Maximum 5 Range 4 Interquartile Range 1 Skewness -1.650 .243
Kurtosis 2.718 .481
28 - Patient/family education of diagnosis | Prior to day of discharge, patient/family is met with to provide education about patient’s diagnosis and treatment and to prepare for discharge
Mean 3.62 .111
95% Confidence Interval for Mean
Lower Bound 3.40 Upper Bound 3.84
5% Trimmed Mean 3.67 Median 4.00 Variance 1.219 Std. Deviation 1.104 Minimum 1 Maximum 5 Range 4 Interquartile Range 1 Skewness -.580 .243
Kurtosis -.410 .481
29 - Patient/family’s understanding of the discharge plan is assessed | Patient/family is asked to explain, in their own words,
Mean 2.96 .113
95% Confidence Interval for Mean
Lower Bound 2.74 Upper Bound 3.18
5% Trimmed Mean 2.96
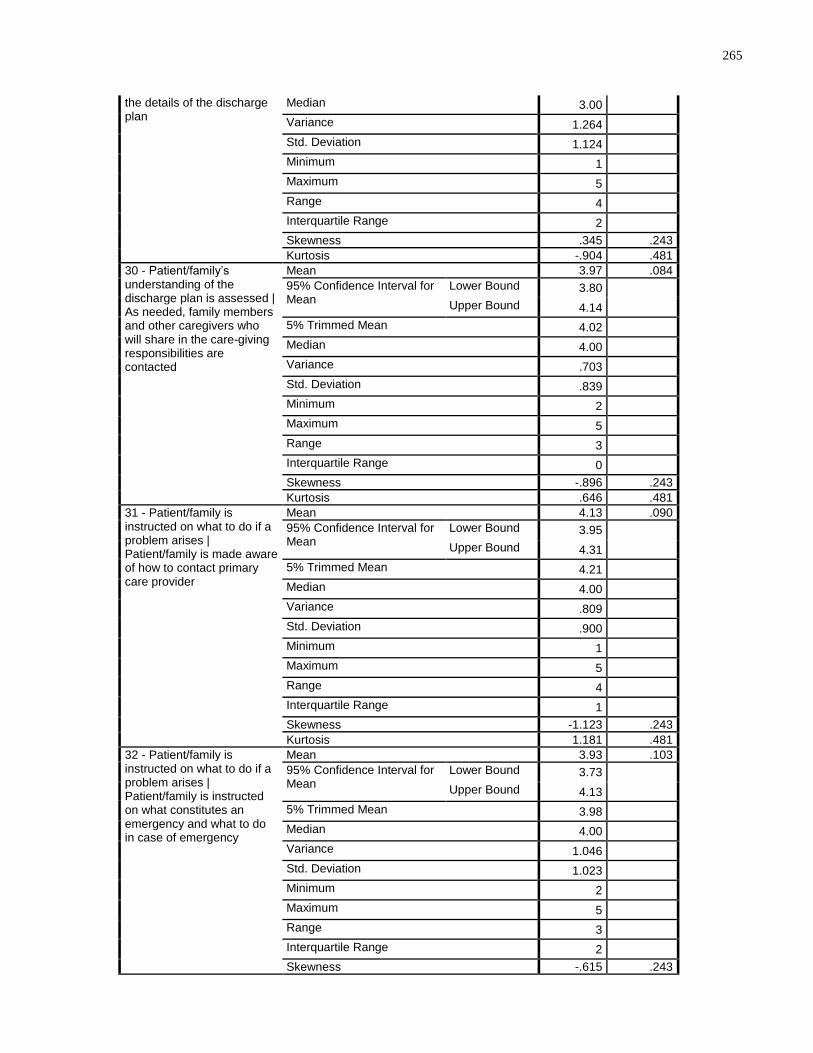
265
the details of the discharge plan
Median 3.00 Variance 1.264 Std. Deviation 1.124 Minimum 1 Maximum 5 Range 4 Interquartile Range 2 Skewness .345 .243
Kurtosis -.904 .481
30 - Patient/family’s understanding of the discharge plan is assessed | As needed, family members and other caregivers who will share in the care-giving responsibilities are contacted
Mean 3.97 .084
95% Confidence Interval for Mean
Lower Bound 3.80 Upper Bound 4.14
5% Trimmed Mean 4.02 Median 4.00 Variance .703 Std. Deviation .839 Minimum 2 Maximum 5 Range 3 Interquartile Range 0 Skewness -.896 .243
Kurtosis .646 .481
31 - Patient/family is instructed on what to do if a problem arises | Patient/family is made aware of how to contact primary care provider
Mean 4.13 .090
95% Confidence Interval for Mean
Lower Bound 3.95 Upper Bound 4.31
5% Trimmed Mean 4.21 Median 4.00 Variance .809 Std. Deviation .900 Minimum 1 Maximum 5 Range 4 Interquartile Range 1 Skewness -1.123 .243
Kurtosis 1.181 .481
32 - Patient/family is instructed on what to do if a problem arises | Patient/family is instructed on what constitutes an emergency and what to do in case of emergency
Mean 3.93 .103
95% Confidence Interval for Mean
Lower Bound 3.73 Upper Bound 4.13
5% Trimmed Mean 3.98 Median 4.00 Variance 1.046 Std. Deviation 1.023 Minimum 2 Maximum 5 Range 3 Interquartile Range 2 Skewness -.615 .243
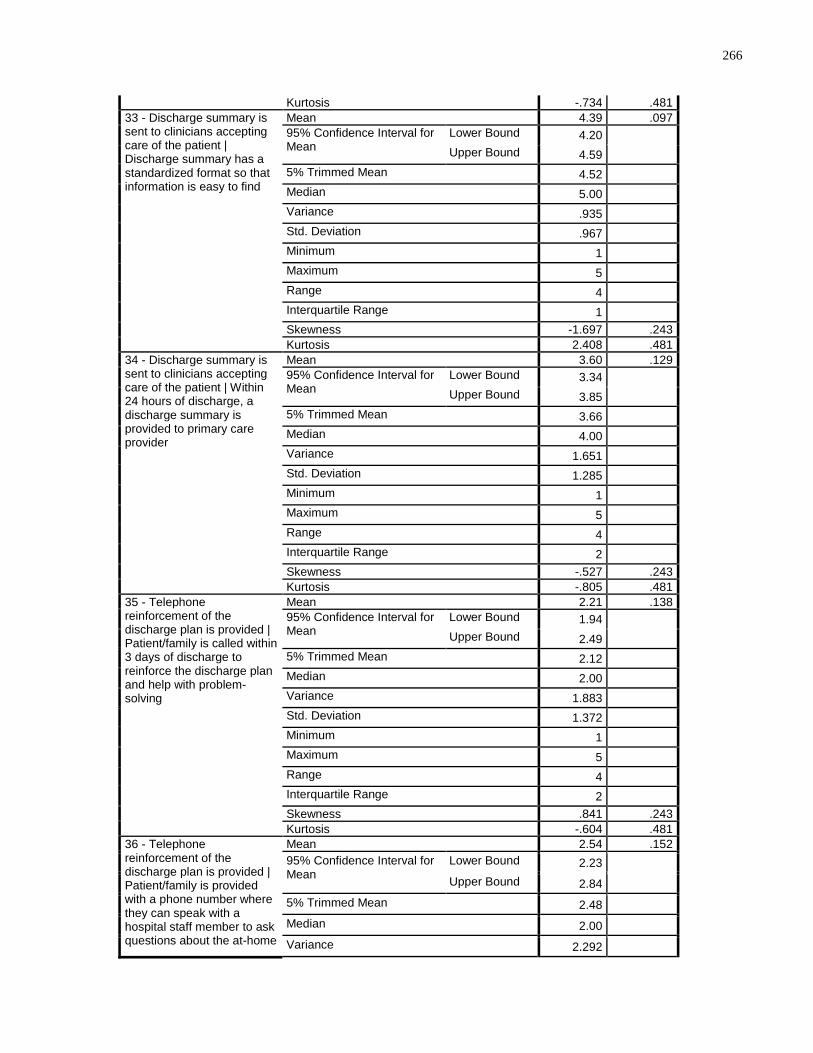
266
Kurtosis -.734 .481
33 - Discharge summary is sent to clinicians accepting care of the patient | Discharge summary has a standardized format so that information is easy to find
Mean 4.39 .097
95% Confidence Interval for Mean
Lower Bound 4.20 Upper Bound 4.59
5% Trimmed Mean 4.52 Median 5.00 Variance .935 Std. Deviation .967 Minimum 1 Maximum 5 Range 4 Interquartile Range 1 Skewness -1.697 .243
Kurtosis 2.408 .481
34 - Discharge summary is sent to clinicians accepting care of the patient | Within 24 hours of discharge, a discharge summary is provided to primary care provider
Mean 3.60 .129
95% Confidence Interval for Mean
Lower Bound 3.34 Upper Bound 3.85
5% Trimmed Mean 3.66 Median 4.00 Variance 1.651 Std. Deviation 1.285 Minimum 1 Maximum 5 Range 4 Interquartile Range 2 Skewness -.527 .243
Kurtosis -.805 .481
35 - Telephone reinforcement of the discharge plan is provided | Patient/family is called within 3 days of discharge to reinforce the discharge plan and help with problem-solving
Mean 2.21 .138
95% Confidence Interval for Mean
Lower Bound 1.94 Upper Bound 2.49
5% Trimmed Mean 2.12 Median 2.00 Variance 1.883 Std. Deviation 1.372 Minimum 1 Maximum 5 Range 4 Interquartile Range 2 Skewness .841 .243
Kurtosis -.604 .481
36 - Telephone reinforcement of the discharge plan is provided | Patient/family is provided with a phone number where they can speak with a hospital staff member to ask questions about the at-home
Mean 2.54 .152
95% Confidence Interval for Mean
Lower Bound 2.23 Upper Bound 2.84
5% Trimmed Mean 2.48 Median 2.00 Variance 2.292

267
care plan, hospitalization, and follow-up plan in order to
Std. Deviation 1.514 Minimum 1 Maximum 5 Range 4 Interquartile Range 3 Skewness .489 .243
Kurtosis -1.257 .481
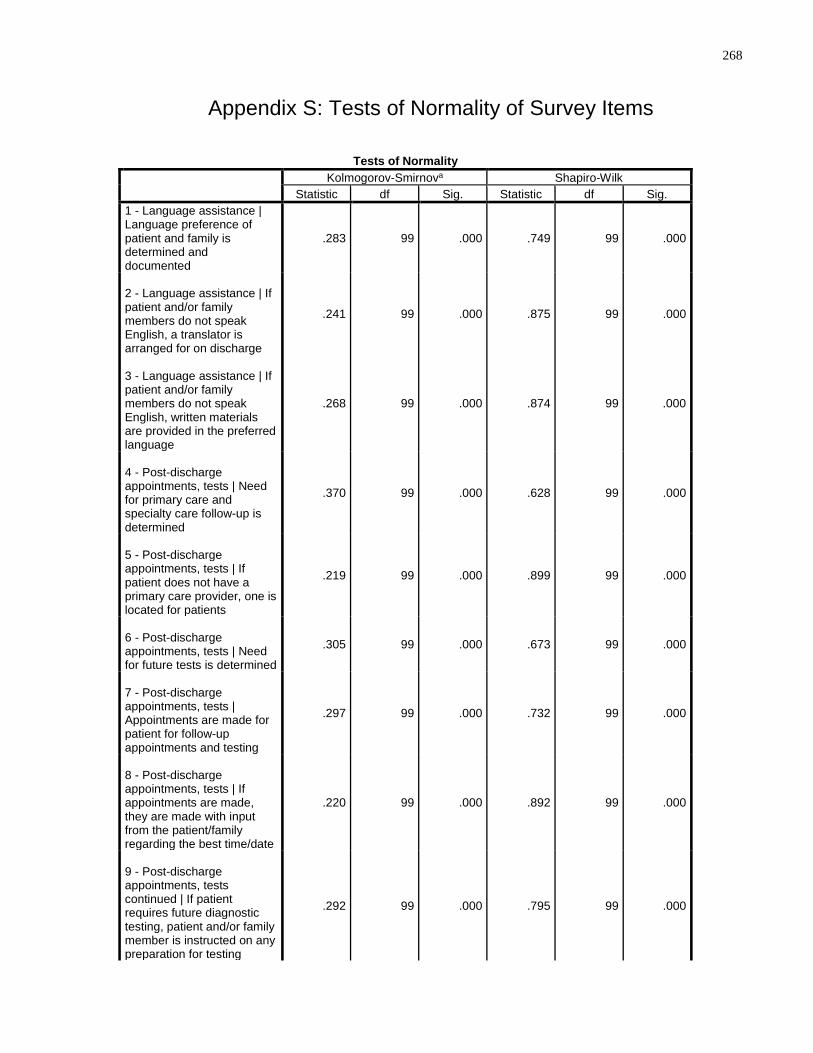
268
Appendix S: Tests of Normality of Survey Items
Tests of Normality
Kolmogorov-Smirnova Shapiro-Wilk
Statistic df Sig. Statistic df Sig.
1 - Language assistance | Language preference of patient and family is determined and documented
.283 99 .000 .749 99 .000
2 - Language assistance | If patient and/or family members do not speak English, a translator is arranged for on discharge
.241 99 .000 .875 99 .000
3 - Language assistance | If patient and/or family members do not speak English, written materials are provided in the preferred language
.268 99 .000 .874 99 .000
4 - Post-discharge appointments, tests | Need for primary care and specialty care follow-up is determined
.370 99 .000 .628 99 .000
5 - Post-discharge appointments, tests | If patient does not have a primary care provider, one is located for patients
.219 99 .000 .899 99 .000
6 - Post-discharge appointments, tests | Need for future tests is determined
.305 99 .000 .673 99 .000
7 - Post-discharge appointments, tests | Appointments are made for patient for follow-up appointments and testing
.297 99 .000 .732 99 .000
8 - Post-discharge appointments, tests | If appointments are made, they are made with input from the patient/family regarding the best time/date
.220 99 .000 .892 99 .000
9 - Post-discharge appointments, tests continued | If patient requires future diagnostic testing, patient and/or family member is instructed on any preparation for testing
.292 99 .000 .795 99 .000
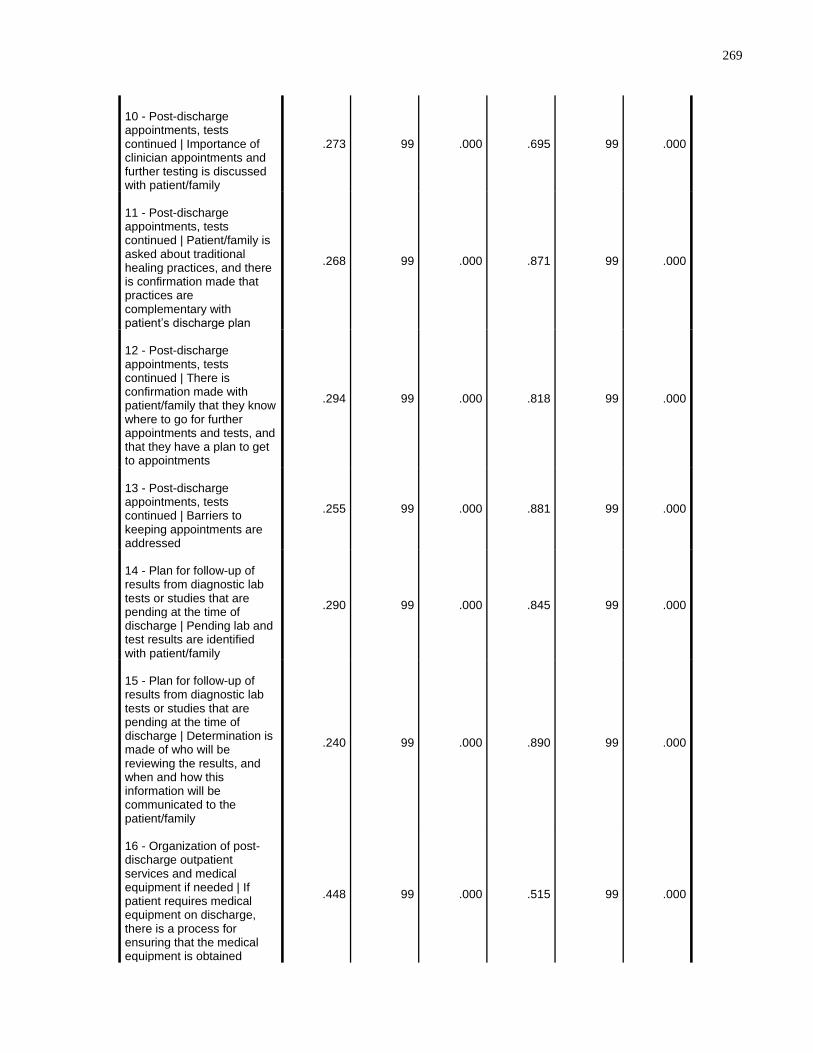
269
10 - Post-discharge appointments, tests continued | Importance of clinician appointments and further testing is discussed with patient/family
.273 99 .000 .695 99 .000
11 - Post-discharge appointments, tests continued | Patient/family is asked about traditional healing practices, and there is confirmation made that practices are complementary with patient’s discharge plan
.268 99 .000 .871 99 .000
12 - Post-discharge appointments, tests continued | There is confirmation made with patient/family that they know where to go for further appointments and tests, and that they have a plan to get to appointments
.294 99 .000 .818 99 .000
13 - Post-discharge appointments, tests continued | Barriers to keeping appointments are addressed
.255 99 .000 .881 99 .000
14 - Plan for follow-up of results from diagnostic lab tests or studies that are pending at the time of discharge | Pending lab and test results are identified with patient/family
.290 99 .000 .845 99 .000
15 - Plan for follow-up of results from diagnostic lab tests or studies that are pending at the time of discharge | Determination is made of who will be reviewing the results, and when and how this information will be communicated to the patient/family
.240 99 .000 .890 99 .000
16 - Organization of post-discharge outpatient services and medical equipment if needed | If patient requires medical equipment on discharge, there is a process for ensuring that the medical equipment is obtained
.448 99 .000 .515 99 .000
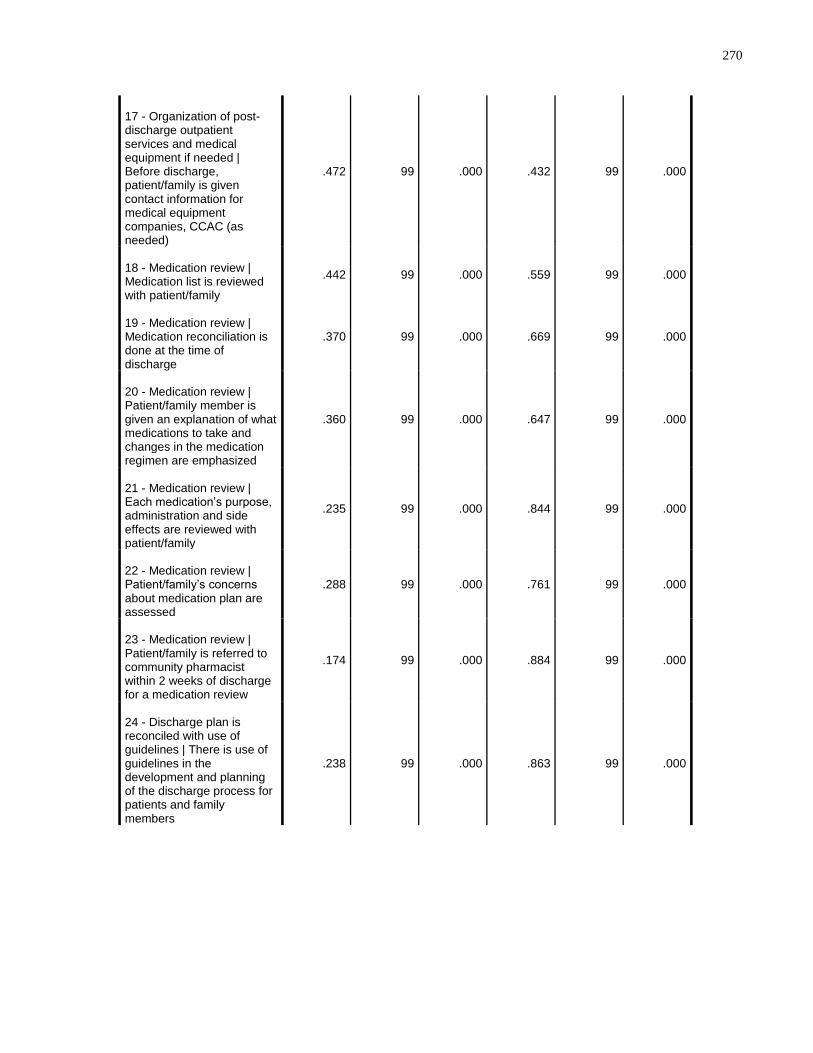
270
17 - Organization of post-discharge outpatient services and medical equipment if needed | Before discharge, patient/family is given contact information for medical equipment companies, CCAC (as needed)
.472 99 .000 .432 99 .000
18 - Medication review | Medication list is reviewed with patient/family
.442 99 .000 .559 99 .000
19 - Medication review | Medication reconciliation is done at the time of discharge
.370 99 .000 .669 99 .000
20 - Medication review | Patient/family member is given an explanation of what medications to take and changes in the medication regimen are emphasized
.360 99 .000 .647 99 .000
21 - Medication review | Each medication’s purpose, administration and side effects are reviewed with patient/family
.235 99 .000 .844 99 .000
22 - Medication review | Patient/family’s concerns about medication plan are assessed
.288 99 .000 .761 99 .000
23 - Medication review | Patient/family is referred to community pharmacist within 2 weeks of discharge for a medication review
.174 99 .000 .884 99 .000
24 - Discharge plan is reconciled with use of guidelines | There is use of guidelines in the development and planning of the discharge process for patients and family members
.238 99 .000 .863 99 .000
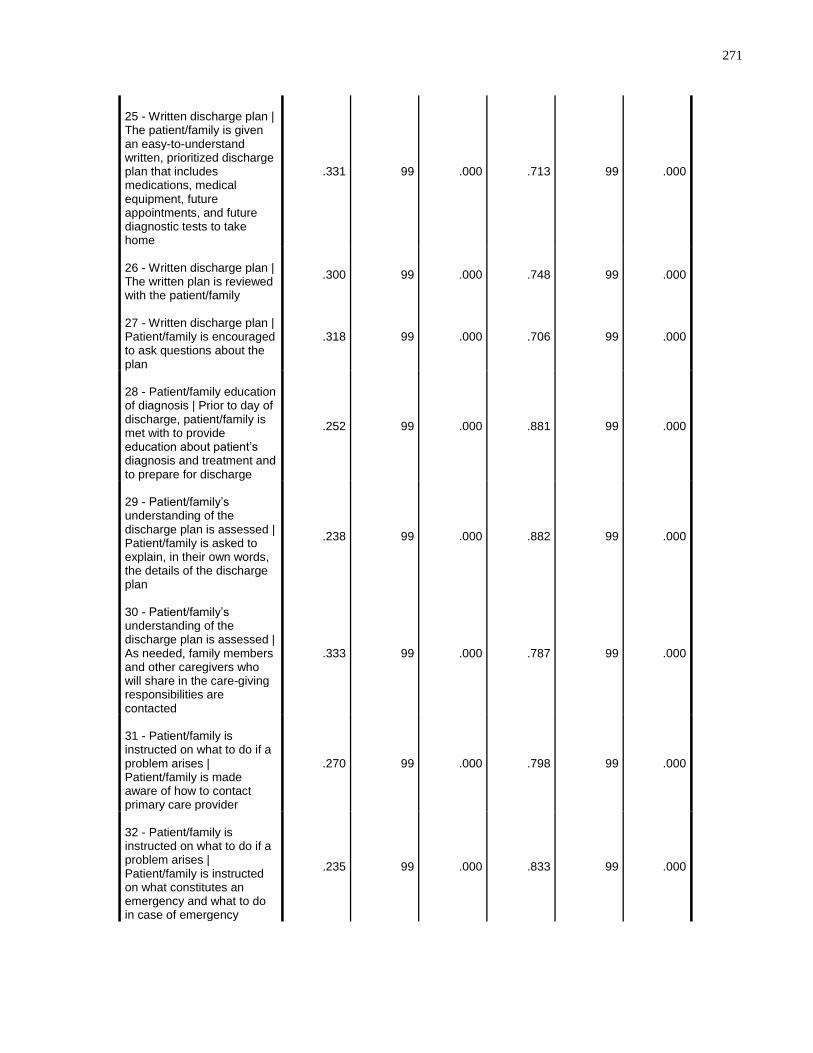
271
25 - Written discharge plan | The patient/family is given an easy-to-understand written, prioritized discharge plan that includes medications, medical equipment, future appointments, and future diagnostic tests to take home
.331 99 .000 .713 99 .000
26 - Written discharge plan | The written plan is reviewed with the patient/family
.300 99 .000 .748 99 .000
27 - Written discharge plan | Patient/family is encouraged to ask questions about the plan
.318 99 .000 .706 99 .000
28 - Patient/family education of diagnosis | Prior to day of discharge, patient/family is met with to provide education about patient’s diagnosis and treatment and to prepare for discharge
.252 99 .000 .881 99 .000
29 - Patient/family’s understanding of the discharge plan is assessed | Patient/family is asked to explain, in their own words, the details of the discharge plan
.238 99 .000 .882 99 .000
30 - Patient/family’s understanding of the discharge plan is assessed | As needed, family members and other caregivers who will share in the care-giving responsibilities are contacted
.333 99 .000 .787 99 .000
31 - Patient/family is instructed on what to do if a problem arises | Patient/family is made aware of how to contact primary care provider
.270 99 .000 .798 99 .000
32 - Patient/family is instructed on what to do if a problem arises | Patient/family is instructed on what constitutes an emergency and what to do in case of emergency
.235 99 .000 .833 99 .000
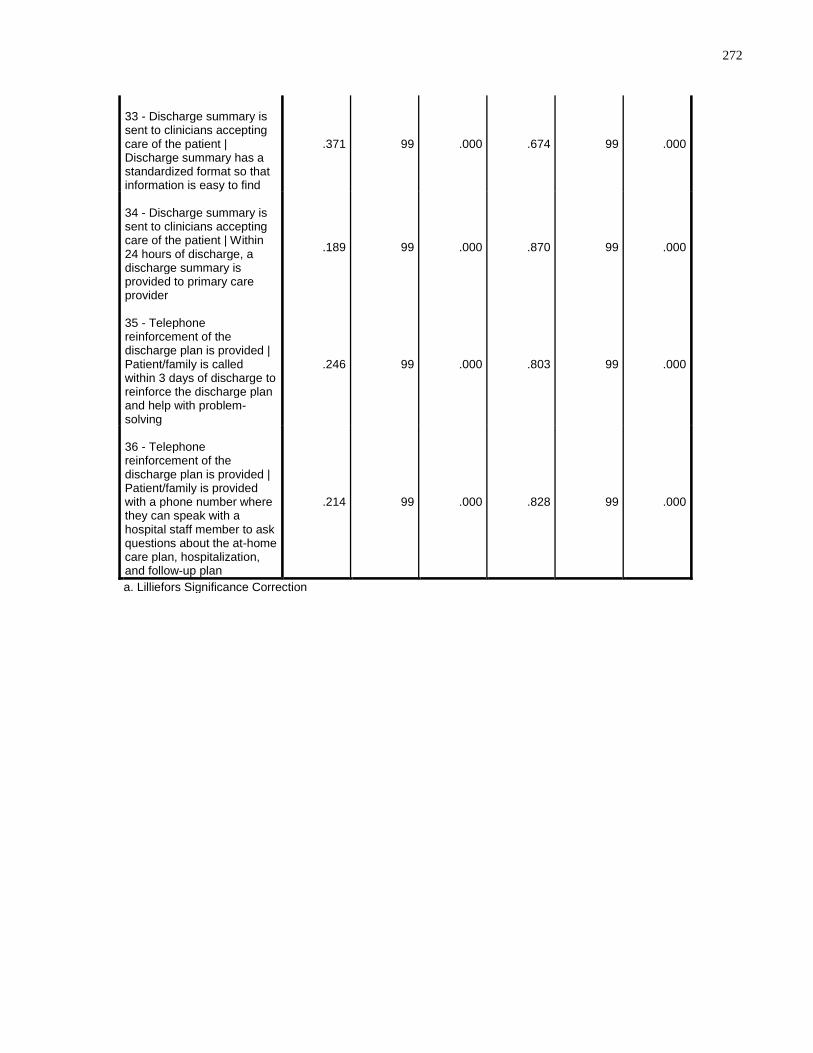
272
33 - Discharge summary is sent to clinicians accepting care of the patient | Discharge summary has a standardized format so that information is easy to find
.371 99 .000 .674 99 .000
34 - Discharge summary is sent to clinicians accepting care of the patient | Within 24 hours of discharge, a discharge summary is provided to primary care provider
.189 99 .000 .870 99 .000
35 - Telephone reinforcement of the discharge plan is provided | Patient/family is called within 3 days of discharge to reinforce the discharge plan and help with problem-solving
.246 99 .000 .803 99 .000
36 - Telephone reinforcement of the discharge plan is provided | Patient/family is provided with a phone number where they can speak with a hospital staff member to ask questions about the at-home care plan, hospitalization, and follow-up plan
.214 99 .000 .828 99 .000
a. Lilliefors Significance Correction
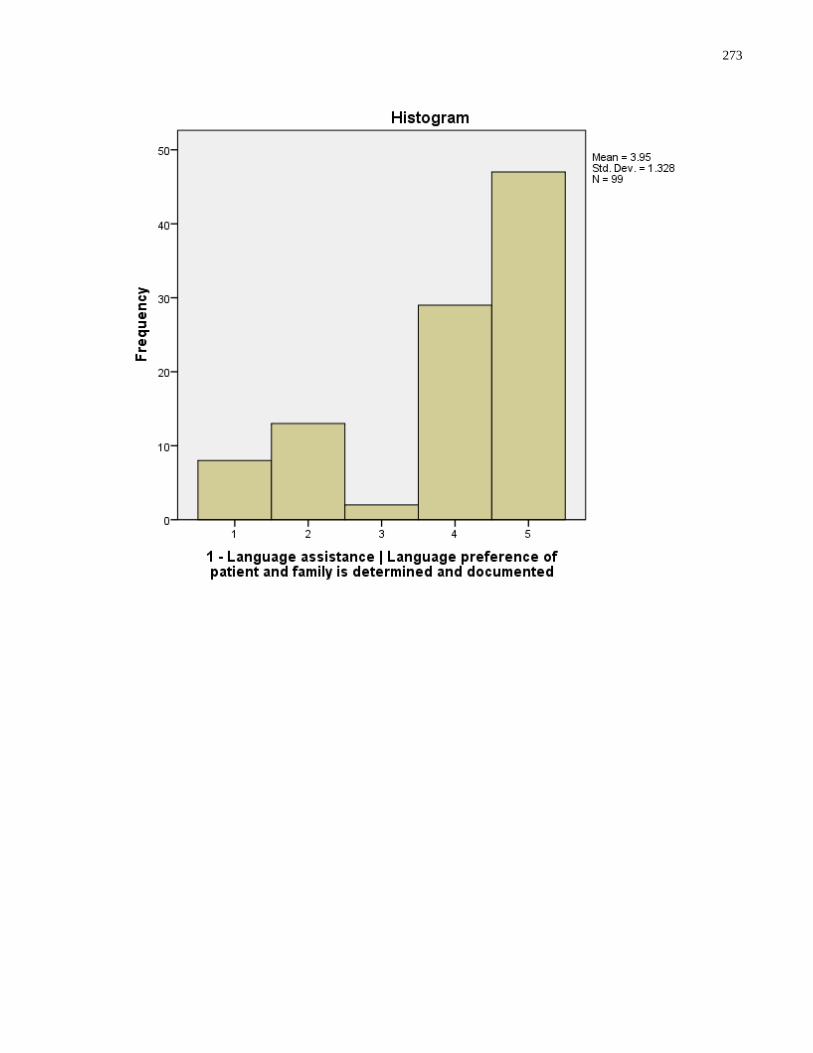
273

274
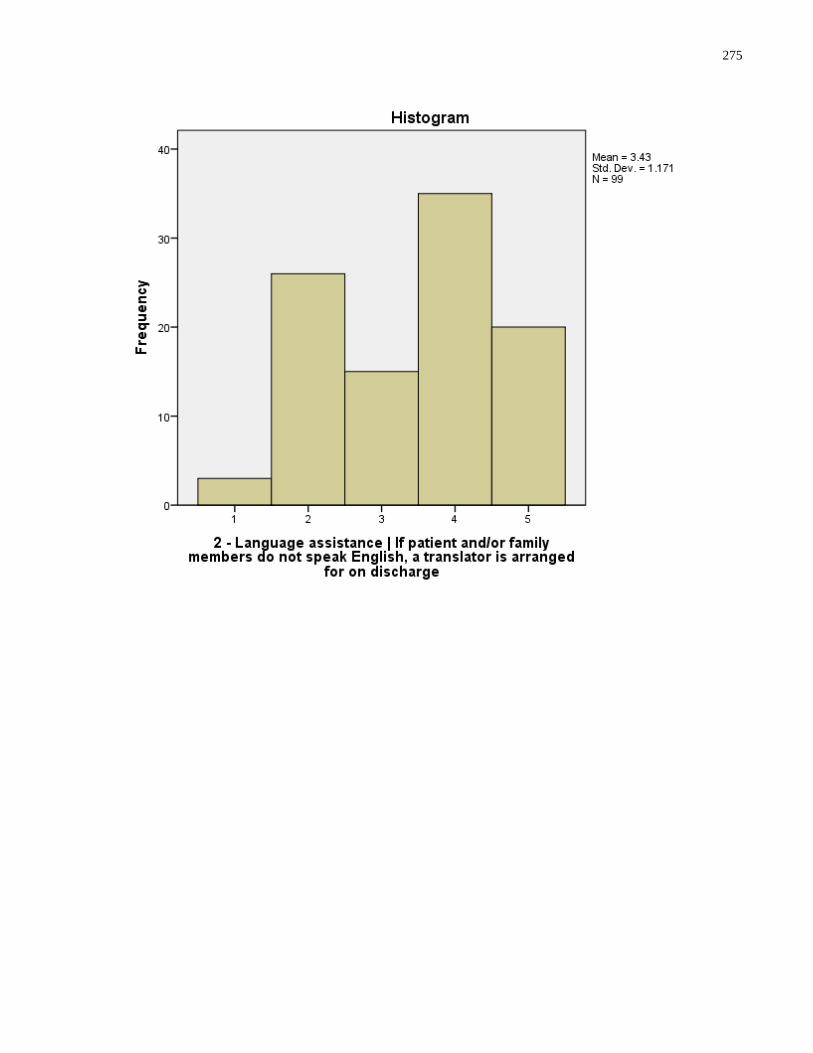
275

276
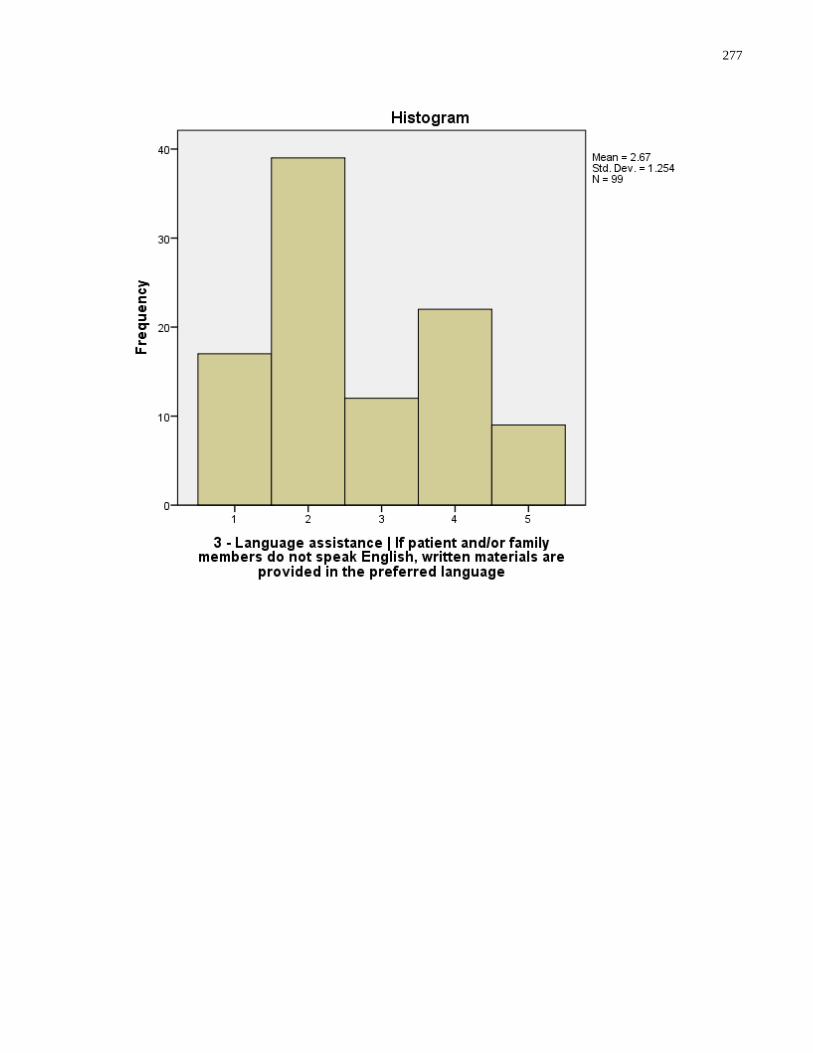
277
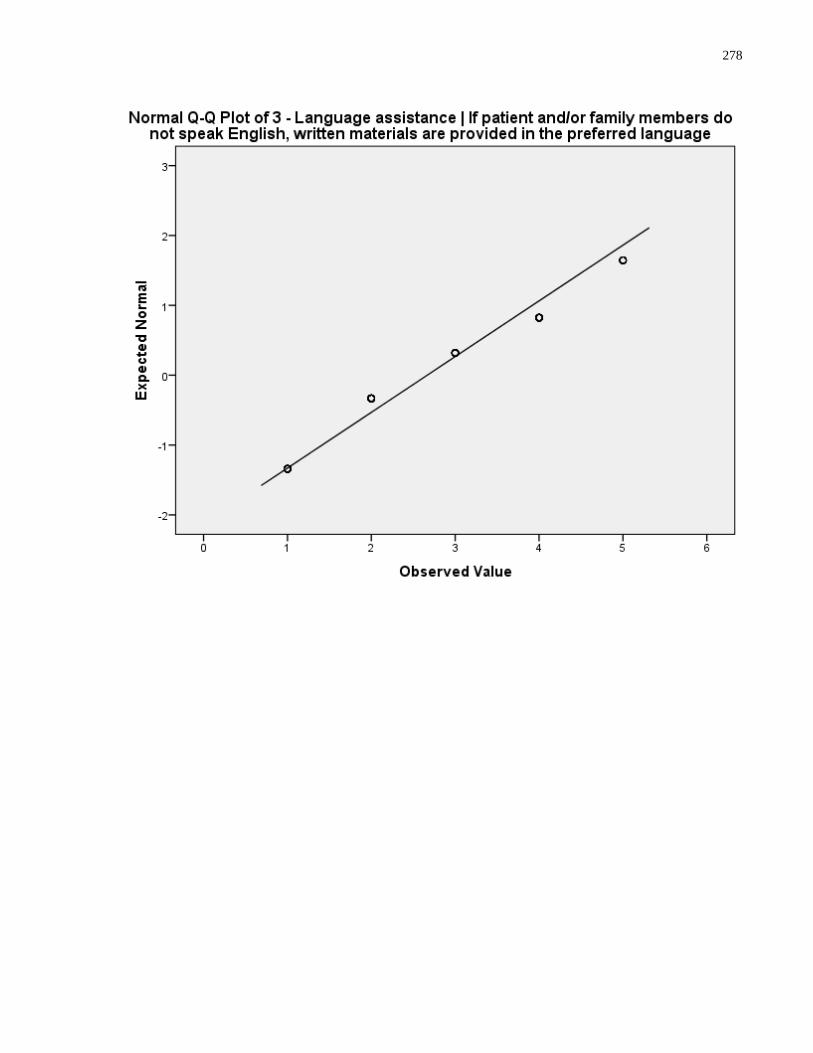
278
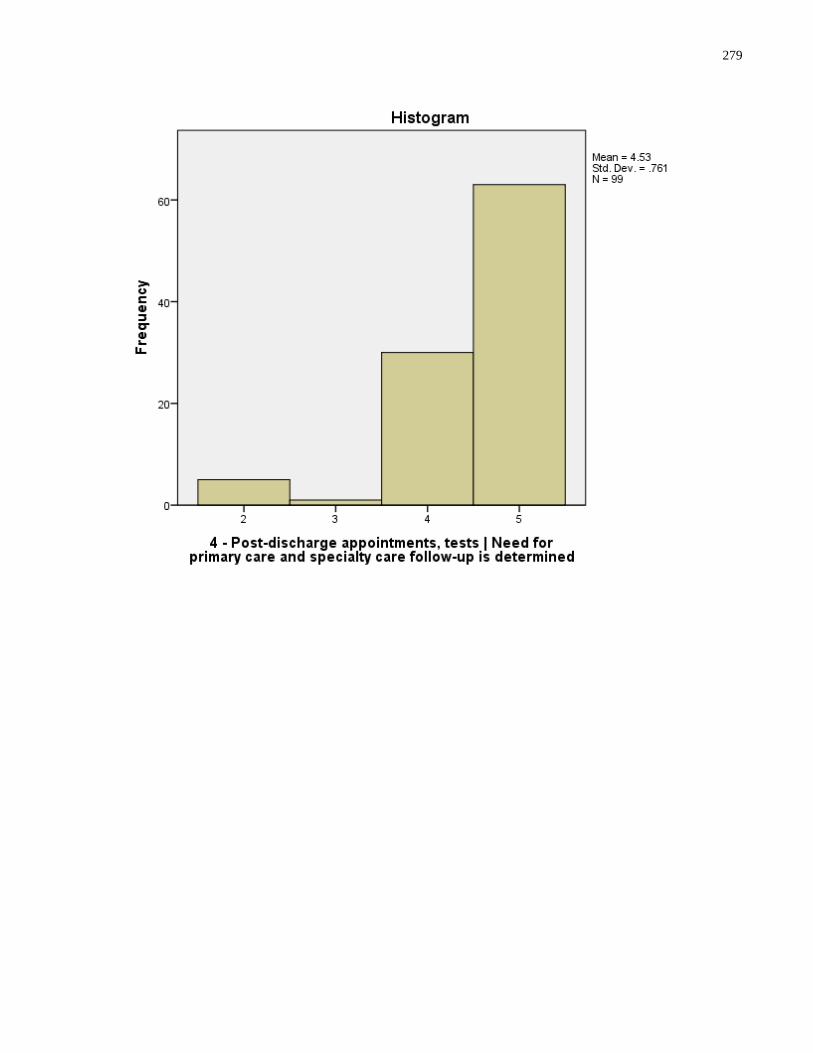
279

280
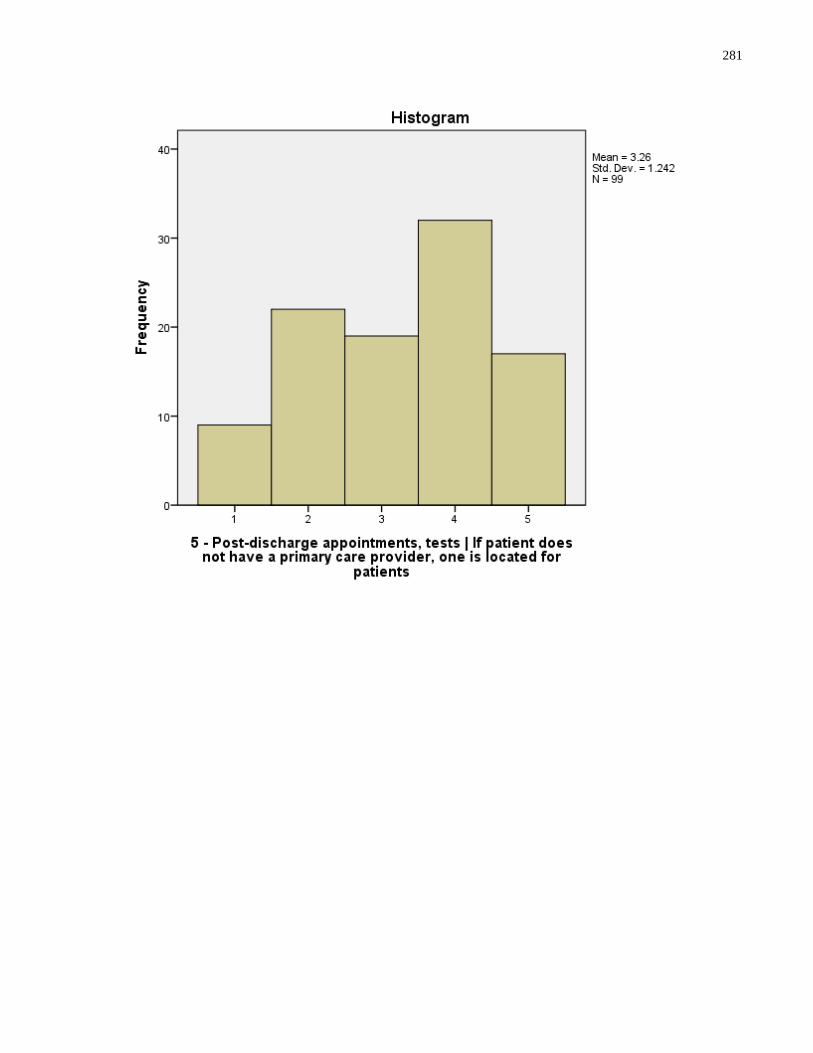
281
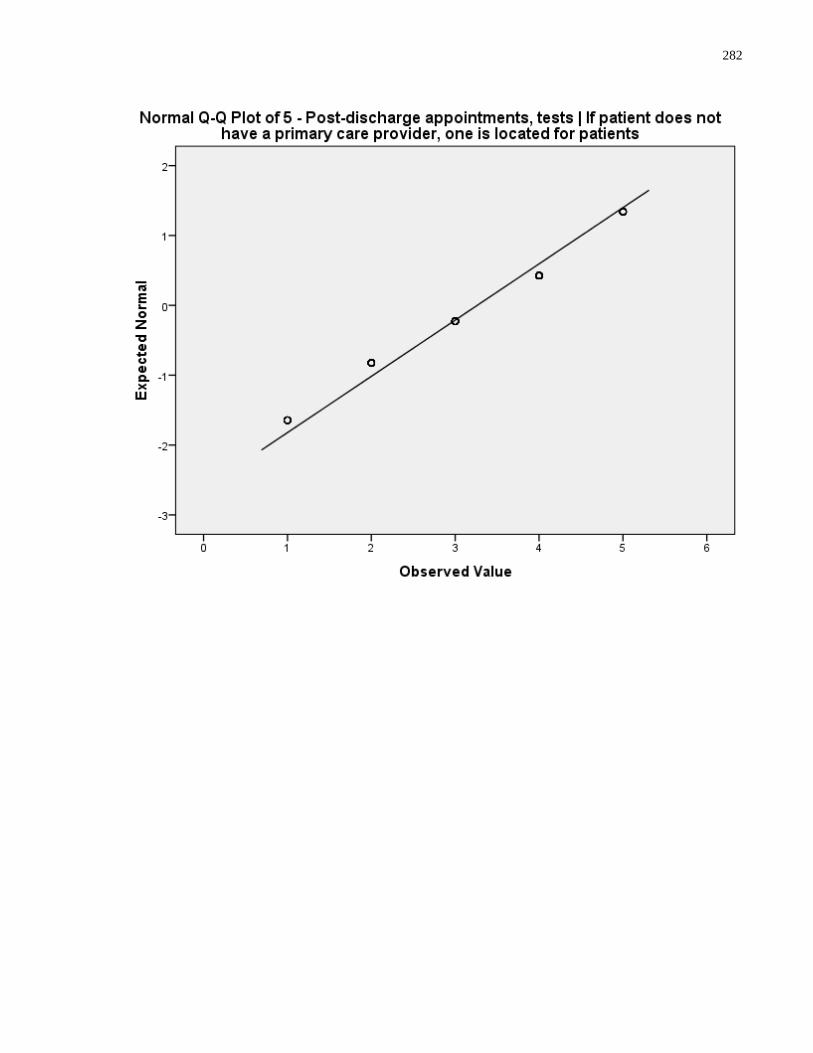
282
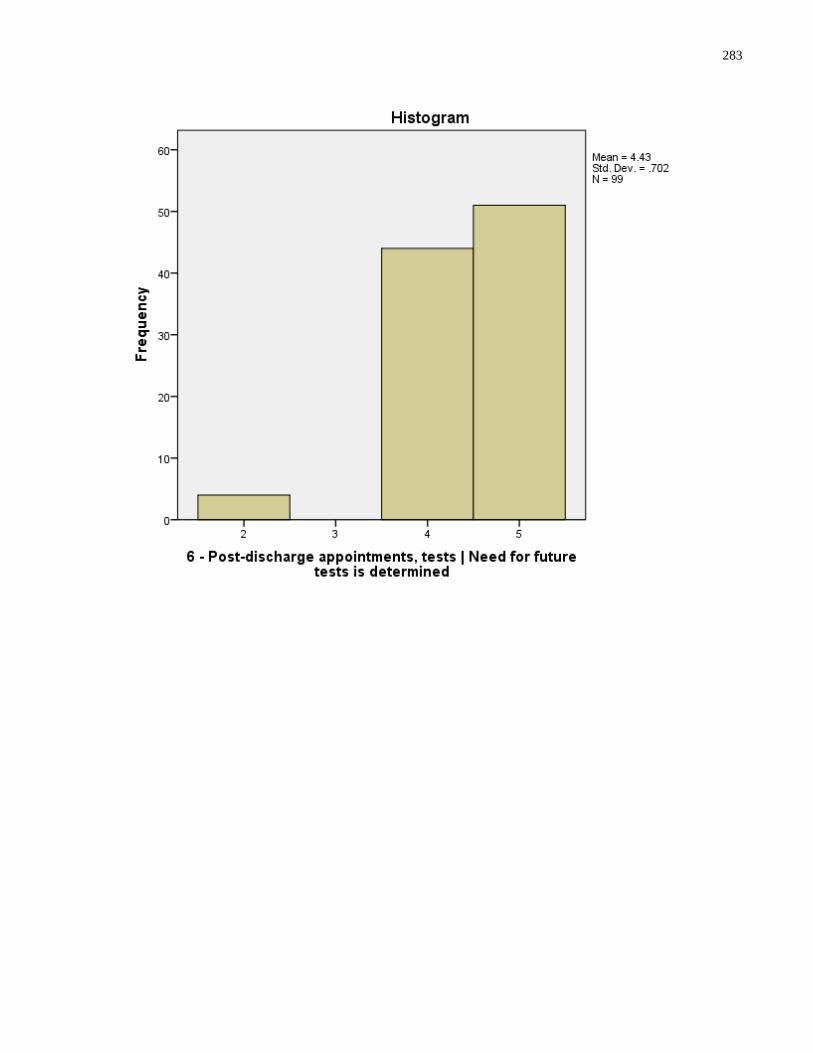
283
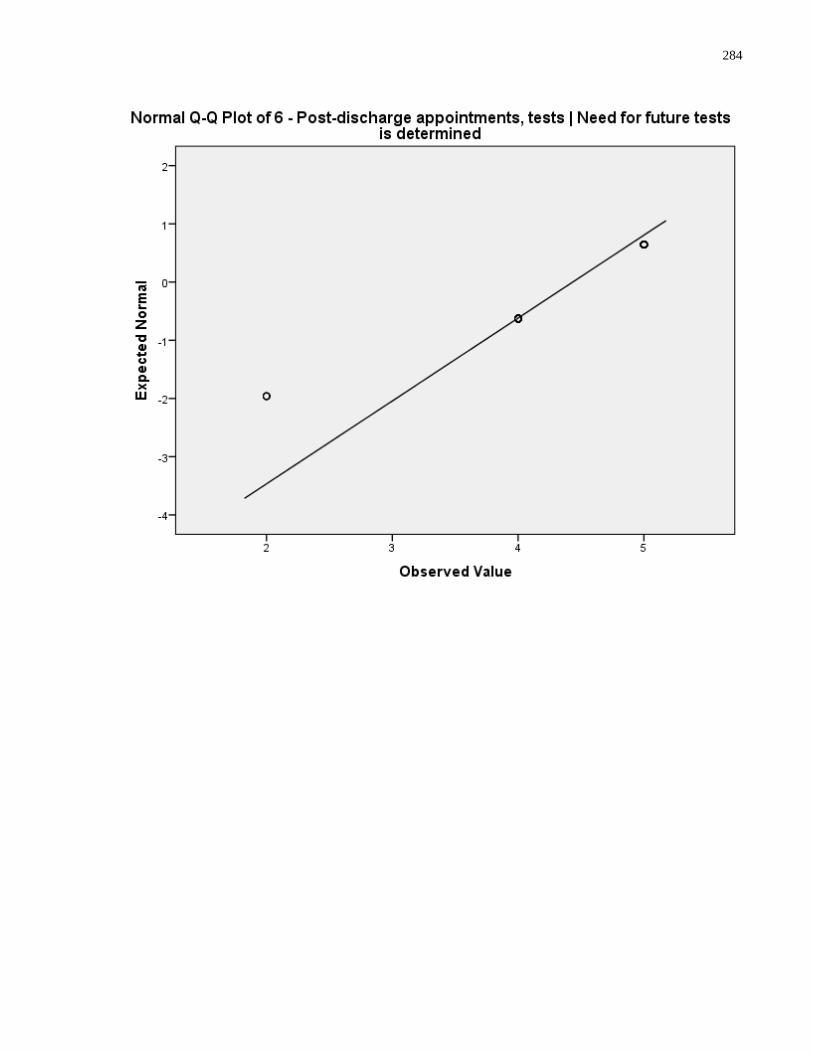
284
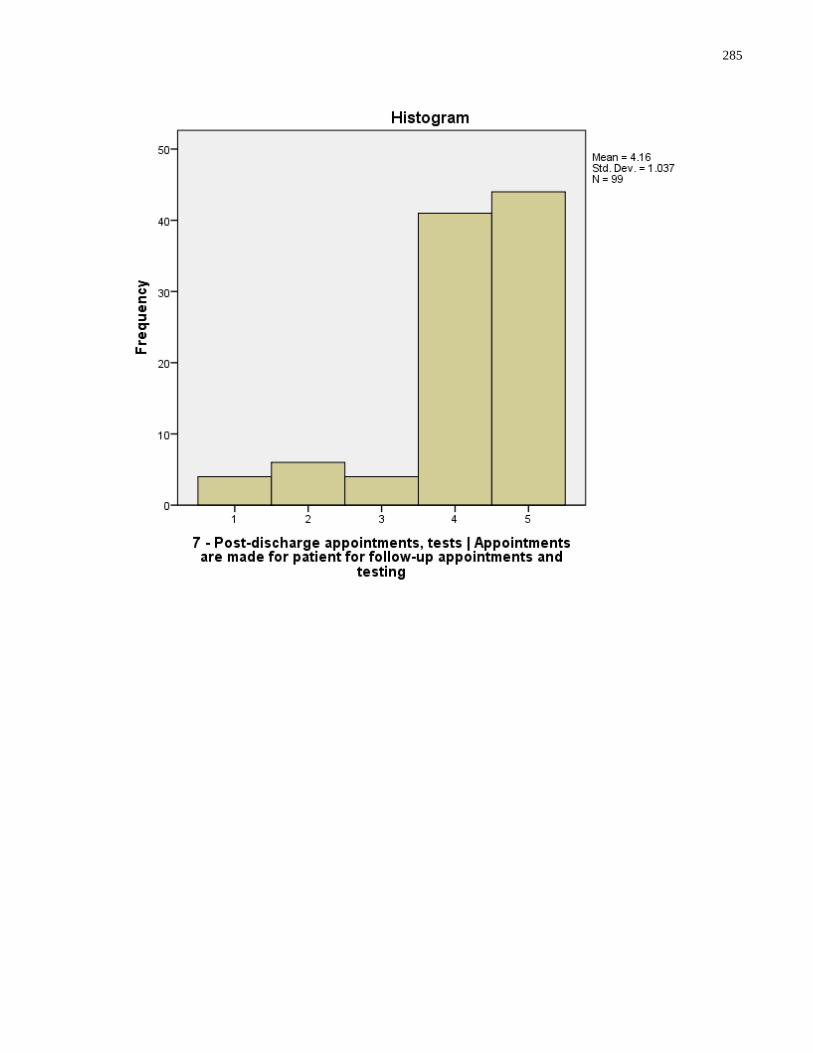
285
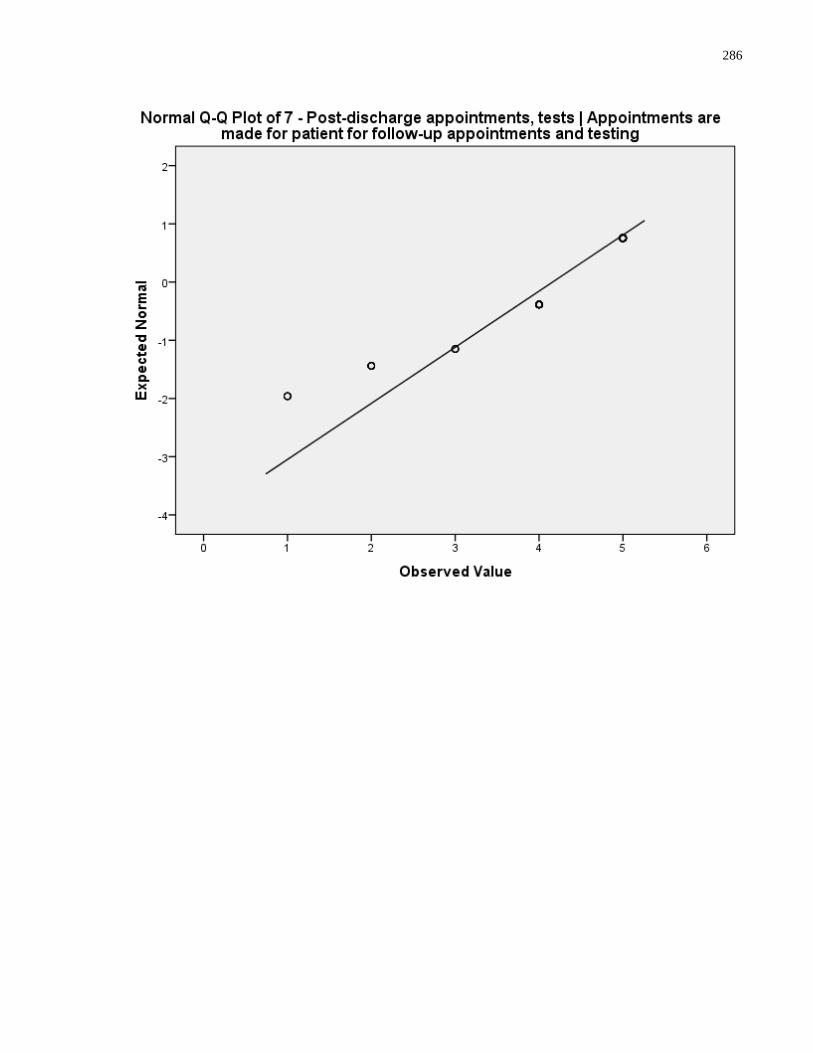
286
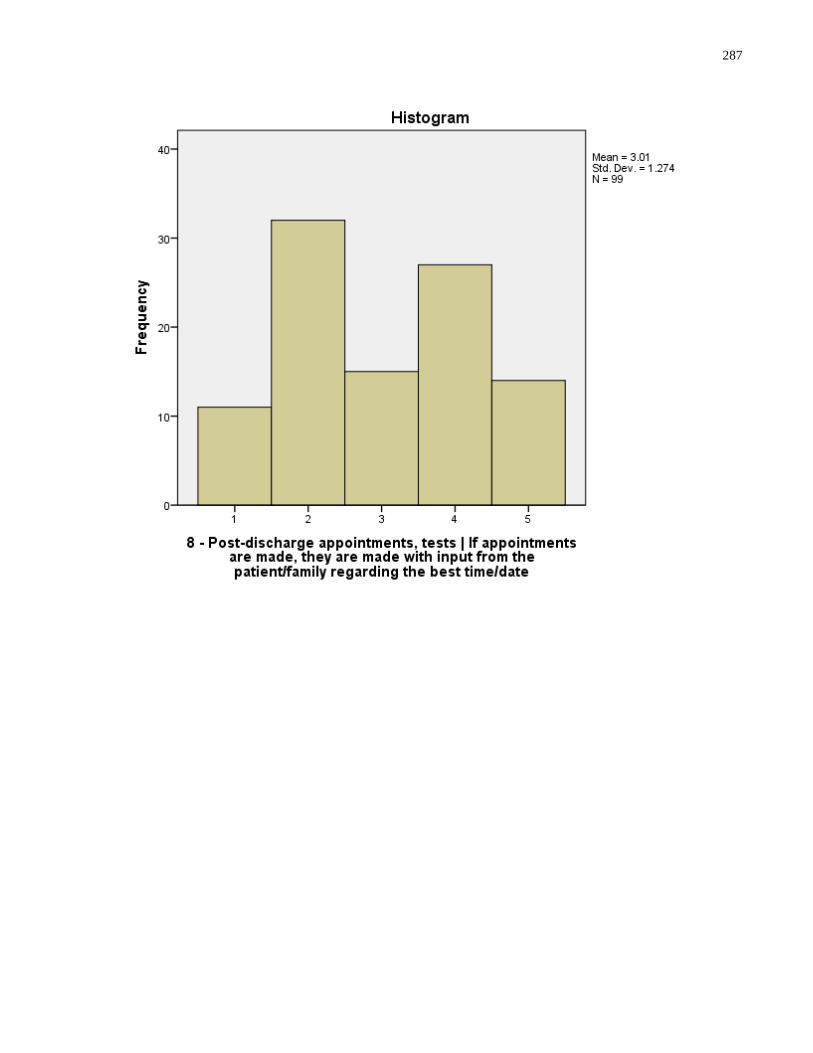
287
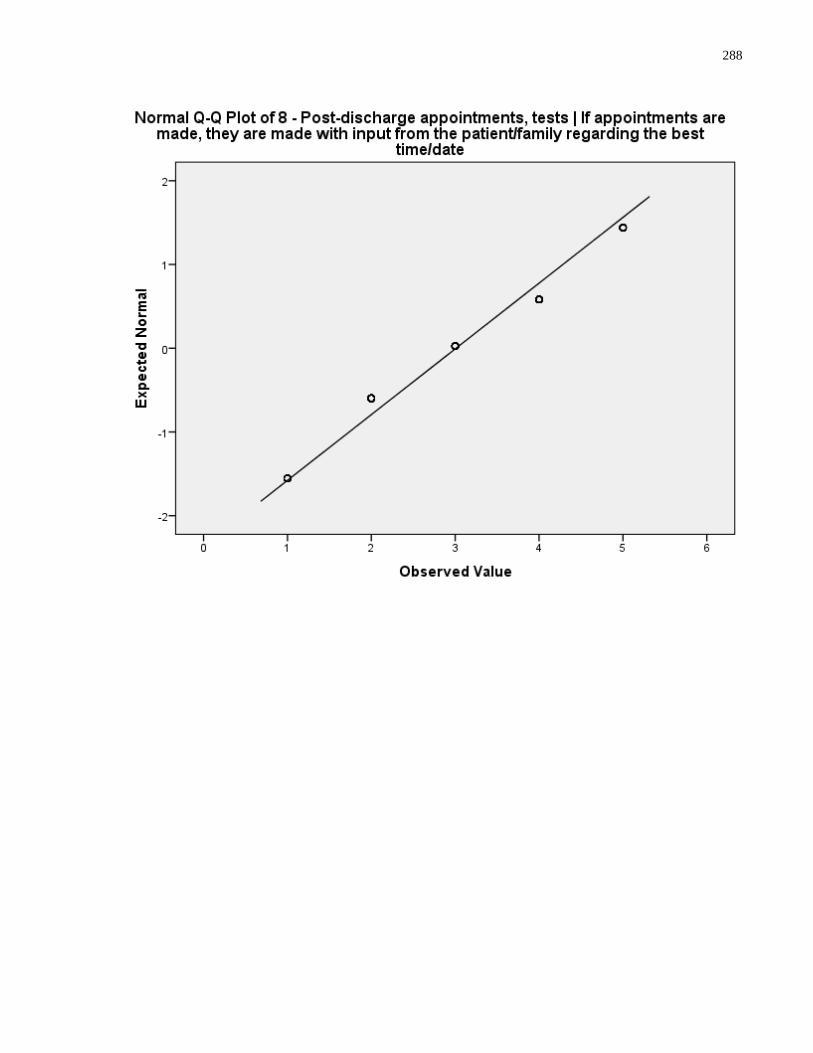
288
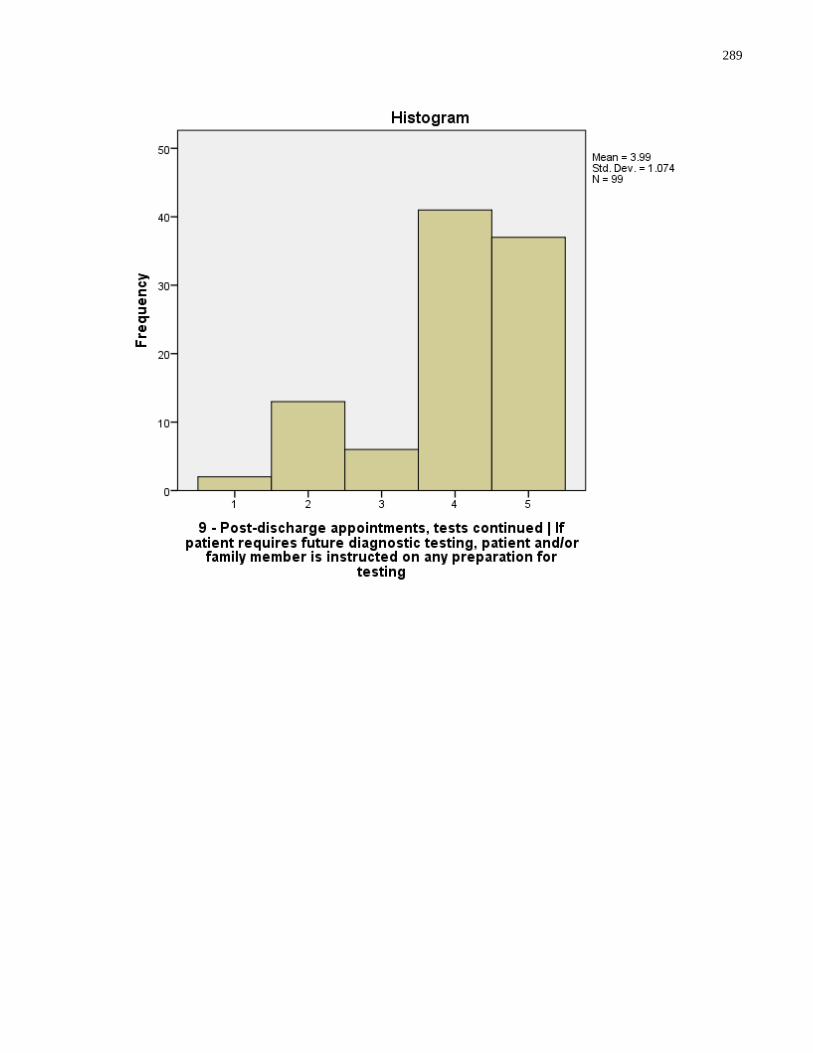
289
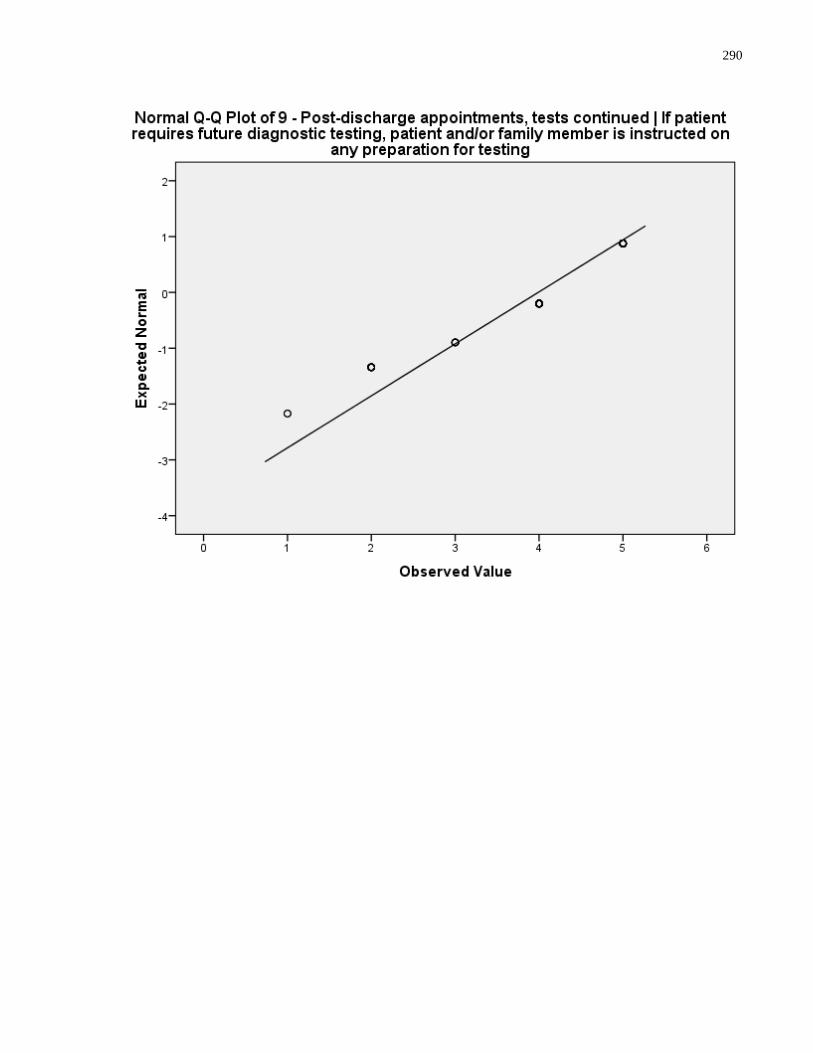
290
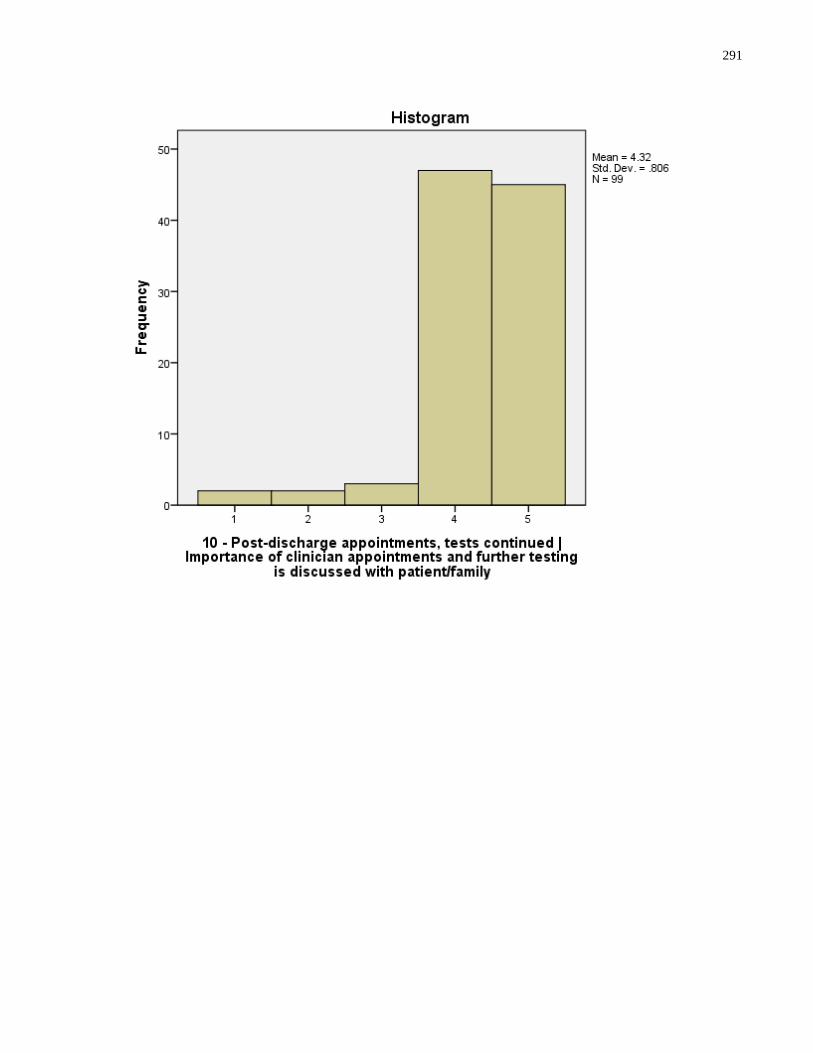
291
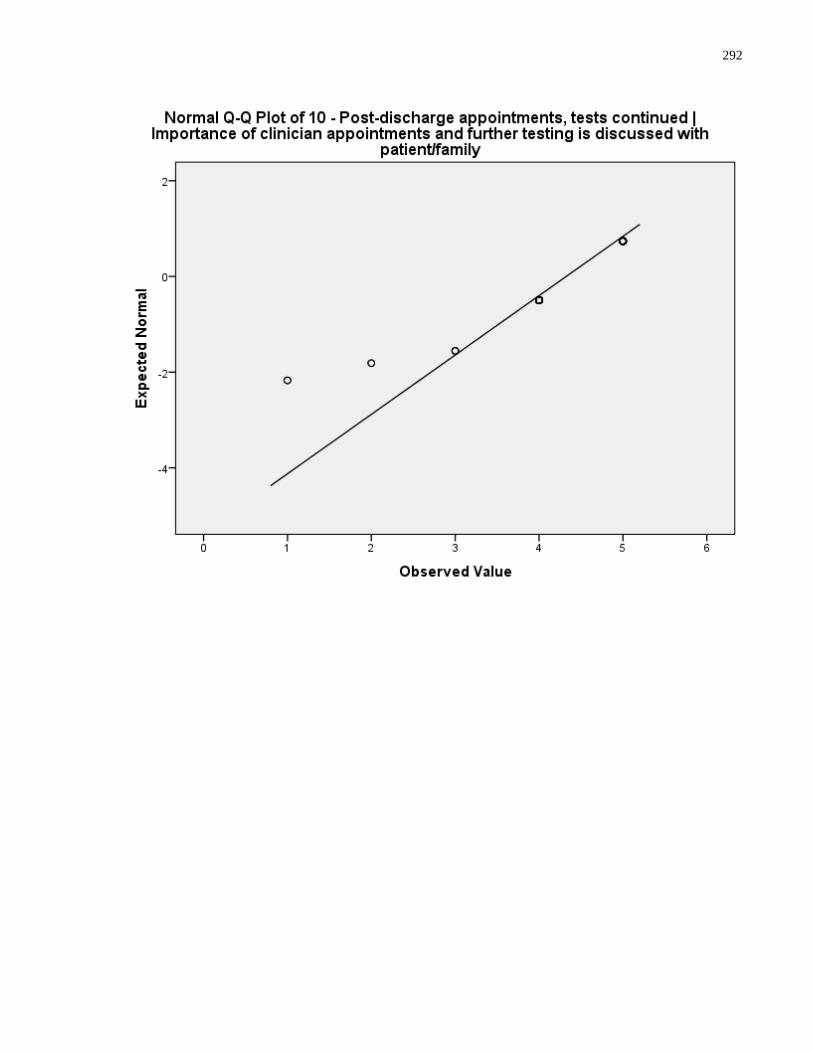
292
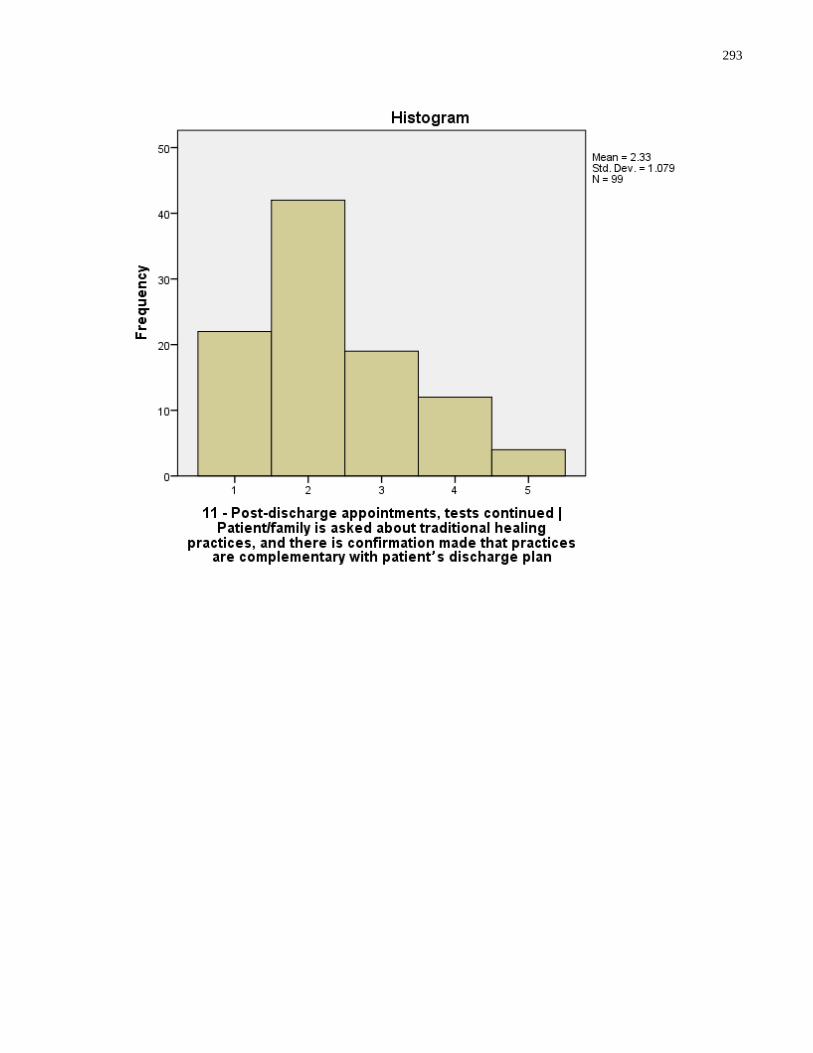
293

294
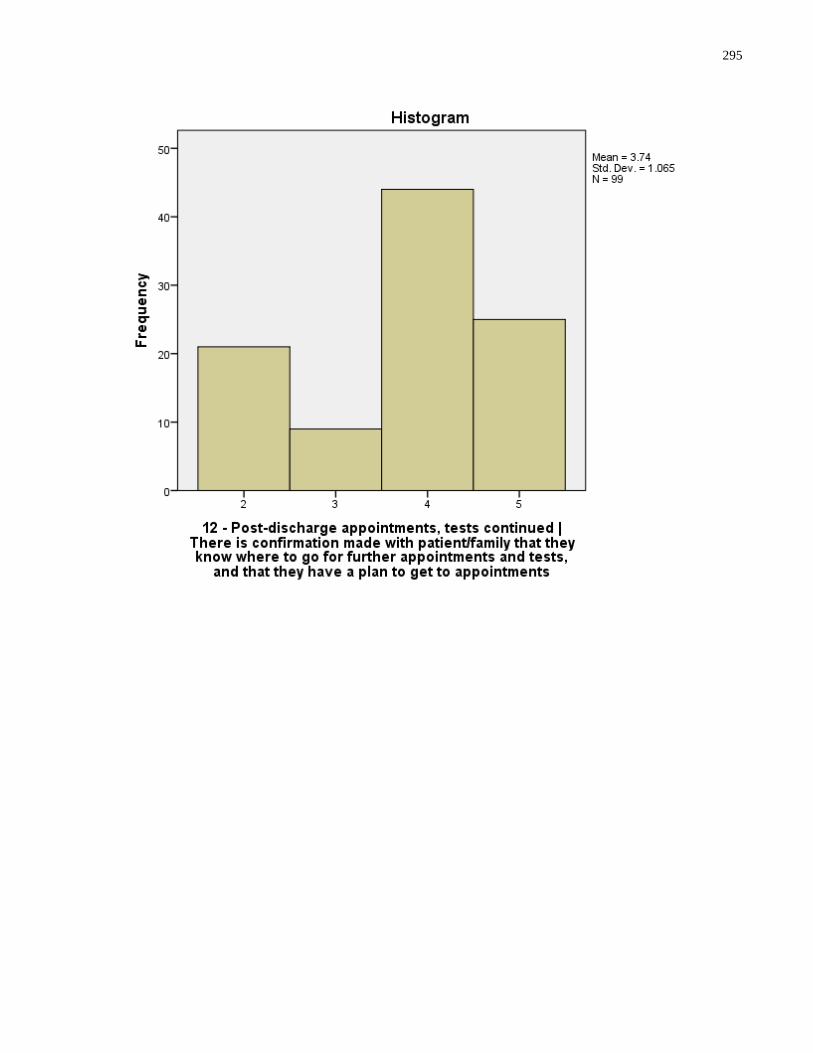
295
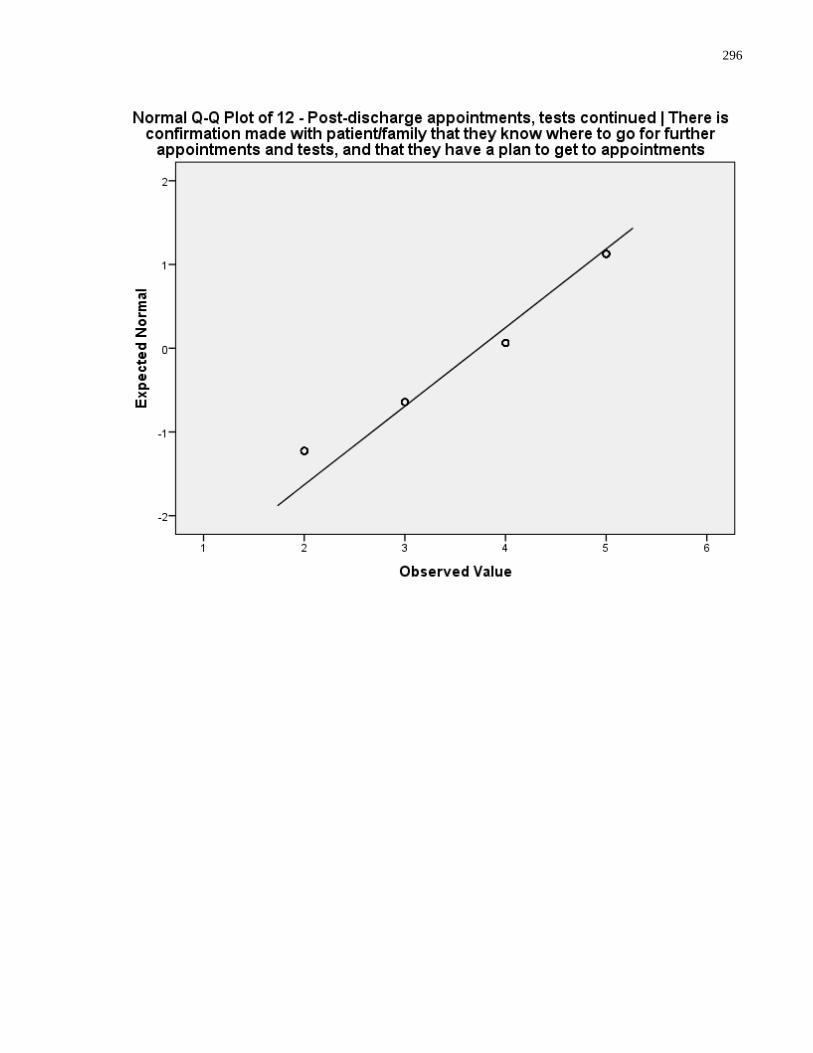
296
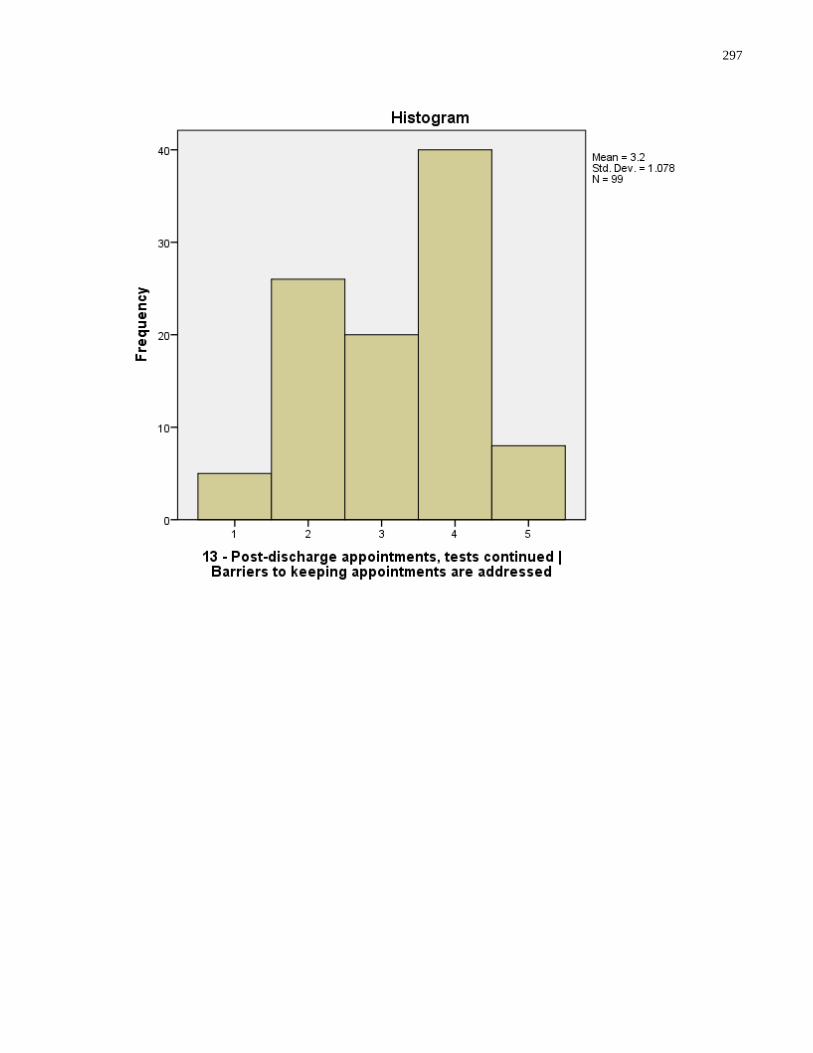
297
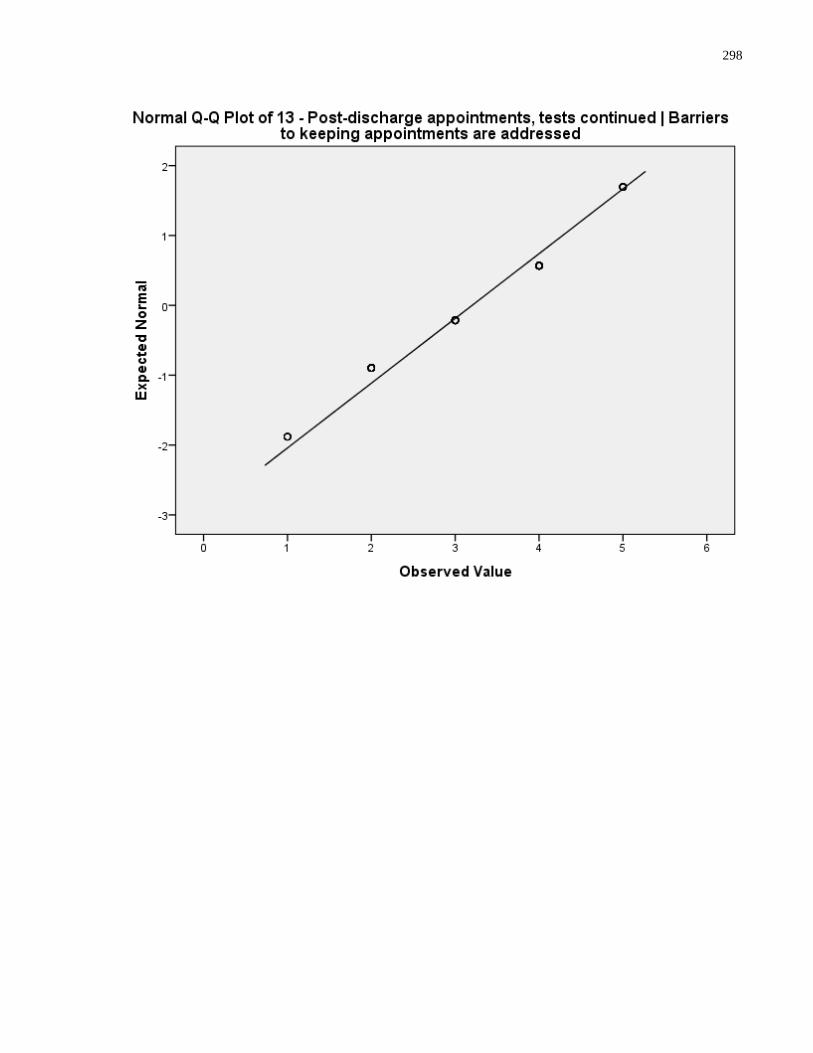
298
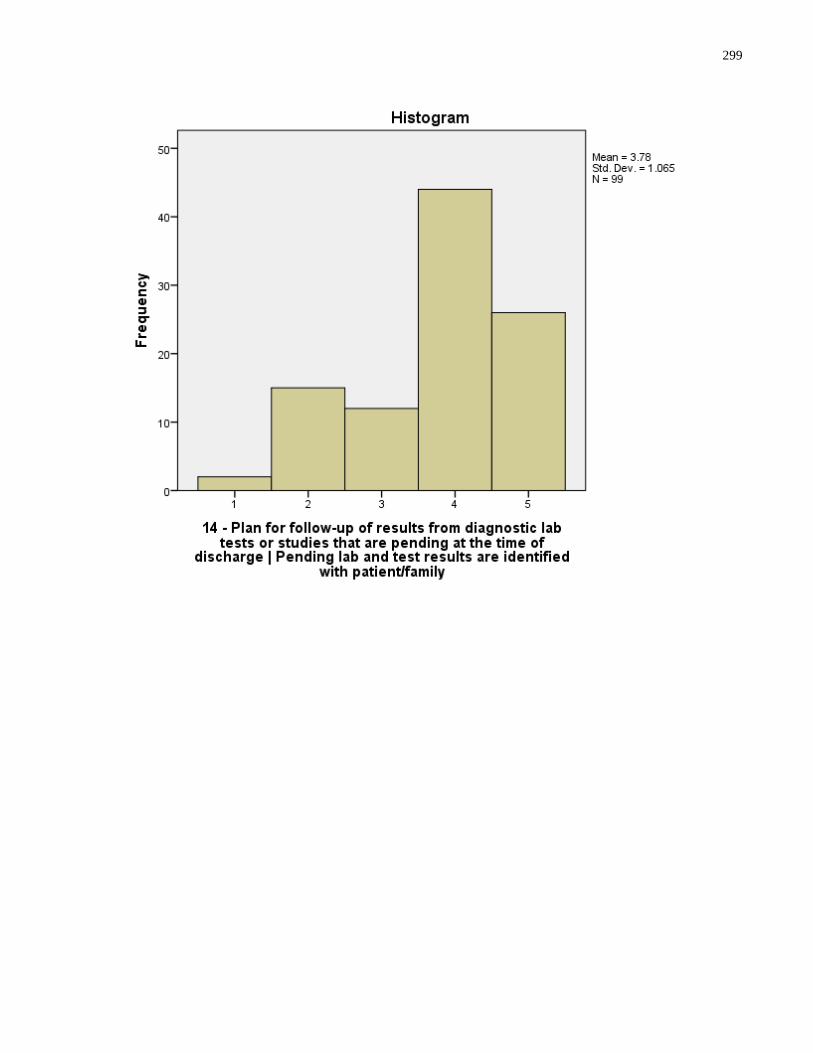
299

300
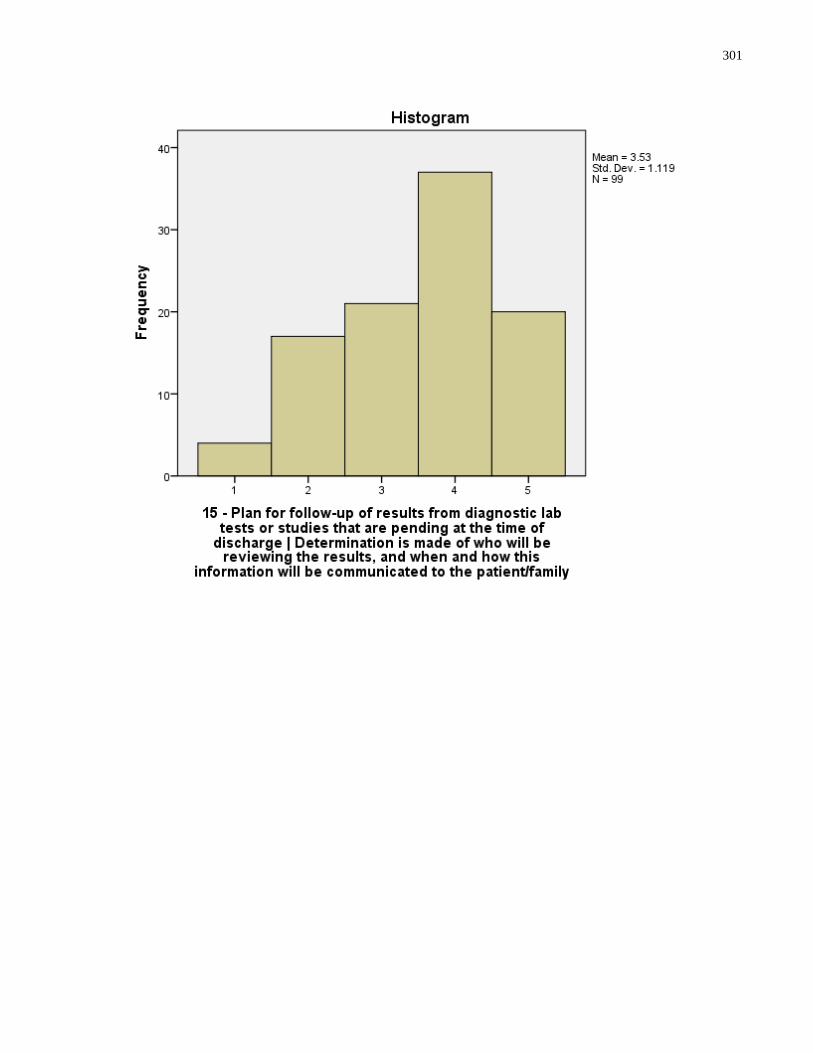
301
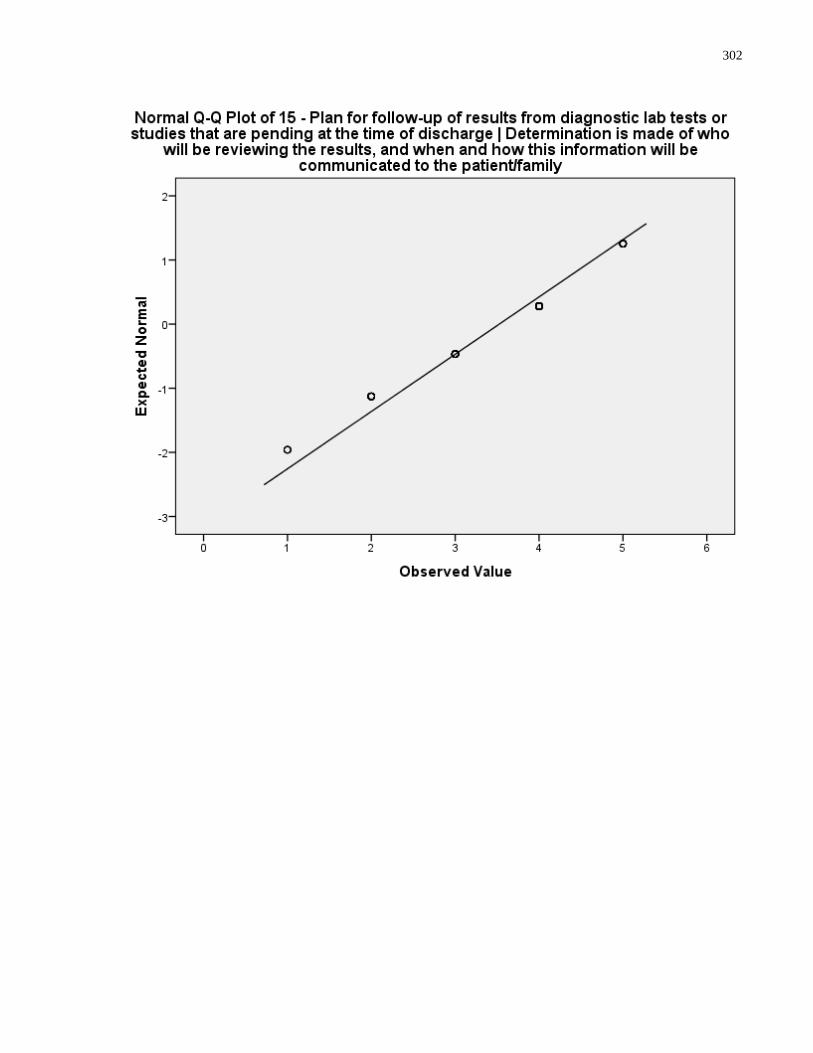
302
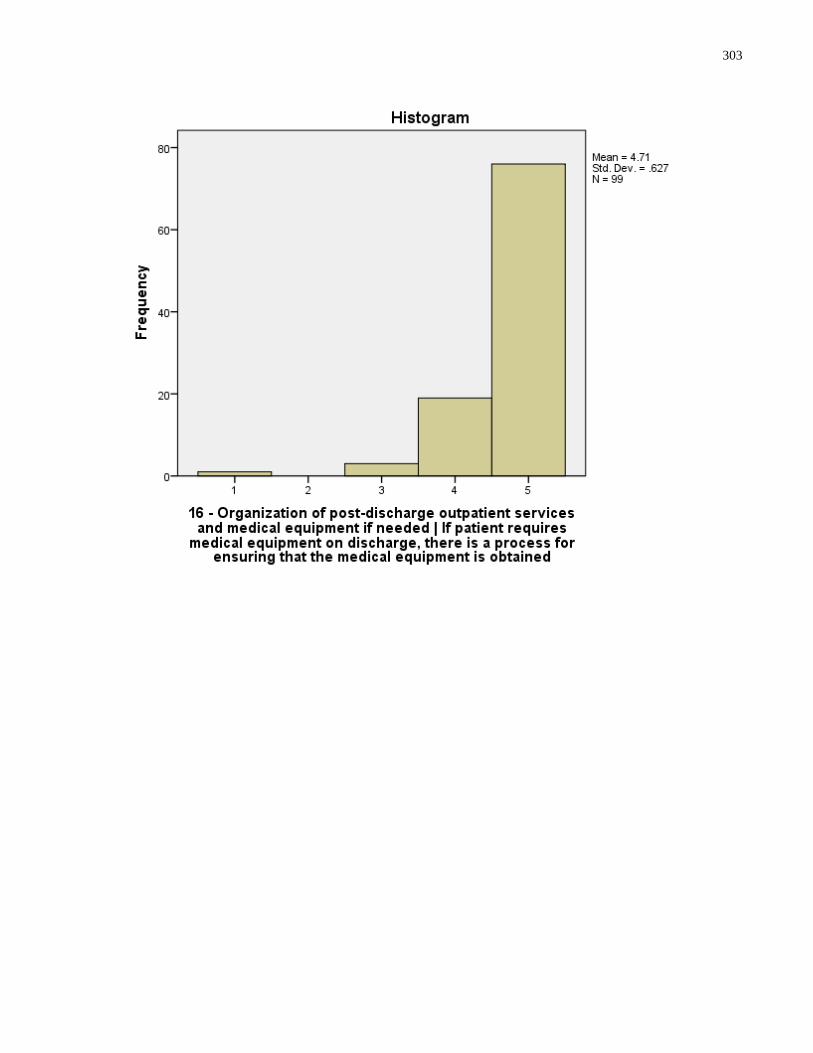
303
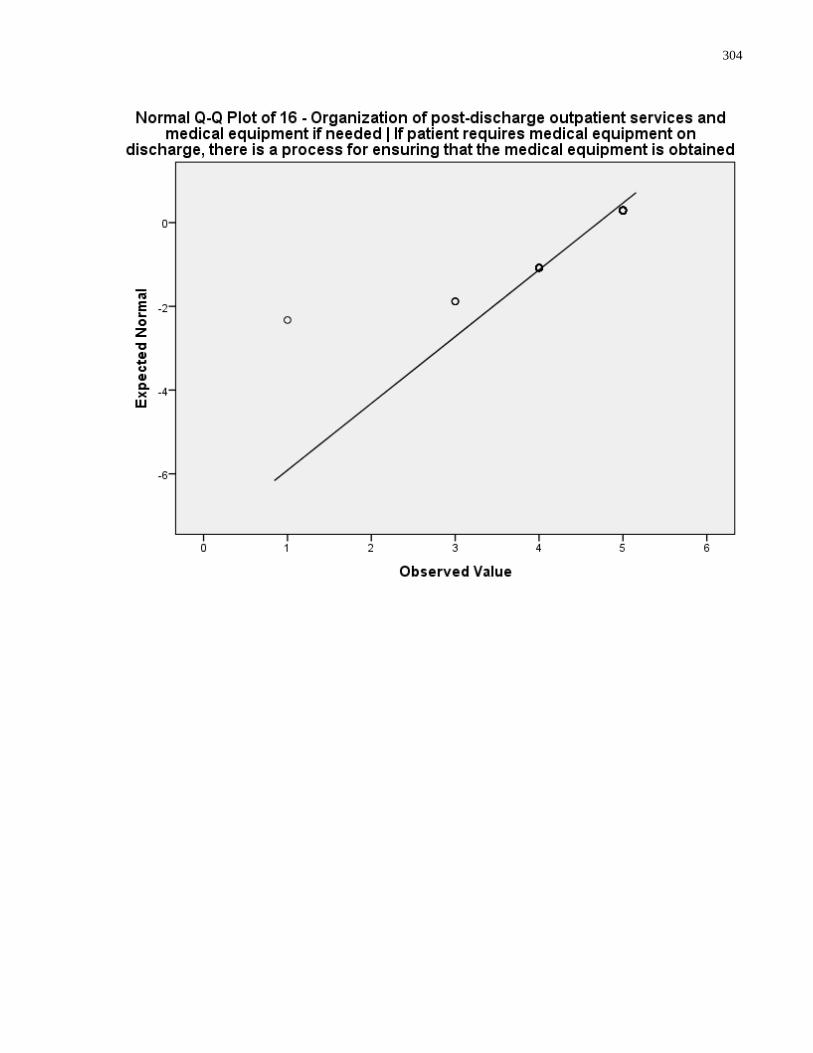
304
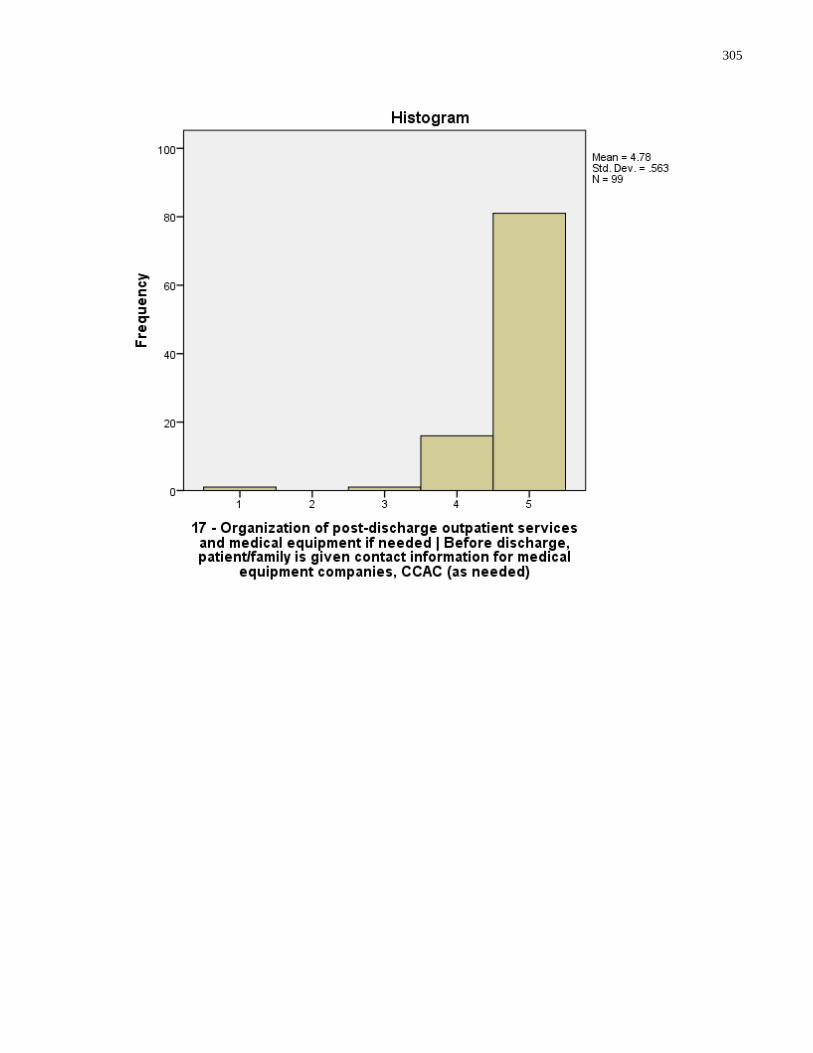
305
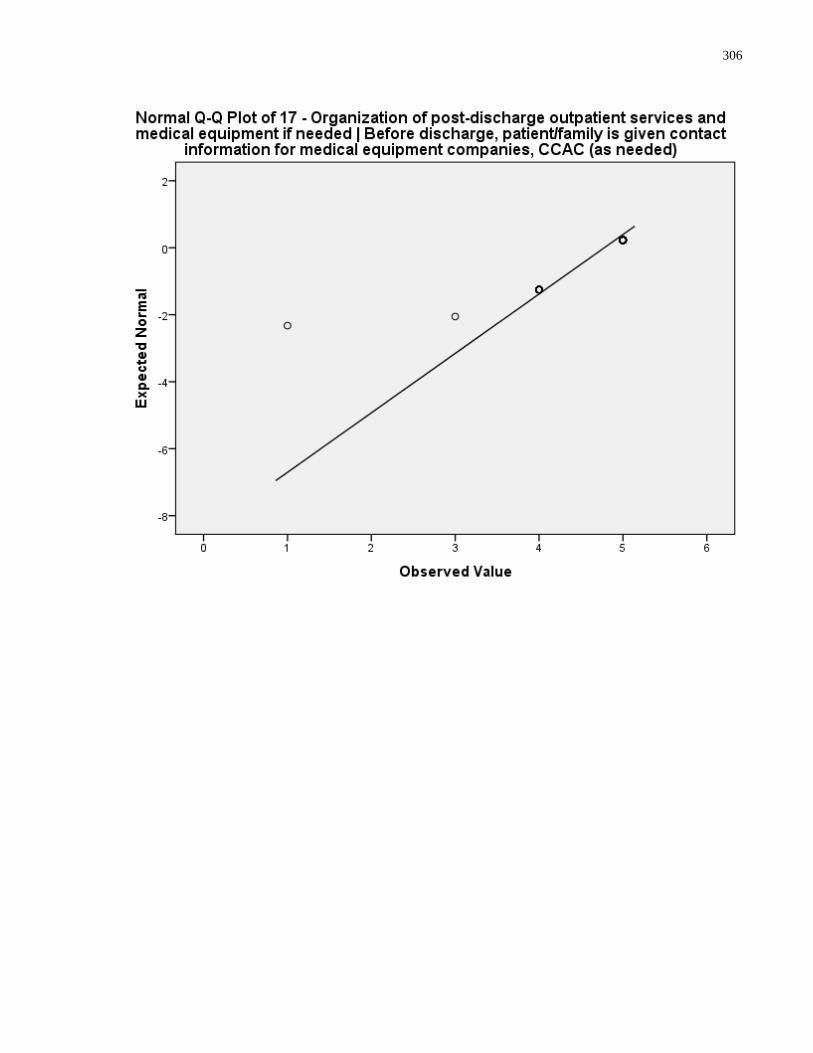
306
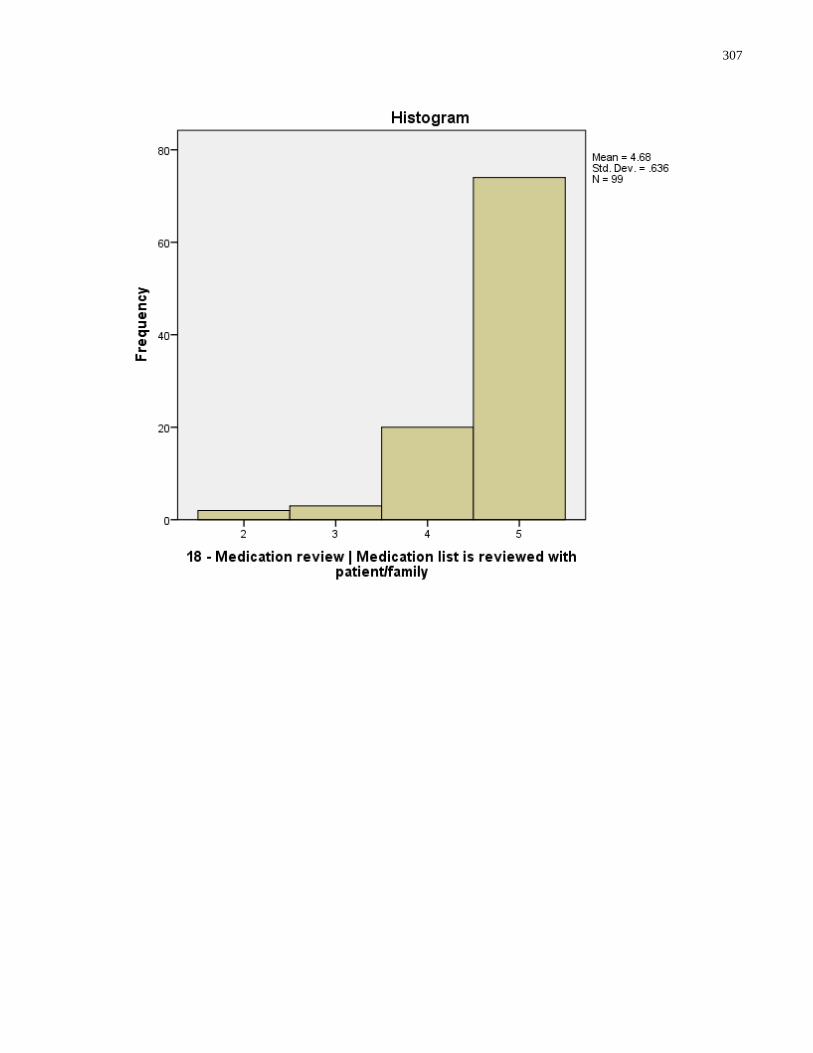
307
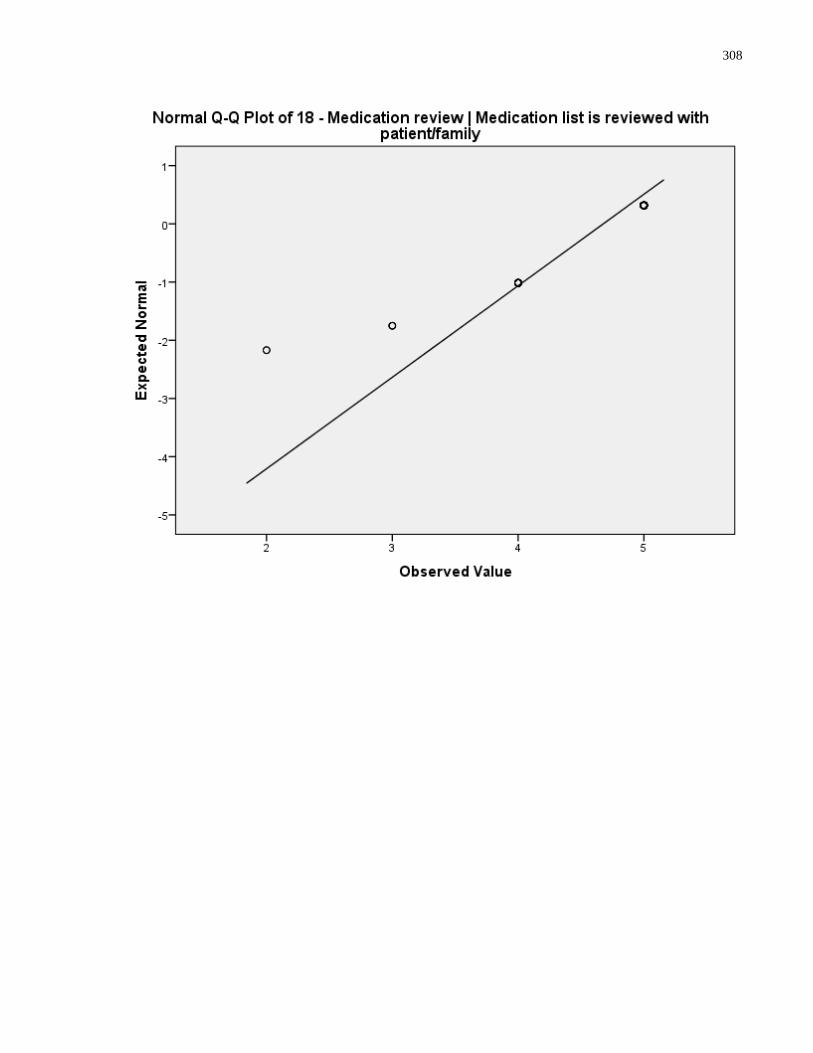
308
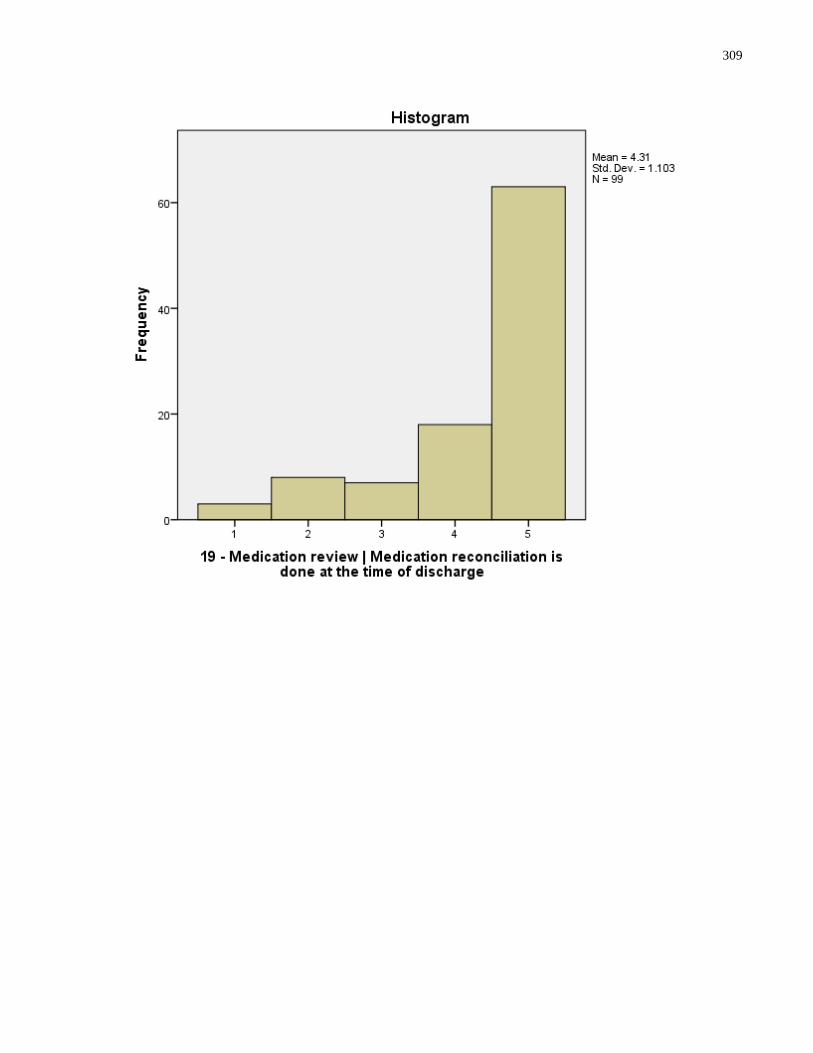
309
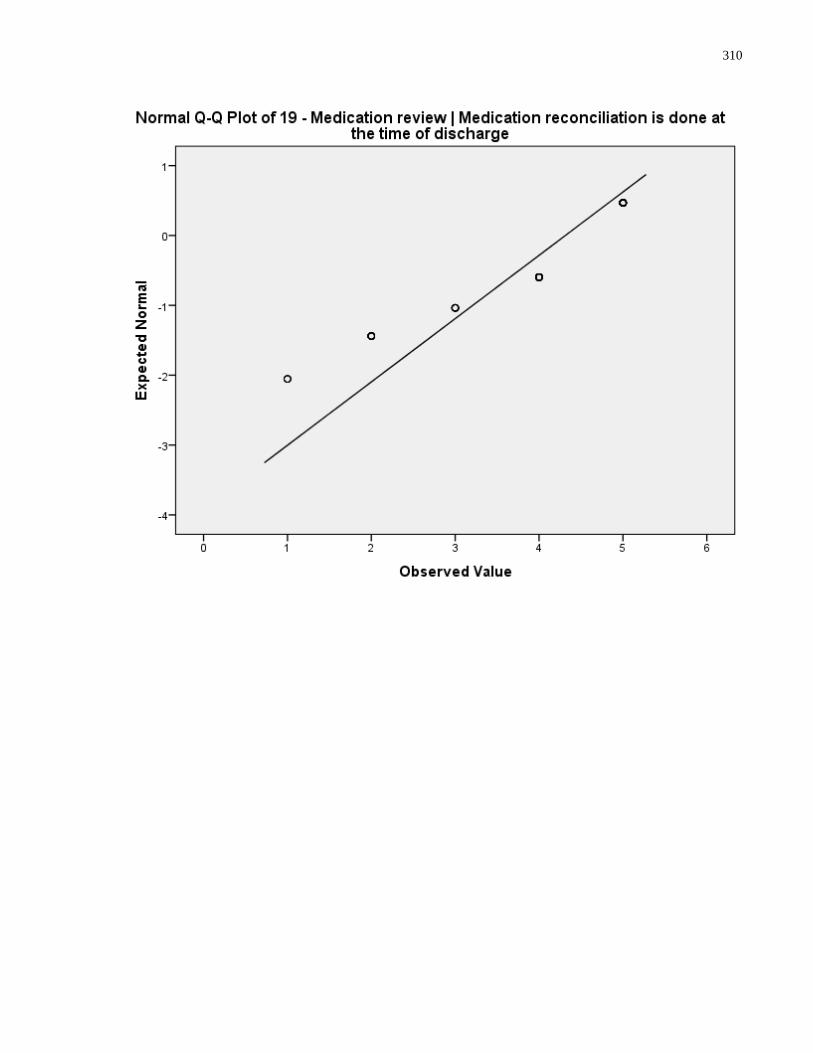
310
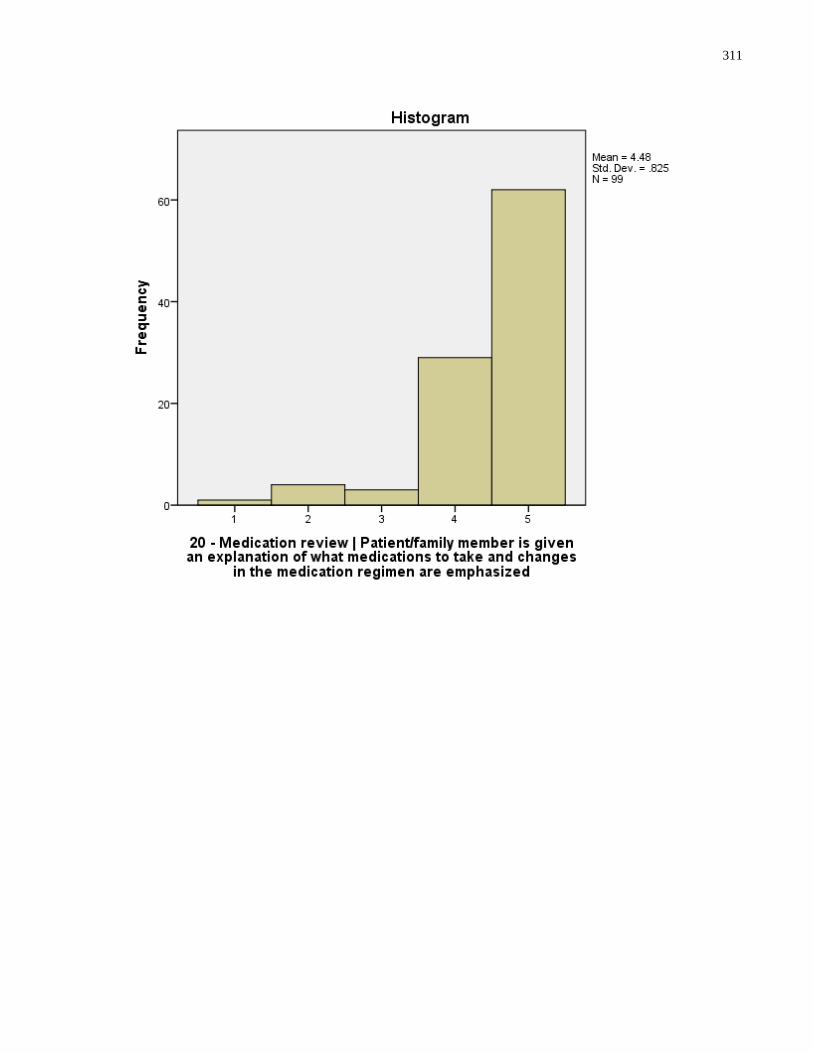
311

312
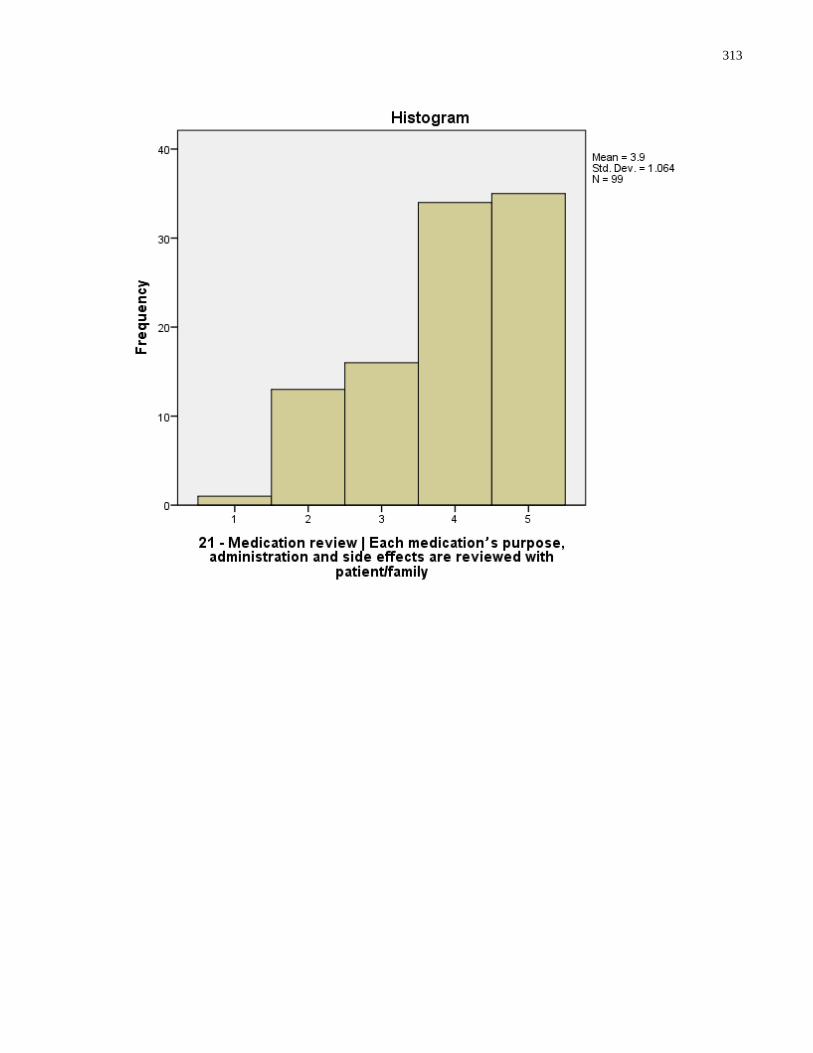
313
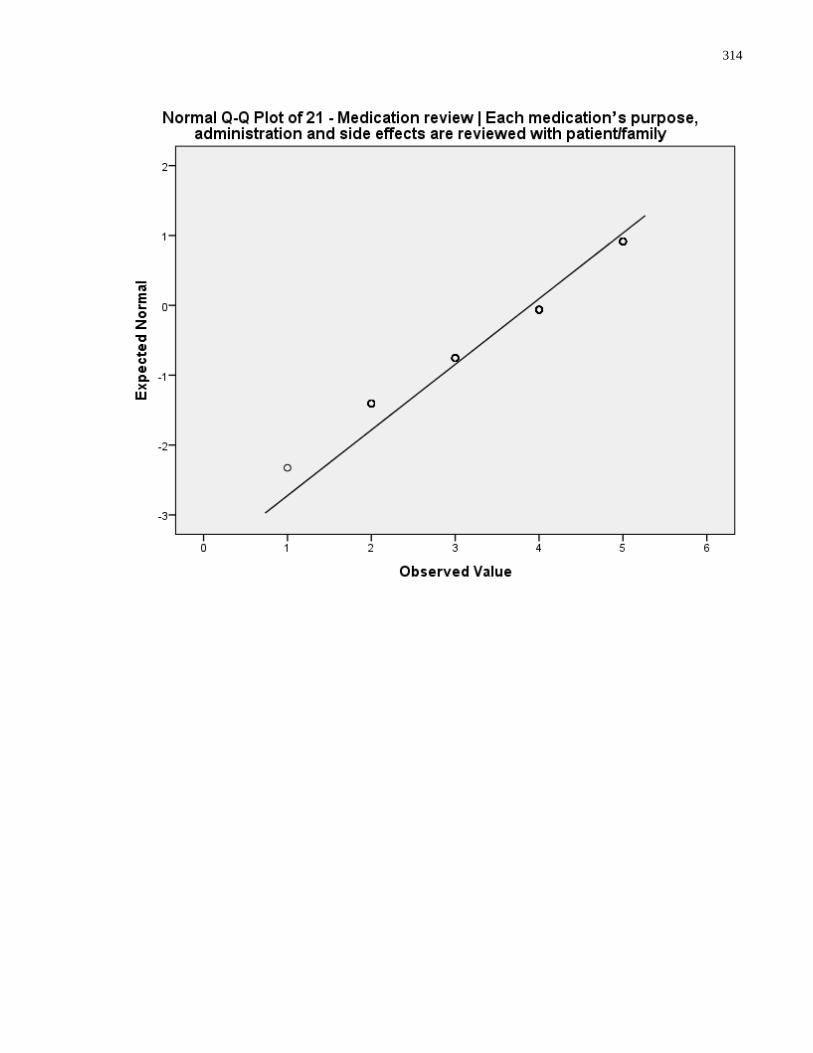
314
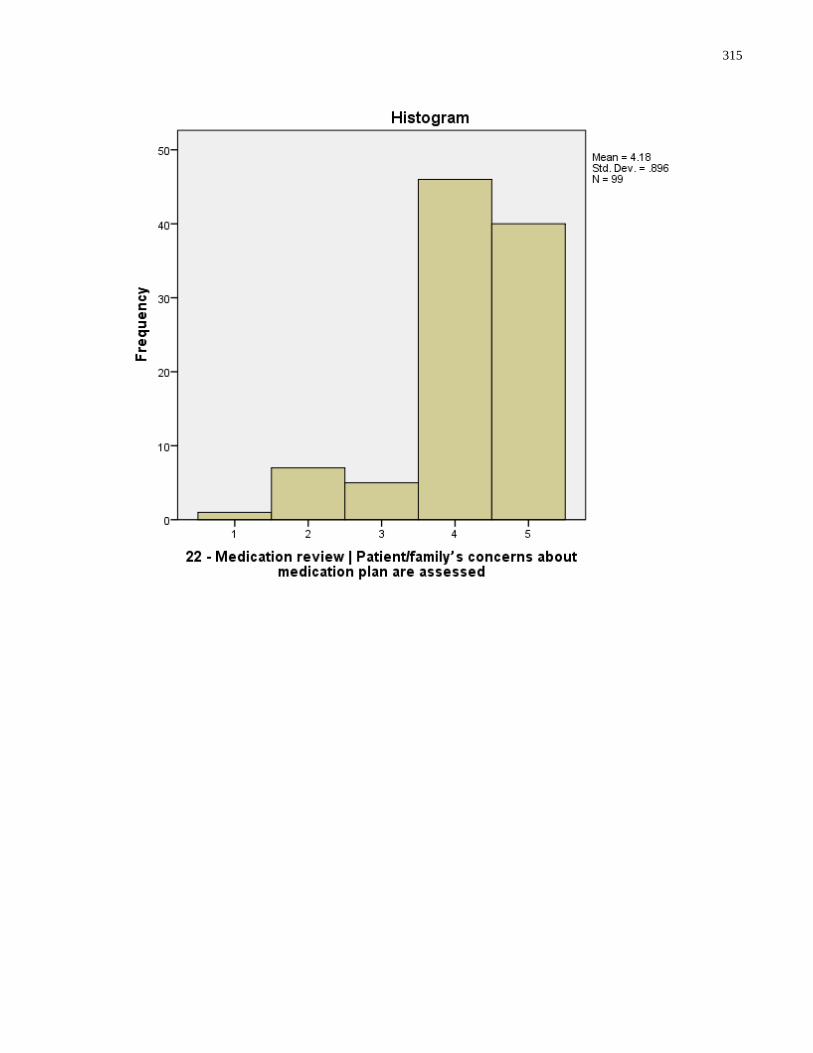
315
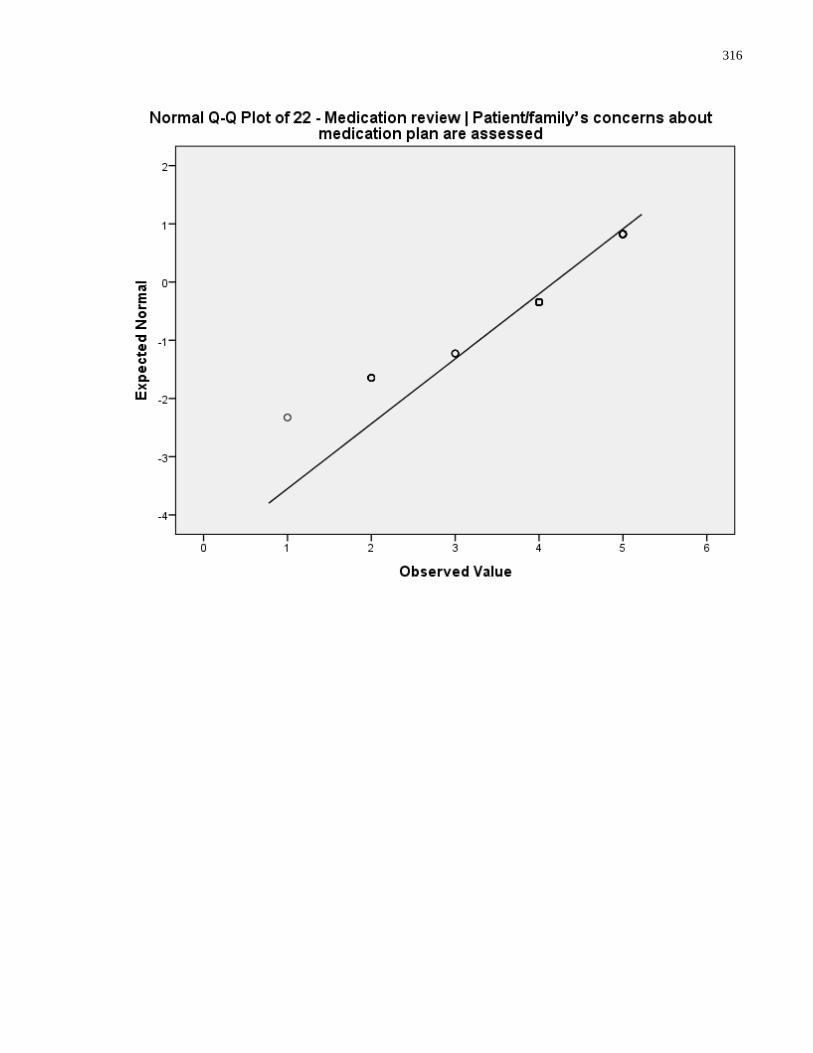
316
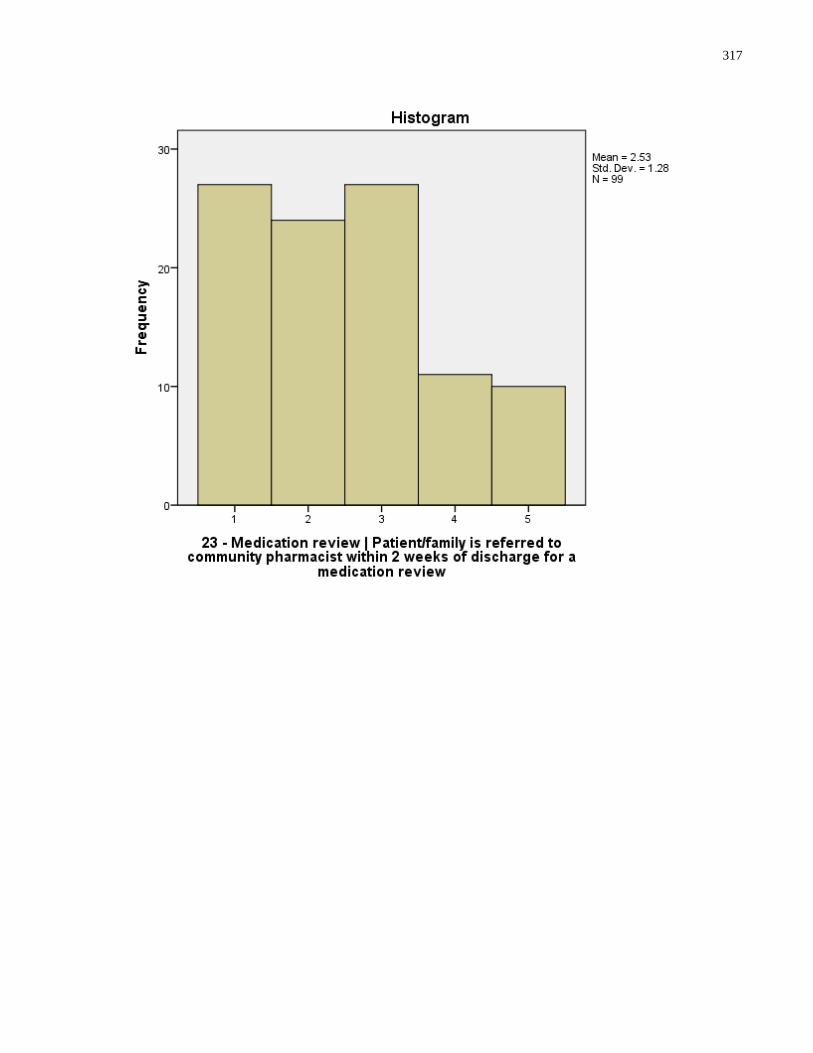
317
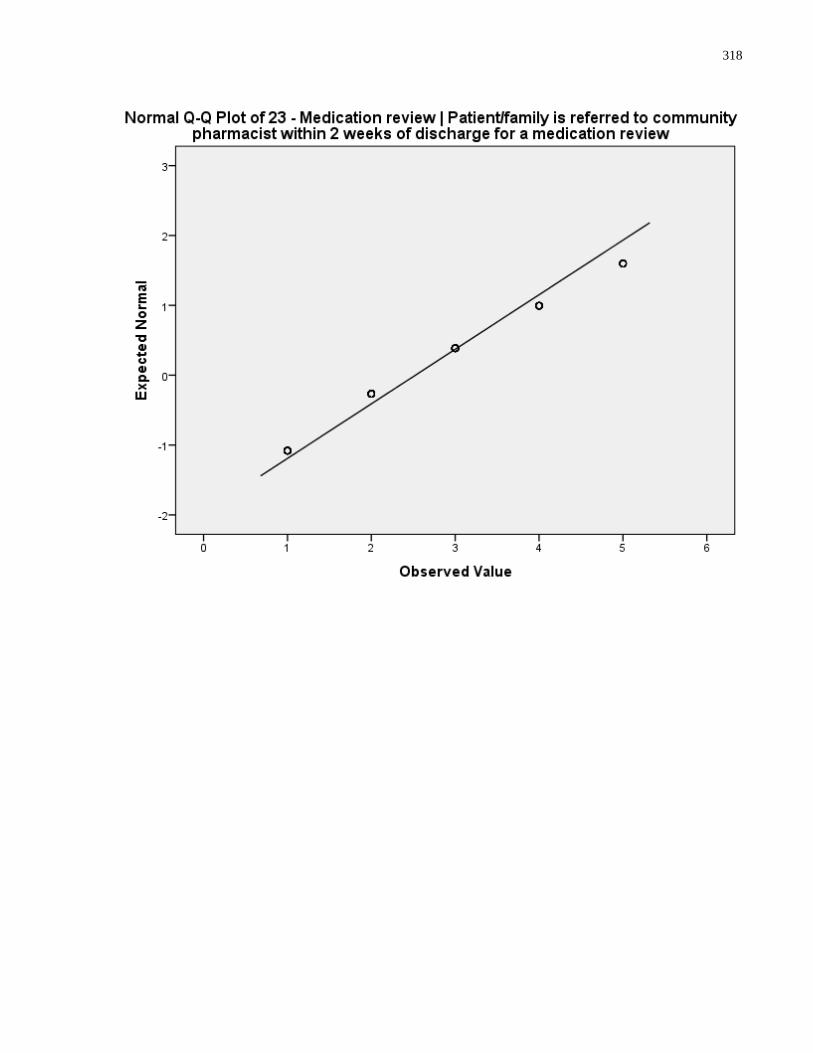
318
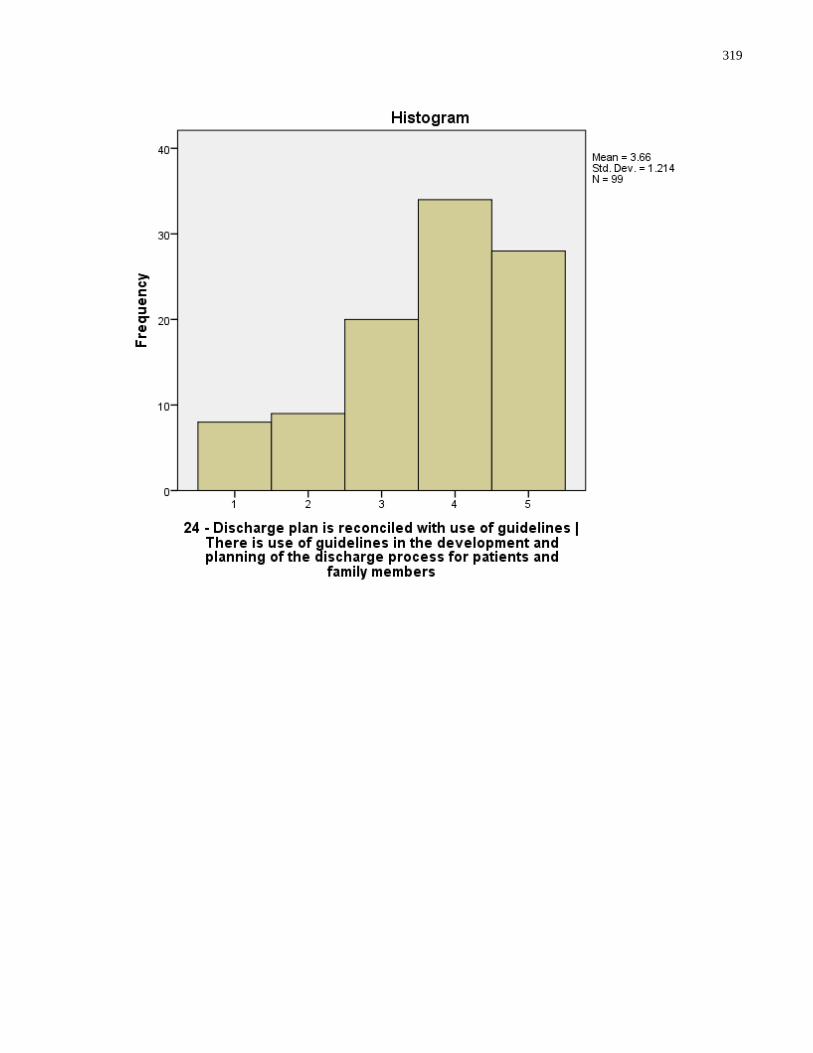
319

320
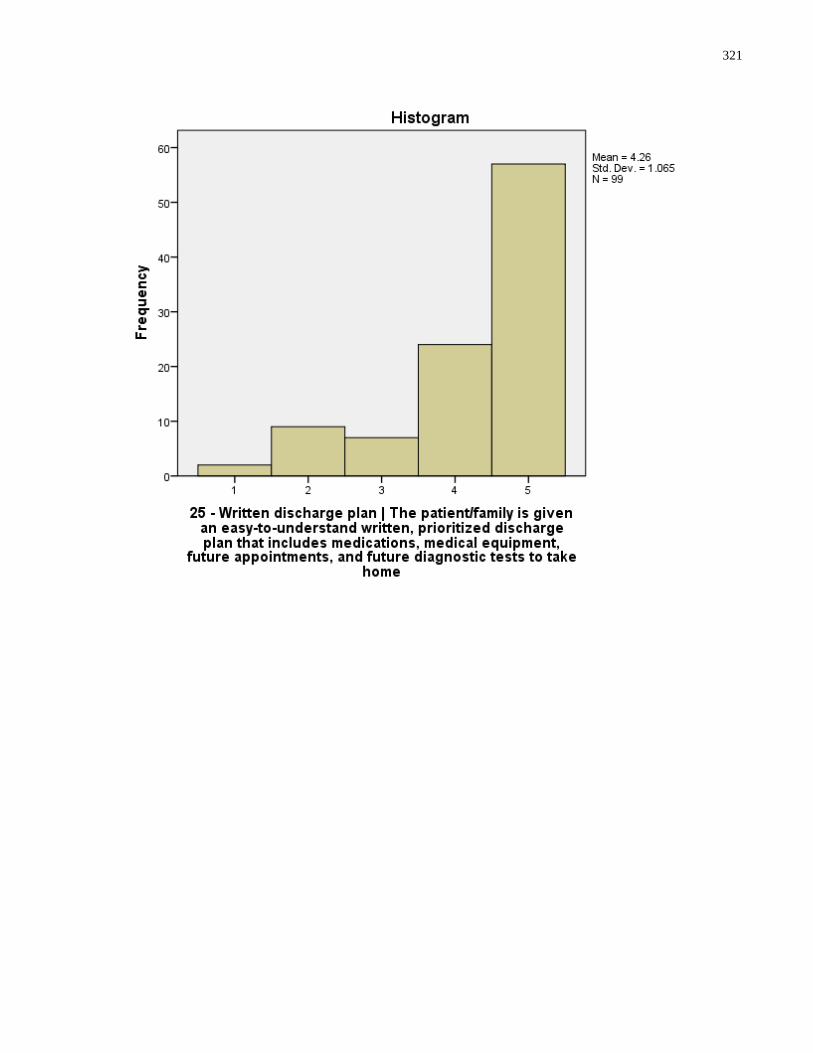
321
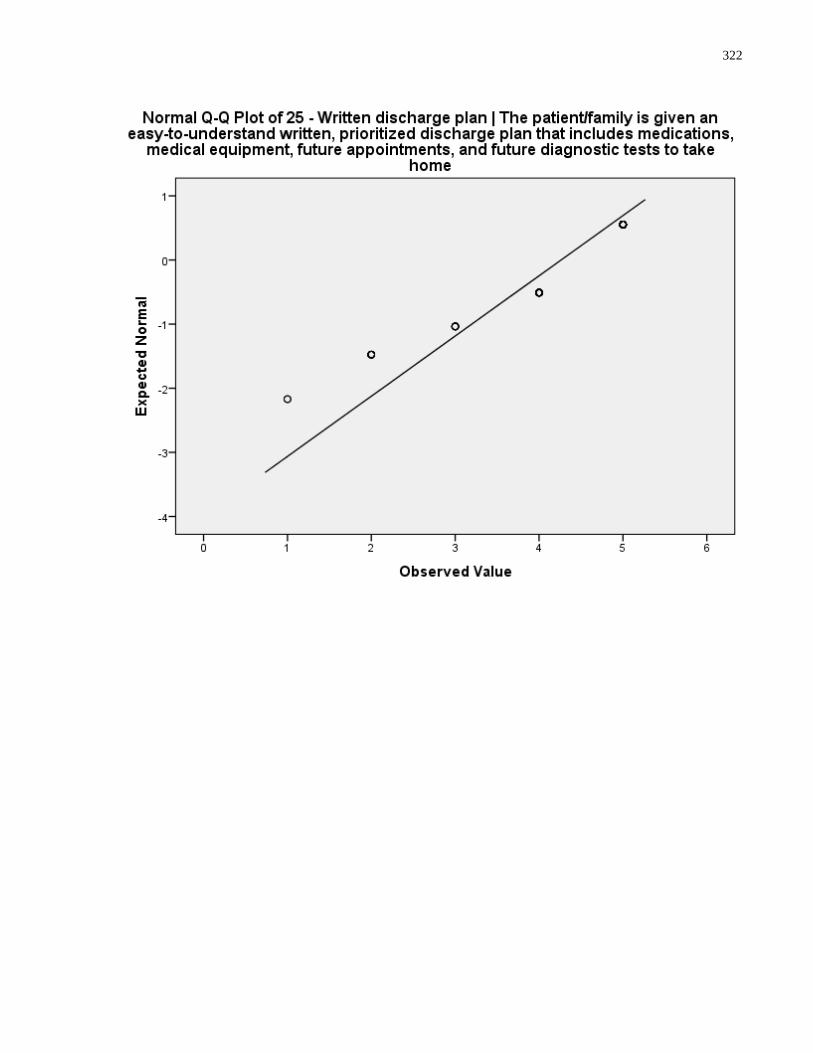
322
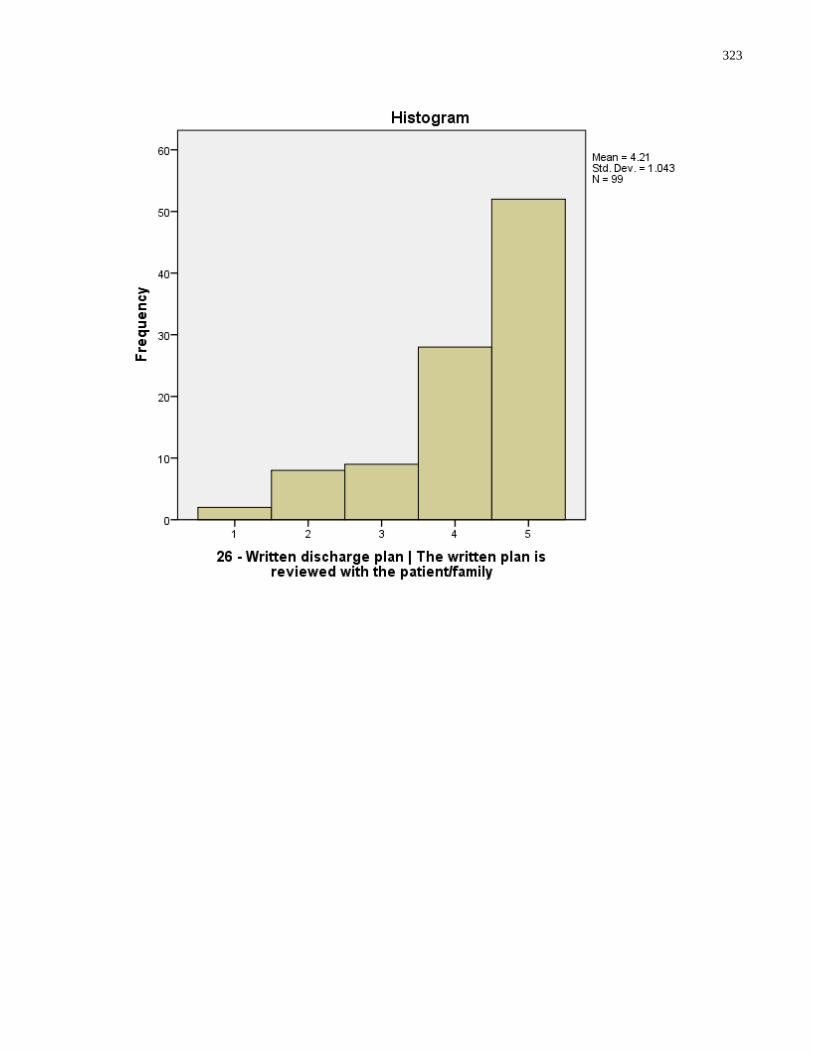
323
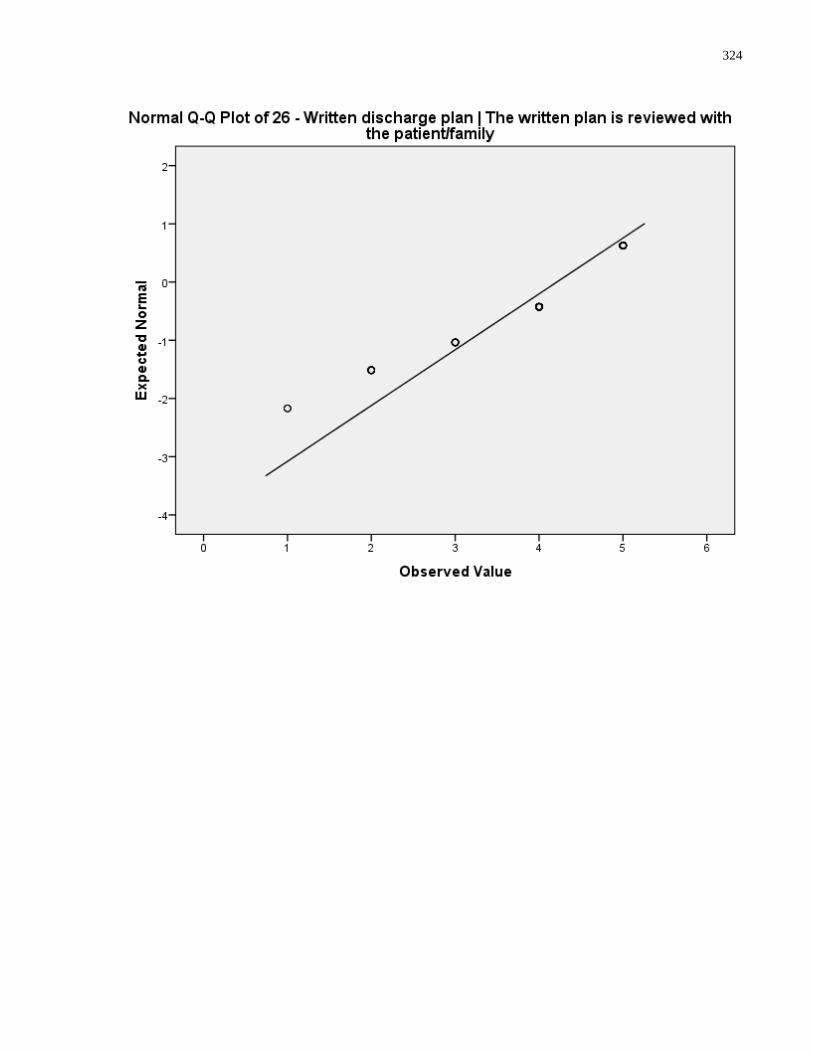
324
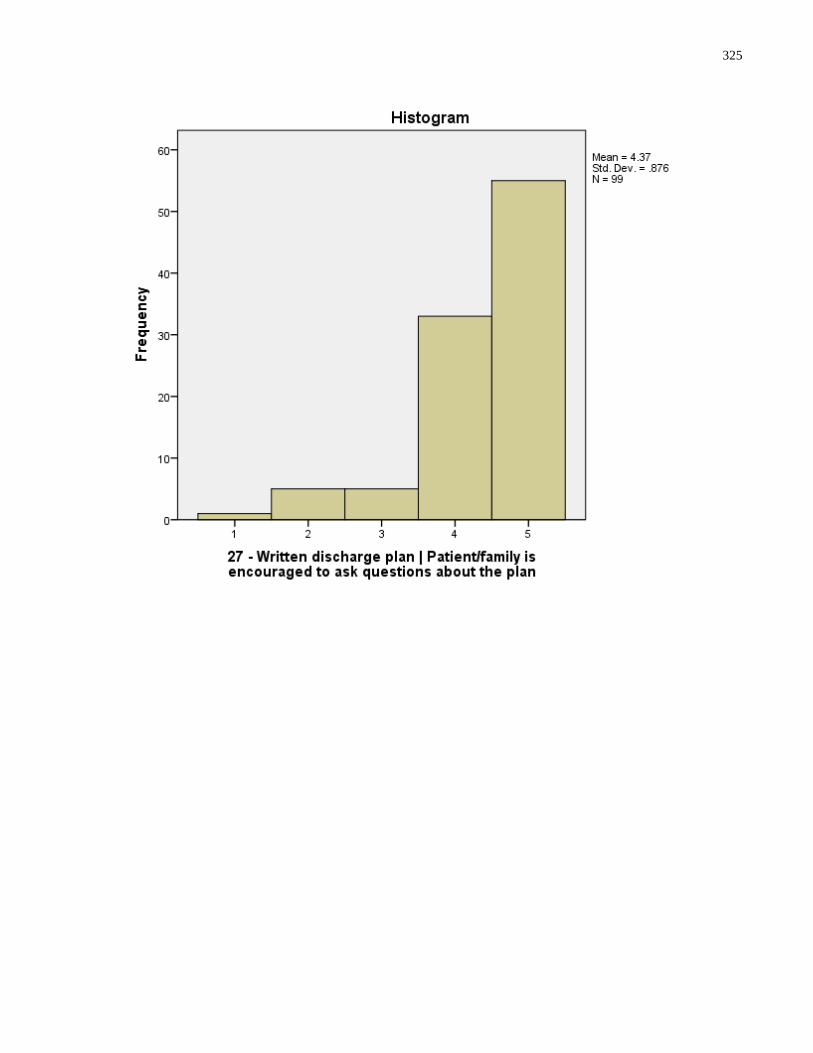
325

326
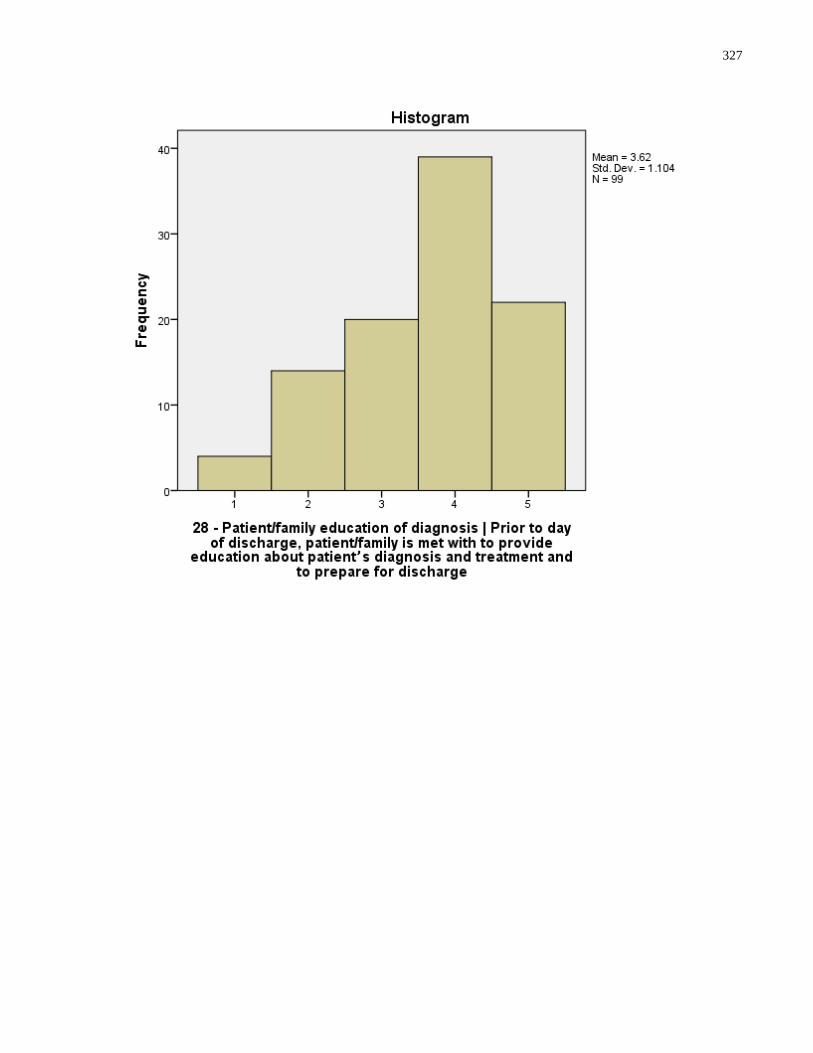
327
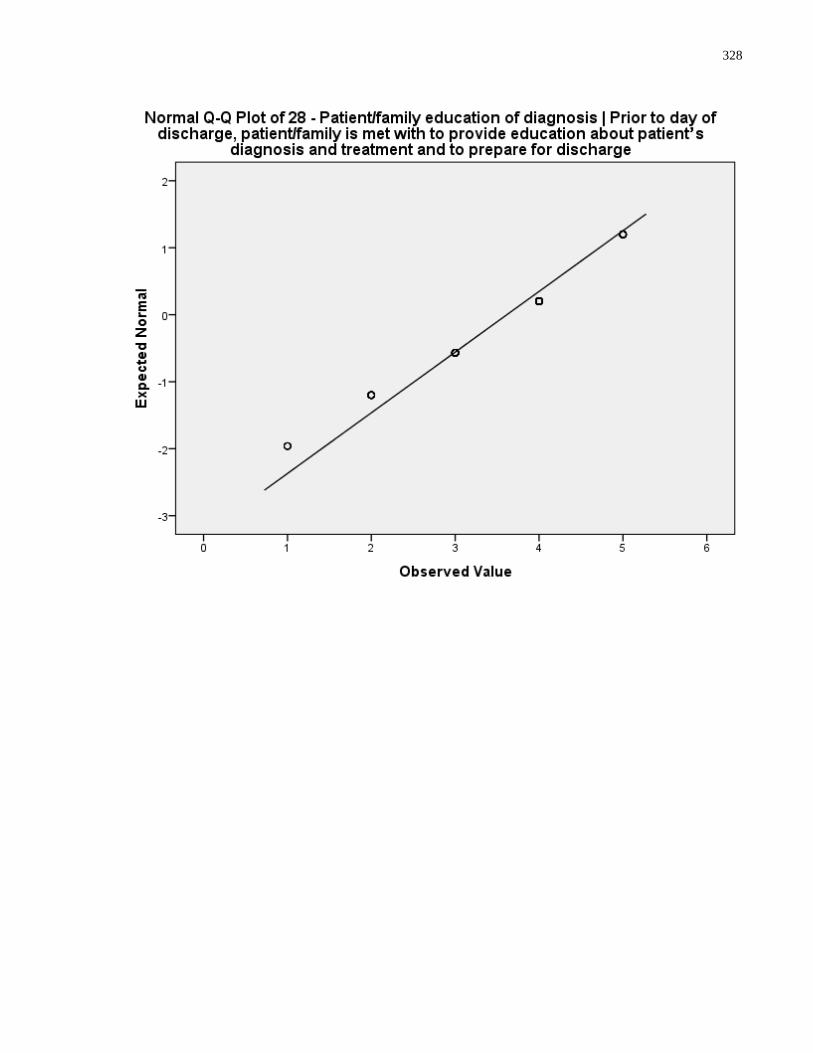
328
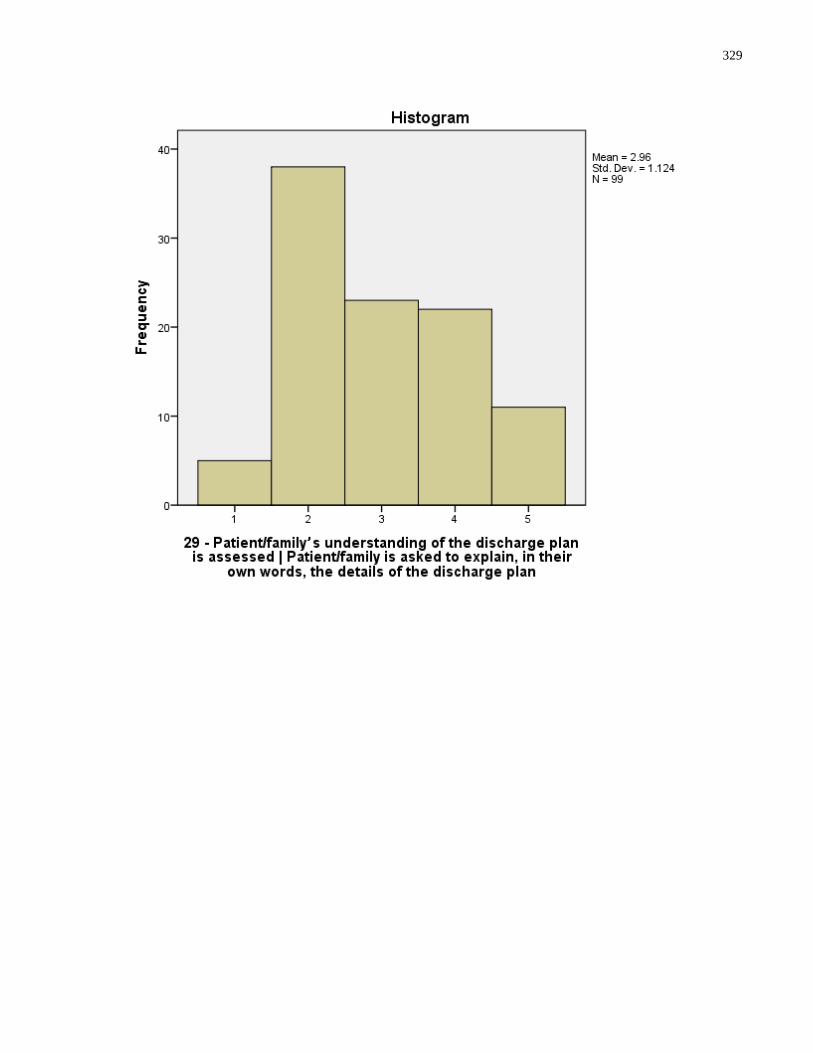
329
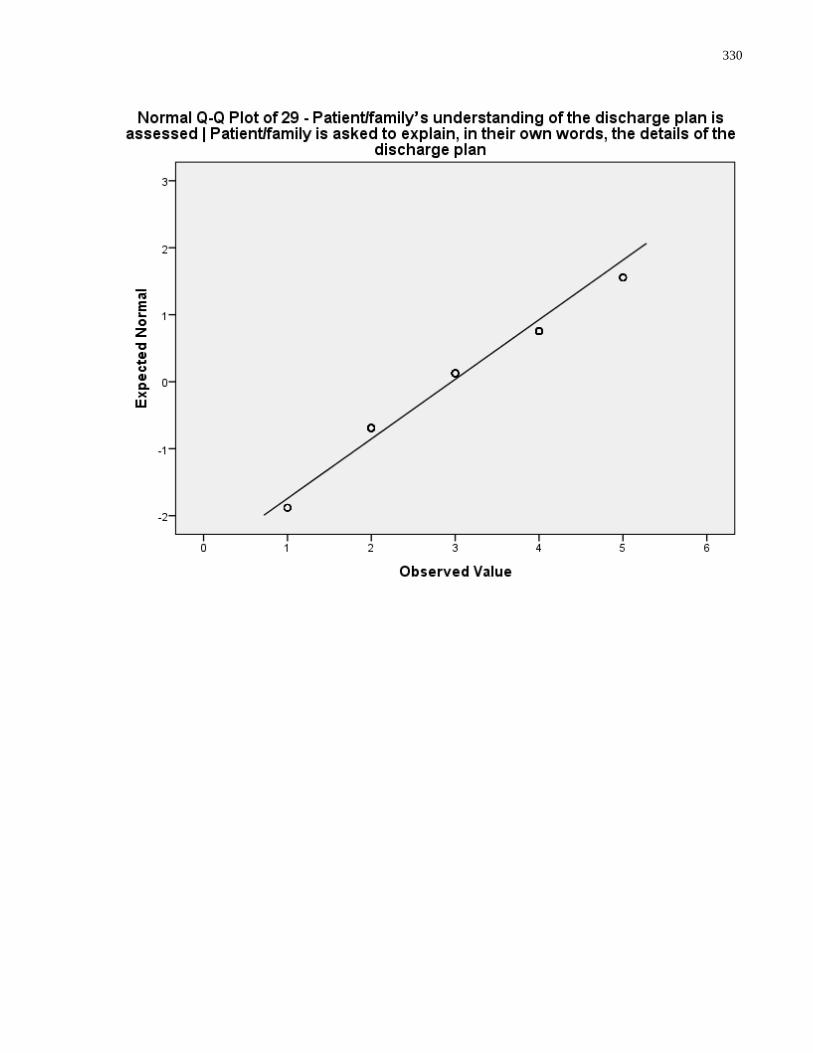
330
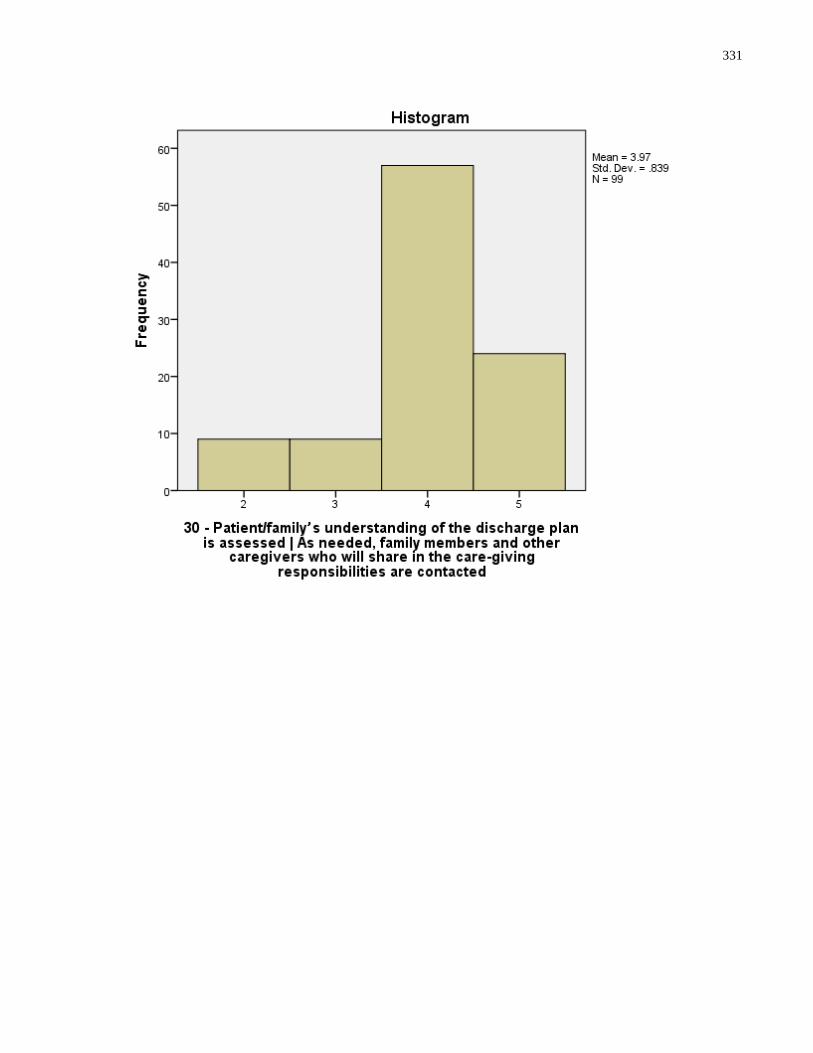
331

332
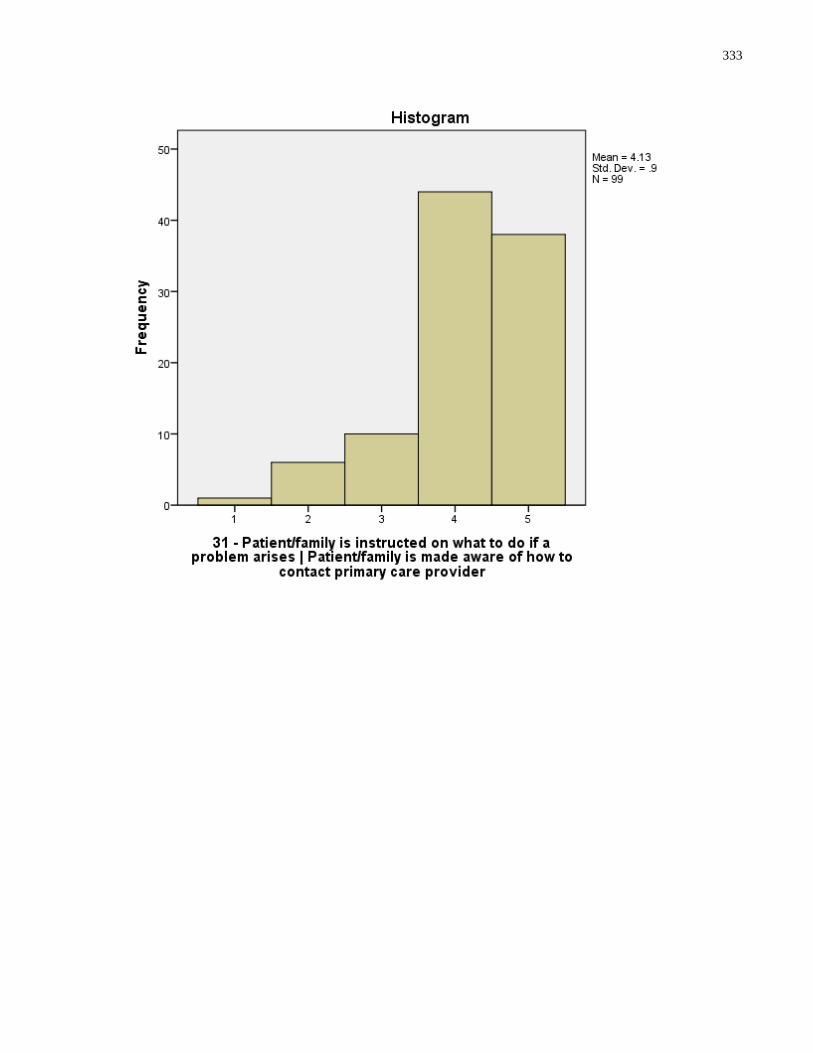
333
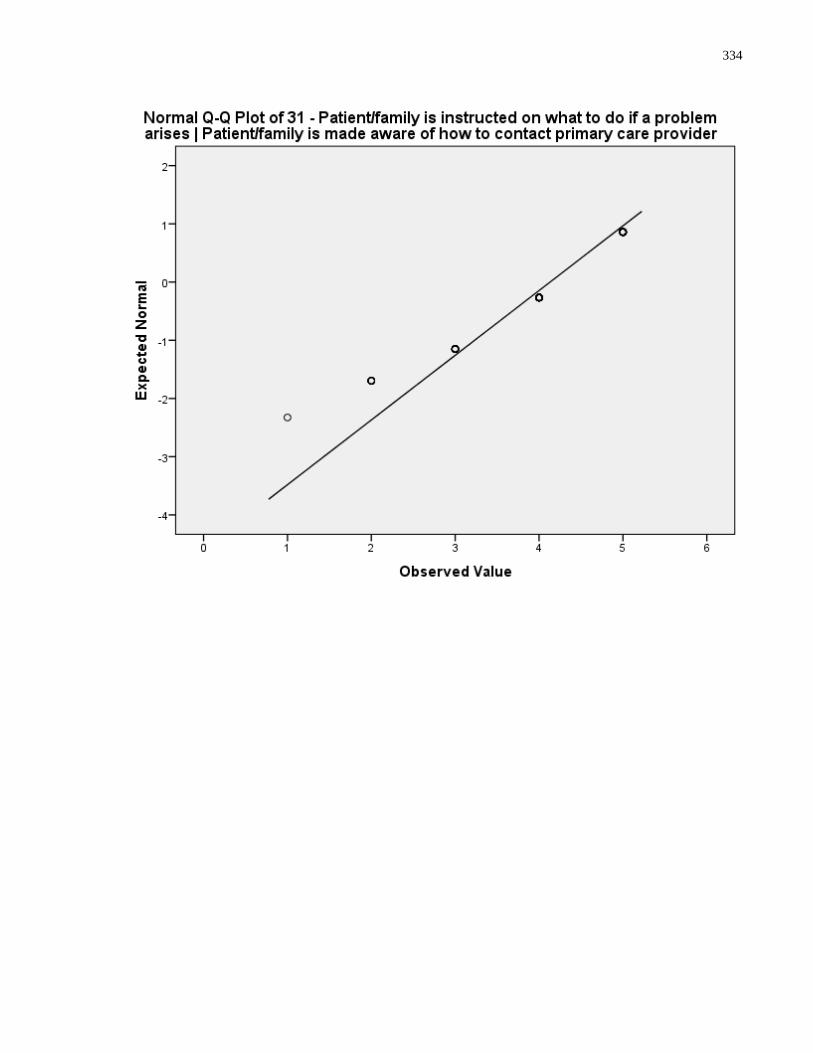
334
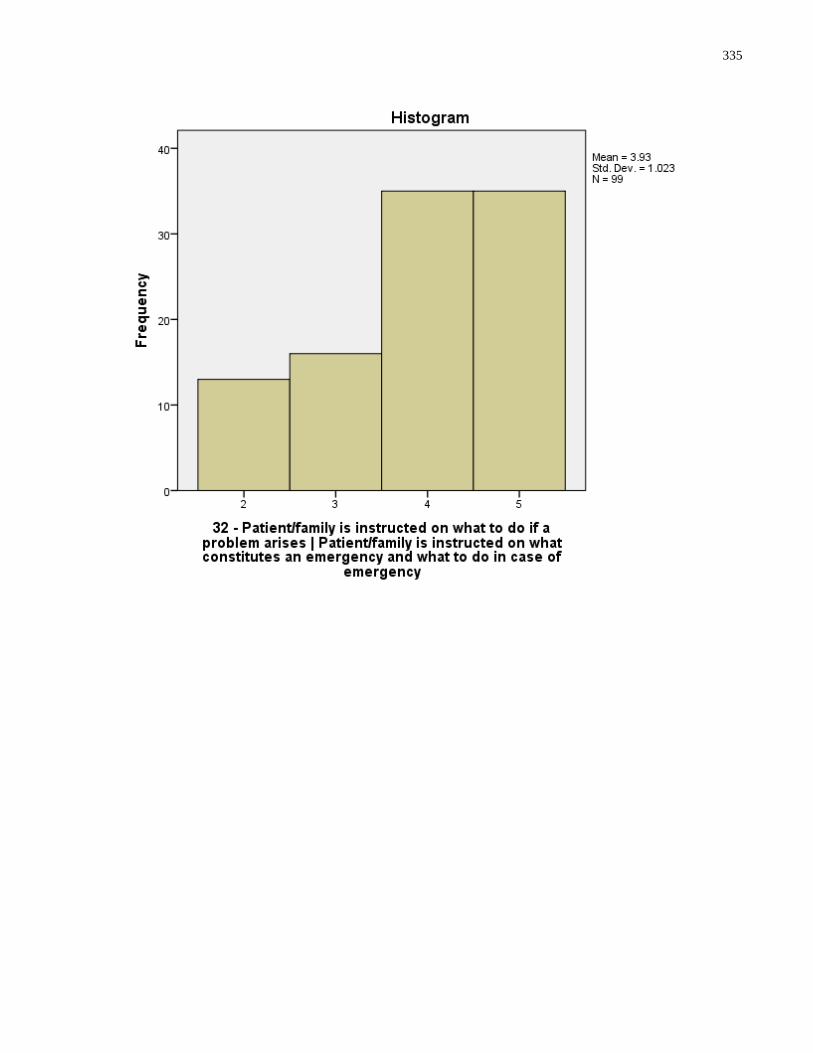
335

336
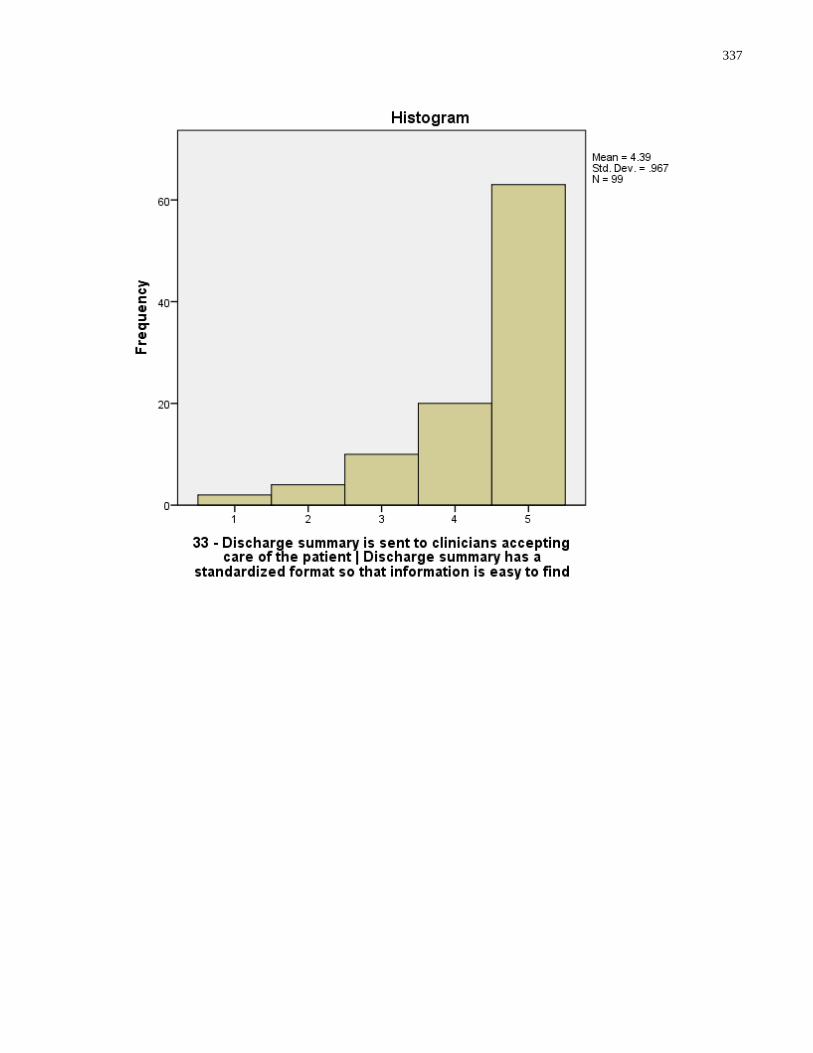
337
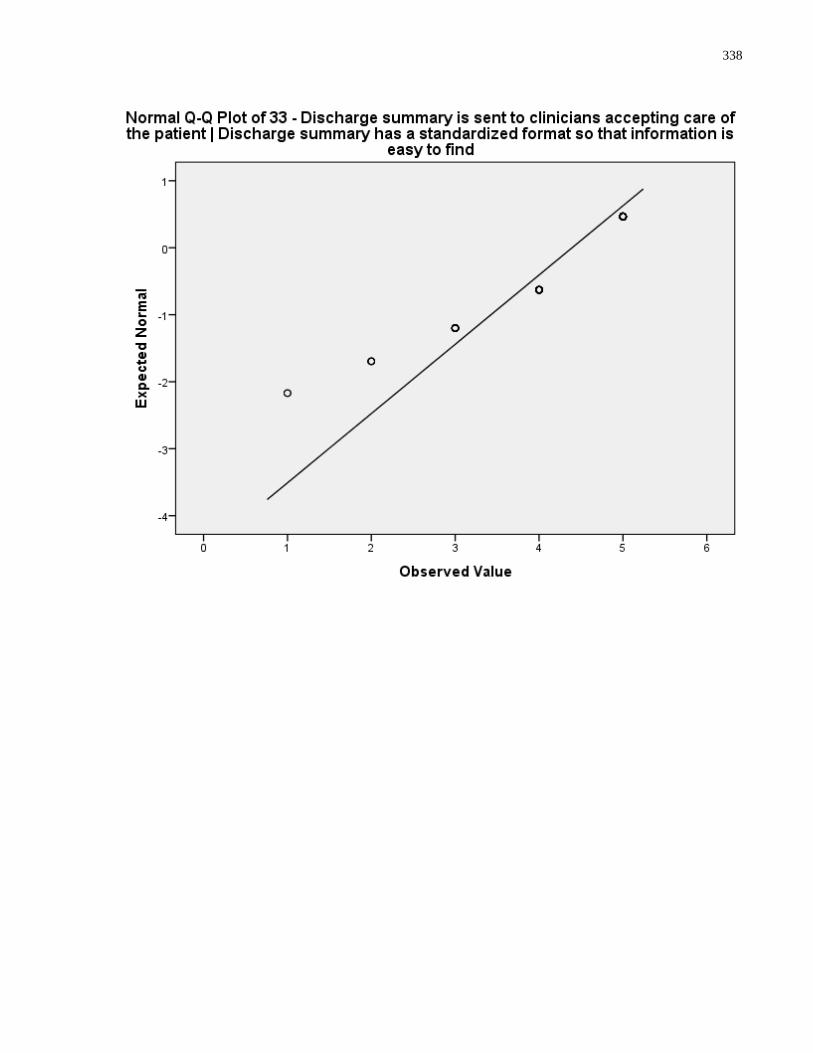
338
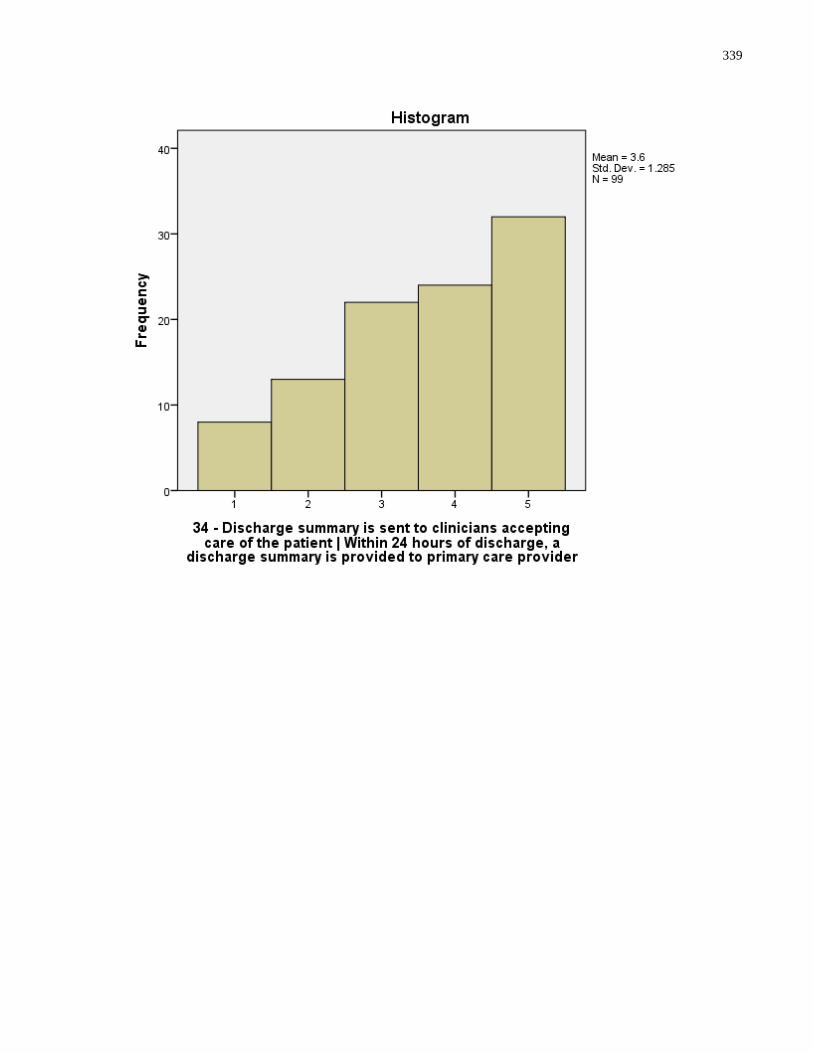
339
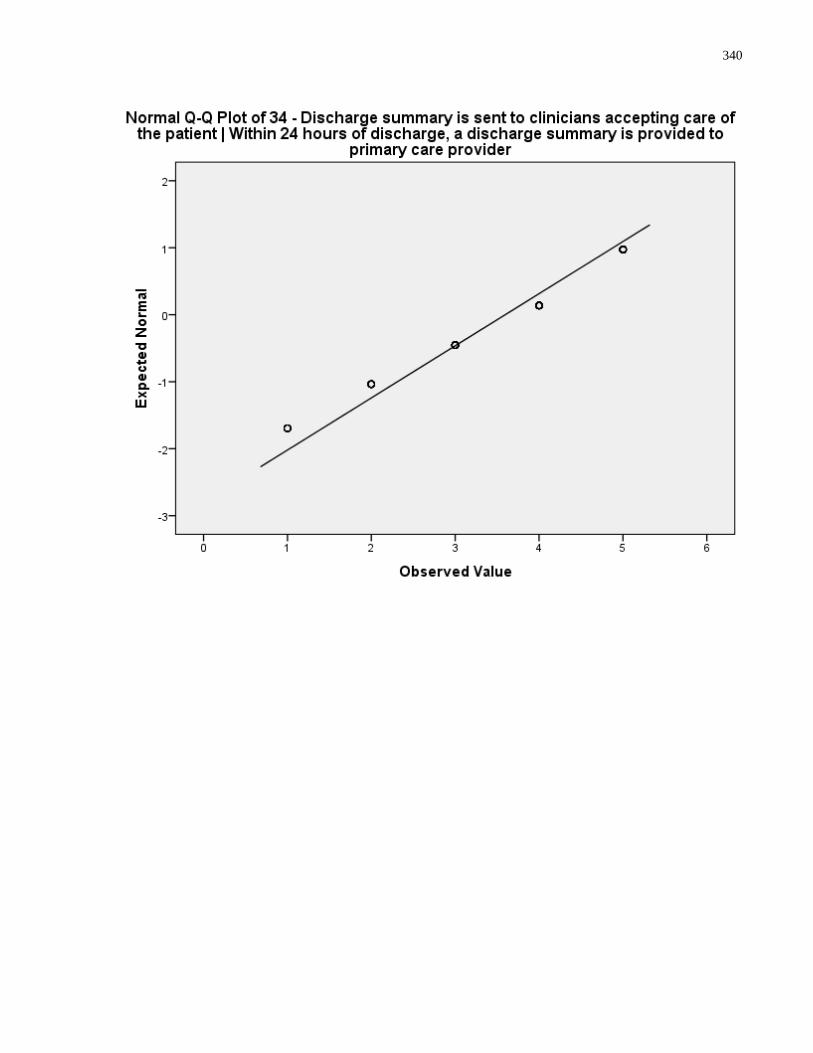
340
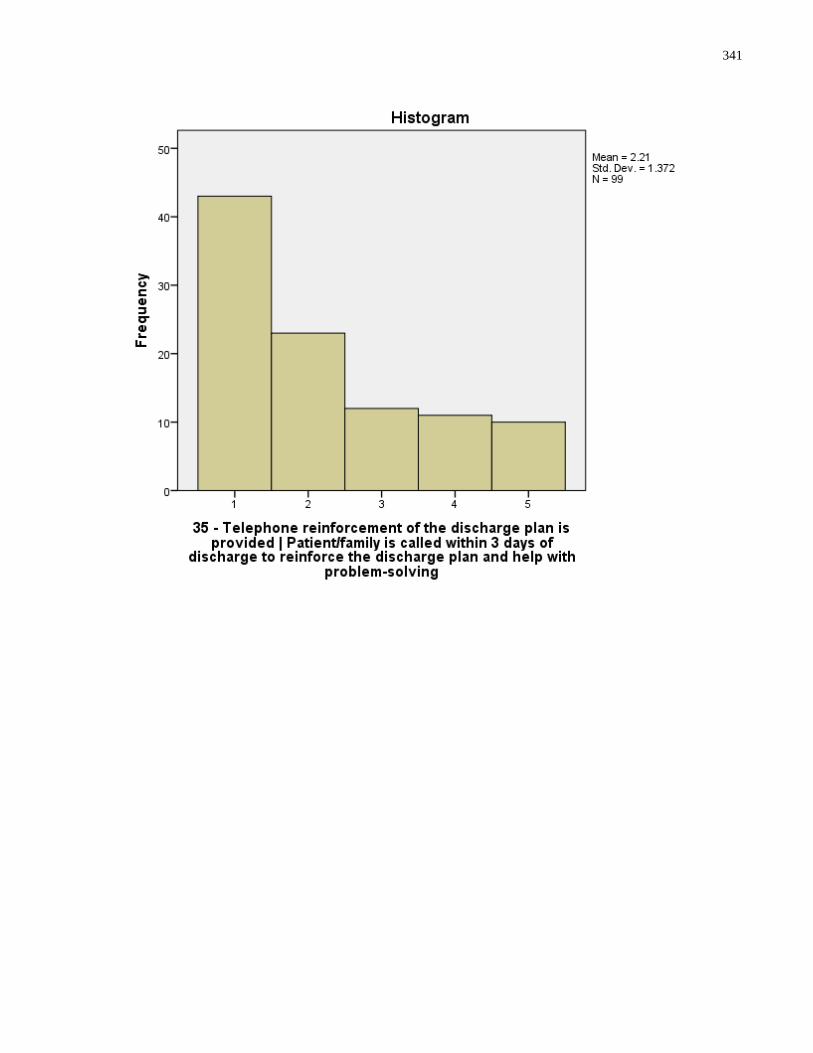
341

342
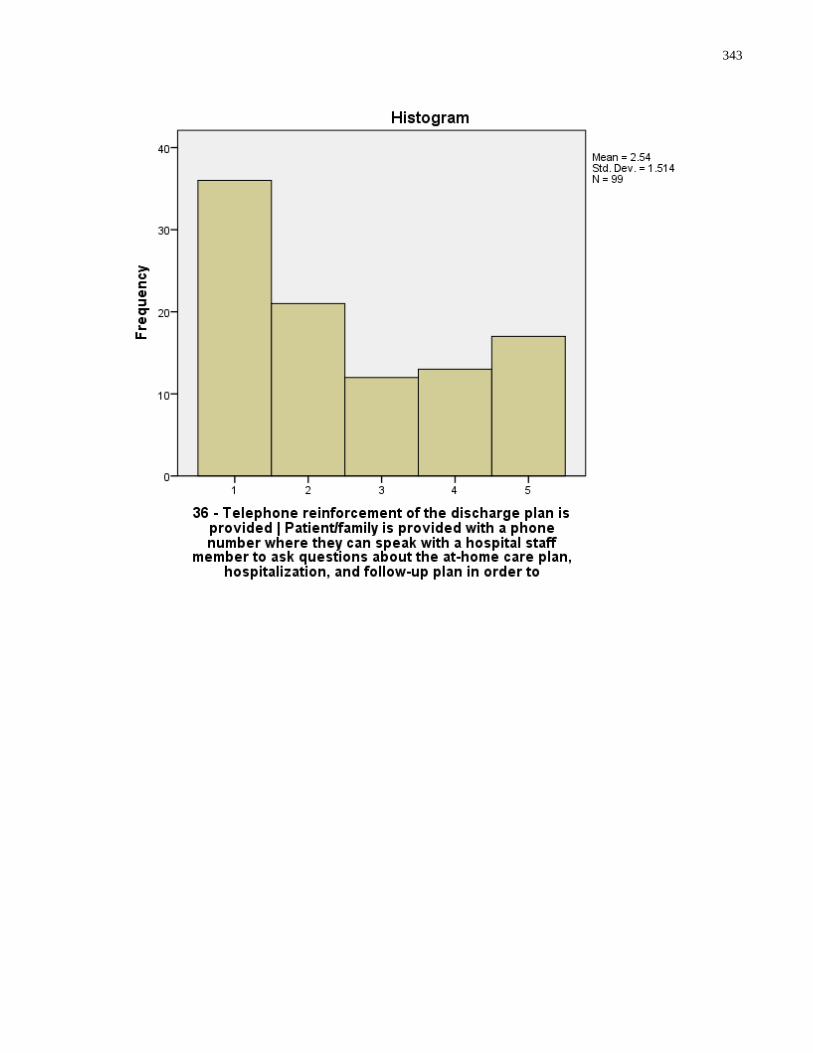
343
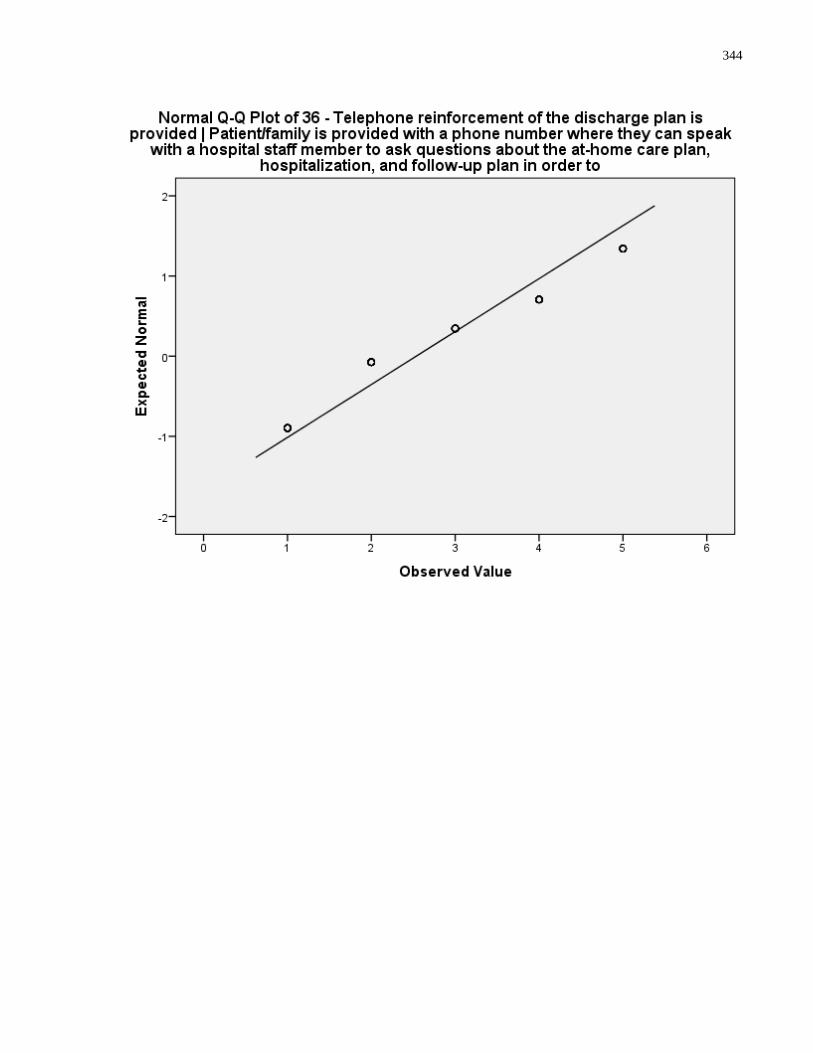
344

345
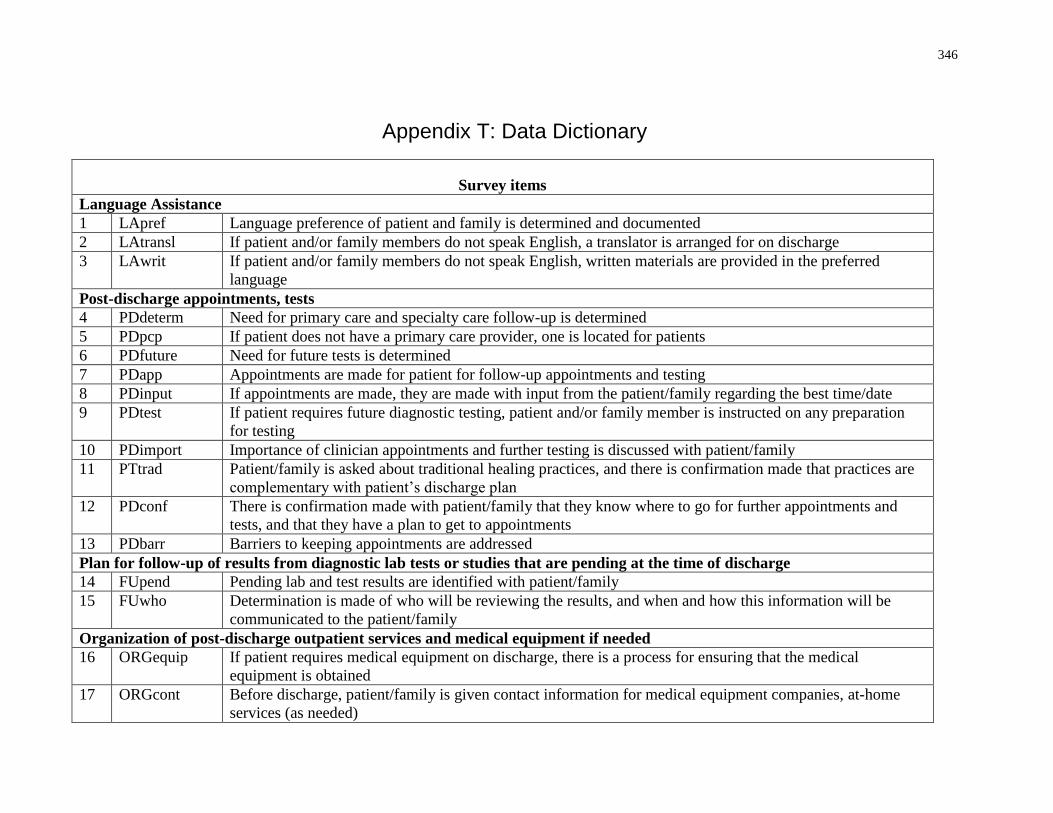
346
Appendix T: Data Dictionary
Survey items
Language Assistance
1 LApref Language preference of patient and family is determined and documented
2 LAtransl If patient and/or family members do not speak English, a translator is arranged for on discharge
3 LAwrit If patient and/or family members do not speak English, written materials are provided in the preferred
language
Post-discharge appointments, tests
4 PDdeterm Need for primary care and specialty care follow-up is determined
5 PDpcp If patient does not have a primary care provider, one is located for patients
6 PDfuture Need for future tests is determined
7 PDapp Appointments are made for patient for follow-up appointments and testing
8 PDinput If appointments are made, they are made with input from the patient/family regarding the best time/date
9 PDtest If patient requires future diagnostic testing, patient and/or family member is instructed on any preparation
for testing
10 PDimport Importance of clinician appointments and further testing is discussed with patient/family
11 PTtrad Patient/family is asked about traditional healing practices, and there is confirmation made that practices are
complementary with patient’s discharge plan
12 PDconf There is confirmation made with patient/family that they know where to go for further appointments and
tests, and that they have a plan to get to appointments
13 PDbarr Barriers to keeping appointments are addressed
Plan for follow-up of results from diagnostic lab tests or studies that are pending at the time of discharge
14 FUpend Pending lab and test results are identified with patient/family
15 FUwho Determination is made of who will be reviewing the results, and when and how this information will be
communicated to the patient/family
Organization of post-discharge outpatient services and medical equipment if needed
16 ORGequip If patient requires medical equipment on discharge, there is a process for ensuring that the medical
equipment is obtained
17 ORGcont Before discharge, patient/family is given contact information for medical equipment companies, at-home
services (as needed)
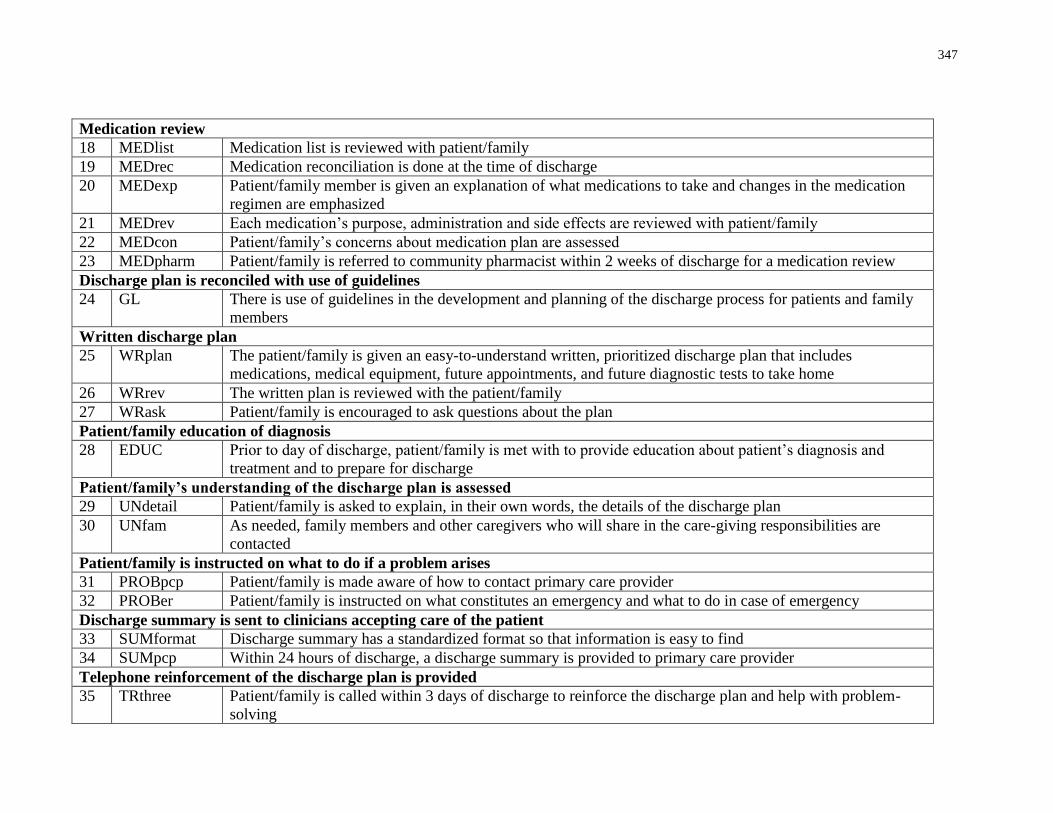
347
Medication review
18 MEDlist Medication list is reviewed with patient/family
19 MEDrec Medication reconciliation is done at the time of discharge
20 MEDexp Patient/family member is given an explanation of what medications to take and changes in the medication
regimen are emphasized
21 MEDrev Each medication’s purpose, administration and side effects are reviewed with patient/family
22 MEDcon Patient/family’s concerns about medication plan are assessed
23 MEDpharm Patient/family is referred to community pharmacist within 2 weeks of discharge for a medication review
Discharge plan is reconciled with use of guidelines
24 GL There is use of guidelines in the development and planning of the discharge process for patients and family
members
Written discharge plan
25 WRplan The patient/family is given an easy-to-understand written, prioritized discharge plan that includes
medications, medical equipment, future appointments, and future diagnostic tests to take home
26 WRrev The written plan is reviewed with the patient/family
27 WRask Patient/family is encouraged to ask questions about the plan
Patient/family education of diagnosis
28 EDUC Prior to day of discharge, patient/family is met with to provide education about patient’s diagnosis and
treatment and to prepare for discharge
Patient/family’s understanding of the discharge plan is assessed
29 UNdetail Patient/family is asked to explain, in their own words, the details of the discharge plan
30 UNfam As needed, family members and other caregivers who will share in the care-giving responsibilities are
contacted
Patient/family is instructed on what to do if a problem arises
31 PROBpcp Patient/family is made aware of how to contact primary care provider
32 PROBer Patient/family is instructed on what constitutes an emergency and what to do in case of emergency
Discharge summary is sent to clinicians accepting care of the patient
33 SUMformat Discharge summary has a standardized format so that information is easy to find
34 SUMpcp Within 24 hours of discharge, a discharge summary is provided to primary care provider
Telephone reinforcement of the discharge plan is provided
35 TRthree Patient/family is called within 3 days of discharge to reinforce the discharge plan and help with problem-
solving
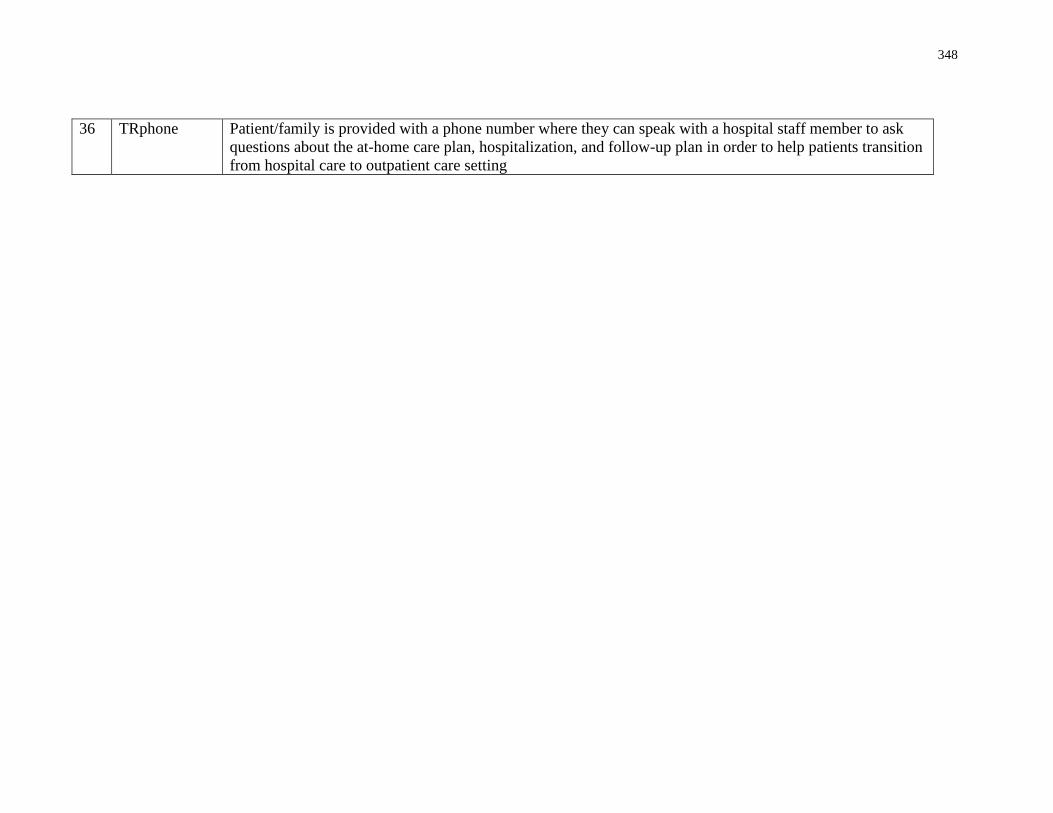
348
36 TRphone Patient/family is provided with a phone number where they can speak with a hospital staff member to ask
questions about the at-home care plan, hospitalization, and follow-up plan in order to help patients transition
from hospital care to outpatient care setting
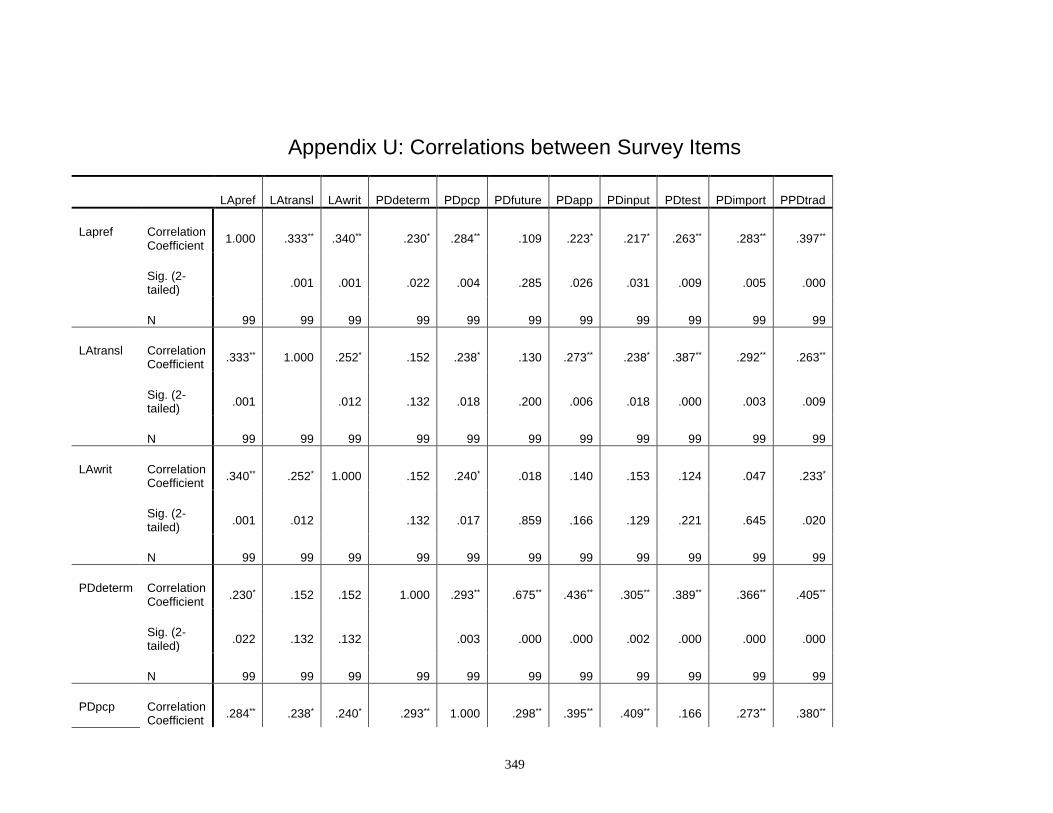
349
Appendix U: Correlations between Survey Items
LApref LAtransl LAwrit PDdeterm PDpcp PDfuture PDapp PDinput PDtest PDimport PPDtrad
Lapref Correlation Coefficient
1.000 .333** .340** .230* .284** .109 .223* .217* .263** .283** .397**
Sig. (2-tailed)
.001 .001 .022 .004 .285 .026 .031 .009 .005 .000
N 99 99 99 99 99 99 99 99 99 99 99
LAtransl Correlation Coefficient
.333** 1.000 .252* .152 .238* .130 .273** .238* .387** .292** .263**
Sig. (2-tailed)
.001 .012 .132 .018 .200 .006 .018 .000 .003 .009
N 99 99 99 99 99 99 99 99 99 99 99
LAwrit Correlation Coefficient
.340** .252* 1.000 .152 .240* .018 .140 .153 .124 .047 .233*
Sig. (2-tailed)
.001 .012 .132 .017 .859 .166 .129 .221 .645 .020
N 99 99 99 99 99 99 99 99 99 99 99
PDdeterm Correlation Coefficient
.230* .152 .152 1.000 .293** .675** .436** .305** .389** .366** .405**
Sig. (2-tailed)
.022 .132 .132 .003 .000 .000 .002 .000 .000 .000
N 99 99 99 99 99 99 99 99 99 99 99
PDpcp Correlation Coefficient
.284** .238* .240* .293** 1.000 .298** .395** .409** .166 .273** .380**
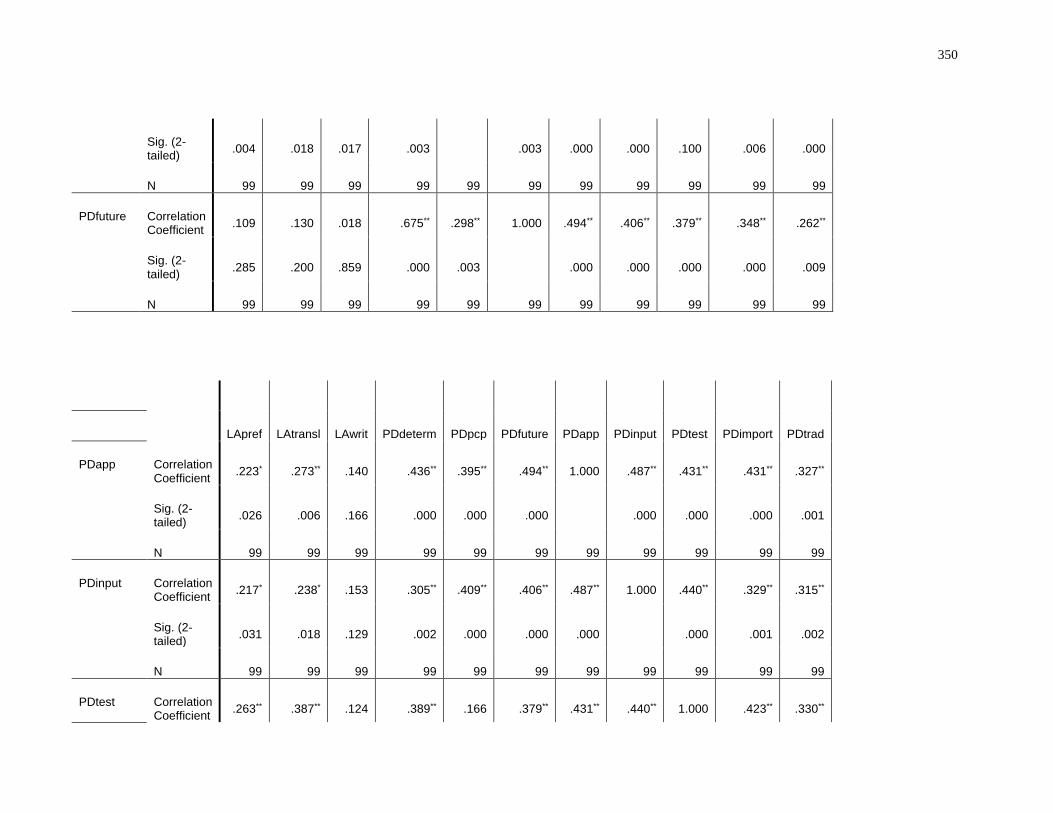
350
Sig. (2-tailed)
.004 .018 .017 .003 .003 .000 .000 .100 .006 .000
N 99 99 99 99 99 99 99 99 99 99 99
PDfuture Correlation Coefficient
.109 .130 .018 .675** .298** 1.000 .494** .406** .379** .348** .262**
Sig. (2-tailed)
.285 .200 .859 .000 .003 .000 .000 .000 .000 .009
N 99 99 99 99 99 99 99 99 99 99 99
LApref LAtransl LAwrit PDdeterm PDpcp PDfuture PDapp PDinput PDtest PDimport PDtrad
PDapp Correlation Coefficient
.223* .273** .140 .436** .395** .494** 1.000 .487** .431** .431** .327**
Sig. (2-tailed)
.026 .006 .166 .000 .000 .000 .000 .000 .000 .001
N 99 99 99 99 99 99 99 99 99 99 99
PDinput Correlation Coefficient
.217* .238* .153 .305** .409** .406** .487** 1.000 .440** .329** .315**
Sig. (2-tailed)
.031 .018 .129 .002 .000 .000 .000 .000 .001 .002
N 99 99 99 99 99 99 99 99 99 99 99
PDtest Correlation Coefficient
.263** .387** .124 .389** .166 .379** .431** .440** 1.000 .423** .330**
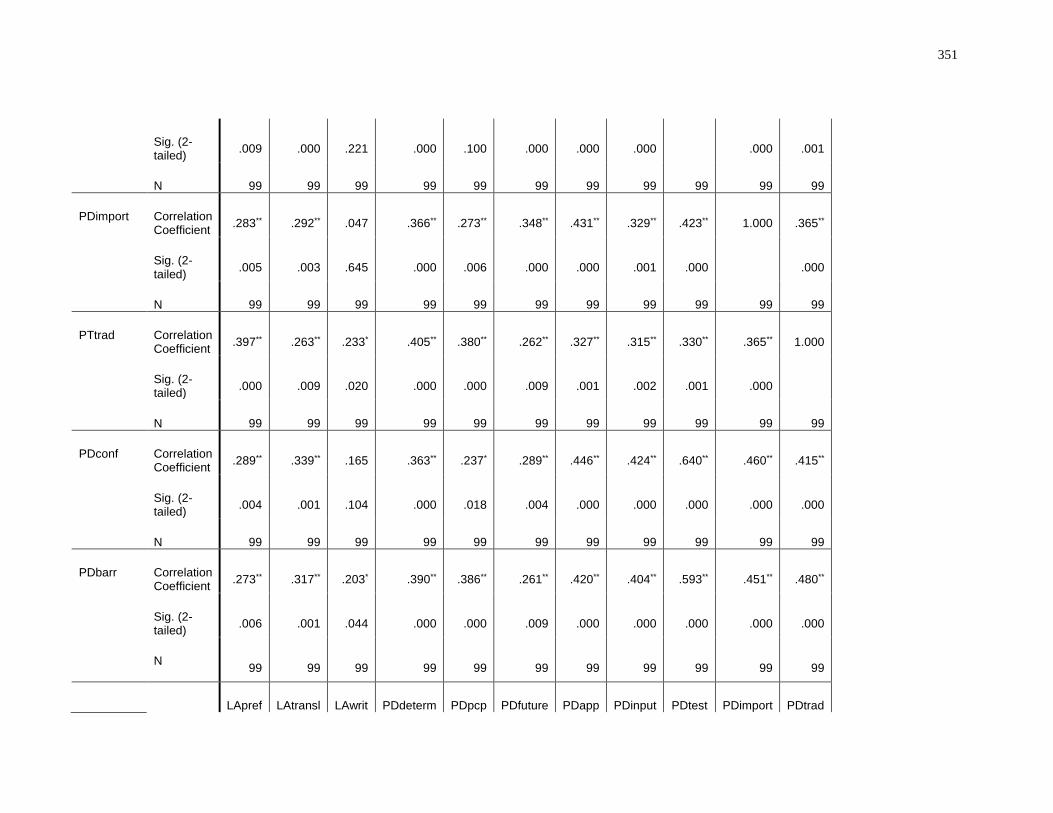
351
Sig. (2-tailed)
.009 .000 .221 .000 .100 .000 .000 .000 .000 .001
N 99 99 99 99 99 99 99 99 99 99 99
PDimport Correlation Coefficient
.283** .292** .047 .366** .273** .348** .431** .329** .423** 1.000 .365**
Sig. (2-tailed)
.005 .003 .645 .000 .006 .000 .000 .001 .000 .000
N 99 99 99 99 99 99 99 99 99 99 99
PTtrad Correlation Coefficient
.397** .263** .233* .405** .380** .262** .327** .315** .330** .365** 1.000
Sig. (2-tailed)
.000 .009 .020 .000 .000 .009 .001 .002 .001 .000
N 99 99 99 99 99 99 99 99 99 99 99
PDconf Correlation Coefficient
.289** .339** .165 .363** .237* .289** .446** .424** .640** .460** .415**
Sig. (2-tailed)
.004 .001 .104 .000 .018 .004 .000 .000 .000 .000 .000
N 99 99 99 99 99 99 99 99 99 99 99
PDbarr Correlation Coefficient
.273** .317** .203* .390** .386** .261** .420** .404** .593** .451** .480**
Sig. (2-tailed)
.006 .001 .044 .000 .000 .009 .000 .000 .000 .000 .000
N 99 99 99 99 99 99 99 99 99 99 99
LApref LAtransl LAwrit PDdeterm PDpcp PDfuture PDapp PDinput PDtest PDimport PDtrad
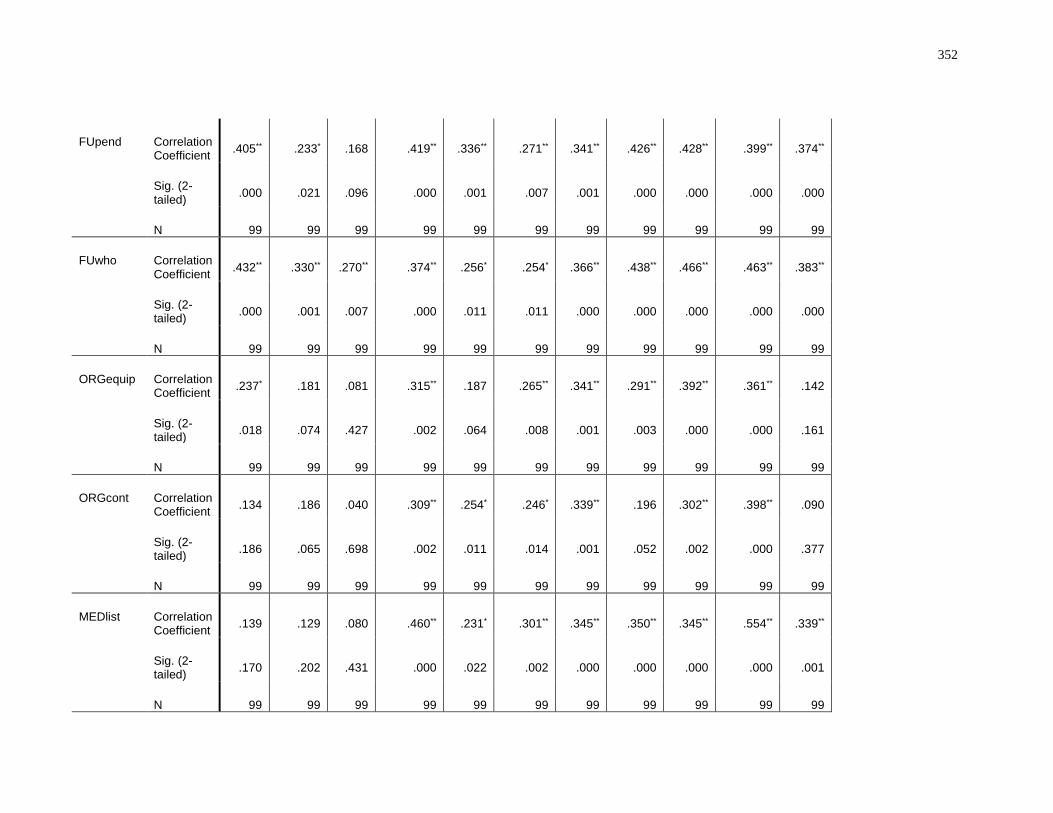
352
FUpend Correlation Coefficient
.405** .233* .168 .419** .336** .271** .341** .426** .428** .399** .374**
Sig. (2-tailed)
.000 .021 .096 .000 .001 .007 .001 .000 .000 .000 .000
N 99 99 99 99 99 99 99 99 99 99 99
FUwho Correlation Coefficient
.432** .330** .270** .374** .256* .254* .366** .438** .466** .463** .383**
Sig. (2-tailed)
.000 .001 .007 .000 .011 .011 .000 .000 .000 .000 .000
N 99 99 99 99 99 99 99 99 99 99 99
ORGequip Correlation Coefficient
.237* .181 .081 .315** .187 .265** .341** .291** .392** .361** .142
Sig. (2-tailed)
.018 .074 .427 .002 .064 .008 .001 .003 .000 .000 .161
N 99 99 99 99 99 99 99 99 99 99 99
ORGcont Correlation Coefficient
.134 .186 .040 .309** .254* .246* .339** .196 .302** .398** .090
Sig. (2-tailed)
.186 .065 .698 .002 .011 .014 .001 .052 .002 .000 .377
N 99 99 99 99 99 99 99 99 99 99 99
MEDlist Correlation Coefficient
.139 .129 .080 .460** .231* .301** .345** .350** .345** .554** .339**
Sig. (2-tailed)
.170 .202 .431 .000 .022 .002 .000 .000 .000 .000 .001
N 99 99 99 99 99 99 99 99 99 99 99
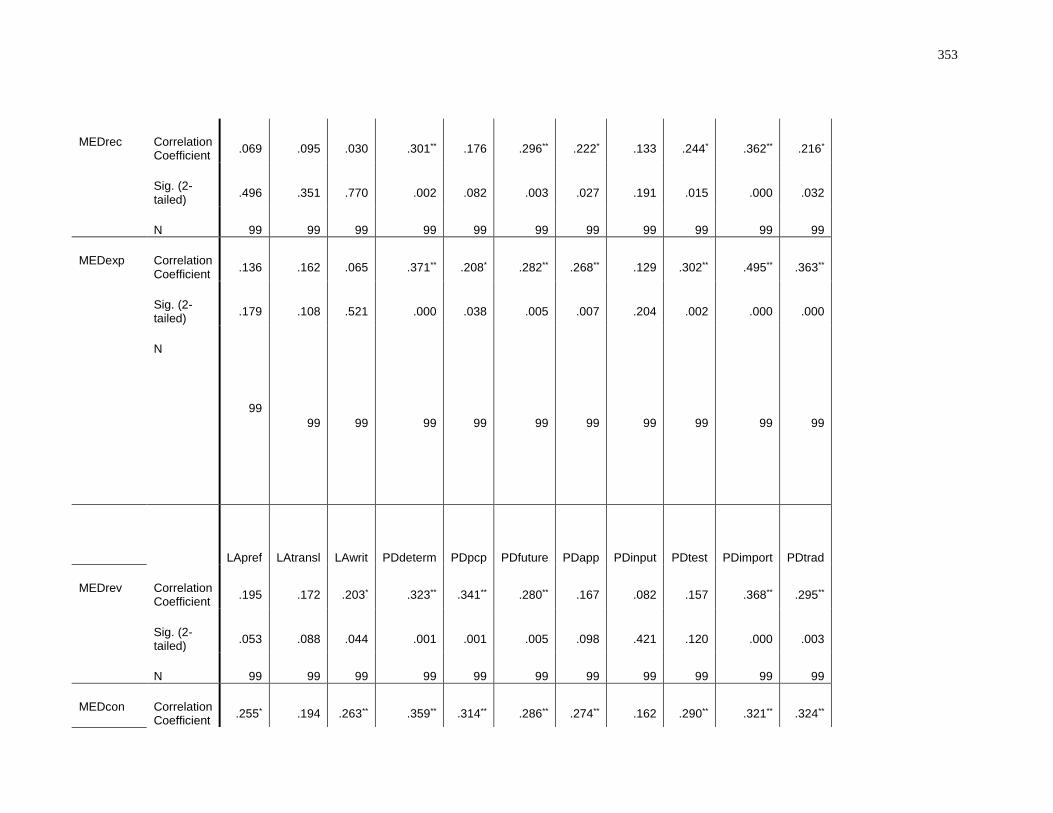
353
MEDrec Correlation Coefficient
.069 .095 .030 .301** .176 .296** .222* .133 .244* .362** .216*
Sig. (2-tailed)
.496 .351 .770 .002 .082 .003 .027 .191 .015 .000 .032
N 99 99 99 99 99 99 99 99 99 99 99
MEDexp Correlation Coefficient
.136 .162 .065 .371** .208* .282** .268** .129 .302** .495** .363**
Sig. (2-tailed)
.179 .108 .521 .000 .038 .005 .007 .204 .002 .000 .000
N
99
99 99 99 99 99 99 99 99 99 99
LApref LAtransl LAwrit PDdeterm PDpcp PDfuture PDapp PDinput PDtest PDimport
PDtrad
MEDrev Correlation Coefficient
.195 .172 .203* .323** .341** .280** .167 .082 .157 .368** .295**
Sig. (2-tailed)
.053 .088 .044 .001 .001 .005 .098 .421 .120 .000 .003
N 99 99 99 99 99 99 99 99 99 99 99
MEDcon Correlation Coefficient
.255* .194 .263** .359** .314** .286** .274** .162 .290** .321** .324**
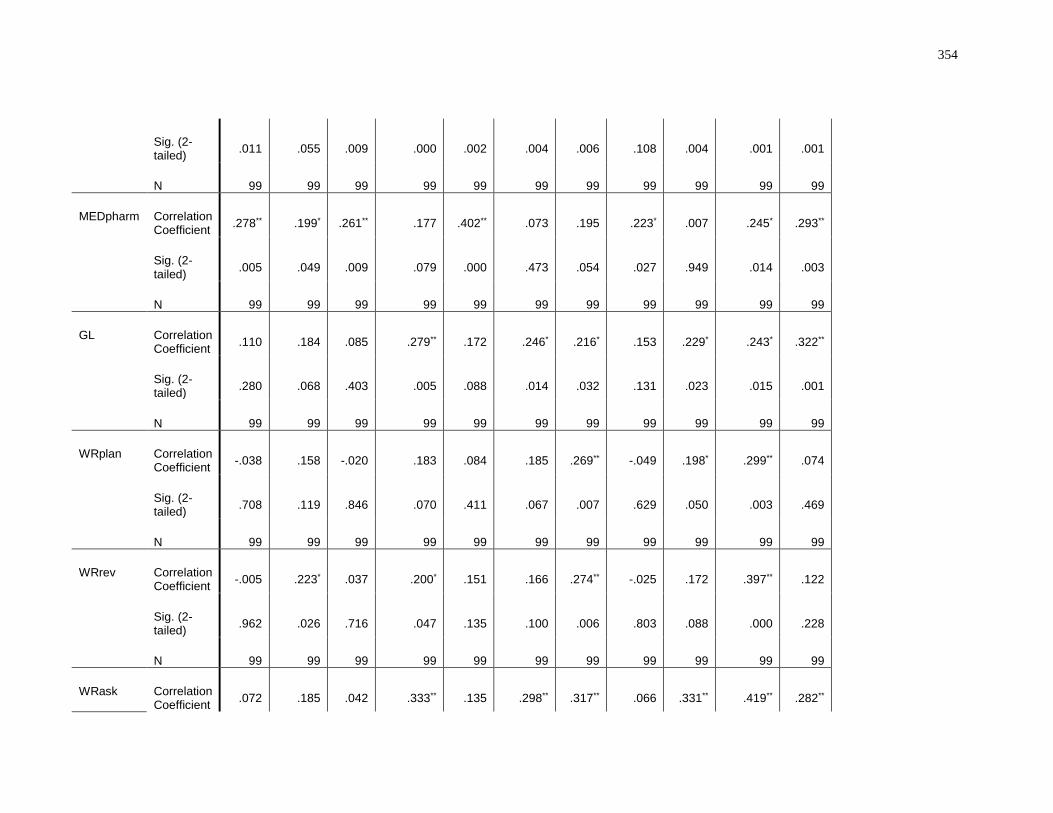
354
Sig. (2-tailed)
.011 .055 .009 .000 .002 .004 .006 .108 .004 .001 .001
N 99 99 99 99 99 99 99 99 99 99 99
MEDpharm Correlation Coefficient
.278** .199* .261** .177 .402** .073 .195 .223* .007 .245* .293**
Sig. (2-tailed)
.005 .049 .009 .079 .000 .473 .054 .027 .949 .014 .003
N 99 99 99 99 99 99 99 99 99 99 99
GL Correlation Coefficient
.110 .184 .085 .279** .172 .246* .216* .153 .229* .243* .322**
Sig. (2-tailed)
.280 .068 .403 .005 .088 .014 .032 .131 .023 .015 .001
N 99 99 99 99 99 99 99 99 99 99 99
WRplan Correlation Coefficient
-.038 .158 -.020 .183 .084 .185 .269** -.049 .198* .299** .074
Sig. (2-tailed)
.708 .119 .846 .070 .411 .067 .007 .629 .050 .003 .469
N 99 99 99 99 99 99 99 99 99 99 99
WRrev Correlation Coefficient
-.005 .223* .037 .200* .151 .166 .274** -.025 .172 .397** .122
Sig. (2-tailed)
.962 .026 .716 .047 .135 .100 .006 .803 .088 .000 .228
N 99 99 99 99 99 99 99 99 99 99 99
WRask Correlation Coefficient
.072 .185 .042 .333** .135 .298** .317** .066 .331** .419** .282**
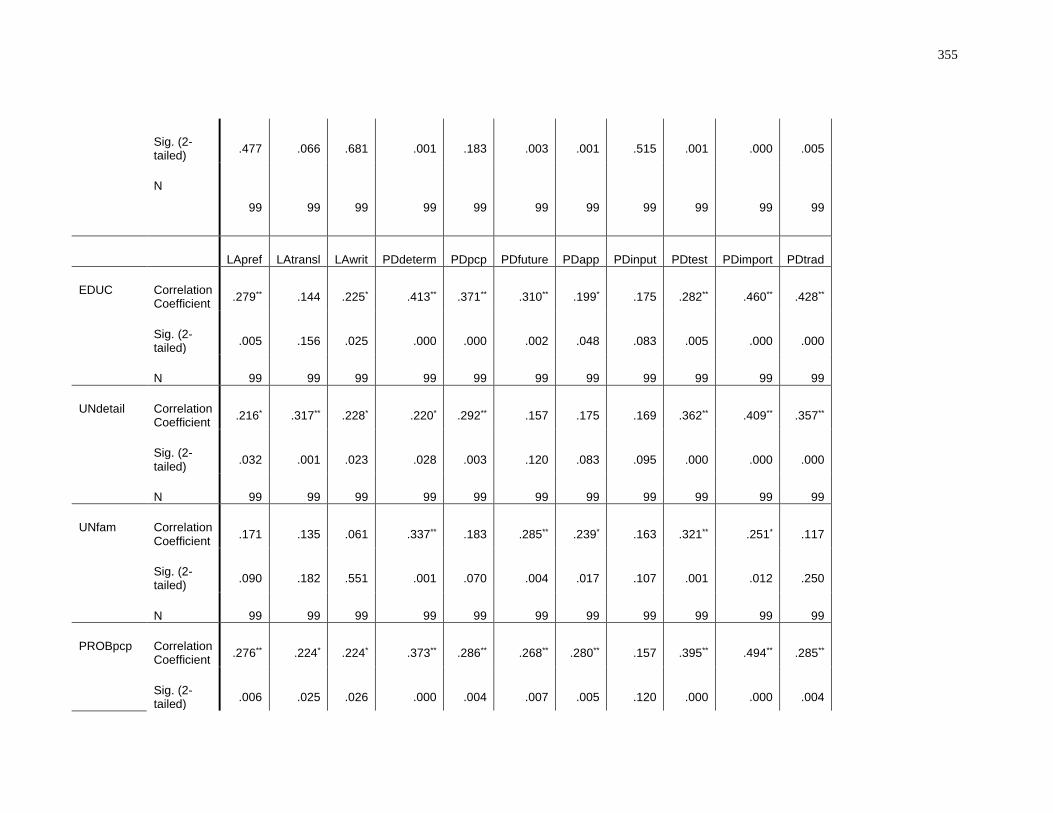
355
Sig. (2-tailed)
.477 .066 .681 .001 .183 .003 .001 .515 .001 .000 .005
N
99 99 99 99 99 99 99 99 99 99 99
LApref LAtransl LAwrit PDdeterm PDpcp PDfuture PDapp PDinput PDtest PDimport PDtrad
EDUC Correlation Coefficient
.279** .144 .225* .413** .371** .310** .199* .175 .282** .460** .428**
Sig. (2-tailed)
.005 .156 .025 .000 .000 .002 .048 .083 .005 .000 .000
N 99 99 99 99 99 99 99 99 99 99 99
UNdetail Correlation Coefficient
.216* .317** .228* .220* .292** .157 .175 .169 .362** .409** .357**
Sig. (2-tailed)
.032 .001 .023 .028 .003 .120 .083 .095 .000 .000 .000
N 99 99 99 99 99 99 99 99 99 99 99
UNfam Correlation Coefficient
.171 .135 .061 .337** .183 .285** .239* .163 .321** .251* .117
Sig. (2-tailed)
.090 .182 .551 .001 .070 .004 .017 .107 .001 .012 .250
N 99 99 99 99 99 99 99 99 99 99 99
PROBpcp Correlation Coefficient
.276** .224* .224* .373** .286** .268** .280** .157 .395** .494** .285**
Sig. (2-tailed)
.006 .025 .026 .000 .004 .007 .005 .120 .000 .000 .004
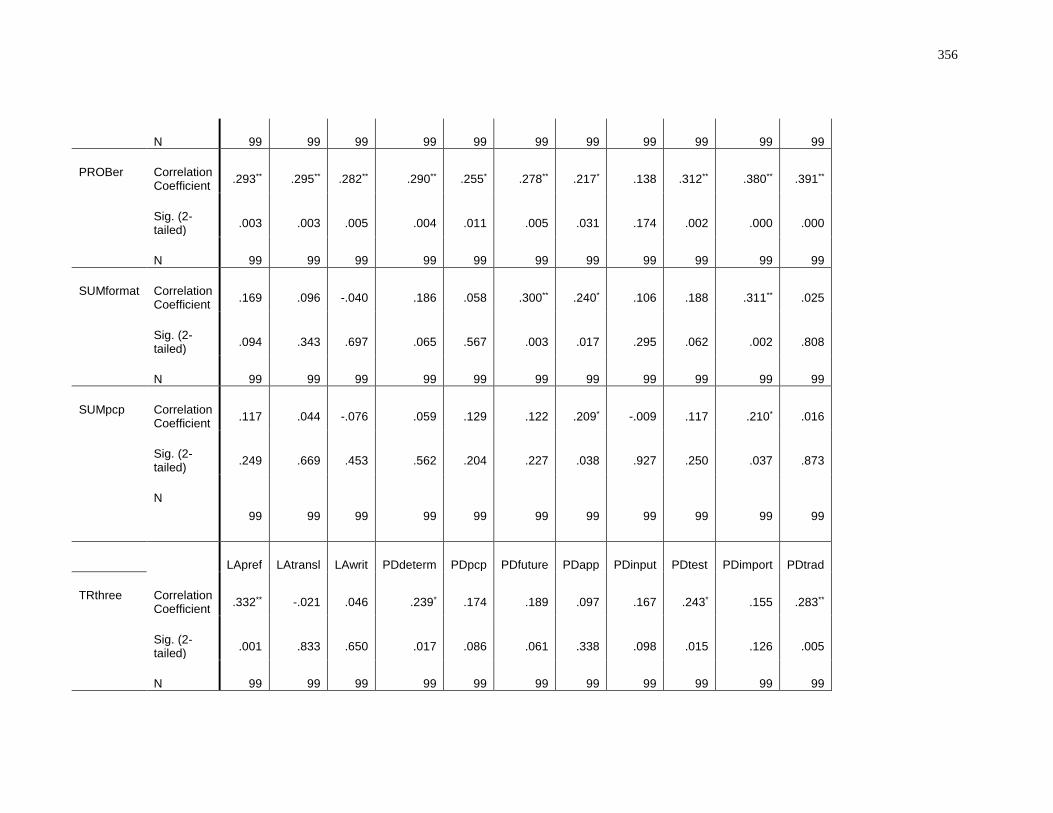
356
N 99 99 99 99 99 99 99 99 99 99 99
PROBer Correlation Coefficient
.293** .295** .282** .290** .255* .278** .217* .138 .312** .380** .391**
Sig. (2-tailed)
.003 .003 .005 .004 .011 .005 .031 .174 .002 .000 .000
N 99 99 99 99 99 99 99 99 99 99 99
SUMformat Correlation Coefficient
.169 .096 -.040 .186 .058 .300** .240* .106 .188 .311** .025
Sig. (2-tailed)
.094 .343 .697 .065 .567 .003 .017 .295 .062 .002 .808
N 99 99 99 99 99 99 99 99 99 99 99
SUMpcp Correlation Coefficient
.117 .044 -.076 .059 .129 .122 .209* -.009 .117 .210* .016
Sig. (2-tailed)
.249 .669 .453 .562 .204 .227 .038 .927 .250 .037 .873
N
99 99 99 99 99 99 99 99 99 99 99
LApref LAtransl LAwrit PDdeterm PDpcp PDfuture PDapp PDinput PDtest PDimport PDtrad
TRthree Correlation Coefficient
.332** -.021 .046 .239* .174 .189 .097 .167 .243* .155 .283**
Sig. (2-tailed)
.001 .833 .650 .017 .086 .061 .338 .098 .015 .126 .005
N 99 99 99 99 99 99 99 99 99 99 99
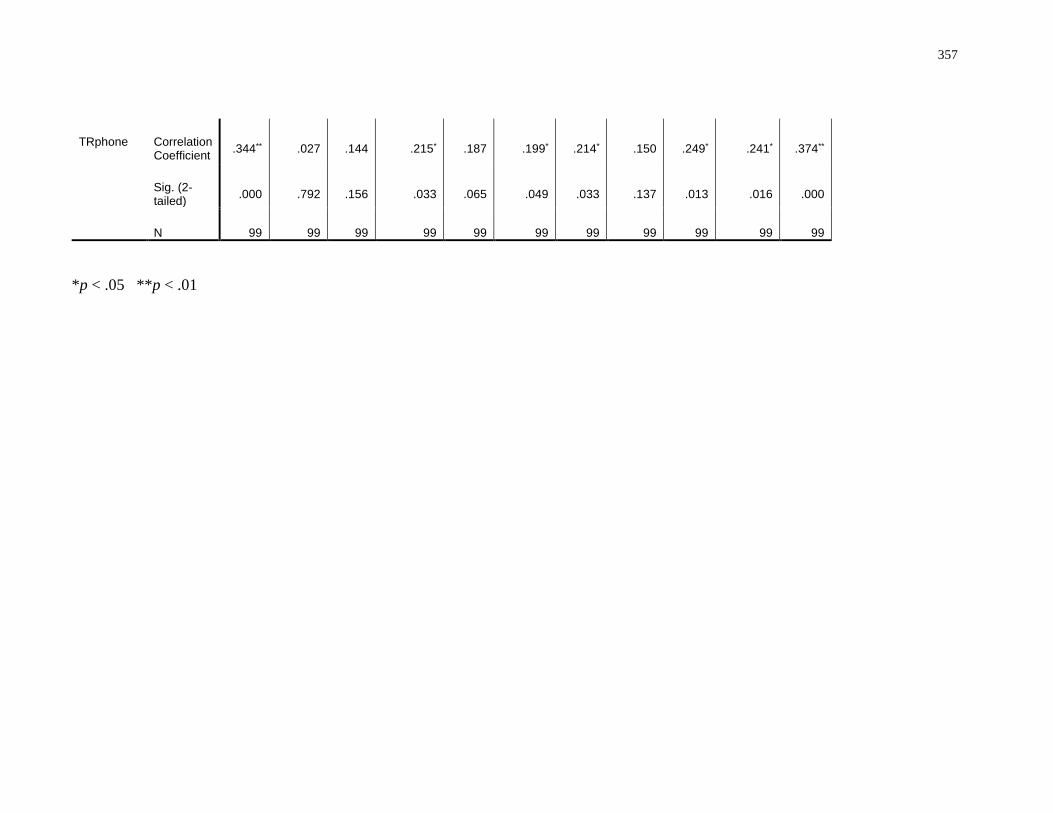
357
TRphone Correlation Coefficient
.344** .027 .144 .215* .187 .199* .214* .150 .249* .241* .374**
Sig. (2-tailed)
.000 .792 .156 .033 .065 .049 .033 .137 .013 .016 .000
N 99 99 99 99 99 99 99 99 99 99 99
*p < .05 **p < .01
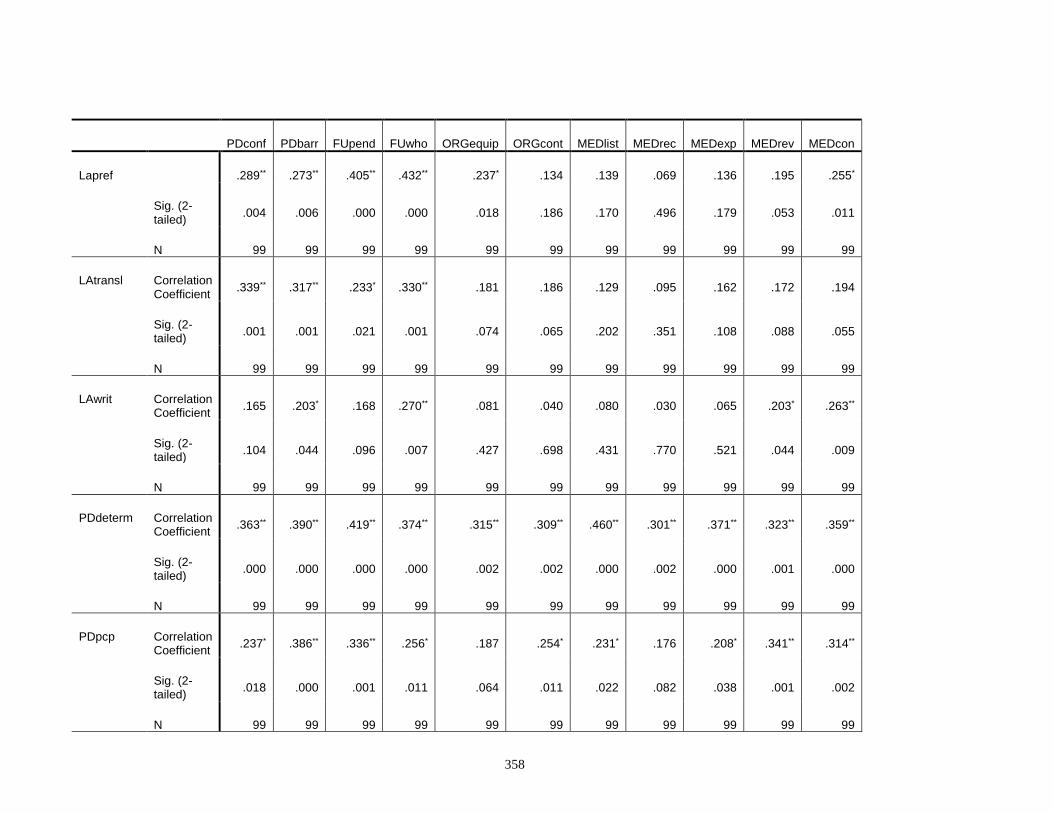
358
PDconf PDbarr FUpend FUwho ORGequip ORGcont MEDlist MEDrec MEDexp MEDrev MEDcon
Lapref .289** .273** .405** .432** .237* .134 .139 .069 .136 .195 .255*
Sig. (2-tailed)
.004 .006 .000 .000 .018 .186 .170 .496 .179 .053 .011
N 99 99 99 99 99 99 99 99 99 99 99
LAtransl Correlation Coefficient
.339** .317** .233* .330** .181 .186 .129 .095 .162 .172 .194
Sig. (2-tailed)
.001 .001 .021 .001 .074 .065 .202 .351 .108 .088 .055
N 99 99 99 99 99 99 99 99 99 99 99
LAwrit Correlation Coefficient
.165 .203* .168 .270** .081 .040 .080 .030 .065 .203* .263**
Sig. (2-tailed)
.104 .044 .096 .007 .427 .698 .431 .770 .521 .044 .009
N 99 99 99 99 99 99 99 99 99 99 99
PDdeterm Correlation Coefficient
.363** .390** .419** .374** .315** .309** .460** .301** .371** .323** .359**
Sig. (2-tailed)
.000 .000 .000 .000 .002 .002 .000 .002 .000 .001 .000
N 99 99 99 99 99 99 99 99 99 99 99
PDpcp Correlation Coefficient
.237* .386** .336** .256* .187 .254* .231* .176 .208* .341** .314**
Sig. (2-tailed)
.018 .000 .001 .011 .064 .011 .022 .082 .038 .001 .002
N 99 99 99 99 99 99 99 99 99 99 99
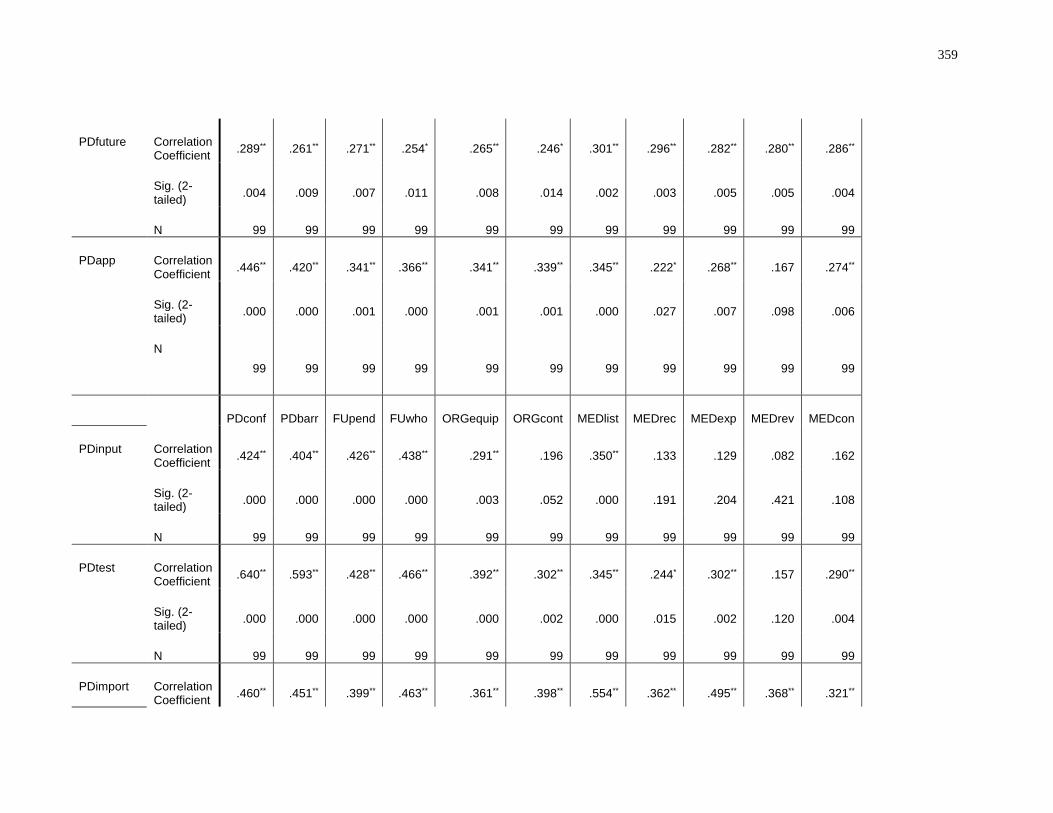
359
PDfuture Correlation Coefficient
.289** .261** .271** .254* .265** .246* .301** .296** .282** .280** .286**
Sig. (2-tailed)
.004 .009 .007 .011 .008 .014 .002 .003 .005 .005 .004
N 99 99 99 99 99 99 99 99 99 99 99
PDapp Correlation Coefficient
.446** .420** .341** .366** .341** .339** .345** .222* .268** .167 .274**
Sig. (2-tailed)
.000 .000 .001 .000 .001 .001 .000 .027 .007 .098 .006
N
99 99 99 99 99 99 99 99 99 99 99
PDconf PDbarr FUpend FUwho ORGequip ORGcont MEDlist MEDrec MEDexp MEDrev MEDcon
PDinput Correlation Coefficient
.424** .404** .426** .438** .291** .196 .350** .133 .129 .082 .162
Sig. (2-tailed)
.000 .000 .000 .000 .003 .052 .000 .191 .204 .421 .108
N 99 99 99 99 99 99 99 99 99 99 99
PDtest Correlation Coefficient
.640** .593** .428** .466** .392** .302** .345** .244* .302** .157 .290**
Sig. (2-tailed)
.000 .000 .000 .000 .000 .002 .000 .015 .002 .120 .004
N 99 99 99 99 99 99 99 99 99 99 99
PDimport Correlation Coefficient
.460** .451** .399** .463** .361** .398** .554** .362** .495** .368** .321**
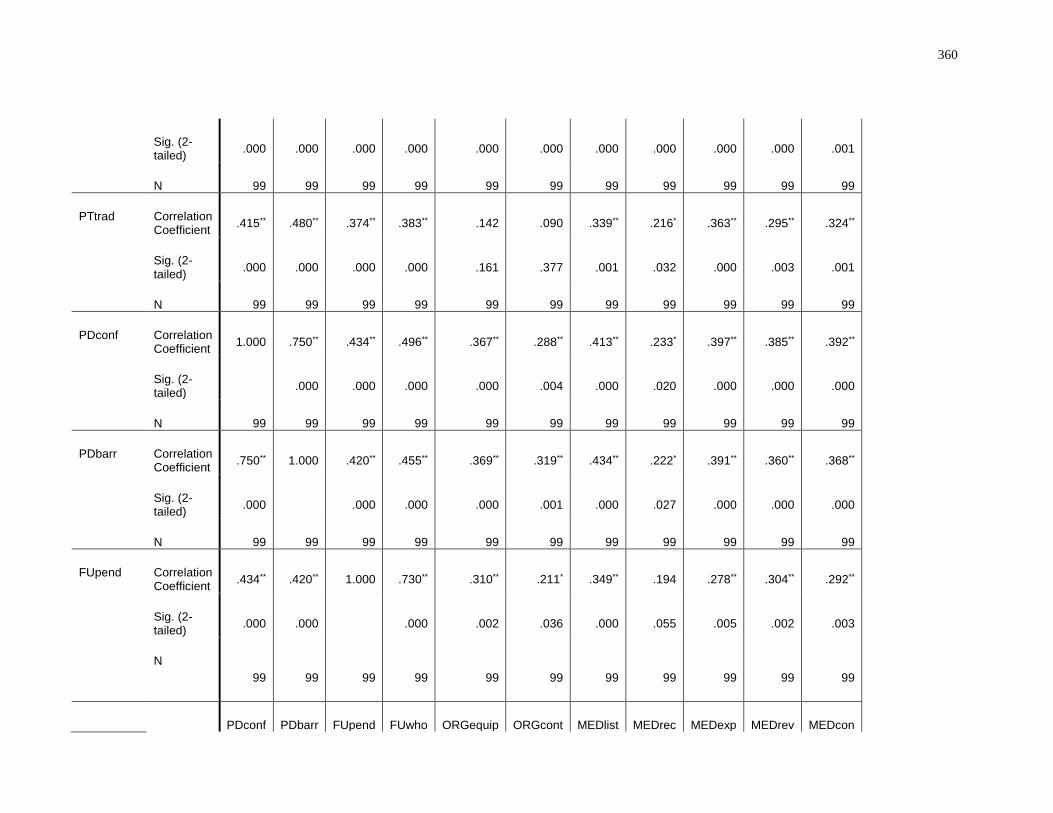
360
Sig. (2-tailed)
.000 .000 .000 .000 .000 .000 .000 .000 .000 .000 .001
N 99 99 99 99 99 99 99 99 99 99 99
PTtrad Correlation Coefficient
.415** .480** .374** .383** .142 .090 .339** .216* .363** .295** .324**
Sig. (2-tailed)
.000 .000 .000 .000 .161 .377 .001 .032 .000 .003 .001
N 99 99 99 99 99 99 99 99 99 99 99
PDconf Correlation Coefficient
1.000 .750** .434** .496** .367** .288** .413** .233* .397** .385** .392**
Sig. (2-tailed)
.000 .000 .000 .000 .004 .000 .020 .000 .000 .000
N 99 99 99 99 99 99 99 99 99 99 99
PDbarr Correlation Coefficient
.750** 1.000 .420** .455** .369** .319** .434** .222* .391** .360** .368**
Sig. (2-tailed)
.000 .000 .000 .000 .001 .000 .027 .000 .000 .000
N 99 99 99 99 99 99 99 99 99 99 99
FUpend Correlation Coefficient
.434** .420** 1.000 .730** .310** .211* .349** .194 .278** .304** .292**
Sig. (2-tailed)
.000 .000 .000 .002 .036 .000 .055 .005 .002 .003
N
99 99 99 99 99 99 99 99 99 99 99
PDconf PDbarr FUpend FUwho ORGequip ORGcont MEDlist MEDrec MEDexp MEDrev MEDcon
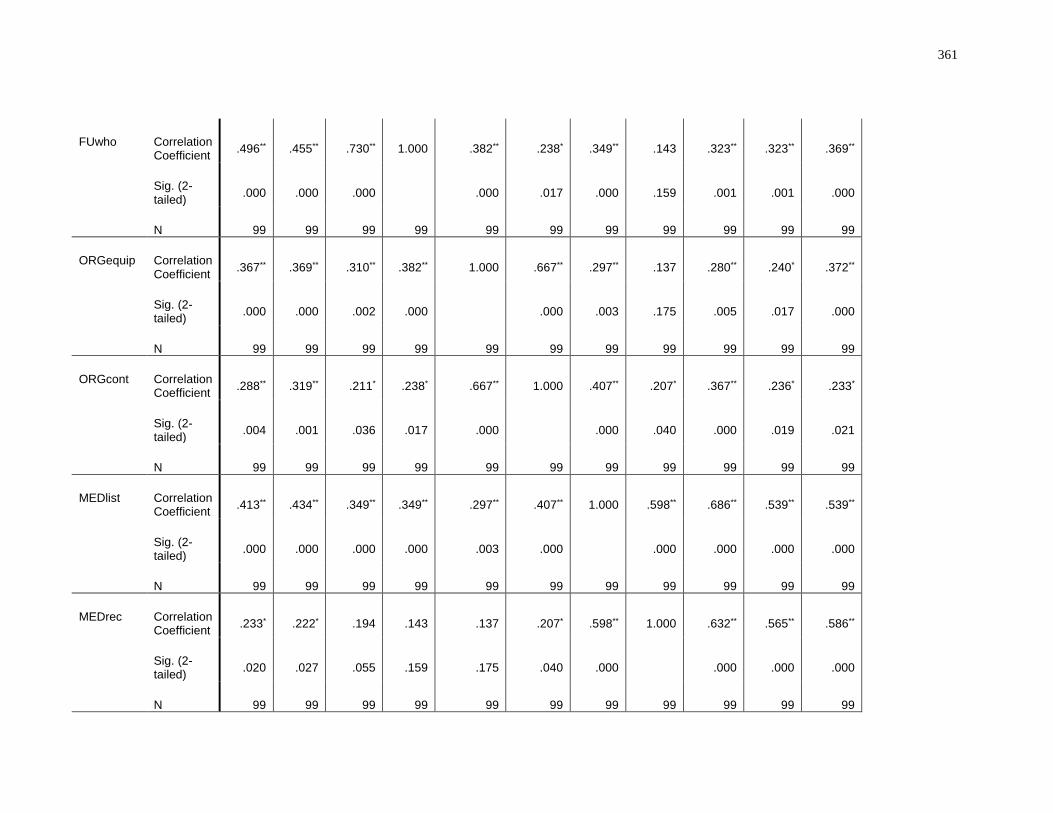
361
FUwho Correlation Coefficient
.496** .455** .730** 1.000 .382** .238* .349** .143 .323** .323** .369**
Sig. (2-tailed)
.000 .000 .000 .000 .017 .000 .159 .001 .001 .000
N 99 99 99 99 99 99 99 99 99 99 99
ORGequip Correlation Coefficient
.367** .369** .310** .382** 1.000 .667** .297** .137 .280** .240* .372**
Sig. (2-tailed)
.000 .000 .002 .000 .000 .003 .175 .005 .017 .000
N 99 99 99 99 99 99 99 99 99 99 99
ORGcont Correlation Coefficient
.288** .319** .211* .238* .667** 1.000 .407** .207* .367** .236* .233*
Sig. (2-tailed)
.004 .001 .036 .017 .000 .000 .040 .000 .019 .021
N 99 99 99 99 99 99 99 99 99 99 99
MEDlist Correlation Coefficient
.413** .434** .349** .349** .297** .407** 1.000 .598** .686** .539** .539**
Sig. (2-tailed)
.000 .000 .000 .000 .003 .000 .000 .000 .000 .000
N 99 99 99 99 99 99 99 99 99 99 99
MEDrec Correlation Coefficient
.233* .222* .194 .143 .137 .207* .598** 1.000 .632** .565** .586**
Sig. (2-tailed)
.020 .027 .055 .159 .175 .040 .000 .000 .000 .000
N 99 99 99 99 99 99 99 99 99 99 99
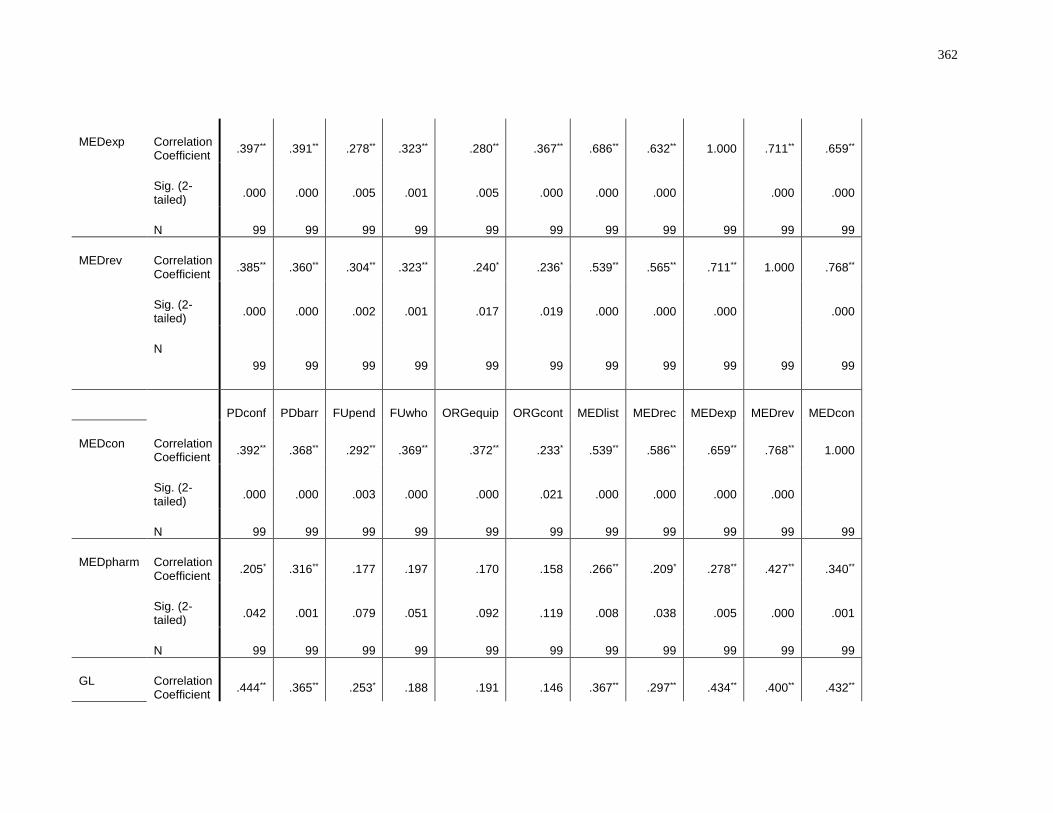
362
MEDexp Correlation Coefficient
.397** .391** .278** .323** .280** .367** .686** .632** 1.000 .711** .659**
Sig. (2-tailed)
.000 .000 .005 .001 .005 .000 .000 .000 .000 .000
N 99 99 99 99 99 99 99 99 99 99 99
MEDrev Correlation Coefficient
.385** .360** .304** .323** .240* .236* .539** .565** .711** 1.000 .768**
Sig. (2-tailed)
.000 .000 .002 .001 .017 .019 .000 .000 .000 .000
N
99 99 99 99 99 99 99 99 99 99 99
PDconf PDbarr FUpend FUwho ORGequip ORGcont MEDlist MEDrec MEDexp MEDrev MEDcon
MEDcon Correlation Coefficient
.392** .368** .292** .369** .372** .233* .539** .586** .659** .768** 1.000
Sig. (2-tailed)
.000 .000 .003 .000 .000 .021 .000 .000 .000 .000
N 99 99 99 99 99 99 99 99 99 99 99
MEDpharm Correlation Coefficient
.205* .316** .177 .197 .170 .158 .266** .209* .278** .427** .340**
Sig. (2-tailed)
.042 .001 .079 .051 .092 .119 .008 .038 .005 .000 .001
N 99 99 99 99 99 99 99 99 99 99 99
GL Correlation Coefficient
.444** .365** .253* .188 .191 .146 .367** .297** .434** .400** .432**
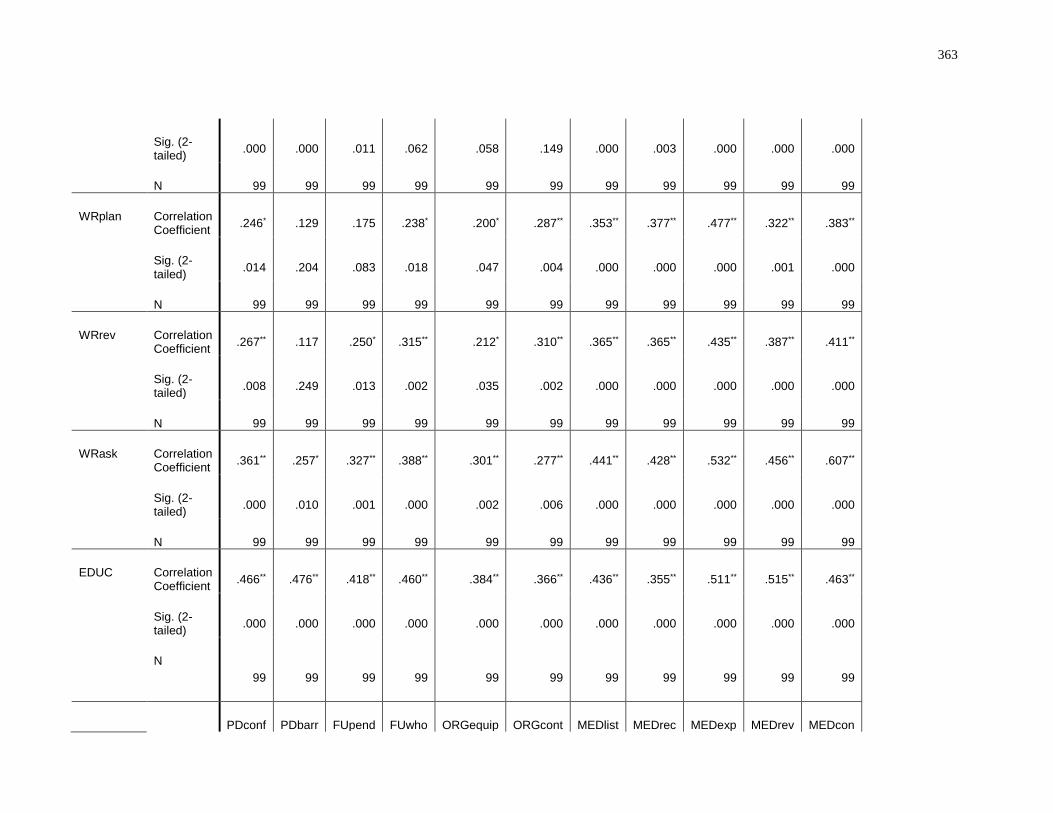
363
Sig. (2-tailed)
.000 .000 .011 .062 .058 .149 .000 .003 .000 .000 .000
N 99 99 99 99 99 99 99 99 99 99 99
WRplan Correlation Coefficient
.246* .129 .175 .238* .200* .287** .353** .377** .477** .322** .383**
Sig. (2-tailed)
.014 .204 .083 .018 .047 .004 .000 .000 .000 .001 .000
N 99 99 99 99 99 99 99 99 99 99 99
WRrev Correlation Coefficient
.267** .117 .250* .315** .212* .310** .365** .365** .435** .387** .411**
Sig. (2-tailed)
.008 .249 .013 .002 .035 .002 .000 .000 .000 .000 .000
N 99 99 99 99 99 99 99 99 99 99 99
WRask Correlation Coefficient
.361** .257* .327** .388** .301** .277** .441** .428** .532** .456** .607**
Sig. (2-tailed)
.000 .010 .001 .000 .002 .006 .000 .000 .000 .000 .000
N 99 99 99 99 99 99 99 99 99 99 99
EDUC Correlation Coefficient
.466** .476** .418** .460** .384** .366** .436** .355** .511** .515** .463**
Sig. (2-tailed)
.000 .000 .000 .000 .000 .000 .000 .000 .000 .000 .000
N
99 99 99 99 99 99 99 99 99 99 99
PDconf PDbarr FUpend FUwho ORGequip ORGcont MEDlist MEDrec MEDexp MEDrev MEDcon
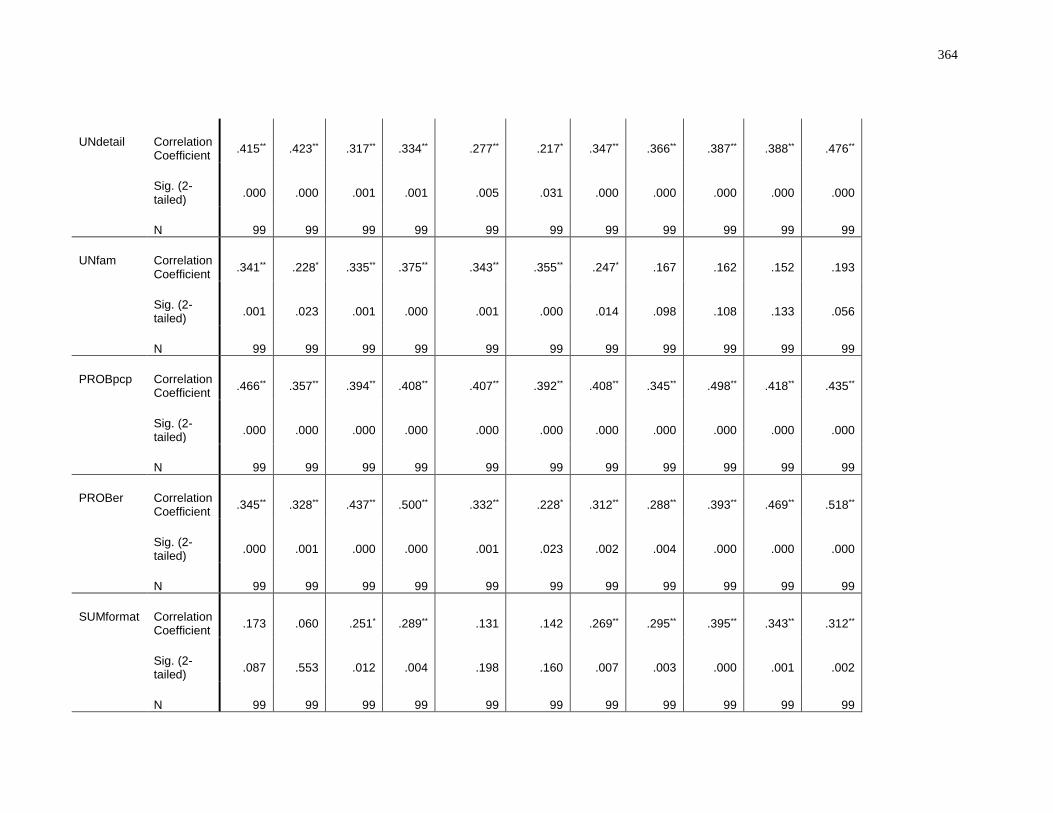
364
UNdetail Correlation Coefficient
.415** .423** .317** .334** .277** .217* .347** .366** .387** .388** .476**
Sig. (2-tailed)
.000 .000 .001 .001 .005 .031 .000 .000 .000 .000 .000
N 99 99 99 99 99 99 99 99 99 99 99
UNfam Correlation Coefficient
.341** .228* .335** .375** .343** .355** .247* .167 .162 .152 .193
Sig. (2-tailed)
.001 .023 .001 .000 .001 .000 .014 .098 .108 .133 .056
N 99 99 99 99 99 99 99 99 99 99 99
PROBpcp Correlation Coefficient
.466** .357** .394** .408** .407** .392** .408** .345** .498** .418** .435**
Sig. (2-tailed)
.000 .000 .000 .000 .000 .000 .000 .000 .000 .000 .000
N 99 99 99 99 99 99 99 99 99 99 99
PROBer Correlation Coefficient
.345** .328** .437** .500** .332** .228* .312** .288** .393** .469** .518**
Sig. (2-tailed)
.000 .001 .000 .000 .001 .023 .002 .004 .000 .000 .000
N 99 99 99 99 99 99 99 99 99 99 99
SUMformat Correlation Coefficient
.173 .060 .251* .289** .131 .142 .269** .295** .395** .343** .312**
Sig. (2-tailed)
.087 .553 .012 .004 .198 .160 .007 .003 .000 .001 .002
N 99 99 99 99 99 99 99 99 99 99 99
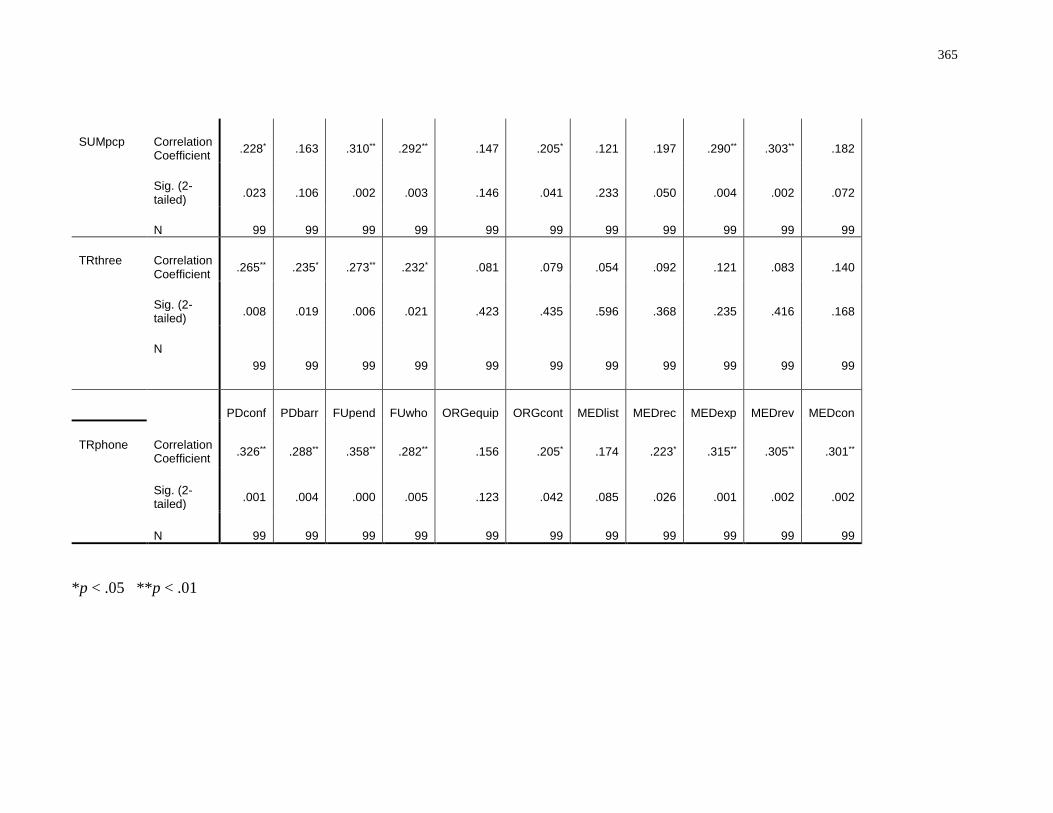
365
SUMpcp Correlation Coefficient
.228* .163 .310** .292** .147 .205* .121 .197 .290** .303** .182
Sig. (2-tailed)
.023 .106 .002 .003 .146 .041 .233 .050 .004 .002 .072
N 99 99 99 99 99 99 99 99 99 99 99
TRthree Correlation Coefficient
.265** .235* .273** .232* .081 .079 .054 .092 .121 .083 .140
Sig. (2-tailed)
.008 .019 .006 .021 .423 .435 .596 .368 .235 .416 .168
N
99 99 99 99 99 99 99 99 99 99 99
PDconf PDbarr FUpend FUwho ORGequip ORGcont MEDlist MEDrec MEDexp MEDrev MEDcon
TRphone Correlation Coefficient
.326** .288** .358** .282** .156 .205* .174 .223* .315** .305** .301**
Sig. (2-tailed)
.001 .004 .000 .005 .123 .042 .085 .026 .001 .002 .002
N 99 99 99 99 99 99 99 99 99 99 99
*p < .05 **p < .01
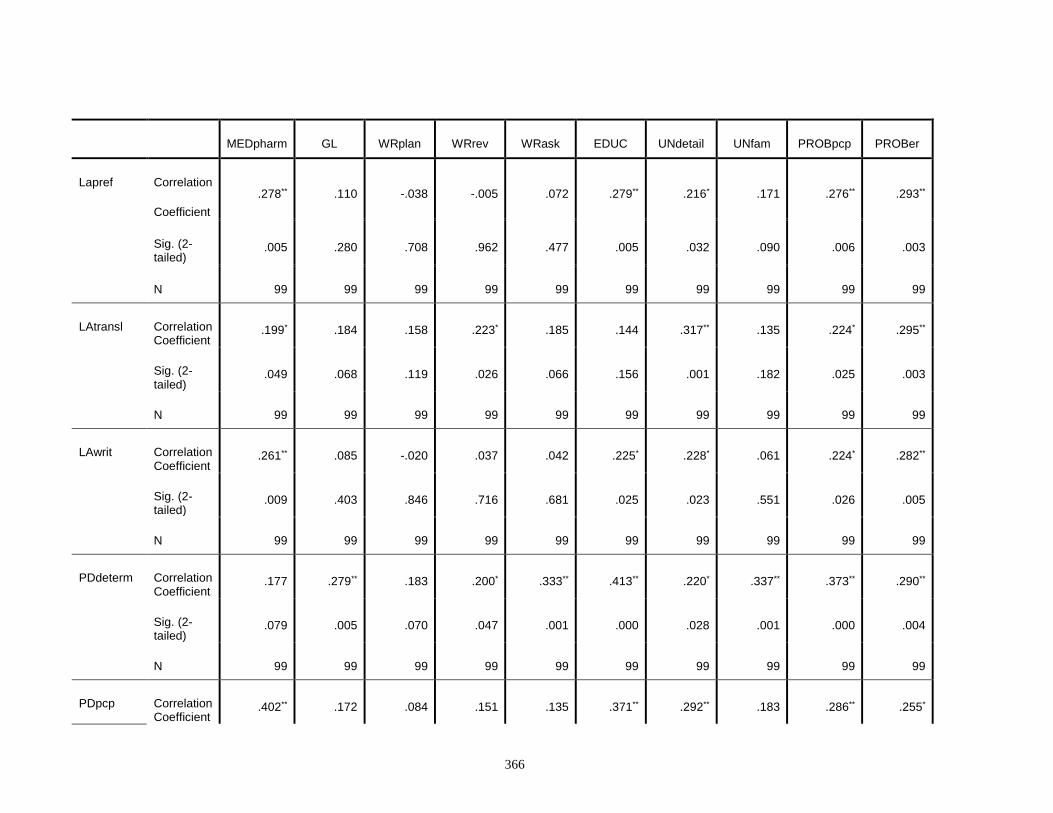
366
MEDpharm GL WRplan WRrev WRask EDUC UNdetail UNfam PROBpcp PROBer
Lapref Correlation
Coefficient
.278** .110 -.038 -.005 .072 .279** .216* .171 .276** .293**
Sig. (2-tailed)
.005 .280 .708 .962 .477 .005 .032 .090 .006 .003
N 99 99 99 99 99 99 99 99 99 99
LAtransl Correlation Coefficient
.199* .184 .158 .223* .185 .144 .317** .135 .224* .295**
Sig. (2-tailed)
.049 .068 .119 .026 .066 .156 .001 .182 .025 .003
N 99 99 99 99 99 99 99 99 99 99
LAwrit Correlation Coefficient
.261** .085 -.020 .037 .042 .225* .228* .061 .224* .282**
Sig. (2-tailed)
.009 .403 .846 .716 .681 .025 .023 .551 .026 .005
N 99 99 99 99 99 99 99 99 99 99
PDdeterm Correlation Coefficient
.177 .279** .183 .200* .333** .413** .220* .337** .373** .290**
Sig. (2-tailed)
.079 .005 .070 .047 .001 .000 .028 .001 .000 .004
N 99 99 99 99 99 99 99 99 99 99
PDpcp Correlation Coefficient
.402** .172 .084 .151 .135 .371** .292** .183 .286** .255*

367
Sig. (2-tailed)
.000 .088 .411 .135 .183 .000 .003 .070 .004 .011
N 99 99 99 99 99 99 99 99 99 99
PDfuture Correlation Coefficient
.073 .246* .185 .166 .298** .310** .157 .285** .268** .278**
Sig. (2-tailed)
.473 .014 .067 .100 .003 .002 .120 .004 .007 .005
N 99 99 99 99 99 99 99 99 99 99
PDapp Correlation Coefficient
.195 .216* .269** .274** .317** .199* .175 .239* .280** .217*
Sig. (2-tailed)
.054 .032 .007 .006 .001 .048 .083 .017 .005 .031
N 99 99 99 99 99 99 99 99 99 99
MEDpharm GL WRplan WRrev WRask EDUC UNdetail UNfam PROBpcp PROBer
PDinput Correlation Coefficient
.223* .153 -.049 -.025 .066 .175 .169 .163 .157 .138
Sig. (2-tailed)
.027 .131 .629 .803 .515 .083 .095 .107 .120 .174
N 99 99 99 99 99 99 99 99 99 99
PDtest Correlation Coefficient
.007 .229* .198* .172 .331** .282** .362** .321** .395** .312**
Sig. (2-tailed)
.949 .023 .050 .088 .001 .005 .000 .001 .000 .002
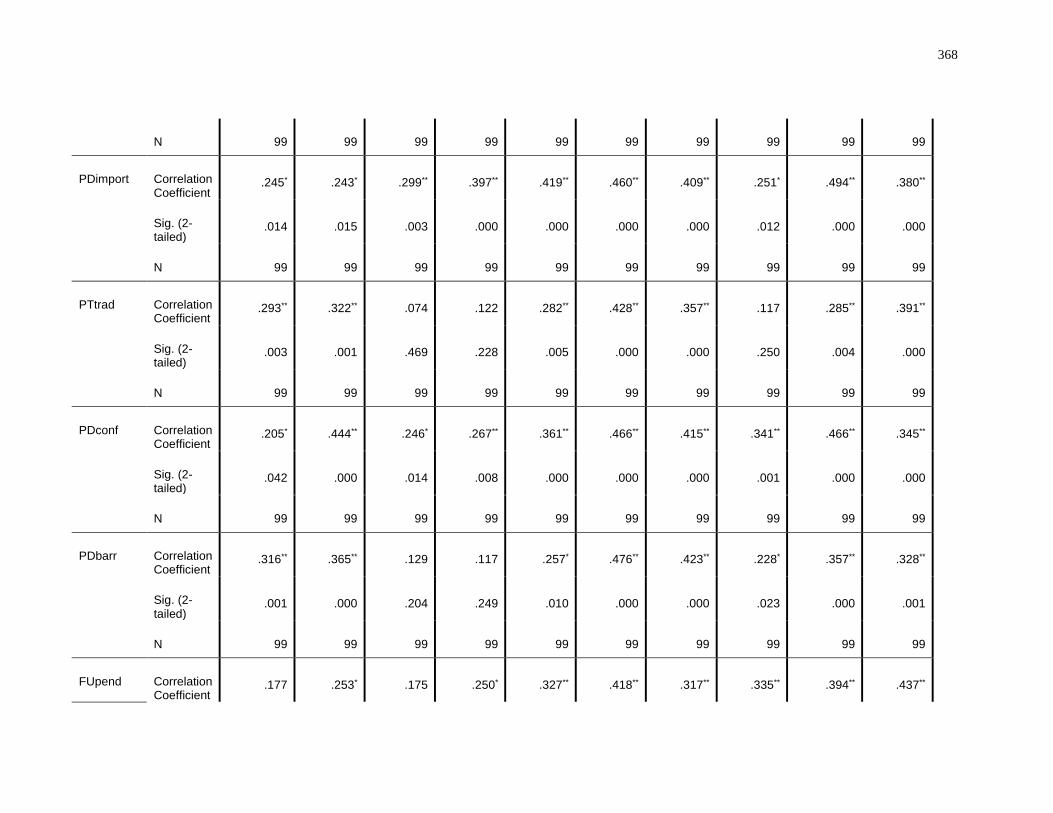
368
N 99 99 99 99 99 99 99 99 99 99
PDimport Correlation Coefficient
.245* .243* .299** .397** .419** .460** .409** .251* .494** .380**
Sig. (2-tailed)
.014 .015 .003 .000 .000 .000 .000 .012 .000 .000
N 99 99 99 99 99 99 99 99 99 99
PTtrad Correlation Coefficient
.293** .322** .074 .122 .282** .428** .357** .117 .285** .391**
Sig. (2-tailed)
.003 .001 .469 .228 .005 .000 .000 .250 .004 .000
N 99 99 99 99 99 99 99 99 99 99
PDconf Correlation Coefficient
.205* .444** .246* .267** .361** .466** .415** .341** .466** .345**
Sig. (2-tailed)
.042 .000 .014 .008 .000 .000 .000 .001 .000 .000
N 99 99 99 99 99 99 99 99 99 99
PDbarr Correlation Coefficient
.316** .365** .129 .117 .257* .476** .423** .228* .357** .328**
Sig. (2-tailed)
.001 .000 .204 .249 .010 .000 .000 .023 .000 .001
N 99 99 99 99 99 99 99 99 99 99
FUpend Correlation Coefficient
.177 .253* .175 .250* .327** .418** .317** .335** .394** .437**
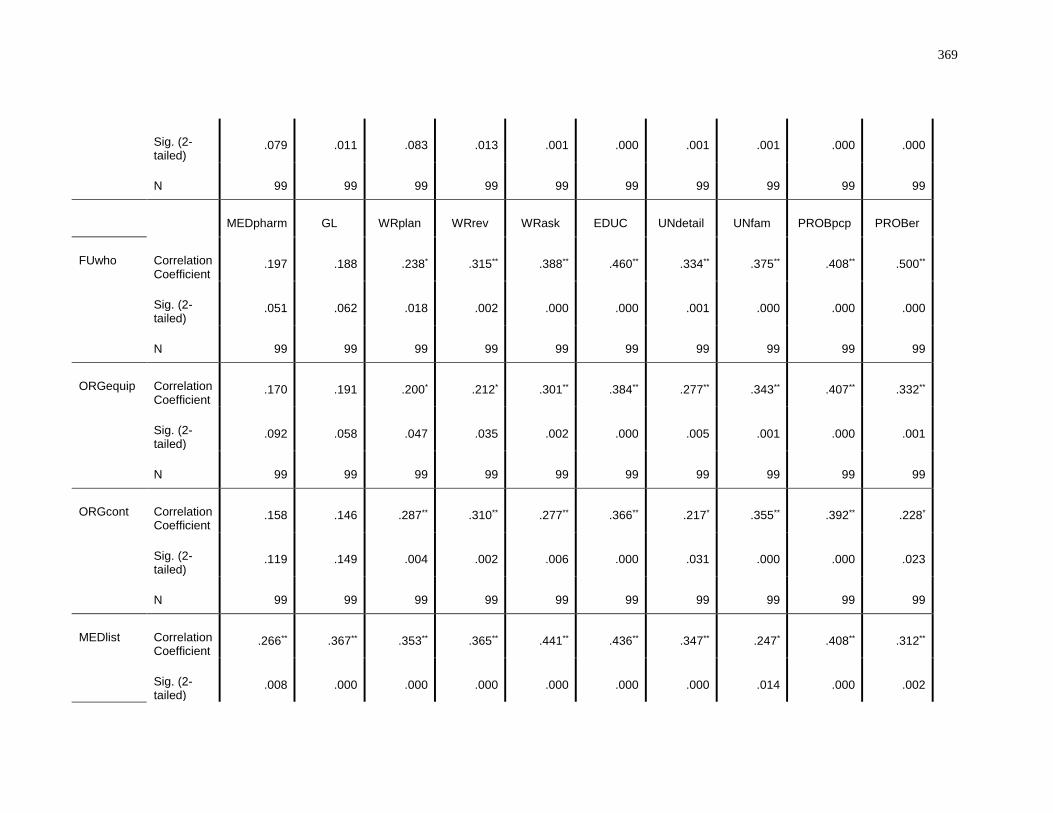
369
Sig. (2-tailed)
.079 .011 .083 .013 .001 .000 .001 .001 .000 .000
N 99 99 99 99 99 99 99 99 99 99
MEDpharm GL WRplan WRrev WRask EDUC UNdetail UNfam PROBpcp PROBer
FUwho Correlation Coefficient
.197 .188 .238* .315** .388** .460** .334** .375** .408** .500**
Sig. (2-tailed)
.051 .062 .018 .002 .000 .000 .001 .000 .000 .000
N 99 99 99 99 99 99 99 99 99 99
ORGequip Correlation Coefficient
.170 .191 .200* .212* .301** .384** .277** .343** .407** .332**
Sig. (2-tailed)
.092 .058 .047 .035 .002 .000 .005 .001 .000 .001
N 99 99 99 99 99 99 99 99 99 99
ORGcont Correlation Coefficient
.158 .146 .287** .310** .277** .366** .217* .355** .392** .228*
Sig. (2-tailed)
.119 .149 .004 .002 .006 .000 .031 .000 .000 .023
N 99 99 99 99 99 99 99 99 99 99
MEDlist Correlation Coefficient
.266** .367** .353** .365** .441** .436** .347** .247* .408** .312**
Sig. (2-tailed)
.008 .000 .000 .000 .000 .000 .000 .014 .000 .002
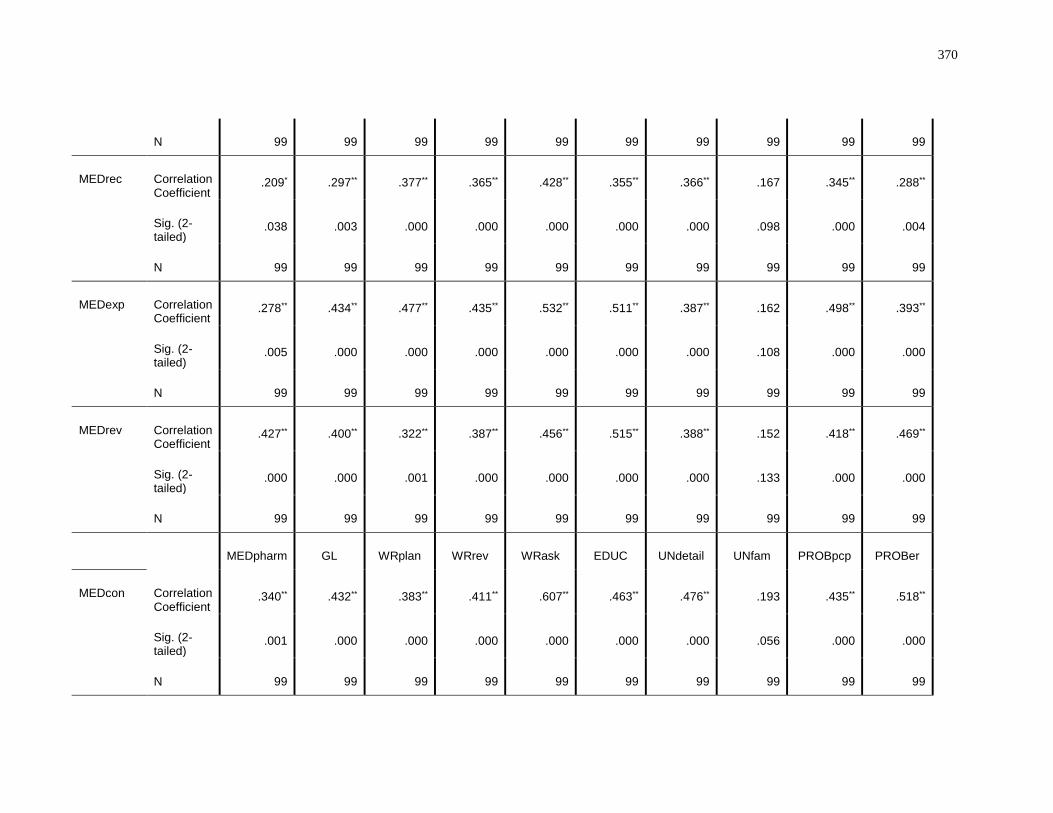
370
N 99 99 99 99 99 99 99 99 99 99
MEDrec Correlation Coefficient
.209* .297** .377** .365** .428** .355** .366** .167 .345** .288**
Sig. (2-tailed)
.038 .003 .000 .000 .000 .000 .000 .098 .000 .004
N 99 99 99 99 99 99 99 99 99 99
MEDexp Correlation Coefficient
.278** .434** .477** .435** .532** .511** .387** .162 .498** .393**
Sig. (2-tailed)
.005 .000 .000 .000 .000 .000 .000 .108 .000 .000
N 99 99 99 99 99 99 99 99 99 99
MEDrev Correlation Coefficient
.427** .400** .322** .387** .456** .515** .388** .152 .418** .469**
Sig. (2-tailed)
.000 .000 .001 .000 .000 .000 .000 .133 .000 .000
N 99 99 99 99 99 99 99 99 99 99
MEDpharm GL WRplan WRrev WRask EDUC UNdetail UNfam PROBpcp PROBer
MEDcon Correlation Coefficient
.340** .432** .383** .411** .607** .463** .476** .193 .435** .518**
Sig. (2-tailed)
.001 .000 .000 .000 .000 .000 .000 .056 .000 .000
N 99 99 99 99 99 99 99 99 99 99
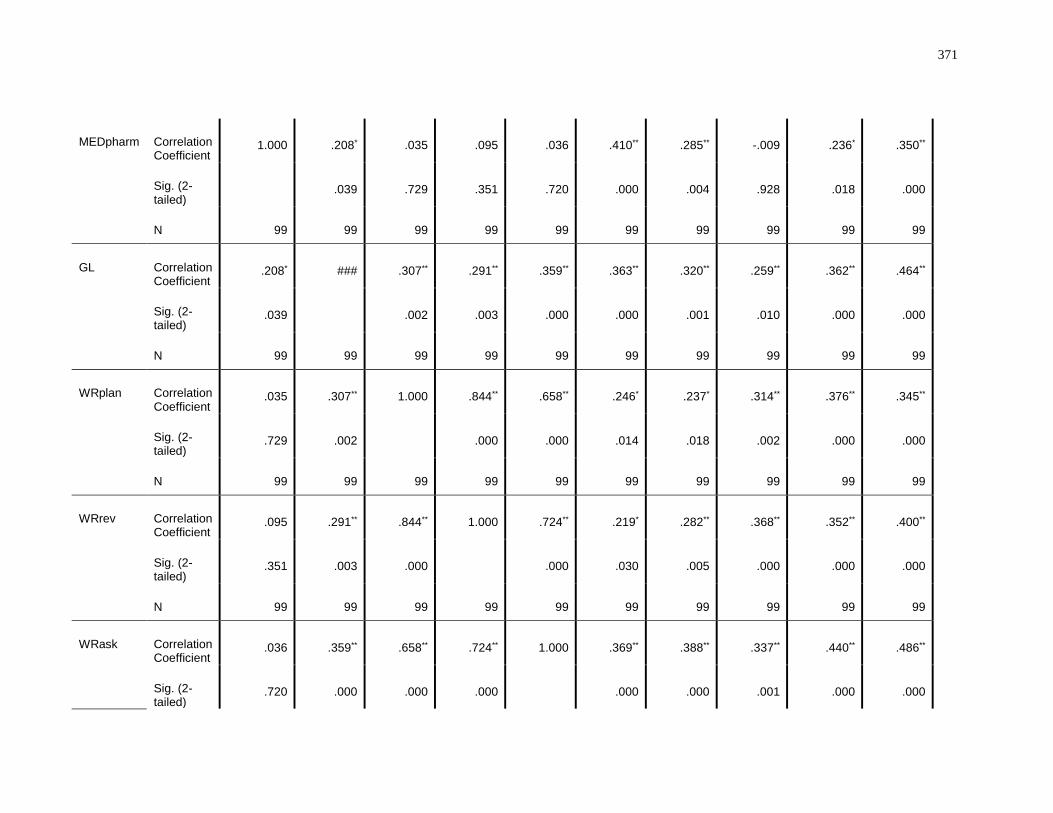
371
MEDpharm Correlation Coefficient
1.000 .208* .035 .095 .036 .410** .285** -.009 .236* .350**
Sig. (2-tailed)
.039 .729 .351 .720 .000 .004 .928 .018 .000
N 99 99 99 99 99 99 99 99 99 99
GL Correlation Coefficient
.208* ### .307** .291** .359** .363** .320** .259** .362** .464**
Sig. (2-tailed)
.039 .002 .003 .000 .000 .001 .010 .000 .000
N 99 99 99 99 99 99 99 99 99 99
WRplan Correlation Coefficient
.035 .307** 1.000 .844** .658** .246* .237* .314** .376** .345**
Sig. (2-tailed)
.729 .002 .000 .000 .014 .018 .002 .000 .000
N 99 99 99 99 99 99 99 99 99 99
WRrev Correlation Coefficient
.095 .291** .844** 1.000 .724** .219* .282** .368** .352** .400**
Sig. (2-tailed)
.351 .003 .000 .000 .030 .005 .000 .000 .000
N 99 99 99 99 99 99 99 99 99 99
WRask Correlation Coefficient
.036 .359** .658** .724** 1.000 .369** .388** .337** .440** .486**
Sig. (2-tailed)
.720 .000 .000 .000 .000 .000 .001 .000 .000
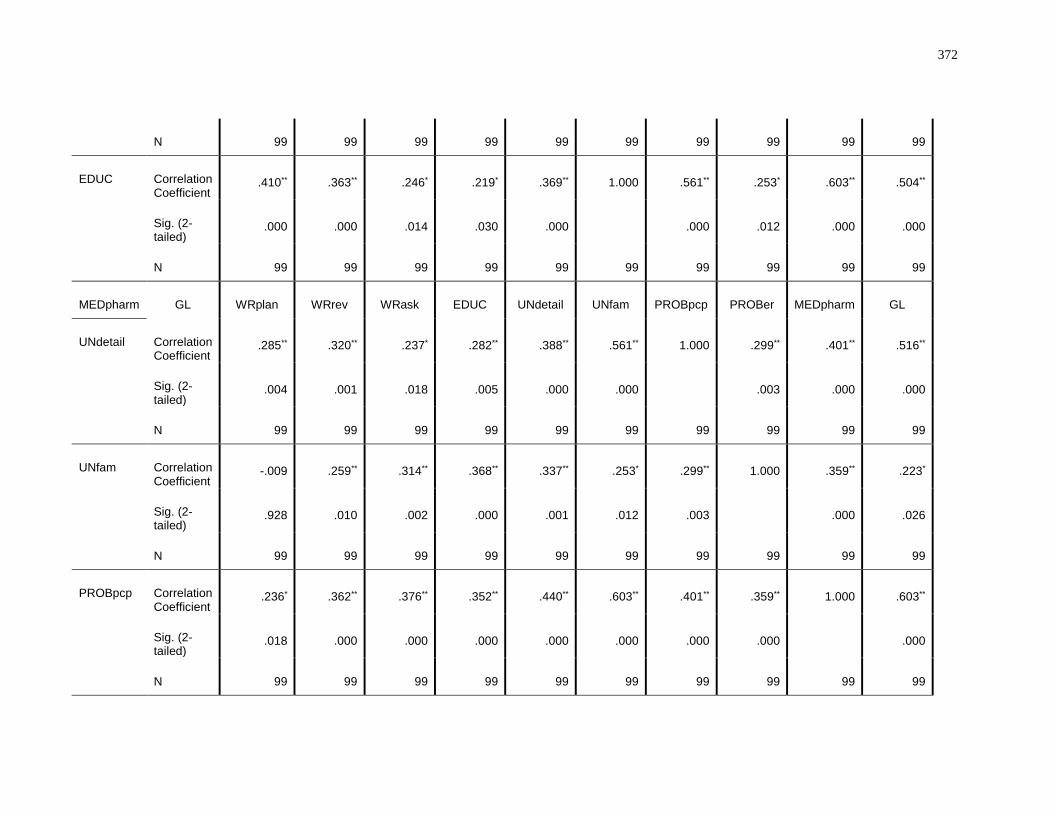
372
N 99 99 99 99 99 99 99 99 99 99
EDUC Correlation Coefficient
.410** .363** .246* .219* .369** 1.000 .561** .253* .603** .504**
Sig. (2-tailed)
.000 .000 .014 .030 .000 .000 .012 .000 .000
N 99 99 99 99 99 99 99 99 99 99
MEDpharm GL WRplan WRrev WRask EDUC UNdetail UNfam PROBpcp PROBer MEDpharm GL
UNdetail Correlation Coefficient
.285** .320** .237* .282** .388** .561** 1.000 .299** .401** .516**
Sig. (2-tailed)
.004 .001 .018 .005 .000 .000 .003 .000 .000
N 99 99 99 99 99 99 99 99 99 99
UNfam Correlation Coefficient
-.009 .259** .314** .368** .337** .253* .299** 1.000 .359** .223*
Sig. (2-tailed)
.928 .010 .002 .000 .001 .012 .003 .000 .026
N 99 99 99 99 99 99 99 99 99 99
PROBpcp Correlation Coefficient
.236* .362** .376** .352** .440** .603** .401** .359** 1.000 .603**
Sig. (2-tailed)
.018 .000 .000 .000 .000 .000 .000 .000 .000
N 99 99 99 99 99 99 99 99 99 99
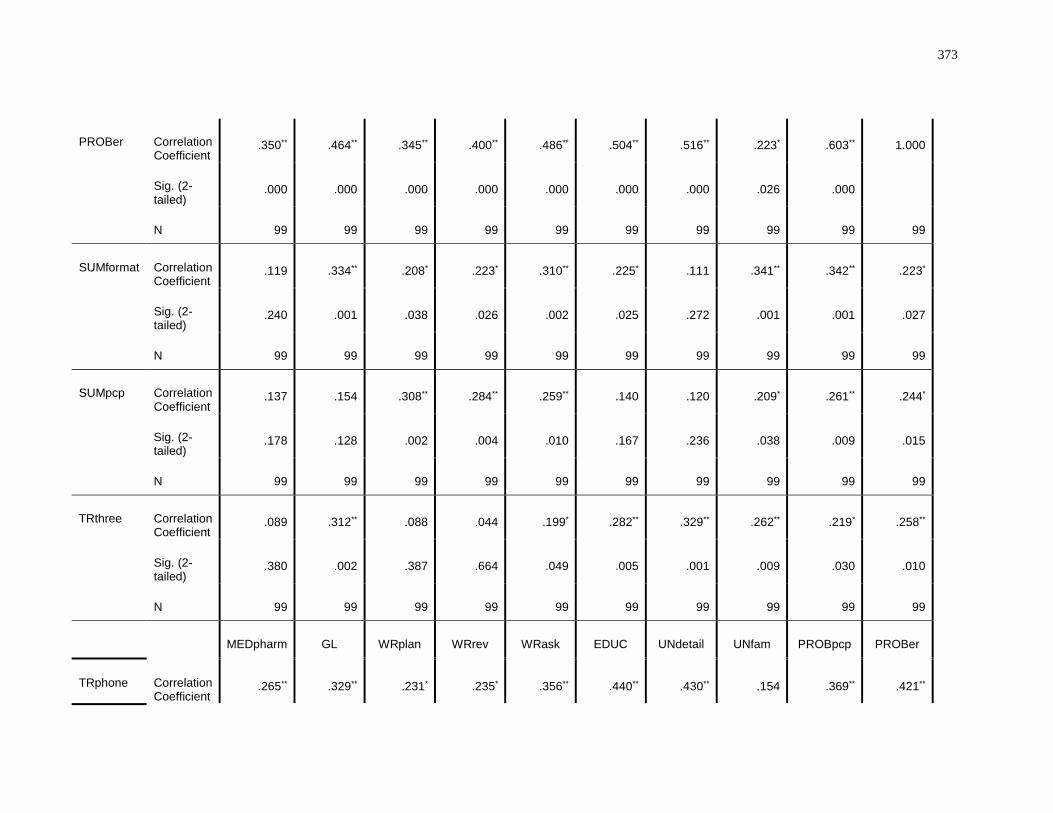
373
PROBer Correlation Coefficient
.350** .464** .345** .400** .486** .504** .516** .223* .603** 1.000
Sig. (2-tailed)
.000 .000 .000 .000 .000 .000 .000 .026 .000
N 99 99 99 99 99 99 99 99 99 99
SUMformat Correlation Coefficient
.119 .334** .208* .223* .310** .225* .111 .341** .342** .223*
Sig. (2-tailed)
.240 .001 .038 .026 .002 .025 .272 .001 .001 .027
N 99 99 99 99 99 99 99 99 99 99
SUMpcp Correlation Coefficient
.137 .154 .308** .284** .259** .140 .120 .209* .261** .244*
Sig. (2-tailed)
.178 .128 .002 .004 .010 .167 .236 .038 .009 .015
N 99 99 99 99 99 99 99 99 99 99
TRthree Correlation Coefficient
.089 .312** .088 .044 .199* .282** .329** .262** .219* .258**
Sig. (2-tailed)
.380 .002 .387 .664 .049 .005 .001 .009 .030 .010
N 99 99 99 99 99 99 99 99 99 99
MEDpharm GL WRplan WRrev WRask EDUC UNdetail UNfam PROBpcp PROBer
TRphone Correlation Coefficient
.265** .329** .231* .235* .356** .440** .430** .154 .369** .421**
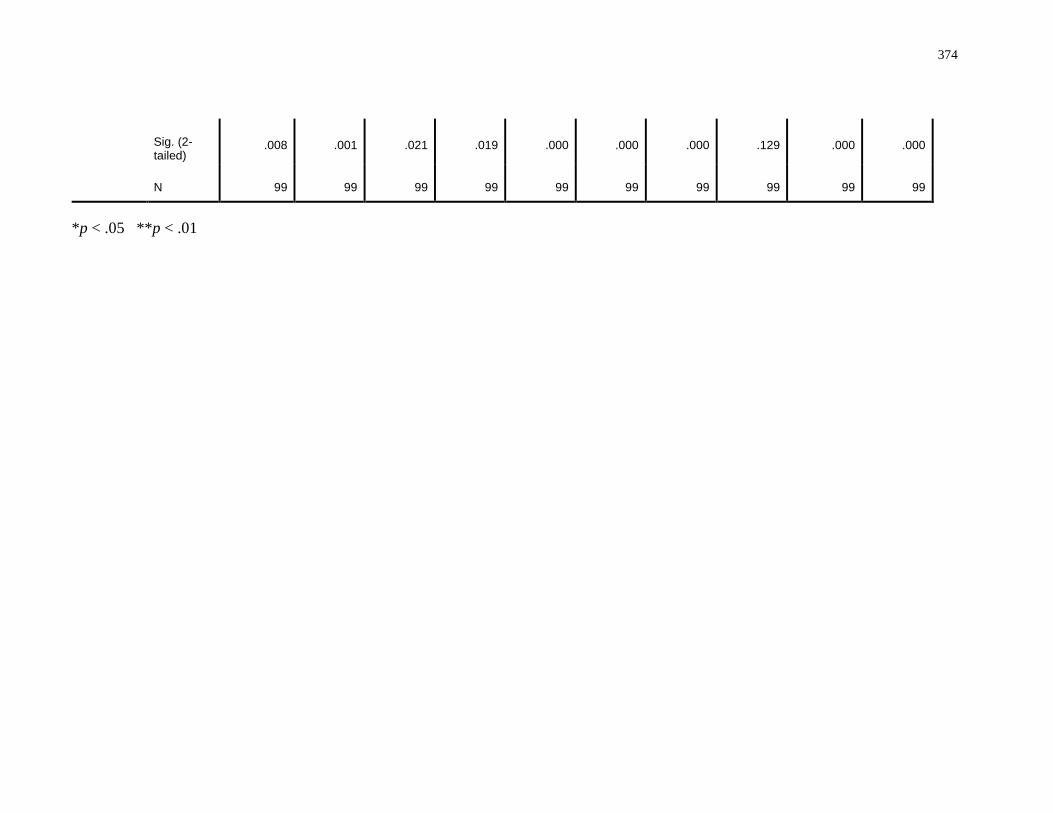
374
Sig. (2-tailed)
.008 .001 .021 .019 .000 .000 .000 .129 .000 .000
N 99 99 99 99 99 99 99 99 99 99
*p < .05 **p < .01
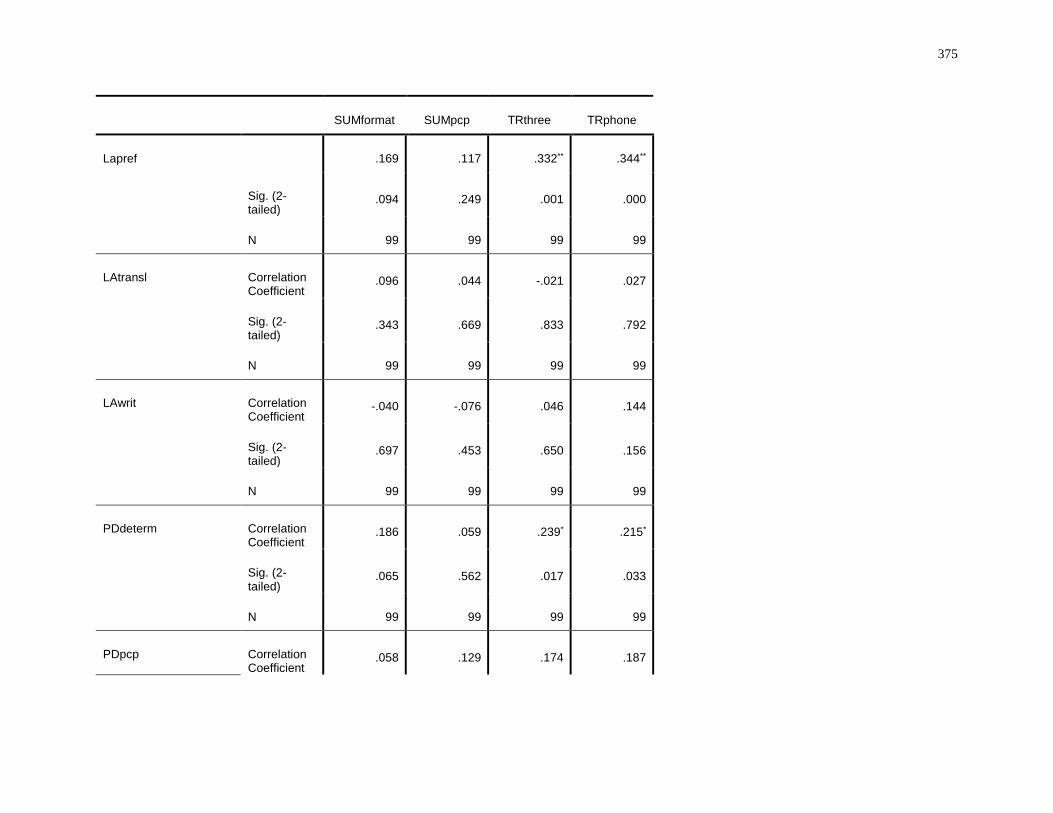
375
SUMformat SUMpcp TRthree TRphone
Lapref .169 .117 .332** .344**
Sig. (2-tailed)
.094 .249 .001 .000
N 99 99 99 99
LAtransl Correlation Coefficient
.096 .044 -.021 .027
Sig. (2-tailed)
.343 .669 .833 .792
N 99 99 99 99
LAwrit Correlation Coefficient
-.040 -.076 .046 .144
Sig. (2-tailed)
.697 .453 .650 .156
N 99 99 99 99
PDdeterm Correlation Coefficient
.186 .059 .239* .215*
Sig. (2-tailed)
.065 .562 .017 .033
N 99 99 99 99
PDpcp Correlation Coefficient
.058 .129 .174 .187
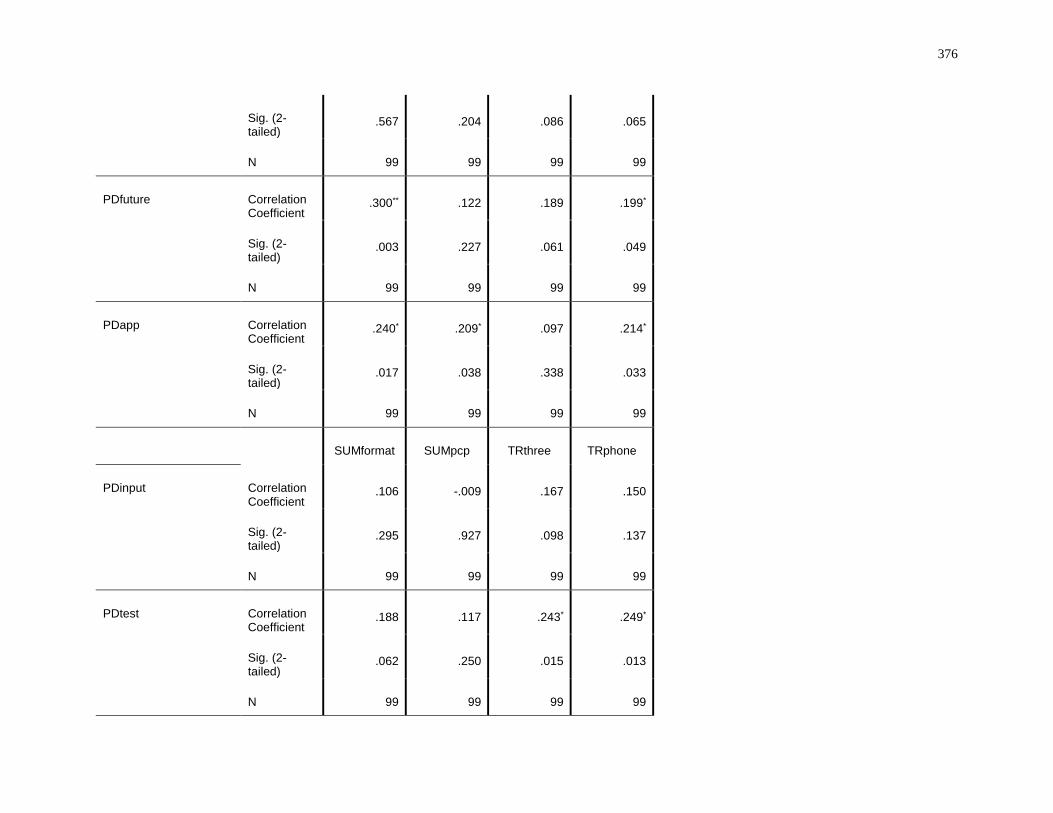
376
Sig. (2-tailed)
.567 .204 .086 .065
N 99 99 99 99
PDfuture Correlation Coefficient
.300** .122 .189 .199*
Sig. (2-tailed)
.003 .227 .061 .049
N 99 99 99 99
PDapp Correlation Coefficient
.240* .209* .097 .214*
Sig. (2-tailed)
.017 .038 .338 .033
N 99 99 99 99
SUMformat SUMpcp TRthree TRphone
PDinput Correlation Coefficient
.106 -.009 .167 .150
Sig. (2-tailed)
.295 .927 .098 .137
N 99 99 99 99
PDtest Correlation Coefficient
.188 .117 .243* .249*
Sig. (2-tailed)
.062 .250 .015 .013
N 99 99 99 99
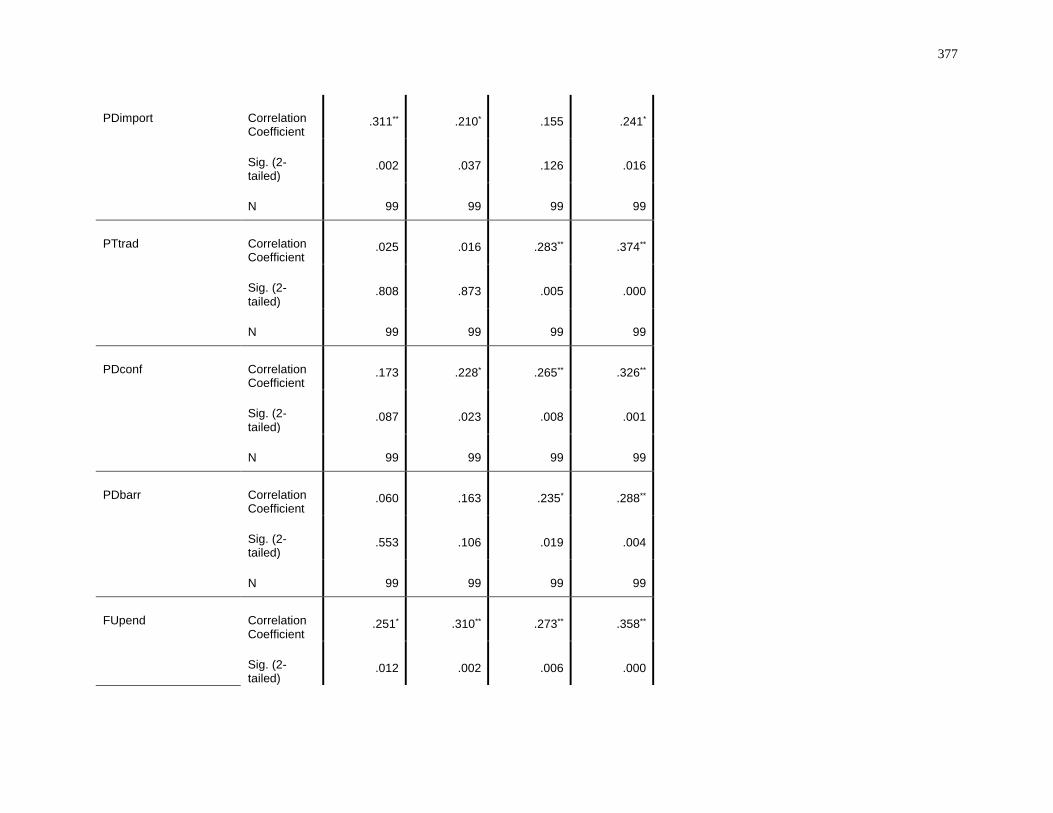
377
PDimport Correlation Coefficient
.311** .210* .155 .241*
Sig. (2-tailed)
.002 .037 .126 .016
N 99 99 99 99
PTtrad Correlation Coefficient
.025 .016 .283** .374**
Sig. (2-tailed)
.808 .873 .005 .000
N 99 99 99 99
PDconf Correlation Coefficient
.173 .228* .265** .326**
Sig. (2-tailed)
.087 .023 .008 .001
N 99 99 99 99
PDbarr Correlation Coefficient
.060 .163 .235* .288**
Sig. (2-tailed)
.553 .106 .019 .004
N 99 99 99 99
FUpend Correlation Coefficient
.251* .310** .273** .358**
Sig. (2-tailed)
.012 .002 .006 .000
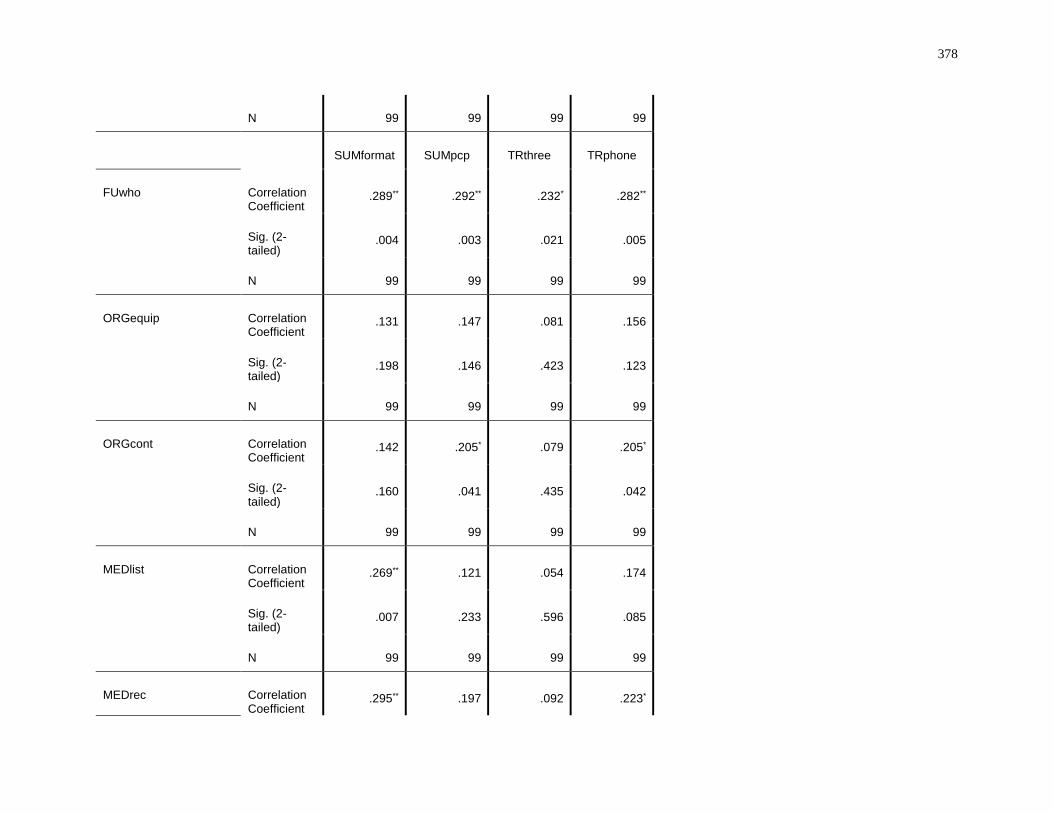
378
N 99 99 99 99
SUMformat SUMpcp TRthree TRphone
FUwho Correlation Coefficient
.289** .292** .232* .282**
Sig. (2-tailed)
.004 .003 .021 .005
N 99 99 99 99
ORGequip Correlation Coefficient
.131 .147 .081 .156
Sig. (2-tailed)
.198 .146 .423 .123
N 99 99 99 99
ORGcont Correlation Coefficient
.142 .205* .079 .205*
Sig. (2-tailed)
.160 .041 .435 .042
N 99 99 99 99
MEDlist Correlation Coefficient
.269** .121 .054 .174
Sig. (2-tailed)
.007 .233 .596 .085
N 99 99 99 99
MEDrec Correlation Coefficient
.295** .197 .092 .223*
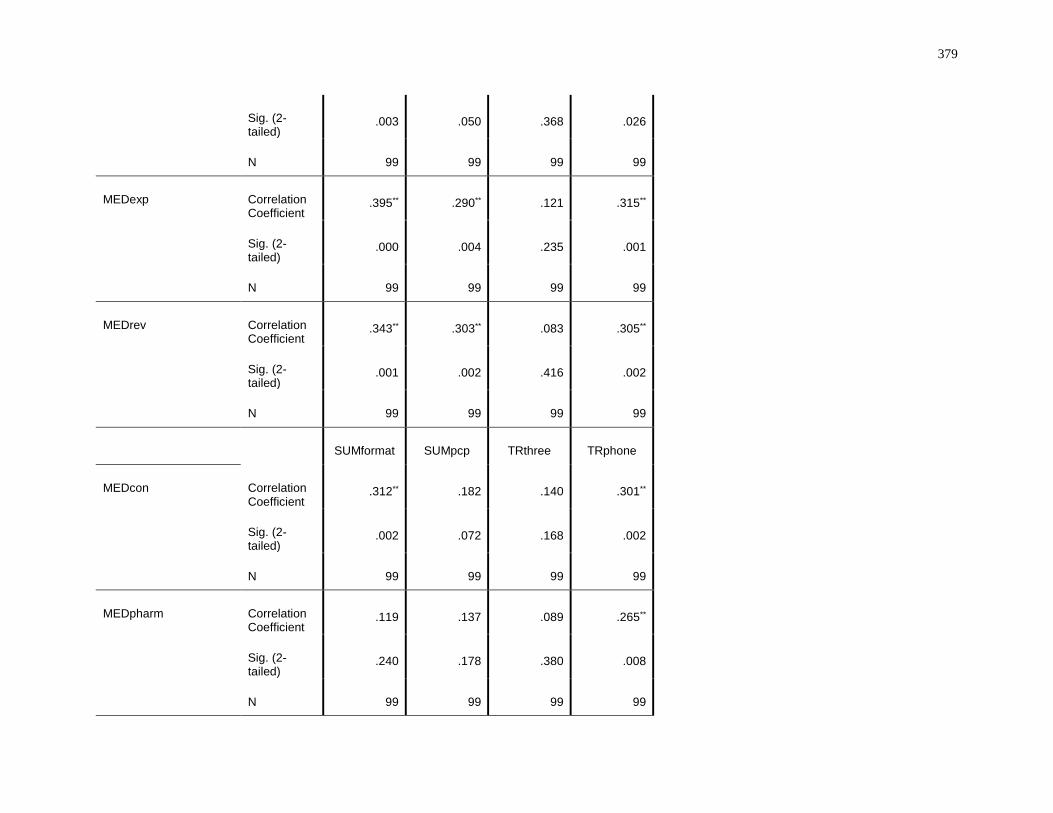
379
Sig. (2-tailed)
.003 .050 .368 .026
N 99 99 99 99
MEDexp Correlation Coefficient
.395** .290** .121 .315**
Sig. (2-tailed)
.000 .004 .235 .001
N 99 99 99 99
MEDrev Correlation Coefficient
.343** .303** .083 .305**
Sig. (2-tailed)
.001 .002 .416 .002
N 99 99 99 99
SUMformat SUMpcp TRthree TRphone
MEDcon Correlation Coefficient
.312** .182 .140 .301**
Sig. (2-tailed)
.002 .072 .168 .002
N 99 99 99 99
MEDpharm Correlation Coefficient
.119 .137 .089 .265**
Sig. (2-tailed)
.240 .178 .380 .008
N 99 99 99 99
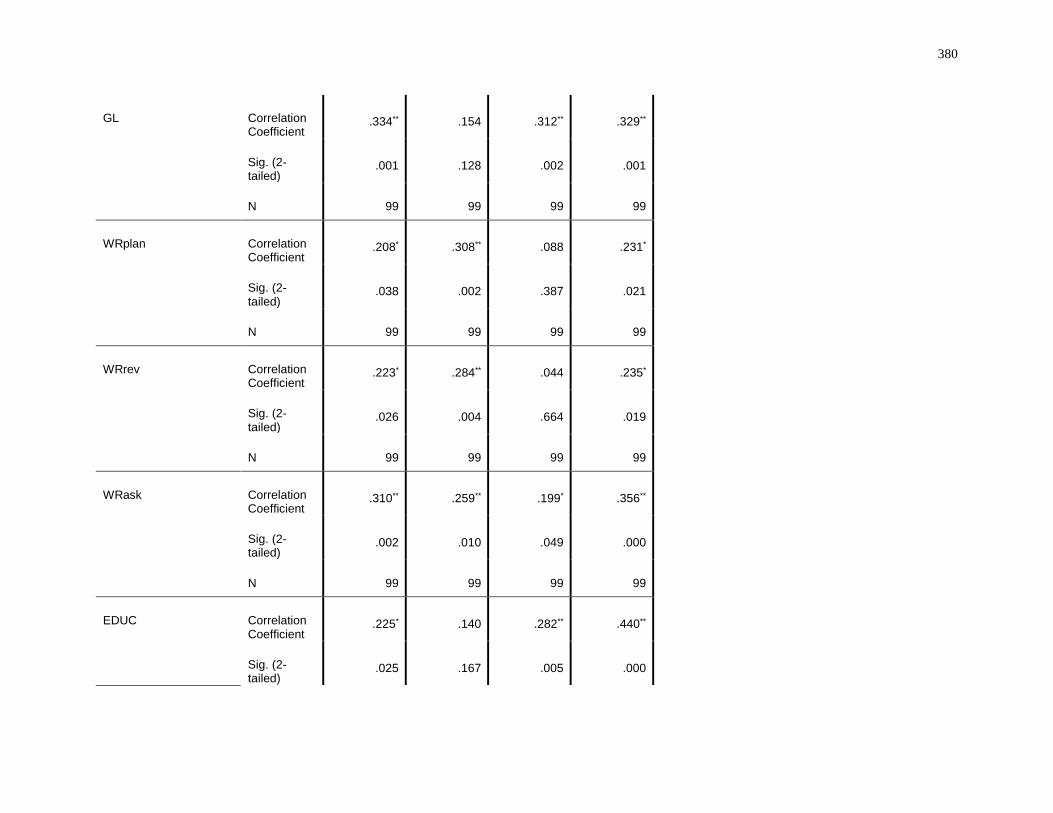
380
GL Correlation Coefficient
.334** .154 .312** .329**
Sig. (2-tailed)
.001 .128 .002 .001
N 99 99 99 99
WRplan Correlation Coefficient
.208* .308** .088 .231*
Sig. (2-tailed)
.038 .002 .387 .021
N 99 99 99 99
WRrev Correlation Coefficient
.223* .284** .044 .235*
Sig. (2-tailed)
.026 .004 .664 .019
N 99 99 99 99
WRask Correlation Coefficient
.310** .259** .199* .356**
Sig. (2-tailed)
.002 .010 .049 .000
N 99 99 99 99
EDUC Correlation Coefficient
.225* .140 .282** .440**
Sig. (2-tailed)
.025 .167 .005 .000
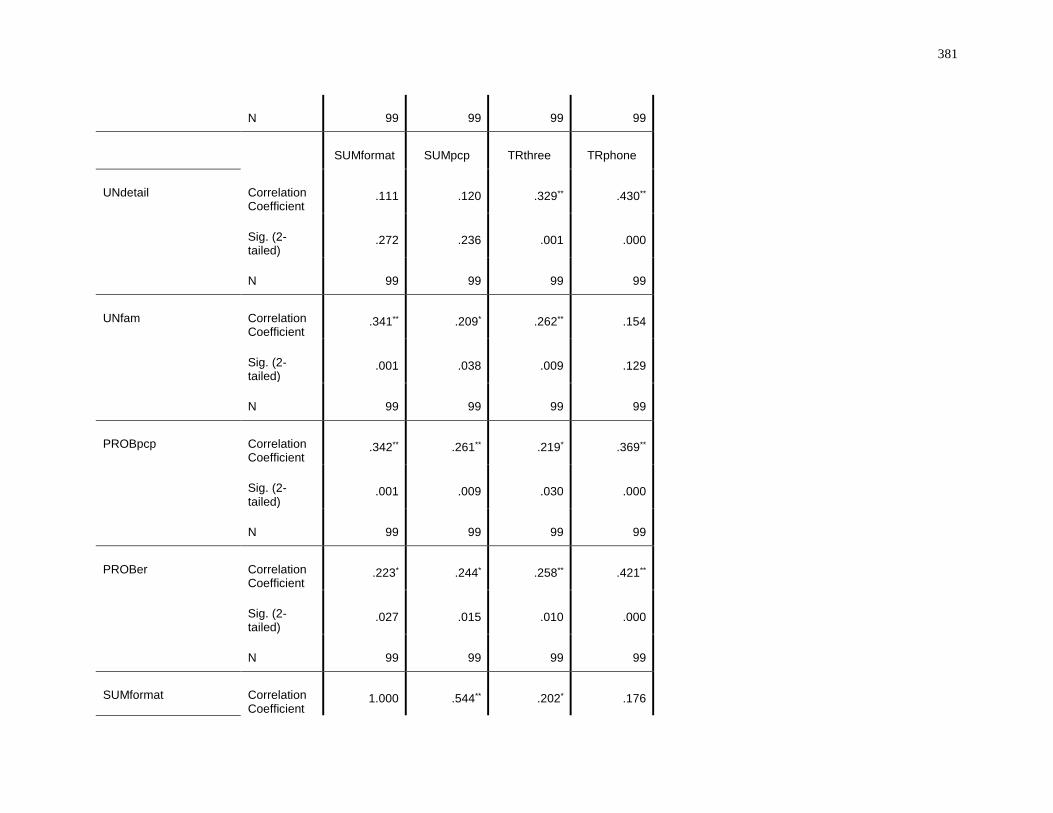
381
N 99 99 99 99
SUMformat SUMpcp TRthree TRphone
UNdetail Correlation Coefficient
.111 .120 .329** .430**
Sig. (2-tailed)
.272 .236 .001 .000
N 99 99 99 99
UNfam Correlation Coefficient
.341** .209* .262** .154
Sig. (2-tailed)
.001 .038 .009 .129
N 99 99 99 99
PROBpcp Correlation Coefficient
.342** .261** .219* .369**
Sig. (2-tailed)
.001 .009 .030 .000
N 99 99 99 99
PROBer Correlation Coefficient
.223* .244* .258** .421**
Sig. (2-tailed)
.027 .015 .010 .000
N 99 99 99 99
SUMformat Correlation Coefficient
1.000 .544** .202* .176
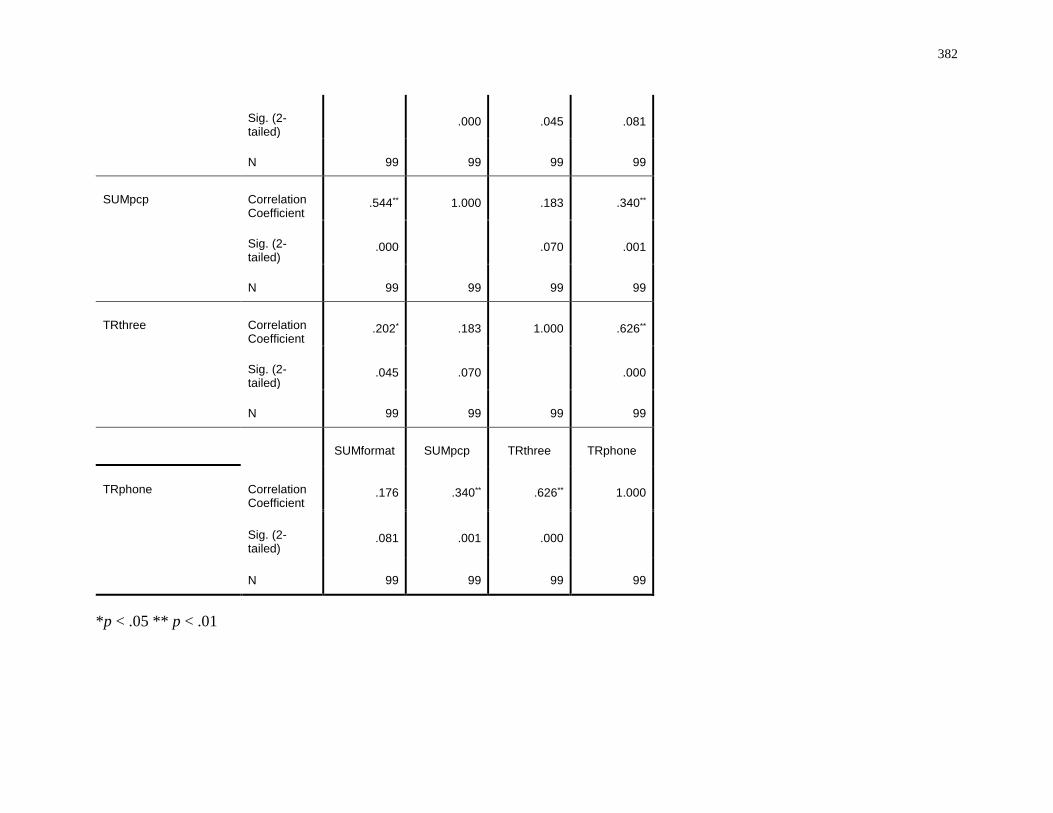
382
Sig. (2-tailed)
.000 .045 .081
N 99 99 99 99
SUMpcp Correlation Coefficient
.544** 1.000 .183 .340**
Sig. (2-tailed)
.000 .070 .001
N 99 99 99 99
TRthree Correlation Coefficient
.202* .183 1.000 .626**
Sig. (2-tailed)
.045 .070 .000
N 99 99 99 99
SUMformat SUMpcp TRthree TRphone
TRphone Correlation Coefficient
.176 .340** .626** 1.000
Sig. (2-tailed)
.081 .001 .000
N 99 99 99 99
*p < .05 ** p < .01
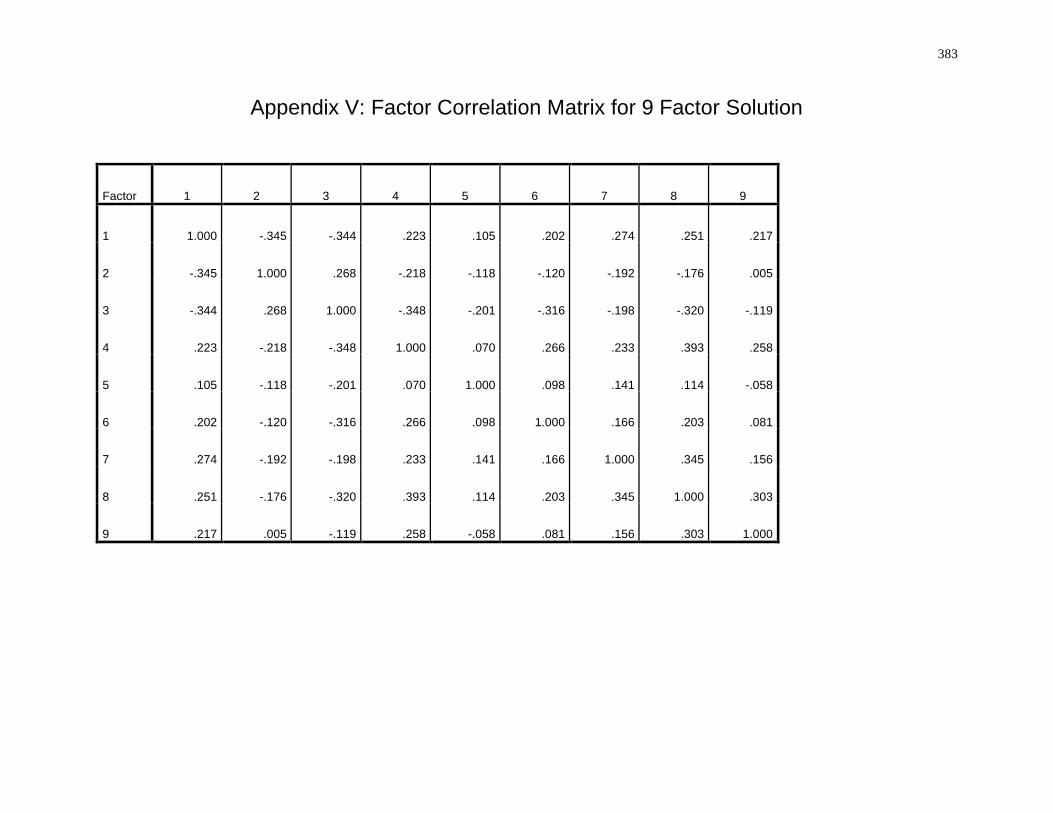
383
Appendix V: Factor Correlation Matrix for 9 Factor Solution
Factor 1 2 3 4 5 6 7 8 9
1 1.000 -.345 -.344 .223 .105 .202 .274 .251 .217
2 -.345 1.000 .268 -.218 -.118 -.120 -.192 -.176 .005
3 -.344 .268 1.000 -.348 -.201 -.316 -.198 -.320 -.119
4 .223 -.218 -.348 1.000 .070 .266 .233 .393 .258
5 .105 -.118 -.201 .070 1.000 .098 .141 .114 -.058
6 .202 -.120 -.316 .266 .098 1.000 .166 .203 .081
7 .274 -.192 -.198 .233 .141 .166 1.000 .345 .156
8 .251 -.176 -.320 .393 .114 .203 .345 1.000 .303
9 .217 .005 -.119 .258 -.058 .081 .156 .303 1.000
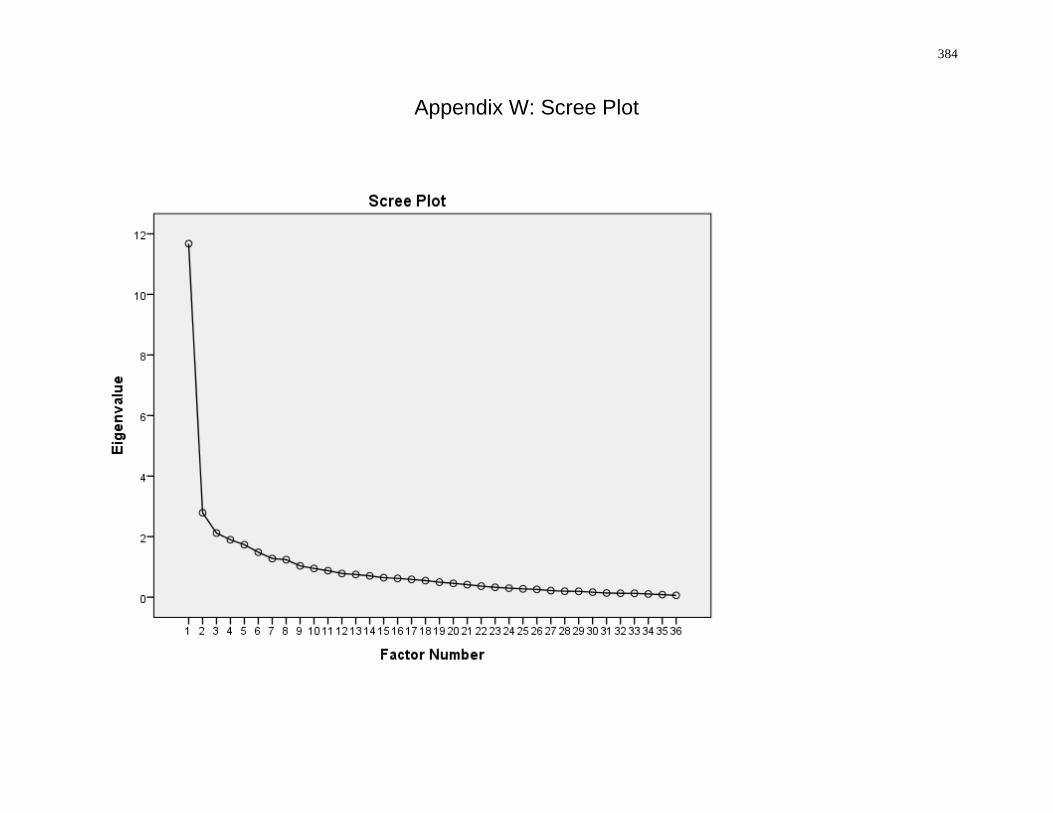
384
Appendix W: Scree Plot
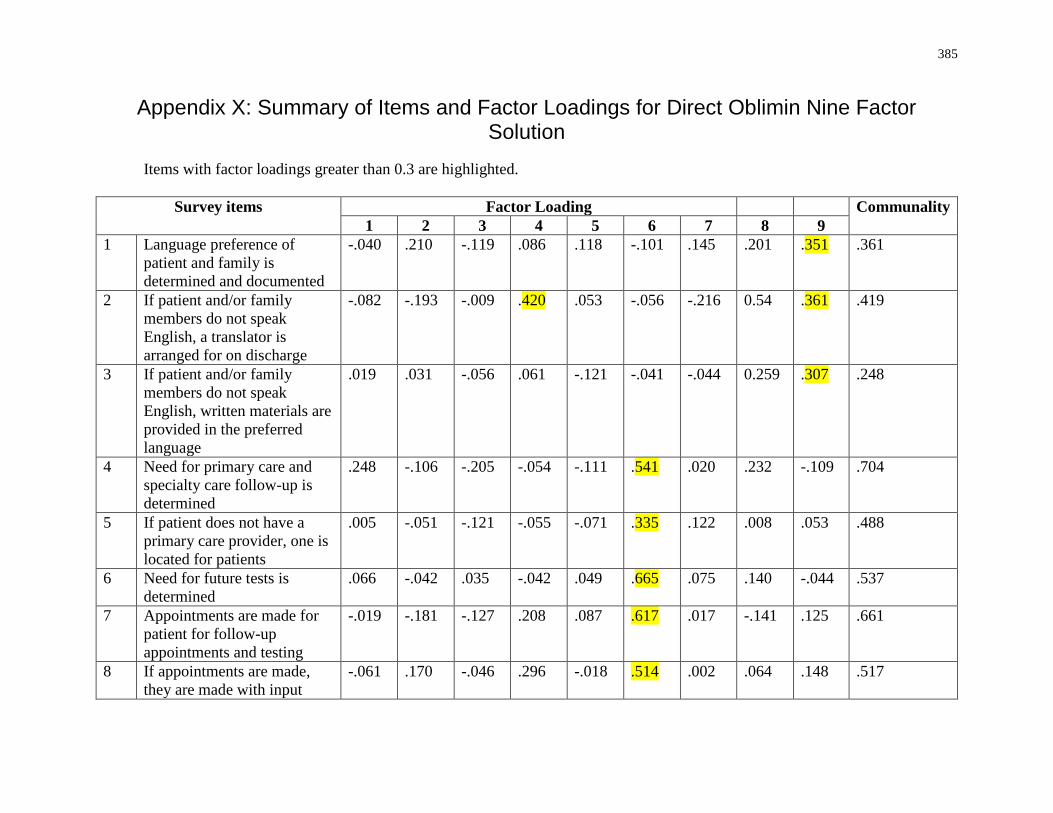
385
Appendix X: Summary of Items and Factor Loadings for Direct Oblimin Nine Factor Solution
Items with factor loadings greater than 0.3 are highlighted.
Survey items
Factor Loading Communality
1 2 3 4 5 6 7 8 9
1 Language preference of
patient and family is
determined and documented
-.040 .210 -.119 .086 .118 -.101 .145 .201 .351 .361
2 If patient and/or family
members do not speak
English, a translator is
arranged for on discharge
-.082 -.193 -.009 .420 .053 -.056 -.216 0.54 .361 .419
3 If patient and/or family
members do not speak
English, written materials are
provided in the preferred
language
.019 .031 -.056 .061 -.121 -.041 -.044 0.259 .307 .248
4 Need for primary care and
specialty care follow-up is
determined
.248 -.106 -.205 -.054 -.111 .541 .020 .232 -.109 .704
5 If patient does not have a
primary care provider, one is
located for patients
.005 -.051 -.121 -.055 -.071 .335 .122 .008 .053 .488
6 Need for future tests is
determined
.066 -.042 .035 -.042 .049 .665 .075 .140 -.044 .537
7 Appointments are made for
patient for follow-up
appointments and testing
-.019 -.181 -.127 .208 .087 .617 .017 -.141 .125 .661
8 If appointments are made,
they are made with input
-.061 .170 -.046 .296 -.018 .514 .002 .064 .148 .517
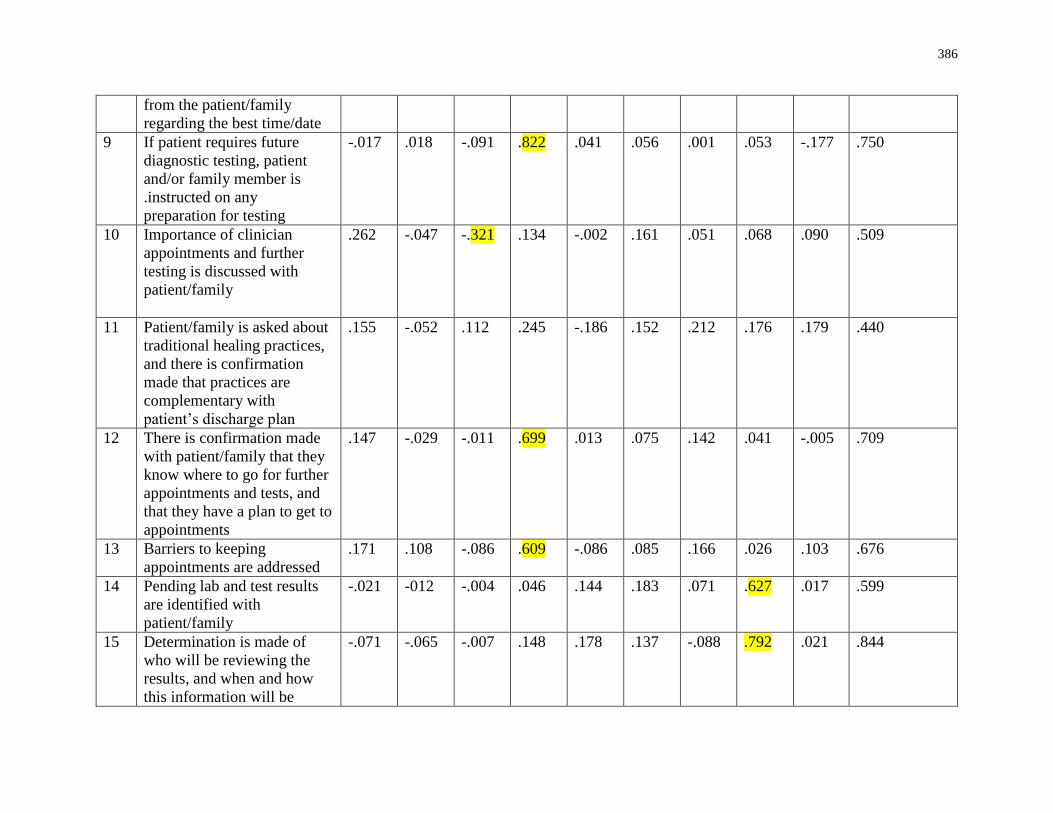
386
from the patient/family
regarding the best time/date
9 If patient requires future
diagnostic testing, patient
and/or family member is
.instructed on any
preparation for testing
-.017 .018 -.091 .822 .041 .056 .001 .053 -.177 .750
10 Importance of clinician
appointments and further
testing is discussed with
patient/family
.262 -.047 -.321 .134 -.002 .161 .051 .068 .090 .509
11 Patient/family is asked about
traditional healing practices,
and there is confirmation
made that practices are
complementary with
patient’s discharge plan
.155 -.052 .112 .245 -.186 .152 .212 .176 .179 .440
12 There is confirmation made
with patient/family that they
know where to go for further
appointments and tests, and
that they have a plan to get to
appointments
.147 -.029 -.011 .699 .013 .075 .142 .041 -.005 .709
13 Barriers to keeping
appointments are addressed
.171 .108 -.086 .609 -.086 .085 .166 .026 .103 .676
14 Pending lab and test results
are identified with
patient/family
-.021 -012 -.004 .046 .144 .183 .071 .627 .017 .599
15 Determination is made of
who will be reviewing the
results, and when and how
this information will be
-.071 -.065 -.007 .148 .178 .137 -.088 .792 .021 .844
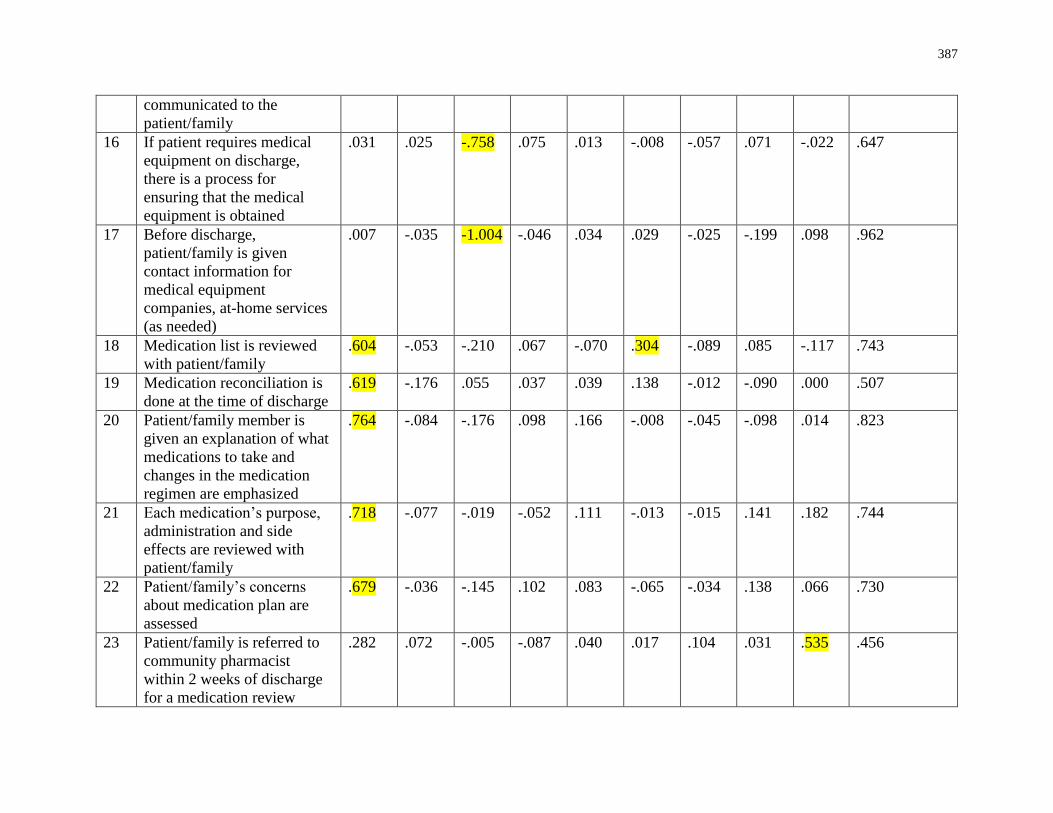
387
communicated to the
patient/family
16 If patient requires medical
equipment on discharge,
there is a process for
ensuring that the medical
equipment is obtained
.031 .025 -.758 .075 .013 -.008 -.057 .071 -.022 .647
17 Before discharge,
patient/family is given
contact information for
medical equipment
companies, at-home services
(as needed)
.007 -.035 -1.004 -.046 .034 .029 -.025 -.199 .098 .962
18 Medication list is reviewed
with patient/family
.604 -.053 -.210 .067 -.070 .304 -.089 .085 -.117 .743
19 Medication reconciliation is
done at the time of discharge
.619 -.176 .055 .037 .039 .138 -.012 -.090 .000 .507
20 Patient/family member is
given an explanation of what
medications to take and
changes in the medication
regimen are emphasized
.764 -.084 -.176 .098 .166 -.008 -.045 -.098 .014 .823
21 Each medication’s purpose,
administration and side
effects are reviewed with
patient/family
.718 -.077 -.019 -.052 .111 -.013 -.015 .141 .182 .744
22 Patient/family’s concerns
about medication plan are
assessed
.679 -.036 -.145 .102 .083 -.065 -.034 .138 .066 .730
23 Patient/family is referred to
community pharmacist
within 2 weeks of discharge
for a medication review
.282 .072 -.005 -.087 .040 .017 .104 .031 .535 .456
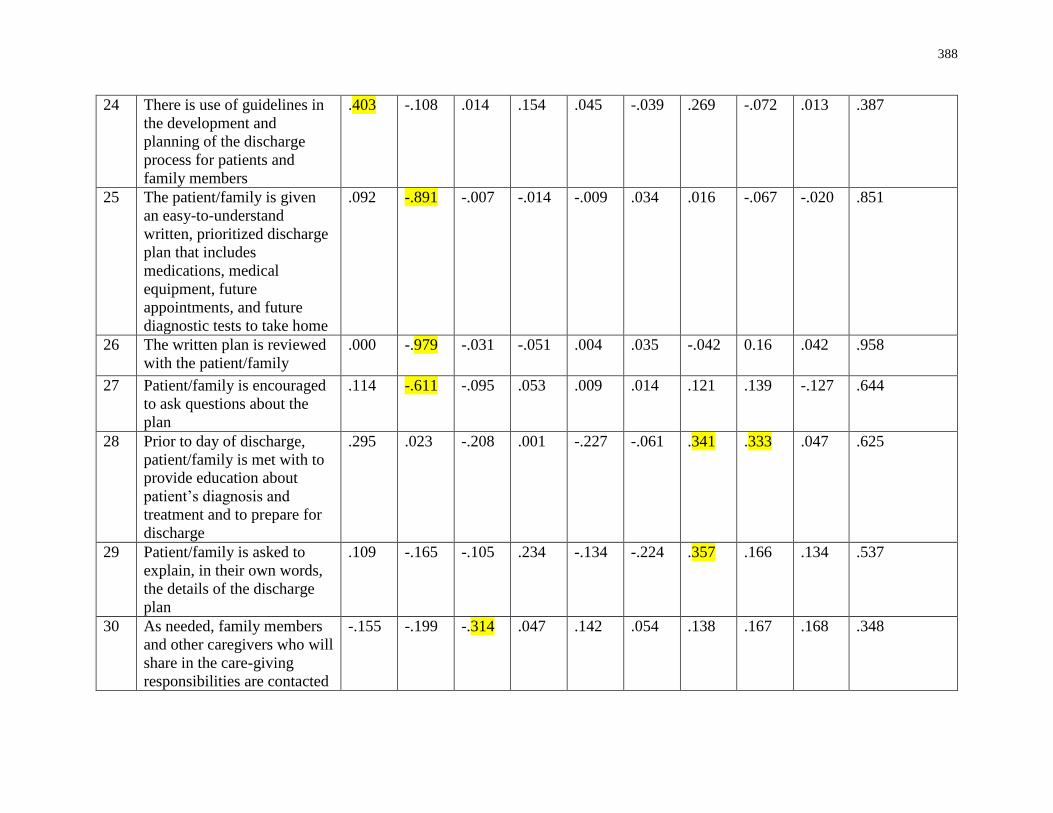
388
24 There is use of guidelines in
the development and
planning of the discharge
process for patients and
family members
.403 -.108 .014 .154 .045 -.039 .269 -.072 .013 .387
25 The patient/family is given
an easy-to-understand
written, prioritized discharge
plan that includes
medications, medical
equipment, future
appointments, and future
diagnostic tests to take home
.092 -.891 -.007 -.014 -.009 .034 .016 -.067 -.020 .851
26 The written plan is reviewed
with the patient/family
.000 -.979 -.031 -.051 .004 .035 -.042 0.16 .042 .958
27 Patient/family is encouraged
to ask questions about the
plan
.114 -.611 -.095 .053 .009 .014 .121 .139 -.127 .644
28 Prior to day of discharge,
patient/family is met with to
provide education about
patient’s diagnosis and
treatment and to prepare for
discharge
.295 .023 -.208 .001 -.227 -.061 .341 .333 .047 .625
29 Patient/family is asked to
explain, in their own words,
the details of the discharge
plan
.109 -.165 -.105 .234 -.134 -.224 .357 .166 .134 .537
30 As needed, family members
and other caregivers who will
share in the care-giving
responsibilities are contacted
-.155 -.199 -.314 .047 .142 .054 .138 .167 .168 .348
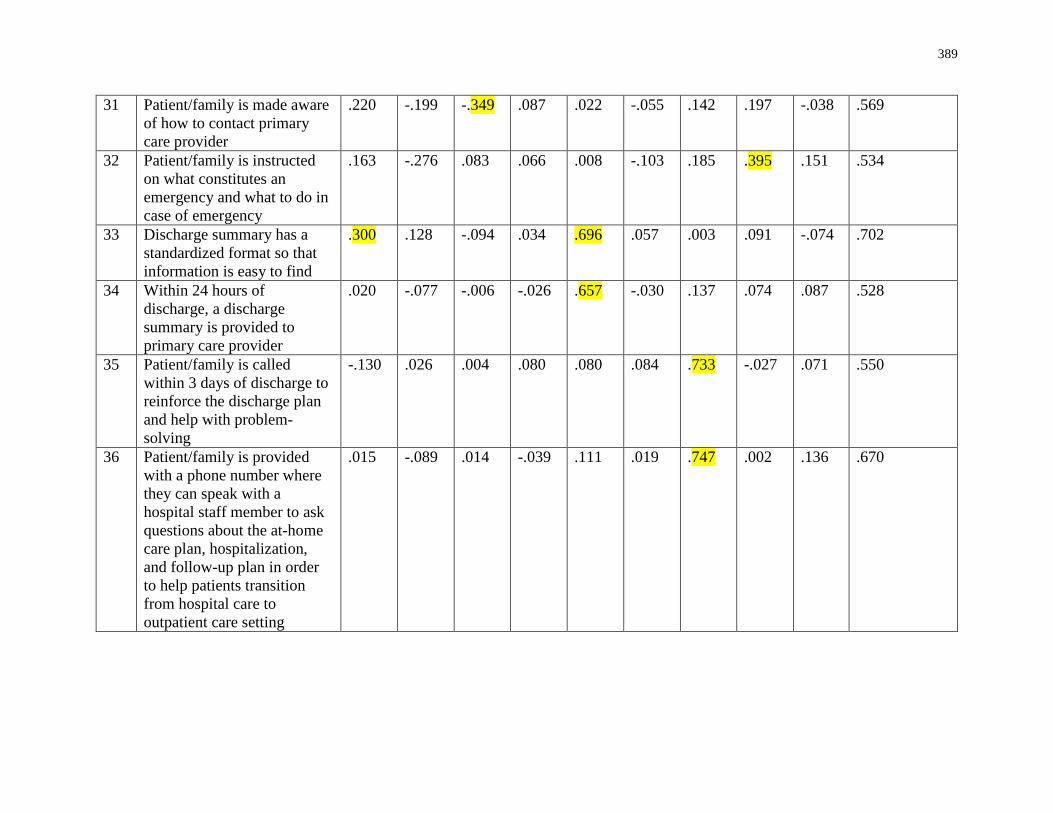
389
31 Patient/family is made aware
of how to contact primary
care provider
.220 -.199 -.349 .087 .022 -.055 .142 .197 -.038 .569
32 Patient/family is instructed
on what constitutes an
emergency and what to do in
case of emergency
.163 -.276 .083 .066 .008 -.103 .185 .395 .151 .534
33 Discharge summary has a
standardized format so that
information is easy to find
.300 .128 -.094 .034 .696 .057 .003 .091 -.074 .702
34 Within 24 hours of
discharge, a discharge
summary is provided to
primary care provider
.020 -.077 -.006 -.026 .657 -.030 .137 .074 .087 .528
35 Patient/family is called
within 3 days of discharge to
reinforce the discharge plan
and help with problem-
solving
-.130 .026 .004 .080 .080 .084 .733 -.027 .071 .550
36 Patient/family is provided
with a phone number where
they can speak with a
hospital staff member to ask
questions about the at-home
care plan, hospitalization,
and follow-up plan in order
to help patients transition
from hospital care to
outpatient care setting
.015 -.089 .014 -.039 .111 .019 .747 .002 .136 .670
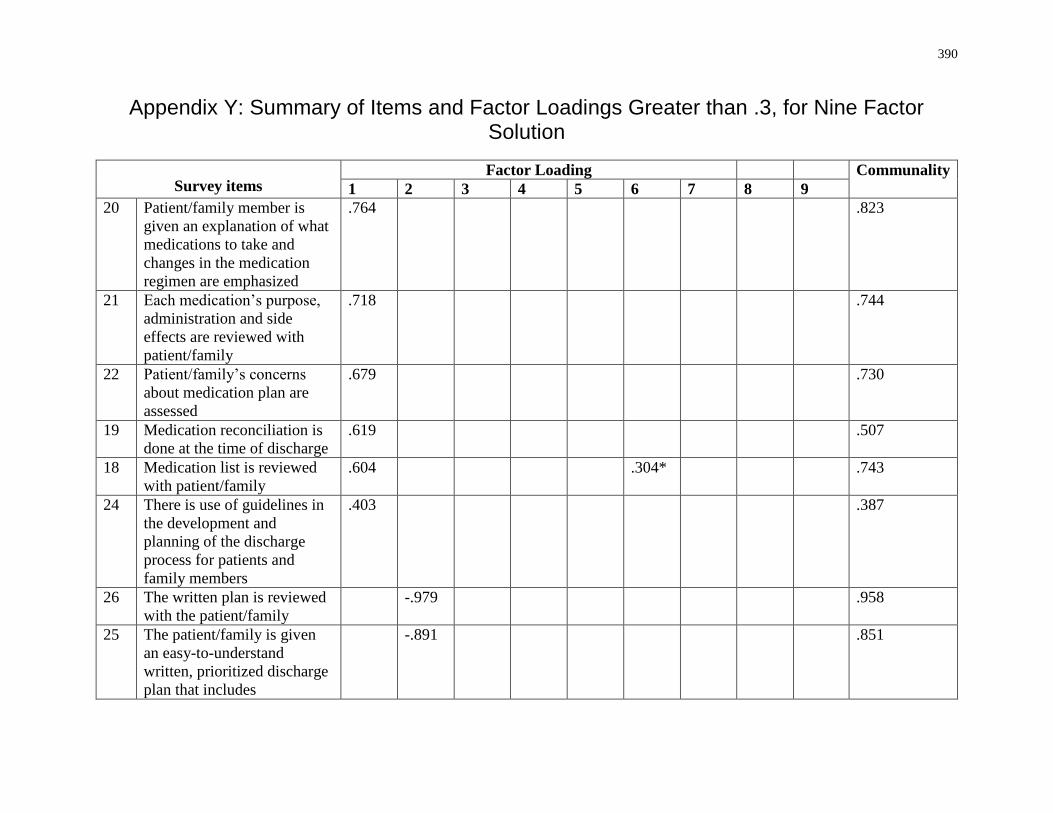
390
Appendix Y: Summary of Items and Factor Loadings Greater than .3, for Nine Factor Solution
Survey items Factor Loading Communality
1 2 3 4 5 6 7 8 9
20 Patient/family member is
given an explanation of what
medications to take and
changes in the medication
regimen are emphasized
.764 .823
21 Each medication’s purpose,
administration and side
effects are reviewed with
patient/family
.718 .744
22 Patient/family’s concerns
about medication plan are
assessed
.679 .730
19 Medication reconciliation is
done at the time of discharge
.619 .507
18 Medication list is reviewed
with patient/family
.604 .304* .743
24 There is use of guidelines in
the development and
planning of the discharge
process for patients and
family members
.403 .387
26 The written plan is reviewed
with the patient/family
-.979 .958
25 The patient/family is given
an easy-to-understand
written, prioritized discharge
plan that includes
-.891 .851
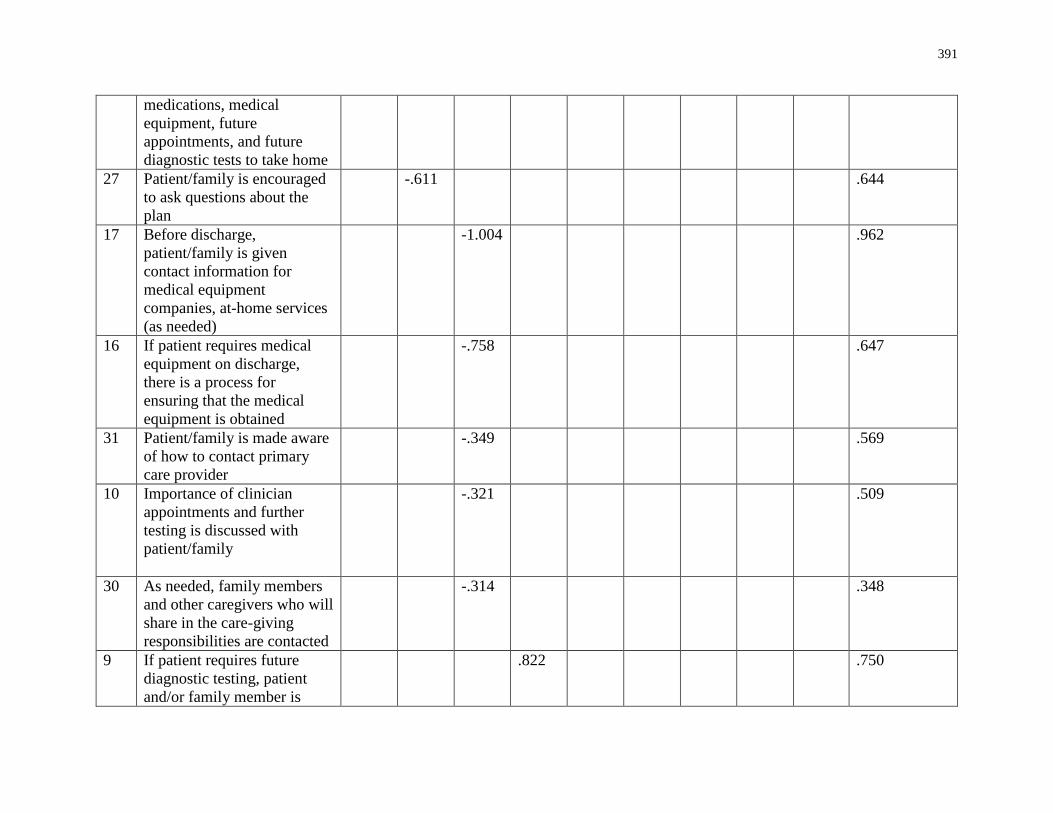
391
medications, medical
equipment, future
appointments, and future
diagnostic tests to take home
27 Patient/family is encouraged
to ask questions about the
plan
-.611 .644
17 Before discharge,
patient/family is given
contact information for
medical equipment
companies, at-home services
(as needed)
-1.004 .962
16 If patient requires medical
equipment on discharge,
there is a process for
ensuring that the medical
equipment is obtained
-.758 .647
31 Patient/family is made aware
of how to contact primary
care provider
-.349 .569
10 Importance of clinician
appointments and further
testing is discussed with
patient/family
-.321 .509
30 As needed, family members
and other caregivers who will
share in the care-giving
responsibilities are contacted
-.314 .348
9 If patient requires future
diagnostic testing, patient
and/or family member is
.822 .750
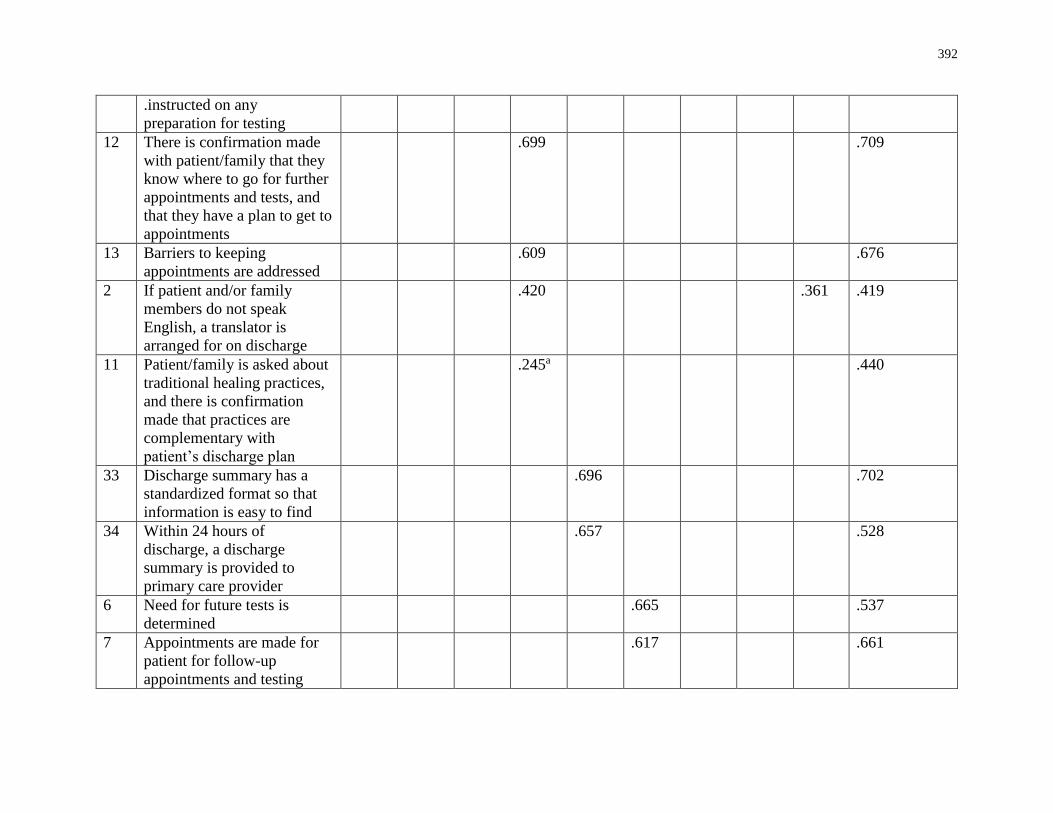
392
.instructed on any
preparation for testing
12 There is confirmation made
with patient/family that they
know where to go for further
appointments and tests, and
that they have a plan to get to
appointments
.699 .709
13 Barriers to keeping
appointments are addressed
.609 .676
2 If patient and/or family
members do not speak
English, a translator is
arranged for on discharge
.420 .361 .419
11 Patient/family is asked about
traditional healing practices,
and there is confirmation
made that practices are
complementary with
patient’s discharge plan
.245a .440
33 Discharge summary has a
standardized format so that
information is easy to find
.696 .702
34 Within 24 hours of
discharge, a discharge
summary is provided to
primary care provider
.657 .528
6 Need for future tests is
determined
.665 .537
7 Appointments are made for
patient for follow-up
appointments and testing
.617 .661
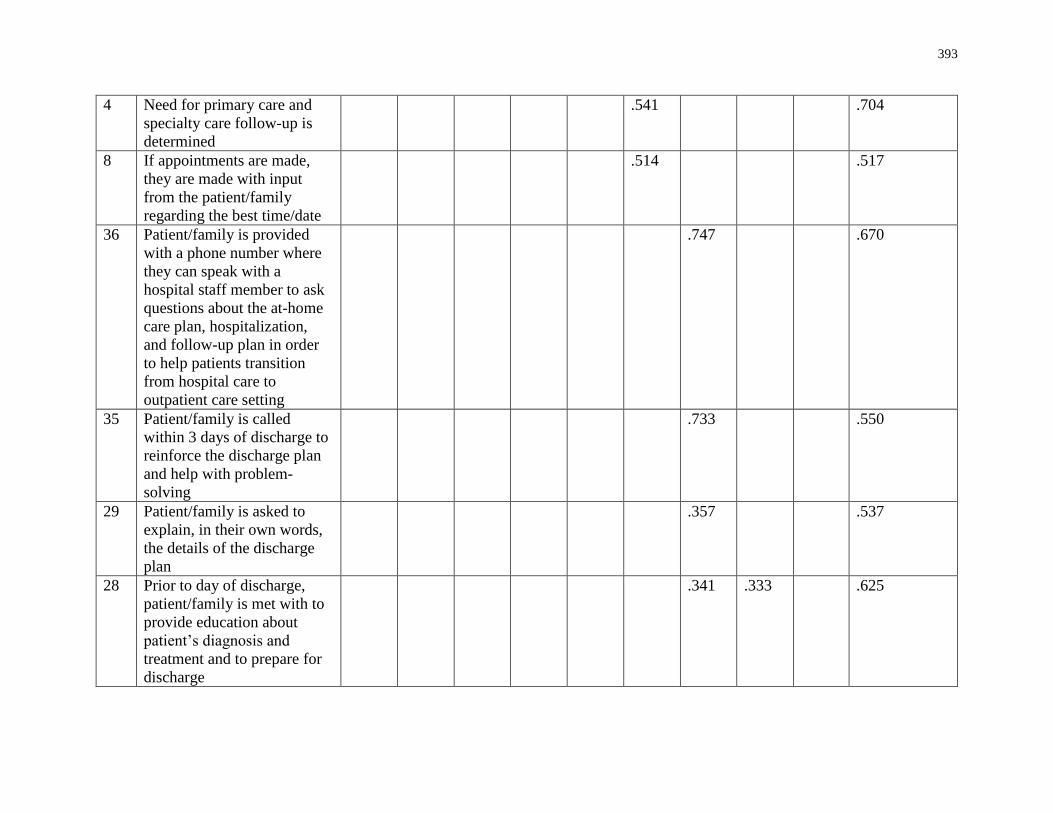
393
4 Need for primary care and
specialty care follow-up is
determined
.541 .704
8 If appointments are made,
they are made with input
from the patient/family
regarding the best time/date
.514 .517
36 Patient/family is provided
with a phone number where
they can speak with a
hospital staff member to ask
questions about the at-home
care plan, hospitalization,
and follow-up plan in order
to help patients transition
from hospital care to
outpatient care setting
.747 .670
35 Patient/family is called
within 3 days of discharge to
reinforce the discharge plan
and help with problem-
solving
.733 .550
29 Patient/family is asked to
explain, in their own words,
the details of the discharge
plan
.357 .537
28 Prior to day of discharge,
patient/family is met with to
provide education about
patient’s diagnosis and
treatment and to prepare for
discharge
.341 .333 .625
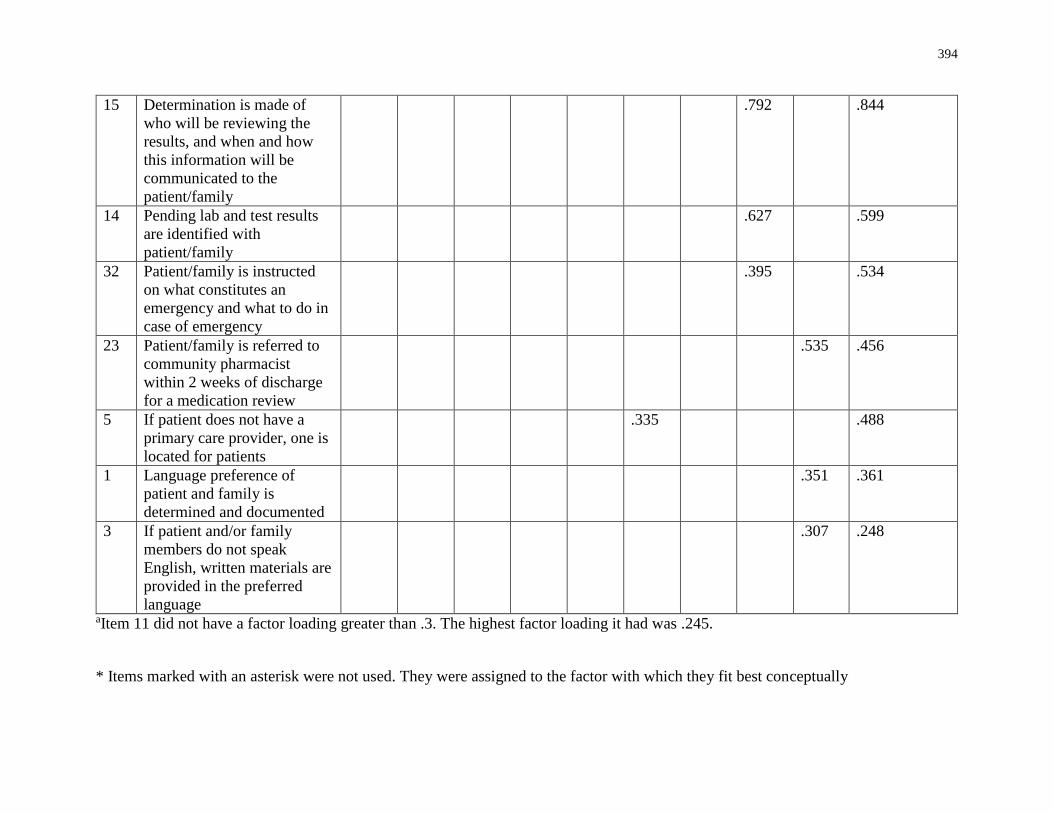
394
15 Determination is made of
who will be reviewing the
results, and when and how
this information will be
communicated to the
patient/family
.792 .844
14 Pending lab and test results
are identified with
patient/family
.627 .599
32 Patient/family is instructed
on what constitutes an
emergency and what to do in
case of emergency
.395 .534
23 Patient/family is referred to
community pharmacist
within 2 weeks of discharge
for a medication review
.535 .456
5 If patient does not have a
primary care provider, one is
located for patients
.335 .488
1 Language preference of
patient and family is
determined and documented
.351 .361
3 If patient and/or family
members do not speak
English, written materials are
provided in the preferred
language
.307 .248
aItem 11 did not have a factor loading greater than .3. The highest factor loading it had was .245.
* Items marked with an asterisk were not used. They were assigned to the factor with which they fit best conceptually
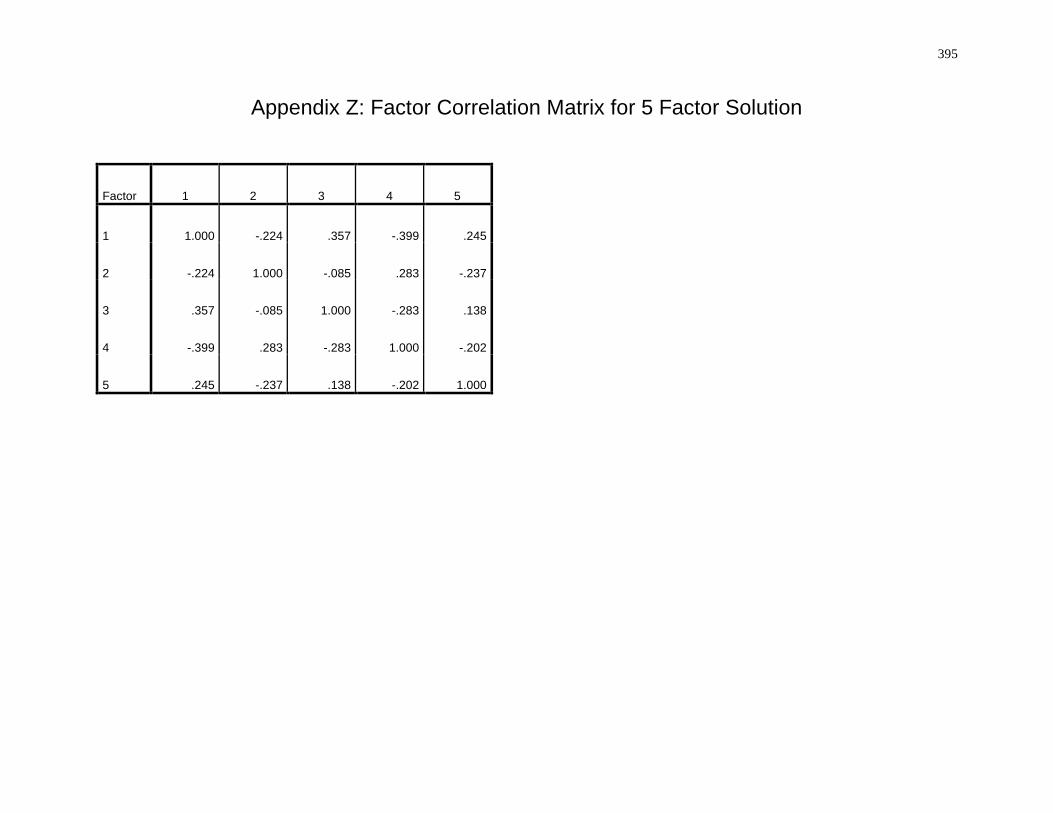
395
Appendix Z: Factor Correlation Matrix for 5 Factor Solution
Factor 1 2 3 4 5
1 1.000 -.224 .357 -.399 .245
2 -.224 1.000 -.085 .283 -.237
3 .357 -.085 1.000 -.283 .138
4 -.399 .283 -.283 1.000 -.202
5 .245 -.237 .138 -.202 1.000
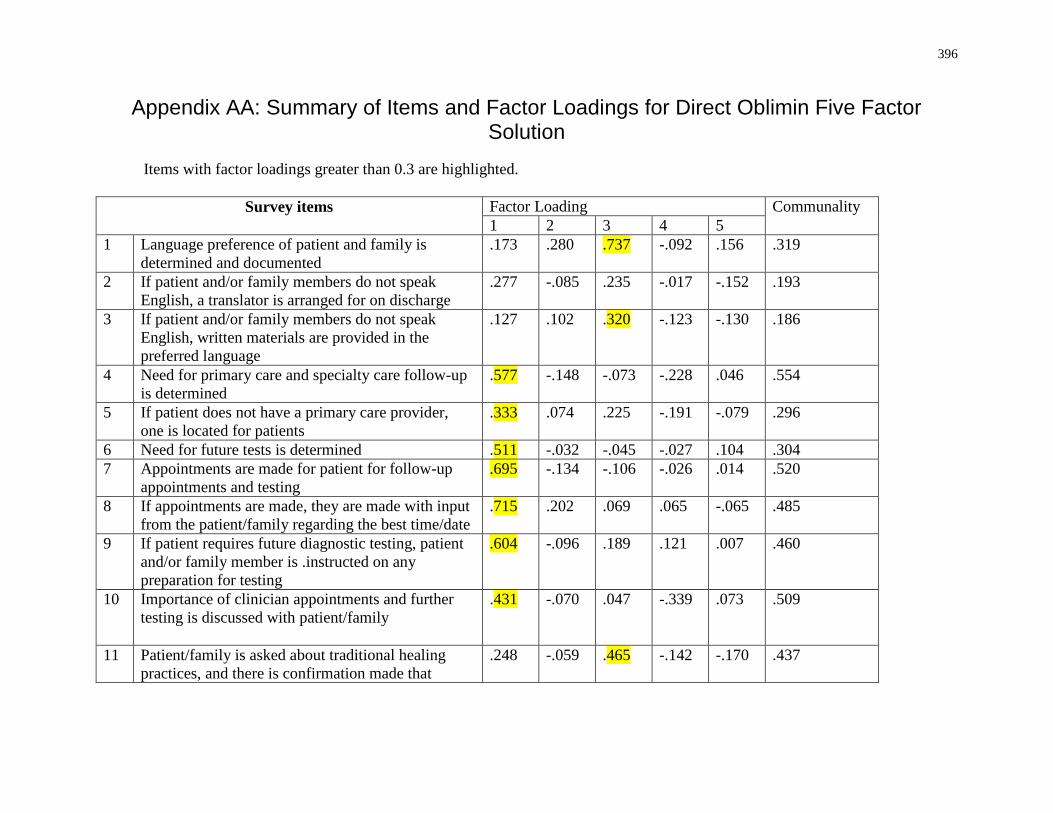
396
Appendix AA: Summary of Items and Factor Loadings for Direct Oblimin Five Factor Solution
Items with factor loadings greater than 0.3 are highlighted.
Survey items
Factor Loading Communality
1 2 3 4 5
1 Language preference of patient and family is
determined and documented
.173 .280 .737 -.092 .156 .319
2 If patient and/or family members do not speak
English, a translator is arranged for on discharge
.277 -.085 .235 -.017 -.152 .193
3 If patient and/or family members do not speak
English, written materials are provided in the
preferred language
.127 .102 .320 -.123 -.130 .186
4 Need for primary care and specialty care follow-up
is determined
.577 -.148 -.073 -.228 .046 .554
5 If patient does not have a primary care provider,
one is located for patients
.333 .074 .225 -.191 -.079 .296
6 Need for future tests is determined .511 -.032 -.045 -.027 .104 .304
7 Appointments are made for patient for follow-up
appointments and testing
.695 -.134 -.106 -.026 .014 .520
8 If appointments are made, they are made with input
from the patient/family regarding the best time/date
.715 .202 .069 .065 -.065 .485
9 If patient requires future diagnostic testing, patient
and/or family member is .instructed on any
preparation for testing
.604 -.096 .189 .121 .007 .460
10 Importance of clinician appointments and further
testing is discussed with patient/family
.431 -.070 .047 -.339 .073 .509
11 Patient/family is asked about traditional healing
practices, and there is confirmation made that
.248 -.059 .465 -.142 -.170 .437
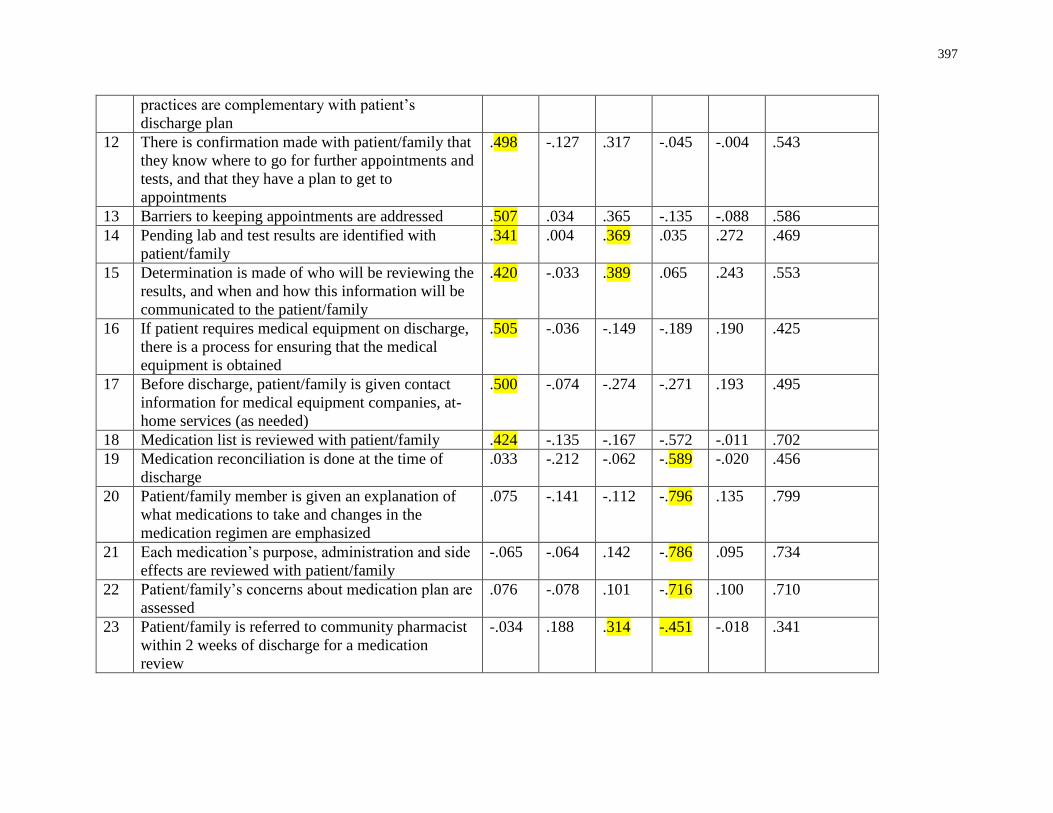
397
practices are complementary with patient’s
discharge plan
12 There is confirmation made with patient/family that
they know where to go for further appointments and
tests, and that they have a plan to get to
appointments
.498 -.127 .317 -.045 -.004 .543
13 Barriers to keeping appointments are addressed .507 .034 .365 -.135 -.088 .586
14 Pending lab and test results are identified with
patient/family
.341 .004 .369 .035 .272 .469
15 Determination is made of who will be reviewing the
results, and when and how this information will be
communicated to the patient/family
.420 -.033 .389 .065 .243 .553
16 If patient requires medical equipment on discharge,
there is a process for ensuring that the medical
equipment is obtained
.505 -.036 -.149 -.189 .190 .425
17 Before discharge, patient/family is given contact
information for medical equipment companies, at-
home services (as needed)
.500 -.074 -.274 -.271 .193 .495
18 Medication list is reviewed with patient/family .424 -.135 -.167 -.572 -.011 .702
19 Medication reconciliation is done at the time of
discharge
.033 -.212 -.062 -.589 -.020 .456
20 Patient/family member is given an explanation of
what medications to take and changes in the
medication regimen are emphasized
.075 -.141 -.112 -.796 .135 .799
21 Each medication’s purpose, administration and side
effects are reviewed with patient/family
-.065 -.064 .142 -.786 .095 .734
22 Patient/family’s concerns about medication plan are
assessed
.076 -.078 .101 -.716 .100 .710
23 Patient/family is referred to community pharmacist
within 2 weeks of discharge for a medication
review
-.034 .188 .314 -.451 -.018 .341
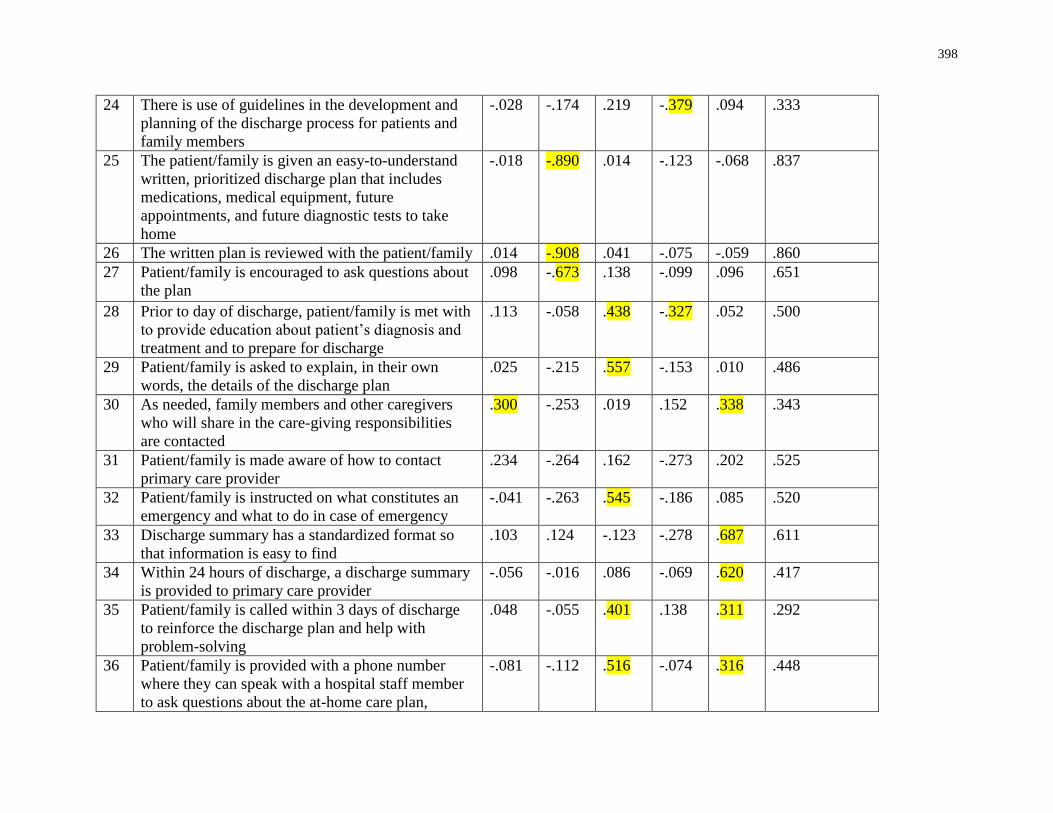
398
24 There is use of guidelines in the development and
planning of the discharge process for patients and
family members
-.028 -.174 .219 -.379 .094 .333
25 The patient/family is given an easy-to-understand
written, prioritized discharge plan that includes
medications, medical equipment, future
appointments, and future diagnostic tests to take
home
-.018 -.890 .014 -.123 -.068 .837
26 The written plan is reviewed with the patient/family .014 -.908 .041 -.075 -.059 .860
27 Patient/family is encouraged to ask questions about
the plan
.098 -.673 .138 -.099 .096 .651
28 Prior to day of discharge, patient/family is met with
to provide education about patient’s diagnosis and
treatment and to prepare for discharge
.113 -.058 .438 -.327 .052 .500
29 Patient/family is asked to explain, in their own
words, the details of the discharge plan
.025 -.215 .557 -.153 .010 .486
30 As needed, family members and other caregivers
who will share in the care-giving responsibilities
are contacted
.300 -.253 .019 .152 .338 .343
31 Patient/family is made aware of how to contact
primary care provider
.234 -.264 .162 -.273 .202 .525
32 Patient/family is instructed on what constitutes an
emergency and what to do in case of emergency
-.041 -.263 .545 -.186 .085 .520
33 Discharge summary has a standardized format so
that information is easy to find
.103 .124 -.123 -.278 .687 .611
34 Within 24 hours of discharge, a discharge summary
is provided to primary care provider
-.056 -.016 .086 -.069 .620 .417
35 Patient/family is called within 3 days of discharge
to reinforce the discharge plan and help with
problem-solving
.048 -.055 .401 .138 .311 .292
36 Patient/family is provided with a phone number
where they can speak with a hospital staff member
to ask questions about the at-home care plan,
-.081 -.112 .516 -.074 .316 .448
399
hospitalization, and follow-up plan in order to help
patients transition from hospital care to outpatient
care setting
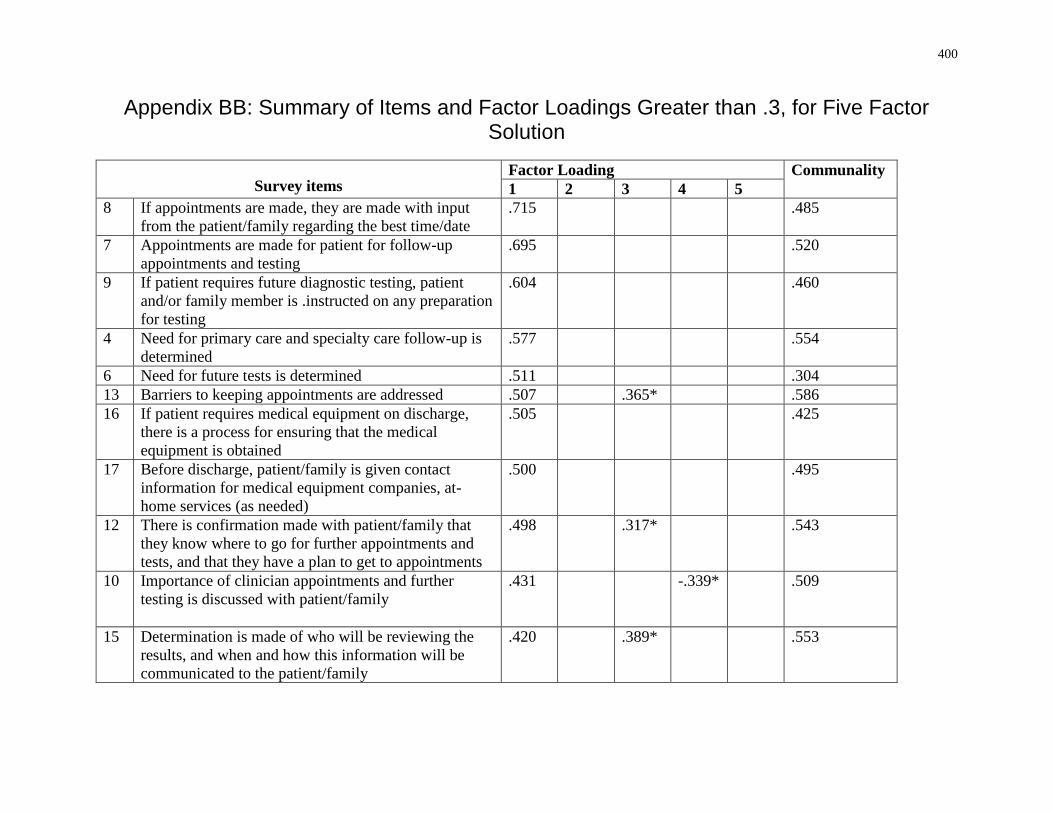
400
Appendix BB: Summary of Items and Factor Loadings Greater than .3, for Five Factor Solution
Survey items Factor Loading Communality
1 2 3 4 5
8 If appointments are made, they are made with input
from the patient/family regarding the best time/date
.715 .485
7 Appointments are made for patient for follow-up
appointments and testing
.695 .520
9 If patient requires future diagnostic testing, patient
and/or family member is .instructed on any preparation
for testing
.604 .460
4 Need for primary care and specialty care follow-up is
determined
.577 .554
6 Need for future tests is determined .511 .304
13 Barriers to keeping appointments are addressed .507 .365* .586
16 If patient requires medical equipment on discharge,
there is a process for ensuring that the medical
equipment is obtained
.505 .425
17 Before discharge, patient/family is given contact
information for medical equipment companies, at-
home services (as needed)
.500 .495
12 There is confirmation made with patient/family that
they know where to go for further appointments and
tests, and that they have a plan to get to appointments
.498 .317* .543
10 Importance of clinician appointments and further
testing is discussed with patient/family
.431 -.339* .509
15 Determination is made of who will be reviewing the
results, and when and how this information will be
communicated to the patient/family
.420 .389* .553
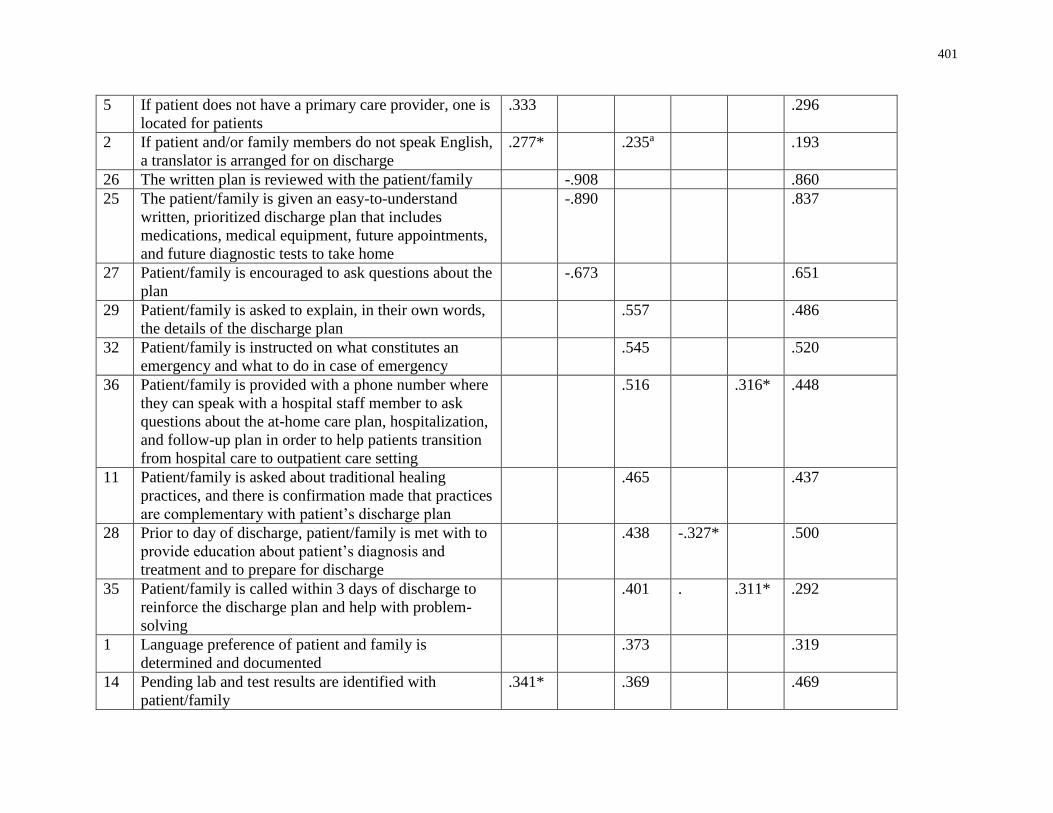
401
5 If patient does not have a primary care provider, one is
located for patients
.333 .296
2 If patient and/or family members do not speak English,
a translator is arranged for on discharge
.277* .235a .193
26 The written plan is reviewed with the patient/family -.908 .860
25 The patient/family is given an easy-to-understand
written, prioritized discharge plan that includes
medications, medical equipment, future appointments,
and future diagnostic tests to take home
-.890 .837
27 Patient/family is encouraged to ask questions about the
plan
-.673 .651
29 Patient/family is asked to explain, in their own words,
the details of the discharge plan
.557 .486
32 Patient/family is instructed on what constitutes an
emergency and what to do in case of emergency
.545 .520
36 Patient/family is provided with a phone number where
they can speak with a hospital staff member to ask
questions about the at-home care plan, hospitalization,
and follow-up plan in order to help patients transition
from hospital care to outpatient care setting
.516 .316* .448
11 Patient/family is asked about traditional healing
practices, and there is confirmation made that practices
are complementary with patient’s discharge plan
.465 .437
28 Prior to day of discharge, patient/family is met with to
provide education about patient’s diagnosis and
treatment and to prepare for discharge
.438 -.327* .500
35 Patient/family is called within 3 days of discharge to
reinforce the discharge plan and help with problem-
solving
.401 . .311* .292
1 Language preference of patient and family is
determined and documented
.373 .319
14 Pending lab and test results are identified with
patient/family
.341* .369 .469
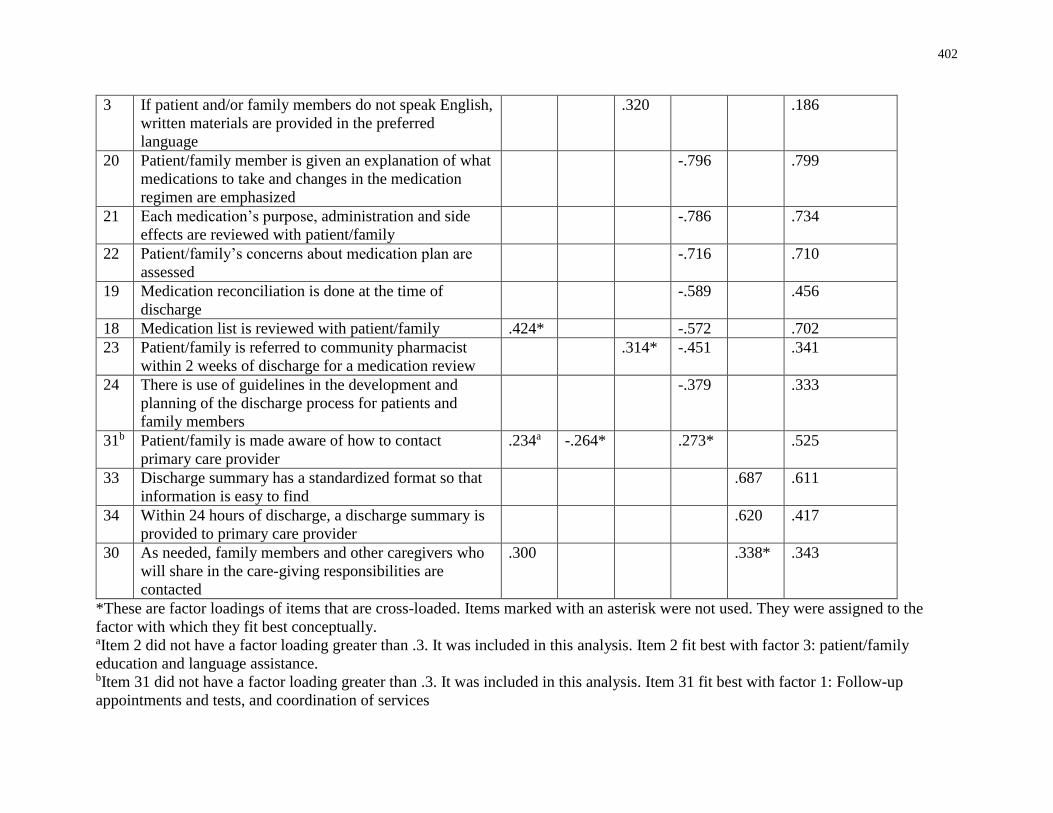
402
3 If patient and/or family members do not speak English,
written materials are provided in the preferred
language
.320 .186
20 Patient/family member is given an explanation of what
medications to take and changes in the medication
regimen are emphasized
-.796 .799
21 Each medication’s purpose, administration and side
effects are reviewed with patient/family
-.786 .734
22 Patient/family’s concerns about medication plan are
assessed
-.716 .710
19 Medication reconciliation is done at the time of
discharge
-.589 .456
18 Medication list is reviewed with patient/family .424* -.572 .702
23 Patient/family is referred to community pharmacist
within 2 weeks of discharge for a medication review
.314* -.451 .341
24 There is use of guidelines in the development and
planning of the discharge process for patients and
family members
-.379 .333
31b Patient/family is made aware of how to contact
primary care provider
.234a -.264* .273* .525
33 Discharge summary has a standardized format so that
information is easy to find
.687 .611
34 Within 24 hours of discharge, a discharge summary is
provided to primary care provider
.620 .417
30 As needed, family members and other caregivers who
will share in the care-giving responsibilities are
contacted
.300 .338* .343
*These are factor loadings of items that are cross-loaded. Items marked with an asterisk were not used. They were assigned to the
factor with which they fit best conceptually. aItem 2 did not have a factor loading greater than .3. It was included in this analysis. Item 2 fit best with factor 3: patient/family
education and language assistance. bItem 31 did not have a factor loading greater than .3. It was included in this analysis. Item 31 fit best with factor 1: Follow-up
appointments and tests, and coordination of services
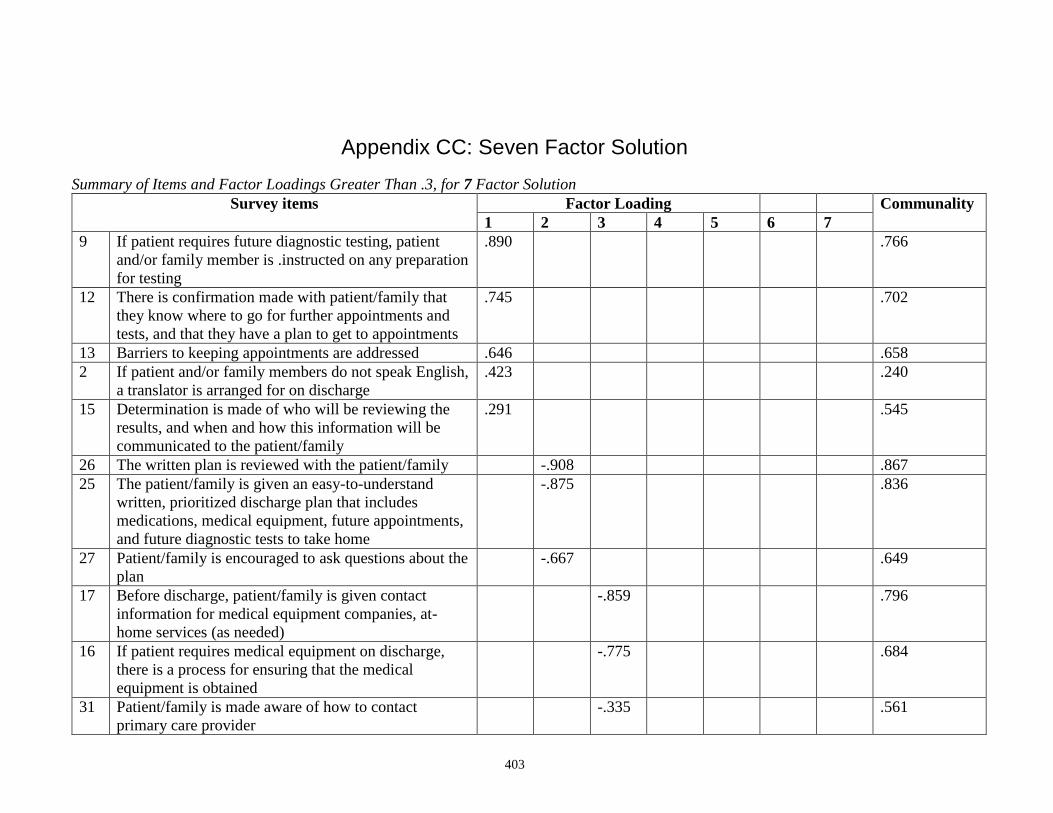
403
Appendix CC: Seven Factor Solution
Summary of Items and Factor Loadings Greater Than .3, for 7 Factor Solution
Survey items Factor Loading Communality
1 2 3 4 5 6 7
9 If patient requires future diagnostic testing, patient
and/or family member is .instructed on any preparation
for testing
.890 .766
12 There is confirmation made with patient/family that
they know where to go for further appointments and
tests, and that they have a plan to get to appointments
.745 .702
13 Barriers to keeping appointments are addressed .646 .658
2 If patient and/or family members do not speak English,
a translator is arranged for on discharge
.423 .240
15 Determination is made of who will be reviewing the
results, and when and how this information will be
communicated to the patient/family
.291 .545
26 The written plan is reviewed with the patient/family -.908 .867
25 The patient/family is given an easy-to-understand
written, prioritized discharge plan that includes
medications, medical equipment, future appointments,
and future diagnostic tests to take home
-.875
.836
27 Patient/family is encouraged to ask questions about the
plan
-.667 .649
17 Before discharge, patient/family is given contact
information for medical equipment companies, at-
home services (as needed)
-.859 .796
16 If patient requires medical equipment on discharge,
there is a process for ensuring that the medical
equipment is obtained
-.775 .684
31 Patient/family is made aware of how to contact
primary care provider
-.335 .561
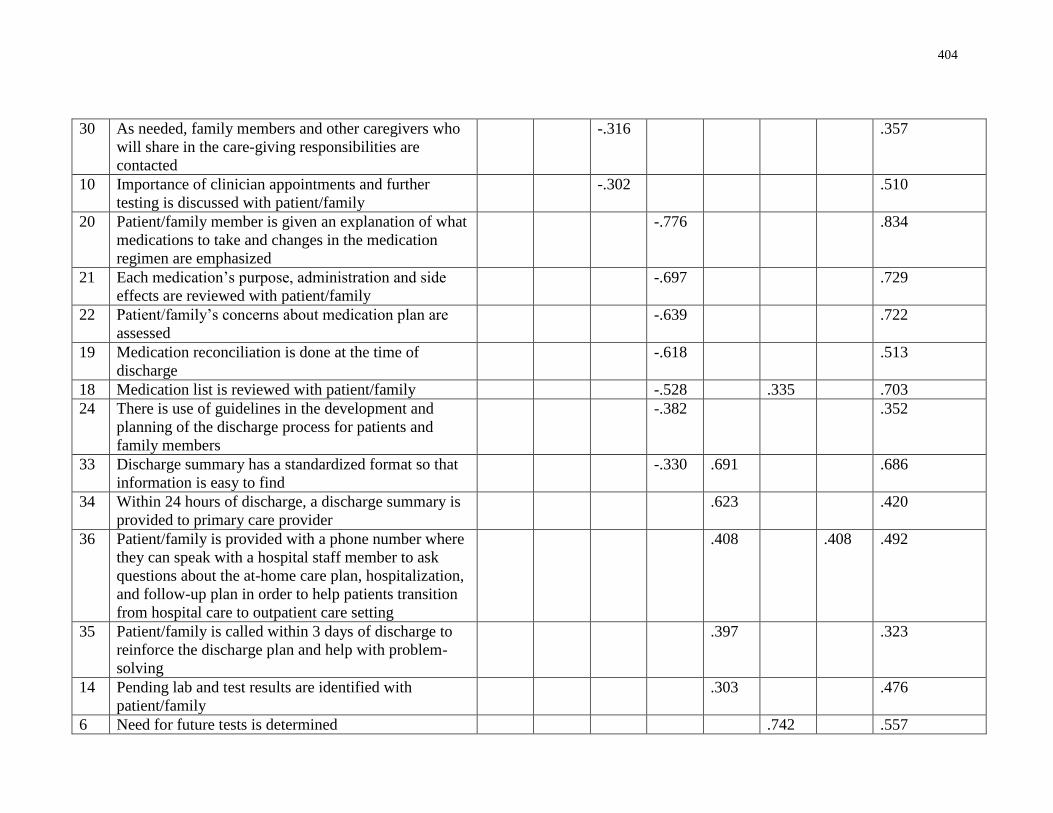
404
30 As needed, family members and other caregivers who
will share in the care-giving responsibilities are
contacted
-.316 .357
10 Importance of clinician appointments and further
testing is discussed with patient/family
-.302 .510
20 Patient/family member is given an explanation of what
medications to take and changes in the medication
regimen are emphasized
-.776 .834
21 Each medication’s purpose, administration and side
effects are reviewed with patient/family
-.697 .729
22 Patient/family’s concerns about medication plan are
assessed
-.639 .722
19 Medication reconciliation is done at the time of
discharge
-.618 .513
18 Medication list is reviewed with patient/family -.528 .335 .703
24 There is use of guidelines in the development and
planning of the discharge process for patients and
family members
-.382 .352
33 Discharge summary has a standardized format so that
information is easy to find
-.330 .691 .686
34 Within 24 hours of discharge, a discharge summary is
provided to primary care provider
.623 .420
36 Patient/family is provided with a phone number where
they can speak with a hospital staff member to ask
questions about the at-home care plan, hospitalization,
and follow-up plan in order to help patients transition
from hospital care to outpatient care setting
.408 .408 .492
35 Patient/family is called within 3 days of discharge to
reinforce the discharge plan and help with problem-
solving
.397 .323
14 Pending lab and test results are identified with
patient/family
.303 .476
6 Need for future tests is determined .742 .557
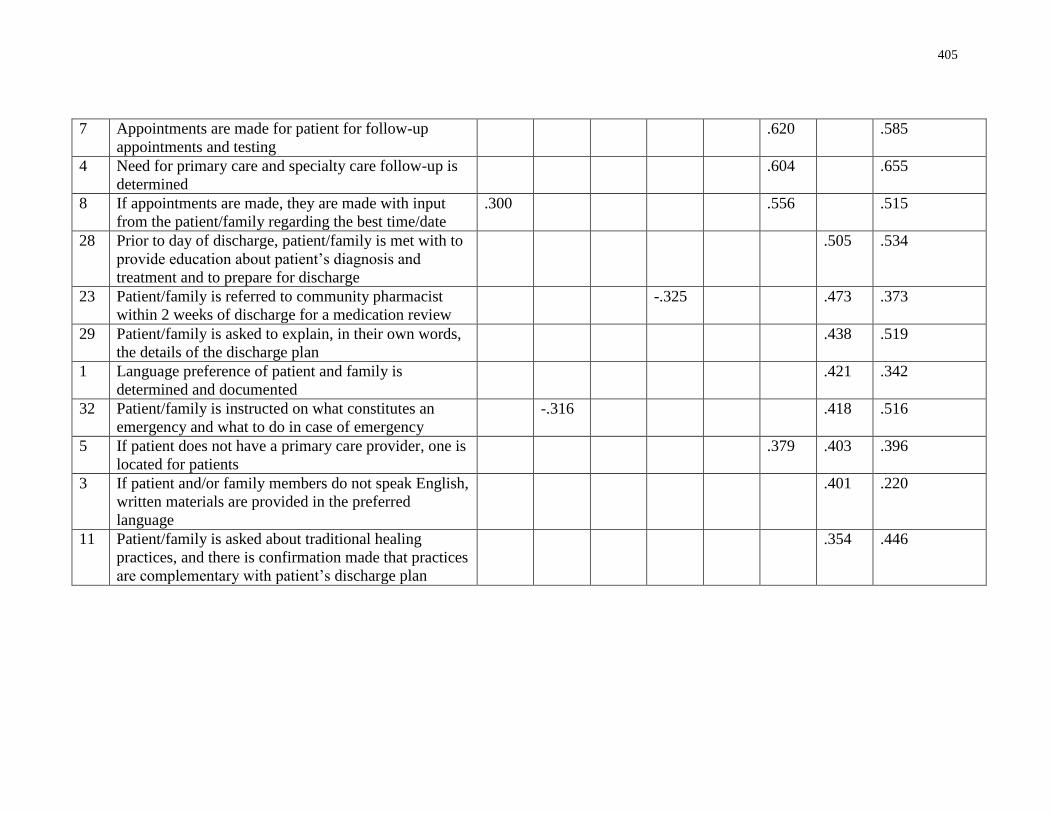
405
7 Appointments are made for patient for follow-up
appointments and testing
.620 .585
4 Need for primary care and specialty care follow-up is
determined
.604 .655
8 If appointments are made, they are made with input
from the patient/family regarding the best time/date
.300 .556 .515
28 Prior to day of discharge, patient/family is met with to
provide education about patient’s diagnosis and
treatment and to prepare for discharge
.505 .534
23 Patient/family is referred to community pharmacist
within 2 weeks of discharge for a medication review
-.325 .473 .373
29 Patient/family is asked to explain, in their own words,
the details of the discharge plan
.438 .519
1 Language preference of patient and family is
determined and documented
.421 .342
32 Patient/family is instructed on what constitutes an
emergency and what to do in case of emergency
-.316 .418 .516
5 If patient does not have a primary care provider, one is
located for patients
.379 .403 .396
3 If patient and/or family members do not speak English,
written materials are provided in the preferred
language
.401 .220
11 Patient/family is asked about traditional healing
practices, and there is confirmation made that practices
are complementary with patient’s discharge plan
.354 .446
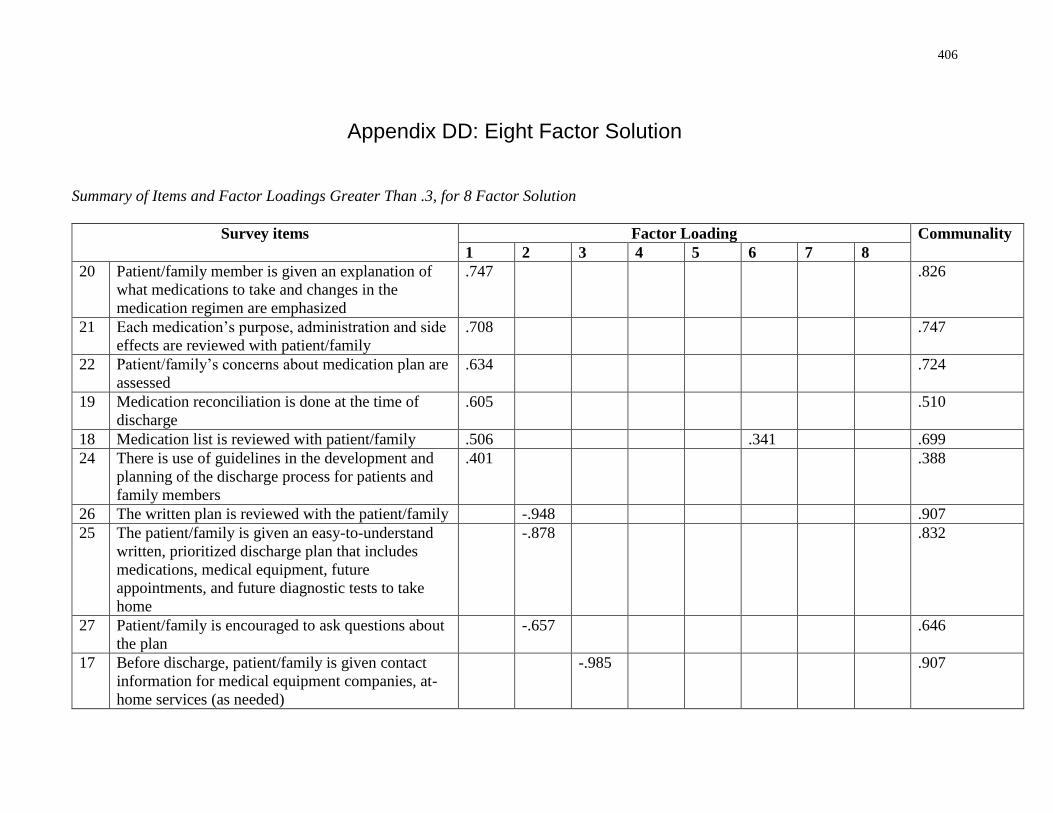
406
Appendix DD: Eight Factor Solution
Summary of Items and Factor Loadings Greater Than .3, for 8 Factor Solution
Survey items Factor Loading Communality
1 2 3 4 5 6 7 8
20 Patient/family member is given an explanation of
what medications to take and changes in the
medication regimen are emphasized
.747 .826
21 Each medication’s purpose, administration and side
effects are reviewed with patient/family
.708 .747
22 Patient/family’s concerns about medication plan are
assessed
.634 .724
19 Medication reconciliation is done at the time of
discharge
.605 .510
18 Medication list is reviewed with patient/family .506 .341 .699
24 There is use of guidelines in the development and
planning of the discharge process for patients and
family members
.401 .388
26 The written plan is reviewed with the patient/family -.948 .907
25 The patient/family is given an easy-to-understand
written, prioritized discharge plan that includes
medications, medical equipment, future
appointments, and future diagnostic tests to take
home
-.878 .832
27 Patient/family is encouraged to ask questions about
the plan
-.657 .646
17 Before discharge, patient/family is given contact
information for medical equipment companies, at-
home services (as needed)
-.985 .907
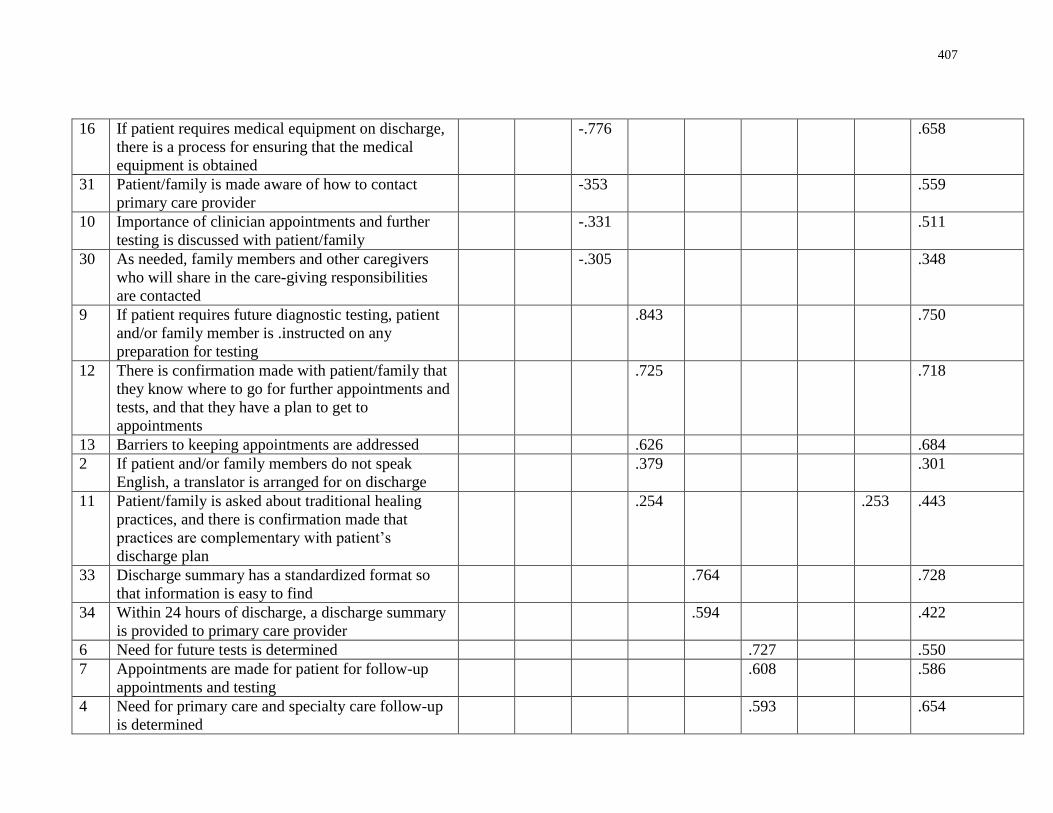
407
16 If patient requires medical equipment on discharge,
there is a process for ensuring that the medical
equipment is obtained
-.776 .658
31 Patient/family is made aware of how to contact
primary care provider
-353 .559
10 Importance of clinician appointments and further
testing is discussed with patient/family
-.331 .511
30 As needed, family members and other caregivers
who will share in the care-giving responsibilities
are contacted
-.305 .348
9 If patient requires future diagnostic testing, patient
and/or family member is .instructed on any
preparation for testing
.843 .750
12 There is confirmation made with patient/family that
they know where to go for further appointments and
tests, and that they have a plan to get to
appointments
.725 .718
13 Barriers to keeping appointments are addressed .626 .684
2 If patient and/or family members do not speak
English, a translator is arranged for on discharge
.379 .301
11 Patient/family is asked about traditional healing
practices, and there is confirmation made that
practices are complementary with patient’s
discharge plan
.254 .253 .443
33 Discharge summary has a standardized format so
that information is easy to find
.764 .728
34 Within 24 hours of discharge, a discharge summary
is provided to primary care provider
.594 .422
6 Need for future tests is determined .727 .550
7 Appointments are made for patient for follow-up
appointments and testing
.608 .586
4 Need for primary care and specialty care follow-up
is determined
.593 .654
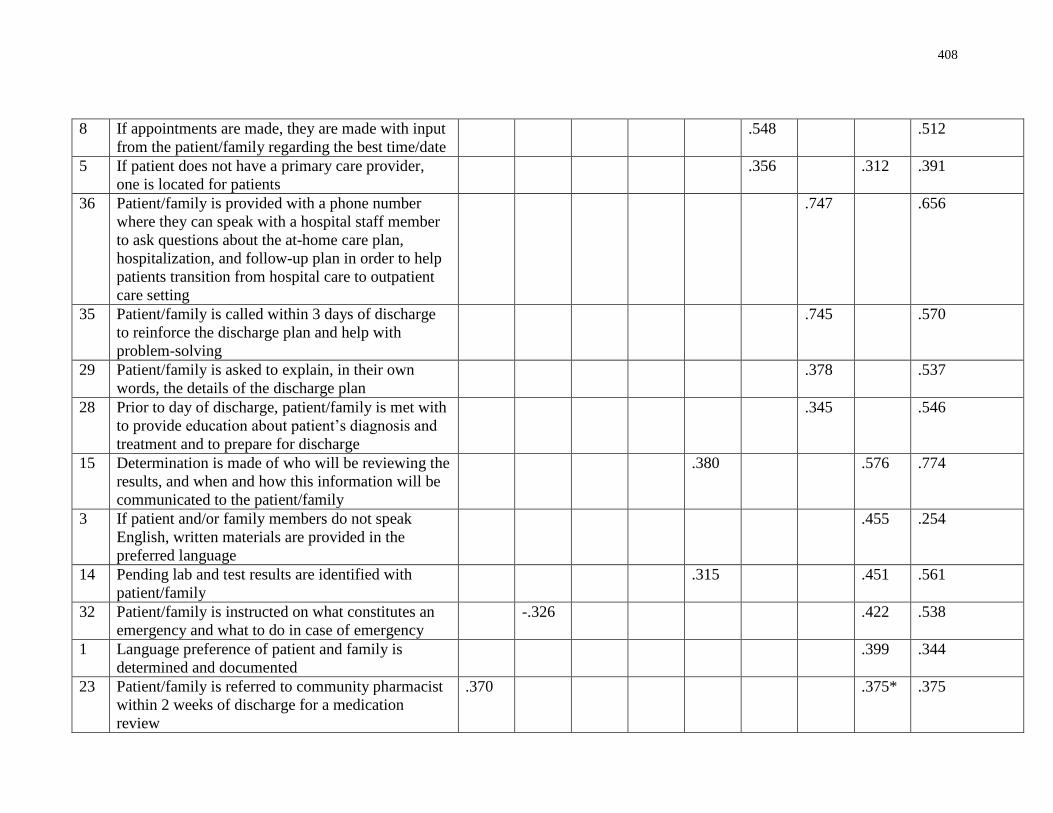
408
8 If appointments are made, they are made with input
from the patient/family regarding the best time/date
.548 .512
5 If patient does not have a primary care provider,
one is located for patients
.356 .312 .391
36 Patient/family is provided with a phone number
where they can speak with a hospital staff member
to ask questions about the at-home care plan,
hospitalization, and follow-up plan in order to help
patients transition from hospital care to outpatient
care setting
.747 .656
35 Patient/family is called within 3 days of discharge
to reinforce the discharge plan and help with
problem-solving
.745 .570
29 Patient/family is asked to explain, in their own
words, the details of the discharge plan
.378 .537
28 Prior to day of discharge, patient/family is met with
to provide education about patient’s diagnosis and
treatment and to prepare for discharge
.345 .546
15 Determination is made of who will be reviewing the
results, and when and how this information will be
communicated to the patient/family
.380 .576 .774
3 If patient and/or family members do not speak
English, written materials are provided in the
preferred language
.455 .254
14 Pending lab and test results are identified with
patient/family
.315 .451 .561
32 Patient/family is instructed on what constitutes an
emergency and what to do in case of emergency
-.326 .422 .538
1 Language preference of patient and family is
determined and documented
.399 .344
23 Patient/family is referred to community pharmacist
within 2 weeks of discharge for a medication
review
.370 .375* .375
409
Appendix EE: Email Communication for Interview
Dear (participant),
Earlier this spring, you participated in a survey to assess how well hospitals discharge patients
from the acute care hospital setting to home. This study is part of my dissertation research at the
Institute of Health Policy, Management and Evaluation at the University of Toronto and it is
endorsed by the Ontario Hospital Association. This research is being supervised by Dr. Jan
Barnsley and Dr. Whitney Berta.
You indicated that you would be willing to participate in a follow-up interview, and provided
your contact information. I am contacting you to request your participation in an interview to
find out about facilitators and barriers to the use of health literate discharge practices. I would
like to make an appointment to interview you in-person.
If you are agreeable to this, could you please suggest a second health care provider or manager at
your hospital who may be willing to be interviewed?
Thank you,
Jennifer
Jennifer Innis
Email: [email protected]
Phone: (416) 571-3248
410
Appendix FF: Informed Consent
Project Title Uptake of health literate discharge practices in Ontario acute care hospitals
Principal Investigator Jennifer Innis, doctoral candidate, University of Toronto
Co-Investigators Dr. Jan Barnsley, University of Toronto
Dr. Whitney Berta, University of Toronto
Dr. Imtiaz Daniel, University of Toronto
Informed Consent Form for Interview
Before agreeing to participate in this research study, it is important that you read and
understand this research consent form. This form provides all the information we think you will
need to know in order to decide whether you wish to participate in the study. If you have any
questions after you read through this form, ask the investigative team. You should not sign this
form until you are sure you understand the information. All research is voluntary and you may
choose to withdraw at any point without consequence.
Purpose of the Research This study is part of a larger study that is examining the use of health literate discharge
practices in Ontario hospitals. The aim of this study is to discover the facilitators and barriers
within hospitals to the uptake of discharge practices that meet the health literacy needs of
patients.
Description of the Research This qualitative study will interview health care providers and managers in Ontario acute
care hospitals who are involved with, or have working knowledge of, the discharge practice on a
general medicine inpatient care unit. Study participants will be asked to participate in a semi-
structured interview session (approximately 30 minutes). In addition, participants will be asked
to provide documents that are used at their hospital in the discharge process. This will include,
but is not limited to, patient discharge summary templates, guidelines, checklists, policies, and
patient education materials.
Potential Harms (Injury, Discomfort or Inconvenience) There are no known harms associated with participation in this study.
Potential Benefits You will not benefit directly from participating in this study. Findings from the study
will be instrumental in evaluating the use of health literate discharge practices in Ontario
hospitals.
Treatment Options Not applicable.
411
Confidentiality and Privacy Confidentiality will be respected and no information that discloses the identity of the
subject will be released or published without consent. All identifying information will be
destroyed. This means that no information will be released or printed that would disclose
personal identity. Data will be aggregated (with no personal identifiers for the analysis).
Consent forms of participants will be stored separately from the data files (transcripts and
analytical worksheets). Only the investigators will have access to the consent forms which will
be kept in a locked cabinet for a period of up to three years. The dialogue from the interview
sessions will be audiotaped and transcribed by the investigator. The hard copies of data
(transcripts and analytical worksheets/notes) and informed consent forms will be shredded 3
years after study completion. Only the study investigators will have access to the data prior to
destruction.
Publication of Results Aggregate results may be shared through oral presentations (conferences) and written
documents (academic and professional journal publications). No identifying information will be
included in any of the publications or presentations associated with this study.
Reimbursement There is no reimbursement for your participation in the study.
Compensation for Injury There is no risk for injury associated with participation in this study.
Participation and Withdrawal Participation in research is voluntary. If you choose not to participate there will be no
consequences. If you choose to participate in this study you can withdraw from the study at any
time without any consequences. Research findings from the study will be made available to the
participants upon completion of the research.
Sponsorship The sponsor of this research is the Institute of Health Policy, Management and Evaluation
at the University of Toronto.
Conflict of Interest The research team members have no conflict of interest to declare.
Research Ethics Board Contact If you have any questions as a research participant you may contact the Office of Office
of Research Ethics ([email protected] or 416-946-3273).
412
Uptake of health literate discharge practices in Ontario acute care hospitals
Participant Consent Form
I, __________________________________ , understand that I am being asked to take part in a
study of health care providers and managers in Ontario acute care hospitals who are involved
with, or have working knowledge of, the discharge practices on a general medicine inpatient care
unit. This study is examining the use of health literate discharge practices in Ontario acute care
hospitals and facilitators and barriers to the use of these practices. Study participants will be
asked to participate in a semi-structured interview session (approximately 30 minutes).
I understand that it is entirely my choice to participate in this study or not; that taking part is
voluntary. I am aware that the interview will take about 30 minutes. I understand that the
interview will be audiotaped for the purpose of data analysis and that no one outside of the
research team will have access to the recordings. In addition, I understand that I will be asked to
provide documents that are used in the discharge process. This may include, but is not limited to,
patient discharge summary templates, guidelines, checklists, policies, and patient education
materials. All information I provide will remain confidential and my name will not be identified
in any report of the study results. The audio recordings will be stored on a secure, password-
protected file on a computer. Only members of the research team will have access to them.
Following completion of the study, the audio recordings will be deleted.
I have been informed that this is a voluntary study and that I have the right to not participate, and
to withdraw from the study at any time. The potential risks, harms, and discomforts have been
explained to me and I also understand the benefits (if any) of participating in the research study.
I understand that I have not waived my legal rights nor released the investigators, sponsor or
involved institution from their legal and professional duties. I know that I may ask now, or in the
future, any questions I have about the study or the research procedures. I have been given
sufficient time to read and understand the above information. By signing this form, I agree that:
1. You have explained this study to me. You have answered all my questions.
2. You have explained the possible harms and benefits (if any) of this study.
3. I know what I could do instead of taking part in this study. I understand that I have the
right not to take part in the study and the right to stop at any time.
4. I am free now, and in the future, to ask questions about the study and the audio recording.
5. I understand that no information about who I am will be given to anyone or be published
without first asking my permission.
6. I agree, or consent, to take part in this study.
7. I agree to be audio recorded during this study. These recordings will be used to explore
the use of health literate discharge practices in Ontario acute care hospitals and the
facilitators and barriers to the use of these practices. These interviews will be recorded as
part of the data analysis.
413
_____________________________ _________________________________
Printed name of participant Participants’ signature and date
_____________________________ _________________________________
Printed name of person who explained consent Signature and date
_____________________________ _________________________________
Printed witness’s name Witness’s signature and date
If you have questions as a research subject you may contact the Office of Office of Research
Ethics ([email protected] or 416-946-3273).
If you have any questions or comments about the study, please contact the investigator at the
address given below.
Jennifer Innis, PhD(c)
University of Toronto
Institute of Health Policy, Management & Evaluation
University of Toronto
425 – 155 College St.
Toronto ON M5T 3M6
Phone: 416-571-3248
Email: [email protected]
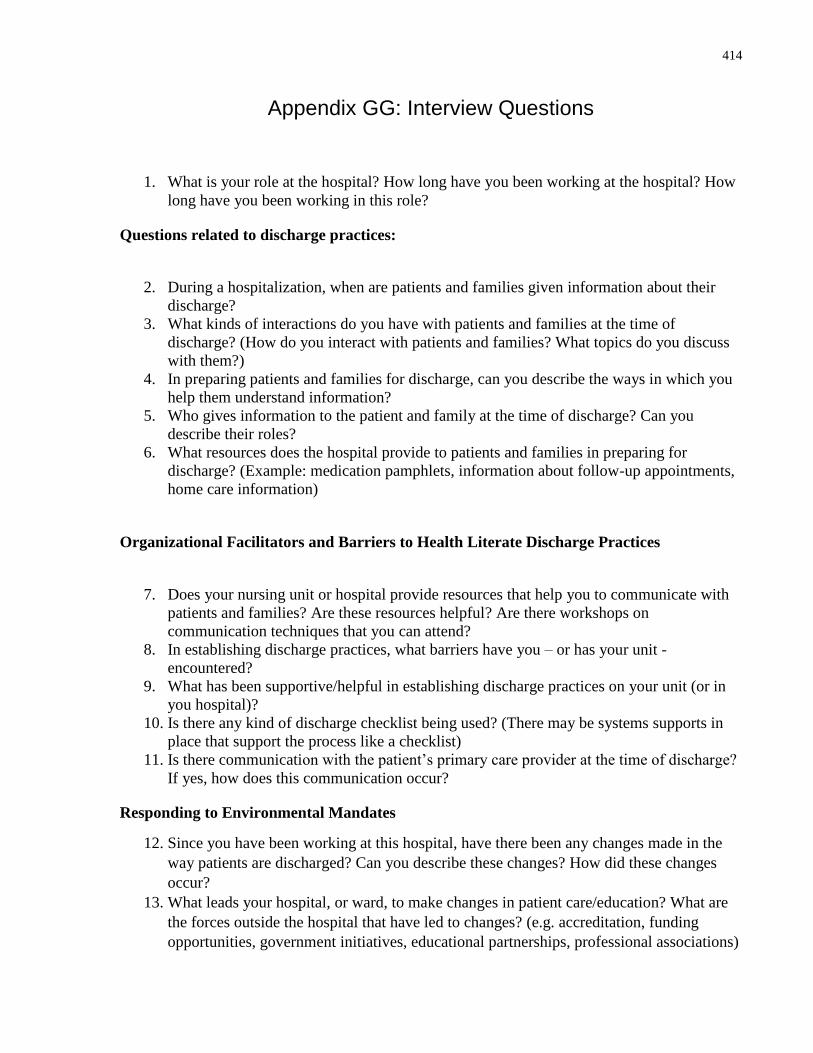
414
Appendix GG: Interview Questions
1. What is your role at the hospital? How long have you been working at the hospital? How
long have you been working in this role?
Questions related to discharge practices:
2. During a hospitalization, when are patients and families given information about their
discharge?
3. What kinds of interactions do you have with patients and families at the time of
discharge? (How do you interact with patients and families? What topics do you discuss
with them?)
4. In preparing patients and families for discharge, can you describe the ways in which you
help them understand information?
5. Who gives information to the patient and family at the time of discharge? Can you
describe their roles?
6. What resources does the hospital provide to patients and families in preparing for
discharge? (Example: medication pamphlets, information about follow-up appointments,
home care information)
Organizational Facilitators and Barriers to Health Literate Discharge Practices
7. Does your nursing unit or hospital provide resources that help you to communicate with
patients and families? Are these resources helpful? Are there workshops on
communication techniques that you can attend?
8. In establishing discharge practices, what barriers have you – or has your unit -
encountered?
9. What has been supportive/helpful in establishing discharge practices on your unit (or in
you hospital)?
10. Is there any kind of discharge checklist being used? (There may be systems supports in
place that support the process like a checklist)
11. Is there communication with the patient’s primary care provider at the time of discharge?
If yes, how does this communication occur?
Responding to Environmental Mandates
12. Since you have been working at this hospital, have there been any changes made in the
way patients are discharged? Can you describe these changes? How did these changes
occur?
13. What leads your hospital, or ward, to make changes in patient care/education? What are
the forces outside the hospital that have led to changes? (e.g. accreditation, funding
opportunities, government initiatives, educational partnerships, professional associations)
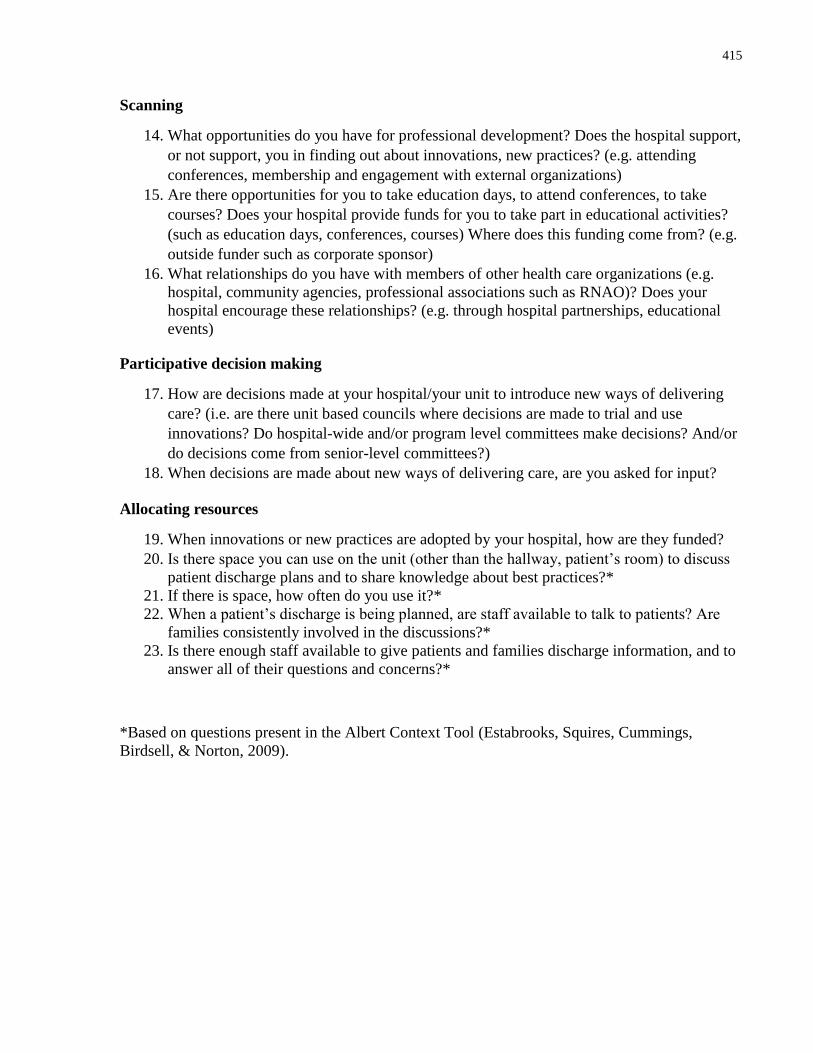
415
Scanning
14. What opportunities do you have for professional development? Does the hospital support,
or not support, you in finding out about innovations, new practices? (e.g. attending
conferences, membership and engagement with external organizations)
15. Are there opportunities for you to take education days, to attend conferences, to take
courses? Does your hospital provide funds for you to take part in educational activities?
(such as education days, conferences, courses) Where does this funding come from? (e.g.
outside funder such as corporate sponsor)
16. What relationships do you have with members of other health care organizations (e.g.
hospital, community agencies, professional associations such as RNAO)? Does your
hospital encourage these relationships? (e.g. through hospital partnerships, educational
events)
Participative decision making
17. How are decisions made at your hospital/your unit to introduce new ways of delivering
care? (i.e. are there unit based councils where decisions are made to trial and use
innovations? Do hospital-wide and/or program level committees make decisions? And/or
do decisions come from senior-level committees?)
18. When decisions are made about new ways of delivering care, are you asked for input?
Allocating resources
19. When innovations or new practices are adopted by your hospital, how are they funded?
20. Is there space you can use on the unit (other than the hallway, patient’s room) to discuss
patient discharge plans and to share knowledge about best practices?*
21. If there is space, how often do you use it?*
22. When a patient’s discharge is being planned, are staff available to talk to patients? Are
families consistently involved in the discussions?*
23. Is there enough staff available to give patients and families discharge information, and to
answer all of their questions and concerns?*
*Based on questions present in the Albert Context Tool (Estabrooks, Squires, Cummings,
Birdsell, & Norton, 2009).
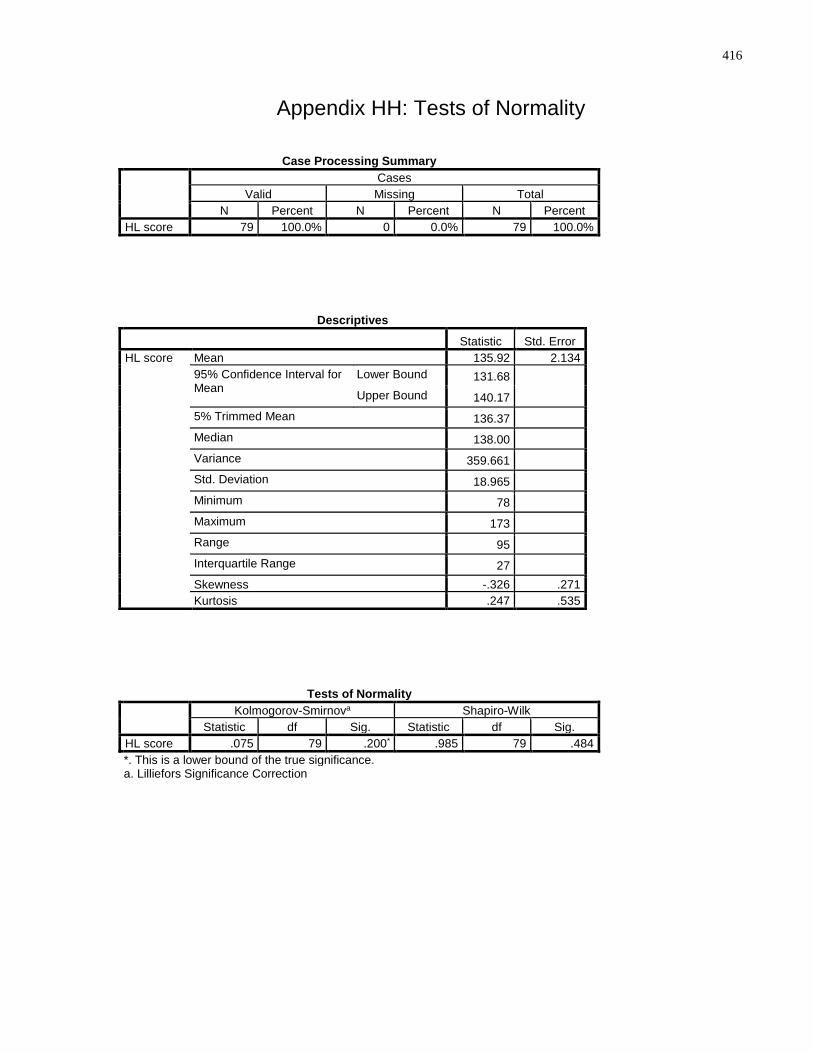
416
Appendix HH: Tests of Normality
Case Processing Summary
Cases
Valid Missing Total
N Percent N Percent N Percent
HL score 79 100.0% 0 0.0% 79 100.0%
Descriptives
Statistic Std. Error
HL score Mean 135.92 2.134
95% Confidence Interval for Mean
Lower Bound 131.68 Upper Bound 140.17
5% Trimmed Mean 136.37 Median 138.00 Variance 359.661 Std. Deviation 18.965 Minimum 78 Maximum 173 Range 95 Interquartile Range 27 Skewness -.326 .271
Kurtosis .247 .535
Tests of Normality
Kolmogorov-Smirnova Shapiro-Wilk
Statistic df Sig. Statistic df Sig.
HL score .075 79 .200* .985 79 .484
*. This is a lower bound of the true significance. a. Lilliefors Significance Correction
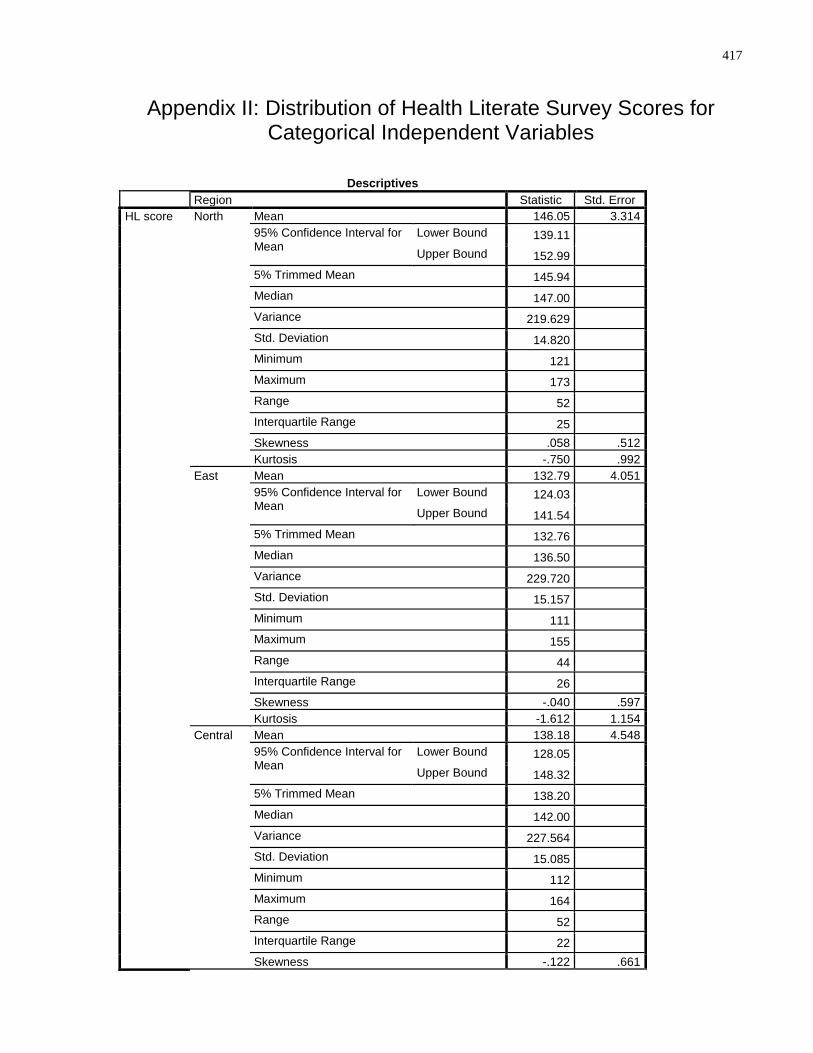
417
Appendix II: Distribution of Health Literate Survey Scores for Categorical Independent Variables
Descriptives
Region Statistic Std. Error
HL score North Mean 146.05 3.314
95% Confidence Interval for Mean
Lower Bound 139.11 Upper Bound 152.99
5% Trimmed Mean 145.94 Median 147.00 Variance 219.629 Std. Deviation 14.820 Minimum 121 Maximum 173 Range 52 Interquartile Range 25 Skewness .058 .512
Kurtosis -.750 .992
East Mean 132.79 4.051
95% Confidence Interval for Mean
Lower Bound 124.03 Upper Bound 141.54
5% Trimmed Mean 132.76 Median 136.50 Variance 229.720 Std. Deviation 15.157 Minimum 111 Maximum 155 Range 44 Interquartile Range 26 Skewness -.040 .597
Kurtosis -1.612 1.154
Central Mean 138.18 4.548
95% Confidence Interval for Mean
Lower Bound 128.05 Upper Bound 148.32
5% Trimmed Mean 138.20 Median 142.00 Variance 227.564 Std. Deviation 15.085 Minimum 112 Maximum 164 Range 52 Interquartile Range 22 Skewness -.122 .661
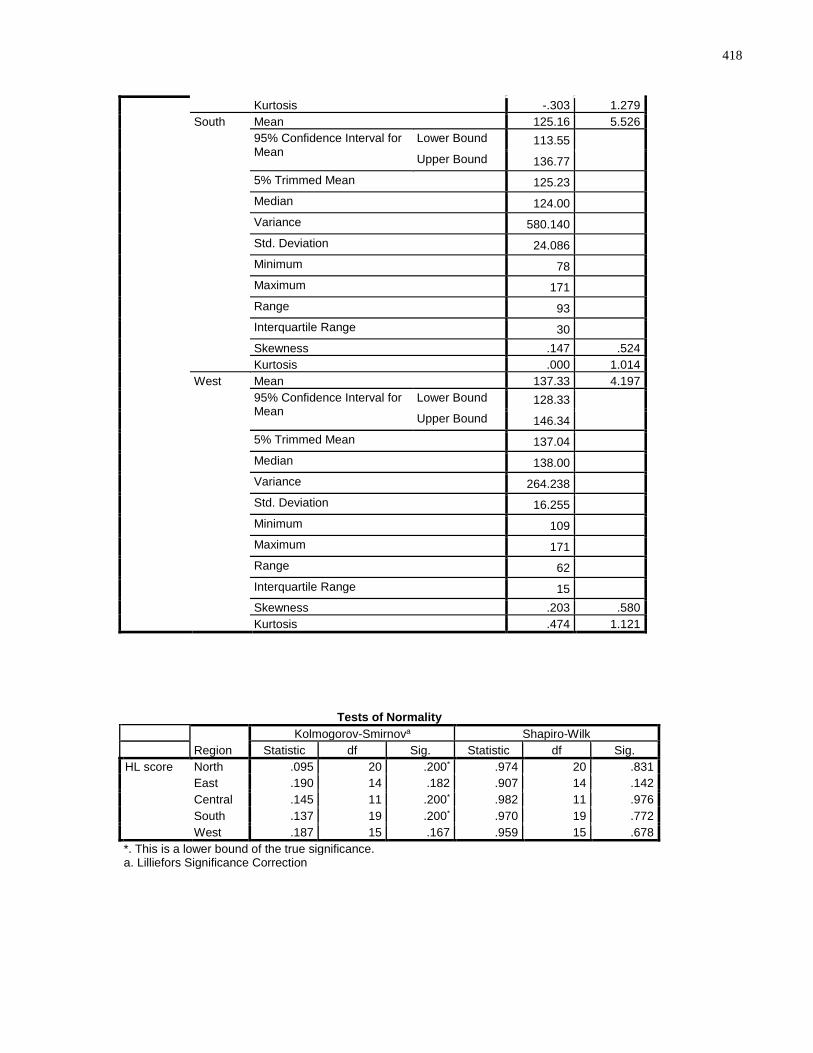
418
Kurtosis -.303 1.279
South Mean 125.16 5.526
95% Confidence Interval for Mean
Lower Bound 113.55 Upper Bound 136.77
5% Trimmed Mean 125.23 Median 124.00 Variance 580.140 Std. Deviation 24.086 Minimum 78 Maximum 171 Range 93 Interquartile Range 30 Skewness .147 .524
Kurtosis .000 1.014
West Mean 137.33 4.197
95% Confidence Interval for Mean
Lower Bound 128.33 Upper Bound 146.34
5% Trimmed Mean 137.04 Median 138.00 Variance 264.238 Std. Deviation 16.255 Minimum 109 Maximum 171 Range 62 Interquartile Range 15 Skewness .203 .580
Kurtosis .474 1.121
Tests of Normality
Region
Kolmogorov-Smirnova Shapiro-Wilk
Statistic df Sig. Statistic df Sig.
HL score North .095 20 .200* .974 20 .831
East .190 14 .182 .907 14 .142
Central .145 11 .200* .982 11 .976
South .137 19 .200* .970 19 .772
West .187 15 .167 .959 15 .678
*. This is a lower bound of the true significance. a. Lilliefors Significance Correction
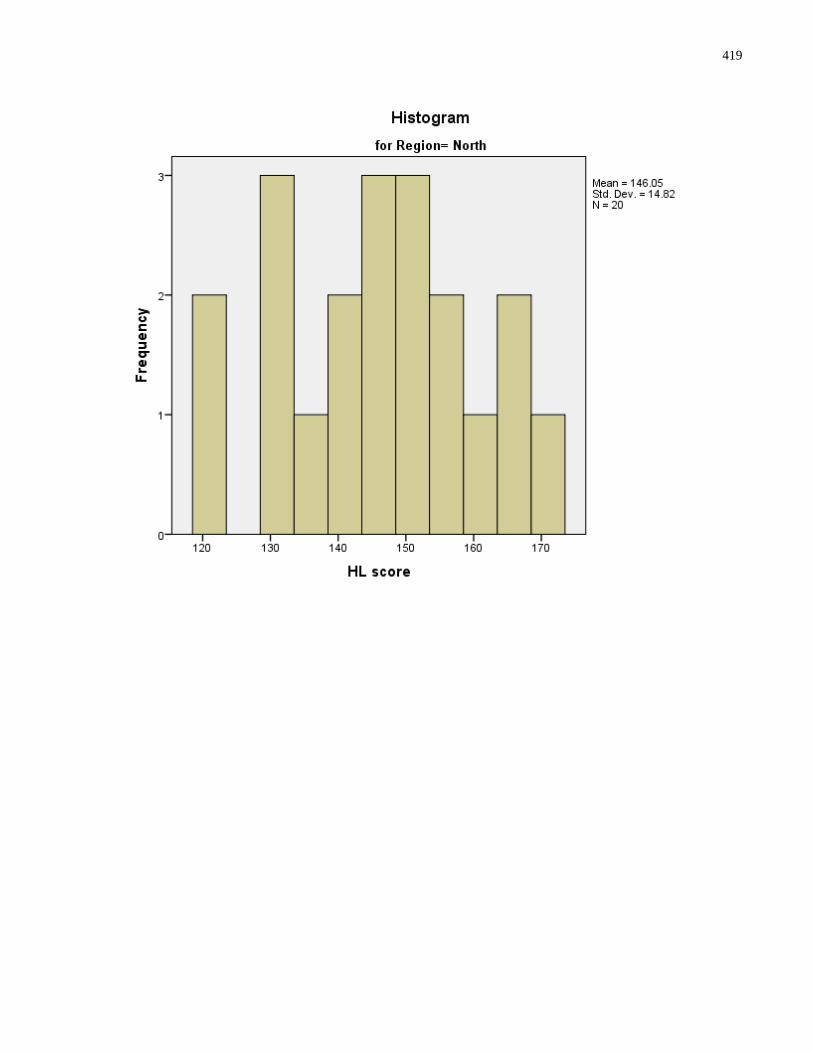
419
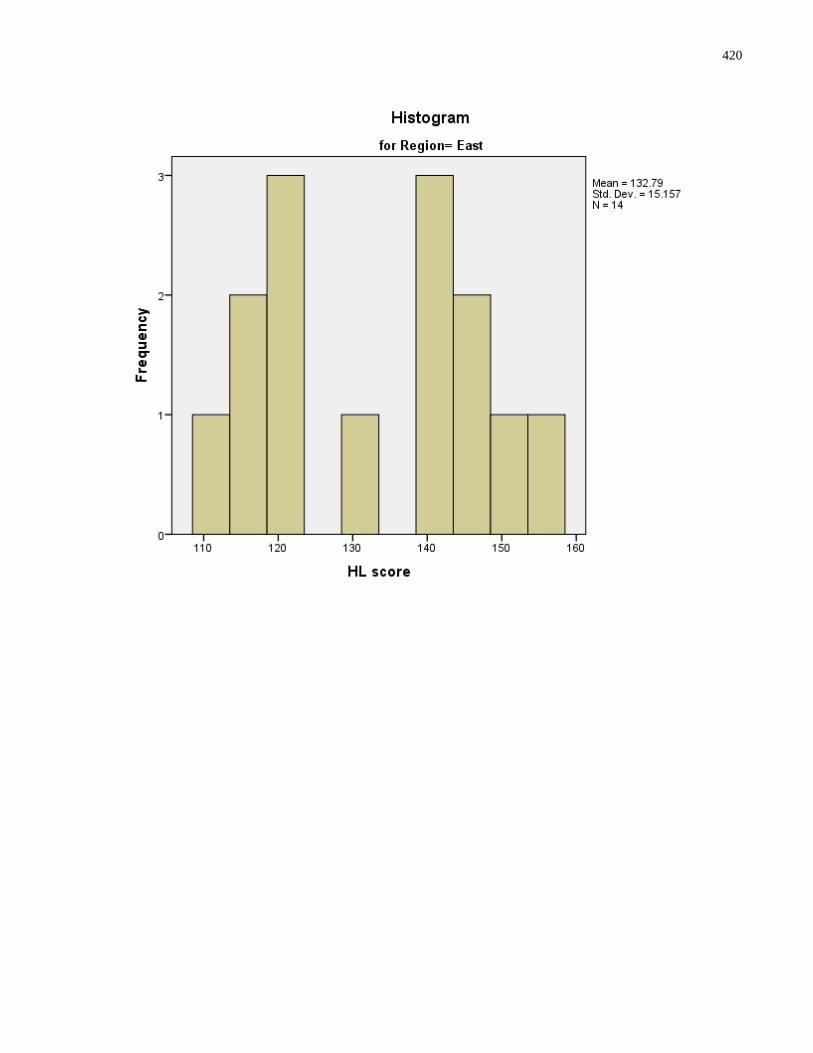
420
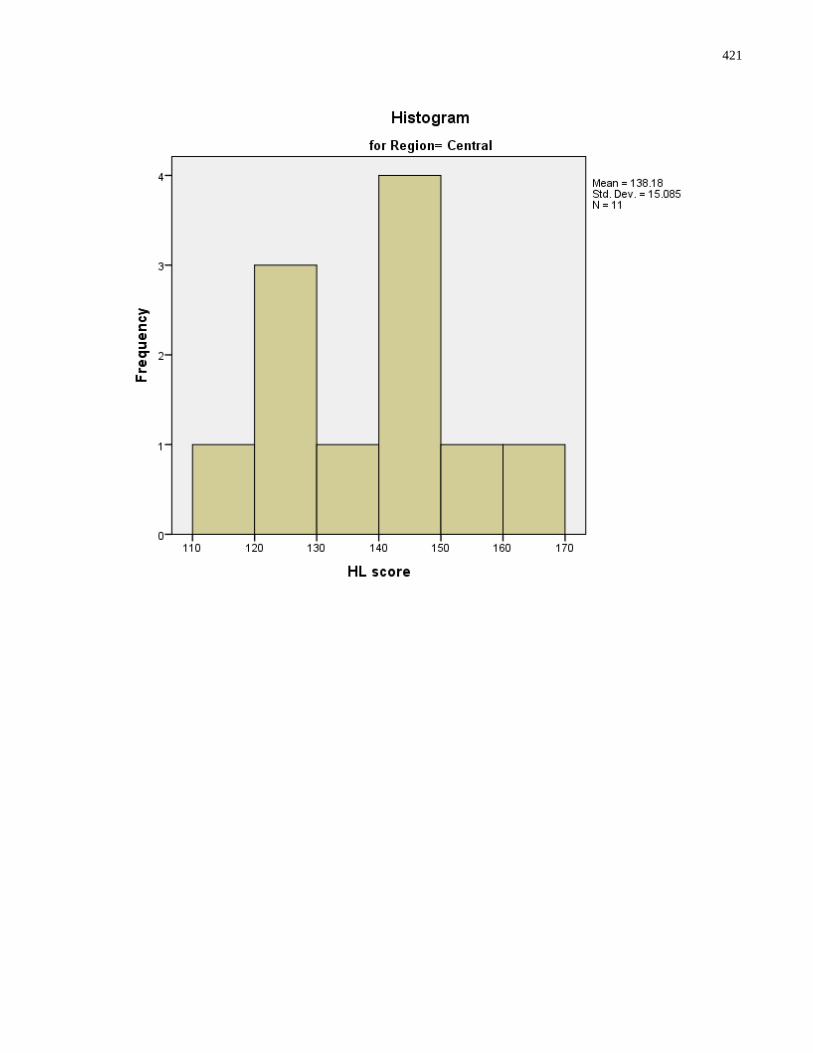
421
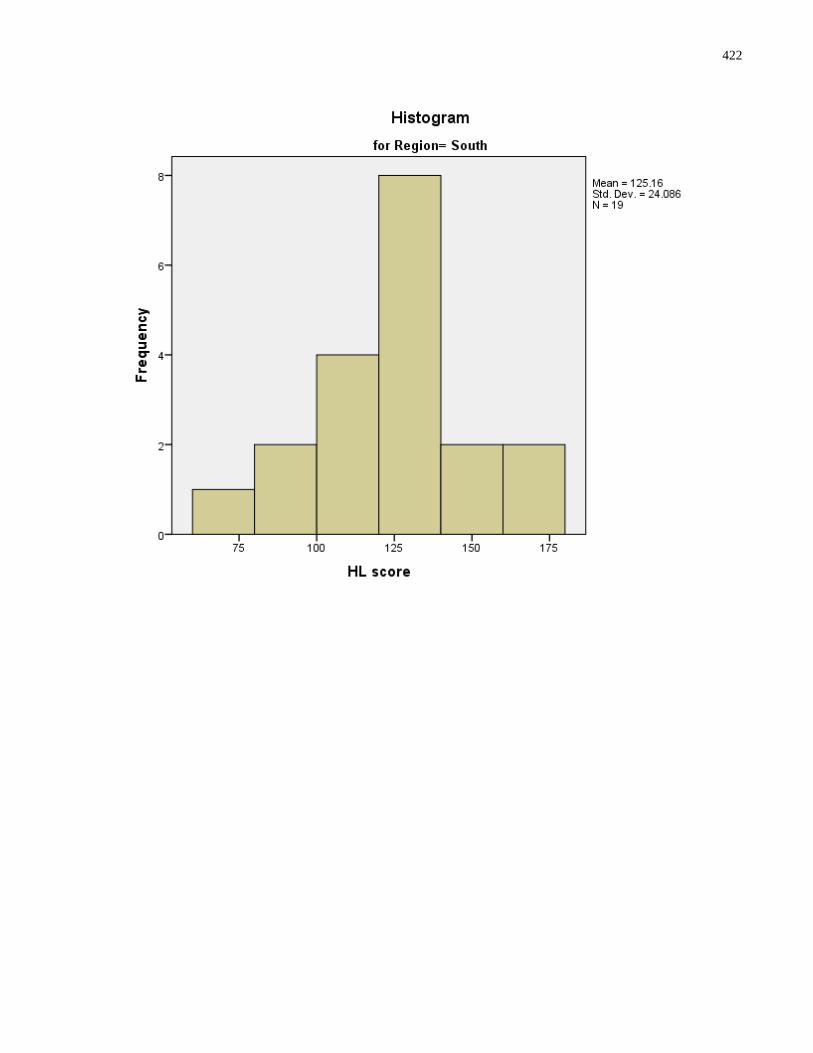
422
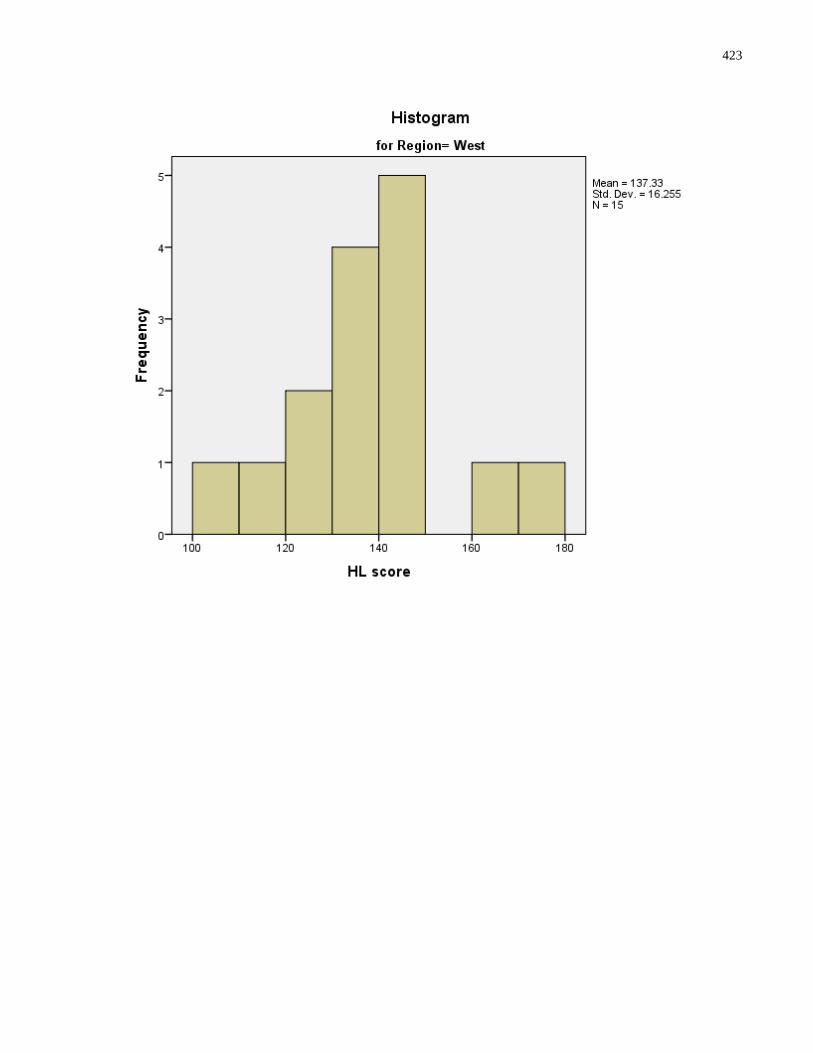
423
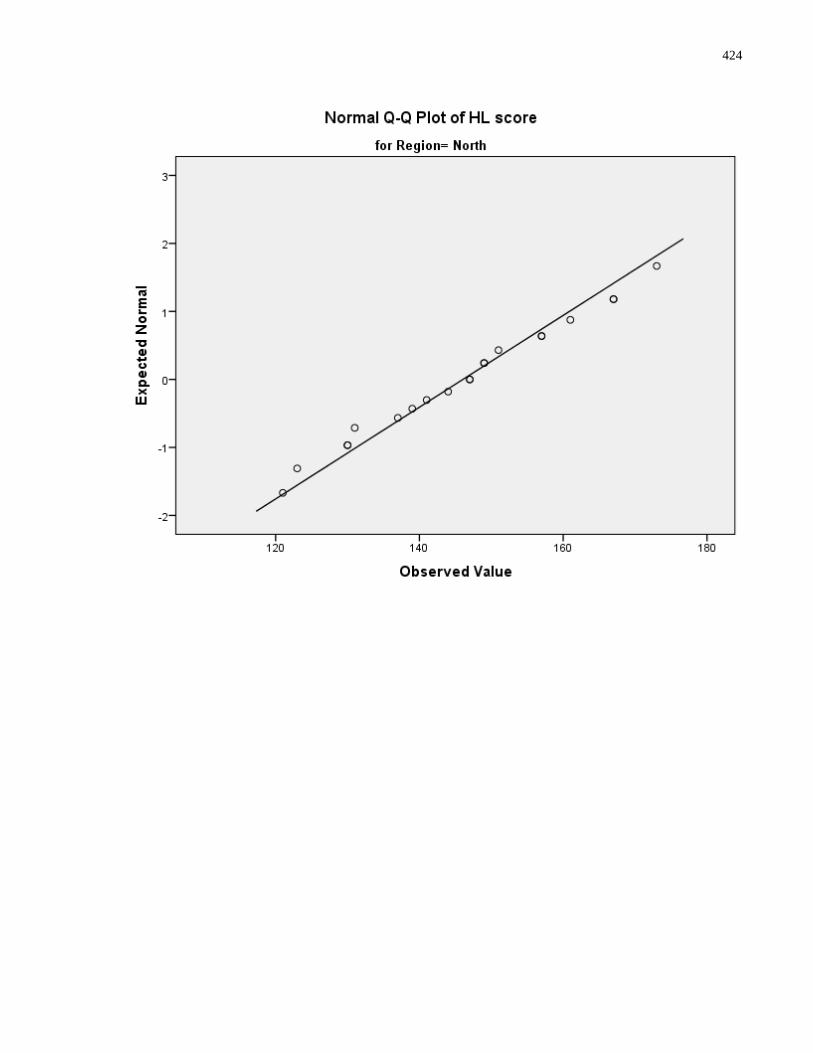
424
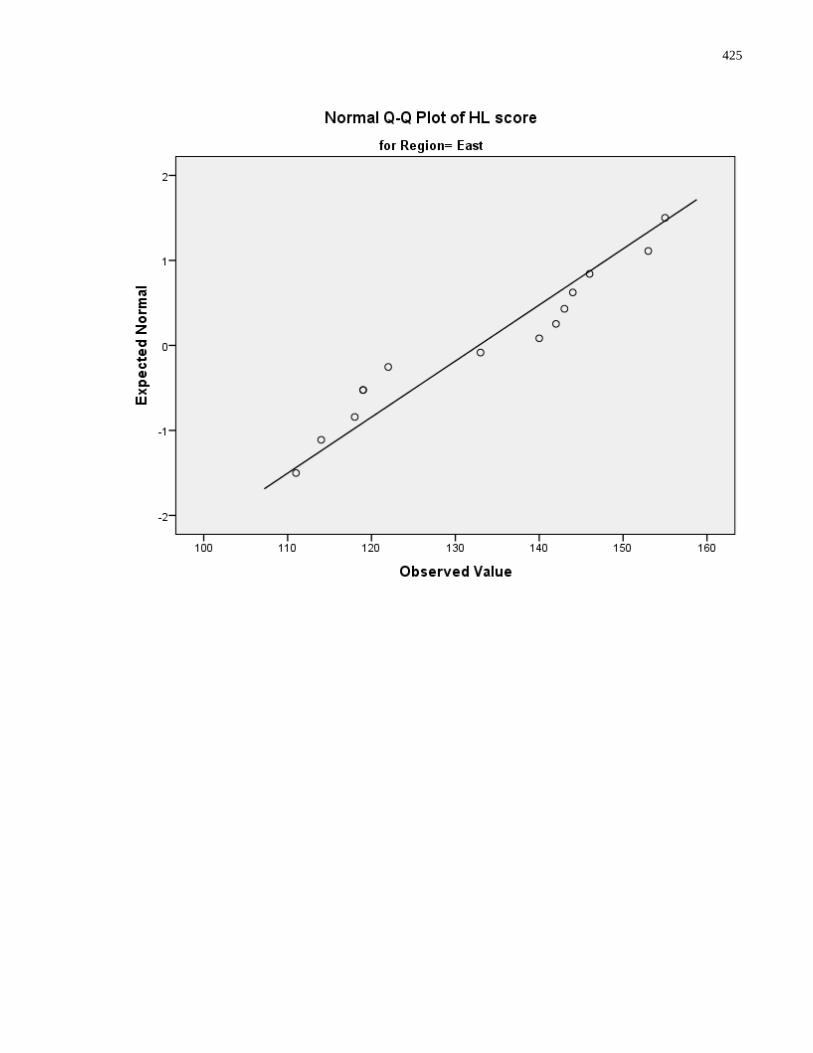
425

426
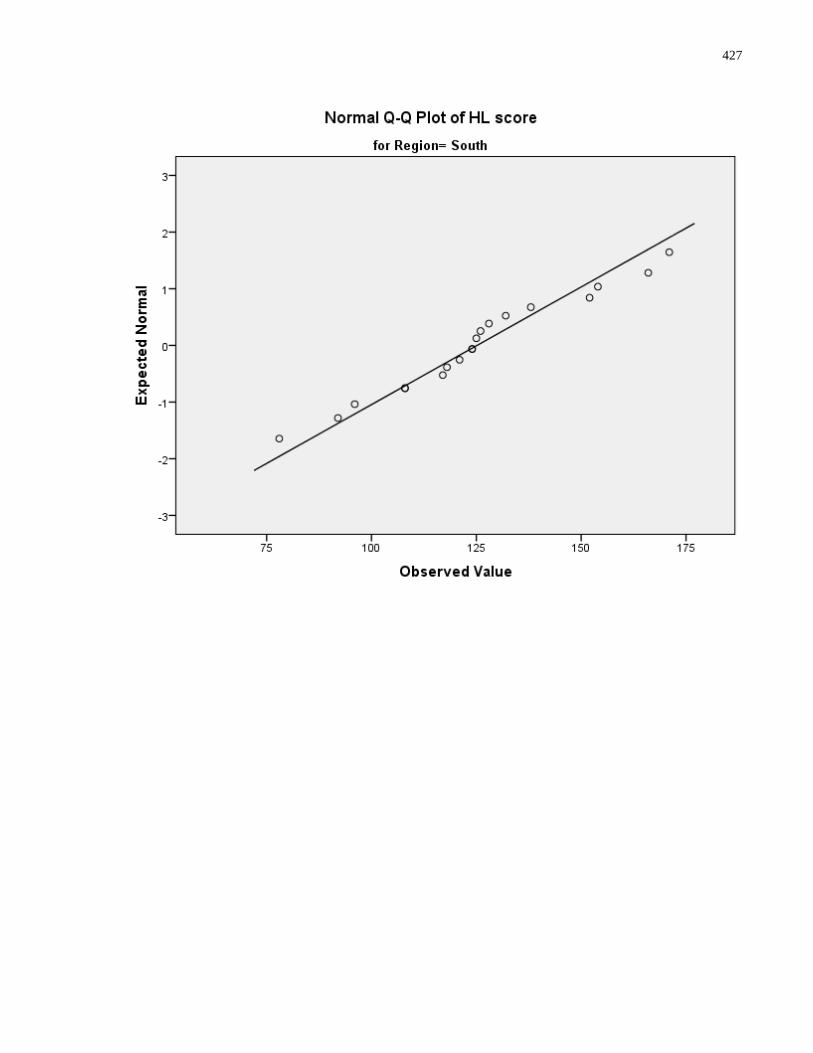
427
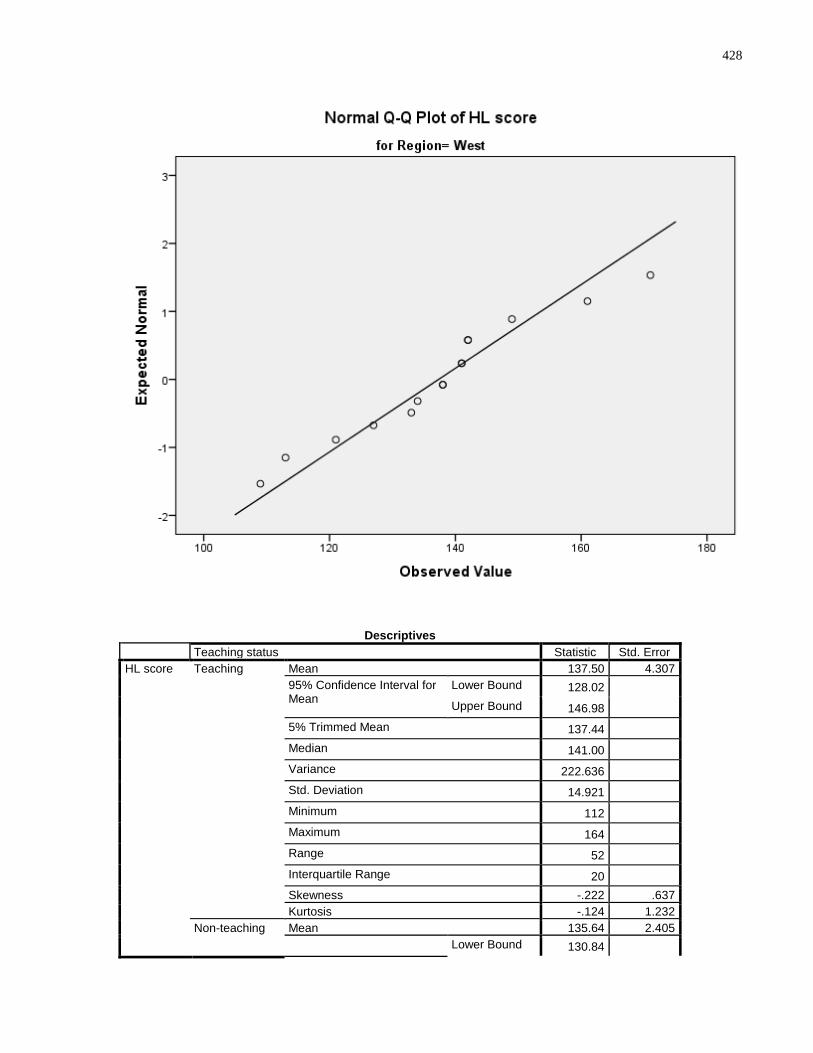
428
Descriptives
Teaching status Statistic Std. Error
HL score Teaching Mean 137.50 4.307
95% Confidence Interval for Mean
Lower Bound 128.02 Upper Bound 146.98
5% Trimmed Mean 137.44 Median 141.00 Variance 222.636 Std. Deviation 14.921 Minimum 112 Maximum 164 Range 52 Interquartile Range 20 Skewness -.222 .637
Kurtosis -.124 1.232
Non-teaching Mean 135.64 2.405
Lower Bound 130.84
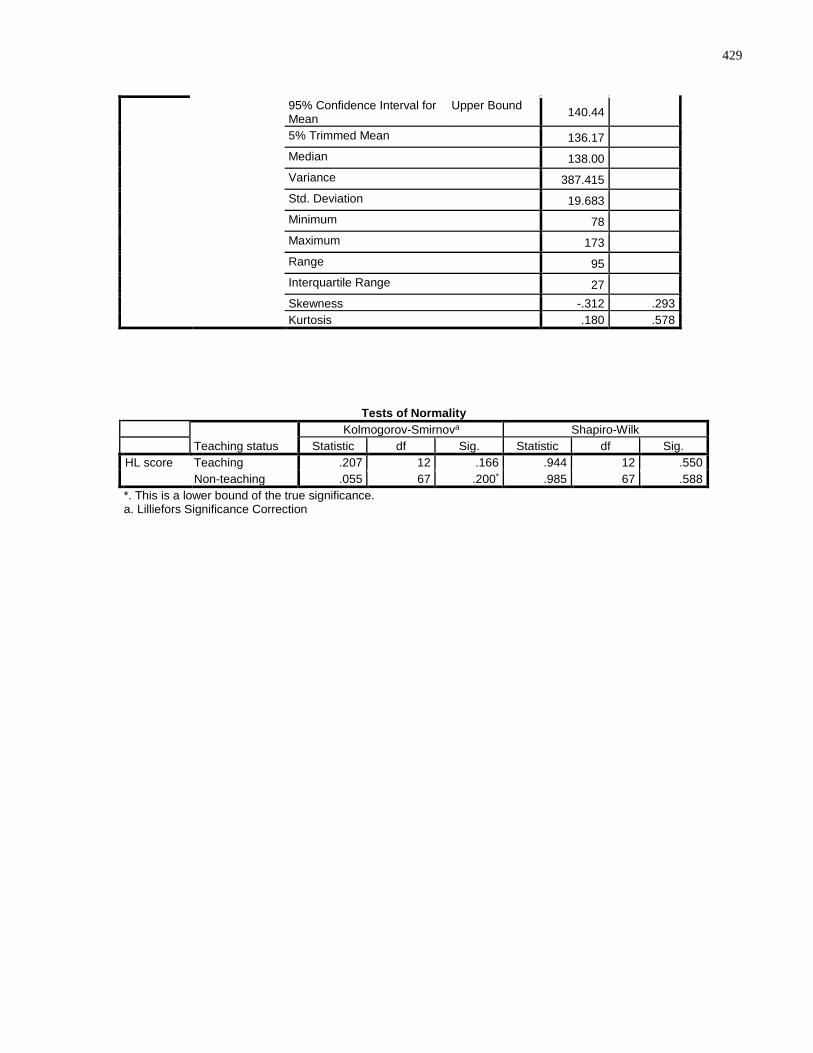
429
95% Confidence Interval for Mean
Upper Bound 140.44
5% Trimmed Mean 136.17 Median 138.00 Variance 387.415 Std. Deviation 19.683 Minimum 78 Maximum 173 Range 95 Interquartile Range 27 Skewness -.312 .293
Kurtosis .180 .578
Tests of Normality
Teaching status
Kolmogorov-Smirnova Shapiro-Wilk
Statistic df Sig. Statistic df Sig.
HL score Teaching .207 12 .166 .944 12 .550
Non-teaching .055 67 .200* .985 67 .588
*. This is a lower bound of the true significance. a. Lilliefors Significance Correction
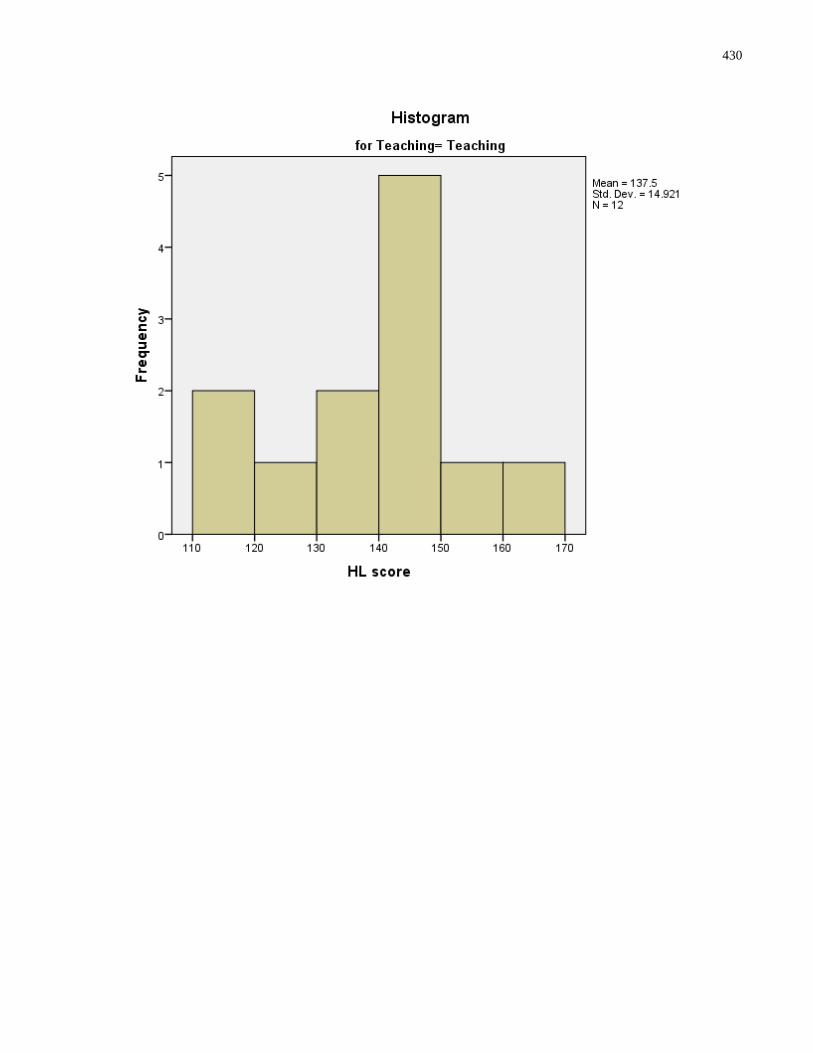
430
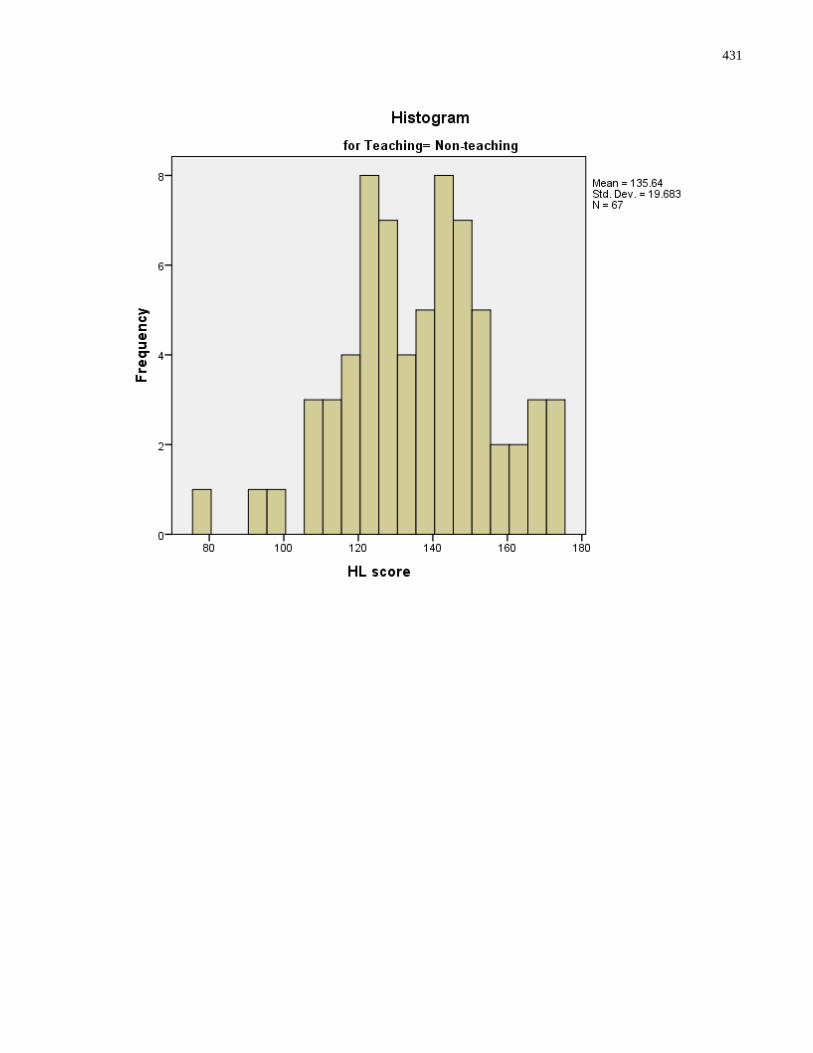
431
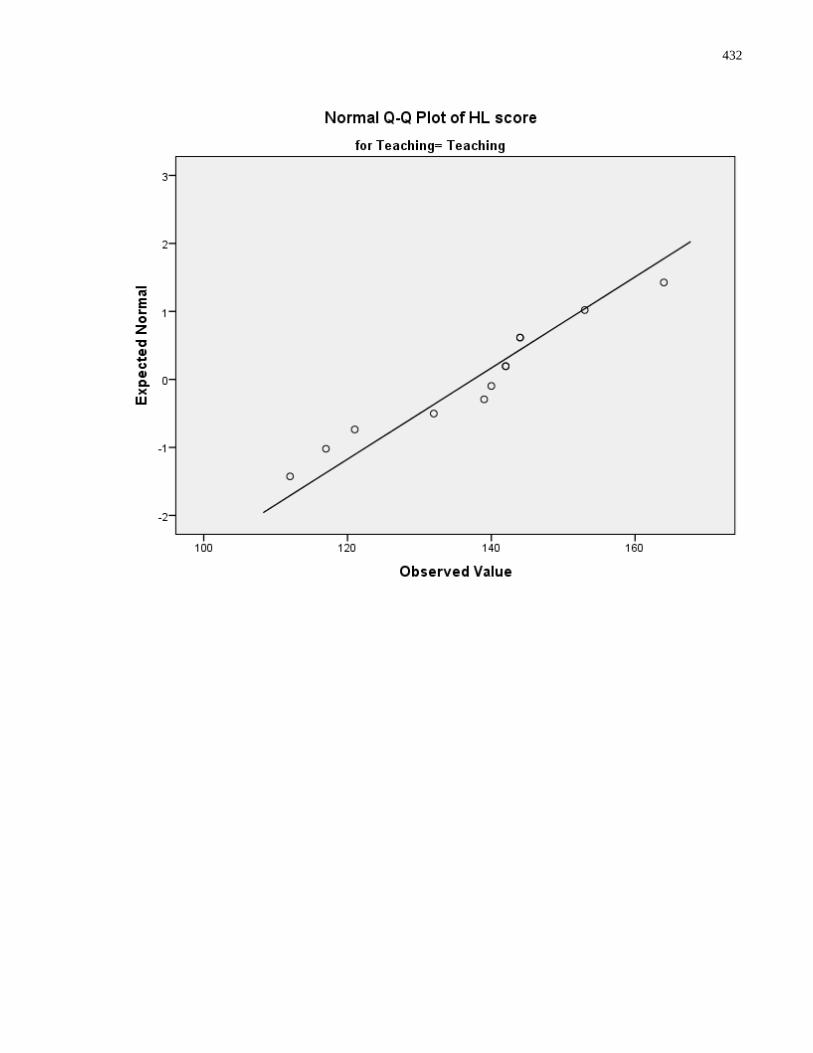
432
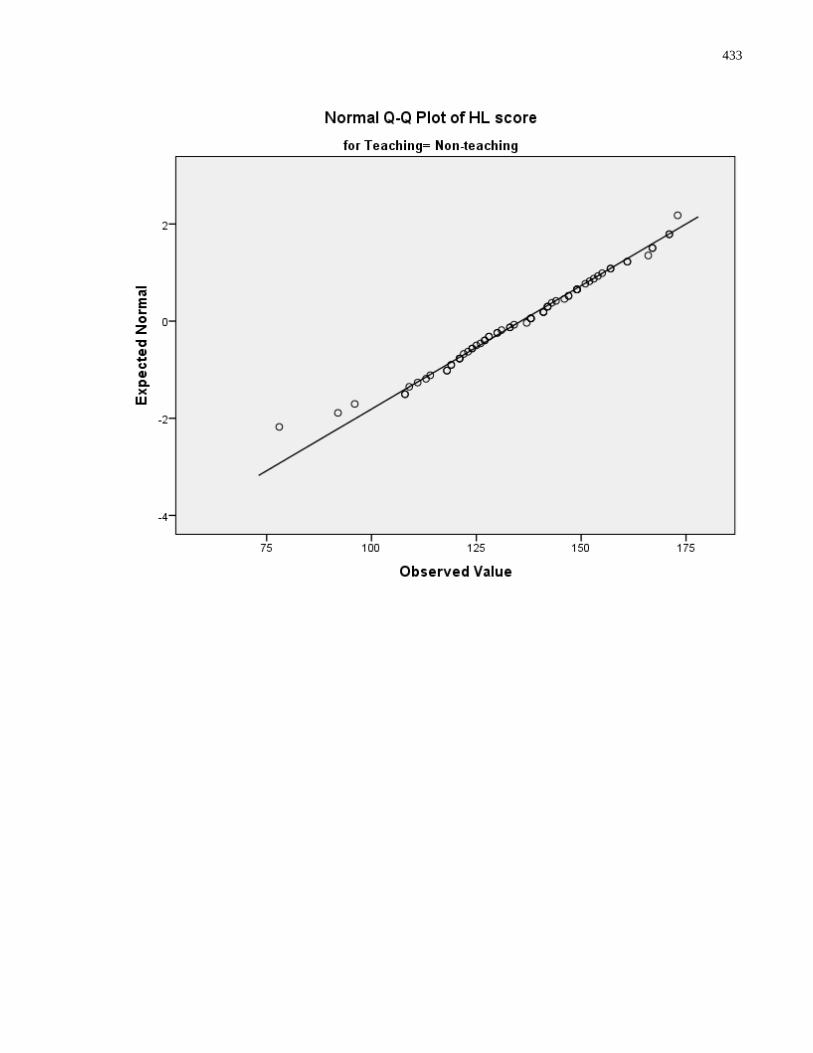
433
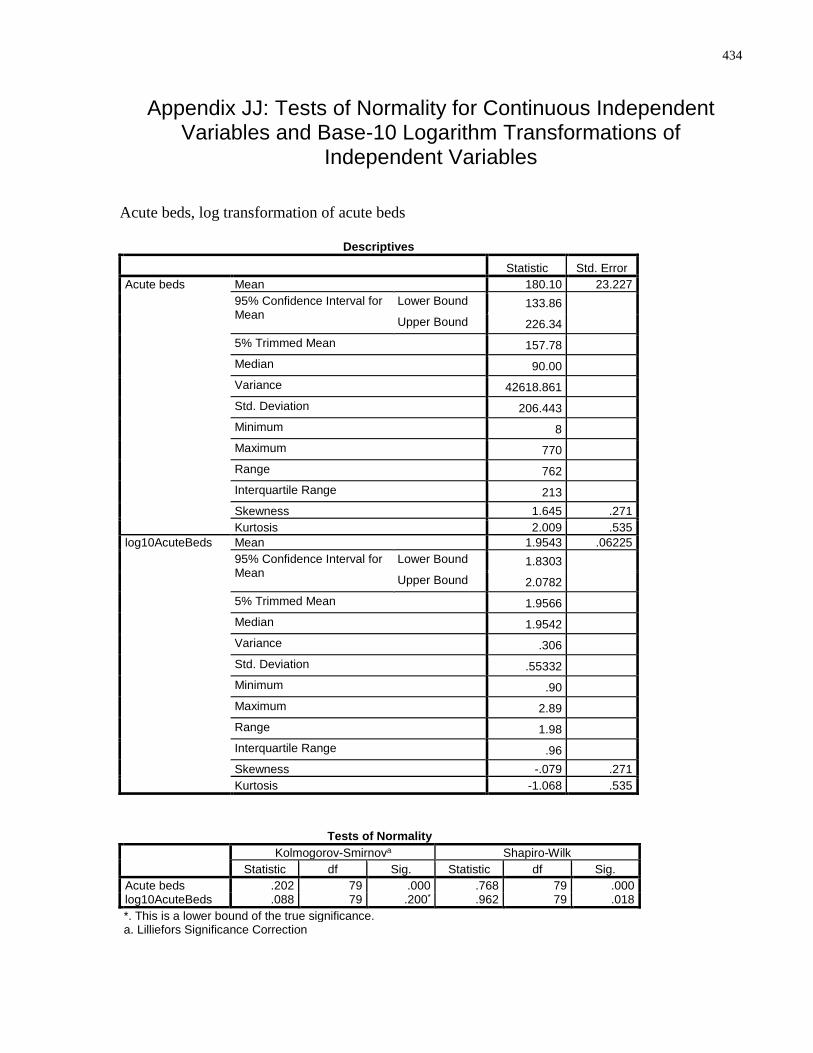
434
Appendix JJ: Tests of Normality for Continuous Independent Variables and Base-10 Logarithm Transformations of
Independent Variables
Acute beds, log transformation of acute beds
Descriptives
Statistic Std. Error
Acute beds Mean 180.10 23.227
95% Confidence Interval for Mean
Lower Bound 133.86 Upper Bound 226.34
5% Trimmed Mean 157.78 Median 90.00 Variance 42618.861 Std. Deviation 206.443 Minimum 8 Maximum 770 Range 762 Interquartile Range 213 Skewness 1.645 .271
Kurtosis 2.009 .535
log10AcuteBeds Mean 1.9543 .06225
95% Confidence Interval for Mean
Lower Bound 1.8303 Upper Bound 2.0782
5% Trimmed Mean 1.9566 Median 1.9542 Variance .306 Std. Deviation .55332 Minimum .90 Maximum 2.89 Range 1.98 Interquartile Range .96 Skewness -.079 .271
Kurtosis -1.068 .535
Tests of Normality
Kolmogorov-Smirnova Shapiro-Wilk
Statistic df Sig. Statistic df Sig.
Acute beds .202 79 .000 .768 79 .000 log10AcuteBeds .088 79 .200* .962 79 .018
*. This is a lower bound of the true significance. a. Lilliefors Significance Correction
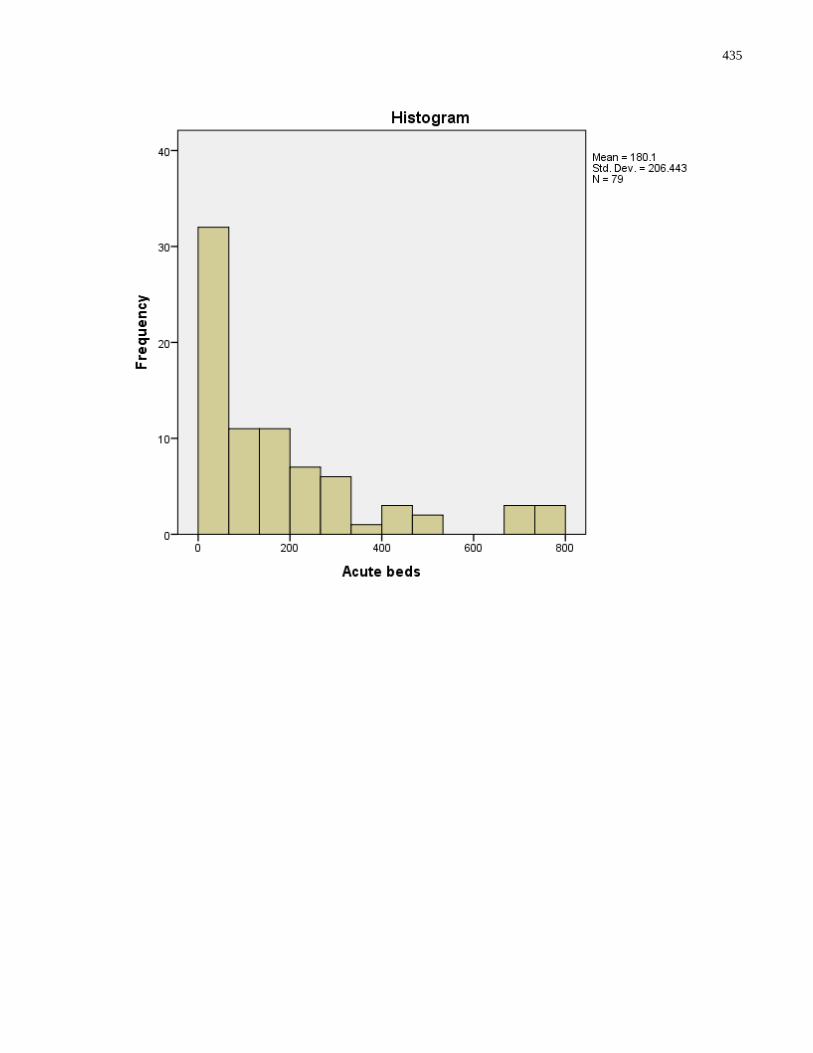
435
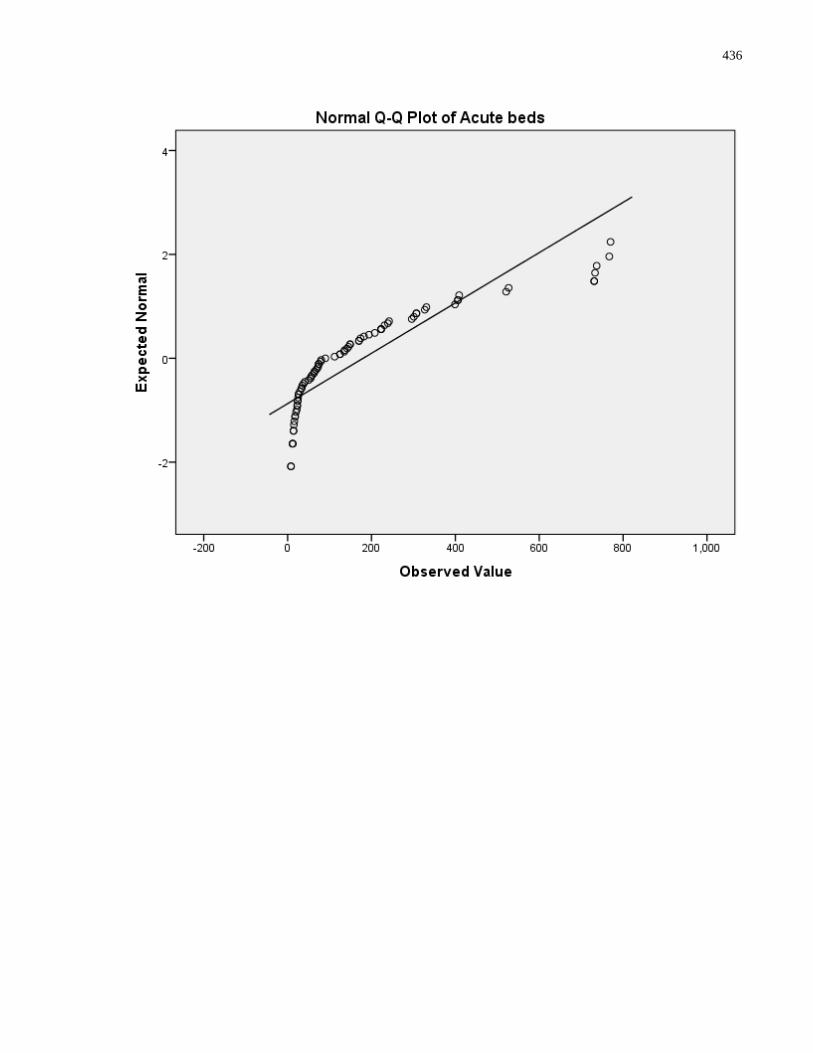
436
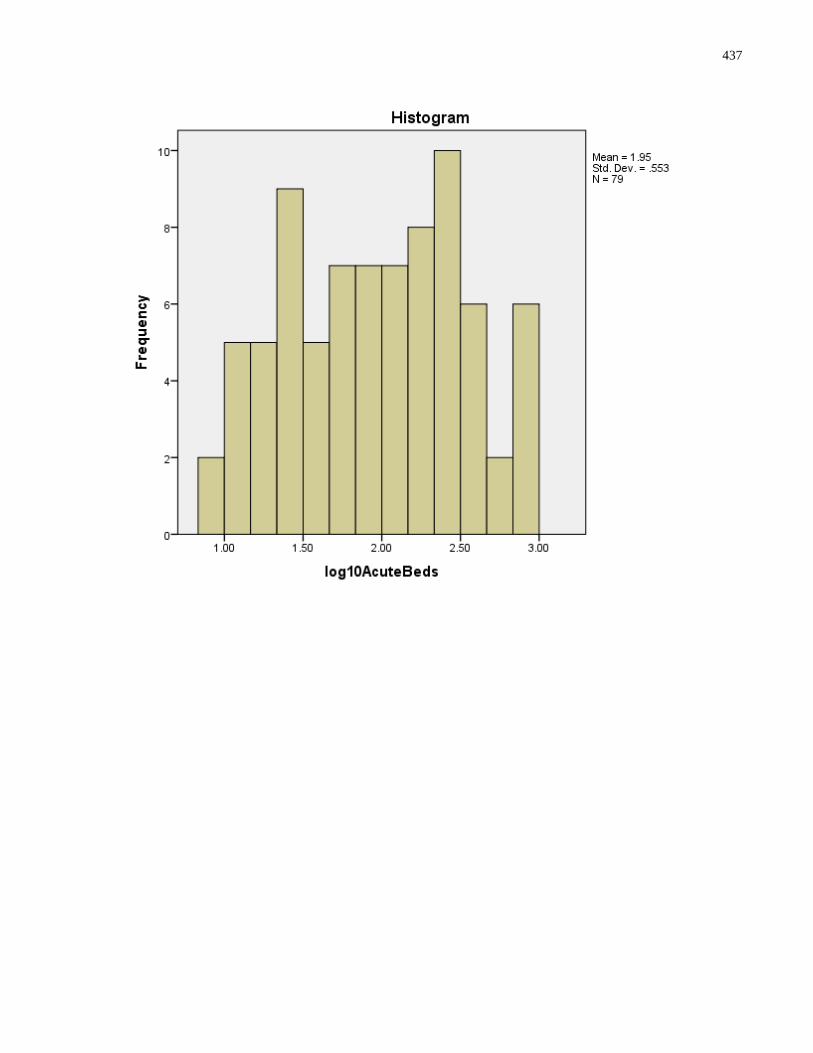
437
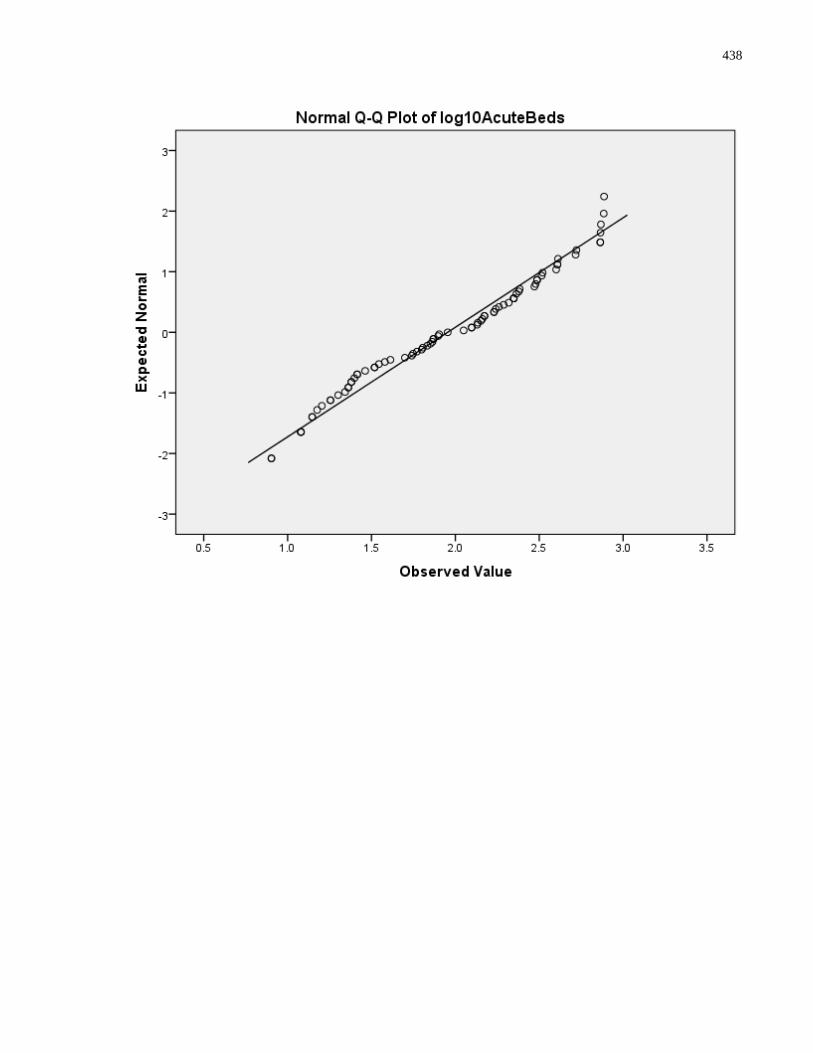
438
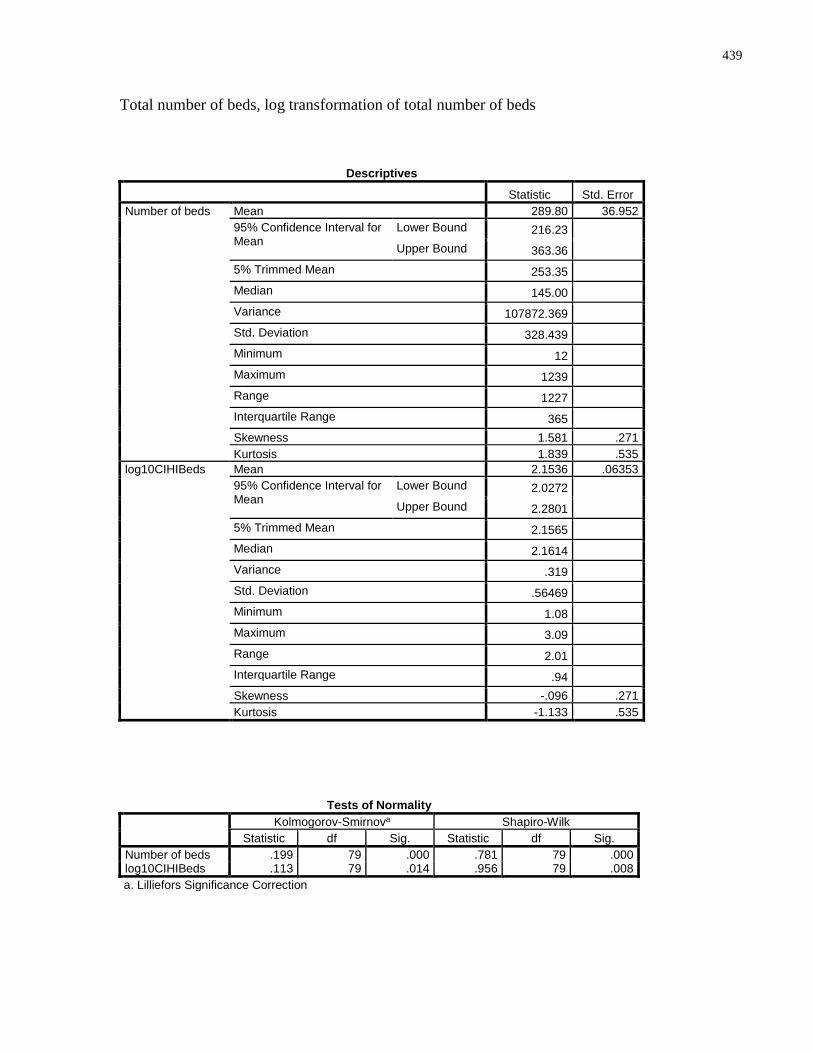
439
Total number of beds, log transformation of total number of beds
Descriptives
Statistic Std. Error
Number of beds Mean 289.80 36.952
95% Confidence Interval for Mean
Lower Bound 216.23 Upper Bound 363.36
5% Trimmed Mean 253.35 Median 145.00 Variance 107872.369 Std. Deviation 328.439 Minimum 12 Maximum 1239 Range 1227 Interquartile Range 365 Skewness 1.581 .271
Kurtosis 1.839 .535
log10CIHIBeds Mean 2.1536 .06353
95% Confidence Interval for Mean
Lower Bound 2.0272 Upper Bound 2.2801
5% Trimmed Mean 2.1565 Median 2.1614 Variance .319 Std. Deviation .56469 Minimum 1.08 Maximum 3.09 Range 2.01 Interquartile Range .94 Skewness -.096 .271
Kurtosis -1.133 .535
Tests of Normality
Kolmogorov-Smirnova Shapiro-Wilk
Statistic df Sig. Statistic df Sig.
Number of beds .199 79 .000 .781 79 .000 log10CIHIBeds .113 79 .014 .956 79 .008
a. Lilliefors Significance Correction
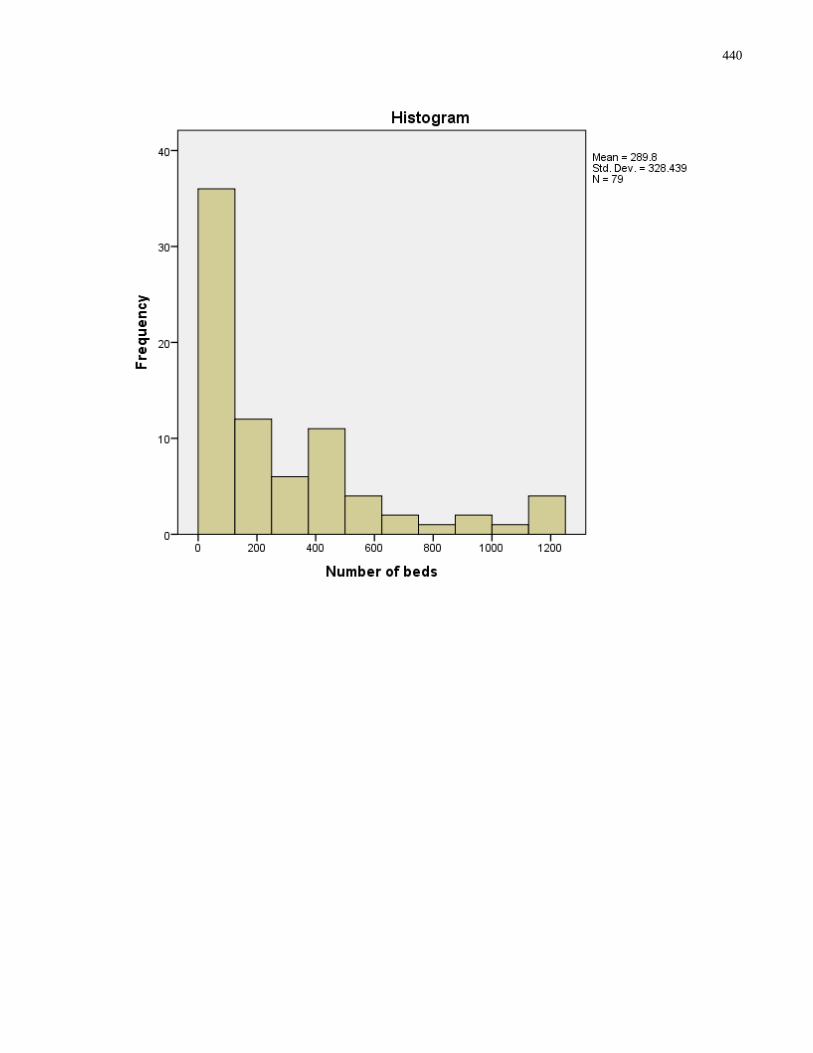
440
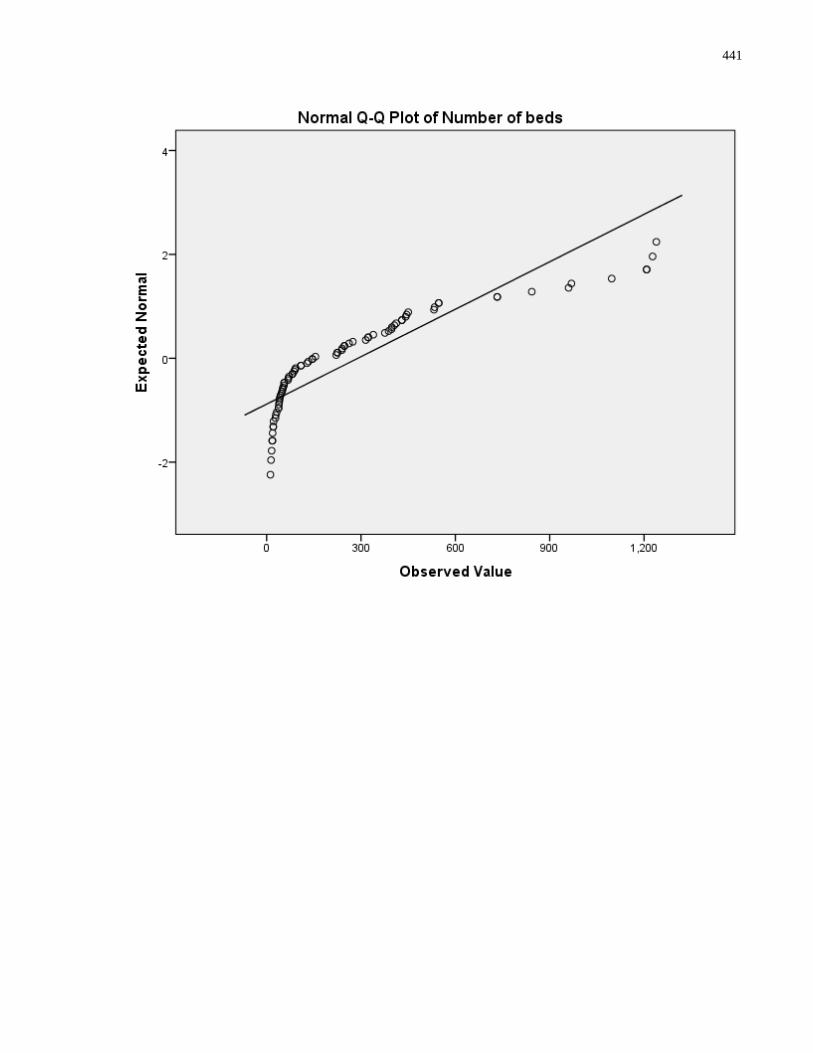
441
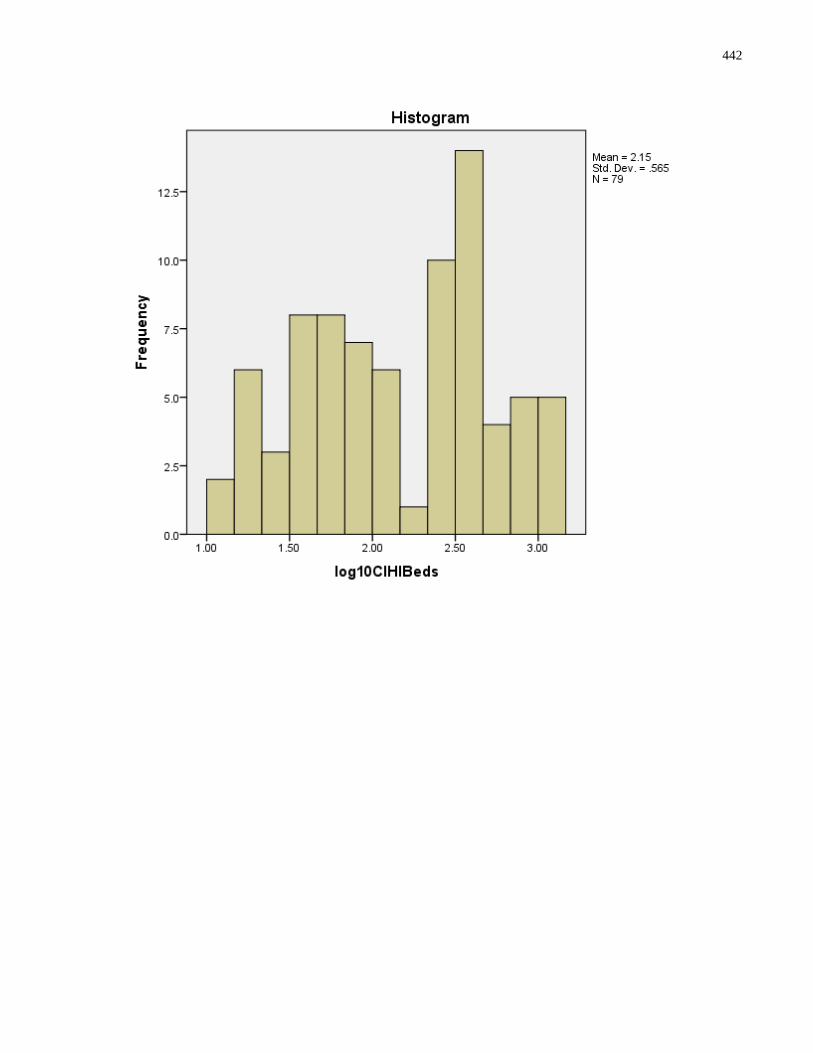
442
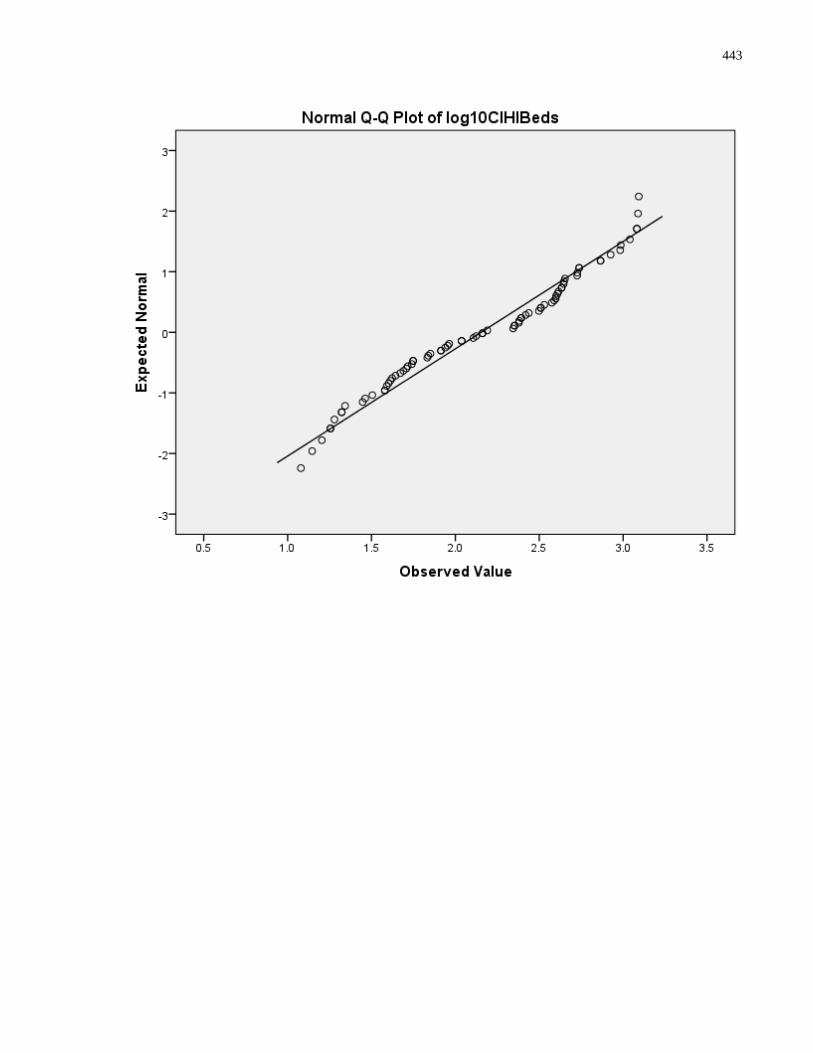
443
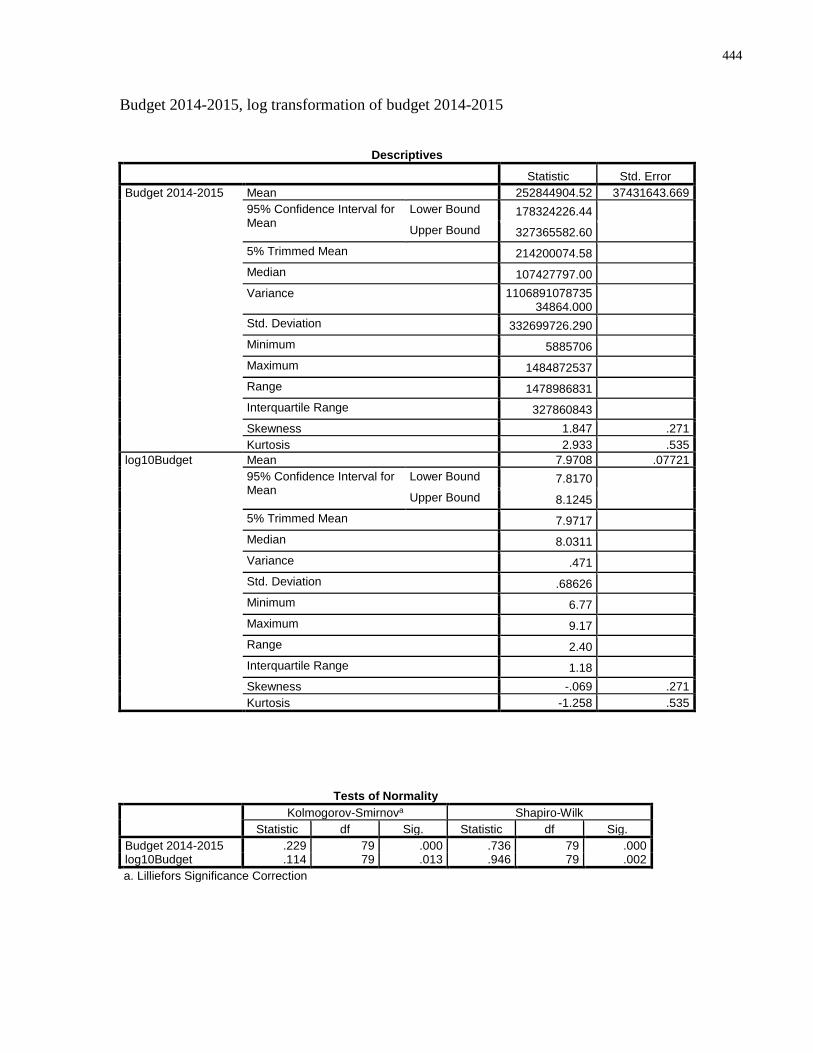
444
Budget 2014-2015, log transformation of budget 2014-2015
Descriptives
Statistic Std. Error
Budget 2014-2015 Mean 252844904.52 37431643.669
95% Confidence Interval for Mean
Lower Bound 178324226.44 Upper Bound 327365582.60
5% Trimmed Mean 214200074.58 Median 107427797.00 Variance 1106891078735
34864.000
Std. Deviation 332699726.290 Minimum 5885706 Maximum 1484872537 Range 1478986831 Interquartile Range 327860843 Skewness 1.847 .271
Kurtosis 2.933 .535
log10Budget Mean 7.9708 .07721
95% Confidence Interval for Mean
Lower Bound 7.8170 Upper Bound 8.1245
5% Trimmed Mean 7.9717 Median 8.0311 Variance .471 Std. Deviation .68626 Minimum 6.77 Maximum 9.17 Range 2.40 Interquartile Range 1.18 Skewness -.069 .271
Kurtosis -1.258 .535
Tests of Normality
Kolmogorov-Smirnova Shapiro-Wilk
Statistic df Sig. Statistic df Sig.
Budget 2014-2015 .229 79 .000 .736 79 .000 log10Budget .114 79 .013 .946 79 .002
a. Lilliefors Significance Correction
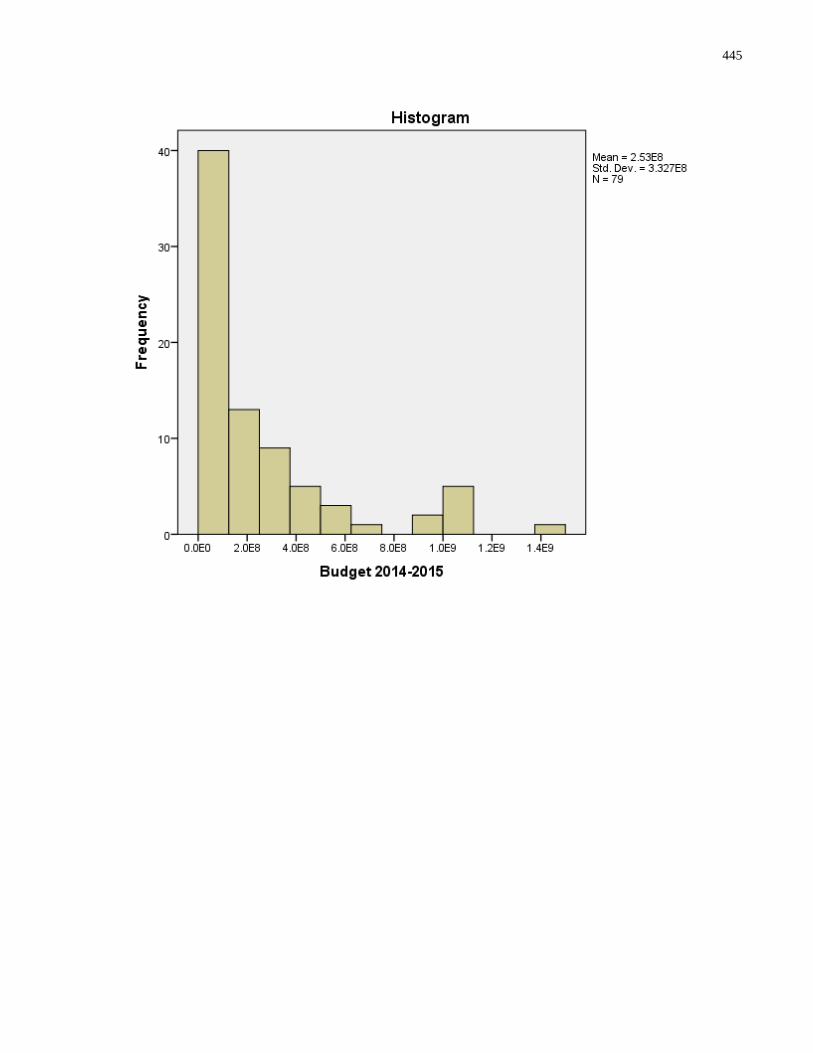
445
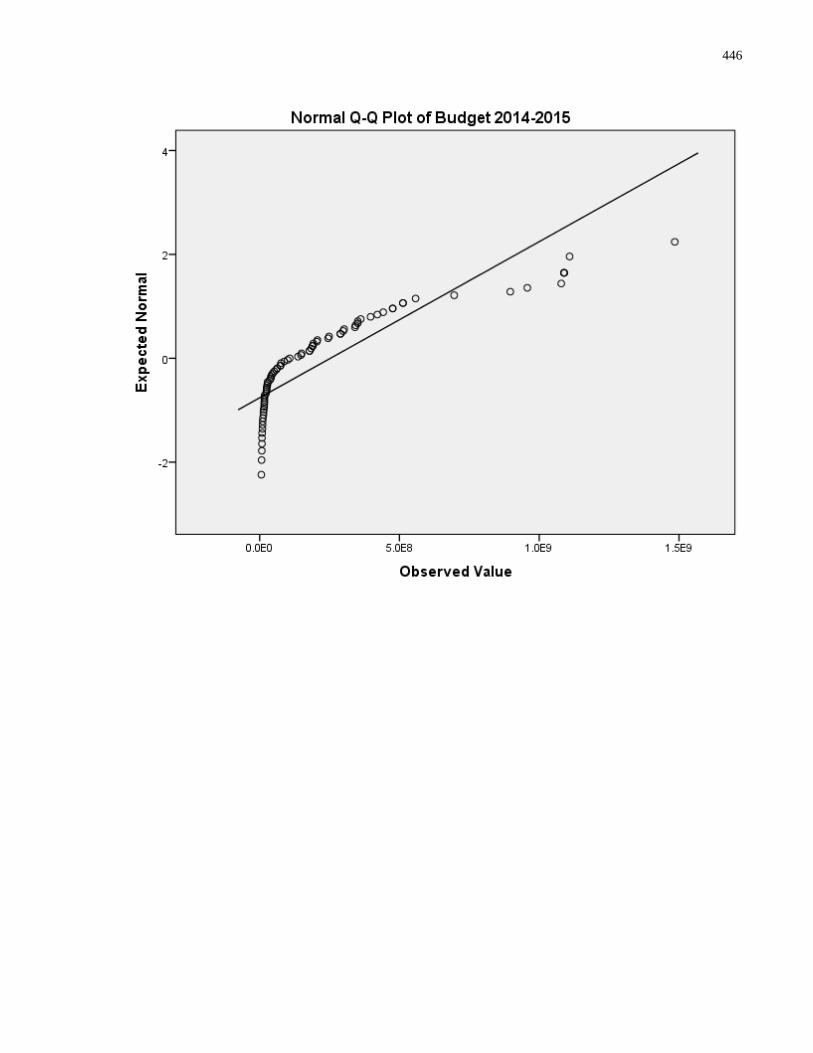
446
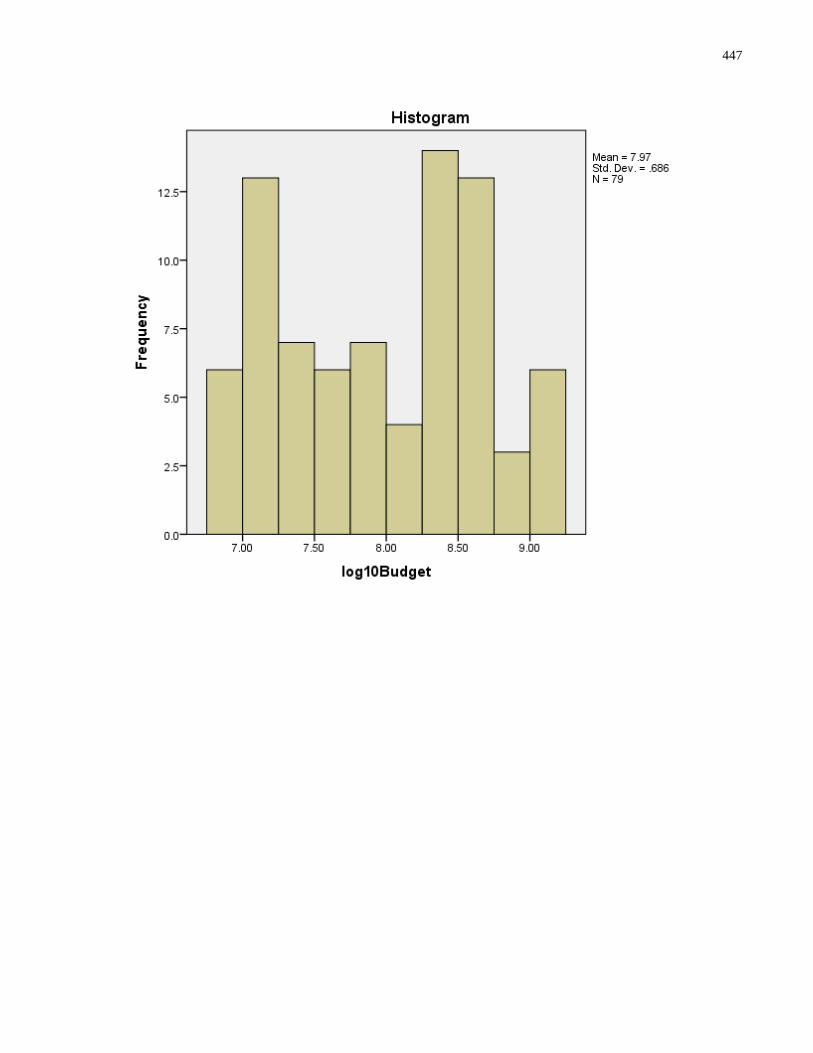
447
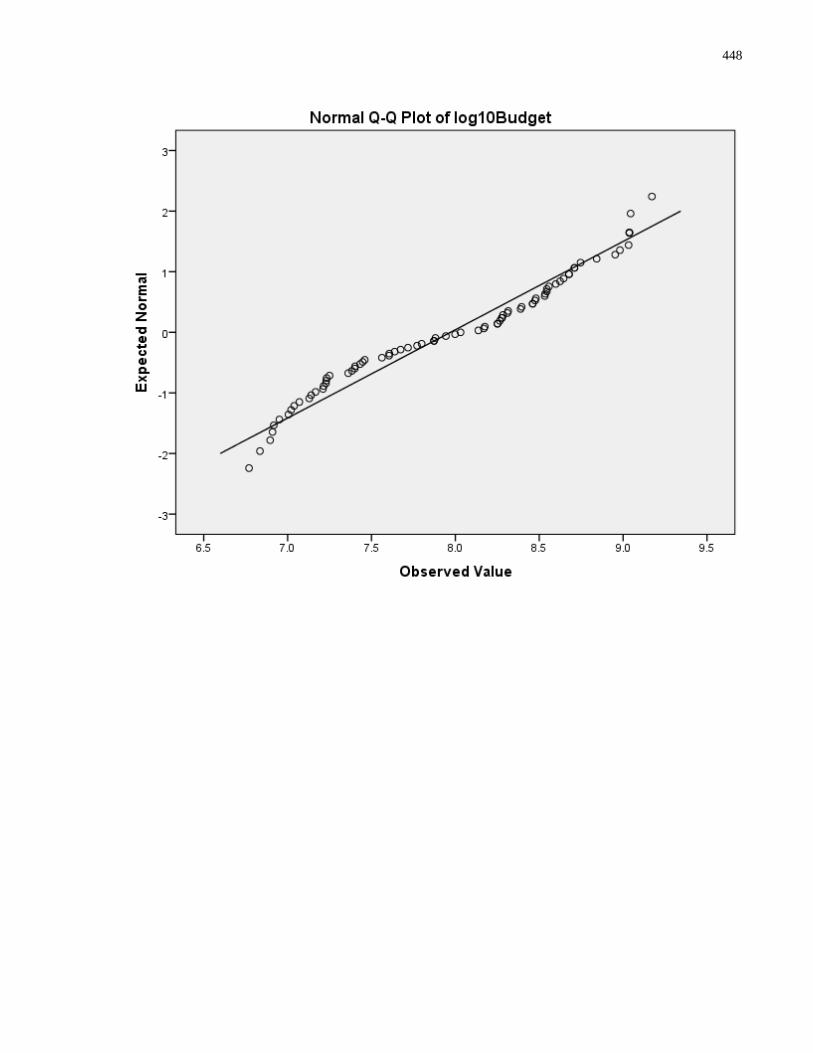
448
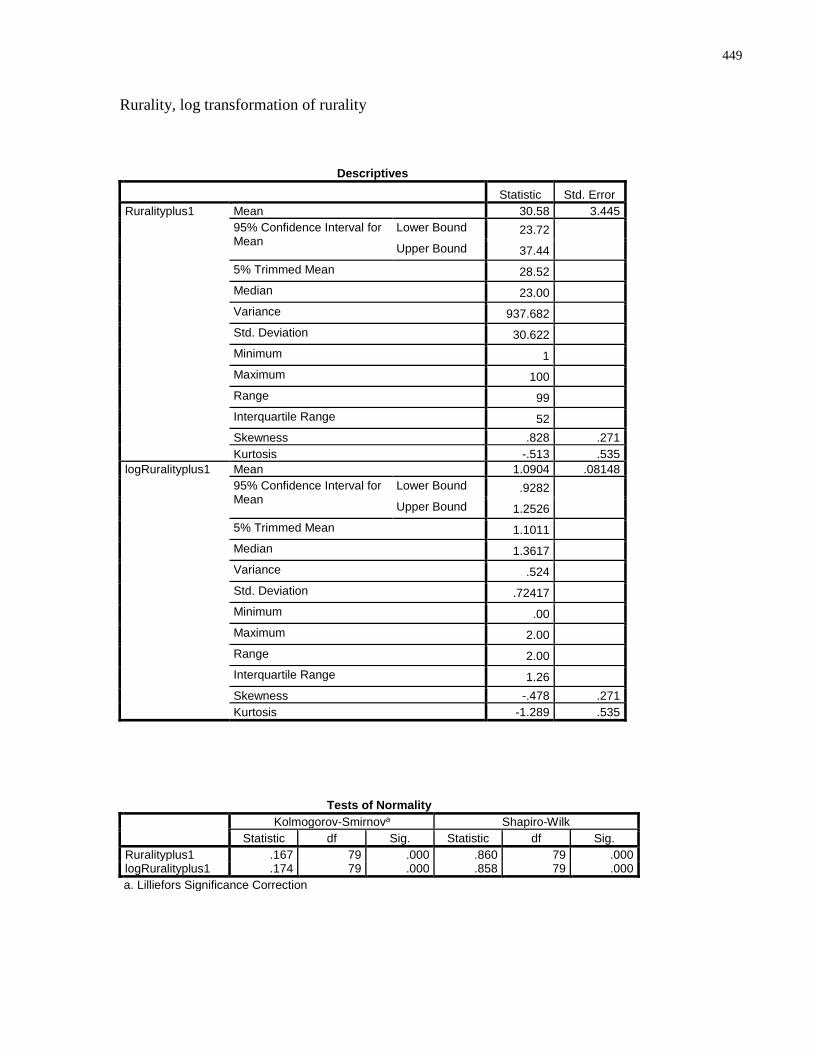
449
Rurality, log transformation of rurality
Descriptives
Statistic Std. Error
Ruralityplus1 Mean 30.58 3.445
95% Confidence Interval for Mean
Lower Bound 23.72 Upper Bound 37.44
5% Trimmed Mean 28.52 Median 23.00 Variance 937.682 Std. Deviation 30.622 Minimum 1 Maximum 100 Range 99 Interquartile Range 52 Skewness .828 .271
Kurtosis -.513 .535
logRuralityplus1 Mean 1.0904 .08148
95% Confidence Interval for Mean
Lower Bound .9282 Upper Bound 1.2526
5% Trimmed Mean 1.1011 Median 1.3617 Variance .524 Std. Deviation .72417 Minimum .00 Maximum 2.00 Range 2.00 Interquartile Range 1.26 Skewness -.478 .271
Kurtosis -1.289 .535
Tests of Normality
Kolmogorov-Smirnova Shapiro-Wilk
Statistic df Sig. Statistic df Sig.
Ruralityplus1 .167 79 .000 .860 79 .000 logRuralityplus1 .174 79 .000 .858 79 .000
a. Lilliefors Significance Correction
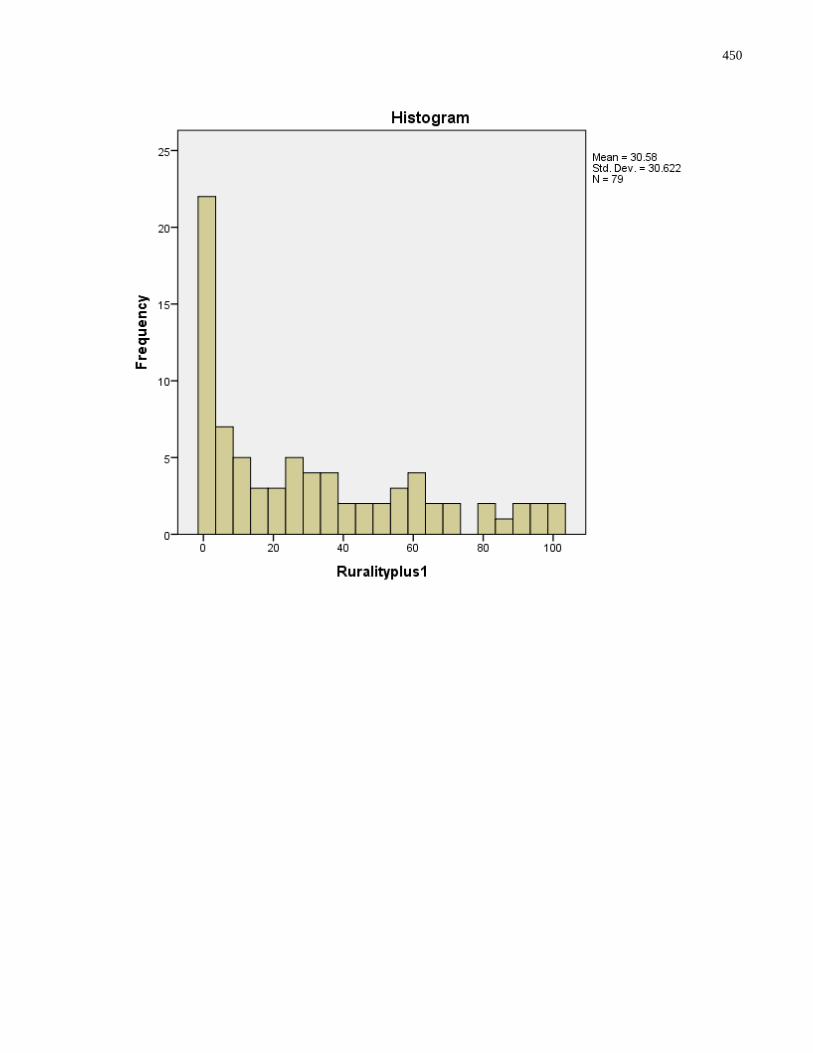
450
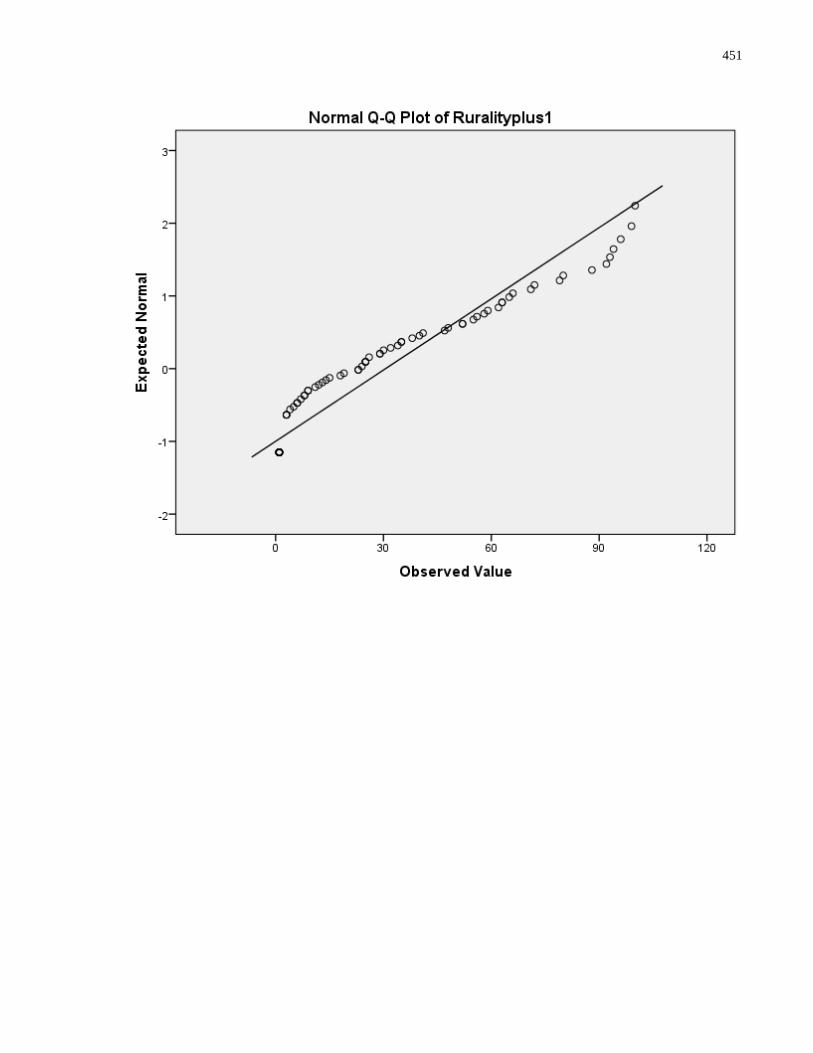
451
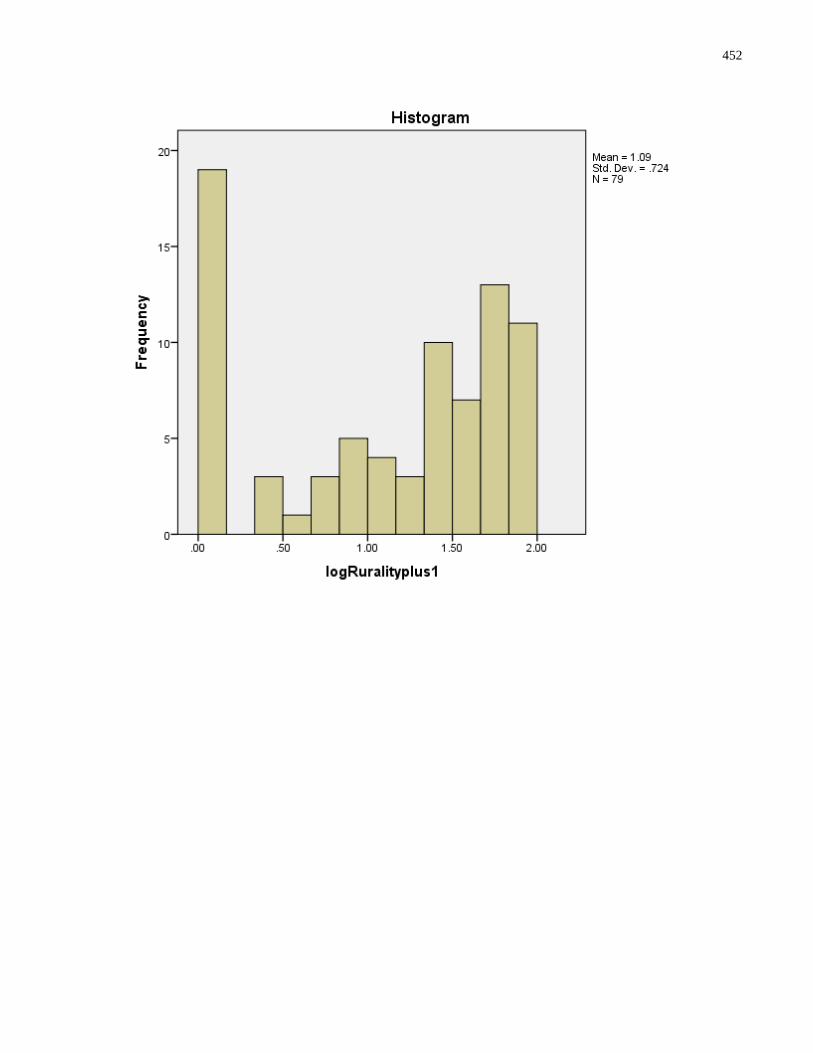
452
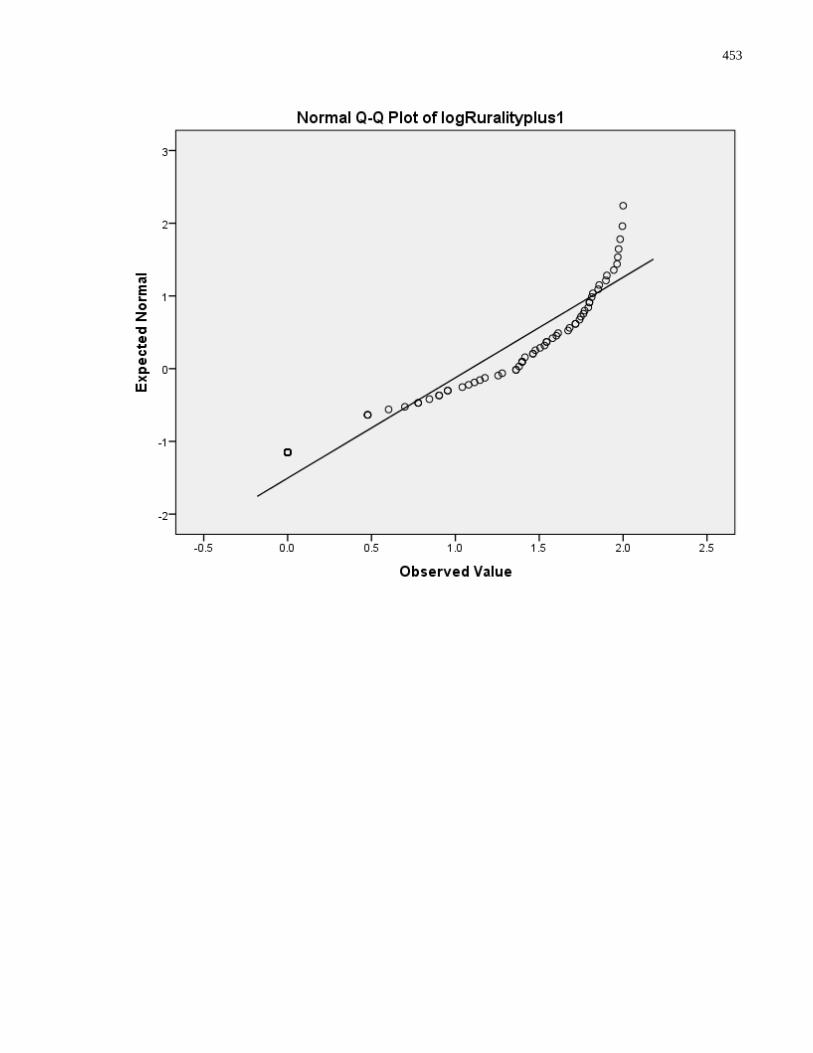
453
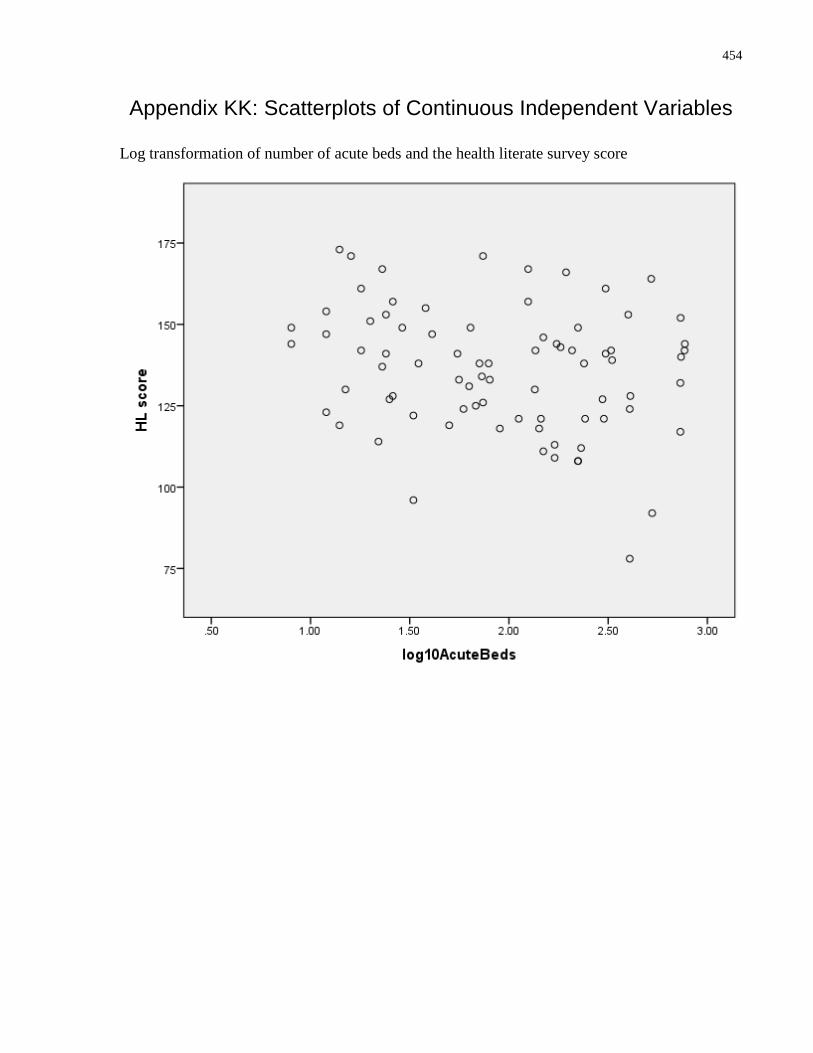
454
Appendix KK: Scatterplots of Continuous Independent Variables
Log transformation of number of acute beds and the health literate survey score
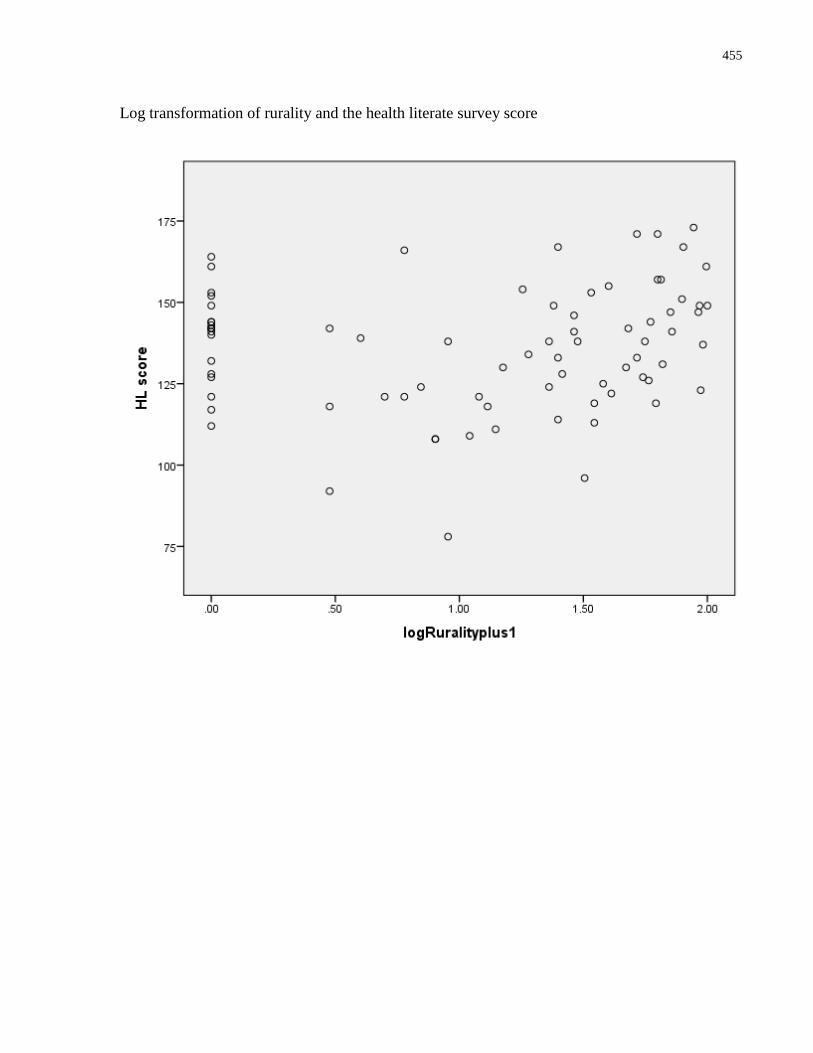
455
Log transformation of rurality and the health literate survey score
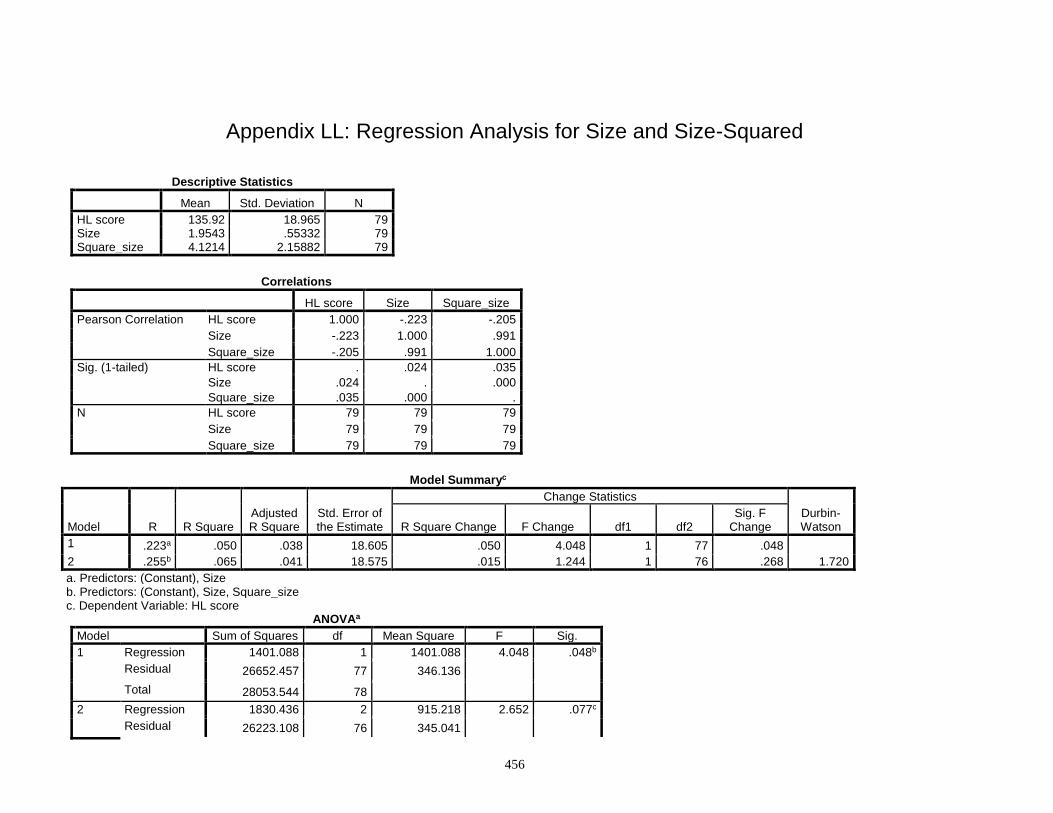
456
Appendix LL: Regression Analysis for Size and Size-Squared
Descriptive Statistics
Mean Std. Deviation N
HL score 135.92 18.965 79 Size 1.9543 .55332 79 Square_size 4.1214 2.15882 79
Correlations
HL score Size Square_size
Pearson Correlation HL score 1.000 -.223 -.205
Size -.223 1.000 .991
Square_size -.205 .991 1.000
Sig. (1-tailed) HL score . .024 .035
Size .024 . .000
Square_size .035 .000 .
N HL score 79 79 79
Size 79 79 79
Square_size 79 79 79
Model Summaryc
Model R R Square Adjusted R Square
Std. Error of the Estimate
Change Statistics
Durbin-Watson R Square Change F Change df1 df2
Sig. F Change
1 .223a .050 .038 18.605 .050 4.048 1 77 .048 2 .255b .065 .041 18.575 .015 1.244 1 76 .268 1.720
a. Predictors: (Constant), Size b. Predictors: (Constant), Size, Square_size c. Dependent Variable: HL score
ANOVAa
Model Sum of Squares df Mean Square F Sig.
1 Regression 1401.088 1 1401.088 4.048 .048b
Residual 26652.457 77 346.136 Total 28053.544 78
2 Regression 1830.436 2 915.218 2.652 .077c
Residual 26223.108 76 345.041
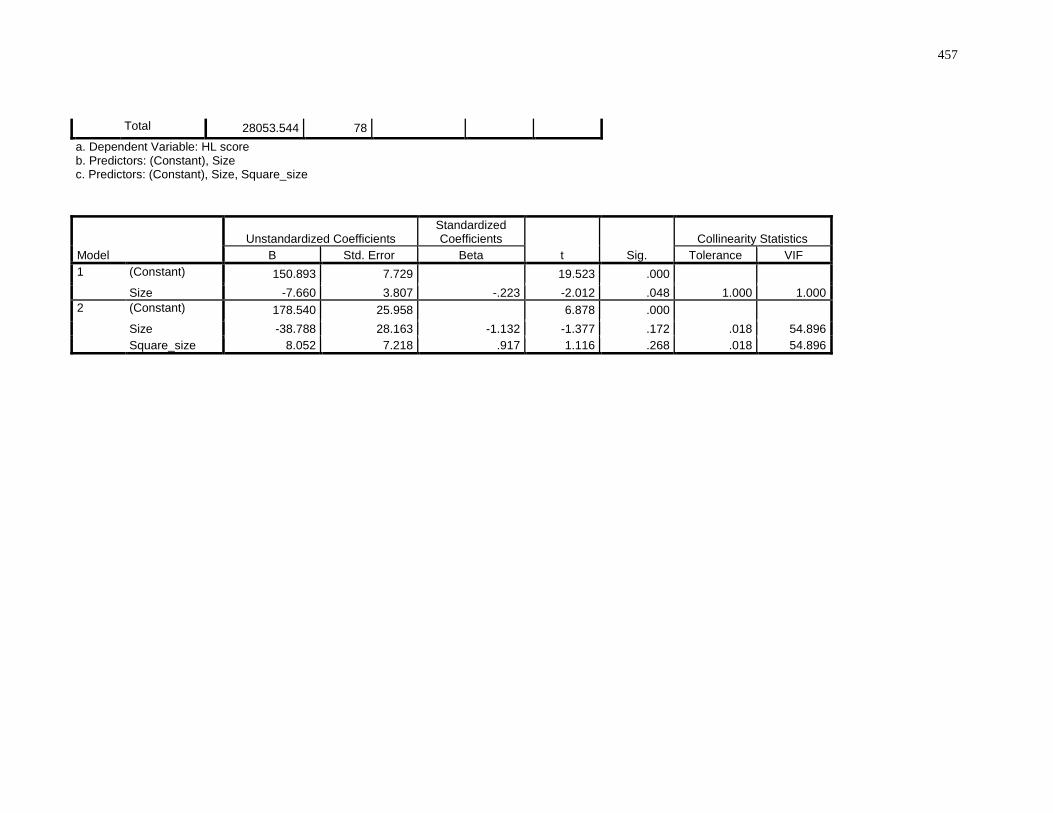
457
Total 28053.544 78 a. Dependent Variable: HL score b. Predictors: (Constant), Size c. Predictors: (Constant), Size, Square_size
Model
Unstandardized Coefficients Standardized Coefficients
t Sig.
Collinearity Statistics
B Std. Error Beta Tolerance VIF
1 (Constant) 150.893 7.729 19.523 .000 Size -7.660 3.807 -.223 -2.012 .048 1.000 1.000
2 (Constant) 178.540 25.958 6.878 .000 Size -38.788 28.163 -1.132 -1.377 .172 .018 54.896
Square_size 8.052 7.218 .917 1.116 .268 .018 54.896
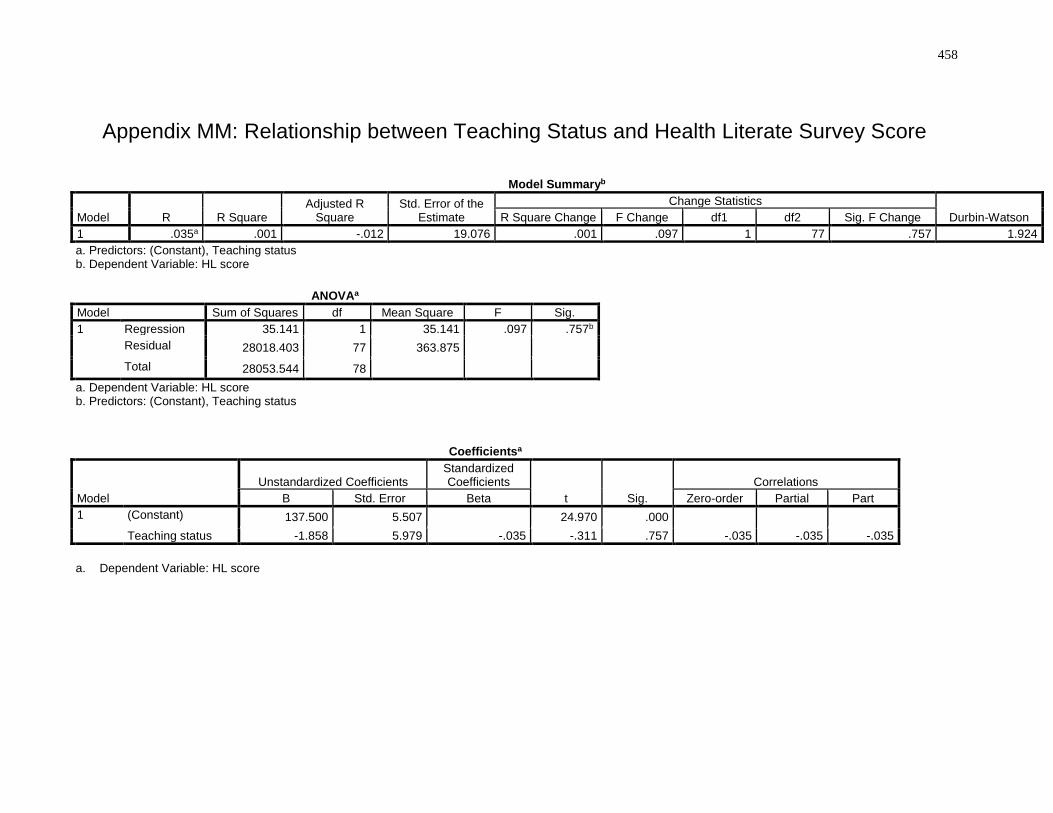
458
Appendix MM: Relationship between Teaching Status and Health Literate Survey Score
Model Summaryb
Model R R Square Adjusted R
Square Std. Error of the
Estimate
Change Statistics
Durbin-Watson R Square Change F Change df1 df2 Sig. F Change
1 .035a .001 -.012 19.076 .001 .097 1 77 .757 1.924
a. Predictors: (Constant), Teaching status b. Dependent Variable: HL score
ANOVAa
Model Sum of Squares df Mean Square F Sig.
1 Regression 35.141 1 35.141 .097 .757b
Residual 28018.403 77 363.875 Total 28053.544 78
a. Dependent Variable: HL score b. Predictors: (Constant), Teaching status
Coefficientsa
Model
Unstandardized Coefficients Standardized Coefficients
t Sig.
Correlations
B Std. Error Beta Zero-order Partial Part
1 (Constant) 137.500 5.507 24.970 .000 Teaching status -1.858 5.979 -.035 -.311 .757 -.035 -.035 -.035
a. Dependent Variable: HL score
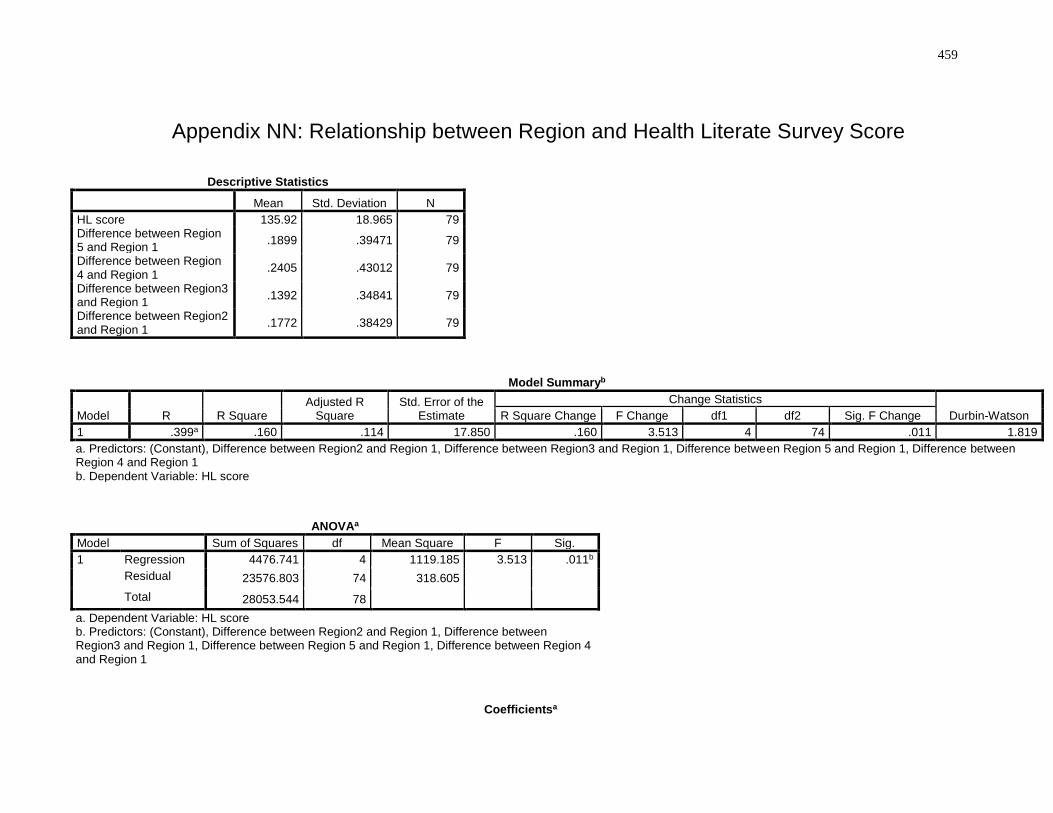
459
Appendix NN: Relationship between Region and Health Literate Survey Score
Descriptive Statistics
Mean Std. Deviation N
HL score 135.92 18.965 79 Difference between Region 5 and Region 1
.1899 .39471 79
Difference between Region 4 and Region 1
.2405 .43012 79
Difference between Region3 and Region 1
.1392 .34841 79
Difference between Region2 and Region 1
.1772 .38429 79
Model Summaryb
Model R R Square Adjusted R
Square Std. Error of the
Estimate
Change Statistics
Durbin-Watson R Square Change F Change df1 df2 Sig. F Change
1 .399a .160 .114 17.850 .160 3.513 4 74 .011 1.819
a. Predictors: (Constant), Difference between Region2 and Region 1, Difference between Region3 and Region 1, Difference between Region 5 and Region 1, Difference between Region 4 and Region 1 b. Dependent Variable: HL score
ANOVAa
Model Sum of Squares df Mean Square F Sig.
1 Regression 4476.741 4 1119.185 3.513 .011b
Residual 23576.803 74 318.605 Total 28053.544 78
a. Dependent Variable: HL score b. Predictors: (Constant), Difference between Region2 and Region 1, Difference between Region3 and Region 1, Difference between Region 5 and Region 1, Difference between Region 4 and Region 1
Coefficientsa
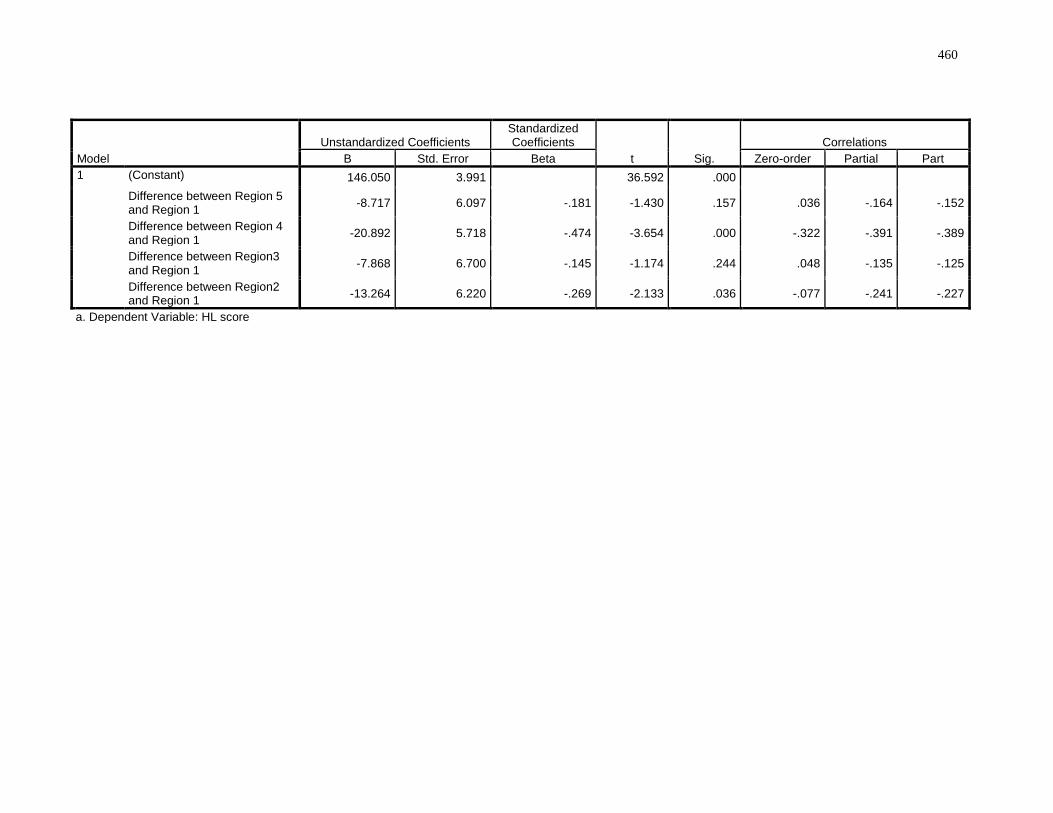
460
Model
Unstandardized Coefficients Standardized Coefficients
t Sig.
Correlations
B Std. Error Beta Zero-order Partial Part
1 (Constant) 146.050 3.991 36.592 .000 Difference between Region 5 and Region 1
-8.717 6.097 -.181 -1.430 .157 .036 -.164 -.152
Difference between Region 4 and Region 1
-20.892 5.718 -.474 -3.654 .000 -.322 -.391 -.389
Difference between Region3 and Region 1
-7.868 6.700 -.145 -1.174 .244 .048 -.135 -.125
Difference between Region2 and Region 1
-13.264 6.220 -.269 -2.133 .036 -.077 -.241 -.227
a. Dependent Variable: HL score
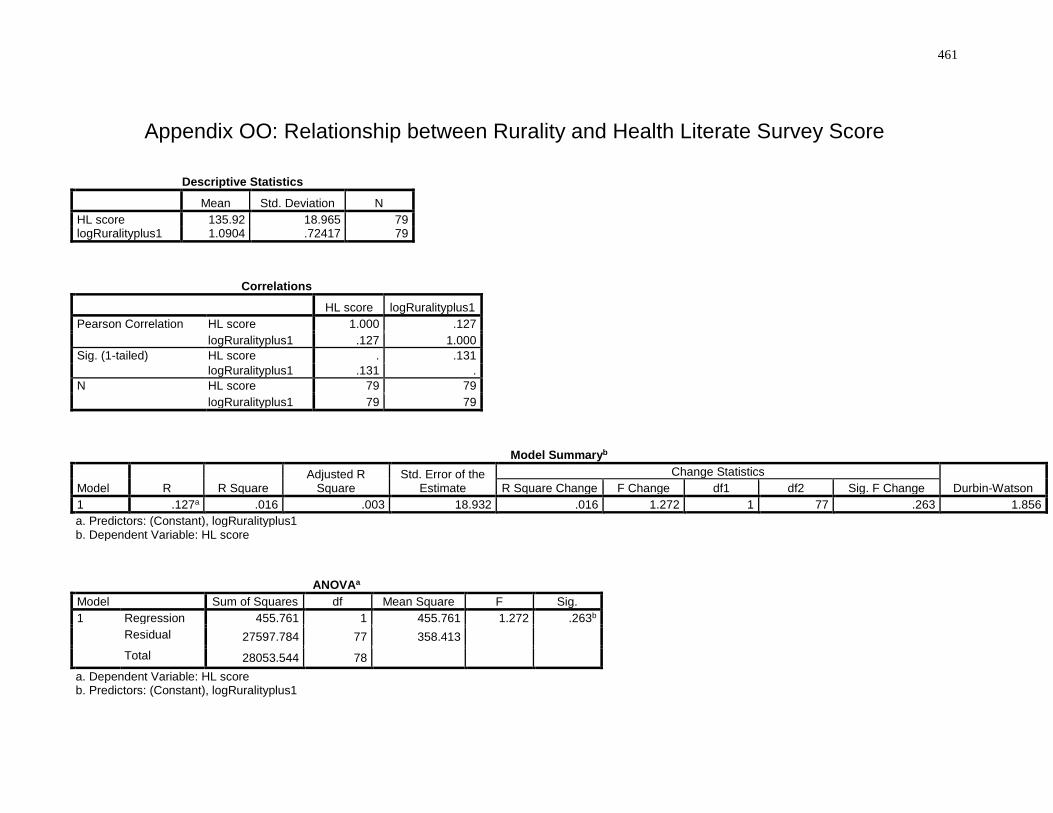
461
Appendix OO: Relationship between Rurality and Health Literate Survey Score
Descriptive Statistics
Mean Std. Deviation N
HL score 135.92 18.965 79 logRuralityplus1 1.0904 .72417 79
Correlations
HL score logRuralityplus1
Pearson Correlation HL score 1.000 .127
logRuralityplus1 .127 1.000
Sig. (1-tailed) HL score . .131
logRuralityplus1 .131 .
N HL score 79 79
logRuralityplus1 79 79
Model Summaryb
Model R R Square Adjusted R
Square Std. Error of the
Estimate
Change Statistics
Durbin-Watson R Square Change F Change df1 df2 Sig. F Change
1 .127a .016 .003 18.932 .016 1.272 1 77 .263 1.856
a. Predictors: (Constant), logRuralityplus1 b. Dependent Variable: HL score
ANOVAa
Model Sum of Squares df Mean Square F Sig.
1 Regression 455.761 1 455.761 1.272 .263b
Residual 27597.784 77 358.413 Total 28053.544 78
a. Dependent Variable: HL score b. Predictors: (Constant), logRuralityplus1
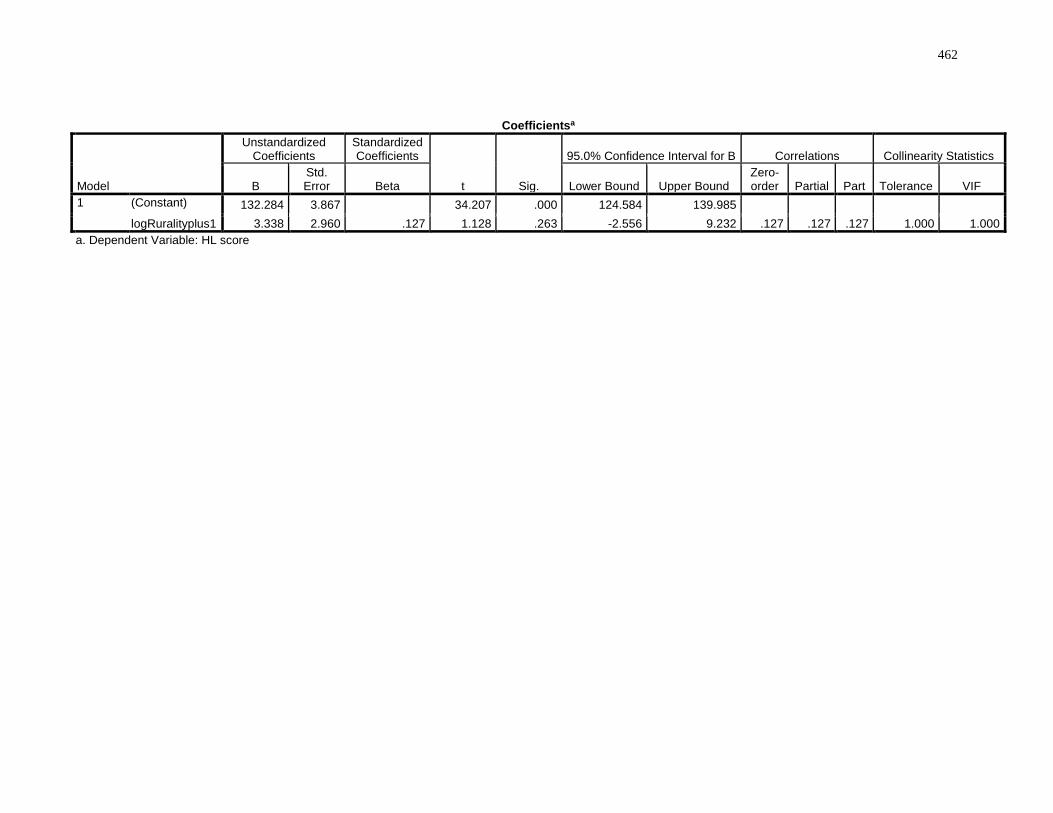
462
Coefficientsa
Model
Unstandardized Coefficients
Standardized Coefficients
t Sig.
95.0% Confidence Interval for B Correlations Collinearity Statistics
B Std. Error Beta Lower Bound Upper Bound
Zero-order Partial Part Tolerance VIF
1 (Constant) 132.284 3.867 34.207 .000 124.584 139.985 logRuralityplus1 3.338 2.960 .127 1.128 .263 -2.556 9.232 .127 .127 .127 1.000 1.000
a. Dependent Variable: HL score
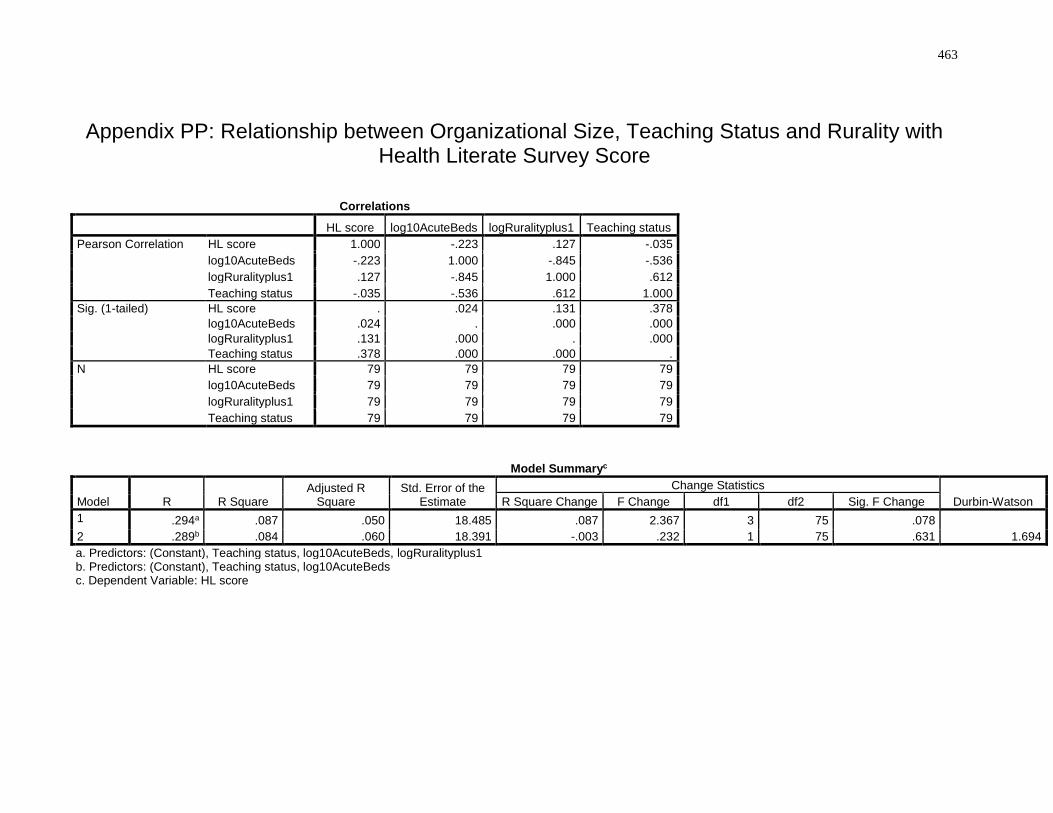
463
Appendix PP: Relationship between Organizational Size, Teaching Status and Rurality with Health Literate Survey Score
Correlations
HL score log10AcuteBeds logRuralityplus1 Teaching status
Pearson Correlation HL score 1.000 -.223 .127 -.035
log10AcuteBeds -.223 1.000 -.845 -.536
logRuralityplus1 .127 -.845 1.000 .612
Teaching status -.035 -.536 .612 1.000
Sig. (1-tailed) HL score . .024 .131 .378
log10AcuteBeds .024 . .000 .000
logRuralityplus1 .131 .000 . .000
Teaching status .378 .000 .000 .
N HL score 79 79 79 79
log10AcuteBeds 79 79 79 79
logRuralityplus1 79 79 79 79
Teaching status 79 79 79 79
Model Summaryc
Model R R Square Adjusted R
Square Std. Error of the
Estimate
Change Statistics
Durbin-Watson R Square Change F Change df1 df2 Sig. F Change
1 .294a .087 .050 18.485 .087 2.367 3 75 .078 2 .289b .084 .060 18.391 -.003 .232 1 75 .631 1.694
a. Predictors: (Constant), Teaching status, log10AcuteBeds, logRuralityplus1 b. Predictors: (Constant), Teaching status, log10AcuteBeds c. Dependent Variable: HL score
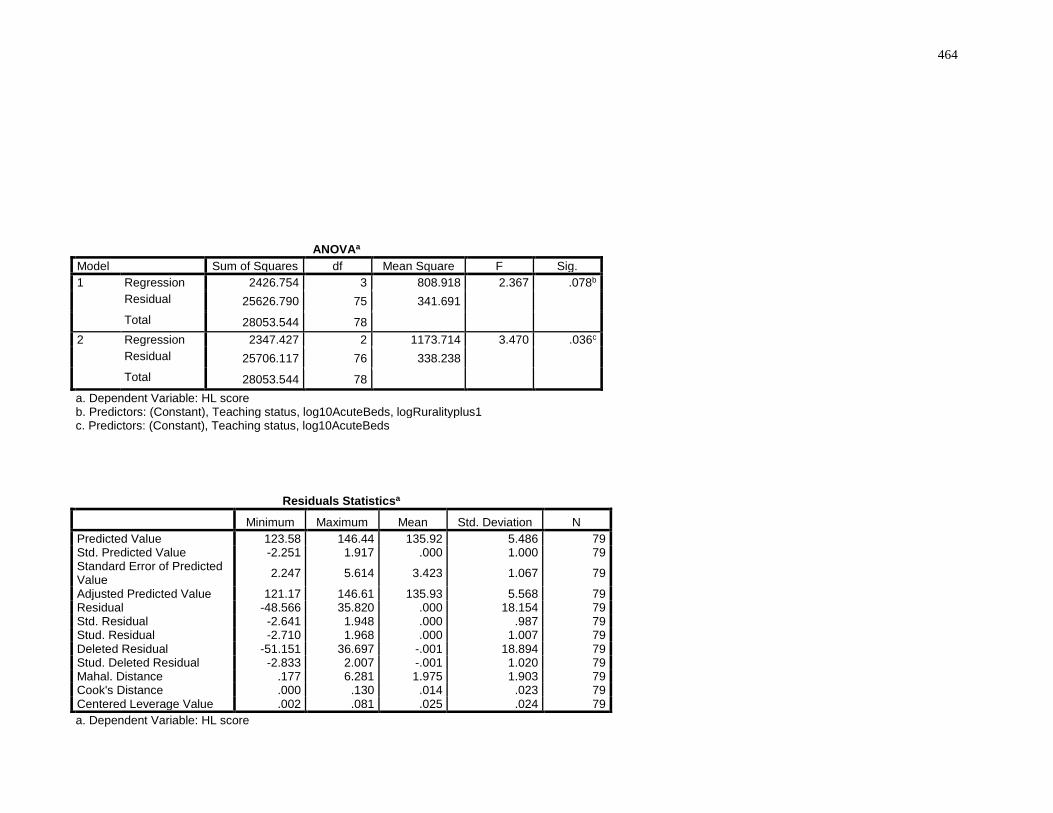
464
ANOVAa
Model Sum of Squares df Mean Square F Sig.
1 Regression 2426.754 3 808.918 2.367 .078b
Residual 25626.790 75 341.691 Total 28053.544 78
2 Regression 2347.427 2 1173.714 3.470 .036c
Residual 25706.117 76 338.238 Total 28053.544 78
a. Dependent Variable: HL score b. Predictors: (Constant), Teaching status, log10AcuteBeds, logRuralityplus1 c. Predictors: (Constant), Teaching status, log10AcuteBeds
Residuals Statisticsa
Minimum Maximum Mean Std. Deviation N
Predicted Value 123.58 146.44 135.92 5.486 79 Std. Predicted Value -2.251 1.917 .000 1.000 79 Standard Error of Predicted Value
2.247 5.614 3.423 1.067 79
Adjusted Predicted Value 121.17 146.61 135.93 5.568 79 Residual -48.566 35.820 .000 18.154 79 Std. Residual -2.641 1.948 .000 .987 79 Stud. Residual -2.710 1.968 .000 1.007 79 Deleted Residual -51.151 36.697 -.001 18.894 79 Stud. Deleted Residual -2.833 2.007 -.001 1.020 79 Mahal. Distance .177 6.281 1.975 1.903 79 Cook's Distance .000 .130 .014 .023 79 Centered Leverage Value .002 .081 .025 .024 79
a. Dependent Variable: HL score
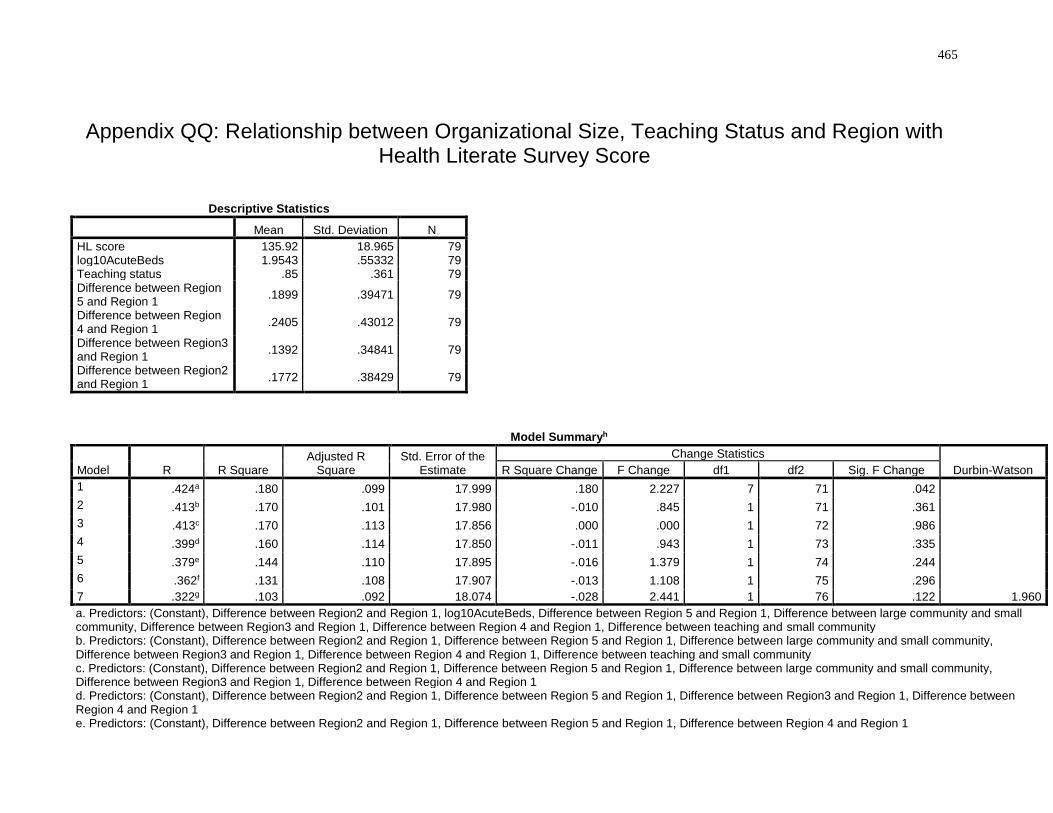
465
Appendix QQ: Relationship between Organizational Size, Teaching Status and Region with Health Literate Survey Score
Descriptive Statistics
Mean Std. Deviation N
HL score 135.92 18.965 79 log10AcuteBeds 1.9543 .55332 79 Teaching status .85 .361 79 Difference between Region 5 and Region 1
.1899 .39471 79
Difference between Region 4 and Region 1
.2405 .43012 79
Difference between Region3 and Region 1
.1392 .34841 79
Difference between Region2 and Region 1
.1772 .38429 79
Model Summaryh
Model R R Square Adjusted R
Square Std. Error of the
Estimate
Change Statistics
Durbin-Watson R Square Change F Change df1 df2 Sig. F Change
1 .424a .180 .099 17.999 .180 2.227 7 71 .042 2 .413b .170 .101 17.980 -.010 .845 1 71 .361 3 .413c .170 .113 17.856 .000 .000 1 72 .986 4 .399d .160 .114 17.850 -.011 .943 1 73 .335 5 .379e .144 .110 17.895 -.016 1.379 1 74 .244 6 .362f .131 .108 17.907 -.013 1.108 1 75 .296 7 .322g .103 .092 18.074 -.028 2.441 1 76 .122 1.960
a. Predictors: (Constant), Difference between Region2 and Region 1, log10AcuteBeds, Difference between Region 5 and Region 1, Difference between large community and small community, Difference between Region3 and Region 1, Difference between Region 4 and Region 1, Difference between teaching and small community b. Predictors: (Constant), Difference between Region2 and Region 1, Difference between Region 5 and Region 1, Difference between large community and small community, Difference between Region3 and Region 1, Difference between Region 4 and Region 1, Difference between teaching and small community c. Predictors: (Constant), Difference between Region2 and Region 1, Difference between Region 5 and Region 1, Difference between large community and small community, Difference between Region3 and Region 1, Difference between Region 4 and Region 1 d. Predictors: (Constant), Difference between Region2 and Region 1, Difference between Region 5 and Region 1, Difference between Region3 and Region 1, Difference between Region 4 and Region 1 e. Predictors: (Constant), Difference between Region2 and Region 1, Difference between Region 5 and Region 1, Difference between Region 4 and Region 1
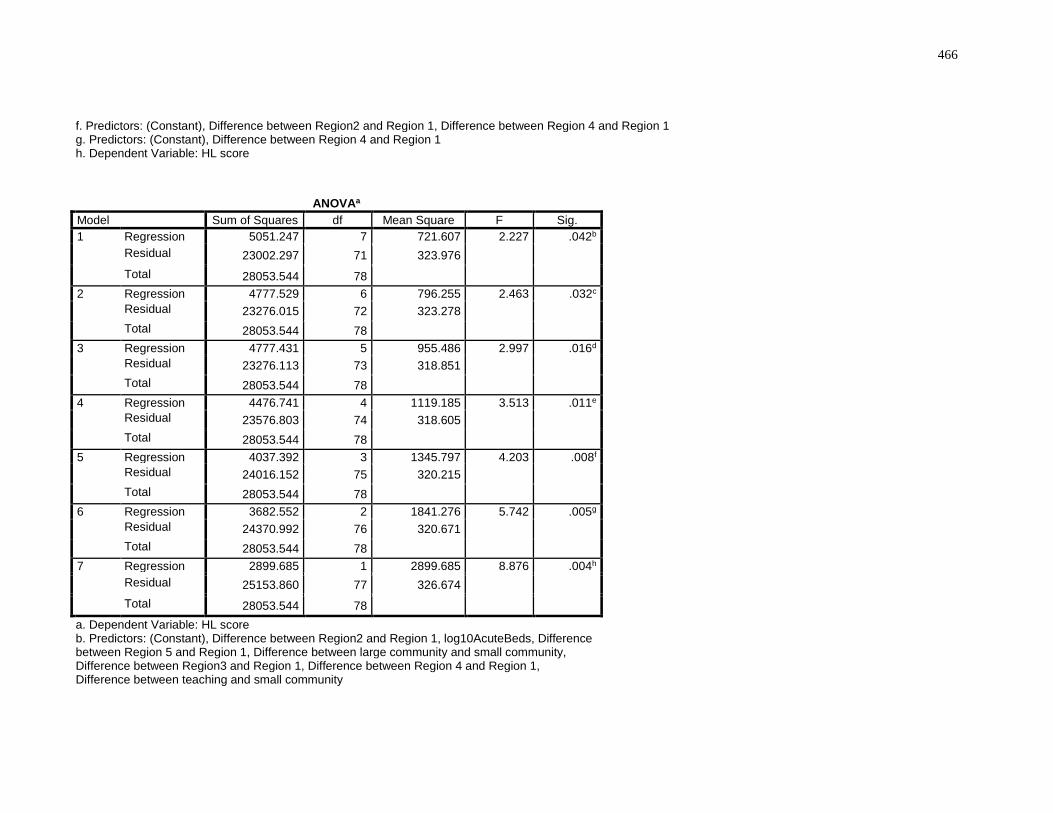
466
f. Predictors: (Constant), Difference between Region2 and Region 1, Difference between Region 4 and Region 1 g. Predictors: (Constant), Difference between Region 4 and Region 1 h. Dependent Variable: HL score
ANOVAa
Model Sum of Squares df Mean Square F Sig.
1 Regression 5051.247 7 721.607 2.227 .042b
Residual 23002.297 71 323.976 Total 28053.544 78
2 Regression 4777.529 6 796.255 2.463 .032c
Residual 23276.015 72 323.278 Total 28053.544 78
3 Regression 4777.431 5 955.486 2.997 .016d
Residual 23276.113 73 318.851 Total 28053.544 78
4 Regression 4476.741 4 1119.185 3.513 .011e
Residual 23576.803 74 318.605 Total 28053.544 78
5 Regression 4037.392 3 1345.797 4.203 .008f
Residual 24016.152 75 320.215 Total 28053.544 78
6 Regression 3682.552 2 1841.276 5.742 .005g
Residual 24370.992 76 320.671 Total 28053.544 78
7 Regression 2899.685 1 2899.685 8.876 .004h
Residual 25153.860 77 326.674 Total 28053.544 78
a. Dependent Variable: HL score b. Predictors: (Constant), Difference between Region2 and Region 1, log10AcuteBeds, Difference between Region 5 and Region 1, Difference between large community and small community, Difference between Region3 and Region 1, Difference between Region 4 and Region 1, Difference between teaching and small community
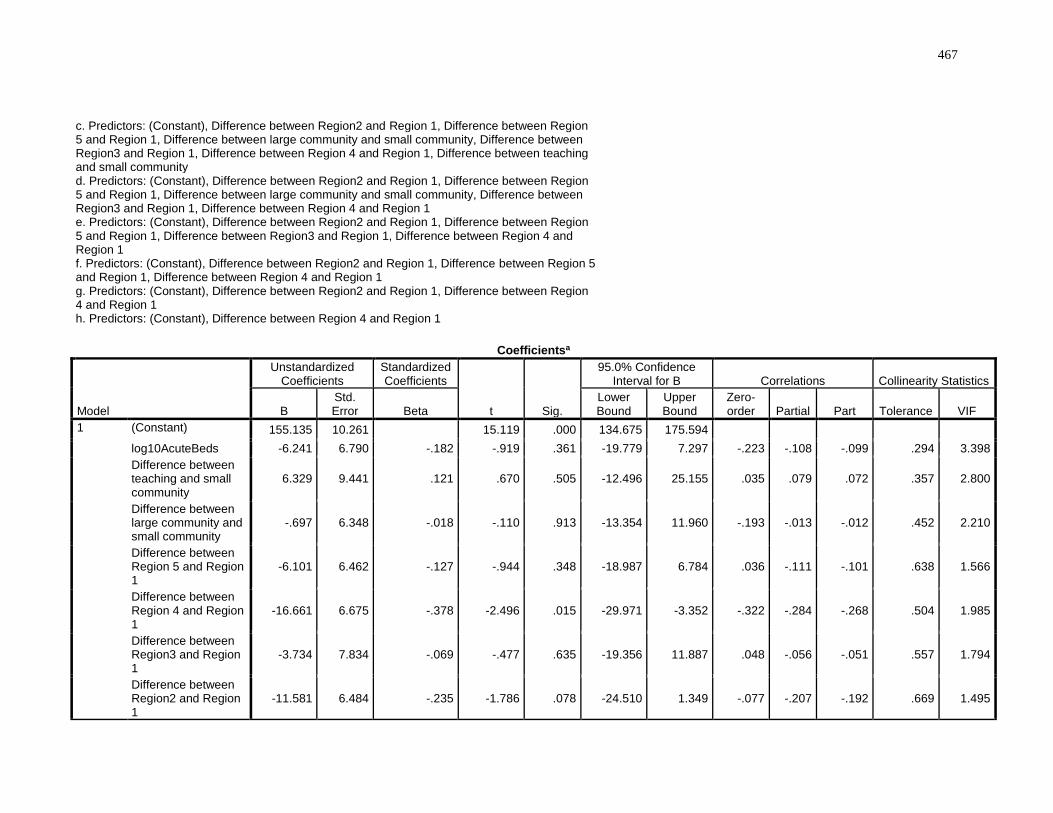
467
c. Predictors: (Constant), Difference between Region2 and Region 1, Difference between Region 5 and Region 1, Difference between large community and small community, Difference between Region3 and Region 1, Difference between Region 4 and Region 1, Difference between teaching and small community d. Predictors: (Constant), Difference between Region2 and Region 1, Difference between Region 5 and Region 1, Difference between large community and small community, Difference between Region3 and Region 1, Difference between Region 4 and Region 1 e. Predictors: (Constant), Difference between Region2 and Region 1, Difference between Region 5 and Region 1, Difference between Region3 and Region 1, Difference between Region 4 and Region 1 f. Predictors: (Constant), Difference between Region2 and Region 1, Difference between Region 5 and Region 1, Difference between Region 4 and Region 1 g. Predictors: (Constant), Difference between Region2 and Region 1, Difference between Region 4 and Region 1 h. Predictors: (Constant), Difference between Region 4 and Region 1
Coefficientsa
Model
Unstandardized Coefficients
Standardized Coefficients
t Sig.
95.0% Confidence Interval for B Correlations Collinearity Statistics
B Std. Error Beta
Lower Bound
Upper Bound
Zero-order Partial Part Tolerance VIF
1 (Constant) 155.135 10.261 15.119 .000 134.675 175.594 log10AcuteBeds -6.241 6.790 -.182 -.919 .361 -19.779 7.297 -.223 -.108 -.099 .294 3.398
Difference between teaching and small community
6.329 9.441 .121 .670 .505 -12.496 25.155 .035 .079 .072 .357 2.800
Difference between large community and small community
-.697 6.348 -.018 -.110 .913 -13.354 11.960 -.193 -.013 -.012 .452 2.210
Difference between Region 5 and Region 1
-6.101 6.462 -.127 -.944 .348 -18.987 6.784 .036 -.111 -.101 .638 1.566
Difference between Region 4 and Region 1
-16.661 6.675 -.378 -2.496 .015 -29.971 -3.352 -.322 -.284 -.268 .504 1.985
Difference between Region3 and Region 1
-3.734 7.834 -.069 -.477 .635 -19.356 11.887 .048 -.056 -.051 .557 1.794
Difference between Region2 and Region 1
-11.581 6.484 -.235 -1.786 .078 -24.510 1.349 -.077 -.207 -.192 .669 1.495
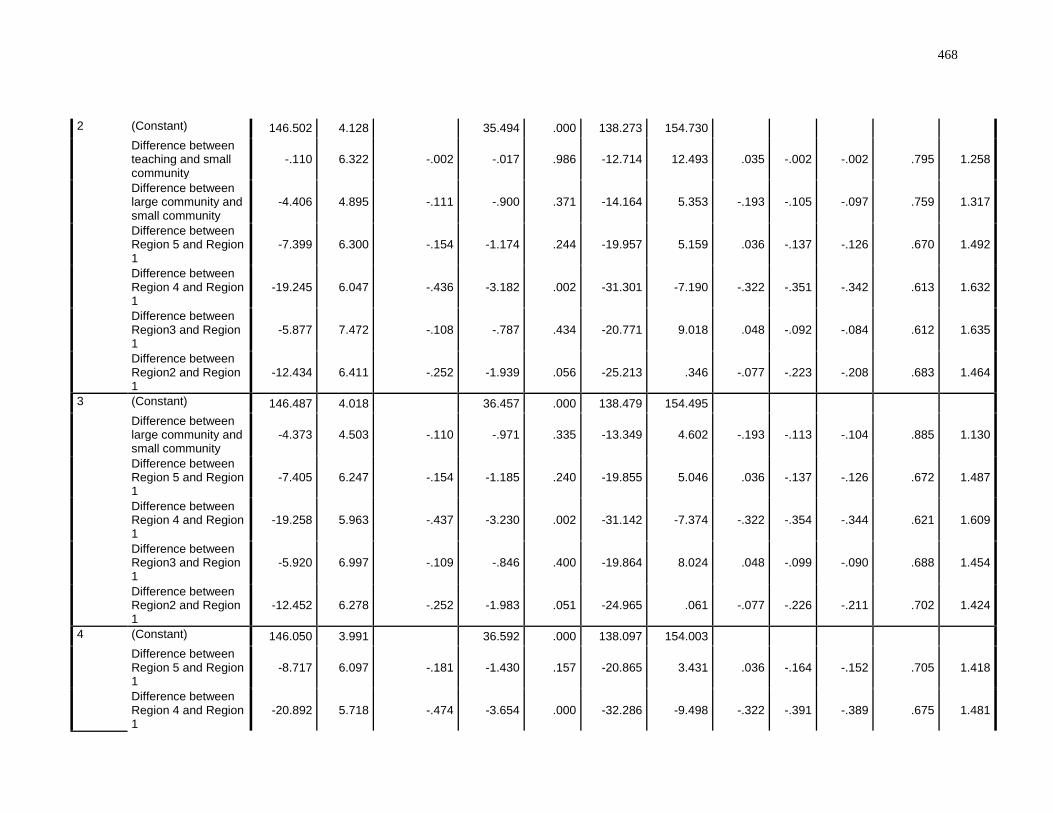
468
2 (Constant) 146.502 4.128 35.494 .000 138.273 154.730 Difference between teaching and small community
-.110 6.322 -.002 -.017 .986 -12.714 12.493 .035 -.002 -.002 .795 1.258
Difference between large community and small community
-4.406 4.895 -.111 -.900 .371 -14.164 5.353 -.193 -.105 -.097 .759 1.317
Difference between Region 5 and Region 1
-7.399 6.300 -.154 -1.174 .244 -19.957 5.159 .036 -.137 -.126 .670 1.492
Difference between Region 4 and Region 1
-19.245 6.047 -.436 -3.182 .002 -31.301 -7.190 -.322 -.351 -.342 .613 1.632
Difference between Region3 and Region 1
-5.877 7.472 -.108 -.787 .434 -20.771 9.018 .048 -.092 -.084 .612 1.635
Difference between Region2 and Region 1
-12.434 6.411 -.252 -1.939 .056 -25.213 .346 -.077 -.223 -.208 .683 1.464
3 (Constant) 146.487 4.018 36.457 .000 138.479 154.495 Difference between large community and small community
-4.373 4.503 -.110 -.971 .335 -13.349 4.602 -.193 -.113 -.104 .885 1.130
Difference between Region 5 and Region 1
-7.405 6.247 -.154 -1.185 .240 -19.855 5.046 .036 -.137 -.126 .672 1.487
Difference between Region 4 and Region 1
-19.258 5.963 -.437 -3.230 .002 -31.142 -7.374 -.322 -.354 -.344 .621 1.609
Difference between Region3 and Region 1
-5.920 6.997 -.109 -.846 .400 -19.864 8.024 .048 -.099 -.090 .688 1.454
Difference between Region2 and Region 1
-12.452 6.278 -.252 -1.983 .051 -24.965 .061 -.077 -.226 -.211 .702 1.424
4 (Constant) 146.050 3.991 36.592 .000 138.097 154.003 Difference between Region 5 and Region 1
-8.717 6.097 -.181 -1.430 .157 -20.865 3.431 .036 -.164 -.152 .705 1.418
Difference between Region 4 and Region 1
-20.892 5.718 -.474 -3.654 .000 -32.286 -9.498 -.322 -.391 -.389 .675 1.481
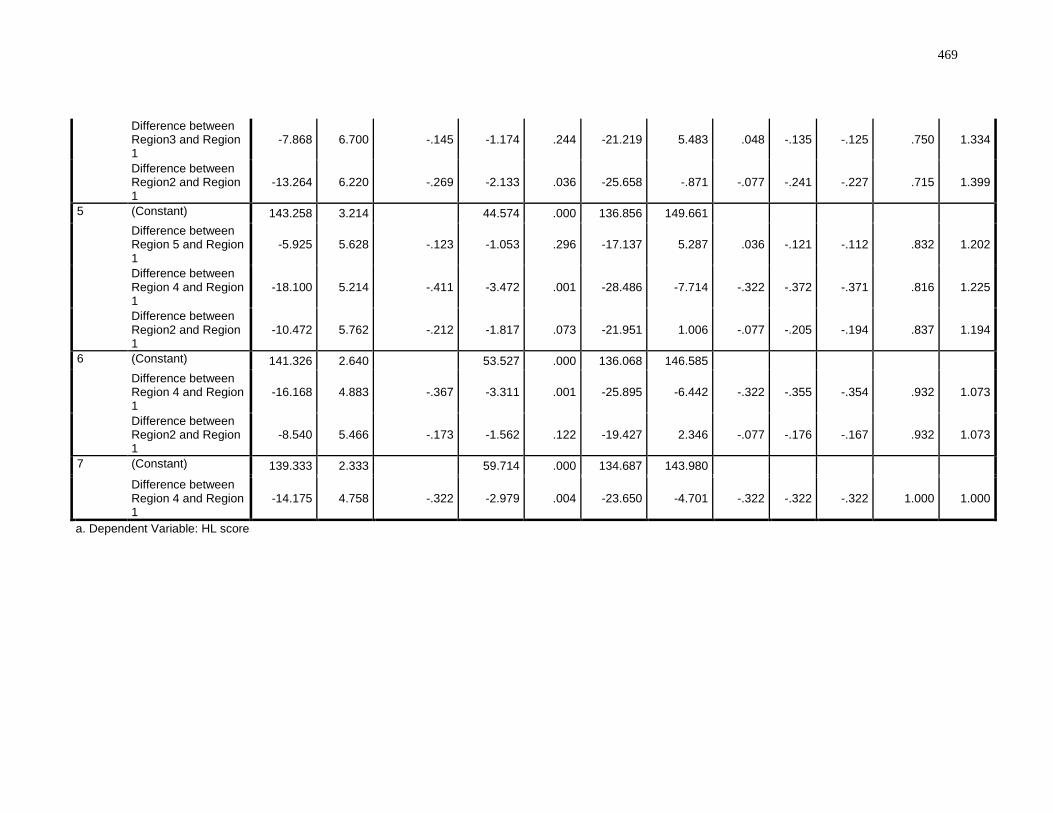
469
Difference between Region3 and Region 1
-7.868 6.700 -.145 -1.174 .244 -21.219 5.483 .048 -.135 -.125 .750 1.334
Difference between Region2 and Region 1
-13.264 6.220 -.269 -2.133 .036 -25.658 -.871 -.077 -.241 -.227 .715 1.399
5 (Constant) 143.258 3.214 44.574 .000 136.856 149.661 Difference between Region 5 and Region 1
-5.925 5.628 -.123 -1.053 .296 -17.137 5.287 .036 -.121 -.112 .832 1.202
Difference between Region 4 and Region 1
-18.100 5.214 -.411 -3.472 .001 -28.486 -7.714 -.322 -.372 -.371 .816 1.225
Difference between Region2 and Region 1
-10.472 5.762 -.212 -1.817 .073 -21.951 1.006 -.077 -.205 -.194 .837 1.194
6 (Constant) 141.326 2.640 53.527 .000 136.068 146.585 Difference between Region 4 and Region 1
-16.168 4.883 -.367 -3.311 .001 -25.895 -6.442 -.322 -.355 -.354 .932 1.073
Difference between Region2 and Region 1
-8.540 5.466 -.173 -1.562 .122 -19.427 2.346 -.077 -.176 -.167 .932 1.073
7 (Constant) 139.333 2.333 59.714 .000 134.687 143.980 Difference between Region 4 and Region 1
-14.175 4.758 -.322 -2.979 .004 -23.650 -4.701 -.322 -.322 -.322 1.000 1.000
a. Dependent Variable: HL score
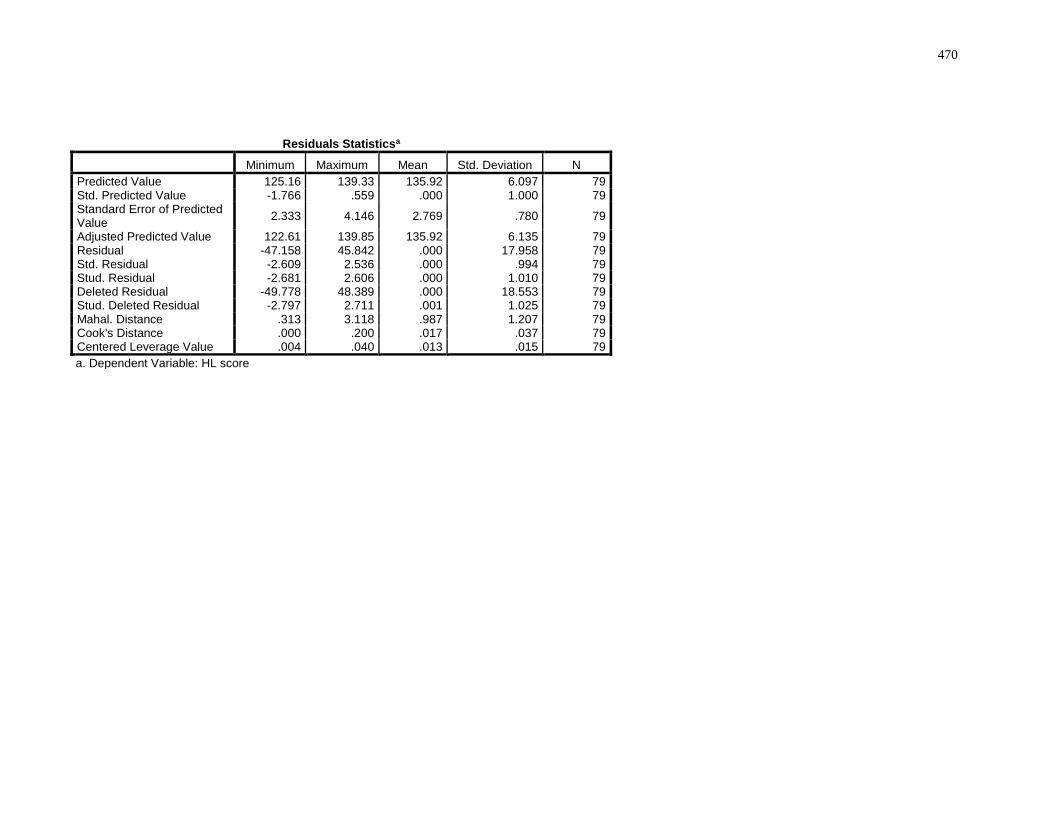
470
Residuals Statisticsa
Minimum Maximum Mean Std. Deviation N
Predicted Value 125.16 139.33 135.92 6.097 79 Std. Predicted Value -1.766 .559 .000 1.000 79 Standard Error of Predicted Value
2.333 4.146 2.769 .780 79
Adjusted Predicted Value 122.61 139.85 135.92 6.135 79 Residual -47.158 45.842 .000 17.958 79 Std. Residual -2.609 2.536 .000 .994 79 Stud. Residual -2.681 2.606 .000 1.010 79 Deleted Residual -49.778 48.389 .000 18.553 79 Stud. Deleted Residual -2.797 2.711 .001 1.025 79 Mahal. Distance .313 3.118 .987 1.207 79 Cook's Distance .000 .200 .017 .037 79 Centered Leverage Value .004 .040 .013 .015 79
a. Dependent Variable: HL score
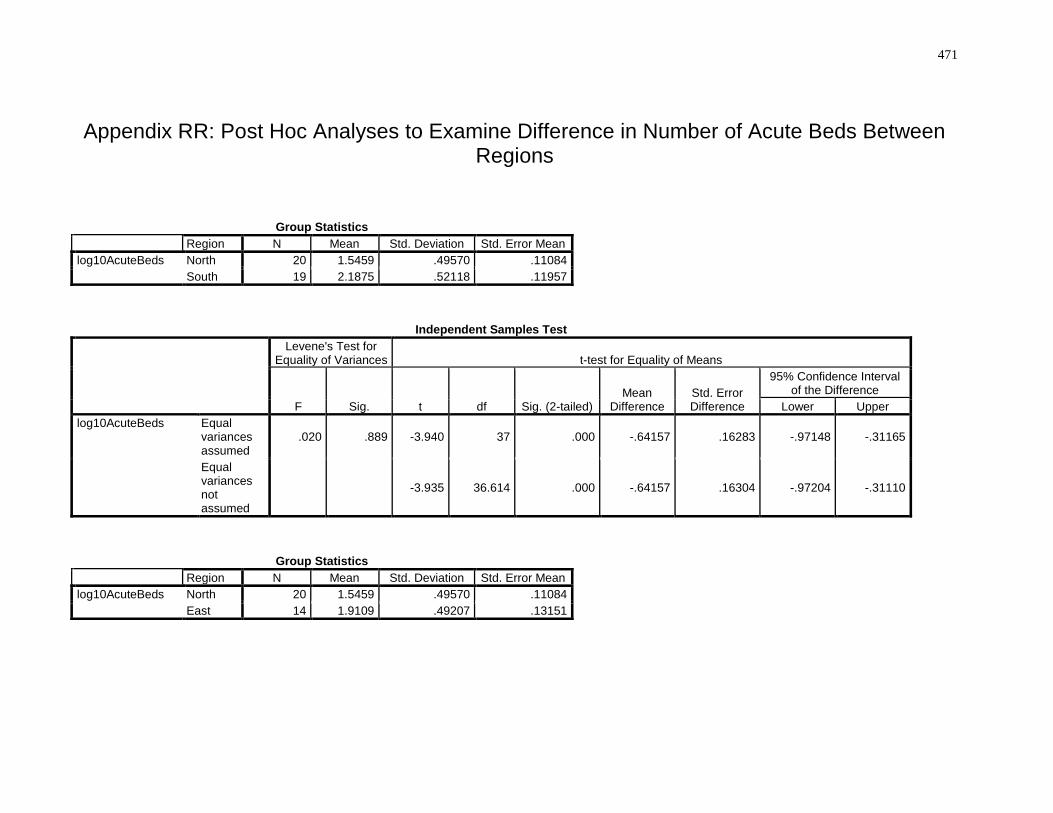
471
Appendix RR: Post Hoc Analyses to Examine Difference in Number of Acute Beds Between Regions
Group Statistics
Region N Mean Std. Deviation Std. Error Mean
log10AcuteBeds North 20 1.5459 .49570 .11084
South 19 2.1875 .52118 .11957
Independent Samples Test
Levene's Test for Equality of Variances t-test for Equality of Means
F Sig. t df Sig. (2-tailed) Mean
Difference Std. Error Difference
95% Confidence Interval of the Difference
Lower Upper
log10AcuteBeds Equal variances assumed
.020 .889 -3.940 37 .000 -.64157 .16283 -.97148 -.31165
Equal variances not assumed
-3.935 36.614 .000 -.64157 .16304 -.97204 -.31110
Group Statistics
Region N Mean Std. Deviation Std. Error Mean
log10AcuteBeds North 20 1.5459 .49570 .11084
East 14 1.9109 .49207 .13151
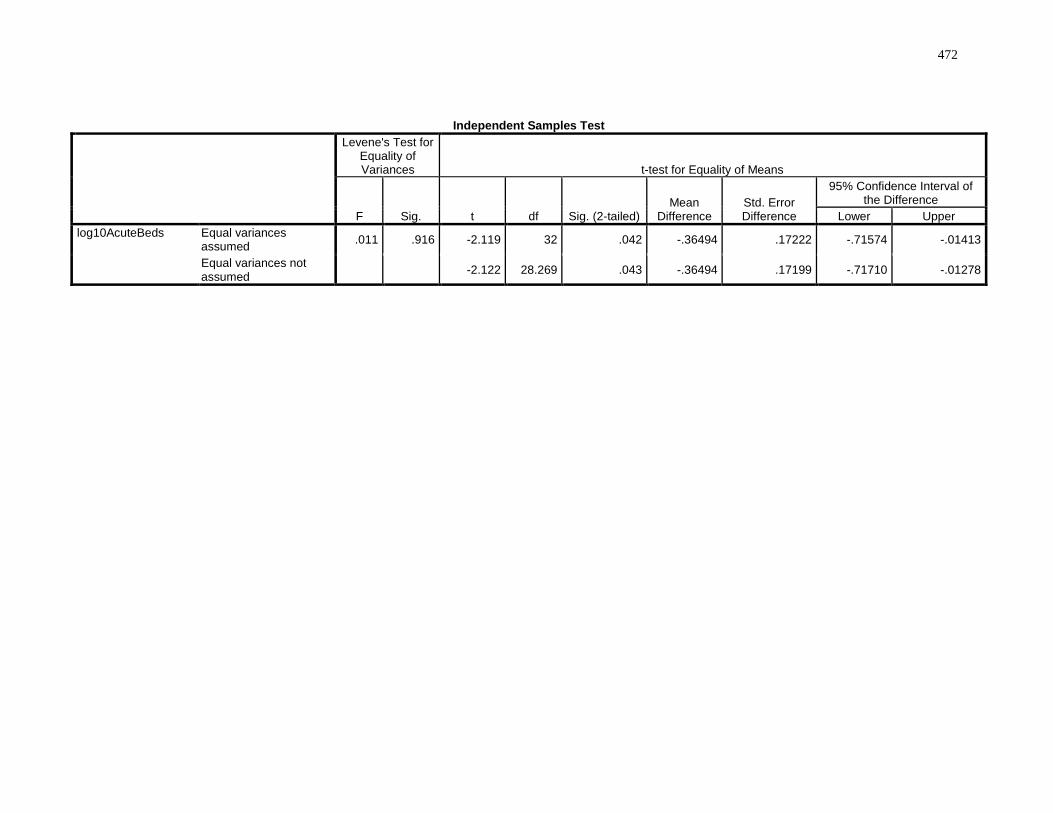
472
Independent Samples Test
Levene's Test for Equality of Variances t-test for Equality of Means
F Sig. t df Sig. (2-tailed) Mean
Difference Std. Error Difference
95% Confidence Interval of the Difference
Lower Upper
log10AcuteBeds Equal variances assumed
.011 .916 -2.119 32 .042 -.36494 .17222 -.71574 -.01413
Equal variances not assumed
-2.122 28.269 .043 -.36494 .17199 -.71710 -.01278
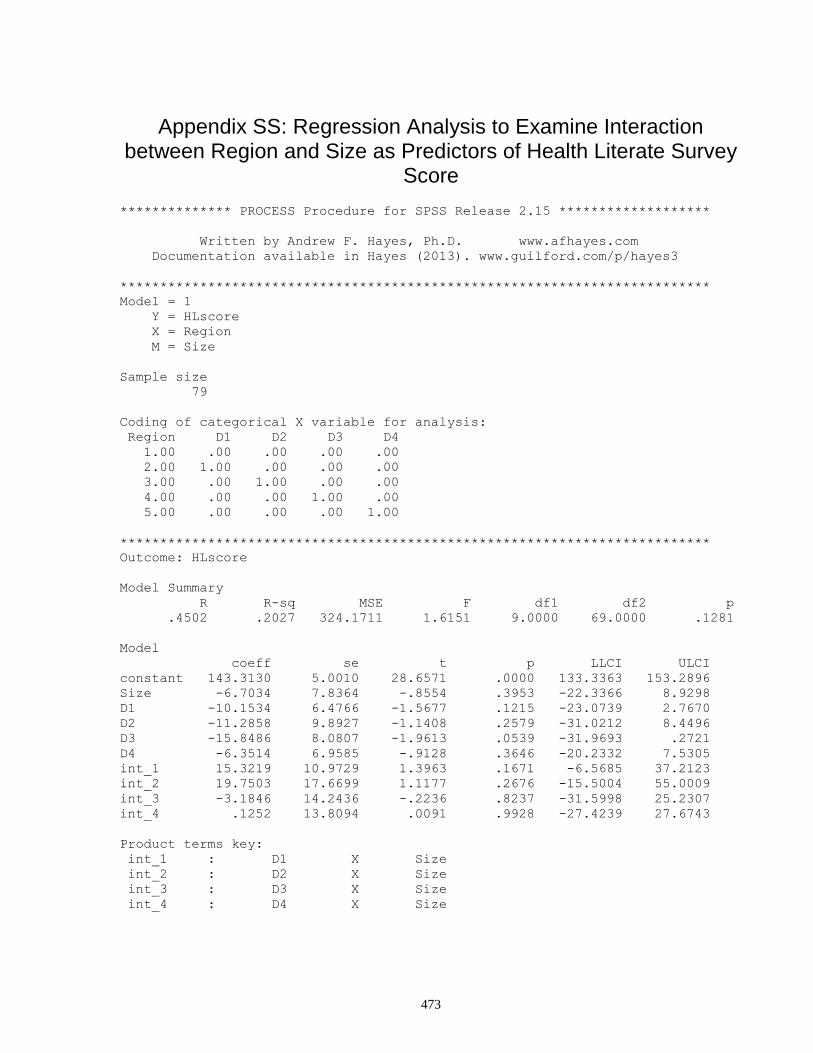
473
Appendix SS: Regression Analysis to Examine Interaction between Region and Size as Predictors of Health Literate Survey
Score
************** PROCESS Procedure for SPSS Release 2.15 *******************
Written by Andrew F. Hayes, Ph.D. www.afhayes.com
Documentation available in Hayes (2013). www.guilford.com/p/hayes3
**************************************************************************
Model = 1
Y = HLscore
X = Region
M = Size
Sample size
79
Coding of categorical X variable for analysis:
Region D1 D2 D3 D4
1.00 .00 .00 .00 .00
2.00 1.00 .00 .00 .00
3.00 .00 1.00 .00 .00
4.00 .00 .00 1.00 .00
5.00 .00 .00 .00 1.00
**************************************************************************
Outcome: HLscore
Model Summary
R R-sq MSE F df1 df2 p
.4502 .2027 324.1711 1.6151 9.0000 69.0000 .1281
Model
coeff se t p LLCI ULCI
constant 143.3130 5.0010 28.6571 .0000 133.3363 153.2896
Size -6.7034 7.8364 -.8554 .3953 -22.3366 8.9298
D1 -10.1534 6.4766 -1.5677 .1215 -23.0739 2.7670
D2 -11.2858 9.8927 -1.1408 .2579 -31.0212 8.4496
D3 -15.8486 8.0807 -1.9613 .0539 -31.9693 .2721
D4 -6.3514 6.9585 -.9128 .3646 -20.2332 7.5305
int_1 15.3219 10.9729 1.3963 .1671 -6.5685 37.2123
int_2 19.7503 17.6699 1.1177 .2676 -15.5004 55.0009
int_3 -3.1846 14.2436 -.2236 .8237 -31.5998 25.2307
int_4 .1252 13.8094 .0091 .9928 -27.4239 27.6743
Product terms key:
int_1 : D1 X Size
int_2 : D2 X Size
int_3 : D3 X Size
int_4 : D4 X Size
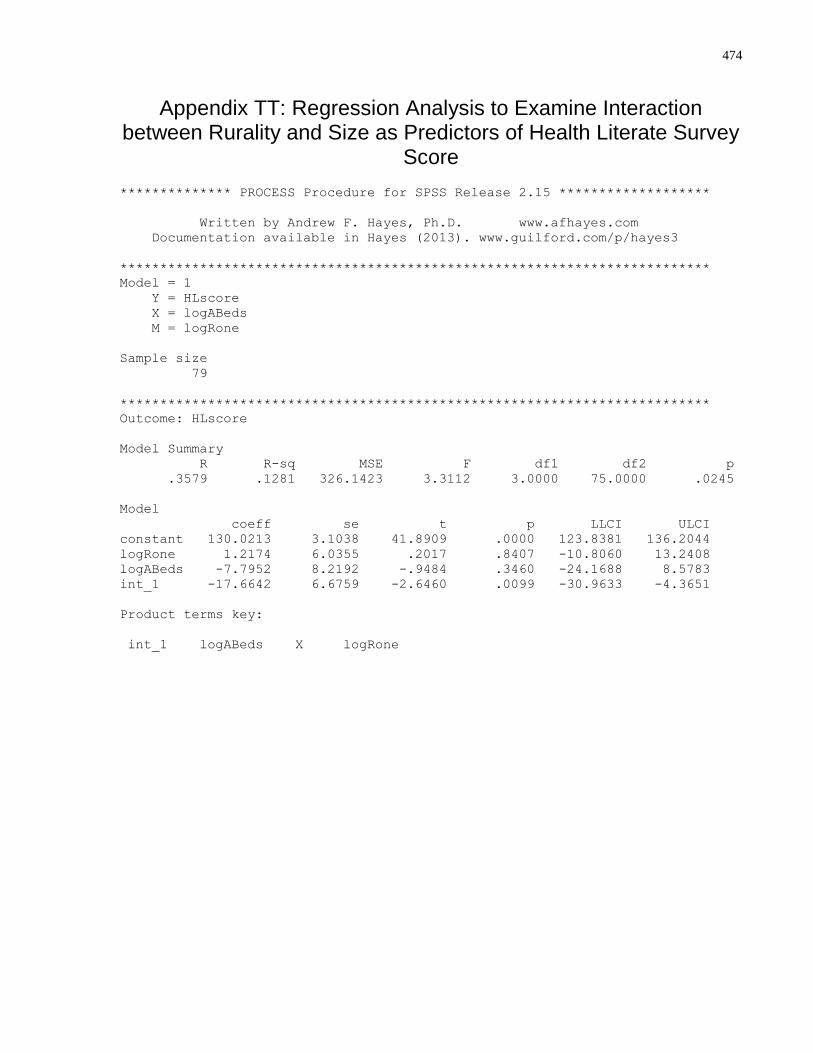
474
Appendix TT: Regression Analysis to Examine Interaction between Rurality and Size as Predictors of Health Literate Survey
Score
************** PROCESS Procedure for SPSS Release 2.15 *******************
Written by Andrew F. Hayes, Ph.D. www.afhayes.com
Documentation available in Hayes (2013). www.guilford.com/p/hayes3
**************************************************************************
Model = 1
Y = HLscore
X = logABeds
M = logRone
Sample size
79
**************************************************************************
Outcome: HLscore
Model Summary
R R-sq MSE F df1 df2 p
.3579 .1281 326.1423 3.3112 3.0000 75.0000 .0245
Model
coeff se t p LLCI ULCI
constant 130.0213 3.1038 41.8909 .0000 123.8381 136.2044
logRone 1.2174 6.0355 .2017 .8407 -10.8060 13.2408
logABeds -7.7952 8.2192 -.9484 .3460 -24.1688 8.5783
int_1 -17.6642 6.6759 -2.6460 .0099 -30.9633 -4.3651
Product terms key:
int_1 logABeds X logRone

475
Copyright Acknowledgements
None required