Embed Size (px)
Citation preview
Article Label
HLRP: Health Literacy Research and Practice • Vol. 1, No. 4, 2017
Original Research
Health Literacy Universal Precautions Are Still a Distant Dream: Analysis of U.S. Data on Health Literate PracticesLan Liang, PhD; and Cindy Brach, MPP
ABSTRACT
Background: Experts have recommended the adoption of health literacy universal precautions, whereby health care providers make all health information easier to understand, confirm everyone’s comprehension, and reduce the difficulty of health-related tasks. The U.S. Department of Health and Human Services select-ed three health literate practices to track progress in the adoption of health literacy universal precautions. Objectives: This study sought to examine whether there has been an increase in the delivery of health literate care and whether recommendations for health literacy universal precautions are being followed. Methods: This study used trend and multiple regression analyses of data from 2011 to 2014 from the Medi-cal Expenditure Panel Survey, a national household survey. Key Results: The proportion of adults in the U.S. who reported receiving health literate care increased from 2011 to 2014, but fell far short of health literacy universal precautions recommendations of delivering health literate care to everyone. In 2014, 70% of the population reported their providers always gave them instructions that were easy to understand, but only 29% were asked to Teach-Back the instructions and only 17% were offered help with forms. Older, less edu-cated, and racial and ethnic minority group members were more likely to report receiving health literate care than more advantaged groups. People who perceived their health and mental health as fair or poor were less likely to report receiving health literate care. Conclusions: Failure to adopt health literacy universal precau-tions in the face of the high prevalence of limited health literacy in the general population may perpetuate adverse health outcomes that are costly to society. Greater efforts should be made to increase providers’ health literacy skills, particularly those who serve populations that are more likely to have limited health literacy, including those with poor health. [Health Literacy Research and Practice. 2017;1(4):e216-e230.]
Plain Language Summary: This study shows that some health care providers did not always check that their instructions were clear enough for patients to understand. Even fewer providers always offered help in filling out forms. People who were older, less educated, or members of racial or ethnic minority groups were more likely to be asked to confirm their understanding or be offered help with forms. More patients said that their provider was easy to understand, checked their understanding, or offered help with forms in 2014 than in 2011.
A large proportion of the United States population has difficulty obtaining, processing, and understanding basic health information and services to make appropriate health decisions. According to the only national survey of health literacy, which was conducted in 2003, only 12% of Ameri-can adults did not have difficulty (or, in other words, had proficient health literacy), 53% had intermediate health lit-eracy, and more than 33% had limited health literacy (U.S. Department of Health and Human Services, 2008). Mem-bers of disadvantaged groups are more likely to have lim-
ited health literacy. These include people with less educa-tion, public or no insurance, and poor health; people who did not speak English before the age of 5 years; the elderly; and members of racial and ethnic minority groups (Kutner, Greenberg, Jin, & Paulsen, 2006). People with limited health literacy are less likely to use preventive services or adhere to treatment, and are more likely to be hospitalized (Berkman et al., 2011).
Health literacy can be improved by reducing the difficulty of health information and the complexity of health care tasks
e216
e217HLRP: Health Literacy Research and Practice • Vol. 1, No. 4, 2017
(Baker, 2006). With few people possessing the health literacy skills needed to manage the demands of the complex U.S. health care system, the difficulty in identifying which peo-ple have limited health literacy, and the fact that a person’s health literacy can vary depending on the circumstances, led experts to recommend the adoption of health literacy uni-versal precautions (Paasche-Orlow, Schillinger, Greene, & Wagner, 2006). Health care providers taking universal pre-cautions assume that all patients may have difficulty compre-hending health information and accessing health services.
The U.S. Department of Health and Human Services in-cluded the goal of improving health literacy in its national health promotion and disease prevention initiative Healthy People (U.S. Department of Health and Human Services, 2000). To track progress in the adoption of health literacy uni-versal precautions, Healthy People 2020 selected measures of three health literacy strategies: (1) giving instructions about what to do about a specific illness or health condition that are easy to understand; (2) asking patients to describe how they were going to follow these instructions (the first step of the Teach-Back method); and (3) offering help in filling out forms (U.S. Department of Health and Human Services, 2017).
The first two are measures of individual providers’ actions in the clinical encounter. Using clear language (i.e., com-mon, everyday language free from jargon) and initiating the Teach-Back method of confirming understanding are highly promoted health literacy strategies (DeWalt et al., 2010). The full Teach-Back process is iterative. If the patient fails to teach the information back correctly, the provider has to re-teach the information and again test understanding until the pa-tient can correctly teach-back the information. Our measure captures only the first step of the process. For the sake of sim-plicity, we refer to this measure as the Teach-Back measure, although it could more precisely be called the initiation of Teach-Back measure. The third measure captures whether health care settings are creating welcoming, stigma-free envi-
ronments that characterize a health-literate health care orga-nization (Brach et al., 2012).
In this article, we use the Healthy People 2020 measures to examine whether there has been an increase in health literate care and whether recommendations for health literacy uni-versal precautions are being followed. We explore how health literate practices by health care professionals vary across pa-tient characteristics and particularly whether people with characteristics associated with lower health literacy (i.e., peo-ple who are older, less educated, members of racial or ethnic minority groups, publicly insured, not proficient in English, and in poorer health) are equally likely to receive health liter-ate care as other people.
DATA AND METHODSStarting in 2011, the Agency for Healthcare Research
and Quality’s Medical Expenditure Panel Survey (MEPS)– Household Component has annually tracked the three Healthy People 2020 health literacy measures using ques-tions that were created through the Consumer Assessment of Healthcare Providers and Systems development process (Weidmer, Brach, & Hays, 2012). MEPS data are nationally representative of the civilian non-institutionalized population and contain detailed information on demographic character-istics, health status, and health care use. Health literacy data are collected as part of the MEPS Adult Self-Administered Questionnaire (Adult SAQ), which had a response rate be-tween 88.7% and 94.2% from 2011 to 2014, the most recent data available at the time of this analysis. We restricted our sample to those older than age 25 years with at least one visit in the previous 12 months. To be able to control for provider characteristics, we also limited our sample to those who re-ported having a person as the usual source of care that is not an emergency room. (Including those people who did not re-port a usual source of care did not change our results in any significant way.) This gave us a sample size of 21,888. Only
Lan Liang, PhD, is a Senior Economist, Center for Financing, Access, and Cost Trends, Agency for Healthcare Research and Quality. Cindy Brach, MPP, is
a Senior Health Case Researcher, Center for Delivery, Organization, and Markets, Agency for Healthcare Research and Quality.
© 2017 Liang, Brach; licensee SLACK Incorporated. This is an Open Access article distributed under the terms of the Creative Commons Attribution-
NonCommercial 4.0 International (https://creativecommons.org/licenses/by-nc/4.0). This license allows users to copy and distribute, to remix, transform,
and build upon the article non-commercially, provided the author is attributed and the new work is non-commercial.
Address correspondence to Lan Liang, PhD, Center for Financing, Access, and Cost Trends, Agency for Healthcare Research and Quality, 5600 Fishers
Lane, 07W45C, Mailstop 07W41A, Rockville, MD 20857; email: [email protected].
Disclaimer: The opinions expressed in this article are the authors’ own and do not necessarily reflect the views of the Agency for Healthcare Research
and Quality, the Department of Health and Human Services, or the United States Government.
Disclosure: The authors have no relevant financial relationships to disclose.
Received: May 30, 2017; Accepted: September 12, 2017
doi: 10.3928/24748307-20170929-01
HLRP: Health Literacy Research and Practice • Vol. 1, No. 4, 2017
respondents who were given instructions (17,309 [79%] of those who had a usual source of care across the 4 years) were asked if instructions were easy to understand and how often they were asked to describe how they planned to follow the instructions. Only respondents who were asked to sign or fill out a form (13,092 across the 4 years) were asked if they were offered help with the form. We derived three outcome vari-ables (Instruction Easy, Teach-Back, and Help with Forms) from the answers to these survey questions. Like the Healthy People measures, we defined an answer of “always” as 1, and anything less than “always” as 0.
Our multiple regression analyses used pooled 2011 to 2014 MEPS household data to examine the associations be-tween patient characteristics and the probability of a person always receiving health literate care. We controlled for char-acteristics predictive of health literacy (Kutner et al., 2006; Martin et al., 2009), such as age, race and ethnicity, insurance status, household poverty status, education level, comfort speaking English, and health status.
Before 2013, Medical Expenditure Panel Survey (MEPS) asked whether each member in a household was comfortable speaking English when MEPS respondents reported not ev-eryone in the household was comfortable or not comfortable speaking English. Since 2013, MEPS asks those who speak another language at home how well they speak English. The potential answers are: very well, well, not well, and not at all. For the purpose of this analysis, we categorized very well and well into “comfortable speaking English,” and not well and not at all into “not comfortable speaking English.” A previ-ous analysis has shown that the proportion of respondents who say they are not comfortable speaking English and the proportion who say they speak English not well or not at all are comparable (Brach & Chevarley, 2008).
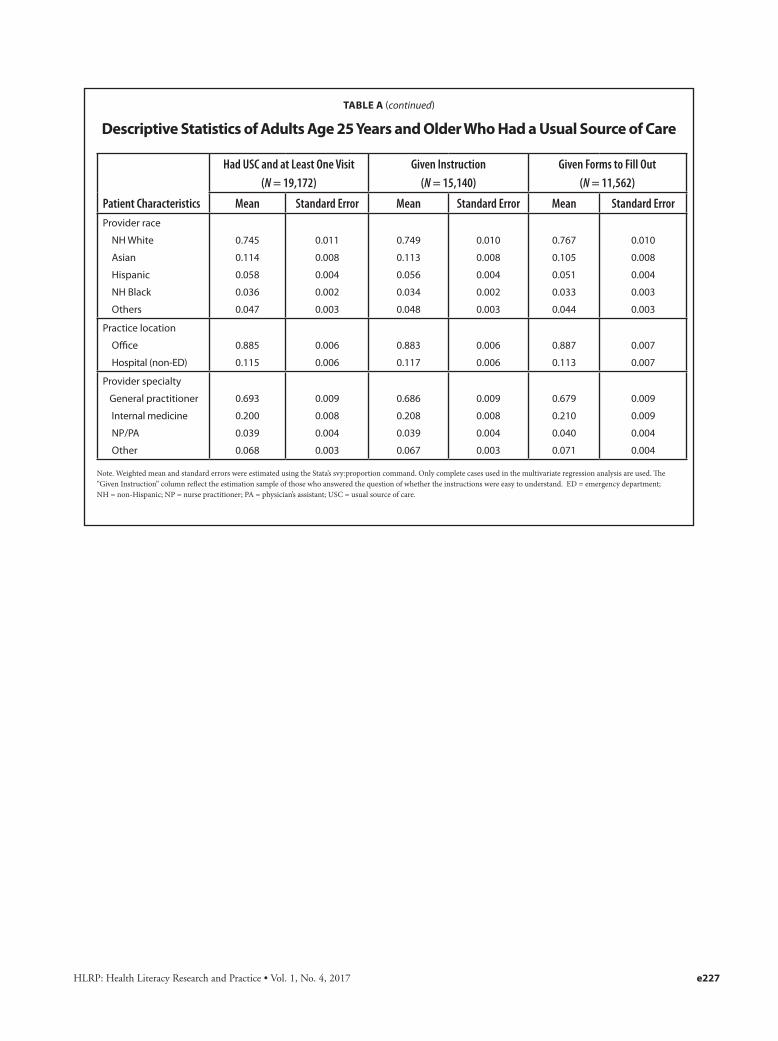
We also controlled for basic demographics (gen-der and marital status) and other health-related variables that might influence how providers interact with patients (e.g., weight, taking five or more drugs, and smoking). Census region and an indicator for metropolitan statisti-cal area were included to capture potential geographic variations in provider practice. Provider characteris-tics (gender, race/ethnicity, specialty, and the location of the usual source of care) were also controlled for. (See Table A for the full specification of these variables and the number of complete cases used in the regression analysis.) We used Stata (version 14.0/SE) to estimate survey-weighted (Adult SAQ weights, which corrects for questionnaire non-response) linear probability models, controlling for MEPS complex survey design. For each key demographic and health status variable of interest, we calculated adjusted means.
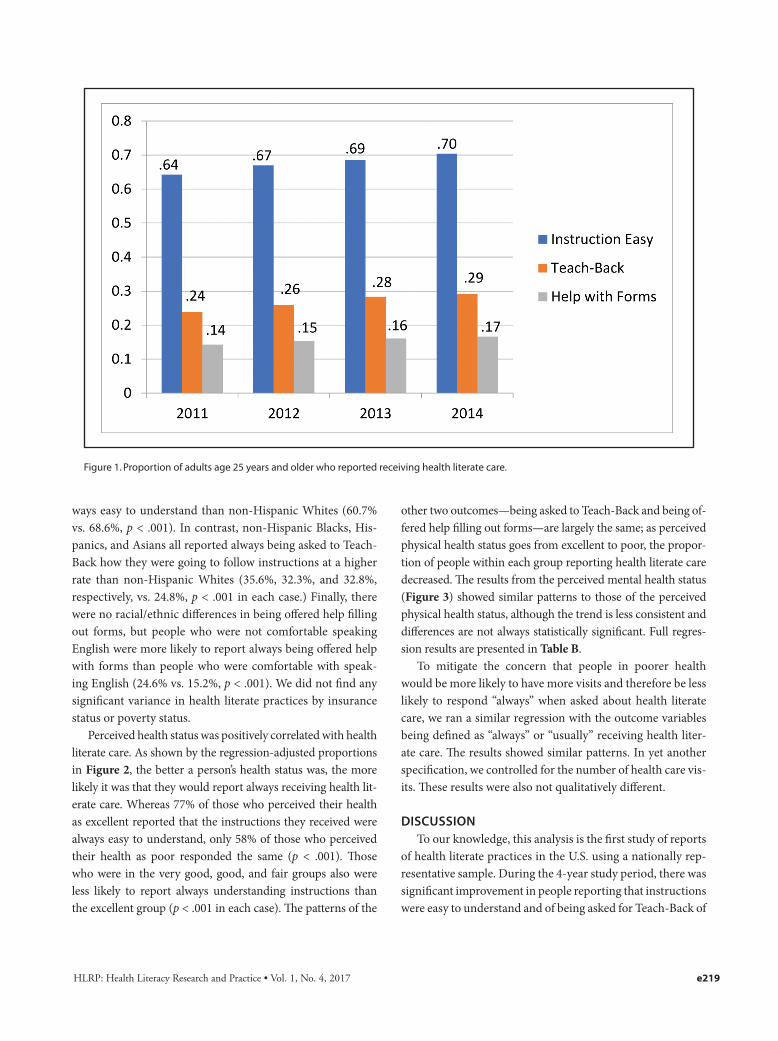
RESULTSAll three measures of health literate care improved be-
tween 2011 and 2014 (Figure 1). The percentage of people who reported their providers always gave them instructions that were easy to understand increased from 64% in 2011 to 70% in 2014, a roughly 10% increase (p < .001). During the same time period, the percentage of people who reported their provider always asked them to explain how they will follow instructions increased from 24% to 29%, an increase of 22% (p < .001). In 2014, 17% of people who were given forms were offered help in filling them out, up from 14% in 2011 (a 16% increase, p < .1).
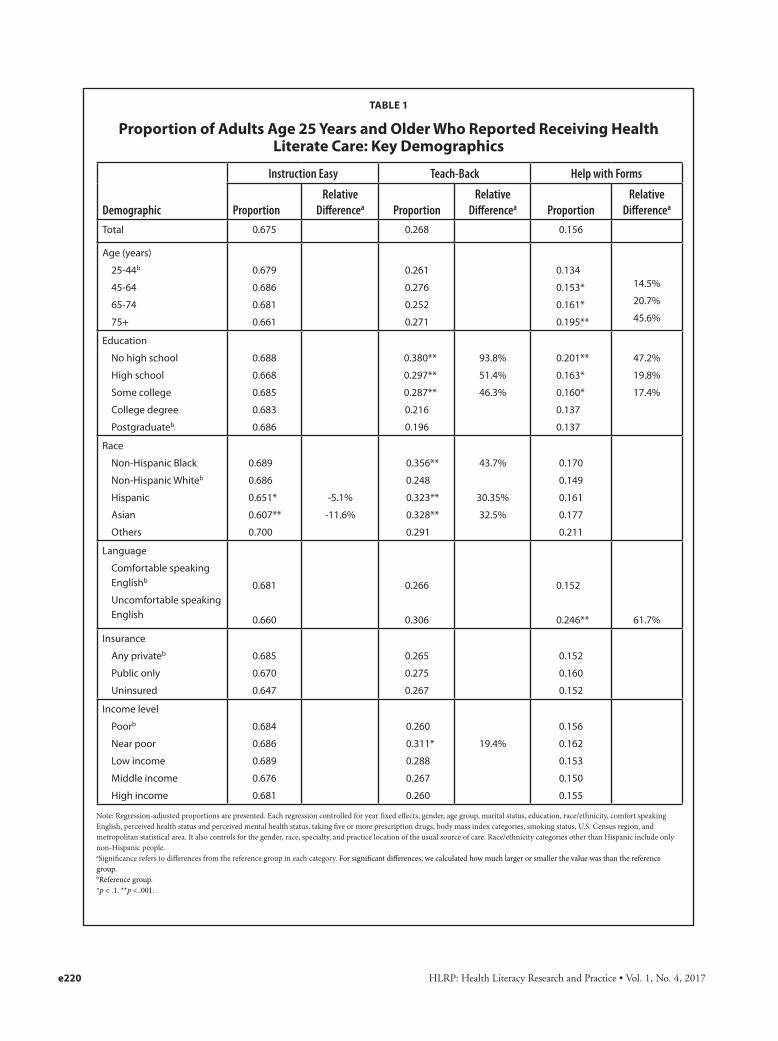
Table 1 shows the regression-adjusted means of the three outcome variables by key patient characteristics that have been shown to predict health literacy. A little more than two-thirds of people in each age group reported that they were always given easy-to-understand instructions. Similarly, the proportion of respondents reporting they were always asked to explain how they planned to follow the instructions, roughly one-quarter from each group, did not vary with age. The oldest group (age ≥75 years), however, was much more likely to always be offered help filling out forms (45.6% more than in people between ages 25 and 44 years, p < .001).
The proportion of people reporting being given easy-to-understand instructions did not vary with education. The three groups with lowest education achievements were, how-ever, much more likely to always be asked to describe how they planned to follow the instructions (the first step of the Teach-Back method): 38% of those with no high school de-gree, 29.7% of those with only a high school degree, and 28.7% of those with some college education reported that they were always asked to Teach-Back instructions, compared to the 19.6% of those with a postgraduate degree who were asked to Teach-Back. The relative differences are large: those with no high school degree were 93.8% more likely than those with a postgraduate degree to report always being asked to Teach-Back instructions, those with only a high school degree were 51.4% more likely, and those with some college education were 46.3% more likely (p < .001 in each case). Whereas the three lowest education groups also received more offers of help with filling out forms (20.1%, 16.3%, and 16%, respec-tively) than those with a postgraduate degree (13.7%); only the difference between the group with no high school degree and the group with a postgraduate degree was statistically significant at better than the p < .1 level.
There were also significant disparities among people by race and ethnicity for all three outcome measures. With re-spect to easy-to-understand instructions, only Asians were significantly less likely to report that instructions were al-
e218
HLRP: Health Literacy Research and Practice • Vol. 1, No. 4, 2017 e219
ways easy to understand than non-Hispanic Whites (60.7% vs. 68.6%, p < .001). In contrast, non-Hispanic Blacks, His-panics, and Asians all reported always being asked to Teach-Back how they were going to follow instructions at a higher rate than non-Hispanic Whites (35.6%, 32.3%, and 32.8%, respectively, vs. 24.8%, p < .001 in each case.) Finally, there were no racial/ethnic differences in being offered help filling out forms, but people who were not comfortable speaking English were more likely to report always being offered help with forms than people who were comfortable with speak-ing English (24.6% vs. 15.2%, p < .001). We did not find any significant variance in health literate practices by insurance status or poverty status.
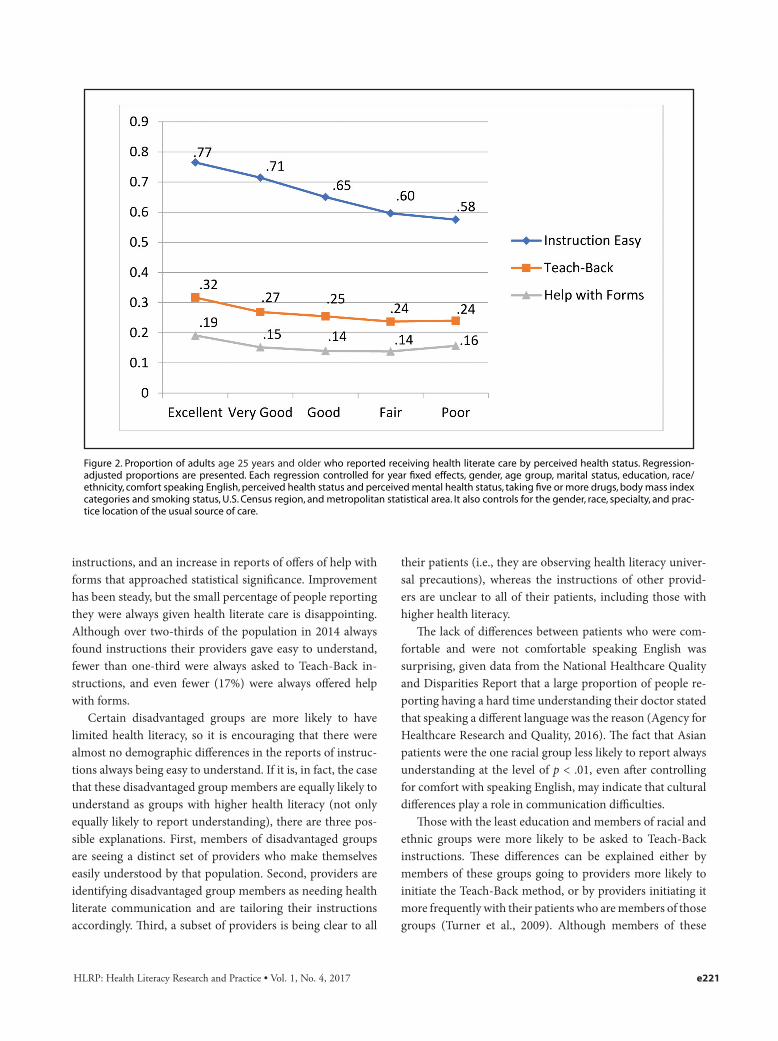
Perceived health status was positively correlated with health literate care. As shown by the regression-adjusted proportions in Figure 2, the better a person’s health status was, the more likely it was that they would report always receiving health lit-erate care. Whereas 77% of those who perceived their health as excellent reported that the instructions they received were always easy to understand, only 58% of those who perceived their health as poor responded the same (p < .001). Those who were in the very good, good, and fair groups also were less likely to report always understanding instructions than the excellent group (p < .001 in each case). The patterns of the
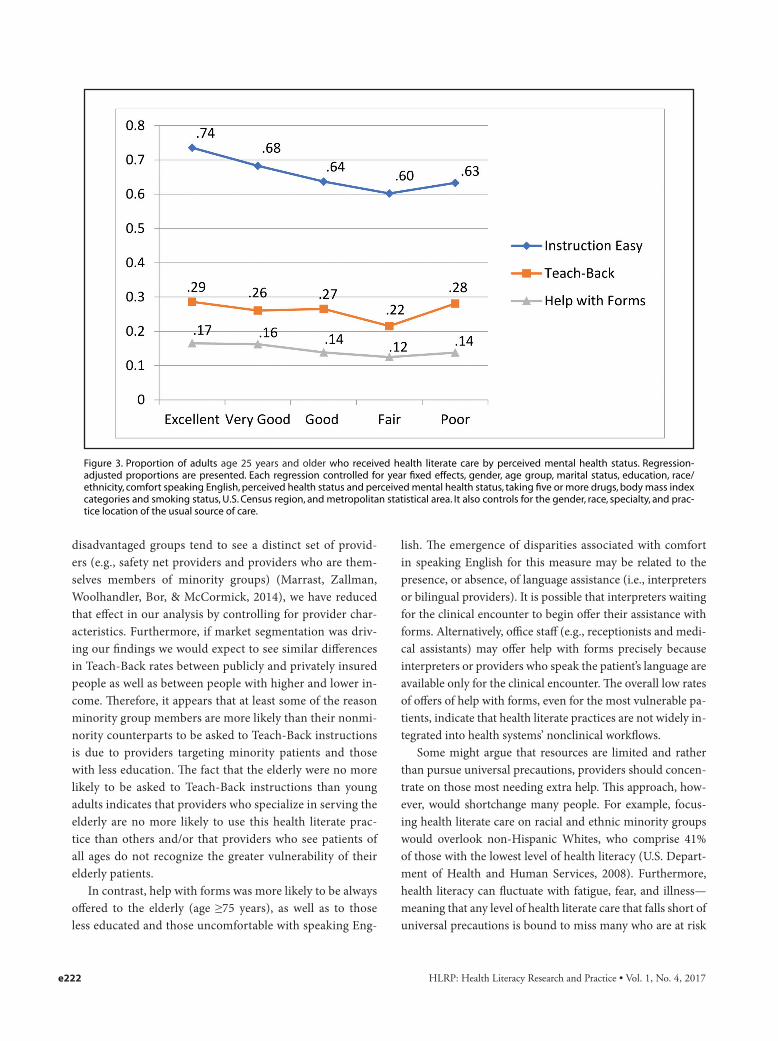
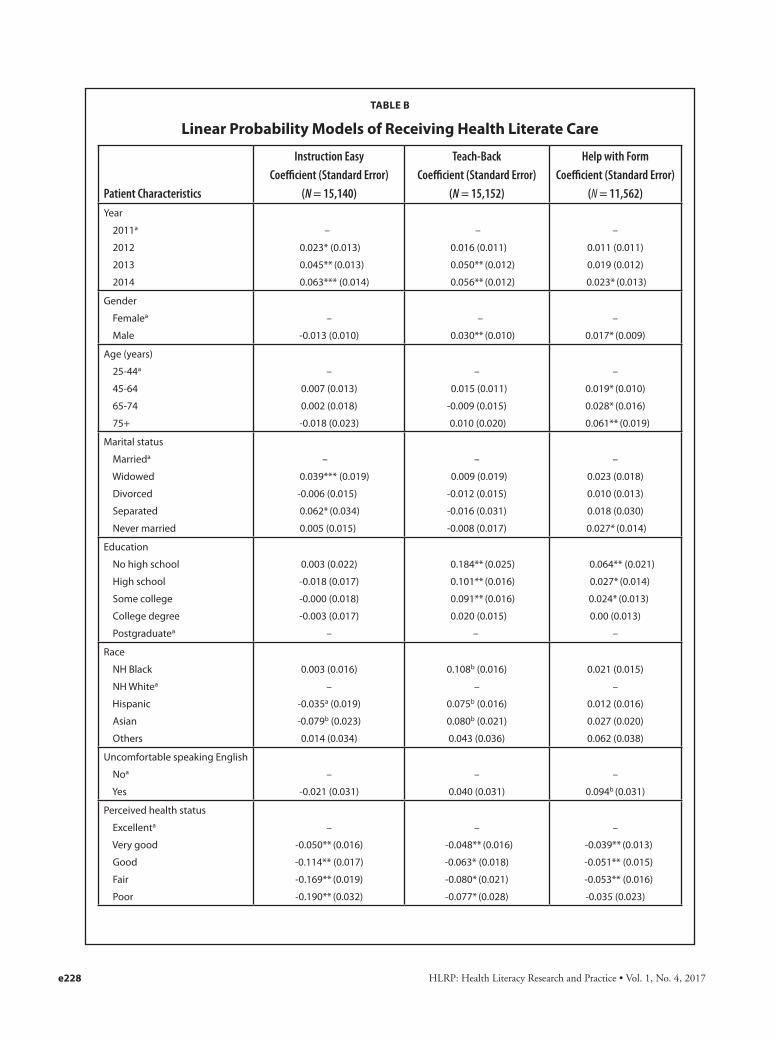
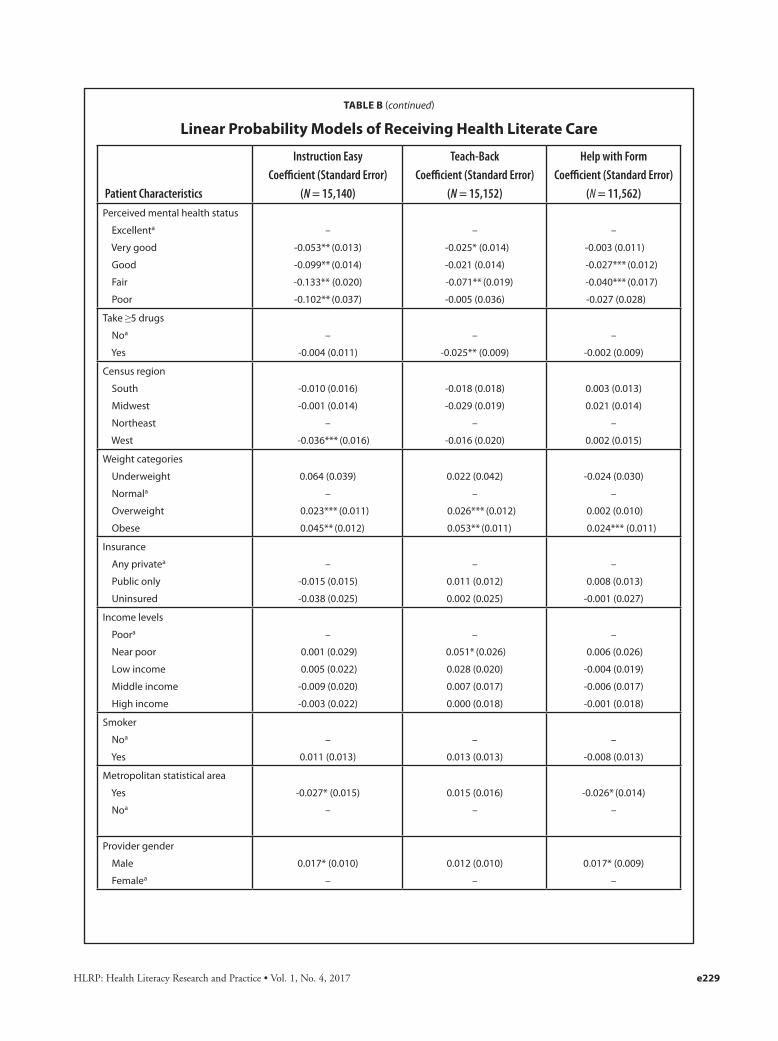
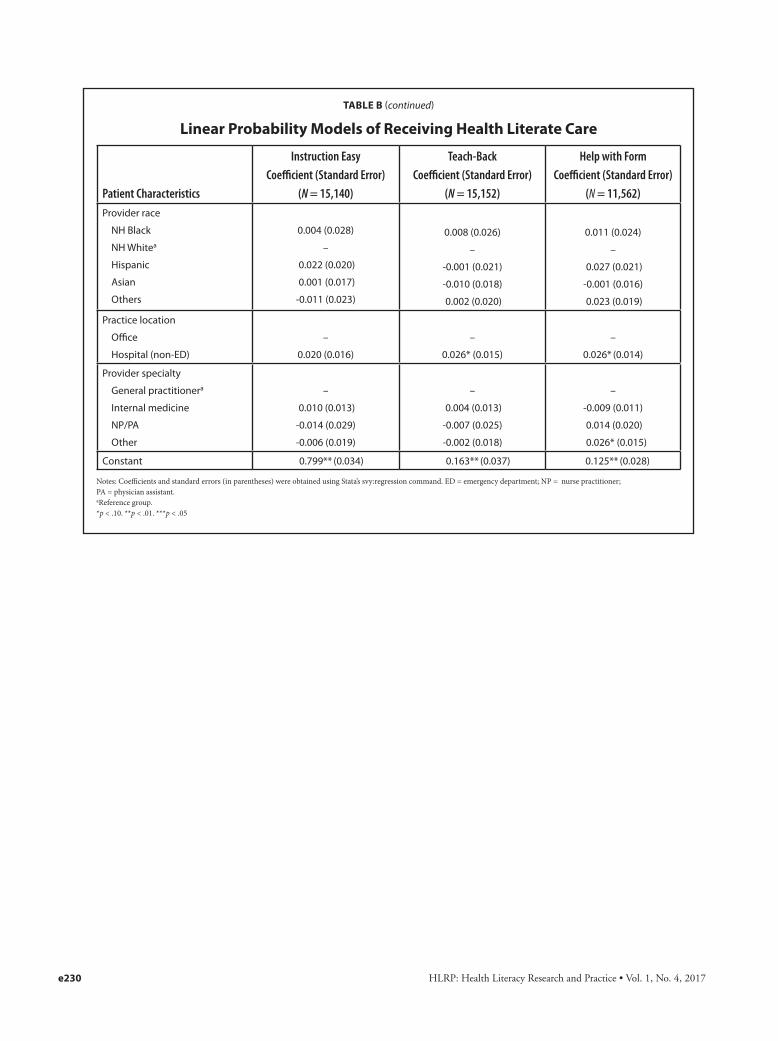
other two outcomes—being asked to Teach-Back and being of-fered help filling out forms—are largely the same; as perceived physical health status goes from excellent to poor, the propor-tion of people within each group reporting health literate care decreased. The results from the perceived mental health status (Figure 3) showed similar patterns to those of the perceived physical health status, although the trend is less consistent and differences are not always statistically significant. Full regres-sion results are presented in Table B.
To mitigate the concern that people in poorer health would be more likely to have more visits and therefore be less likely to respond “always” when asked about health literate care, we ran a similar regression with the outcome variables being defined as “always” or “usually” receiving health liter-ate care. The results showed similar patterns. In yet another specification, we controlled for the number of health care vis-its. These results were also not qualitatively different.
DISCUSSIONTo our knowledge, this analysis is the first study of reports
of health literate practices in the U.S. using a nationally rep-resentative sample. During the 4-year study period, there was significant improvement in people reporting that instructions were easy to understand and of being asked for Teach-Back of
Figure 1. Proportion of adults age 25 years and older who reported receiving health literate care.
HLRP: Health Literacy Research and Practice • Vol. 1, No. 4, 2017e220
TABLE 1
Proportion of Adults Age 25 Years and Older Who Reported Receiving Health Literate Care: Key Demographics
Demographic
Instruction Easy Teach-Back Help with Forms
ProportionRelative
Differencea ProportionRelative
Differencea ProportionRelative
Differencea
Total 0.675 0.268 0.156
Age (years)
25-44b
45-64
65-74
75+
0.679
0.686
0.681
0.661
0.261
0.276
0.252
0.271
0.134
0.153*
0.161*
0.195**
14.5%
20.7%
45.6%
Education
No high school
High school
Some college
College degree
Postgraduateb
0.688
0.668
0.685
0.683
0.686
0.380**
0.297**
0.287**
0.216
0.196
93.8%
51.4%
46.3%
0.201**
0.163*
0.160*
0.137
0.137
47.2%
19.8%
17.4%
Race
Non-Hispanic Black
Non-Hispanic Whiteb
Hispanic
Asian
Others
0.689
0.686
0.651*
0.607**
0.700
-5.1%
-11.6%
0.356**
0.248
0.323**
0.328**
0.291
43.7%
30.35%
32.5%
0.170
0.149
0.161
0.177
0.211
Language
Comfortable speaking Englishb
Uncomfortable speaking English
0.681
0.660
0.266
0.306
0.152
0.246** 61.7%
Insurance
Any privateb
Public only
Uninsured
0.685
0.670
0.647
0.265
0.275
0.267
0.152
0.160
0.152
Income level
Poorb
Near poor
Low income
Middle income
High income
0.684
0.686
0.689
0.676
0.681
0.260
0.311*
0.288
0.267
0.260
19.4%
0.156
0.162
0.153
0.150
0.155
Note: Regression-adjusted proportions are presented. Each regression controlled for year fixed effects, gender, age group, marital status, education, race/ethnicity, comfort speaking English, perceived health status and perceived mental health status, taking five or more prescription drugs, body mass index categories, smoking status, U.S. Census region, and metropolitan statistical area. It also controls for the gender, race, specialty, and practice location of the usual source of care. Race/ethnicity categories other than Hispanic include only non-Hispanic people. aSignificance refers to differences from the reference group in each category. For significant differences, we calculated how much larger or smaller the value was than the reference group. bReference group. *p < .1. **p < .001.
HLRP: Health Literacy Research and Practice • Vol. 1, No. 4, 2017 e221
instructions, and an increase in reports of offers of help with forms that approached statistical significance. Improvement has been steady, but the small percentage of people reporting they were always given health literate care is disappointing. Although over two-thirds of the population in 2014 always found instructions their providers gave easy to understand, fewer than one-third were always asked to Teach-Back in-structions, and even fewer (17%) were always offered help with forms.
Certain disadvantaged groups are more likely to have limited health literacy, so it is encouraging that there were almost no demographic differences in the reports of instruc-tions always being easy to understand. If it is, in fact, the case that these disadvantaged group members are equally likely to understand as groups with higher health literacy (not only equally likely to report understanding), there are three pos-sible explanations. First, members of disadvantaged groups are seeing a distinct set of providers who make themselves easily understood by that population. Second, providers are identifying disadvantaged group members as needing health literate communication and are tailoring their instructions accordingly. Third, a subset of providers is being clear to all
their patients (i.e., they are observing health literacy univer-sal precautions), whereas the instructions of other provid-ers are unclear to all of their patients, including those with higher health literacy.
The lack of differences between patients who were com-fortable and were not comfortable speaking English was surprising, given data from the National Healthcare Quality and Disparities Report that a large proportion of people re-porting having a hard time understanding their doctor stated that speaking a different language was the reason (Agency for Healthcare Research and Quality, 2016). The fact that Asian patients were the one racial group less likely to report always understanding at the level of p < .01, even after controlling for comfort with speaking English, may indicate that cultural differences play a role in communication difficulties.
Those with the least education and members of racial and ethnic groups were more likely to be asked to Teach-Back instructions. These differences can be explained either by members of these groups going to providers more likely to initiate the Teach-Back method, or by providers initiating it more frequently with their patients who are members of those groups (Turner et al., 2009). Although members of these
Figure 2. Proportion of adults age 25 years and older who reported receiving health literate care by perceived health status. Regression-adjusted proportions are presented. Each regression controlled for year fixed effects, gender, age group, marital status, education, race/ethnicity, comfort speaking English, perceived health status and perceived mental health status, taking five or more drugs, body mass index categories and smoking status, U.S. Census region, and metropolitan statistical area. It also controls for the gender, race, specialty, and prac-tice location of the usual source of care.
HLRP: Health Literacy Research and Practice • Vol. 1, No. 4, 2017
disadvantaged groups tend to see a distinct set of provid-ers (e.g., safety net providers and providers who are them-selves members of minority groups) (Marrast, Zallman, Woolhandler, Bor, & McCormick, 2014), we have reduced that effect in our analysis by controlling for provider char-acteristics. Furthermore, if market segmentation was driv-ing our findings we would expect to see similar differences in Teach-Back rates between publicly and privately insured people as well as between people with higher and lower in-come. Therefore, it appears that at least some of the reason minority group members are more likely than their nonmi-nority counterparts to be asked to Teach-Back instructions is due to providers targeting minority patients and those with less education. The fact that the elderly were no more likely to be asked to Teach-Back instructions than young adults indicates that providers who specialize in serving the elderly are no more likely to use this health literate prac-tice than others and/or that providers who see patients of all ages do not recognize the greater vulnerability of their elderly patients.
In contrast, help with forms was more likely to be always offered to the elderly (age ≥75 years), as well as to those less educated and those uncomfortable with speaking Eng-
lish. The emergence of disparities associated with comfort in speaking English for this measure may be related to the presence, or absence, of language assistance (i.e., interpreters or bilingual providers). It is possible that interpreters waiting for the clinical encounter to begin offer their assistance with forms. Alternatively, office staff (e.g., receptionists and medi-cal assistants) may offer help with forms precisely because interpreters or providers who speak the patient’s language are available only for the clinical encounter. The overall low rates of offers of help with forms, even for the most vulnerable pa-tients, indicate that health literate practices are not widely in-tegrated into health systems’ nonclinical workflows.
Some might argue that resources are limited and rather than pursue universal precautions, providers should concen-trate on those most needing extra help. This approach, how-ever, would shortchange many people. For example, focus-ing health literate care on racial and ethnic minority groups would overlook non-Hispanic Whites, who comprise 41% of those with the lowest level of health literacy (U.S. Depart-ment of Health and Human Services, 2008). Furthermore, health literacy can fluctuate with fatigue, fear, and illness—meaning that any level of health literate care that falls short of universal precautions is bound to miss many who are at risk
Figure 3. Proportion of adults age 25 years and older who received health literate care by perceived mental health status. Regression- adjusted proportions are presented. Each regression controlled for year fixed effects, gender, age group, marital status, education, race/ethnicity, comfort speaking English, perceived health status and perceived mental health status, taking five or more drugs, body mass index categories and smoking status, U.S. Census region, and metropolitan statistical area. It also controls for the gender, race, specialty, and prac-tice location of the usual source of care.
e222
HLRP: Health Literacy Research and Practice • Vol. 1, No. 4, 2017 e223
of misunderstanding critical information, such as medication instructions.
Our results suggest that until health literacy universal pre-cautions can be achieved, health care providers should focus more on one vulnerable group—people with poor physical and mental health. People with perceived poor health have worse health literacy (Kutner et al., 2006), yet in our study they were less likely to receive health literate care. A possible explanation for why those with worse physical and mental health status were less likely to always find instructions easy to understand is that they were given more complicated in-structions. However, it is unclear why they were also less like-ly to be asked to Teach-Back to check their understanding of the instructions they received or be offered help filling out forms. Understanding their conditions and how to manage them is especially important for this vulnerable group.
This study is subject to several limitations. First, we do not directly observe the use of health literate strategies, but rely on reports of their use. People who reported instructions were always easy to understand may have misunderstood the instructions because providers were not easy to under-stand, but did not realize they misunderstood. Similarly, people who reported they were asked to Teach-Back instruc-tions may have only been asked, “Do you understand?” or “Do you have any questions?” We would not, however, ex-pect this limitation to bias our temporal analysis because re-porting bias would not be expected to change over time. We have no information if misreporting of Teach-Back or offers of help with forms varies by the respondent characteristics included in our model. Second, the health literacy questions are asked at the person level and not at the visit level. It is possible that people who have a large number of visits find it harder to answer they “always” received health literate care. We mitigated this by running two sensitivity analyses: (1) combining “usually” and “always” for all three outcomes, and (2) including total number of visits in the regression analy-sis as a control variable. Third, the SAQ is available only in English and Spanish. For languages other than English, an interpreter, on site for the verbally administered portion of the MEPS data collection process, may have sight-translat-ed the SAQ and read the questions out loud, but we do not have those data. Fourth, completing the SAQ requires read-ing and writing skills (although interviewers are permitted to write the answers down if a medical condition prevents the respondent from doing so, and a toll-free number was avail-able to ask questions). Although we found that people with lower levels of education are less likely to complete the SAQ, the completion rates were between 88.7% and 94.2%, and the SAQ weights account for item nonresponse using variables
such as education. Although the point-in-time estimates of the proportion of the population receiving health literate care may be higher than our estimates, our trend analysis remains unaffected. Fifth, respondents with less education were less likely to answer that they received instructions and that they were given forms and, therefore, were not asked about Teach-Back or help with forms. Because these respondents were more likely to report that Teach-Back was initiated and that help with forms was offered, this also could result in a down-ward bias in our point-in-time estimates. Finally, our data are from a household survey and not a survey of providers. Therefore, differences in the receipt of health literate care that are associated with patient characteristics may be the result of (1) providers varying the level of health literate care they deliver based on each patient’s characteristics, or (2) people with similar characteristics being more likely to see providers that deliver more (or less) health literate care.
CONCLUSIONDuring the period from 2011 to 2014, rates of health liter-
ate care increased slowly but steadily. However, almost one-third of the population seeing health care providers had, at one time during 2014, found that instructions given by their health care provider were not easy to understand. At some point during the year, over two-thirds did not have their un-derstanding of instructions they received verified using the Teach-Back method. Some vulnerable populations (members of racial and ethnic minority groups, the elderly, and those with little education) were more likely to receive some forms of health literate care. Failure to adopt health literacy uni-versal precautions in the face of the high prevalence of lim-ited health literacy in the general population may perpetuate adverse health outcomes that are costly to society (Howard, 2004). Greater efforts should be made to increase providers’ health literacy skills, particularly those who serve popula-tions that are more likely to have limited health literacy— including those with poor health. Importantly, health sys-tems will need to redesign workflows to integrate health liter-ate practices if health literacy universal precautions are ever to be achieved (Brach, 2017; Brach et al., 2012).
REFERENCESAgency for Healthcare Research and Quality. (2016). National health-
care quality and disparities report chartbook on person- and family-centered care. Retrieved from https://www.ahrq.gov/ research/findings/nhqrdr/chartbooks/personcentered/index.html
Baker, D. W. (2006). The meaning and the measure of health literacy. Journal of General Internal Medicine, 21(8), 878-883. doi:10.1111/j.1525-1497.2006.00540.x
Berkman, N. D., Sheridan, S. L., Donahue, K. E., Halpern, D. J., Viera, A., Crotty, K., . . . Viswanathan, M. (2011). Health literacy interventions
HLRP: Health Literacy Research and Practice • Vol. 1, No. 4, 2017
and outcomes: An updated systematic review. Retrieved from Agency for Healthcare Research and Quality website: https://archive.ahrq.gov/research/findings/evidence-based-reports/litupsum.html
Brach, C. (2017). The journey to become a health literate organization: A snapshot of health system improvement. Studies in Health Technol-ogy and Informatics, 240, 203-237.
Brach, C., Keller, D., Hernandez, L. M., Baur, C., Parker, R., Dreyer, B., . . . Schillinger, D. (2012). Ten attributes of health literate health care or-ganizations. Retrieved from National Academy of Medicine website: https://nam.edu/perspectives-2012-ten-attributes-of-health-literate-health-care-organizations/
Brach, C., & Chevarley, F. M. (2008). Demographics and health care access and utilization of limited-English-proficient and English-proficient Hispanics. Retrieved from Agency for Healthcare Re-search and Quality website: http://meps.ahrq.gov/mepsweb/data_files/publications//rf28/rf28.pdf
DeWalt, D. A., Callahan, L. F., Hawk, V. H., Broucksou, K. A., Hink, A., Rudd, R., & Brach, C. (2010). Health literacy universal precautions toolkit. Retrieved from Agency for Healthcare Research and Qual-ity website: http://www.ahrq.gov/qual/literacy/healthliteracytoolkit.pdf
Howard, D. H. (2004). The relationship between health literacy and medi-cal costs. Retrieved from The National Academies Press website: https://www.nap.edu/read/10883/chapter/11
Kutner, M., Greenberg, E., Jin, Y., & Paulsen, C. (2006). The health lit-eracy of America’s adults: Results from the 2003 national assess-ment of adult literacy. Retrieved from National Center for Educa-tional Statistics website: https://nces.ed.gov/pubsearch/pubsinfo.asp?pubid=2006483
Marrast, L. M., Zallman, L., Woolhandler, S., Bor, D. H., & McCormick,
D. (2014). Minority physicians’ role in the care of underserved pa-tients: Diversifying the physician workforce may be key in address-ing health disparities. JAMA Internal Medicine, 174(2), 289-291. doi:10.1001/jamainternmed.2013.12756
Martin, L. T., Ruder, T., Escarce, J. J., Ghosh-Dastidar, B., Sherman, D., Elliott, M., . . . Lurie, N. (2009). Developing predictive models of health literacy. Journal of General Internal Medicine, 24(11), 1211-1216. doi:10.1007/s11606-009-1105-7
Paasche-Orlow, M. K., Schillinger, D., Greene, S. M., & Wagner, E. H. (2006). How health care systems can begin to address the chal-lenge of limited literacy. Journal of General Internal Medicine, 21(8), 884-887. doi:10.1111/j.1525-1497.2006.00544.x
Turner, T., Cull, W. L., Bayldon, B., Klass, P., Sanders, L. M., Frintner, M. P., . . . Dreyer, B. (2009). Pediatricians and health literacy: Descrip-tive results from a national survey. Pediatrics, 124(Suppl. 3), S299-S305.
U.S. Department of Health and Human Services. (2008). America’s health literacy: Why we need accessible health information. Retrieved from http://www.health.gov/communication/literacy/default.htm
U.S. Department of Health and Human Services. (2000). Healthy peo-ple 2010: Understanding and improving health. Retrieved from www.healthypeople.gov/2010/document/pdf/uih/2010uih.pdf
U.S. Department of Health and Human Services. (2017). Healthy people 2020. Retrieved from https://www.healthypeople.gov/2020/topics-objectives/topic/health-communication-and-health-information-technology/objectives
Weidmer, B. A., Brach, C., & Hays, R. D. (2012). Development and evalu-ation of CAHPS survey items assessing how well healthcare pro-viders address health literacy. Medical Care, 50(Suppl. 2), S3-S11. doi:10.1097/MLR.0b013e3182652482
e224
HLRP: Health Literacy Research and Practice • Vol. 1, No. 4, 2017 e225
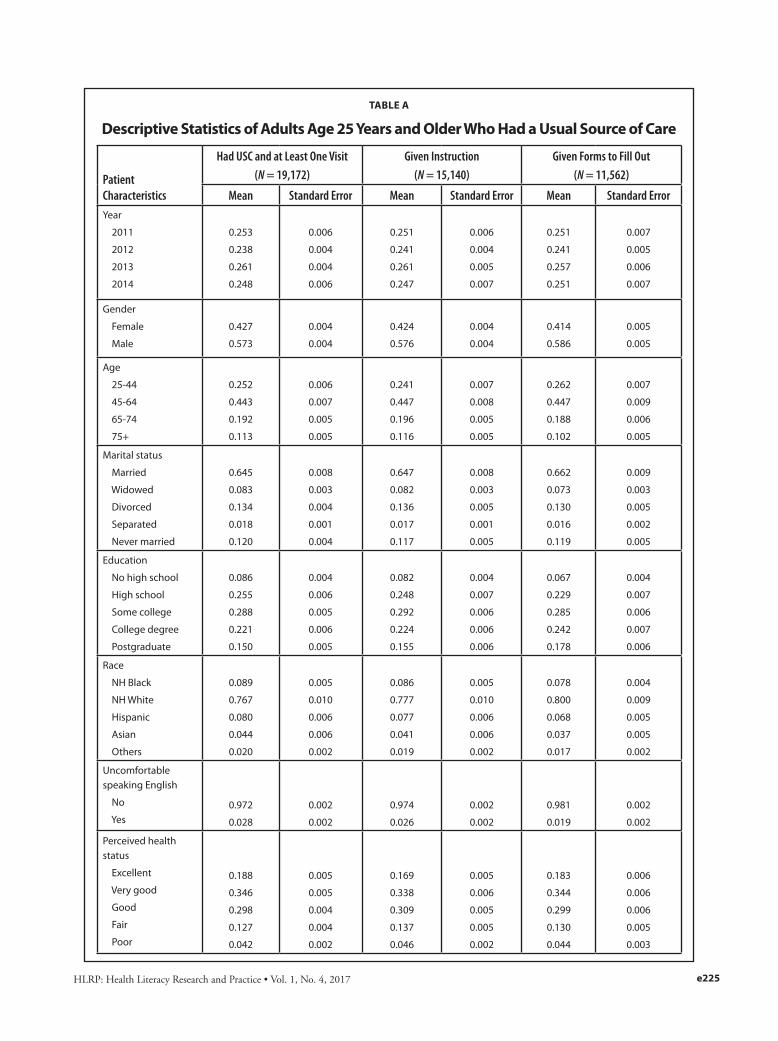
TABLE A
Descriptive Statistics of Adults Age 25 Years and Older Who Had a Usual Source of Care
Patient Characteristics
Had USC and at Least One Visit (N = 19,172)
Given Instruction(N = 15,140)
Given Forms to Fill Out(N = 11,562)
Mean Standard Error Mean Standard Error Mean Standard ErrorYear
2011
2012
2013
2014
0.253
0.238
0.261
0.248
0.006
0.004
0.004
0.006
0.251
0.241
0.261
0.247
0.006
0.004
0.005
0.007
0.251
0.241
0.257
0.251
0.007
0.005
0.006
0.007
Gender
Female
Male
0.427
0.573
0.004
0.004
0.424
0.576
0.004
0.004
0.414
0.586
0.005
0.005
Age
25-44
45-64
65-74
75+
0.252
0.443
0.192
0.113
0.006
0.007
0.005
0.005
0.241
0.447
0.196
0.116
0.007
0.008
0.005
0.005
0.262
0.447
0.188
0.102
0.007
0.009
0.006
0.005
Marital status
Married
Widowed
Divorced
Separated
Never married
0.645
0.083
0.134
0.018
0.120
0.008
0.003
0.004
0.001
0.004
0.647
0.082
0.136
0.017
0.117
0.008
0.003
0.005
0.001
0.005
0.662
0.073
0.130
0.016
0.119
0.009
0.003
0.005
0.002
0.005
Education
No high school
High school
Some college
College degree
Postgraduate
0.086
0.255
0.288
0.221
0.150
0.004
0.006
0.005
0.006
0.005
0.082
0.248
0.292
0.224
0.155
0.004
0.007
0.006
0.006
0.006
0.067
0.229
0.285
0.242
0.178
0.004
0.007
0.006
0.007
0.006
Race
NH Black
NH White
Hispanic
Asian
Others
0.089
0.767
0.080
0.044
0.020
0.005
0.010
0.006
0.006
0.002
0.086
0.777
0.077
0.041
0.019
0.005
0.010
0.006
0.006
0.002
0.078
0.800
0.068
0.037
0.017
0.004
0.009
0.005
0.005
0.002
Uncomfortable speaking English
No
Yes0.972
0.028
0.002
0.002
0.974
0.026
0.002
0.002
0.981
0.019
0.002
0.002
Perceived health status
Excellent
Very good
Good
Fair
Poor
0.188
0.346
0.298
0.127
0.042
0.005
0.005
0.004
0.004
0.002
0.169
0.338
0.309
0.137
0.046
0.005
0.006
0.005
0.005
0.002
0.183
0.344
0.299
0.130
0.044
0.006
0.006
0.006
0.005
0.003
HLRP: Health Literacy Research and Practice • Vol. 1, No. 4, 2017
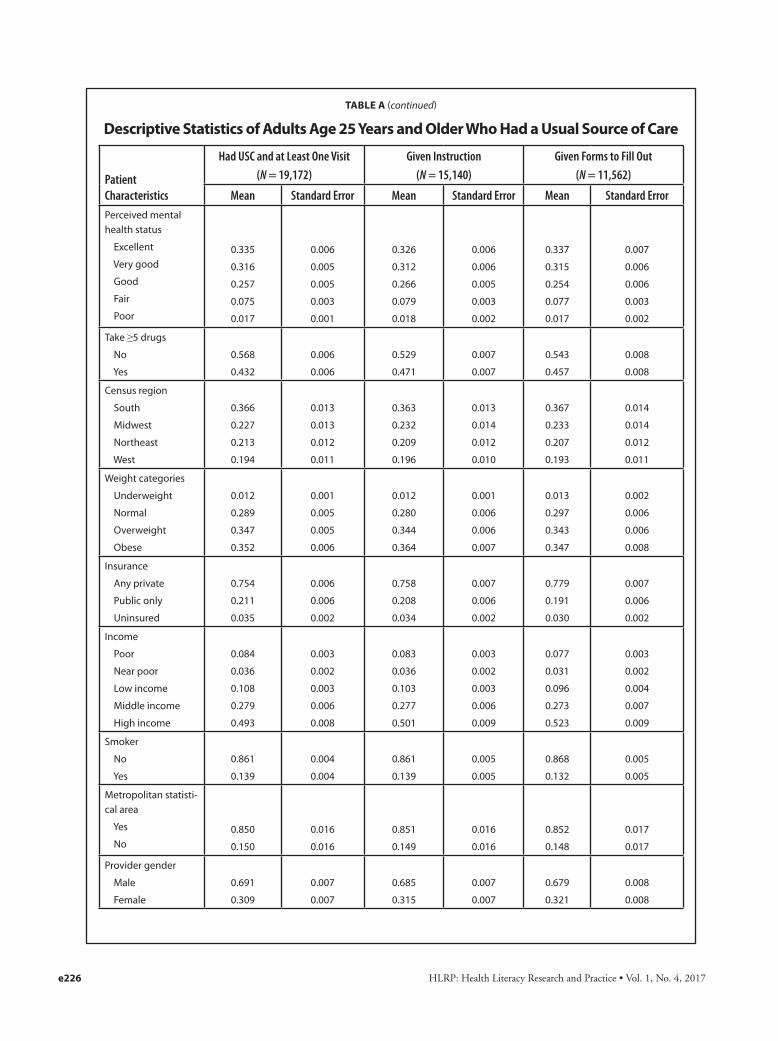
TABLE A (continued)
Descriptive Statistics of Adults Age 25 Years and Older Who Had a Usual Source of Care
Patient Characteristics
Had USC and at Least One Visit(N = 19,172)
Given Instruction(N = 15,140)
Given Forms to Fill Out(N = 11,562)
Mean Standard Error Mean Standard Error Mean Standard ErrorPerceived mental health status
Excellent
Very good
Good
Fair
Poor
0.335
0.316
0.257
0.075
0.017
0.006
0.005
0.005
0.003
0.001
0.326
0.312
0.266
0.079
0.018
0.006
0.006
0.005
0.003
0.002
0.337
0.315
0.254
0.077
0.017
0.007
0.006
0.006
0.003
0.002
Take ≥5 drugs
No
Yes
0.568
0.432
0.006
0.006
0.529
0.471
0.007
0.007
0.543
0.457
0.008
0.008
Census region
South
Midwest
Northeast
West
0.366
0.227
0.213
0.194
0.013
0.013
0.012
0.011
0.363
0.232
0.209
0.196
0.013
0.014
0.012
0.010
0.367
0.233
0.207
0.193
0.014
0.014
0.012
0.011
Weight categories
Underweight
Normal
Overweight
Obese
0.012
0.289
0.347
0.352
0.001
0.005
0.005
0.006
0.012
0.280
0.344
0.364
0.001
0.006
0.006
0.007
0.013
0.297
0.343
0.347
0.002
0.006
0.006
0.008
Insurance
Any private
Public only
Uninsured
0.754
0.211
0.035
0.006
0.006
0.002
0.758
0.208
0.034
0.007
0.006
0.002
0.779
0.191
0.030
0.007
0.006
0.002
Income
Poor
Near poor
Low income
Middle income
High income
0.084
0.036
0.108
0.279
0.493
0.003
0.002
0.003
0.006
0.008
0.083
0.036
0.103
0.277
0.501
0.003
0.002
0.003
0.006
0.009
0.077
0.031
0.096
0.273
0.523
0.003
0.002
0.004
0.007
0.009
Smoker
No
Yes
0.861
0.139
0.004
0.004
0.861
0.139
0.005
0.005
0.868
0.132
0.005
0.005
Metropolitan statisti-cal area
Yes
No0.850
0.150
0.016
0.016
0.851
0.149
0.016
0.016
0.852
0.148
0.017
0.017
Provider gender
Male
Female
0.691
0.309
0.007
0.007
0.685
0.315
0.007
0.007
0.679
0.321
0.008
0.008
e226
HLRP: Health Literacy Research and Practice • Vol. 1, No. 4, 2017 e227
TABLE A (continued)
Descriptive Statistics of Adults Age 25 Years and Older Who Had a Usual Source of Care
Patient Characteristics
Had USC and at Least One Visit(N = 19,172)
Given Instruction(N = 15,140)
Given Forms to Fill Out(N = 11,562)
Mean Standard Error Mean Standard Error Mean Standard ErrorProvider race
NH White
Asian
Hispanic
NH Black
Others
0.745
0.114
0.058
0.036
0.047
0.011
0.008
0.004
0.002
0.003
0.749
0.113
0.056
0.034
0.048
0.010
0.008
0.004
0.002
0.003
0.767
0.105
0.051
0.033
0.044
0.010
0.008
0.004
0.003
0.003
Practice location
Office
Hospital (non-ED)
0.885
0.115
0.006
0.006
0.883
0.117
0.006
0.006
0.887
0.113
0.007
0.007
Provider specialty
General practitioner
Internal medicine
NP/PA
Other
0.693
0.200
0.039
0.068
0.009
0.008
0.004
0.003
0.686
0.208
0.039
0.067
0.009
0.008
0.004
0.003
0.679
0.210
0.040
0.071
0.009
0.009
0.004
0.004 Note. Weighted mean and standard errors were estimated using the Stata’s svy:proportion command. Only complete cases used in the multivariate regression analysis are used. The “Given Instruction” column reflect the estimation sample of those who answered the question of whether the instructions were easy to understand. ED = emergency department; NH = non-Hispanic; NP = nurse practitioner; PA = physician’s assistant; USC = usual source of care.
HLRP: Health Literacy Research and Practice • Vol. 1, No. 4, 2017
TABLE B
Linear Probability Models of Receiving Health Literate Care
Patient Characteristics
Instruction Easy Coefficient (Standard Error)
(N = 15,140)
Teach-BackCoefficient (Standard Error)
(N = 15,152)
Help with FormCoefficient (Standard Error)
(N = 11,562)Year
2011a
2012
2013
2014
–
0.023* (0.013)
0.045** (0.013)
0.063*** (0.014)
–
0.016 (0.011)
0.050** (0.012)
0.056** (0.012)
–
0.011 (0.011)
0.019 (0.012)
0.023* (0.013)
Gender
Femalea
Male
–
-0.013 (0.010)
–
0.030** (0.010)
–
0.017* (0.009)
Age (years)
25-44a
45-64
65-74
75+
–
0.007 (0.013)
0.002 (0.018)
-0.018 (0.023)
–
0.015 (0.011)
-0.009 (0.015)
0.010 (0.020)
–
0.019* (0.010)
0.028* (0.016)
0.061** (0.019)
Marital status
Marrieda
Widowed
Divorced
Separated
Never married
–
0.039*** (0.019)
-0.006 (0.015)
0.062* (0.034)
0.005 (0.015)
–
0.009 (0.019)
-0.012 (0.015)
-0.016 (0.031)
-0.008 (0.017)
–
0.023 (0.018)
0.010 (0.013)
0.018 (0.030)
0.027* (0.014)
Education
No high school
High school
Some college
College degree
Postgraduatea
0.003 (0.022)
-0.018 (0.017)
-0.000 (0.018)
-0.003 (0.017)
–
0.184** (0.025)
0.101** (0.016)
0.091** (0.016)
0.020 (0.015)
–
0.064** (0.021)
0.027* (0.014)
0.024* (0.013)
0.00 (0.013)
–
Race
NH Black
NH Whitea
Hispanic
Asian
Others
0.003 (0.016)
–
-0.035a (0.019)
-0.079b (0.023)
0.014 (0.034)
0.108b (0.016)
–
0.075b (0.016)
0.080b (0.021)
0.043 (0.036)
0.021 (0.015)
–
0.012 (0.016)
0.027 (0.020)
0.062 (0.038)
Uncomfortable speaking English
Noa
Yes
–
-0.021 (0.031)
–
0.040 (0.031)
–
0.094b (0.031)
Perceived health status
Excellenta
Very good
Good
Fair
Poor
–
-0.050** (0.016)
-0.114** (0.017)
-0.169** (0.019)
-0.190** (0.032)
–
-0.048** (0.016)
-0.063* (0.018)
-0.080* (0.021)
-0.077* (0.028)
–
-0.039** (0.013)
-0.051** (0.015)
-0.053** (0.016)
-0.035 (0.023)
e228
HLRP: Health Literacy Research and Practice • Vol. 1, No. 4, 2017 e229
TABLE B (continued)
Linear Probability Models of Receiving Health Literate Care
Patient Characteristics
Instruction EasyCoefficient (Standard Error)
(N = 15,140)
Teach-BackCoefficient (Standard Error)
(N = 15,152)
Help with FormCoefficient (Standard Error)
(N = 11,562)Perceived mental health status
Excellenta
Very good
Good
Fair
Poor
–
-0.053** (0.013)
-0.099** (0.014)
-0.133** (0.020)
-0.102** (0.037)
–
-0.025* (0.014)
-0.021 (0.014)
-0.071** (0.019)
-0.005 (0.036)
–
-0.003 (0.011)
-0.027*** (0.012)
-0.040*** (0.017)
-0.027 (0.028)
Take ≥5 drugs
Noa
Yes
–
-0.004 (0.011)
–
-0.025** (0.009)
–
-0.002 (0.009)
Census region
South
Midwest
Northeast
West
-0.010 (0.016)
-0.001 (0.014)
–
-0.036*** (0.016)
-0.018 (0.018)
-0.029 (0.019)
–
-0.016 (0.020)
0.003 (0.013)
0.021 (0.014)
–
0.002 (0.015)
Weight categories
Underweight
Normala
Overweight
Obese
0.064 (0.039)
–
0.023*** (0.011)
0.045** (0.012)
0.022 (0.042)
–
0.026*** (0.012)
0.053** (0.011)
-0.024 (0.030)
–
0.002 (0.010)
0.024*** (0.011)
Insurance
Any privatea
Public only
Uninsured
–
-0.015 (0.015)
-0.038 (0.025)
–
0.011 (0.012)
0.002 (0.025)
–
0.008 (0.013)
-0.001 (0.027)
Income levels
Poora
Near poor
Low income
Middle income
High income
–
0.001 (0.029)
0.005 (0.022)
-0.009 (0.020)
-0.003 (0.022)
–
0.051* (0.026)
0.028 (0.020)
0.007 (0.017)
0.000 (0.018)
–
0.006 (0.026)
-0.004 (0.019)
-0.006 (0.017)
-0.001 (0.018)
Smoker
Noa
Yes
–
0.011 (0.013)
–
0.013 (0.013)
–
-0.008 (0.013)
Metropolitan statistical area
Yes
Noa
-0.027* (0.015)
–
0.015 (0.016)
–
-0.026* (0.014)
–
Provider gender
Male
Femalea
0.017* (0.010)
–
0.012 (0.010)
–
0.017* (0.009)
–
HLRP: Health Literacy Research and Practice • Vol. 1, No. 4, 2017e230
TABLE B (continued)
Linear Probability Models of Receiving Health Literate Care
Patient Characteristics
Instruction Easy Coefficient (Standard Error)
(N = 15,140)
Teach-BackCoefficient (Standard Error)
(N = 15,152)
Help with FormCoefficient (Standard Error)
(N = 11,562)Provider race
NH Black
NH Whitea
Hispanic
Asian
Others
0.004 (0.028)
–
0.022 (0.020)
0.001 (0.017)
-0.011 (0.023)
0.008 (0.026)
–
-0.001 (0.021)
-0.010 (0.018)
0.002 (0.020)
0.011 (0.024)
–
0.027 (0.021)
-0.001 (0.016)
0.023 (0.019)
Practice location
Office
Hospital (non-ED)
–
0.020 (0.016)
–
0.026* (0.015)
–
0.026* (0.014)
Provider specialty
General practitionera
Internal medicine
NP/PA
Other
–
0.010 (0.013)
-0.014 (0.029)
-0.006 (0.019)
–
0.004 (0.013)
-0.007 (0.025)
-0.002 (0.018)
–
-0.009 (0.011)
0.014 (0.020)
0.026* (0.015)
Constant 0.799** (0.034) 0.163** (0.037) 0.125** (0.028)
Notes: Coefficients and standard errors (in parentheses) were obtained using Stata’s svy:regression command. ED = emergency department; NP = nurse practitioner; PA = physician assistant. aReference group. *p < .10. **p < .01. ***p < .05