Embed Size (px)
Citation preview

HEALTH INSURANCE COVERAGEIN RURAL AMERICA
CHARTBOOK
September 20031330 G Street, NWWashington,DC 20005
(202) 347-5270 Fax: (202) 347-5274www.kff.org/kcmu
A d d i t i o n a l c o p i e s o f t h i s p u b l i c a t i o n ( # 4 0 9 3 ) a r e a v a i l a b l e o n t h e
K a i s e r F a m i l y F o u n d a t i o n ’ s w e b s i t e a t w w w. k f f . o r g .
p / / g

The Kaiser Commission on Medicaid and the Uninsured serves as a policy institute and forum for analyzinghealth care coverage and access for the low-income population and assessing options for reform. TheCommission, begun in 1991, strives to bring increased public awareness and expanded analytic effort to thepolicy debate over health coverage and access, with a special focus on Medicaid and the uninsured. TheCommission is a major initiative of The Henry J. Kaiser Family Foundation and is based at the Foundation’sWashington, DC office.
The Edmund S. Muskie School of Public Service at the University of Southern Maine educates leaders inpublic policy, health policy, and community planning and development. The School’s Institute for Health Policyconducts nationally recognized health services research and policy analysis that informs state and nationalhealth policy development. The Institute’s research and policy agenda spans a wide range of topics related tothe structure, financing and delivery of health services. More information on the Muskie School is available atwww.muskie.usm.maine.edu.
The Henry J. Kaiser Family Foundation is an independent, national health philanthropy dedicated toproviding information and analysis on health issues to policymakers, the media, and the generalpublic. The Foundation is not associated with Kaiser Permanente or Kaiser Industries.
p / / g

Health Insurance Coverage In
Rural America
September 2003
Institute for Health Policy
Muskie School of Public Service University of Southern Maine
with
The Kaiser Commission on Medicaid and the Uninsured

Authors: Institute for Health Policy, Muskie School of Public Service, University of Southern Maine
Erika C. Ziller, MS Andrew F. Coburn, PhD Stephenie L. Loux, MS Kaiser Commission on Medicaid and the Uninsured Catherine Hoffman, ScD Saint Louis University Timothy D. McBride, PhD
Acknowledgments: In addition to the primary funding provided by the Kaiser Commission on Medicaid and the Uninsured, we wish to thank the Rural Policy Research Institute at the University of Missouri-Columbia for their funding support. We want to also thank the Rural Policy Research Institute’s Health Panel who reviewed this chart book. William Carroll and Ray Kuntz from the Agency for Healthcare Research and Quality’s Data Center provided invaluable assistance. Special thanks go to Commission staff Brandi Simmons and Alan Schlobohm for their assistance in producing the chartbook.

Preface
Among the 41 million uninsured in the United States, nearly one in five live in rural communities. Rural concerns have become central to national and state health policy, yet our understanding of the wide variation in both health insurance coverage and access to health care services across rural communities is remarkably limited. Much of what is known about health insurance coverage comes from national surveys that only allow us to describe the experience of the rural population in total — 52 million Americans. However, people living in rural communities are widely diverse, not just in their geographic differences, but in their social, economic, and health status as well. The Kaiser Commission on Medicaid and the Uninsured wanted to better understand the root causes of the health insurance disparities faced by rural residents, as well as underscore the fact that not all rural residents face the same risk of being uninsured. Because rural residents tend to have lower incomes and are less healthy, the Medicaid program plays an even larger role as the insurance safety net in rural America than it does in urban America. More Americans today than ever before manage health problems without the financial security of health insurance. As policy makers debate health financing reforms in the current economic environment, it will be important to bear in mind the factors that make rural Americans particularly at risk of losing health coverage and in turn, more likely to be in need of publicly funded programs.
James R. Tallon Diane Rowland, ScD Chairman Executive Director


Table of Contents
Overview: Key Findings and Policy Implications ........................................................1 Background Facts about Rural America .......................................................................4 Endnotes ……………………………………………………………………………………………………………………………..8 Section I: Health Insurance Coverage in Rural America..............................................11 Figure 1: Sources of Health Insurance Coverage Among the Nonelderly (Ages 0-64) by Residence, .......................... 12 December 1998 Figure 2: Sources of Health Insurance Coverage Among Children (Ages 0-17) by Residence, December 1998 .......... 13 Figure 3: Sources of Health Insurance Coverage Among Adults (Ages 18-64) by Residence, December 1998 ........... 14 Figure 4: Trend: Percent of Rural Nonelderly Population Uninsured, December 1996-1998 ........................................ 15 Figure 5: Trend: Percent of Rural Nonelderly Population with Private Coverage, December 1996-1998 ..................... 16 Figure 6: Trend: Percent of Rural Nonelderly Population with Medicaid/Other Coverage, December 1996-1998 ........ 17 Figure 7: Trend: Percent of Nonelderly Population Uninsured All Year, 1996-1998...................................................... 18 Section II: Profile of the Rural vs. Urban Uninsured ....................................................19 Figure 8: Percent Uninsured by Family Income and Residence (Ages 0-64), 1998...................................................... 20 Figure 9: Family Income of the Uninsured and Total Population, by Residence (Ages 0-64), 1998 ............................. 21 Figure 10: Percent Uninsured by Family Employment and Residence (Ages 0-64), 1998.............................................. 22 Figure 11: Family Employment of the Uninsured by Residence (Ages 0-64), 1998 ........................................................ 23 Figure 12: Percent Uninsured by Age and Residence, 1998 .......................................................................................... 24 Figure 13: Age Distribution of the Uninsured and Total Population by Residence, 1998 ............................................... 25 Figure 14: Percent Uninsured by Marital Status and Residence (Ages 16-64), 1998 ..................................................... 26 Figure 15: Marital Status of the Uninsured and Total Population, by Residence (Ages 16-64), 1998............................. 27 Figure 16: Percent Uninsured by Education and Residence (Adults aged 18-64), 1998................................................. 28 Figure 17: Education of the Uninsured and Total Population, by Residence (Adults aged 18-64), 1998 ........................ 29 Figure 18: Percent Uninsured by Minority Status and Residence (Ages 0-64), 1998 ..................................................... 30 Figure 19: Minority Status of the Uninsured and Total Population by Residence (Ages 0-64), 1998 .............................. 31 Figure 20: Percent Uninsured by Health Status and Residence (Ages 0-64), 1998........................................................ 32 Figure 21: Health Status of the Uninsured and Total Population by Residence (Ages 0-64), 1998 ................................ 33 Section III: Employment and Health Insurance in Rural America ...............................35 Figure 22: Percent of Adults Uninsured, by Employment Status and Residence, 1998.................................................. 36 Figure 23: Employer-Sponsored Health Insurance among Workers: Offer, Enrollment, and Coverage, 1998............... 37 Figure 24: Percent Uninsured Among Self-Employed Workers by Residence, 1998...................................................... 38 Figure 25: Self-Employment Among Uninsured Workers and Total Working Population by Residence, 1998 ............... 39 Figure 26: Percent of Workers Whose Employer Offers Health Insurance, by Employment Status and Residence, 1998 ........................................................................................................................ 40 Figure 27: Percent of Workers Uninsured by Employment Status and Residence, 1998................................................ 41 Figure 28: Percent of Workers Whose Employer Offers Health Insurance by Firm Size and Residence, 1998.............. 42 Figure 29: Percent of Workers Uninsured by Firm Size and Residence, 1998 ............................................................... 43

Figure 30: Firm Size Among Uninsured Workers and Total Working Population by Residence, 1998............................ 43 Figure 31: Percent of Workers Whose Employer Offers Health Insurance by Hourly Wage and Residence, 1998 ........ 44 Figure 32: Percent of Workers Uninsured by Wages and Residence, 1998 ................................................................... 45 Figure 33: Wages of Uninsured Workers and Total Working Population by Residence, 1998........................................ 45 Figure 34: Share of Workers Offered Employer-Based Coverage by Industry and Residence, 1998 ............................. 46 Figure 35: Percent Uninsured by Industry and Residence, 1998 .................................................................................... 47 Figure 36: Share of Workers Offered Employer-Based Coverage by Occupation and Residence, 1998........................ 48 Figure 37: Percent Uninsured by Occupation and Residence, 1998............................................................................... 49 Section IV: Policy Considerations for Covering the Rural Uninsured ........................51 Section V: Data Tables...................................................................................................55 Table 1: Health Insurance Coverage of the Nonelderly by Residence, 1996-1998....................................................... 56 Table 2: Health Insurance Coverage of Children by Residence, 1996-1998................................................................. 57 Table 3: Health Insurance Coverage of Nonelderly Adults by Residence, 1996-1998.................................................. 58 Table 4: Characteristics of the Nonelderly Uninsured in Rural, Non-Adjacent Counties, 1998 ..................................... 59 Table 5: Characteristics of the Nonelderly Uninsured in Rural, Adjacent Counties, 1998 ............................................. 60 Table 6: Characteristics of the Nonelderly Uninsured in Urban Counties, 1998............................................................ 61 Table 7: Full-Year and Part-Year Uninsured Rates Among the Nonelderly by Residence, 1996-1998......................... 62 Table 8: Full-Year and Part-Year Uninsured Rates Among Children by Residence, 1996-1998................................... 63 Table 9: Full-Year and Part-Year Uninsured Rates Among Nonelderly Adults by Residence, 1996-1998.................... 64 Table 10: Characteristics (Hours, Wages, and Firm Size) of All Workers and Uninsured Workers, by Three................. 65 County Levels, 1998 Table 11: Characteristics (Industry and Occupation) of All Workers and Uninsured Workers, Rural vs. Urban, 1998.... 66 Table 12: Access to Employer-Sponsored Insurance Among Workers (excluding self-employed) by Hours,................. 67
Wages and Firm Size—Three County Levels, 1998 Table 13: Access to Employer-Sponsored Insurance Among Workers (excluding self-employed) by Industry and........ 68 Occupation—Rural vs. Urban, 1998 Table Endnotes................................................................................................................................................................ 69 ____________________________________________ Methods Appendix ..........................................................................................................71
Data Sources..................................................................................................................................................... 71 Defining Rural.................................................................................................................................................... 72 Challenges of Rural Health Research................................................................................................................ 72
Overview: Key Findings and Policy Implications
One in five Americans lives in rural America. Compared to those who live in urban communities, rural residents are generally poorer, older, and less healthyall factors that pertain directly to the adequacy of health insurance coverage and access to health care. Rural communities are however widely diverse in their geographic, demographic, social, and economic structures. The health and economic status of people living in remote rural counties differ substantially from rural residents who live closer to large urban areas. Studies that examine rural America as a whole ignore this diversity and provide only limited insight into the differences that exist, including health insurance disparities. Among the 41 million uninsured in the United States, nearly twenty percent live in rural areas, but not all rural residents face the same risk of being uninsured. This chartbook presents an analysis of the most recent national data on health insurance coverage based on a county’s proximity to a large urban area—an important factor discriminating rural residents’ access to economic opportunities and health care services. In the first section of this chartbook we address the questions of whether and by how much health insurance coverage and sources of health coverage differ among people living in rural vs. urban communities. Trends in health coverage are also explored. Sections II and III examine differences in the socio-economic and employment characteristics of those living in two groups of rural counties vs. all urban counties. The final section discusses the policy implications of these findings. Key Findings:
Not all rural residents face the same risk of being uninsured. There are wide gaps in health coverage between rural residents who live in counties adjacent vs. not adjacent to an urban county.
Nearly a quarter of residents in rural, non-adjacent counties (24%) are uninsured.
Although they are 50% more likely to have Medicaid coverage than residents in urban counties, it is not enough to compensate for their lower private coverage.
Medicaid and the State Children’s Health Insurance Program (S-CHIP) are extremely
important sources of coverage for rural, non-adjacent communities, particularly for children. In 1998 30% of children in rural, non-adjacent areas had Medicaid or S-CHIP coverage compared to 19% of children in urban areas or other rural communities.
1

Almost two-thirds of the uninsured in rural, non-adjacent counties come from families with low incomes, i.e., less than twice the poverty level. Compared to the urban uninsured, more of the uninsured from these rural counties have low incomesreflecting the fact that almost half of the rural, non-adjacent population comes from a low-income family.
Rural, non-adjacent residents are more likely to be uninsured all of the year compared to
urban residents.
While health coverage began to improve slightly with the booming economy during the period we studied (1996-1998), the higher uninsured rates among people living in rural, non-adjacent counties did not change as uninsured rates declined in other areas of the country.
Residents of rural, non-adjacent counties have the lowest rate of private health insurance,
largely because they are less likely to be offered health benefits through their jobs.
Workers in rural, non-adjacent counties are far more likely to be earning low wages (<$7/hr) compared to urban workers (33% vs. 19%) and more likely to work in small businesses with fewer than 20 employees—two factors that markedly increase their chances of being uninsured.
Low-wage workers make up 60% of all uninsured workers in rural, non-adjacent counties
compared to 40% of uninsured workers in urban areas. Over two-thirds of uninsured workers in these same rural counties are employed by small businesses.
Families with two full-time workers are at higher risk of being uninsured if they live in a
rural, non-adjacent area, where job-based health benefits are less available and incomes lower. Self-employed persons living in rural counties are far more likely to be uninsured than those living in urban counties.
Policy Implications Because of these differences, the following points should be considered in structuring policies designed to expand health insurance coverage to more Americans living in rural communities.
A strategy that may be effective in reducing the uninsured rate among residents of rural communities in close proximity to urban areas may not meet the needs of those in more remote areas, where more workers earn low wages and work for small employers, and more families are poor.
2

Efforts to increase enrollment in private health insurance, either through employer or
individual plans, would require generous subsidies—either to small employers or individuals—in order to reach rural, non-adjacent residents. Given limited monthly disposable incomes, personal tax credits would need to be made available to low-income families before vs. after health insurance is purchased.
Because Medicaid coverage is currently a larger source of coverage for rural, non-adjacent
residents compared to urban residents, expanding on this base could be a particularly effective way to increase coverage among the rural uninsured.
In the current economic environment, it is important to bear in mind that rural residents
may suffer the most when Medicaid and S-CHIP programs are diminished by states’ budget constraints.
Whether public programs are expanded or tax credits are used to expand private
employer-based or individual insurance, substantial assistance with the costs of premiums will be needed to keep the option affordable for low-income families. Benefits, co-payments, deductibles, and other cost-sharing requirements of any expansion strategy will be equally critical to improving access to health services for low-income people.
Strategies to expand coverage need to be designed to help those who have been
uninsured for long periods vs. those with only temporary gaps without insurance. Rural residents living in counties not adjacent to an urban area are most likely to be uninsured for long periods of time. These strategies would be in contrast with past federal reforms, such as COBRA or HIPAA, which were designed to provide transitional insurance coverage.
3

Background Facts about Rural America No single portrait can accurately capture today’s rural America. Rural counties are widely diverse not only in their geography, but in their populations, industries, and their economies. Despite these variations, rural counties as a whole are substantially different from all of urban America in ways that pertain directly to the adequacy of health insurance coverage and access to health care. Significant urban-rural differences include: Fact #1: Rural Americans have lower incomes than their urban counterparts.
The median income of rural residents was approximately $32,000, nearly $12,000 less per year than urban residents in 2001.1
Rural families are also more likely to have incomes below the federal poverty level
compared to urban families (16% vs. 13% of families).2
Despite growth in average rural wages in the period 1996-2000, the share of rural workers earning low wages (those working on a full-time, full-year basis and still earning less than the federal poverty level for a family of four) continues to be substantially higher than in urban areas27% vs. 19% among workers over age 24.3
Residents of rural America tend to be less educated than urban residents, a mediating
factor in lower rural incomes. In 1998, 20% of rural adults over the age of 24 were not high school graduates compared to 15% of urban adults. Less than 16% of rural adults held a bachelor’s degree or higher while 28% of urban adults were college graduates.4
Fact #2: While racial and ethnic minorities comprise only seventeen percent of the rural population they are more economically disadvantaged than minorities in urban areas.
17% of rural Americans belong to a racial or ethnic minority, compared to 49% in urban central cities and 23% of urban areas outside of central cities.5
Racial and ethnic minorities in rural counties are three times as likely to live in poverty
compared to whites in rural America6 and their chances of being employed are only half as great.
Rural black Americans face the greatest economic disadvantage. The median household
income for rural black households is about 40% less than that of rural white households, and 60% less than the median income for suburban white households.7
Although rural Hispanics tend to fair better economically than rural Blacks, they earn 30
percent less than both rural Whites and suburban Hispanics; and earn nearly 50 percent less than suburban Whites.8
4

Fact #3: Rural Americans tend to be somewhat older than urban residents.
In 1998, the median age of rural Americans was two years older than that of urban
residents (36 vs. 34 years old).9 Rural residents are more likely to be elderly than urban residents with 15% compared to
13% of their populations being 65 years or older.10 Given their greater health care needs, this higher concentration of older residents has important implications for health insurance costs and the kinds of acute and long-term care services necessary in rural health care systems.
Fact #4: On average, rural residents tend to be in poorer health and are less likely to access preventive services than urban residents.
Rural residents are more likely to report themselves to be in fair or poor health than urban residents are (11% versus 8%).11
Rural residents are more likely to have certain types of chronic conditions, such as
diabetes.12
Infant mortality rates are somewhat higher in rural counties. Post-neonatal death rates, (deaths between the 28th and 364th day of life) are 3.5 per 1,000 in rural areas compared to 3.1 in urban areas.13
Rural residents are also more likely to die from heart disease, particularly in the South
where the death rate from heart disease is almost 20% higher in rural areas compared to suburban areas.14
Rural residents are also less likely to receive recommended preventive care services.
Rural women are less likely to get a mammogram and pap smear, and all rural residents are less likely to get a colon cancer screening than urban residents.15
Studies suggest that rural residents’ poor access to preventive care may be a function of
their poor access to physician care in general.16
5

Fact #5: The economic health of rural America is fragile with a declining population and employment losses in key industries.
Economic vitality depends on population growth. Between 1990 and 2000, the population growth in rural areas lagged behind that of urban areas by approximately 40% (10% vs. 14% growth).17
Unemployment rates tend to be higher in rural areas. Between 1996 and 2001, job growth
in rural areas lagged even further behind urban job growth. Rural employment grew less than 5% between 1995 and 2001, while urban employment grew 11%.18
Fact #6: Small businesses are the bedrock of the rural economywhere health benefits are much less likely to be offered.
Approximately three-fourths of all rural firms in 1998 (over a million firms) had fewer than 20 employees.19
At least 40% of all rural workers are employed by small businesses with fewer than 20
employees. Small businesses in rural areas are more likely to be in the service sector, compared to
those in urban areas where there are more professional firms. Consequently, workers in urban small businesses earn wages that are as much as 50% higher than those in rural small businesses.20
Fact #7: The nature of employment is changing in ways that further disadvantage rural America’s income base and health insurance coverage.
Consumer services including retail stores, food service establishments, health, education, and personal serviceswith typically lower-paying jobshave grown to become the largest segment of the rural economy in terms of annual earnings, increasing from 20% to 23% of total rural earnings between 1989 and 1999.21
The manufacturing sectorwith higher wages and better health benefits typicallyalso
contributes significantly to the rural economy, accounting for 21% of total rural earnings in 1999.22 However, it has not grown as fast as urban manufacturing. While high-tech production accounted for 41% of the recent increases in urban manufacturing earnings, rural manufacturing earnings increased only 14% from high-tech production. If this pattern continues, the economic growth of rural communities may be further disadvantaged.23
6

Fact #8: Rural America is likely to face a disproportionate number of challenges in the current economic environment.
In times of economic slowdown, rural labor markets are often the first to feel the effect.24 The economic downturn in 2000 and 2001 was led by declines in the manufacturing sector, an important component of the rural economy, which may account for some of the disproportionate loss of jobs in rural areas since 2000.25
In many rural areas, the rate of job growth has not only slowed, but has declined. In March
2001, job growth in rural manufacturing dropped four percent from the previous year. By October 2001, the decline had extended to other industries, including construction and mining and wholesale and retail trade.26
Farm incomes slumped in 2000 because of lower demand for food and despite some
recovery in 2001 (in part because of emergency federal payments to farmers) the outlook for farm products remains unclear.27
Fact #9: The rural health care system is vulnerable because of its health professional shortages, small volume hospitals, and disproportionate reliance on public reimbursement levelskey factors affecting the availability and quality of rural health care services.
Rural communities face challenges maintaining an adequate supply of physicians, nurses, and other health professionals. Although 20% of the U.S. population lives in rural America, only nine percent of physicians practice there.28
Although rural and urban communities have nearly equal numbers of family practice and
general practitioners (28.1/100,000 population vs. 26.1/100,000 population, respectively), rural areas have significantly fewer specialists compared to urban areas. Rural communities have nearly 25 fewer general internists, 12 fewer pediatricians and obstetricians/gynecologists, and 7 fewer general surgeons per 100,000 residents than urban communities. The problem is even greater for other specialties, with rural areas having only 40 other specialists per 100,000 population compared to 134 per 100,000 in urban areas.29
The supply of dentists in rural areas is particularly lowless than half the supply of
dentists available in urban areas (29 vs. 63/100,000 people).30
Rural hospitals are more dependent on the lower payment levels of the Medicare and Medicaid programs. Nearly half of all rural hospital discharges are paid for by Medicare, compared to just over a third of urban hospital discharges.31
Rural hospitals often have financial difficulties because of lower patient volumes, operating
at roughly 55% occupancy compared to urban hospitals with 63% occupancy.32
7

8
1 Economic Research Service, Rural Development Research Report No. 90. 2 Ricketts, et. al., 1999. Populations and places in rural America. In T.C. Ricketts (Ed.),
Rural health in the United States (pp. 7-24). New York: Oxford University Press. 3 Gibbs, R. (2001). Rural labor and education: Rural low-wage employment [Online]
Available: http://www.ers.usda.gov/briefing/LaborAndEducation/lwemployment/. 4 Gibbs, R. (2001). Rural labor and education: Rural education. [Online] Available:
http://www.ers.usda.gov/briefing/LaborAndEducation/ruraleducation/. 5 United States Census Bureau, Current Population Survey, March 2000, Ethnic and
Hispanic Statistics Branch, Population Division. Release Date 3/6/2001. 6 Cromartie, J. (2000). Rural population and migration: Race and ethnicity in rural areas.
[Online] Available: http://www.ers.usda.gov/Briefing/Population/race/. 7 McLaughlin, D. K. (2002). Income inequality in America: Non-metro income levels
lower than metro, but income inequality did not increase as fast. Rural America, 17(2), 14-20.
8 Ibid., 2002. 9 Rogers, C. C. (2000). Changes in the older population and implications for rural areas.
(Economic Research Service, Rural Development Research Report No. 90). 10 Ibid., 2000.
11 National Center for Health Statistics. Health, United States, 2001 with Urban and
Rural Chartbook. Hyattsville, Maryland: 2001. 12 Ibid., 2001. 13 Lishner, D. M., Larson, E. H., Rosenblatt, R. A., & Clark, S. J. (1999). Rural maternal
and perinatal health. In T.C. Ricketts (Ed.), Rural health in the United States (pp. 134-149). New York: Oxford University Press. 14 National Center for Health Statistics, 2001. 15 Casey, M. M., Call, K. T., & Klinger, J. M. (2001). Are rural residents less likely to
obtain recommended preventive healthcare services? American Journal of Preventive Medicine, 21(3), 182-188; and Zhang, P., Tao, G., & Irwin, K. L. (2000). Utilization of preventive medical services in the United States: A comparison between rural and urban populations. The Journal of Rural Health, 16, 349-356.
16 Pol, L. G., Rouse, J., Zyanski, S., Rasmussen, D., & Crabtree, B. (2001). Rural, urban
and suburban comparisons of preventive services in family practice clinics. The Journal of Rural Health, 17, 114-121.

17 Perry, M. J., & Mackun, P. J. (2001). Population change and distribution. (United
States Census Bureau Publication No. C2KBR/01-2). 18 Kusmin, L. Rural labor and education: Rural employment and unemployment. [Online]
Available: http://www.ers.usda.gov/briefing/laborandeducation/employunemploy/ 19 McDaniel, K. (2001). Small Business in Rural America. From the series: The Main
Street Economist: Commentary on the Rural Economy. Kansas City, MO: Center for the Study of Rural America, Federal Reserve Bank of Kansas City.
20 Ibid., 2001. 21 McGranahan, D. & Gale, F. Rural industry: Is rural America being left behind in the
new economy? [Online] Available: http://www.ers.usda.gov/briefing/Industry/neweconomy/.
22 McGranahan, D. & Gale, F. Rural industry: Which industries are the most important in
rural America? [Online] Available: http://www.ers.usda.gov/Briefing/Industry/importantindust/.
23 Gale, F. & McGranahan, D. (2001). Non-metro areas fall behind in the new economy.
Rural America, 16(1), 44-51. 24 Hamrick, K.S. (1997). Rural labor markets often lead urban markets in recessions and
expansions. Rural Development Perspectives, 12(3), 11-17. 25 Torgerson, D. A. & Hamrick, K. S. (2002). U. S. economy in recovery, although rural
areas still affected by recession. Rural America, 17(1), 34-39. 26 Henderson, J.R. (2002). Will the rural economy rebound with the rest of the nation?
Kansas City, MO: Center for the Study of Rural America, Federal Reserve Bank of Kansas City.
27 Ibid., 2002. 28 Rosenblatt, R. A. & Hart, L. G. (1999). Physicians and rural America. In T.C. Ricketts
(Ed.), Rural health in the United States (pp. 38-51). New York: Oxford University Press.
29 Ibid.,1999. 30 National Center for Health Statistics (2001). Health, United States, 2001with Urban
and Rural Chartbook. Hyattsville, Maryland: 2001. 31 Ricketts, T.C. & Heaphy, P. E. (1999). Hospitals in Rural America. In T.C. Ricketts
(Ed.), Rural health in the United States (pp. 101-112). New York: Oxford University Press.
32 Ibid., 1999.
9

Section I: Health Insurance Coverage in Rural America
Capturing the diversity across rural America has not been easy with currently available national data sources. Studies that have not attempted to divide rural counties in a meaningful way have provided mixed findings about whether health coverage differs between rural and urban America. However, by separating rural counties into even just two groups (those that are or are not adjacent to a county containing a large city), differences become apparent.
Not all rural residents face the same risk of being uninsured. There are wide gaps in coverage between rural residents who live in counties adjacent vs. not adjacent to an urban county.
Nearly a quarter of residents in rural, non-adjacent counties are uninsured. Although they
are 50% more likely to have Medicaid coverage, it is not enough to compensate for their lower private coverage.
Less than half of children living in rural, non-adjacent counties have private coverage; 30%
are covered by Medicaid and still one in five have no health insurance.
Because Medicaid is not the same safety net for adults that it is for children, 25% of adults living in rural, non-adjacent areas are uninsured.
Health coverage in the late 1990s began to improve slightly with the booming economy,
however, the higher uninsured rates among people living in rural, non-adjacent counties did not change between 1996 and 1998 as uninsured rates declined in other areas of the country.
Rural residents are also uninsured for longer periods of time than urban residents. The
chances of being uninsured for an entire year are a third greater among residents from rural, non-adjacent counties compared to urban residents.
11
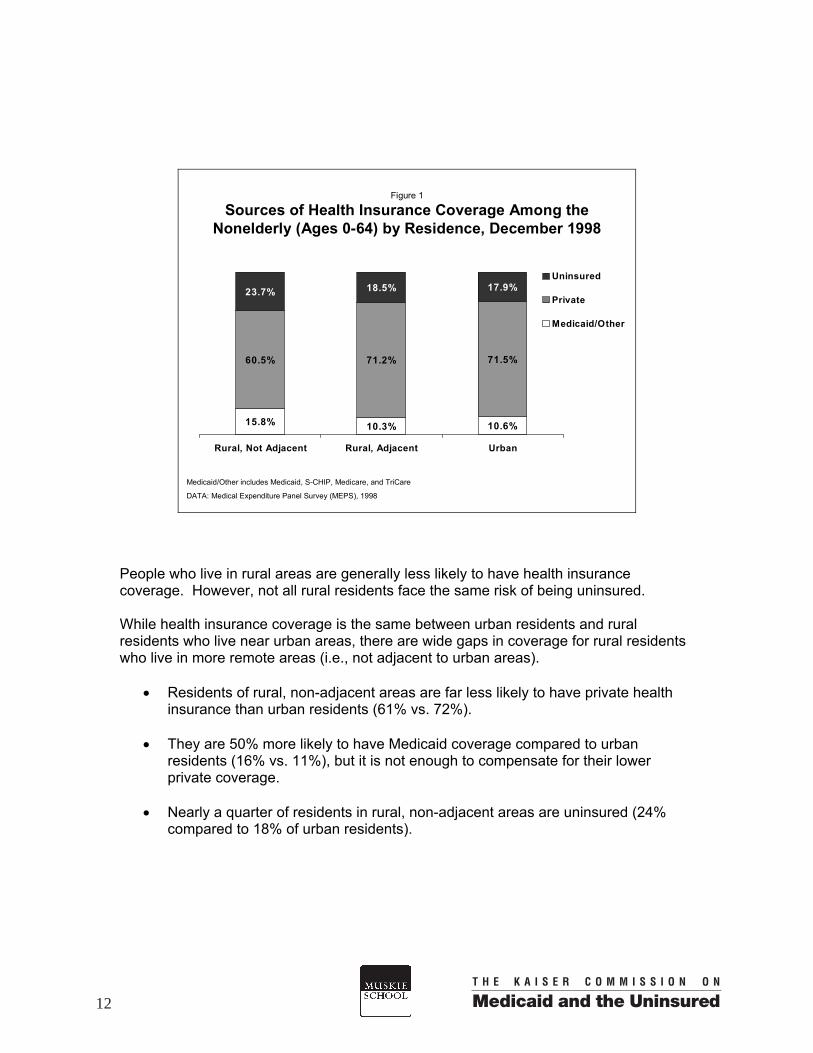
Figure 1
Sources of Health Insurance Coverage Among the Nonelderly (Ages 0-64) by Residence, December 1998
15.8% 10.3% 10.6%
60.5% 71.2% 71.5%
17.9%18.5%23.7%
Rural, Not Adjacent Rural, Adjacent Urban
Uninsured
Private
Medicaid/Other
Medicaid/Other includes Medicaid, S-CHIP, Medicare, and TriCare
DATA: Medical Expenditure Panel Survey (MEPS), 1998
People who live in rural areas are generally less likely to have health insurance coverage. However, not all rural residents face the same risk of being uninsured. While health insurance coverage is the same between urban residents and rural residents who live near urban areas, there are wide gaps in coverage for rural residents who live in more remote areas (i.e., not adjacent to urban areas).
• Residents of rural, non-adjacent areas are far less likely to have private health
insurance than urban residents (61% vs. 72%).
• They are 50% more likely to have Medicaid coverage compared to urban residents (16% vs. 11%), but it is not enough to compensate for their lower private coverage.
• Nearly a quarter of residents in rural, non-adjacent areas are uninsured (24%
compared to 18% of urban residents).
12

Figure 2
Sources of Health Insurance Coverage Among Children (Ages 0-17) by Residence, December 1998
27.3%16.8% 18.6%
52.1% 67.4% 66.9%
20.6% 15.8% 14.5%
Rural, Not Adjacent Rural, Adjacent Urban
Uninsured
Private
Medicaid/Other
Medicaid/Other includes Medicaid, S-CHIP, Medicare,and TriCare
DATA: Medical Expenditure Panel Survey (MEPS), 1998
Medicaid fills the gap in private health insurance particularly for children from more rural areas.
• About half of children who live in rural, non-adjacent areas have private health
insurance and 27% are covered by Medicaid. In contrast, 2/3 of children living in urban and rural adjacent areas have private health insurance and just under 20% have Medicaid coverage.
• Children living in rural, non-adjacent areas have the highest uninsured rates.
One in five children living in rural counties not adjacent to urban areas has no health insurance.
13
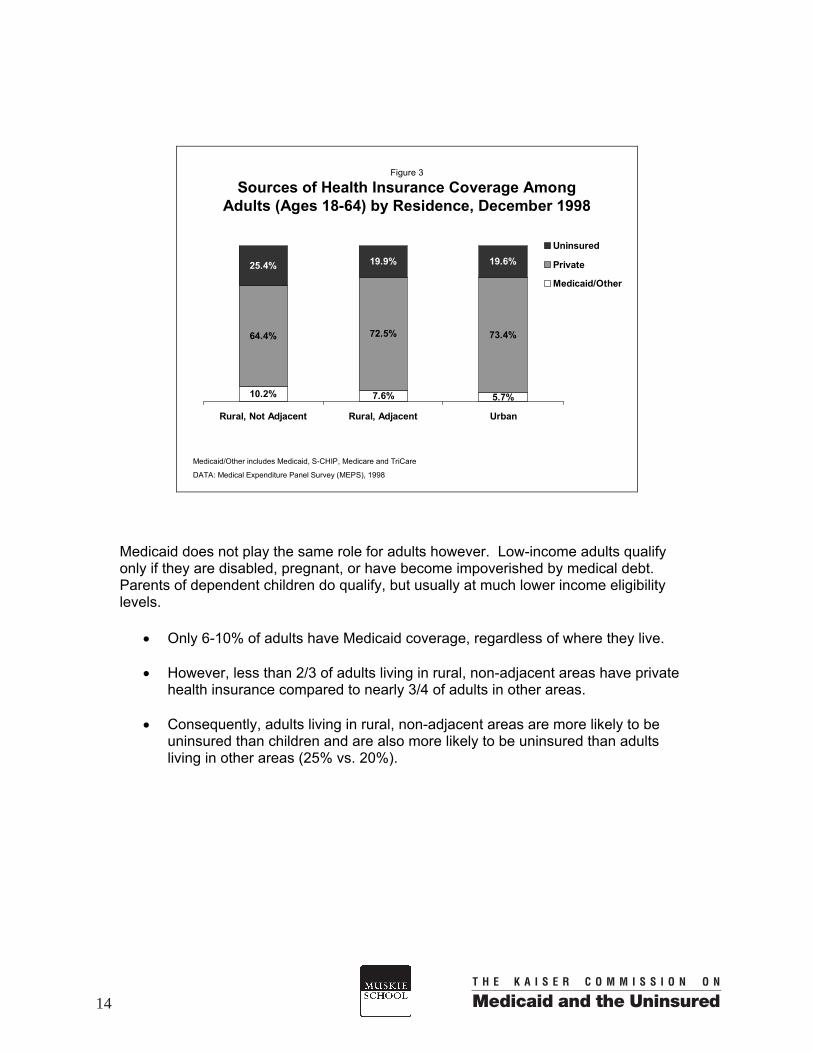
Figure 3
Sources of Health Insurance Coverage Among Adults (Ages 18-64) by Residence, December 1998
64.4% 72.5% 73.4%
19.9% 19.6%
10.2% 5.7%7.6%
25.4%
Rural, Not Adjacent Rural, Adjacent Urban
Uninsured
Private
Medicaid/Other
Medicaid/Other includes Medicaid, S-CHIP, Medicare and TriCare
DATA: Medical Expenditure Panel Survey (MEPS), 1998
Medicaid does not play the same role for adults however. Low-income adults qualify only if they are disabled, pregnant, or have become impoverished by medical debt. Parents of dependent children do qualify, but usually at much lower income eligibility levels.
• Only 6-10% of adults have Medicaid coverage, regardless of where they live. • However, less than 2/3 of adults living in rural, non-adjacent areas have private
health insurance compared to nearly 3/4 of adults in other areas.
• Consequently, adults living in rural, non-adjacent areas are more likely to be uninsured than children and are also more likely to be uninsured than adults living in other areas (25% vs. 20%).
14

Despite the rapid growth in the nation’s economy between 1996 and 1998, health insurance coverage was still lagging. By 2000, the number and proportion of Americans who were uninsured began to decrease somewhat, however by 2001 the economic downturn reversed the trend and the number of uninsured once again climbed. While newer estimates are not available to trend rural differences beyond 1998, the period 1996-1998 is useful to understanding how changes in health coverage can vary across urban and different rural areas of America.
• For those living in urban areas, uninsured rates were beginning to decline
somewhat between 1996 and 1998 as private health insurance began to increase slightly.
• A similar, but more substantial trend occurred for rural residents living near urban
areas—with uninsured rates falling significantly from 26% to 19%. • Uninsured rates for rural, non-adjacent areas did not change between 1996 and
1998, remaining high at about 24% over the three years.
• The differences in trends across the three areas were the same for children and adults.
Figure 4
Trend: Percent of Nonelderly Population Uninsured, December 1996-1998
23.5%
19.3%
25.5%23.9%
21.7%18.7% 17.9%
23.7%
18.5%
Rural, Not Adjacent Rural, Adjacent Urban
1996 1997 1998
DATA: Medical Expenditure Panel Survey (MEPS), 1996-1998
15

Figure 5
Trend: Percent of Rural Nonelderly Population with Private Coverage, December 1996-1998
61.8%70.5%
64.6%61.3%67.8% 70.9% 71.5%
60.5%
71.2%
Rural, Not Adjacent Rural, Adjacent Urban
1996 1997 1998
DATA: Medical Expenditure Panel Survey (MEPS), 1996-1998
Gains in private health insurance, fueled by the strong economy, were strongest in rural counties adjacent to urban areas. Private health insurance coverage was just gradually beginning to increase in urban areas between 1996 and 1998, but the change was not significant.
• Private health insurance rates did not change for the rural population living in rural,
non-adjacent areas. • Private coverage trends across the three areas did not vary between children and
adults.
16

Figure 6
Trend: Percent of Rural Nonelderly Population with Medicaid/Other Coverage, December 1996-1998
9.9% 10.3%
14.7%
10.5%10.5%
14.9%
10.3%
15.8%
10.6%
Rural, Not Adjacent Rural, Adjacent Urban
1996 1997 1998
Medicaid/Other includes Medicaid, S-CHIP, Medicare, and TriCare
DATA: Medical Expenditure Panel Survey (MEPS), 1996-1998 • The impact of new Medicaid/S-CHIP expansions for children enacted in 1996 was
not yet appreciable by December 1998 in any type of county, even in rural, non-adjacent counties where the population is poorer.
• Medicaid coverage rates did not change between 1996 and 1998 in any of the three
areas—for either children or adults.
17

Figure 7
Trend: Percent of Nonelderly Population Uninsured All Year, 1996-1998
18.5% 18.6%
13.6%
19.8%
15.8%14.3%
20.4%
14.7% 13.6%
Rural Not Adjacent Rural Adjacent Urban
1996 1997 1998
DATA: Medical Expenditure Panel Survey (MEPS), 1996-1998
A large share of the uninsured go without health insurance for long stretches of time. Differences in the proportion of people who are not temporarily uninsured—rather have been uninsured for at least a full year—exist between rural and urban counties.
• In 1998, the chances of being uninsured for the entire year were a third greater among residents in rural, non-adjacent areas (20%) compared to those living in urban (14%) or rural adjacent areas (15%).
• Between 1996 and 1998, the likelihood of being uninsured all year actually
increased slightly for rural, non-adjacent residents, while chances decreased for rural adjacent residents and stayed the same for urban residents. The number of rural, non-adjacent residents who had been uninsured for an entire year rose from 3.9 to 4.5 million, while among rural adjacent residents the decline was from 4.4 to 3.3 million.
18

Section II: Profile of the Rural vs. Urban Uninsured Economic and social factors explain some of the health insurance disparities between rural and urban America. Rural residents are poorer, have less formal education, and are generally in poorer health—all risk factors for being uninsured. At the same time, rural families are more likely to be white, non-Hispanics and to have two adults living in a household which generally lower a family’s risk of being uninsured. Among the uninsured in rural, non-adjacent counties:
79% come from families where there is at least one full-time worker;
almost 2/3 come from low-income families (less than 200% of the federal poverty level)
compared to half of the urban uninsured—because almost half of the population in rural, non-adjacent counties are low-income families;
30% are children;
a larger majority are white, non-Hispanics, in part reflecting the higher concentration of
whites in rural America (83% vs. 67% in urban counties); and self-reported health status is generally poorer than for the urban uninsured.
No matter where one lives, low-income people (<200% of the federal poverty level) are at
least twice as likely to be uninsured as those from families with higher incomes. Nearly half of rural, non-adjacent residents live in low-income families which explains a large part of the higher uninsured rates in these areas.
Uninsured rates among children and middle-aged adults (age 35-64) in rural, non-adjacent
counties are over 40% higher compared to their age groups in urban counties. Families with two full-time workers are at higher risk of being uninsured if they live in a
rural, non-adjacent area—where job-based health benefits are less available and incomes are lower.
Among urban residents, the uninsured rate increases as health status declines. However
for rural, non-adjacent residents, the chances of being uninsured are highest among those in good health. Those in fair or poor health who may also be disabled are more likely to qualify for Medicaid given lower family incomes in rural, non-adjacent areas.
Married couples are more likely to be uninsured if they live in rural America.
19

Figure 8
Percent Uninsured by Family Income and Residence (Ages 0–64), 1998
16.1%
31.6%32.4%35.4%
29.3%
12.6%12.3%
32.3% 32.2%
< 100% of FPL* 100 - 199% of FPL* 200% or more of FPL*
Rural, Not Adjacent Rural, Adjacent Urban
DATA: Medical Expenditure Panel Survey (MEPS), December 1998
*In 1998, the federal poverty level (FPL) for a family of three was $13,650
Persons from low-income families (<200% of the federal poverty level) are at least twice as likely to be uninsured compared to those from families with higher incomes—no matter where they live.
• Since there are no rural-urban differences in the likelihood of being uninsured within any of the three income groups, one of the primary reasons rural residents are at greater risk of being uninsured is because they are more likely to be in poor or near-poor families.
20
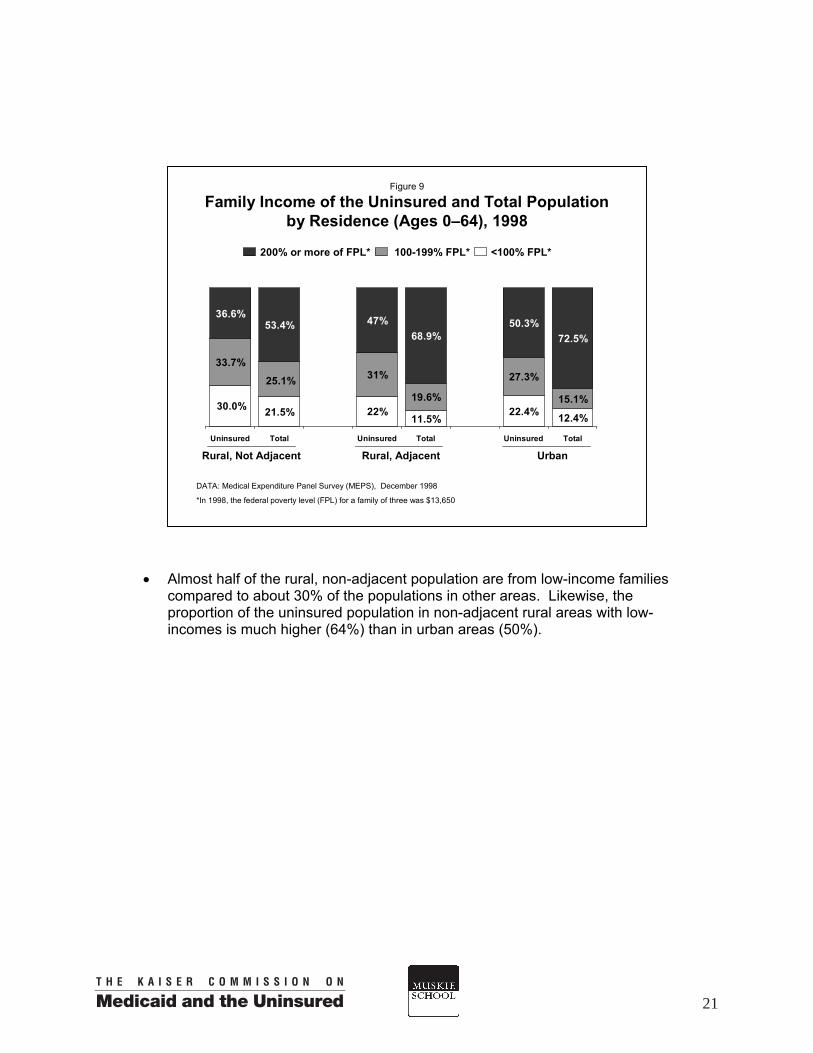
• Almost half of the rural, non-adjacent population are from low-income families compared to about 30% of the populations in other areas. Likewise, the proportion of the uninsured population in non-adjacent rural areas with low-incomes is much higher (64%) than in urban areas (50%).
Figure 9
Family Income of the Uninsured and Total Population by Residence (Ages 0–64), 1998
DATA: Medical Expenditure Panel Survey (MEPS), December 1998
*In 1998, the federal poverty level (FPL) for a family of three was $13,650
11.5%22.4% 12.4%
19.6%
27.3%
15.1%
36.6%53.4%
68.9%50.3%
72.5%
22%21.5%30.0%
31%33.7%
25.1%
47%
Uninsured Total Uninsured Total Uninsured Total
Rural, Not Adjacent Rural, Adjacent Urban
200% or more of FPL* 100-199% FPL* <100% FPL*
21
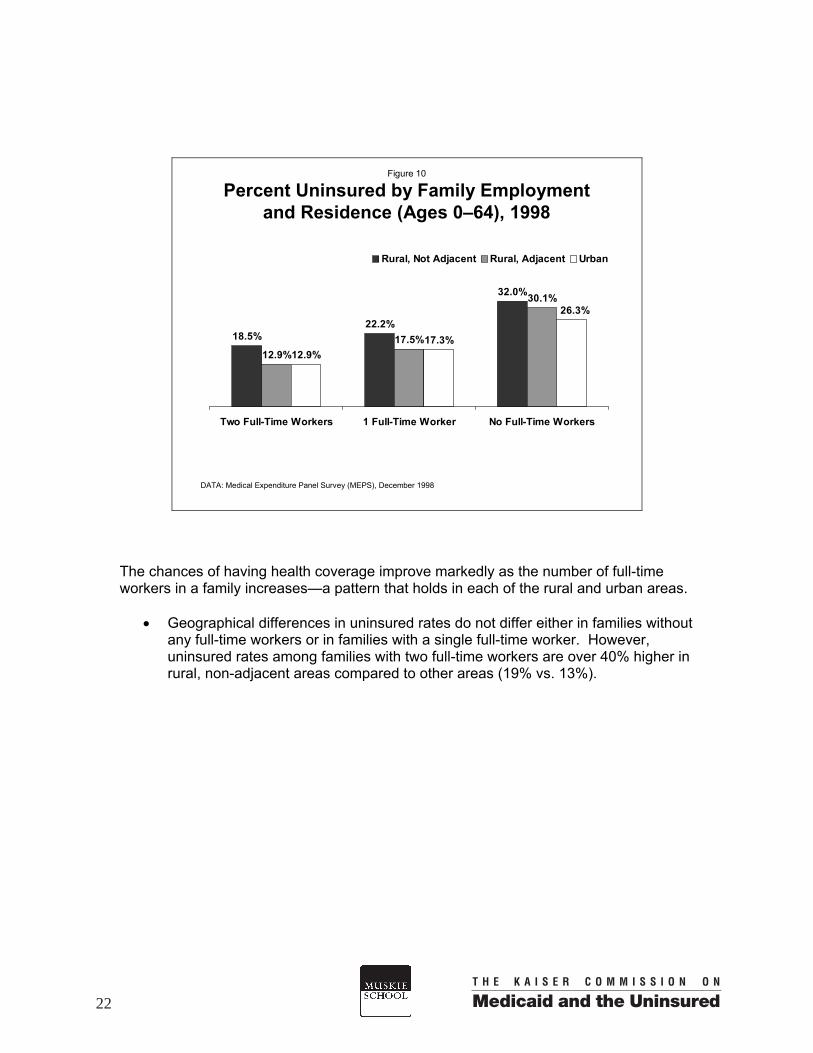
Figure 10
Percent Uninsured by Family Employment and Residence (Ages 0–64), 1998
32.0%
12.9%17.3%
22.2%18.5%
12.9%17.5%
30.1%26.3%
Two Full-Time Workers 1 Full-Time Worker No Full-Time Workers
Rural, Not Adjacent Rural, Adjacent Urban
DATA: Medical Expenditure Panel Survey (MEPS), December 1998
The chances of having health coverage improve markedly as the number of full-time workers in a family increases—a pattern that holds in each of the rural and urban areas.
• Geographical differences in uninsured rates do not differ either in families without any full-time workers or in families with a single full-time worker. However, uninsured rates among families with two full-time workers are over 40% higher in rural, non-adjacent areas compared to other areas (19% vs. 13%).
22

• The distribution of the nonelderly population by the number of full-time workers in
a family is the same across these groups of rural and urban counties and so are the distributions of their uninsured populations—suggesting that family work status is not a major factor driving the rural-urban differences in health coverage.
Figure 11
Family Employment of the Uninsured by Residence (Ages 0–64), 1998
DATA: Medical Expenditure Panel Survey (MEPS), December, 1998
FT: Full-Time
21.9%31.5%
21.5% 29.6%
46.4%
49.1%48.7%
50.2%
32.3% 23.7% 19.5%29.8%
20.2%
26.7%21.0%
46.7%49.6%
31.7%
Uninsured Total Uninsured Total Uninsured Total
No FT Workers
1 FT Worker
Two FTWorkers
Rural, Not Adjacent Rural, Adjacent Urban
23

Age differences between rural and urban nonelderly populations are also not a major factor behind the health insurance disparities. The age distribution among the nonelderly across rural and urban counties is only slightly different, yet rural-urban differences in health coverage within some age groups exist.
• Children and adults aged 35-64 living in rural, non-adjacent areas have higher
uninsured rates compared to others their age—in both urban areas and adjacent rural areas.
• Among young adults (18-34)the age group with the greatest likelihood of being
uninsureduninsured rates do not differ across rural and urban counties.
Figure 12
Percent Uninsured by Age and Residence, 1998
22.0%
30.2%
20.6%15.8%
29.7%
14.7%14.8%
26.4%
14.5%
Age 0 - 17 Age 18 - 34 Age 35 - 64
Rural, Not Adjacent Rural, Adjacent Urban
DATA: Medical Expenditure Panel Survey (MEPS), December 1998
24

Figure 13
Age Distribution of the Uninsured and Total Population by Residence, 1998
26.3% 31.1% 25.7%
37.9% 23.7% 40.6% 27.3%
41.1% 35.8% 45.2%33.8% 40.7%
32%29.7% 34.1%
24.8%31.9%
38.4%
Uninsured Total Uninsured Total Uninsured Total
35-64 years
18-34 years
0-17 years
DATA: Medical Expenditure Panel Survey (MEPS), December 1998
Rural, Not Adjacent Rural, Adjacent Urban
25

Regardless of where a person lives, being unmarried puts a person at substantially higher risk of being uninsured because married people may be able to gain coverage through their spouse’s employment if they are not offered health benefits by their own employers or do not work outside the home.
• The difference marital status makes is most pronounced in urban areas, where the uninsured risk is twice as high for single vs. married persons.
• Married people living in rural, non-adjacent counties are more likely to be
uninsured than those living in an urban area (20% vs. 13%), however there are no significant rural-urban differences in uninsured rates among unmarried persons.
Figure 14
Percent Uninsured by Marital Status and Residence (Ages 16-64), 1998
12.6%
26.5%30.5%
19.7%14.3%
27.4%
Married, Spouse Present No Spouse
Rural, Not Adjacent Rural, Adjacent Urban
DATA: Medical Expenditure Panel Survey (MEPS), December 1998
26

• Adults in rural America are just as likely to be married as adults living in urban areas are. However, married individuals comprise a larger share of uninsured adults in all rural areas compared to urban areas (43% vs. 34%) because rural couples are more likely to be uninsured than urban couples.
Figure 15
Marital Status of the Uninsured and Total Population, by Residence (Ages 16-64), 1998
42.7%58.9%
34.2%52.2%
57.3%41.1%
65.8%47.9%
54.3%43.4%
56.6%45.8%
Uninsured Total Uninsured Total Uninsured Total
No Spouse
Married, Spouse Present
DATA: Medical Expenditure Panel Survey (MEPS), December 1998
Rural, Not Adjacent Rural, Adjacent Urban
27

Figure 16
Percent Uninsured by Education and Residence (Adults, Ages 18–64), 1998
9.1%
19.6%
38.4% 39.8%
19.1%
8.4%
< High School High School/SomeCollege
College Degree or Higher
Rural Urban
DATA: Medical Expenditure Panel Survey (MEPS), December 1998
Data are presented by metropolitan (urban) and non-metropolitan (rural) because sample sizes could not support analyses of three geographic levels.
The more education a person has, the lower are his or her chances of being uninsured. Adults in both rural and urban areas with less than a high school education are four to five times as likely to lack health insurance as those with a college degree or higher.
• Rural and urban uninsured rates are not statistically different for adults with
similar education backgrounds. • However, rural adults are nearly 40% more likely to lack a high school diploma
(22% vs. 16%), putting them at increased risk of being uninsured.
28

• Over half (55%) of uninsured adults in both rural and urban areas have a high
school diploma or some college, but no college degree. However, the rural uninsured are more likely not to have graduated from high school and less likely to have a college degree compared to the uninsured in urban areas.
Figure 17
Education of the Uninsured and Total Population, by Residence (Adults, Ages 18–64), 1998
55.9%
57.2%
11.5%26.8%
16%22.138.4% 32.6%
55.2%
62.3%
15.6%6.4%
Uninsured Total Uninsured Total
College Degree or HigherHigh School/Some College< High School
DATA: Medical Expenditure Panel Survey (MEPS), December 1998
Data are presented by metropolitan (urban) and non-metropolitan (rural) because sample sizes could not support analyses of three geographic levels.
Rural Urban
29

Figure 18
Percent Uninsured by Minority Status and Residence (Ages 0–64), 1998
27.3%28.6%
19.2%
13.2%
Rural Urban
Racial/Ethnic Minority White, Not Hispanic
DATA: Medical Expenditure Panel Survey (MEPS), December1998
Data are presented by metropolitan (urban) and non-metropolitan (rural) areas because sample sizes could not support analyses of three geographic levels. Sample sizes were also too small to examine separate minority groups.
Living in either rural or urban areas does not change the higher risk of being uninsured that racial and ethnic minorities experience, but location does affect uninsured rates among white, non-Hispanics.
• Over a quarter of those in racial and ethnic minority groups are uninsured in both rural and urban counties.
• The chances of being uninsured among white, non-Hispanic persons is higher for
those in rural areas compared to urban areas (19% vs. 13%).
30

Figure 19
Minority Status of the Uninsured and Total Population, by Residence (Ages 0–64), 1998
76.3% 82.7%
50.0%67.3%
50.0%32.7%
17.3%23.7%
Uninsured Total Uninsured Total
Racial/Ethnic Minority
White, Not Hispanic
DATA: Medical Expenditure Panel Survey (MEPS), December 1998
Data are presented by metropolitan (urban) and non-metropolitan (rural) areas because sample sizes could not support analyses of three geographic levels. Sample sizes were also too small to examine minority groups.
UrbanRural
• More than 3/4 of the rural uninsured are white, non-Hispanics compared to half of the urban uninsured—which reflects both the greater likelihood of being uninsured associated with living in rural counties among whites and a much higher concentration of whites in rural compared to urban areas.
31

Figure 20
Percent Uninsured by Health Status and Residence (Ages 0–64), 1998
23.2%
28.8%
21.3%16.7%
22.4% 20.9%
16.6%
23.0%19.6%
Excellent/Very Good Good Fair/Poor
Rural, Not Adjacent Rural, Adjacent Urban
DATA: Medical Expenditure Panel Survey (MEPS), December 1998
In general, persons in excellent and very good health have the lowest chances of being uninsured. Persons in good health, in contrast, tend to have the highest uninsured risk because while their health does not disable them, they do have health problems that can affect their ability to work fully—consequently affecting their ability to get health insurance. Medicaid coverage of the low-income disabled helps to lower what would otherwise be very high uninsured rates among persons in fair and poor health, who are least likely to have access to employer-sponsored insurance.
• In rural, non-adjacent areas the likelihood of being uninsured is about equal
between persons in excellent/very good health and those in fair or poor health. Uninsured rates in these rural counties are highest among people with good health.
• In contrast, the chances of being uninsured among urban residents increase
incrementally as health declines.
32

• Persons living in rural, non-adjacent areas who are in good health are at greater
risk of being uninsured than others in good health who live in either other rural or urban counties.
• Health status varies little across these geographical groups, however the
distribution of health status among the uninsured populations differs more because of the much higher uninsured rates among those in good health living in rural, non-adjacent areas.
Figure 21
Health Status of the Uninsured and Total Population, by Residence (Ages 0–64), 1998
59.6% 65.9% 65.9% 70.5%
28.5% 23.5% 23.7% 21.4%12.0% 10.6% 10.4%
57.8% 63.5%
25.2%31.1%
8.1%11.1% 11.3%
Uninsured Total Uninsured Total Uninsured Total
Fair/PoorGoodExcellent/Very Good
DATA: Medical Expenditure Panel Survey (MEPS), December 1998
Rural, Not Adjacent Rural, Adjacent Urban
33


Section III: Employment and Health Insurance in Rural America Rural Americans are less likely to have private health insurance largely because they are less likely to be offered health benefits through their jobs. However, when health benefits are offered, enrollment rates are no different across rural and urban workers—despite wide differences in incomes. Workers in rural, non-adjacent counties are far more likely to be earning low wages compared to urban workers (33% vs. 19%) and more likely to work in small businesses with fewer than 20 employees (46% vs. 37%)—two factors that markedly increase their chances of being uninsured. Only about a third of low-wage workers (earning less than $7/hour) are offered health
benefits through their jobs, regardless of where they work. Nearly 40% of low-wage workers in rural, non-adjacent counties are uninsured.
Low-wage workers make up 60% of all uninsured workers in rural, non-adjacent
communities compared to 40% of uninsured workers in urban areas. Only 36% of rural, non-adjacent workers who work for a small business have an employer
who offers them health benefits (compared to 47% of urban workers in small businesses). One in three small business employees in rural, non-adjacent counties is uninsured.
Over 2/3 of uninsured workers (68%) who live in rural, non-adjacent counties are working
for firms with less than 20 employees. Persons employed in personal services or the entertainment industry are the least likely to
work for an employer who offers health benefits to them, particularly in rural areas (27% vs. 40% in urban areas).
Self-employed persons living in rural counties are far more likely to be uninsured than
those living in urban counties.
35

Figure 22
Percent of Adults Uninsured, by Employment Status and Residence, 1998
26.9%
20.9%17.9%
26.6%
Employed Not Employed
Rural Urban
DATA: Medical Expenditure Panel Survey (MEPS), December 1998
Adults age 18-64.
Data are presented by metropolitan (urban) and non-metropolitan (rural) because sample sizes could not support analyses of three geographic levels.
Most Americans obtain their health insurance as a benefit through their jobs, but not all employers offer health benefits, not all employees are eligible, and not all can afford to participate when health insurance is offered. Regardless of location, approximately 3/4 of all uninsured adults are currently employed.
• Employed adults living in rural areas are more likely to be uninsured compared to employed adults living in urban areas (21% vs. 18%).
• Being unemployed or out of the labor force increases the likelihood of being
uninsured for both rural and urban adults, and this likelihood does not differ by residence.
36
Employer-Sponsored Health Insurance among Workers: Offer, Enrollment, and Coverage, 1998
59.0%
83.0%
49.0%
66.0%
86.0%
56.0%
84.0%
58.0%69.0%
Rural, Not Adjacent Rural, Adjacent Urban
Figure 23
DATA: Medical Expenditure Panel Survey (MEPS), December 1998
ESI Offered Enrolled,If Offered
Covered byEmployer
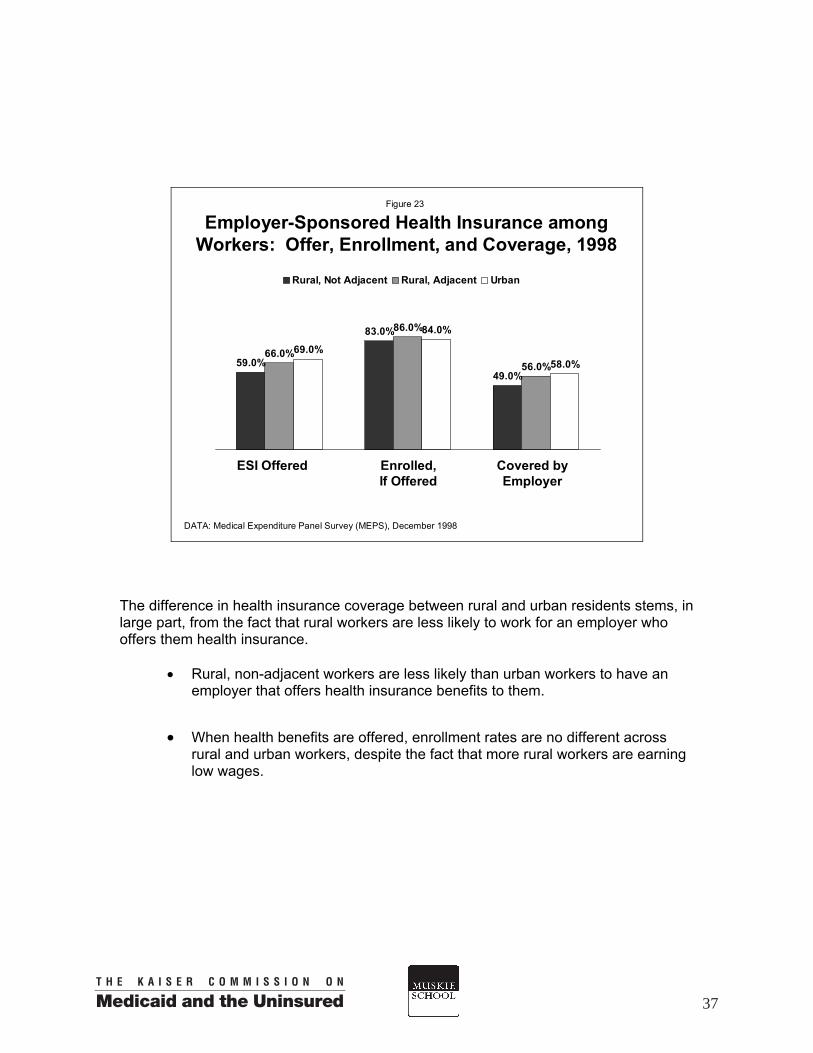
The difference in health insurance coverage between rural and urban residents stems, in large part, from the fact that rural workers are less likely to work for an employer who offers them health insurance.
• Rural, non-adjacent workers are less likely than urban workers to have an employer that offers health insurance benefits to them.
• When health benefits are offered, enrollment rates are no different across
rural and urban workers, despite the fact that more rural workers are earning low wages.
37

Without a connection to a business firm and the opportunity to be covered by a group health plan, the self-employed are much less likely to have health insurance.
• Self-employed workers living in rural counties are far more likely to be uninsured than those living in urban counties (33% vs. 24%).
Figure 24
Percent Uninsured among Self-Employed Workers by Residence, 1998
23.8%
32.7%
Rural Urban
DATA: Medical Expenditure Panel Survey (MEPS), 1998
Data are presented by metropolitan (urban) and non-metropolitan (rural) because sample sizes could not support analyses of three geographic levels.
38
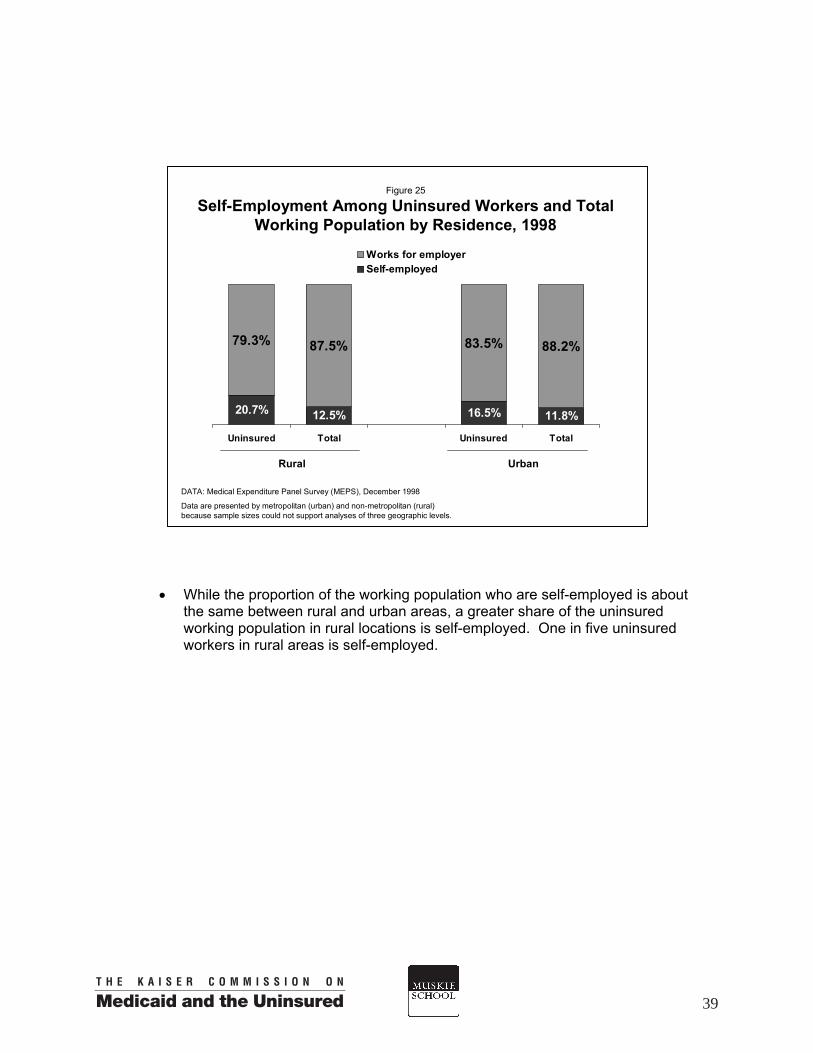
• While the proportion of the working population who are self-employed is about
the same between rural and urban areas, a greater share of the uninsured working population in rural locations is self-employed. One in five uninsured workers in rural areas is self-employed.
Figure 25
Self-Employment Among Uninsured Workers and Total Working Population by Residence, 1998
16.5% 11.8%
83.5% 88.2%
12.5%20.7%
79.3% 87.5%
Uninsured Total Uninsured Total
Works for employerSelf-employed
DATA: Medical Expenditure Panel Survey (MEPS), December 1998
Data are presented by metropolitan (urban) and non-metropolitan (rural) because sample sizes could not support analyses of three geographic levels.
UrbanRural
39

Figure 26
Percent of Workers Whose Employer Offers Health Insurance, by Employment Status and Residence, 1998
36.0%
79.0%
40.0%
68.4%
33.8%
76.5%
Full-Time Part-Time
Rural, Not Adjacent Rural, Adjacent Urban
DATA: Medical Expenditure Panel Survey (MEPS), December 1998
For all workers aged 16-64. Workers asked if their employer offered health benefits to them.
Part-time workers are commonly not eligible for health benefits. Many of them have coverage through their spouse’s employer, others find a private non-group plan, and many go uninsured.
• In rural, non-adjacent areas only about 2/3 of full-time workers have an employer
that offers them health insurance compared to about 3/4 of urban full-time workers.
• Full-time workers in all areas are nearly twice as likely to have an employer that
offers them health insurance compared to part-time workers. Consequently, part-time workers are more likely to be uninsured than full-time workers, regardless of where they live.
40

• Workers in rural, non-adjacent counties have higher uninsured rates compared to workers in urban counties among both full-time and part-time workers.
• Uninsured workers in rural, non-adjacent counties are more likely to be full-time
workers compared to uninsured workers in other rural and urban counties.
Figure 27
Percent of Workers Uninsured by Employment Status and Residence, 1998
30.9%
19.3%14.4%
22.4% 22.3%
14.9%
Full-Time Part-Time
Rural, Not Adjacent Rural, Adjacent Urban
DATA: Medical Expenditure Panel Survey (MEPS), 1998
41

Figure 28
Percent of Workers Whose Employer Offers Health Insurance by Firm Size* and Residence, 1998
76.0%
36.4%43.2%
78.9%
47.1%
80.5%
< 20 Employees 20 Employees or More
Rural, Not Adjacent Rural, Adjacent Urban
DATA: Medical Expenditure Panel Survey (MEPS), December 1998
*For all workers aged 16-64. Workers asked if their employer offered health benefits to them.
People living in rural America are more likely than urban residents to work in small firms (defined here as less than 20 employees) where they are less likely to be offered health benefits.
• At least 3/4 of larger businesses offer their employees health benefits, regardless of location. However workers in small businesses are far less likely to be offered health insurance coverage and this varies by location.
• Only 36% of small business employees living in rural, non-adjacent areas have
health benefits offered to them through their job, compared to 47% of similar urban, small business workers.
• Working for a small employer more than doubles the risk that a worker will be
uninsured regardless of where the worker lives. • The chances of being uninsured among small business employees are greatest
for those living in rural, non-adjacent areas, where a third of these workers are uninsured compared to a quarter of small firm workers in urban areas.
• Nearly half of all workers in rural, non-adjacent counties work for a small
business. Given this group’s higher uninsured rates, over 2/3 of uninsured workers who live in rural, non-adjacent areas are working for small businesses.
42

Figure 29
Percent Of Workers Uninsured by Firm Size and Residence, 1998
25.0%
11.3%
33.1%
13.2% 11.6%
23.9%
< 20 Employees 20 Employees or more
Rural, Not Adjacent Rural, Adjacent Urban
DATA: Medical Expenditure Panel Survey (MEPS), December 1998
Figure 30
Firm Size Among Uninsured Workers and Total Working Population by Residence, 1998
DATA: Medical Expenditure Panel Survey (MEPS), December 1998
57.5%39.5%
56.1%36.6%
31.8%53.9%
42.6%60.5%
43.9%63.4%
46.1%68.2%
Uninsured Total Uninsured Total Uninsured Total
20 Employees or more< 20 Employees
Rural, Not Adjacent Rural, Adjacent Urban
43

Figure 31
Percent of Workers Whose Employer Offers Health Insurance, by Hourly Wage* and Residence, 1998
77.0%
32.5%
79.3%
32.0% 30.4%
81.5%
< $7 per hour $7 per hour or more
Rural, Not Adjacent Rural, Adjacent Urban
DATA: Medical Expenditure Panel Survey (MEPS), 1998
*For all workers aged 16-64. Workers asked if their employer offered health benefits to them.
How much a worker earns factors heavily into the chances of having health insurance coverage. Low-wage workers (earning less than $7 per hour) often cannot afford their share of health insurance premiums, but are also less likely to have health benefits offered to them by their employers.
• Low-wage workers are less than half as likely to be offered health insurance by their employer than workers earning more. Only about a third of low-wage workers are offered health benefits through their own jobs.
• Location does not change the size of this gap between low and higher wage
workers. Low-wage workers (earning less than $7 per hour) are roughly three times as likely to be uninsured compared to workers earning more, no matter where they live.
• Since workers in rural America are more likely to earn low wages, they make up
a majority of uninsured workers there, particularly in rural, non-adjacent areas where 60% of uninsured workers are earning low wages.
44

Figure 32
Percent of Workers Uninsured by Wages and Residence, 1998
34.7%
12.0%
37.3%
12.3%10.0%
32.4%
< $7 per hour $7 per hour or more
Rural, Not Adjacent Rural, Adjacent Urban
DATA: Medical Expenditure Panel Survey (MEPS), December 1998
Figure 33
Wages of Uninsured Workers and Total Working Population by Residence, 1998
DATA: Medical Expenditure Panel Survey (MEPS), December 1998
53.1%
25.9%39.8%
18.6%
46.9%
74.1%60.2%
81.4%
33.4%
60.4%
39.6%
66.6%
Uninsured Total Uninsured Total Uninsured Total
$7 per hour or more<$7 per hour
Rural, Not Adjacent Rural, Adjacent Urban
45

The nature of jobs differs between rural and urban America and agricultural jobs are no longer the primary difference. While rural workers are still more likely to be employed in natural resources (agriculture, forestry and fishing, 4% in rural areas vs. 2% in urban), they are also more likely than urban workers to be employed in manufacturing and mining (19% in rural areas vs. 16%). Urban workers are more likely than rural workers to be employed in the construction/repair and financial/administrative industries (12% vs. 9%). The type of industry does not fully account for the differences between rural and urban workers’ health coverage.
• Health benefits are far less common in these industries:
agriculture, forestry, and fishing personal services and entertainment.
Rural-urban differences are the greatest in the industry group of personal services and entertainment—only 27% of rural workers in these two industries have health insurance offered to them compared to 40% of urban workers.
• Rural workers in sales, professional services, utilities, transportation, and
construction/repair services are also less likely then urban workers to have health insurance offered as a benefit to them.
Figure 34
Share of Workers Offered Employer-Based Coverage by Industry and Residence, 1998
74.5%
40.3%
50.0%
55.9%
85.9%
81.4%
32.4%
47.4%
40.0%
69.4%
78.8%
81.2%
34.4%
27.1%
Sales
Professional Services & Utilities
Personal Services & Entertainment
Natural Resources
Manufacturing & Mining
Finance & Public Administration
Construction & Repair Services
Rural
Urban
DATA: Medical Expenditure Panel Survey (MEPS), 1998. Includes all workers aged 16-64.
46

Interestingly, the proportion of rural vs. urban workers who are uninsured is only statistically different in two industry groups: sales and construction/repair services. This suggests that rural workers in the other industries where benefits are less likely to be offered to rural employees are actually more likely to participate in their employer’s health benefits than urban workers.
Figure 35
Percent Uninsured by Industry and Residence, 1998
39.0%30.0%
5.8%
10.8%
35.1%
31.2%
11.0%
25.6%
30.7%
30.4%
13.0%
9.4%
11.9%
30.8%Sales
Professional Services & Utilities
Personal Services & Entertainment
Natural Resources
Manufacturing & Mining
Finance & Public Administration
Construction & Repair Services
Rural
Urban
DATA: Medical Expenditure Panel Survey (MEPS), 1998. Includes all workers aged 16-64.
47
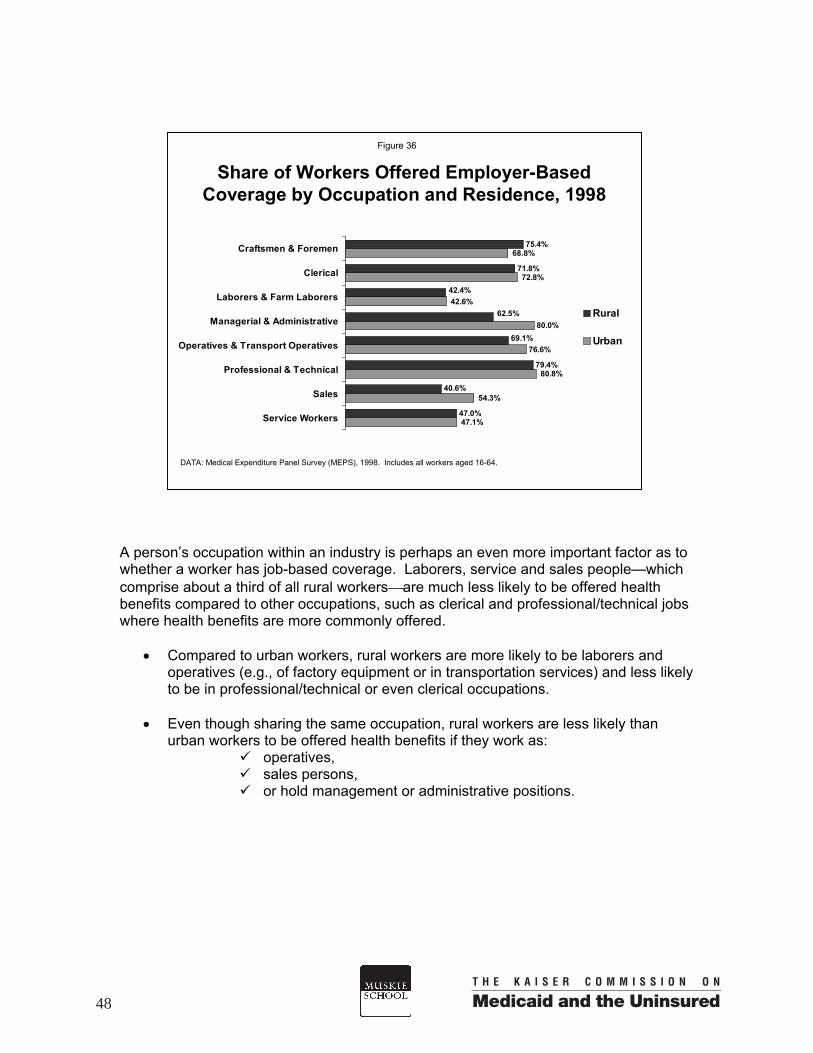
A person’s occupation within an industry is perhaps an even more important factor as to whether a worker has job-based coverage. Laborers, service and sales people—which comprise about a third of all rural workersare much less likely to be offered health benefits compared to other occupations, such as clerical and professional/technical jobs where health benefits are more commonly offered.
• Compared to urban workers, rural workers are more likely to be laborers and operatives (e.g., of factory equipment or in transportation services) and less likely to be in professional/technical or even clerical occupations.
• Even though sharing the same occupation, rural workers are less likely than
urban workers to be offered health benefits if they work as: operatives, sales persons, or hold management or administrative positions.
Share of Workers Offered Employer-Based Coverage by Occupation and Residence, 1998
47.1%
68.8%
72.8%
42.6%
80.0%
76.6%
80.8%
54.3%
75.4%
79.4%
69.1%
62.5%
42.4%
40.6%
47.0%
71.8%
Service Workers
Sales
Professional & Technical
Operatives & Transport Operatives
Managerial & Administrative
Laborers & Farm Laborers
Clerical
Craftsmen & Foremen
Rural
Urban
DATA: Medical Expenditure Panel Survey (MEPS), 1998. Includes all workers aged 16-64.
Figure 36
48

• Uninsured rates between rural and urban workers do not vary in these occupational groups with two exceptions. Rural workers in managerial/administrative positions—where offer rates are much lower—are three times as likely to be uninsured compared to urban workers. Craftsmen and foremen positions in rural counties are actually more likely to be offered health benefits and are less likely to be uninsured than urban workers in these occupations.
Percent Uninsured by Occupation and Residence, 1998
29.1%
11.6%
25.1%
17.6%
35.6%
7.3%
9.2%
20.9%
8.0%
20.8%
21.6%
39.4%
18.7%
25.7%
21.4%
10.2%
Service Workers
Sales
Professional & Technical
Operatives & Transport Operatives
Managerial & Administrative
Laborers & Farm Laborers
Clerical
Craftsmen & Foremen
Rural
Urban
DATA: Medical Expenditure Panel Survey (MEPS), 1998. Includes all workers aged 16-64.
Figure 37
49

Section IV: Policy Considerations for Covering the Rural Uninsured A number of different strategies for expanding health insurance coverage to uninsured persons have been proposed over the past decade. These have ranged from sweeping reforms such as universal coverage proposals to more incremental, targeted strategies. Given the generally higher uninsured rate in rural compared to urban areas, expanding health insurance coverage could be a particularly critical policy intervention for improving the well being of rural families. However, the rural and urban uninsured differ in a variety of ways that may affect the feasibility and effectiveness of potential policy solutions. These differences should be taken into account when weighing the effectiveness of particular proposals among rural Americans. Not all rural communities are equally disadvantaged in their health insurance coverage, and special consideration should be given to the needs of the most remote rural residents.
Residents of rural communities that are not adjacent to an urban area may have a particularly difficult time obtaining and sustaining health insurance coverage. They tend to have higher uninsured rates and even in a better economic period (between 1996 and 1998) their health coverage did not improve. However, health coverage for persons living in both urban counties and rural counties close to urban areas did improve during this same period and their uninsured rates declined.
Policymakers who want to create effective insurance programs for rural residents need to be aware of the distinctions between different rural counties. A strategy that may be effective in reducing the uninsured rate among residents of rural communities in close proximity to urban areas may not meet the needs of those in more remote areas.
Rural residents, particularly those not living adjacent to an urban area, are more likely to be uninsured for long periods of time.
Individuals living in rural non-adjacent communities were a third more likely to have been uninsured throughout all of 1998. To better meet the needs of rural communities, reforms will need to include strategies to secure stable coverage over long periods of time, providing more than “bridge” coverage. For example, past federal reforms such as COBRA and the Health Insurance Portability and Accountability Act (HIPAA) were designed to maintain health benefits for those transitioning between one source of health insurance to the next. Given that more of the rural uninsured are without health coverage for long periods, they are probably less likely to experience a loss in coverage simply as a result of employment changes.
51

Rural families in more remote areas (not adjacent to an urban county) who lack health insurance have lower family incomes than uninsured urban families do.
While half of the urban uninsured come from families with incomes under 200% of poverty, nearly 2/3 (63%) of the uninsured living in rural, non-adjacent counties are from low-income families. The extent to which particular strategies can keep health insurance costs affordable for poor and near-poor families will have important implications for the success of any health coverage expansion in rural America.
Whether tax credits are used to expand private insurance by employers or individuals, or public programs are expanded (perhaps with buy-in options), substantial assistance with the costs of premiums will be needed to keep the option affordable for low-income families everywhere. Given limited monthly disposable incomes, subsidies like tax credits need to be made available to low-income families before vs. after health insurance is purchased. The benefits, co-payments, deductibles, and other cost-sharing requirements of any expansion strategy, be it through private or public health insurance, will be equally critical to improving access to health services for low-income people.
Medicaid coverage is currently a more important source of coverage for rural, non-adjacent residents, compared to those in urban areas.
Proportionately, about 50% more nonelderly residents of rural, non-adjacent counties compared to urban counties are covered by Medicaid (16% versus 10%). Over a quarter of children (27%) living in rural non-adjacent areas are covered by Medicaid. Because the Medicaid program insures larger shares of the rural population many more rural than urban families are familiar with how the program operates. Expanding on this base could be an effective way to increase coverage among the rural uninsured. In the current economic environment, it is important to bear in mind that rural populations will likely suffer the most when Medicaid and S-CHIP programs are diminished by states’ budget constraints.
Rural Americans are less likely to have private health insurance largely because, besides working for lower wages, rural workers are less likely than urban workers to be offered health benefits through their employers.
Only 59% of workers in rural, non-adjacent areas are employed in a business that offers health benefits to them, compared to 69% of urban workers. When insurance is offered, enrollment rates are no different across rural and urban employees—despite the fact that rural workers on average are earning lower wages, making cost-sharing requirements more difficult for many. The large majority of uninsured workers do not have access to employer benefits and the situation is worse among uninsured rural workers where about 18% have health benefits offered through their jobs compared to 27% of uninsured urban workers.
52

Strategies to increase employers’ ability to offer health insurance to their workers that take into account the nature of rural businesses could be helpful at reducing coverage disparities. Small firms dominate the rural economy—46% of workers in rural, non-adjacent counties are employed by businesses with less than 20 employees. Small businesses in rural non-adjacent counties are the least likely to offer health benefits (just 36%). Over two-thirds of uninsured workers who live in these rural non-adjacent counties are working for small businesses. Subsidies aimed at increasing the percentage of employers that offer health insurance would need to be particularly large in order to secure participation among these very small rural businesses.
Workers in rural non-adjacent areas are far more likely to be earning low wages (less than $7/hour) compared to urban workers (33% vs. 19%). Sixty percent of uninsured workers in rural, non-adjacent areas are earning low wages. Employers with a high proportion of low-wage workers would need large tax incentives to make offering health insurance to their employees attractive and/or affordable. Meyer and Wicks estimate that to attract employers into participating in a tax incentive program for increasing health insurance, those with average wages per worker of less than $7.00 per hour would need a tax credit of 50% of the cost of a standard benefit package. In addition, worker contributions may also need to be subsidized in order to increase benefit participation among those earning the lowest wages. 1
Besides the fact that the majority of uninsured workers in rural, non-adjacent areas are earning less than $7/hour, they are more likely to be working part-time. In many cases, part-time workers are not eligible for employer-sponsored health insurance even when it is available to full-time workers. When part-time workers are permitted to buy into an employer plan, the employee cost sharing is typically quite high. Consequently, in order to be most effective at insuring rural workers, policy efforts aimed at employers may need to consider specific provisions for part-time workers.
Strategies to increase coverage among the self-employed will be particularly important in rural areas.
Although rural residents are only slightly more likely than those in urban areas to be self-employed, self-employed rural residents are more likely to lack health insurance. Approximately 1/3 of self-employed workers in rural areas lack health insurance compared to less than 1/4 of those in urban areas. As a result, strategies intended to expand health coverage will need to address the affordability of non-group health policies available to the self-employed.
1 Meyer, J. A., & Wicks, E. K. (2000). A federal tax credit to encourage employers to offer health coverage. The Commonwealth Fund.
53


Data Tables
55
Section V:

Nonelderly(millions) Private Public Uninsured
1996Total 231.8 69.1% 10.7% 20.3%
Rural, Non-Adjacent 20.4 61.8% 14.7% 23.5%Rural, Adjacent 23.3 64.6% 9.9% 25.5%
Urban 188.1 70.5% 10.3% 19.3%
1997Total 233.8 69.6% 10.9% 19.5%
Rural, Non-Adjacent 21.2 61.3% 14.9% 23.9%Rural, Adjacent 23.2 67.8% 10.5% 21.7%
Urban 189.4 70.9% 10.5% 18.7%
1998Total 235.9 70.2% 11.2% 18.6%
Rural, Non-Adjacent 21.7 60.5% 15.8% 23.7%Rural, Adjacent 22.4 71.2% 10.3% 18.5%
Urban 191.8 71.5% 10.6% 17.9%
Health Insurance Coverage of the NonelderlyTable 1
Percent Distribution by Coverage Type
by Residence, 1996-1998a
56

Children(millions) Private Public Uninsured
1996Total 74.3 64.0% 18.5% 17.6%
Rural, Non-Adjacent 6.9 53.4% 26.9% 19.8%Rural, Adjacent 7.9 58.6% 15.6% 25.8%
Urban 59.6 65.9% 17.9% 16.2%
1997Total 74.5 64.6% 18.7% 16.6%
Rural, Non-Adjacent 7.1 52.3% 26.0% 21.7%Rural, Adjacent 7.4 64.1% 16.1% 19.9%
Urban 59.9 66.1% 18.2% 15.6%
1998Total 75.5 65.5% 19.3% 15.2%
Rural, Non-Adjacent 7.4 52.1% 27.3% 20.6%Rural, Adjacent 6.9 67.4% 16.8% 15.8%
Urban 61.1 66.9% 18.6% 14.5%
Health Insurance Coverage of ChildrenTable 2
Percent Distribution by Coverage Type
by Residence, 1996-1998
57

Adults(millions) Private Public Uninsured
1996Total 157.4 71.5% 7.0% 21.5%
Rural, Non-Adjacent 13.6 66.0% 8.5% 25.4%Rural, Adjacent 15.4 67.7% 7.0% 25.3%
Urban 128.5 72.6% 6.8% 20.7%
1997Total 159.3 72.0% 7.2% 20.8%
Rural, Non-Adjacent 13.9 64.9% 9.2% 25.9%Rural, Adjacent 15.8 69.6% 7.9% 22.5%
Urban 129.6 73.0% 6.9% 20.1%
1998Total 160.4 72.5% 7.4% 20.2%
Rural, Non-Adjacent 14.2 64.4% 10.2% 25.4%Rural, Adjacent 15.5 72.5% 7.6% 19.9%
Urban 130.7 73.4% 5.7% 19.6%
Health Insurance Coverage of Nonelderly AdultsTable 3
Percent Distribution by Coverage Type
by Residence, 1996-1998
58

Nonelderly Percent of Uninsured Percent of Uninsured(millions) Nonelderly (millions) Uninsured Rate
Total - Nonelderly 21.7 100.0% 5.1 100.0% 23.7%
AgeChildren - Total 7.4 34.1% 1.5 29.7% 20.6%
Adults - Total 14.2 65.9% 3.6 70.3% 25.4%Adults 18-34 5.4 24.8% 1.6 31.9% 30.2%Adults 35-64 8.9 41.1% 2.0 38.4% 22.0%
Family Poverty Levelb
<100% 4.7 21.5% 1.5 30.0% 32.4%100-199% 5.4 25.1% 1.7 33.7% 31.6%
200% or more 11.6 53.4% 1.9 36.6% 16.1%
Family Work Status2 Full-time Workers 5.8 26.7% 1.1 21.0% 18.5%1 Full-time Worker 10.8 49.6% 2.4 46.7% 22.2%
No Full-time Workers 5.1 23.7% 1.6 32.3% 32.0%
Marital Statusc
Married 8.7 54.3% 1.7 43.4% 19.7%No Spouse 7.3 45.8% 2.2 56.6% 30.5%
Health StatusExcellent/Very Good 13.8 63.5% 2.9 57.8% 21.3%
Good 5.5 25.2% 1.6 31.1% 28.8%Fair/Poor 2.5 11.3% 0.6 11.1% 23.2%
Additional Characteristics: Total Rural Nonelderly 44.1 100.0% 9.2 100.0% 20.9%(Rural Non-Adjacent and Rural Adjacent Counties)
Minority StatusWhite, not Hispanic 36.5 82.7% 7.0 76.3% 19.2%
Minority 7.6 17.3% 2.2 23.7% 28.6%
Education LevelLess than High School 6.5 22.1% 2.5 38.4% 38.4%
HS Grad/Some College 18.4 62.3% 3.6 55.2% 19.6%College degree or more 4.6 15.6% 0.5 6.4% 9.1%
Table 4Characteristics of the Nonelderly Uninsured
in Rural, Non-Adjacent Counties, 1998
59

Nonelderly Percent of Uninsured Percent of Uninsured(millions) Nonelderly (millions) Uninsured Rate
Total - Nonelderly 22.4 100.0% 4.1 100.0% 18.5%
AgeChildren - Total 6.9 31.1% 1.1 26.3% 15.8%
Adults - Total 15.5 68.9% 3.1 73.7% 19.9%Adults 18-34 5.3 23.7% 1.6 37.9% 29.7%Adults 35-64 10.2 45.2% 1.5 35.8% 14.7%
Family Poverty Levelb
<100% 2.6 11.5% 0.9 22.0% 35.4%100-199% 4.4 19.6% 1.3 31.0% 29.3%
200% or more 15.4 68.9% 1.9 47.0% 12.6%
Family Work Status2 Full-time Workers 7.1 31.5% 0.9 21.9% 12.9%1 Full-time Worker 11.0 49.1% 1.9 46.4% 17.5%
No Full-time Workers 4.4 19.5% 1.3 31.7% 30.1%
Marital Statusc
Married 9.8 58.9% 1.4 42.7% 14.3%No Spouse 6.9 41.1% 1.9 57.3% 27.4%
Health StatusExcellent/Very Good 14.8 65.9% 2.4 59.6% 16.7%
Good 5.3 23.5% 1.2 28.5% 22.4%Fair/Poor 2.4 10.6% 0.5 12.0% 20.9%
Characteristics of the Nonelderly UninsuredTable 5
in Rural, Adjacent Counties, 1998
60
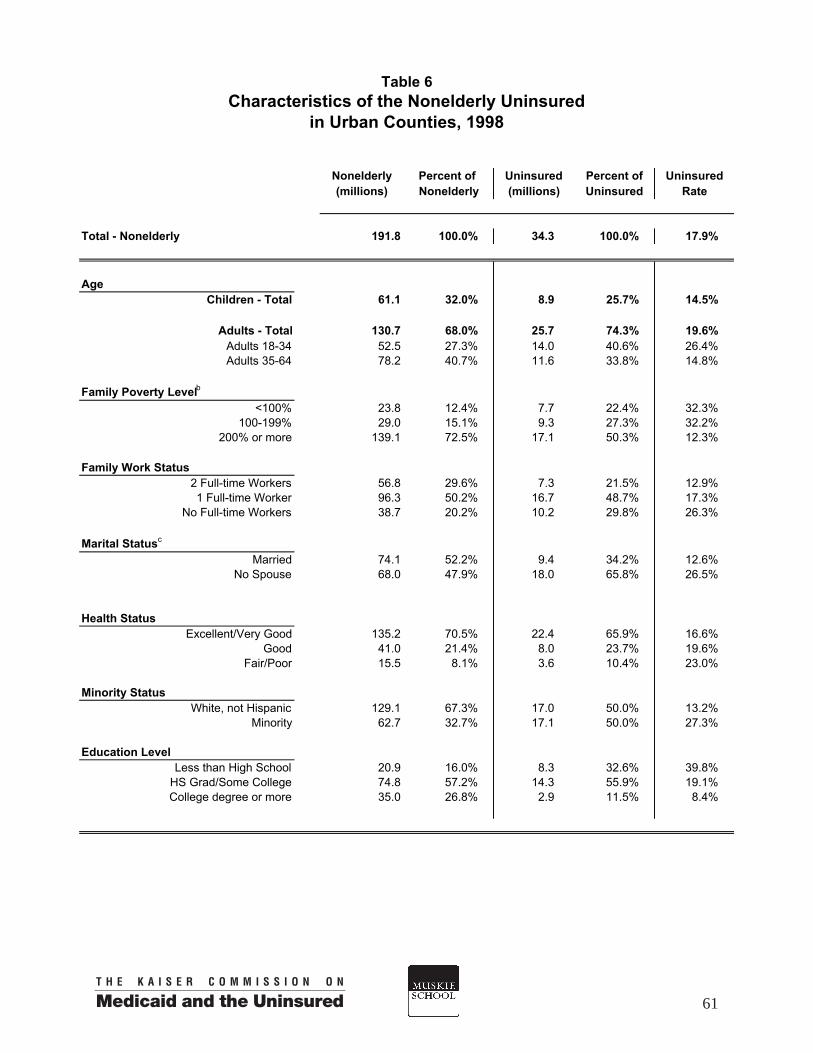
Nonelderly Percent of Percent of Uninsured(millions) Nonelderly Uninsured Rate
Total - Nonelderly 191.8 100.0% 34.3 100.0% 17.9%
AgeChildren - Total 61.1 32.0% 8.9 25.7% 14.5%
Adults - Total 130.7 68.0% 25.7 74.3% 19.6%Adults 18-34 52.5 27.3% 14.0 40.6% 26.4%Adults 35-64 78.2 40.7% 11.6 33.8% 14.8%
Family Poverty Levelb
<100% 23.8 12.4% 7.7 22.4% 32.3%100-199% 29.0 15.1% 9.3 27.3% 32.2%
200% or more 139.1 72.5% 17.1 50.3% 12.3%
Family Work Status2 Full-time Workers 56.8 29.6% 7.3 21.5% 12.9%1 Full-time Worker 96.3 50.2% 16.7 48.7% 17.3%
No Full-time Workers 38.7 20.2% 10.2 29.8% 26.3%
Marital Statusc
Married 74.1 52.2% 9.4 34.2% 12.6%No Spouse 68.0 47.9% 18.0 65.8% 26.5%
Health StatusExcellent/Very Good 135.2 70.5% 22.4 65.9% 16.6%
Good 41.0 21.4% 8.0 23.7% 19.6%Fair/Poor 15.5 8.1% 3.6 10.4% 23.0%
Minority StatusWhite, not Hispanic 129.1 67.3% 17.0 50.0% 13.2%
Minority 62.7 32.7% 17.1 50.0% 27.3%
Education LevelLess than High School 20.9 16.0% 8.3 32.6% 39.8%
HS Grad/Some College 74.8 57.2% 14.3 55.9% 19.1%College degree or more 35.0 26.8% 2.9 11.5% 8.4%
(millions)
Characteristics of the Nonelderly UninsuredTable 6
in Urban Counties, 1998
Uninsured
61

Uninsured Uninsured Uninsured(millions) Rate Rate
1996Total 34.3 14.5% 29.6 12.5%
Rural, Non-Adjacent 3.9 18.5% 2.4 11.2%Rural, Adjacent 4.4 18.6% 3.2 13.6%
Urban 26.1 13.6% 24.2 12.6%
1997Total 35.4 15.0% 28.3 12.0%
Rural, Non-Adjacent 4.2 19.8% 2.3 10.7%Rural, Adjacent 3.7 15.8% 3.0 12.9%
Urban 27.3 14.3% 23.1 12.1%
1998Total 34.4 14.4% 26.5 11.1%
Rural, Non-Adjacent 4.5 20.4% 2.3 10.5%Rural, Adjacent 3.3 14.7% 2.2 9.7%
Urban 26.5 13.6% 22.0 11.3%
Uninsured(millions)
Full-Year and Part-Year Uninsured Rates Among the NonelderlyTable 7
by Residence, 1996-1998
Uninsured Full Year Uninsured Part Year
62
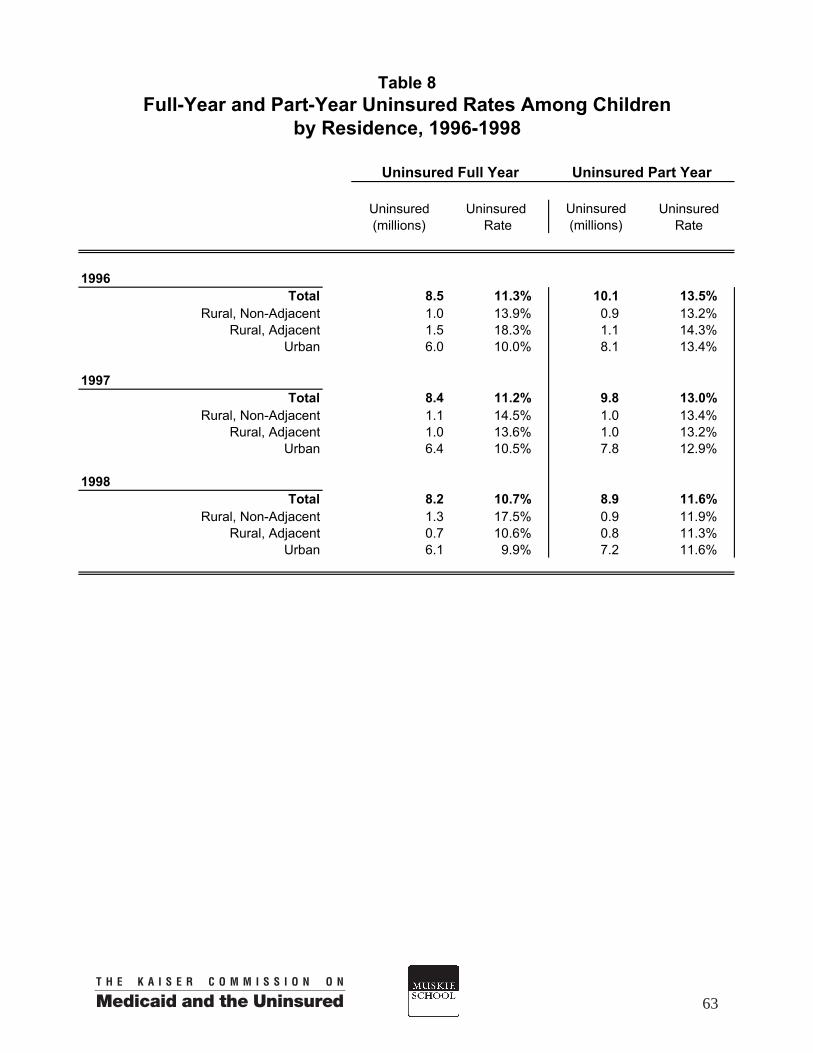
Uninsured Uninsured Uninsured(millions) Rate Rate
1996Total 8.5 11.3% 10.1 13.5%
Rural, Non-Adjacent 1.0 13.9% 0.9 13.2%Rural, Adjacent 1.5 18.3% 1.1 14.3%
Urban 6.0 10.0% 8.1 13.4%
1997Total 8.4 11.2% 9.8 13.0%
Rural, Non-Adjacent 1.1 14.5% 1.0 13.4%Rural, Adjacent 1.0 13.6% 1.0 13.2%
Urban 6.4 10.5% 7.8 12.9%
1998Total 8.2 10.7% 8.9 11.6%
Rural, Non-Adjacent 1.3 17.5% 0.9 11.9%Rural, Adjacent 0.7 10.6% 0.8 11.3%
Urban 6.1 9.9% 7.2 11.6%
Uninsured(millions)
Full-Year and Part-Year Uninsured Rates Among ChildrenTable 8
by Residence, 1996-1998
Uninsured Full Year Uninsured Part Year
63

Uninsured Uninsured Uninsured(millions) Rate Rate
1996Total 25.9 16.3% 19.1 12.0%
Rural, Non-Adjacent 2.9 21.3% 1.4 10.0%Rural, Adjacent 3.0 19.1% 2.0 13.1%
Urban 20.1 15.5% 15.7 12.1%
1997Total 26.8 16.7% 18.6 11.6%
Rural, Non-Adjacent 3.2 22.6% 1.3 9.4%Rural, Adjacent 2.7 16.8% 2.0 12.7%
Urban 20.9 16.0% 15.3 11.7%
1998Total 26.2 16.2% 17.3 10.7%
Rural, Non-Adjacent 3.2 22.1% 1.4 9.5%Rural, Adjacent 2.6 16.6% 1.4 8.9%
Urban 20.4 15.5% 14.6 11.1%
Uninsured(millions)
Full-Year and Part-Year Uninsured Rates Among Nonelderly AdultsTable 9
by Residence, 1996-1998
Uninsured Full Year Uninsured Part Year
64

Workers Percent of Percent of Uninsured(millions) Workers Uninsured Rate
Total - Workers 11.5 100.0% 2.6 100.0% 22.8%
Employment Status Full-time Workerd 8.0 69.9% 1.5 59.1% 19.3%Part-time Worker 3.5 30.2% 1.1 40.9% 30.9%
Worker's Wages <$7 per Hour
$7 per Hour or More 3.3 33.4% 1.2 60.4% 37.3%6.5 66.6% 0.8 39.6% 12.3%
Firm Size <20 Employees
20 Employees or More 5.1 46.1% 1.7 68.2% 33.1%5.9 53.9% 0.8 31.8% 13.2%
Rural Adjacent CountiesTotal - Workers 12.0 100.0% 2.0 100.0% 16.4%
Employment StatusFull-time Worker 9.0 74.5% 1.3 65.3% 14.4%Part-time Worker 3.1 25.5% 0.7 34.7% 22.4%
Worker's Wages<$7 per Hour
$7 per Hour or More 2.8 25.9% 0.9 53.1% 32.4%8.1 74.1% 0.8 46.9% 10.0%
Firm Size <20 Employees
20 Employees or More 4.6 39.5% 1.1 57.5% 23.9%7.0 60.5% 0.8 42.6% 11.6%
Urban CountiesTotal - Workers 104.7 100.0% 17.6 100.0% 16.8%
Employment Status Full-time Worker 77.4 73.9% 11.5 65.5% 14.9%Part-time Worker 27.3 26.1% 6.1 34.5% 22.3%
Worker's Wages<$7 per Hour 17.1 18.6% 6.0 39.8% 34.7%
$7 per Hour or More 75.0 81.4% 9.0 60.2% 12.0%
Firm Size<20 Employees 36.4 36.6% 9.1 56.1% 25.0%
20 Employees or More 63.0 63.4% 7.1 43.9% 11.3%
Table 10Characteristics (Hours, Wages, and Firm Size)
by Three County Levels, 1998
Rural Non-Adjacent Counties
of All Workers and Uninsured Workers,
Uninsured(millions)
65

Workers Percent of Percent of Uninsured(millions) Workers Uninsured Rate
Total - Workersd 23.5 100.0% 4.6 100.0% 19.5%
IndustryConstruction and Repair Services 2.6 11.0% 1.0 21.9% 39.0%
Finance & Public Administration 2.3 9.7% 0.2 4.7% 9.4%Manufacturing & Mining 4.7 19.9% 0.6 13.2% 13.0%
Natural Resourcese 1.0 4.4% 0.3 6.8% 30.4%Personal Services & Entertainment 1.1 4.7% 0.3 7.4% 30.7%Professional Services and Utilities 7.8 33.4% 0.9 20.3% 11.9%
Sales 3.9 16.7% 1.2 26.3% 30.8%
OccupationCraftsmen & Foremen 2.7 11.5% 0.6 12.6% 21.4%
Clerical 2.4 10.4% 0.2 5.4% 10.2%Laborers and Farm Laborers 1.8 7.7% 0.7 15.2% 39.4%Managerial & Administrative 3.2 13.8% 0.7 15.2% 21.6%
Operatives & Transport Operatives f 3.6 15.5% 0.8 16.5% 20.8%Professional & Technical 3.8 16.0% 0.3 6.5% 8.0%
Sales 2.3 9.7% 0.4 9.3% 18.7%Service 3.6 15.5% 0.9 19.6% 25.7%
Total - Workers 104.7 100.0% 17.6 100.0% 16.8%
IndustryConstruction and Repair Services 15.5 14.8% 4.6 26.4% 30.0%
Finance & Public Administration 12.0 11.5% 0.7 4.0% 5.8%Manufacturing & Mining 16.3 15.6% 1.8 10.0% 10.8%
Natural Resourcese 1.9 1.8% 0.6 3.4% 35.1%Personal Services & Entertainment 5.1 4.9% 1.5 8.5% 31.2%Professional Services and Utilities 34.1 32.6% 3.7 21.0% 11.0%
Sales 19.7 18.8% 4.7 26.7% 25.6%
OccupationCraftsmen & Foremen 10.9 10.4% 2.7 15.5% 25.1%
Clerical 14.7 14.0% 1.7 9.7% 11.6%Laborers and Farm Laborers 5.2 5.0% 1.9 10.6% 35.6%Managerial & Administrative 17.1 16.3% 1.2 7.1% 7.3%
Operatives & Transport Operatives f 9.9 9.5% 2.1 11.8% 20.9%Professional & Technical 21.4 20.4% 2.0 11.2% 9.2%
Sales 11.9 11.4% 2.1 11.9% 17.6%Service 13.6 13.0% 4.0 22.5% 29.1%
Refer to Table Endnotes for description of industry and occupation groups.
All Rural Counties
Urban Counties
Table 11Characteristics (Industry and Occupation)
of All Workers and Uninsured Workers,Rural vs. Urban, 1998
Uninsured(millions)
66

Workers Percent of Offered & Offer(millions) Workers Eligible Rate *
(millions)
Rural Non-Adjacent Counties
Total - Workers 10.3 100.0% 6.1 59.0%
Employment StatusFull-time Workerd 7.3 71.3% 5.0 68.4%Part-time Worker 2.9 28.7% 1.1 36.0%
Worker's Wages<$7 per Hour 3.1 33.2% 1.0 32.0%
$7 per Hour or More 6.3 66.8% 4.9 77.0%
Firm Size<20 Employees 4.1 42.0% 1.5 36.4%
20 Employees or More 5.7 58.0% 4.3 76.0%
Rural Adjacent Counties
Total - Workers 11.0 100.0% 7.3 65.9%
Employment StatusFull-time Worker 8.3 75.1% 6.3 76.5%Part-time Worker 2.7 24.9% 0.9 33.8%
Worker's Wages<$7 per Hour 2.7 25.9% 0.8 30.4%
$7 per Hour or More 7.8 74.1% 6.3 81.5%
Firm Size<20 Employees 3.9 36.2% 1.7 43.2%
20 Employees or More 6.8 63.8% 5.4 78.9%
Urban Counties Total - Workers 95.1 100.0% 65.6 69.0%
Employment StatusFull-time Worker 70.8 74.5% 55.9 79.0%Part-time Worker 24.3 25.5% 9.7 40.0%
Worker's Wages<$7 per Hour 16.1 18.3% 5.2 32.5%
$7 per Hour or More 72.0 81.7% 57.0 79.3%
Firm Size<20 Employees 29.8 33.0% 14.1 47.1%
20 Employees or More 60.5 67.0% 48.7 80.5%
Based on question asked of all working respondents (except the self-employed) as to whether health benefits were offered to them.
Access to Employer-Sponsored Insurance Among Workers Table 12
(excluding self-employed) by Hours, Wages, and Firm Size -- Three County Levels, 1998
67

Percent Offered & Offerof Eligible Rate*
Workers (millions)
All Rural Counties
Total - Workersd 21.3 100.0% 13.4 63.0%
IndustryConstruction & Repair Services 2.1 9.8% 1.0 47.4%Finance & Public Administration 2.1 10.0% 1.7 78.8%
Manufacturing & Mining 4.3 20.1% 3.5 81.2%Natural Resources 0.7 3.4% 0.3 34.4%
Personal Services & Entertainment 0.9 4.3% 0.3 27.1%Professional Services & Utilities 7.3 34.1% 5.1 69.4%
Sales 3.9 18.4% 1.6 40.0%
OccupationCraftsmen & Foremen 2.3 10.9% 1.8 75.4%
Clerical 2.3 10.9% 2.7 71.8%Laborers & Farm Laborers 1.7 7.8% 0.7 42.4%
Managerial & Administrative 2.7 12.5% 1.7 62.5%Operatives & Transport Operatives 3.3 15.3% 2.3 69.1%
Professional & Technical 3.3 15.4% 2.7 79.4%Sales 2.1 9.9% 0.9 40.6%
Service Workers 3.4 16.1% 1.6 47.0%
Urban Counties
Total - Workers 95.1 100.0% 65.6 69.0%
IndustryConstruction & Repair Services 13.1 13.8% 7.5 55.9%Finance & Public Administration 11.2 11.8% 9.2 81.4%
Manufacturing & Mining 15.4 16.2% 13.5 85.9%Natural Resourcese 1.5 1.6% 0.5 32.4%
Personal Services & Entertainment 4.1 4.3% 1.7 40.3%Professional Services & Utilities 31.3 32.9% 23.8 74.5%
Sales 18.4 19.4% 9.4 50.0%
OccupationCraftsmen & Foremen 9.5 10.0% 6.5 68.8%
Clerical 13.7 14.4% 10.1 72.8%Laborers & Farm Laborers 4.9 5.2% 2.0 42.6%
Managerial & Administrative 14.9 15.7% 12.1 80.0%Operatives & Transport Operativesf 8.7 9.2% 6.8 76.6%
Professional & Technical 18.8 19.8% 15.5 80.8%Sales 11.3 11.9% 6.2 54.3%
Service Workers 12.7 13.4% 6.0 47.1%
*Based on question asked of all working respondents (except the self-employed) as to whether health benefits were offered to them.
Refer to the Table Endnotes for description of industry and occupation groups.
Table 13
Workers(millions)
Rural vs. Urban, 1998
Access to Employer-Sponsored Insurance Among Workers(excluding self-employed) by Industry and Occupation --
68

ENDNOTES TO TABLES
The Public Insurance category, and in some figures Medicaid/Other Public,used throughout this chartbook includes Medicaid, S-CHIP, Medicare, and TriCare.
a Nonelderly includes U.S. residents aged 0-64, excluding those incarcerated or living in institutions.
b Family income is measured as a percentage of the federal poverty level (FPL) which was $13,650 for a family of three in 1998.
c The MEPS asks the marital status of every respondent aged 16 and older.
d Full-time workers were defined as those working 40 or more hours per week while part-time workers are those working less than 40 hours.
e Natural Resource industries include agriculture, fishing and forestry.
f Operatives typically work with specialized machinery such as factory equipment. Transport operatives include: truck drivers, train engineers, and other workers trained to operate moving vehicles.
e
69

Methods Appendix Data Sources This chartbook relies on data and analyses from the Agency for Healthcare Research and Quality’s Medical Expenditure Panel Survey (MEPS) for the years 1996-1999. While the data portray an economic era (1996-1998) quite different from our current economy, these were the only national data with sufficient information to divide rural America into at least two subgroups. The fact that using it required access to restricted data (for individual privacy concerns) is indicative of the challenges in conducting research on rural issues. However, studies relying on data that do not contain geographic identification have produced findings in the past that masked substantial differences in health coverage and even missed the factors that contribute to these differences. The MEPS is a nationally representative survey consisting of four components, with a sample drawn from the prior years’ National Health Interview Survey. The data for this project are derived from the Household Component, which collects information from more than 10,000 households annually on a wealth of topics, including: health insurance coverage, health status, employment status and characteristics, socio-economic characteristics, health care use and expenditures. We selected the MEPS for this study because it contains a wider array of health insurance and health care related data than can be found in other national surveys, and may be used to make national estimates for a host of relevant indicators. Because the MEPS public use files contain only a dichotomous measure of rural residence (Metropolitan Statistical Area or Non-Metropolitan Statistical Area county), we applied to the Agency for Healthcare Research and Quality (AHRQ) for access to restricted data that could be linked to a more refined rural classification system. We obtained permission to use these data with the restriction that we analyzed them at a sufficiently aggregated level to ensure respondents’ confidentiality and maintain statistical integrity. The MEPS is designed so that households are interviewed approximately every four months, and consequently are asked to report on their health insurance coverage since the time of the last interview. As a result, the MEPS files contain month-by-month data on health insurance coverage that permit researchers to measure health insurance in a variety of ways. In this chartbook, we primarily measure health insurance at a point in time (e.g., December) in order to obtain a cross-sectional picture of the uninsured. However, recognizing that spells without health insurance can vary dramatically in length, we also measure the number of individuals who are uninsured over the course of an entire year. Data were analyzed and weighted using the mortality and poverty-adjusted weights created by the AHRQ. We calculated all standard errors using SUDAAN, a statistical software package developed by the Research Triangle Institute to analyze clustered data including household surveys such as the MEPS. Unless stated otherwise, all findings based on our own analyses of the MEPS data that are discussed in the chartbook met or exceeded our standard of statistical significance of p ≤ .05 level.
71

Defining Rural There are multiple methods for defining rural and urban areas that are used in analyzing national data. For example, the U.S. Census Bureau has defined urban as “all territory, population, and housing units in urbanized areas and in places of 2,500 or more persons outside urbanized areas.” Places not meeting this definition are, by default, rural. In contrast, the U.S. Office of Management and Budget has designated each U.S. County as “metropolitan” or “non-metropolitan” based on population. These definitions are frequently included in public use files of national health data sets and hence are commonly used to conduct rural-urban comparisons of health insurance coverage. Studies using these definitions lack the ability to distinguish between different levels of rural, however. Other definitions of rural have improved the ability of researchers to identify and describe rural areas and populations. The Rural-Urban Continuum Codes created six levels of rural counties, based on their level of urbanization and proximity to an urban county. The U. S. Department of Agriculture’s, Urban Influence Codes are similar and have organized urban into two categories and rural into seven. In this definition, rural counties are classified based on the size of their largest city, whether it is adjacent or not adjacent to a metropolitan area, and whether that metropolitan area is large or small. This chartbook uses the Urban Influence Codes as our measurement of rurality. However, because of the relatively small rural sample in the MEPS, we were unable to use the full classification and chose to aggregate rural counties based on their adjacency to a metropolitan area (See Table 1). We chose to emphasize adjacency rather than population size, because being near a more centralized and highly populated area may provide rural residents with greater access to economic opportunities and health care services, while rural areas not adjacent to these metropolitan areas are more isolated. In this way, we hoped to tease out some of the differences between types of rural areas that are often masked by more aggregate definitions. Challenges of Rural Health Research Although utilizing national health surveys provides researchers with a more detailed picture of health and health care issues facing rural Americans, using these types of surveys also presents several problems. First, due to the high costs associated with surveying rural areas, many national surveys under-represent the rural population. Schur, Good and Berk found that national health surveys, such as the MEPS, the National Heath Interview Survey, the National Long Term Care Survey, and the Medicare Current Beneficiary Survey, have rural samples that represent 15 to 20 percent of the total sample. However, the rural population represents 20 to 25% of the total U.S. population. These sample sizes are typically adequate for estimating the number of rural uninsured, but make examining subgroups of the rural population (such as estimating uninsured rates for frontier areas), or examining the interactive effects of personal characteristics and insurance status on access to health care difficult, if not impossible. Using national surveys to study rural health issues can also be hampered by concerns about confidentiality. Due to smaller sample sizes, public use data for these national surveys often have a limited number of geographic identifiers. As a result, many national, public use data permit only the most basic analyses into rural and urban differences.
72

In completing the analysis for this chartbook we faced both of these challenges. Because of concerns about confidentiality and statistical power, the public use data files of the MEPS include only a metropolitan/non-metropolitan definition for rural-urban residence. To obtain access to Urban Influence-coded data, we obtained permission to use restricted data on-site at the AHRQ Data Center. As a result, although MEPS public use data is available through 2000, most of our analyses are from 1996-1998 because 1998 was the last year of data that was fully geo-coded at the time we conducted the analyses for this project. In addition to the timing of the data, confidentiality and statistical issues dramatically impeded our ability to make detailed rural-urban or rural-rural comparisons. For example, although we recognize that region of the country plays an important role in health insurance coverage and access to care, sample sizes did not permit us to analyze how rates of insurance differ by rural-urban location in different parts of the country. Similarly, because prior research has demonstrated that minority status is highly correlated with health insurance coverage, we wanted to examine the differences in coverage by race and ethnicity across different levels of rural. However, sample sizes precluded us from looking at race/ethnicity beyond the very gross measurement of “white, non-Hispanic” and “racial/ethnic minority”. Further efforts are needed to make national data sets more meaningful for rural health research. For policy interventions to be most effective across all different types of rural communities, we need to develop a substantially greater understanding of the health insurance, access, and health care needs of rural Americans. Table 1: Geographic Levels Used in This Chartbook Urban-Influence Code (UIC) Modified UIC
Used in Analyses 1 Counties in large metropolitan areas of 1 million or more residents 2 Counties in small metropolitan areas of less than 1 million residents Urban
3 Adjacent to a large metro area and contains all or part of its own city of 10,000 or more residents
4 Adjacent to a large metro area and does not contain any part of a city of 10,000 or more residents
5 Adjacent to a small metro area and contains all or part of its own city of 10,000 or more residents
6 Adjacent to a small metro area and does not contain any part of a city of 10,000 or more residents
Rural, Adjacent
7 Not adjacent to a metro area and contains all or part of its own city of 10,000 or more residents
8 Not adjacent to a metro area and contains all or part of its own town of 2,500 to 9,999 residents
9 Totally rural, does not contain any part of a town of 2,500+ residents
Rural, Not Adjacent
SOURCE: A County-Level Measure of Urban Influence. Linda M. Ghelfi and Timothy S. Parker. Rural Economy Division, Economic Research Service, U.S. Department of Agriculture. ERS Staff Paper No. 9702. February 1997.
73


The Kaiser Commission on Medicaid and the Uninsured serves as a policy institute and forum for analyzinghealth care coverage and access for the low-income population and assessing options for reform. TheCommission, begun in 1991, strives to bring increased public awareness and expanded analytic effort to thepolicy debate over health coverage and access, with a special focus on Medicaid and the uninsured. TheCommission is a major initiative of The Henry J. Kaiser Family Foundation and is based at the Foundation’sWashington, DC office.
The Edmund S. Muskie School of Public Service at the University of Southern Maine educates leaders inpublic policy, health policy, and community planning and development. The School’s Institute for Health Policyconducts nationally recognized health services research and policy analysis that informs state and nationalhealth policy development. The Institute’s research and policy agenda spans a wide range of topics related tothe structure, financing and delivery of health services. More information on the Muskie School is available atwww.muskie.usm.maine.edu.
The Henry J. Kaiser Family Foundation is an independent, national health philanthropy dedicated toproviding information and analysis on health issues to policymakers, the media, and the generalpublic. The Foundation is not associated with Kaiser Permanente or Kaiser Industries.
p / / g

HEALTH INSURANCE COVERAGEIN RURAL AMERICA
CHARTBOOK
September 20031330 G Street, NWWashington,DC 20005
(202) 347-5270 Fax: (202) 347-5274www.kff.org/kcmu
A d d i t i o n a l c o p i e s o f t h i s p u b l i c a t i o n ( # 4 0 9 3 ) a r e a v a i l a b l e o n t h e
K a i s e r F a m i l y F o u n d a t i o n ’ s w e b s i t e a t w w w. k f f . o r g .
p / / g