Embed Size (px)
Citation preview

Health Impact Assessment of Coal and Clean Energy Options in Kentucky
A Report from Kentucky Environmental FoundationBy Elizabeth Walker, PhD
Deborah Payne, MPH
i
AcknowledgementsThe authors thankfully acknowledge the following experts for reviews and comments on drafts of this report:
Carla Baumann, MSN, RN Philip Curd, M.D., MSPH Richard Futrell, PhD Michael Hendryx, PhD David Mannino, MD John Patterson, MD, MSPH Monica Unseld, PhD
Any remaining errors are entirely our own.
The authors also thank contributions of interviews carried out by students of Berea College’s Health in Appalachia course (HEA/APS 210), Fall 2010 and 2011.
About Kentucky Environmental Foundation:
The Kentucky Environmental Foundation (KEF) is a non-pro!t organization dedicated to securing solutions to environmental problems in a manner, which safeguards human health, promotes environmental justice, preserves ecological systems and encourages sustainability.
Design and layout: Rob Gorstein Graphic Design, Inc.
i Health Impact Assessment of Coal and Clean Energy Options in Kentucky
iiiiA Report from Kentucky Environmental Foundation
Table of Contents
Introduction .......................................................................................................................1
Executive Summary ............................................................................................................3
Health Impacts of Coal Mining ............................................................................................5
1. Surface mining ...........................................................................................................6
a. Heavy metals and acid mine drainage: water contamination .......................................7
b. Dust .......................................................................................................................9
c. Flooding and accidents ............................................................................................9
d. Psychological effects of mountaintop mining ...........................................................10
2. Deep coal mining ......................................................................................................12
a. Slurry and slurry pond "ooding ...............................................................................15
Health Impacts of Coal Processing and Transportation .......................................................16
Health Impacts of Power Plant Emissions ..........................................................................18
1. Particulates ..............................................................................................................18
2. Mercury emissions ....................................................................................................20
3. Greenhouse gas emissions ........................................................................................22
Health Impacts of Coal Waste ...........................................................................................23
Health Impacts of Energy Efficiency And Renewable Energies ............................................25
Recommendations ............................................................................................................32
References .......................................................................................................................33
Executive SummaryIntroduction
If we Kentuckians value our health, and if Kentucky legislators are concerned with improving public health, it is imperative that community and state leaders examine the role of energy policy in determining health outcomes. Governments and institutions are increasingly using Health Impact Assessments (HIA) as tools to help make policy decisions in the best interest of public health. Using both quantitative and qualitative data, an HIA can arrive at policy recommendations or propose a speci!c course of action to create the best health outcome possible.
Energy policy in Kentucky has typically been designed to maintain the use of coal, a resource that currently provides roughly 93-94% of Kentucky’s electricity. Kentucky legislators have given less attention to the speci!c health bene!ts and consequences of our energy options. "is HIA provides a health-based screening of coal, and of the energy e#ciency and renewable energy options proposed in the Clean Energy Opportunity Act as introduced in the 2011 and 2012 Kentucky legislative sessions.
Findings. Coal has provided reliable electricity to Kentuckians for decades and has provided many Kentuckians with the bene!ts of employment, but at a substantial cost to the health of people in the Commonwealth. Public health is a$ected throughout the coal cycle from mining to waste disposal: Mountaintop mining exposes people to air pollution,
contamination of groundwater and drinking water, %ooding, structural damage to homes, and accidents.
Miners working in deep coal mines are exposed to high levels of dust, noise, and toxic gasses, leading to respiratory damage and hearing damage.
After coal is extracted, it is cleaned with a chemical wash. Any hazardous chemicals remaining from the wash are stored in ponds or injected into abandoned mines, both of which may leak into streams, rivers, and groundwater. Spills may involve millions of gallons, leading to %ooding of toxic chemicals.
Coal is transported by rail or trucks, which has led to accidents and respiratory disease from coal dust and diesel combustion.
Impacts from coal power plants can be measured up to hundreds of miles from the source. Gaseous emissions and particulate matter can a$ect the heart,
lungs, and nervous system, as well as damage prenatal development. Coal-!red power plants also emit mercury, a toxicant that can have signi!cant negative e$ects on the nervous system, especially in fetuses, infants, and children. Individuals can experience loss of intelligence that can last a lifetime, in addition to other nervous system disabilities.
Coal extraction and burning processes release greenhouse gases like carbon dioxide and methane, which are linked to climate change. Climate change impacts public health through heat strokes, %ooding, loss of crops, and increased spread of diseases.
Remaining coal ash contains toxic metals such as arsenic and cadmium. "is is stored in impoundment ponds and land!lls across Kentucky. "ese toxic metals can leak into water supplies or blow into the air, causing cancer and other health problems.
Electricity can also be generated from renewable sources such as solar, wind, hydro and biomass, and these sources may also have some health impacts. For example, solar panel manufacturing involves use of many heavy metals and chemicals (as in other electronics manufacturing) and as such poses occupational exposure risks. Low-frequency noise and vibrations from wind turbines have been reported to cause disturbances to some people living close by. Biomass can involve combustion of fuel sources like wood and switchgrass or other materials, which result in air emissions that may be harmful depending on the fuel used.
Energy e#ciency is not an electricity source, rather refers to methods of using electricity from any source more e#ciently. Home weatherization, energy e#cient appliances and lighting are common examples of energy e#ciency. Health impacts from energy e#ciency activities may come from exposure to chemicals in construction or building materials, as would be the case generally with any new building construction or retro!t.
Scienti!c and health research clearly show that the bene!cial impacts of energy e#ciency and renewable energy are often realized in the avoidance of additional pollution from coal. Displacement of pollution at each step in the coal cycle means lower rates of worker illness or injury. Lower levels of soot, heavy metals, greenhouse gases and other harmful emissions can directly reduce the number of heart attacks and asthma attacks. In addition to the health
11 Health Impact Assessment of Coal and Clean Energy Options in Kentucky

RecommendationsBased on these !ndings, we recommend:1. Kentucky legislators should support diversi!cation
of Kentucky’s energy portfolio to include renewable energy from sources such as solar, wind or hydro, and provide incentives for Kentuckians to use energy more e#ciently. "ese portfolio standards would displace pollution from coal and provide additional direct health bene!ts to Kentucky residents. Policy proposals like the Clean Energy Opportunity Act (HB 167) of 2012 could help shift toward a healthier energy portfolio.
2. Kentucky legislators and environmental regulatory agencies should consider the health impacts of our state’s current and future energy policy and consider requiring that HIAs be utilized as a part of any future electricity generation policy process. "e HIA methodology and !ndings will help ensure that public health improvements are a priority policy outcome.
bene!ts of pollution prevention, tangible bene!ts from energy e#ciency can be observed. Bene!ts include those from home weatherization, which results in fewer incidences of general illnesses, and reduction in eye-strain and headaches when energy e#cient lighting is used.
Research also shows that avoiding the use of less- or non-toxic chemicals and materials can mitigate some of the potential health impacts associated with energy e#ciency. Renewable energy health impacts can be addressed at the manufacturing or installation phase or in the case of biomass, by choosing non-toxic renewable fuels.
"e HIA authors and reviewers intend for this document to serve as a tool primarily for Kentucky legislators to consider health outcomes of energy policy such as the Clean Energy Opportunity Act and other future proposed policies, and make decisions as though we value public health: because we should.
22A Report from Kentucky Environmental Foundation
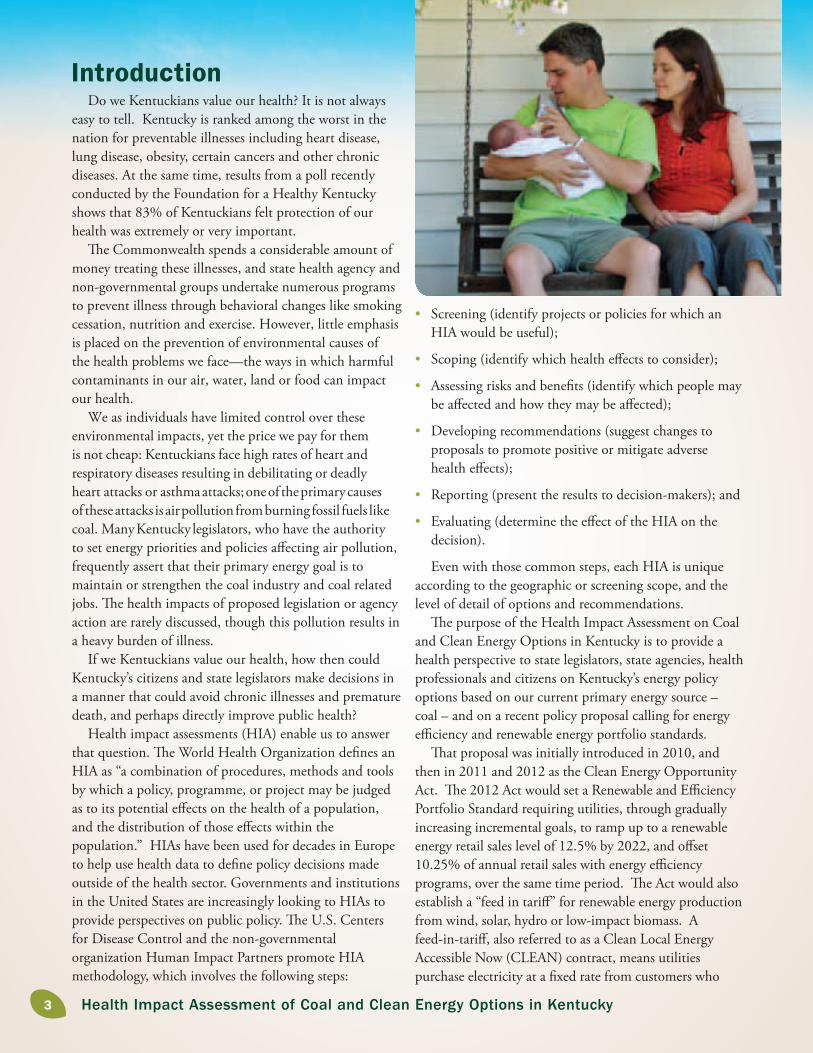
IntroductionDo we Kentuckians value our health? It is not always
easy to tell. Kentucky is ranked among the worst in the nation for preventable illnesses including heart disease, lung disease, obesity, certain cancers and other chronic diseases. At the same time, results from a poll recently conducted by the Foundation for a Healthy Kentucky shows that 83% of Kentuckians felt protection of our health was extremely or very important.
"e Commonwealth spends a considerable amount of money treating these illnesses, and state health agency and non-governmental groups undertake numerous programs to prevent illness through behavioral changes like smoking cessation, nutrition and exercise. However, little emphasis is placed on the prevention of environmental causes of the health problems we face—the ways in which harmful contaminants in our air, water, land or food can impact our health.
We as individuals have limited control over these environmental impacts, yet the price we pay for them is not cheap: Kentuckians face high rates of heart and respiratory diseases resulting in debilitating or deadly heart attacks or asthma attacks; one of the primary causes of these attacks is air pollution from burning fossil fuels like coal. Many Kentucky legislators, who have the authority to set energy priorities and policies a$ecting air pollution, frequently assert that their primary energy goal is to maintain or strengthen the coal industry and coal related jobs. "e health impacts of proposed legislation or agency action are rarely discussed, though this pollution results in a heavy burden of illness.
If we Kentuckians value our health, how then could Kentucky’s citizens and state legislators make decisions in a manner that could avoid chronic illnesses and premature death, and perhaps directly improve public health?
Health impact assessments (HIA) enable us to answer that question. "e World Health Organization de!nes an HIA as “a combination of procedures, methods and tools by which a policy, programme, or project may be judged as to its potential e$ects on the health of a population, and the distribution of those e$ects within the population.” HIAs have been used for decades in Europe to help use health data to de!ne policy decisions made outside of the health sector. Governments and institutions in the United States are increasingly looking to HIAs to provide perspectives on public policy. "e U.S. Centers for Disease Control and the non-governmental organization Human Impact Partners promote HIA methodology, which involves the following steps:
Screening (identify projects or policies for which an HIA would be useful);
Scoping (identify which health e$ects to consider);
Assessing risks and bene!ts (identify which people may be a$ected and how they may be a$ected);
Developing recommendations (suggest changes to proposals to promote positive or mitigate adverse health e$ects);
Reporting (present the results to decision-makers); and
Evaluating (determine the e$ect of the HIA on the decision).
Even with those common steps, each HIA is unique according to the geographic or screening scope, and the level of detail of options and recommendations.
"e purpose of the Health Impact Assessment on Coal and Clean Energy Options in Kentucky is to provide a health perspective to state legislators, state agencies, health professionals and citizens on Kentucky’s energy policy options based on our current primary energy source – coal – and on a recent policy proposal calling for energy e#ciency and renewable energy portfolio standards.
"at proposal was initially introduced in 2010, and then in 2011 and 2012 as the Clean Energy Opportunity Act. "e 2012 Act would set a Renewable and E#ciency Portfolio Standard requiring utilities, through gradually increasing incremental goals, to ramp up to a renewable energy retail sales level of 12.5% by 2022, and o$set 10.25% of annual retail sales with energy e#ciency programs, over the same time period. "e Act would also establish a “feed in tari$” for renewable energy production from wind, solar, hydro or low-impact biomass. A feed-in-tari$, also referred to as a Clean Local Energy Accessible Now (CLEAN) contract, means utilities purchase electricity at a !xed rate from customers who
33 Health Impact Assessment of Coal and Clean Energy Options in Kentucky
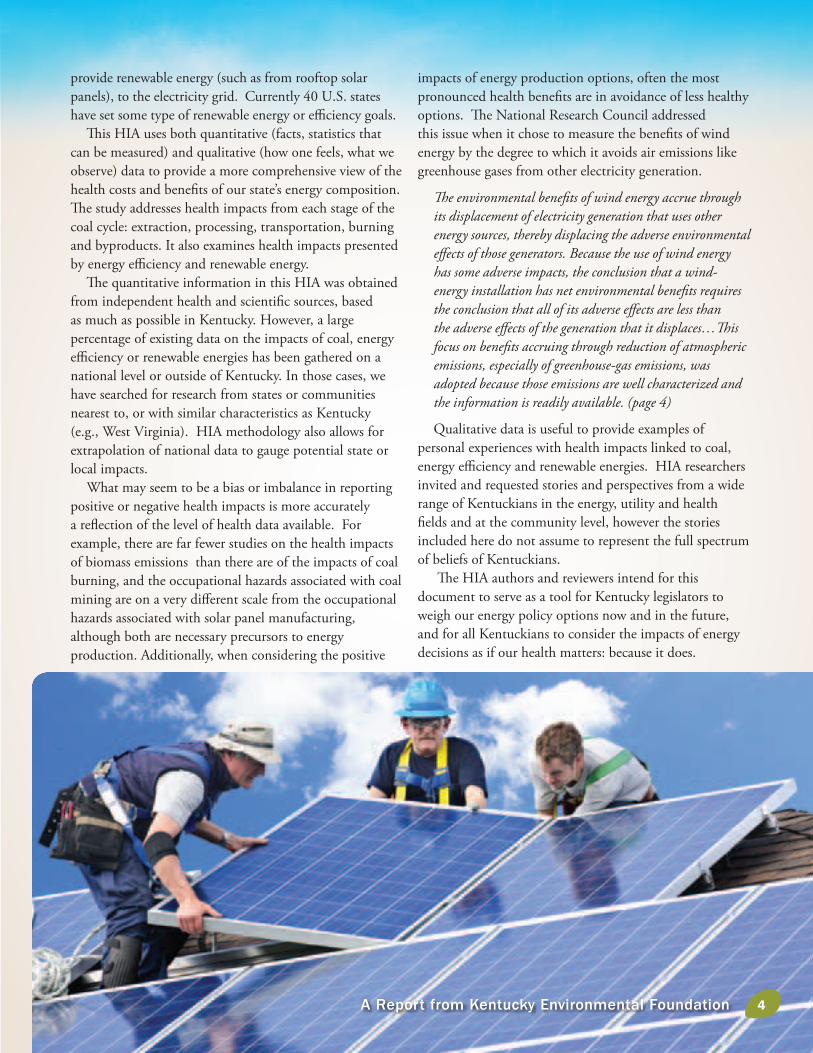
provide renewable energy (such as from rooftop solar panels), to the electricity grid. Currently 40 U.S. states have set some type of renewable energy or e#ciency goals.
"is HIA uses both quantitative (facts, statistics that can be measured) and qualitative (how one feels, what we observe) data to provide a more comprehensive view of the health costs and bene!ts of our state’s energy composition. "e study addresses health impacts from each stage of the coal cycle: extraction, processing, transportation, burning and byproducts. It also examines health impacts presented by energy e#ciency and renewable energy.
"e quantitative information in this HIA was obtained from independent health and scienti!c sources, based as much as possible in Kentucky. However, a large percentage of existing data on the impacts of coal, energy e#ciency or renewable energies has been gathered on a national level or outside of Kentucky. In those cases, we have searched for research from states or communities nearest to, or with similar characteristics as Kentucky (e.g., West Virginia). HIA methodology also allows for extrapolation of national data to gauge potential state or local impacts.
What may seem to be a bias or imbalance in reporting positive or negative health impacts is more accurately a re%ection of the level of health data available. For example, there are far fewer studies on the health impacts of biomass emissions than there are of the impacts of coal burning, and the occupational hazards associated with coal mining are on a very di$erent scale from the occupational hazards associated with solar panel manufacturing, although both are necessary precursors to energy production. Additionally, when considering the positive
impacts of energy production options, often the most pronounced health bene!ts are in avoidance of less healthy options. "e National Research Council addressed this issue when it chose to measure the bene!ts of wind energy by the degree to which it avoids air emissions like greenhouse gases from other electricity generation.
!e environmental bene"ts of wind energy accrue through its displacement of electricity generation that uses other energy sources, thereby displacing the adverse environmental e#ects of those generators. Because the use of wind energy has some adverse impacts, the conclusion that a wind-energy installation has net environmental bene"ts requires the conclusion that all of its adverse e#ects are less than the adverse e#ects of the generation that it displaces…!is focus on bene"ts accruing through reduction of atmospheric emissions, especially of greenhouse-gas emissions, was adopted because those emissions are well characterized and the information is readily available. (page 4)
Qualitative data is useful to provide examples of personal experiences with health impacts linked to coal, energy e#ciency and renewable energies. HIA researchers invited and requested stories and perspectives from a wide range of Kentuckians in the energy, utility and health !elds and at the community level, however the stories included here do not assume to represent the full spectrum of beliefs of Kentuckians.
"e HIA authors and reviewers intend for this document to serve as a tool for Kentucky legislators to weigh our energy policy options now and in the future, and for all Kentuckians to consider the impacts of energy decisions as if our health matters: because it does.
44A Report from Kentucky Environmental Foundation
Health Impacts of Coal MiningCoal based energy production has long been integrated
into the economics, culture and history of Kentucky. With 94% of the state’s energy generated by coal, families have depended on coal mining jobs for sources of income to feed, house and support families. Energy derived from coal has aided in the growth and development of Kentucky and the U.S. "e process of extracting coal from the Appalachian mountains and western coal!elds, while !nancially bene!cial to some, has had a direct impact on the health of Kentuckians, not only surface and deep miners, but also community members living in proximity to mining activities.
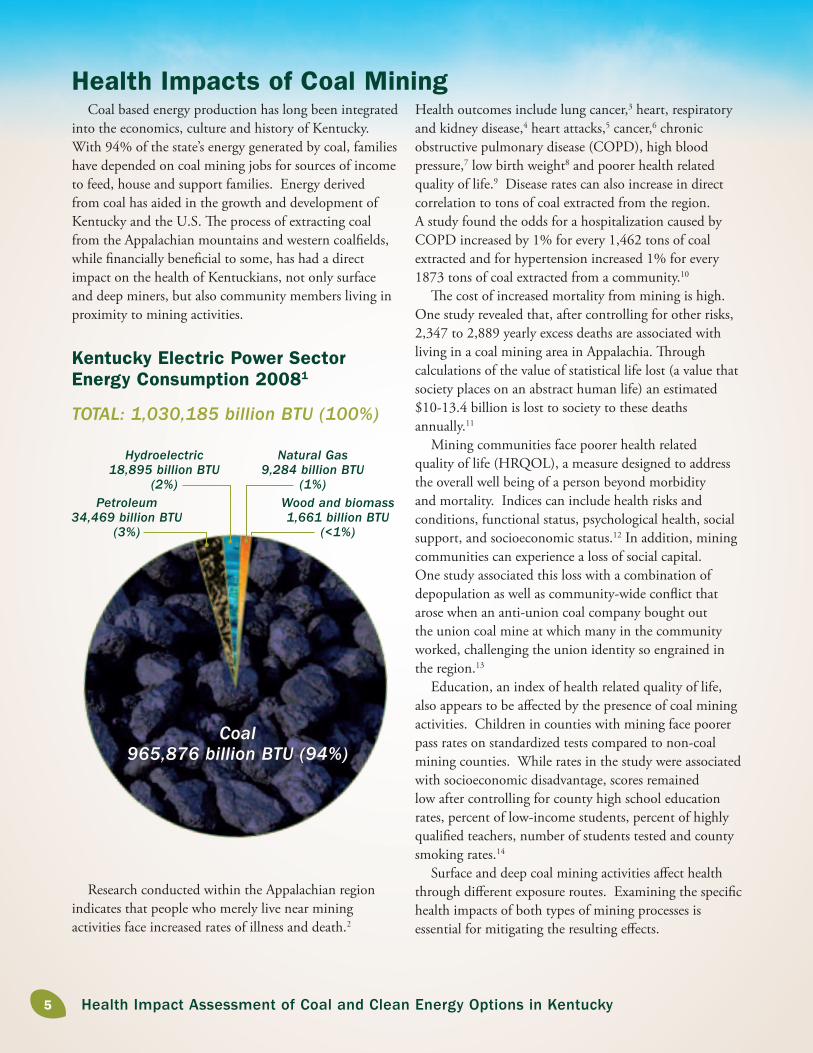
Kentucky Electric Power Sector Energy Consumption 20081
TOTAL: 1,030,185 billion BTU (100%)
Coal 965,876 billion BTU (94%)
Petroleum 34,469 billion BTU
(3%)
Hydroelectric 18,895 billion BTU
(2%)
Natural Gas 9,284 billion BTU
(1%)Wood and biomass 1,661 billion BTU
(<1%)
Health outcomes include lung cancer,3 heart, respiratory and kidney disease,4 heart attacks,5 cancer,6 chronic obstructive pulmonary disease (COPD), high blood pressure,7 low birth weight8 and poorer health related quality of life.9 Disease rates can also increase in direct correlation to tons of coal extracted from the region. A study found the odds for a hospitalization caused by COPD increased by 1% for every 1,462 tons of coal extracted and for hypertension increased 1% for every 1873 tons of coal extracted from a community.10
"e cost of increased mortality from mining is high. One study revealed that, after controlling for other risks, 2,347 to 2,889 yearly excess deaths are associated with living in a coal mining area in Appalachia. "rough calculations of the value of statistical life lost (a value that society places on an abstract human life) an estimated $10-13.4 billion is lost to society to these deaths annually.11
Mining communities face poorer health related quality of life (HRQOL), a measure designed to address the overall well being of a person beyond morbidity and mortality. Indices can include health risks and conditions, functional status, psychological health, social support, and socioeconomic status.12 In addition, mining communities can experience a loss of social capital. One study associated this loss with a combination of depopulation as well as community-wide con%ict that arose when an anti-union coal company bought out the union coal mine at which many in the community worked, challenging the union identity so engrained in the region.13
Education, an index of health related quality of life, also appears to be a$ected by the presence of coal mining activities. Children in counties with mining face poorer pass rates on standardized tests compared to non-coal mining counties. While rates in the study were associated with socioeconomic disadvantage, scores remained low after controlling for county high school education rates, percent of low-income students, percent of highly quali!ed teachers, number of students tested and county smoking rates.14
Surface and deep coal mining activities a$ect health through di$erent exposure routes. Examining the speci!c health impacts of both types of mining processes is essential for mitigating the resulting e$ects.
Research conducted within the Appalachian region indicates that people who merely live near mining activities face increased rates of illness and death.2
55 Health Impact Assessment of Coal and Clean Energy Options in Kentucky

Health Impacts of Surface MiningKentuckians living near mountaintop mining (MTM)
sites are exposed to a wide range of health risks. "e mining process, which utilizes heavy explosives, creates large quantities of dust, a known respiratory irritant. Explosives including ammonium nitrate and fuel oil form toxic gasses including carbon monoxide (CO) and oxides of nitrogen (NOx). Carbon monoxide, an odorless, colorless gas that can cause asphyxiation and death, has been known to travel underground and poison area residents.15 Explosives can also fracture water tables leading to the contamination of drinking water by heavy metals, acid mine drainage and methane gas. Area watersheds are also contaminated when “over burden,” a byproduct from the explosions, is pushed into valleys and the headwaters of streams.16 Exposed coal seams are harvested with heavy machinery and hauled away by dump trucks carrying up to 120,000 tons. While regulations require trucks to cover the coal, many do not, thus releasing dust and rocks along roadways farther from the mining site.17
"ough state and federal regulations are established to minimize the impact of mining on surrounding communities, not all contaminants are contained on site. Contamination of air and water from mining activities may therefore serve as routes of exposure for a
range of toxins leading to the poorer health observed in surface mining areas.
Studies on mountaintop mining communities have indicated increased poverty and mortality disparities,18 birth defects,19 chronic cardiovascular disease mortality,20 higher rates of cancer21 and poorer HRQOL.22 Other health concerns include increased risk of %ooding resulting from land being stripped of trees and vegetation.23 Some communities have self-reported high numbers of gall bladder failure and tumors in eastern Kentucky 24, 25, 26 and cancer clusters have been observed where water quality has been degraded by mining.27 Mining explosions have fractured foundations on homes and %y rock and boulders have crashed into homes causing structural damage and loss of life.28 Such threats can also have a strong impact on psychological health inducing anxiety and fear.29
As of 2009, there were 249 licensed surface mines in operation in Kentucky,30 with approximately 61,721 acres of valley !lls covering over 1400 miles of streams.31 Signi!cant environmental degradation can impact the economic health of the region, an additional index of HRQOL. "is may reduce opportunities for alternative industries including tourism which could boost economics and result in higher HRQOL indexes.
(Photo credit: KFTC)
66A Report from Kentucky Environmental Foundation

Heavy metals and acid mine drainage: concerns around water contamination
Surface mining contaminates watersheds through multiple routes. In the process of coal extraction, vast new surfaces of rocks are exposed to the sun and rain. Acid mine drainage (AMD) forms through the biological oxidation of metal sul!des in mines or mining waste heaps. When rain washes over the acidi!ed exposed rocks, toxic elements can be released into the streams, groundwater and drinking water including arsenic, lead, aluminum, cadmium, selenium, manganese and copper. While some elements are essential for health in very small doses, all are toxic at a large dosage. "e pH in streams directly impacted by mountaintop mining can reach as low as 3 (the acidity of a lemon) turning water orange or brown and eliminating aquatic life. Coal ash is sometimes used to neutralize the acid. "is acidic environment can release the heavy metals bound within the ash causing them to leach out into the environment.32
Research by Lindberg and colleagues measured concentrations of major and trace elements within a watershed catchment covering 100 mining discharge outlets and approximately 28km of active and reclaimed surface coal mines on the Upper Mud River of West Virginia. A linear relationship was observed between contributions of run o$ from surface mining sites and increases in conductivity and the concentrations of selenium, sulfate, magnesium and other inorganic solutes. "e results of the study reveal the cumulative impacts of multiple surface mining sites on the region’s watersheds.33
Many rural communities in Kentucky’s mining regions are not connected to public water supplies and therefore depend on groundwater for basic water needs. Local residents have found, however, that when wells near mining sites are contaminated with heavy metals or gases, coal companies are resistant to provide compensation or remediation for this contamination.34 Reasons include the limited capacity to determine direction of water %ow within aquifers.
Erica Urias lives in a valley in Pike County, KY surrounded by mountaintop mining. Her husband’s family had lived on the land for many years and had always had clean well water. As surface mining started above their home they started to observe a change in the water. When tested, one well contained levels of arsenic 130 times the EPA’s maximum contamination level and another has turned orange from high levels of iron. “I bathed my daughter in the water with high levels of arsenic for the !rst three years of her life and I worry what e$ect it may have had on her. We’ve stopped using
The wells of four residents in Pike County, KY have been contaminated by mining activities with high levels of methane gas, sulfur and iron. Residents reported to local authorities in May of 2011 that the water would turn to black or orange, and burn the skin upon contact. Due to the high methane content the wells have been left to burn inde!nitely. The families have received compensation through a settlement with the mining company but have continued to rely on bottled water for their source of clean drinking water.37 Along with the psychological stress of the sounds of explosions beneath their homes, health concerns related to the contaminated water have included vomiting and hair falling out.38
Beverly May displays contaminated drinking water from her house in Wilson Creek, KY
(Pho
to cr
edit:
KFT
C)
77 Health Impact Assessment of Coal and Clean Energy Options in Kentucky
Increased rates of birth defects have been observed in Appalachian communities where mountain top removal mining methods are used. After controlling for socio-economic risks, smoking, level of education and other factors, mothers had a 26% higher risk of having a child with a birth defect than a mother living outside a mountain top mining community. Using National Center for Health Statistics natality !les, the study evaluated live births in four Central Appalachian states between 1996 and 2003. Types of birth defects observed included circulatory/respiratory, central nervous system, musculoskeletal, urogenital, gastrointestinal and ‘other.’ These defects became more pronounced in the latter time frame 2000-2003 suggesting that rates of birth defects will continue to increase as mountain top mining continues. Birth defect rates also increased the closer an individual lived to a mountain top mining site.40
Mountaintop Mining and Birth Defects
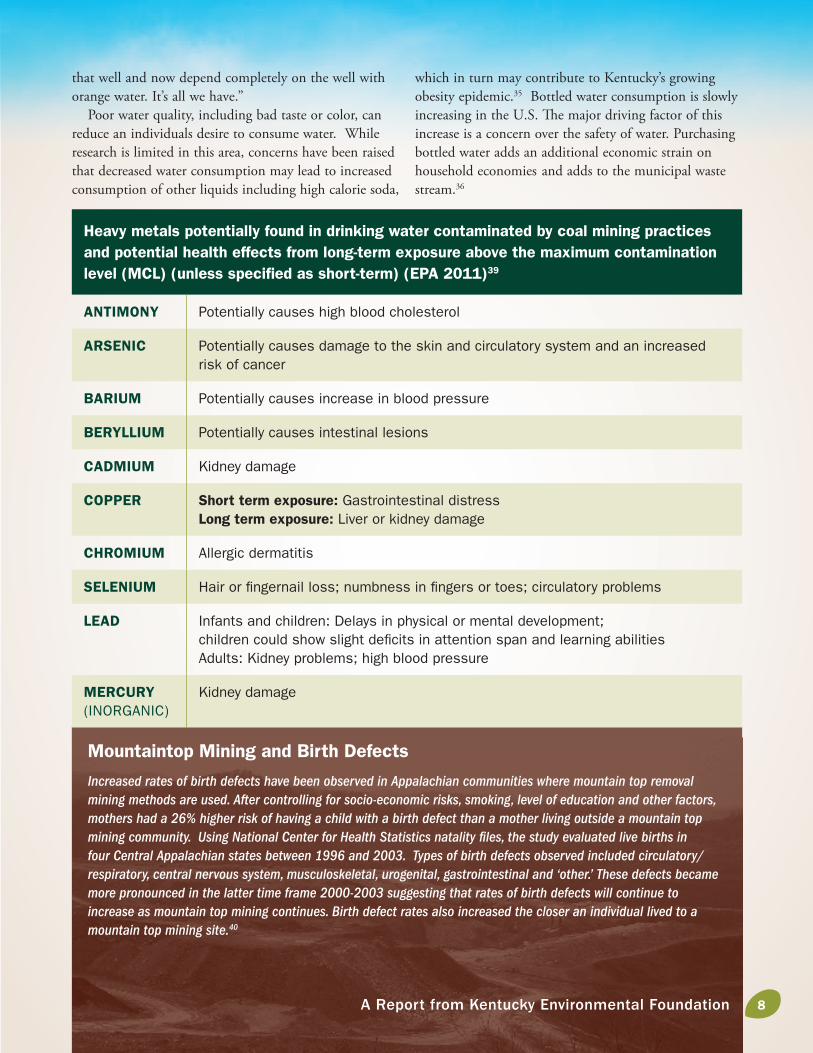
Heavy metals potentially found in drinking water contaminated by coal mining practices and potential health effects from long-term exposure above the maximum contamination level (MCL) (unless specified as short-term) (EPA 2011)39
ANTIMONY Potentially causes high blood cholesterol
ARSENIC Potentially causes damage to the skin and circulatory system and an increased risk of cancer
BARIUM Potentially causes increase in blood pressure
BERYLLIUM Potentially causes intestinal lesions
CADMIUM Kidney damage
COPPER Short term exposure: Gastrointestinal distress Long term exposure: Liver or kidney damage
CHROMIUM Allergic dermatitis
SELENIUM Hair or !ngernail loss; numbness in !ngers or toes; circulatory problems
LEAD Infants and children: Delays in physical or mental development; children could show slight de!cits in attention span and learning abilities Adults: Kidney problems; high blood pressure
MERCURY (INORGANIC)
Kidney damage
that well and now depend completely on the well with orange water. It’s all we have.”
Poor water quality, including bad taste or color, can reduce an individuals desire to consume water. While research is limited in this area, concerns have been raised that decreased water consumption may lead to increased consumption of other liquids including high calorie soda,
which in turn may contribute to Kentucky’s growing obesity epidemic.35 Bottled water consumption is slowly increasing in the U.S. "e major driving factor of this increase is a concern over the safety of water. Purchasing bottled water adds an additional economic strain on household economies and adds to the municipal waste stream.36
88A Report from Kentucky Environmental Foundation
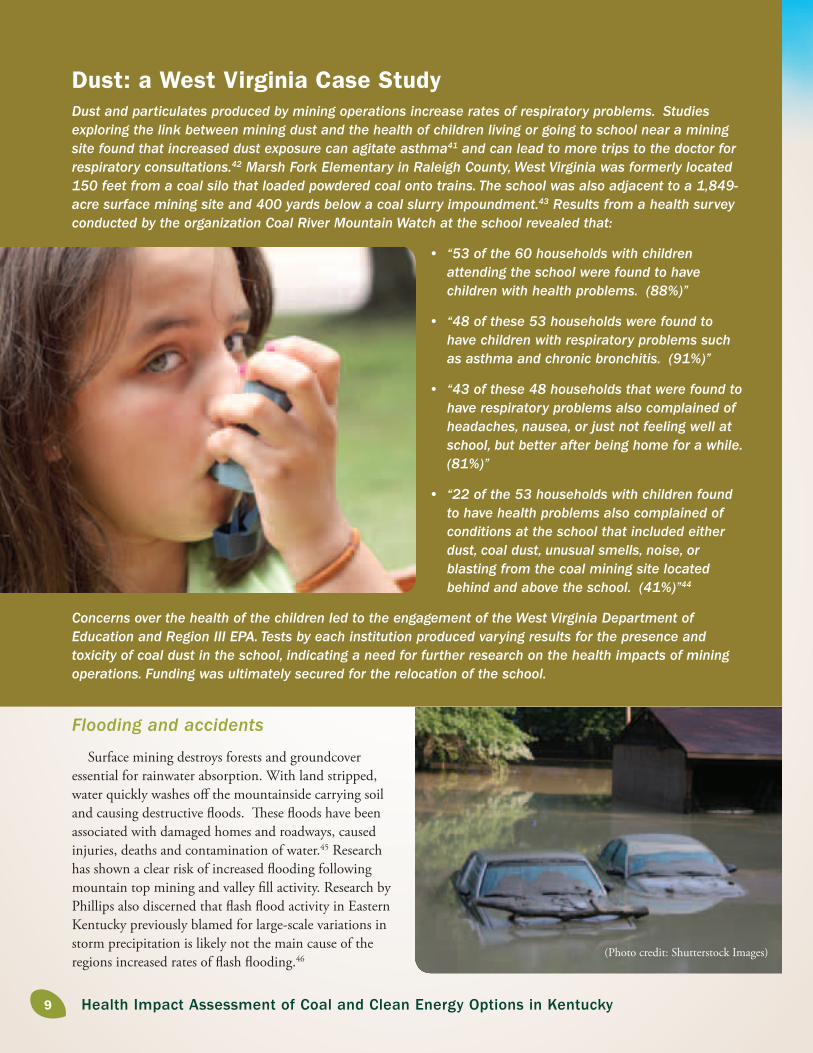
Dust: a West Virginia Case StudyDust and particulates produced by mining operations increase rates of respiratory problems. Studies exploring the link between mining dust and the health of children living or going to school near a mining site found that increased dust exposure can agitate asthma41 and can lead to more trips to the doctor for respiratory consultations.42 Marsh Fork Elementary in Raleigh County, West Virginia was formerly located 150 feet from a coal silo that loaded powdered coal onto trains. The school was also adjacent to a 1,849-acre surface mining site and 400 yards below a coal slurry impoundment.43 Results from a health survey conducted by the organization Coal River Mountain Watch at the school revealed that:
“53 of the 60 households with children attending the school were found to have children with health problems. (88%)”
“48 of these 53 households were found to have children with respiratory problems such as asthma and chronic bronchitis. (91%)”
“43 of these 48 households that were found to have respiratory problems also complained of headaches, nausea, or just not feeling well at school, but better after being home for a while. (81%)”
“22 of the 53 households with children found to have health problems also complained of conditions at the school that included either dust, coal dust, unusual smells, noise, or blasting from the coal mining site located behind and above the school. (41%)”44
Concerns over the health of the children led to the engagement of the West Virginia Department of Education and Region III EPA. Tests by each institution produced varying results for the presence and toxicity of coal dust in the school, indicating a need for further research on the health impacts of mining operations. Funding was ultimately secured for the relocation of the school.
(Photo credit: Shutterstock Images)
Flooding and accidents
Surface mining destroys forests and groundcover essential for rainwater absorption. With land stripped, water quickly washes o$ the mountainside carrying soil and causing destructive %oods. "ese %oods have been associated with damaged homes and roadways, caused injuries, deaths and contamination of water.45 Research has shown a clear risk of increased %ooding following mountain top mining and valley !ll activity. Research by Phillips also discerned that %ash %ood activity in Eastern Kentucky previously blamed for large-scale variations in storm precipitation is likely not the main cause of the regions increased rates of %ash %ooding.46
99 Health Impact Assessment of Coal and Clean Energy Options in Kentucky
(Photo credit: KFTC)
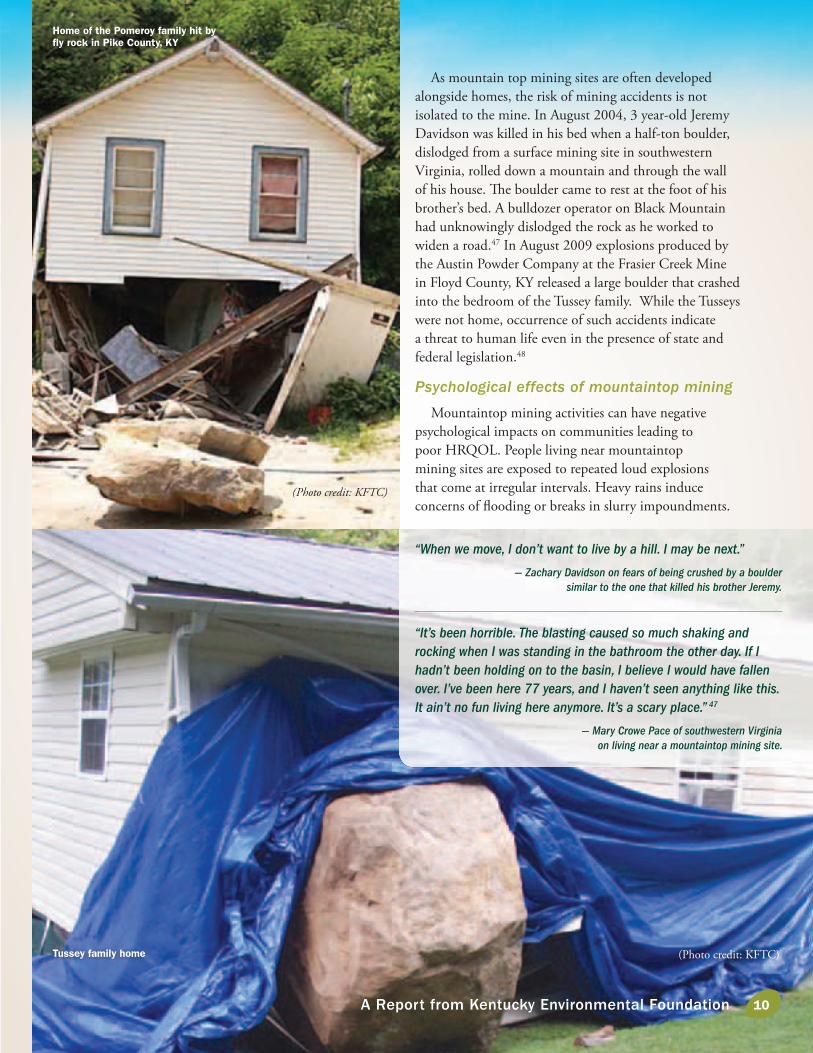
Home of the Pomeroy family hit by fly rock in Pike County, KY
Tussey family home
As mountain top mining sites are often developed alongside homes, the risk of mining accidents is not isolated to the mine. In August 2004, 3 year-old Jeremy Davidson was killed in his bed when a half-ton boulder, dislodged from a surface mining site in southwestern Virginia, rolled down a mountain and through the wall of his house. "e boulder came to rest at the foot of his brother’s bed. A bulldozer operator on Black Mountain had unknowingly dislodged the rock as he worked to widen a road.47 In August 2009 explosions produced by the Austin Powder Company at the Frasier Creek Mine in Floyd County, KY released a large boulder that crashed into the bedroom of the Tussey family. While the Tusseys were not home, occurrence of such accidents indicate a threat to human life even in the presence of state and federal legislation.48
Psychological effects of mountaintop mining
Mountaintop mining activities can have negative psychological impacts on communities leading to poor HRQOL. People living near mountaintop mining sites are exposed to repeated loud explosions that come at irregular intervals. Heavy rains induce concerns of %ooding or breaks in slurry impoundments.
“When we move, I don’t want to live by a hill. I may be next.”
— Zachary Davidson on fears of being crushed by a boulder similar to the one that killed his brother Jeremy.
“It’s been horrible. The blasting caused so much shaking and rocking when I was standing in the bathroom the other day. If I hadn’t been holding on to the basin, I believe I would have fallen over. I’ve been here 77 years, and I haven’t seen anything like this. It ain’t no fun living here anymore. It’s a scary place.” 47
— Mary Crowe Pace of southwestern Virginia on living near a mountaintop mining site.
(Photo credit: KFTC)
1010A Report from Kentucky Environmental Foundation
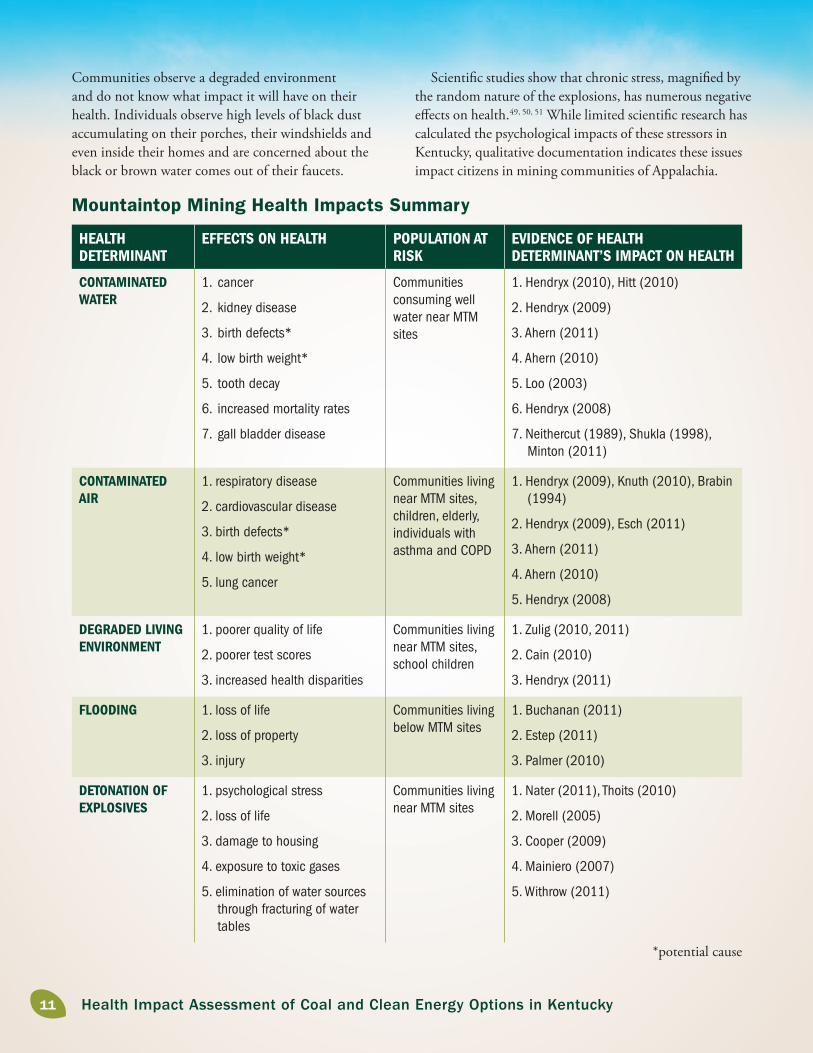
Mountaintop Mining Health Impacts Summary
HEALTH DETERMINANT
EFFECTS ON HEALTH POPULATION AT RISK
EVIDENCE OF HEALTH DETERMINANT’S IMPACT ON HEALTH
CONTAMINATED WATER
1. cancer
2. kidney disease
3. birth defects*
4. low birth weight*
5. tooth decay
6. increased mortality rates
7. gall bladder disease
Communities consuming well water near MTM sites
1. Hendryx (2010), Hitt (2010)
2. Hendryx (2009)
3. Ahern (2011)
4. Ahern (2010)
5. Loo (2003)
6. Hendryx (2008)
7. Neithercut (1989), Shukla (1998), Minton (2011)
CONTAMINATED AIR
1. respiratory disease
2. cardiovascular disease
3. birth defects*
4. low birth weight*
5. lung cancer
Communities living near MTM sites, children, elderly, individuals with asthma and COPD
1. Hendryx (2009), Knuth (2010), Brabin (1994)
2. Hendryx (2009), Esch (2011)
3. Ahern (2011)
4. Ahern (2010)
5. Hendryx (2008)
DEGRADED LIVING ENVIRONMENT
1. poorer quality of life
2. poorer test scores
3. increased health disparities
Communities living near MTM sites, school children
1. Zulig (2010, 2011)
2. Cain (2010)
3. Hendryx (2011)
FLOODING 1. loss of life
2. loss of property
3. injury
Communities living below MTM sites
1. Buchanan (2011)
2. Estep (2011)
3. Palmer (2010)
DETONATION OF EXPLOSIVES
1. psychological stress
2. loss of life
3. damage to housing
4. exposure to toxic gases
5. elimination of water sources through fracturing of water tables
Communities living near MTM sites
1. Nater (2011), Thoits (2010)
2. Morell (2005)
3. Cooper (2009)
4. Mainiero (2007)
5. Withrow (2011)
*potential cause
Communities observe a degraded environment and do not know what impact it will have on their health. Individuals observe high levels of black dust accumulating on their porches, their windshields and even inside their homes and are concerned about the black or brown water comes out of their faucets.
Scienti!c studies show that chronic stress, magni!ed by the random nature of the explosions, has numerous negative e$ects on health.49, 50, 51 While limited scienti!c research has calculated the psychological impacts of these stressors in Kentucky, qualitative documentation indicates these issues impact citizens in mining communities of Appalachia.
1111 Health Impact Assessment of Coal and Clean Energy Options in Kentucky

Health Impacts of Deep Coal miningKentucky has the greatest number of deep coal mines
in the country accounting for 28% of those in operation. "is mining process, which takes place at depths between 250 to 1000 feet underground, has the highest rates of injury and death compared to all other types of mining.53 "e con!ned nature of the mining process exposes miners to high levels of dust, noise, heat and gasses leading to both acute and chronic health problems. Heart and lung disease, hearing loss, and neck and back strain are common among deep coal miners. 54, 55, 56, 57, 58, 59, 60
"is occupation also carries a high risk of death.61 As of 2008 the fatality rate for deep mining was 24.8 deaths per 100,000 workers, nearly six times higher than the total private industry rate of 4.3.62 "e U.S. coal industry experienced 365 deaths between 2000 and 2010; 91 of these fatalities occurred in Kentucky.63
Health Impacts on Miners
INJURY. In 2009 the Mine Safety and Health Administration recorded 3,885 reports of coal mining injuries nationally.64 Mining injuries frequently stem from falling objects, roof collapse, mechanical equipment, electric currents, or falls from equipment or an extended height. Muscle and tendon in%ammation are common. Back strain contributed to 58,975 of the 230,139 days lost from work across the US in 2003.65 A total of 5,847 injuries resulted from the mining industry in Kentucky between 2000 and 2009.66
RESPIRATORY DAMAGE. A miner’s exposure to high levels of dust puts them at risk for a range of respiratory health problems. Concerns can include chronic obstructive pulmonary disease (COPD) including emphysema, coal worker’s pneumoconiosis (CWP) also known as black lung, silicosis and progressive massive !brosis (PMF).67, 68, 69 Both silica and coal dust can lead to advanced pneumoconiosis. Silica dust, however, is more toxic to lungs than coal mine dust exposure, causing more rapid development of progressive massive !brosis (PMF) a debilitating disease that can eventually lead to death.70
"e National Institute for Occupational Safety and Health (NIOSH) observed in a 2011 report that the prevalence of black lung is increasing. "e highest rates of increase are taking place in the central Appalachian region including Kentucky, Virginia, and southern West Virginia. While many issues may a$ect this shift, contributing factors may include excessive exposure to dust combined with longer work hours. In addition, as thicker seams run
out, a transition by the industry to thinner coal seams with more rock intrusions may increase exposure to silica dust.71
Occupational dust exposure in coal mines has e$ects similar to the link between smoking and emphysema. "e severity of a miner’s emphysema can be predicted by the amount of coal dust to which they are exposed over the course of their career. Di$erent regions of a mine can also increase exposure to di$erent types and quantities of dust. For example, roof bolters and drillers are exposed to higher levels of silica than are miners working only at the face of a seam. In contrast, miners working at the face of a seam may be exposed to chemical resins that may have a negative impact on respiratory health and lung function.72
Interestingly, small underground coal mines in the United States have higher rates of black lung and progressive massive !brosis than other mines with more than 50 workers.73 While this could indicate that smaller mines may have higher concentrations of dust, research is limited in this area.
HEARING DAMAGE. Coal mining operations utilize equipment with loud machinery in a con!ned space. Roof bolters can be exposed to excess of 95 dB for extensive periods of time. Hearing loss therefore accounts for 18% of all injuries reported to the National Institute for Occupational Safety and Health. NIOSH reports that approximately 50% of coal miners will experience some form of hearing loss by the age of 50 as opposed to only 9% of the general population.74
ACCIDENTS: FATALITIES AND INJURIES. Deep coal mining exposes workers to a range of life threatening circumstances. Mining releases methane, a gas that can cause asphyxiation through the displacement of oxygen. Methane, as well as suspended coal dust, can ignite and cause explosions leading to the collapse of a mine. Roof collapse is also a concern if bracing is insu#cient.
Between 1900 and 2010, 104,722 coalmine workers were killed in over 500 U.S. underground coalmining disasters.75 While the majority of these accidents took place in the early part of the 1900s, mining disasters continue to be a reality. Decline in the number of mining deaths may be associated with increased safety practices. However, other factors such as structural changes in the industry, mechanization, and decreased numbers of workers in the mine may also a$ect this number. "ree disasters in 2006 led to the death of 19 miners including one killing
1212A Report from Kentucky Environmental Foundation

!ve people at the Darby Mine No. 1 in Holmes Mill, Kentucky. "e 2010 disaster at the Upper Big Branch Mine in Montcoal, West Virginia lead to the death of 29 miners indicating that mining accidents remain a concern.76
Mining accidents involving multiple injuries or fatalities tend to receive more attention than individual accidents. However, within the last 30 years, most mining accidents have involved only one or two people. Kentucky had the second highest number of deaths in 2010 with seven (!ve underground, two surface mining) of the 48 deaths occurring in the nation. All of these accidents involved less than !ve people.77
Management of safety is determined by research, implementation of standards and surveillance. Breakdowns in this process lead to increased risk for miners. After three mining disasters in 2006 the National Mining Association identi!ed a need for further research in rescue and escape training and communications, realistic training, professional emergency response and rescue capability, and development of a safety culture in mining organizations. A culture of disregard for safety measures such as the proper use of air monitors and curtains has lead to increased morbidity and mortality. While arguments against increased regulation include costs to the company, research indicates that improvements do not need to lead to a decline in productivity.78
Eddie Bostic began his career in coal in 1979 working for the Stump Coal Company while in his twenties. He got into the business because his father had worked in coal and he was always intrigued by the stories he told. Even though the work brought !nancial support, he also endured multiple injuries. He now has second stage black lung disease and joint problems. Several times he was involved in blowouts and collapses. “I witnessed several of my friends lose their lives and to this day have nightmares reliving all the tragic events. One of my fellow miners whose name was also Eddie perished due to electrocution. As he was leaving the mines to go on vacation with his family a coworker asked him to help repair some equipment. He walked back into the mine one last time and unfortunately did not walk back out.”79
Coal miners have depended upon coal for sources of income to support families and maintain livelihoods. Eddie weighed the possibility of unemployment against resulting health impacts. “Despite all the things that have happened to me and all the things I have witnessed, when asked if I would do it all over again my answer is always a resounding yes.”
Sam Buchanan, a former miner from Barbourville, Kentucky describes personal health impacts of working with coal:
“You always worried a little bit about breathing that dust and [about] rock falls. Quite a few get hurt. A couple get killed. Grandpa on my side of the family, he got busted up in a rock fall once or twice. He had black lung. Dad had black lung. On mom’s side, her dad had black lung… I’d say it contributed to [his death].”
“It wears your joints…out all the time. The coal I worked you had to crawl. Seams [were] from seventeen to thirty inches. So you [were] all the time crawling a lot. You had to watch the roof belt, a piece of equipment that could tear you up, jerk you off it. Or getting crushed.” 80
Anonymous:
A Coal Miner’s Daughter, Wife and Niece
“When my husband was injured, he had to be out of work. He had his neck broke, his chest broke, and his back broke… My husband’s health is destroyed because of coal. My dad’s health is destroyed because of coal. He and his family owns coal mines and has run coal mines all their life, but he is now sixty-two years old and has already had lung cancer and had half his lungs removed and is no longer able to work.”
Numerous family members have been impacted by the coal mining industry including a number of uncles with black lung and emphysema. “My grandpa had the emphysema. He did not work in the coal mines, but they lived on the river bank and they burned coal their entire lives for heat. So the overall health effect of coal is damaging. But then in this area it is the only job that’s available for most people to take care of their families. Without an education, it’s all that is there for them. I am sure that if these men had the option to do something different they would do something different.”
1313 Health Impact Assessment of Coal and Clean Energy Options in Kentucky

YEAR DAY MINE LOCATION TYPE DEATHS
2006 5/20 Darby Mine No. 1 Kentucky Darby LLC
Middlesboro, Harlan Co.
Explosion 5
1989 9/13 William Station No. 9 Mine Pyro Mining Co.
Wheatcroft, Union Co.
Explosion 10
1982 1/20 No. 1 Mine, RFH Coal Co.
Craynor, KY, Floyd Co.
Explosion 7
1981 12/07 No. 11 Mine, Adkins Coal Co.
Kite, KY, Knott Co.
Explosion 8
1970 12/30 Nos. 15 and 16 Mines, Finley Coal Co.
Hyden, KY, Leslie Co.
Explosion 38
All Accidents with Five or More Fatalities, since 1970 in Kentucky Mine Safety and Health Administration.
TRENDS IN MINING SAFETY Coal companies with high numbers of safety violations tend to have higher rates of injury and death. Metrics observing lost workdays can serve as indicators for levels of risk in a particular mine. Such trends should be observed by mine safety regulators in order to help reduce risk.82
Discrepancies exist in injury data collected from the Mining Safety and Health Administration (MSHA) database, the National Institute for Occupational Safety and Health (OSHA) and the Centers for Disease and Control (CDC) regarding disease and illness in U.S. mining. These inconsistencies may be related to a worker’s fear of losing his or her job, health insurance, or other job related bene!ts contributing to under reporting.83
HEALTH DETERMINANT EFFECTS ON HEALTH POPULATION AT RISK EVIDENCE OF HEALTH DETERMINANT’S IMPACT ON HEALTH
Coal dust 1. Emphysema
2. Coal worker’s pneumoconiosis (CWP)
3. Progressive massive !brosis (PMF)
All miners 1. Kuempel (2009),
2. Bertrand (2007)
3. Att!eld (2003)
4. Laney (2010)
Chemicals used in mining process: isocyanate, rueaformol, and formophenolic
1. Decreased lung function Miners working at the face of the coal seam.
1. Bertrand (2007)
Roof drilling: noise Hearing loss Roof drillers 1. Peterson (2006)
2. Joy (2007)
Roof drilling: Production of silicate dust
1. Emphysema
2. Silicosis
3. Progressive massive !brosis (PMF)
Roof drillers 1.Onder (2007)
Continuous mining machine: noise
Hearing loss Miners working with continuous mining machines
1. Joy (2007)
Continuous mining machine: injury
Injury or death Miners working with continuous mining machines
1. Solis (2009)
2. MSHA (2011)
Roof collapse Injury or death All miners 1. Solis (2009)
2. MSHA (2011)
Electric currents Injury or death Electricians, all miners
1. Solis (2009)
2. MSHA (2011)
Transport mining equipment Injury or death Equipment operators, all miners
1. Solis (2009)
2. MSHA (2011)
Trends of accidents associated with speci!c mines
Injury or death All miners 1. Coleman (2007)
2. Laney (2010)
Major mining disasters Injury or death All miners 1. Att!eld (2003)
2. Kowalski-Trako"er (2009)
Deep Mining Health Impacts Summary
1414A Report from Kentucky Environmental Foundation

Health Impacts of Coal SlurryAfter coal is extracted, using either deep or surface
mining, it is cleaned with a chemical wash (%occulent) to help waste particles coagulate. Waste material from this washing is called “slurry” and is made up of coal dust and mineral matter, as well as the washing materials. "e composition of many %occulants is typically unknown due to companies’ concealed trade secrets. While limited research has been carried out on public health e$ects, some versions of the %occulent may contain residual acrylamide monomers. "ese monomers may have side e$ects including nerve damage, e$ects on the blood, increased risk of cancer and reproductive or fertility problems.84 While the wash reduces the amount of toxic chemicals in coal from being released into the air, the compound that is left behind when coal is burned remains toxic. "e slurry is then stored in impoundment ponds or injected underground into an abandoned mine. "ere are currently 115 slurry impoundments in Kentucky.85
"e Agency for Toxic Substances and Disease Registry has tested wells in proximity of coal slurry impoundments in Mingo County, West Virginia and determined that they were a risk to public health due to
contamination by mining activities.86 Studies by Stout have also observed contamination of well water by heavy metals at ratios comparable to that found in coal slurry.87 Coal slurry has been shown to a$ect the viability of liver cells,88 can cause deformities in !sh due to high levels of selenium,89 and can contain high levels of manganese.90 Manganese in drinking water may attract bacteria causing increased numbers of oral cavities.91 "is could be one of the many factors related to high rates of tooth decay in central Appalachia.
Health and life are at risk when impoundments are improperly maintained resulting in leaks or breaks. A major break at Bu$alo Creek, WV in 1972, killed 125 people and injured hundreds more.92 Over 300 million gallons of slurry were released into Kentucky’s Tug Fork River in October 2000 after an impoundment, sitting on an old mine, broke through a mining shaft. "e spill caused severe stream degradation and property damage. "e Martin County spill covered over 75 miles of Kentucky waterways. Clean up costs exceeded 36 million dollars.93, 94, 95 Risks of spills also include contamination of water sources with toxic metals and chemicals.
HEALTH DETERMINANT
EFFECTS ON HEALTH POPULATION AT RISK EVIDENCE OF HEALTH DETERMINANT IMPACT OF HEALTH
Flocculants containing acrylamide
Nerve damage, effects on the blood, infertility, increased risk of cancer.
Workers handling slurry !occulent
EPA
Impoundment breakage/!ooding
Risk of injury, death Communities living below slurry impoundments
Martin County spill (2000)
Coal Slurry:Heavy metals, Chemical wash
1. Cancer, kidney disease 2. Liver disease
Community members consuming ground water near slurry impoundments
1. Stout (2004, 2009)2. Bunnell (2008)
Coal Slurry Health Impacts Summary
1515 Health Impact Assessment of Coal and Clean Energy Options in Kentucky
OP9
OP9
OP3
OP80
OP11OP80
OP70
OP74
OP15
OP30
OP72
OP28
OP15
OP80
OP38
OP11
ST270
ST871
ST191
ST645
ST160ST931
ST699
ST404ST114
ST221
ST468
ST627
ST2006
ST245
0162
0123
0168
0160
0160
0125E
01119
01150
01431
0125E01119
01460
!"#75
!"#75
!"#75
!"#64
!"#75
!"#75
!"#471
0141A
0162
OP56
ST1508
0162
0160B
0141A
ST17601431
0160
!"#640160
01150
01150
01127
01150
0160 0160
!"#64
!"#75
!"#640160
!"#75
OP9
OP9
OP11
OP11
OP11 ST519
!"#75
OP11
ST205
ST205
ST519
0123
0123
OP80OP80
0127
ST904OP92
OP92
ST221ST221
0125E01119
01421
01421
OP11
01421OP11
0125
0125
OP28
ST699
01119ST160
OP80
OP7
OP7
0123
OP15
01460
ST194ST194
ST194
ST194
01119
0123
0123
OP15OP15
OP80 ST194OP15
0123
OP80OP7
01460
0123
0123
01150
ST492
OP85
!"#65OP61
!"#264ST627
ST472 ST638
01421
ST219
OP7
ST1020
")WK
")WK")WK
")EB
")EB")AU
")BG")BG
")BG
")MT
")MT
")MT
")MT
")HR")HR
")HR
ST610
ST194
ST899
ST657
ST144
ST225OP66
OP66
ST463
!"#64
0162OP95
")EB
ST175
01431OP56
ST245
0160
OP11
OP80
0125W
0125W OP26
OP30
01460
ST267
ST292
ST1071
0141A
ST1428
ST1426 ST199ST850
ST1499ST1929
ST3427
OP11
")HROP80
OP11
OP6
0127
01119
OP28
OP15
OP85
OP92
01460
ST1110
OP33
0160
")MTST191
OP32
ST14600123
ST197
ST195
ST317 ST805
ST680 ST979
011190123
ST550OP7
ST805
ST319
ST3419ST632
ST1426
ST1231
ST476ST476
ST2008
OP30OP15
ST3094OP70
ST630
0123S
ST122
ST1595 ST1344ST2012
OP92 ST1809
ST1247
FULTONCALLOWAY
MONROEHICKMANSIMPSON CLINTON
ALLENCUMBERLAND
MCCREARY
BELL
WHITLEYGRAVES
CARLISLE
WAYNETRIGG
HARLANKNOX
LOGANTODDMARSHALL
BARRENCHRISTIAN
METCALFERUSSELL
WARRENLYON
MCCRACKEN
BALLARD LETCHERADAIR
EDMONSON
LESLIELAUREL
PULASKI CLAY
CALDWELL BUTLER
MUHLENBERG
HARTLIVINGSTON
PERRY
GREEN
TAYLOR
ROCKCASTLE
CASEY
KNOTT
OWSLEYCRITTENDEN
HOPKINS
JACKSONGRAYSON LINCOLN
WEBSTERMCLEAN
BOYLEBREATHITT
MARIONLARUE
LEE
OHIO PIKE
FLOYD
GARRARD
ESTILL
WOLFE
WASHINGTON
UNION
MAGOFFIN
MADISON
DAVIESS
POWELLMERCERHENDERSON
NELSON
HANCOCK
HARDINMARTIN
JESSAMINE
BRECKINRIDGE
MENIFEEBULLITTCLARK
ANDERSON
MORGANSPENCER
WOODFORD
MEADE
MONTGOMERYFAYETTE
ELLIOTT LAWRENCE
BATH
SHELBYFRANKLIN
JEFFERSON
BOURBON
ROWANNICHOLAS
SCOTT
OLDHAM CARTERFLEMING BOYD
HARRISONHENRY
ROBERTSONOWEN
TRIMBLE LEWIS
CARROLLMASON
GREENUP
GRANT BRACKENGALLA
TIN PENDLETON
KENTON
CAMPBELL
BOONE
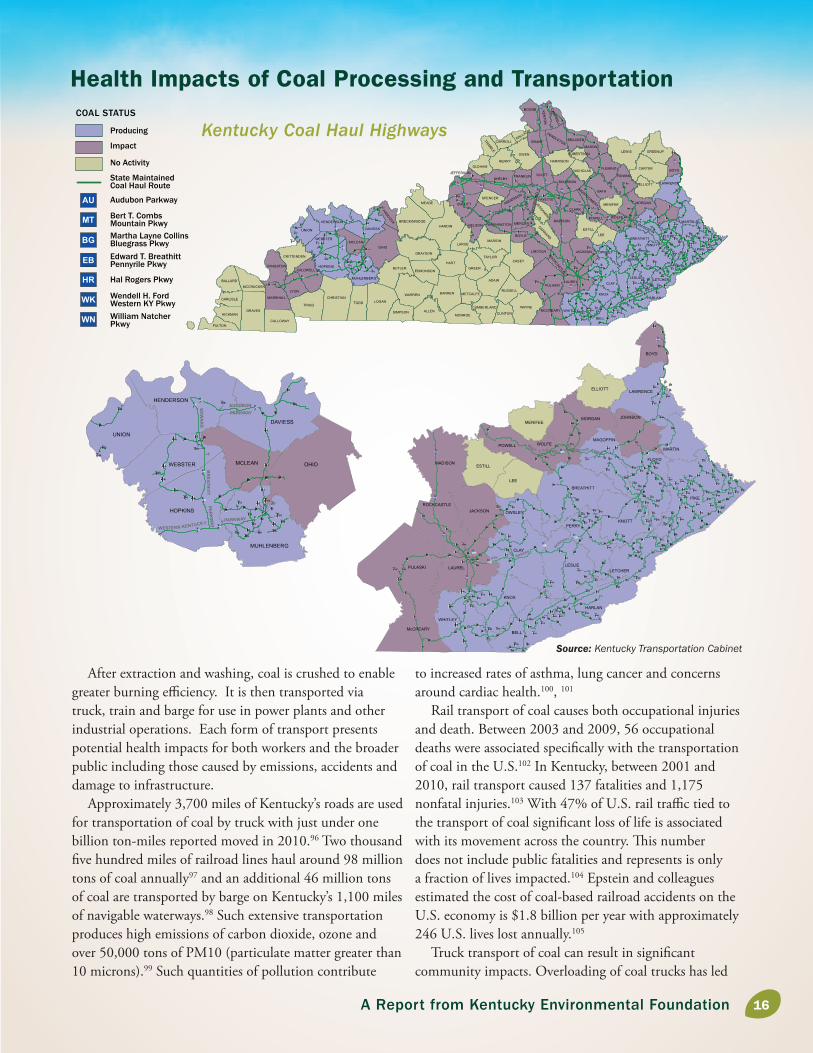
Health Impacts of Coal Processing and Transportation
Kentucky Coal Haul Highways
OP56
ST416
ST492
ST181
ST370
ST630
ST360
ST1508
0160
0141A
")WK
OP56
")EB
0141
")AU")EB
")EBOP85
01431
ST270
0141A
OP70 0162
01431")WK
AUDUBON PARKWAY
EDWARD
TBREATH
ITTPARKWAY
PARKWAY
WESTERN KENTUCKY ")WK
0141A
ST176
ST176
ST144
0160
01431
")AU
01431
ST175
0141A
0162
0162
OP560141A
ST175
OP85
OP85
OP70
ST189ST189
ST181ST2107
ST277
OP85
0160
ST103101431OP70
MUHLENBERG
HOPKINS
WEBSTER MCLEAN
UNION
DAVIESS
HENDERSON
OHIO
OP7
OP80
OP74
OP80
OP32
OP80
OP72
OP28 OP15
OP92
ST205
ST757
ST205ST645
ST899
ST904
ST199
ST931ST805
ST463
ST632
ST114
ST610
ST468
ST221
ST805
ST476
ST2565
ST1460
ST2012
ST2008
ST3041
ST1428ST1635
ST1095
ST2006
0123
0123
0123
0125
01119
01460
01119
01150
!"#75
!"#75
0125W
ST2210125E
0125E
011190125E
01119
0125E
!"#75
OP30
0125 ST638
0125
OP11
01421
01421
OP30
OP15
ST476
OP15
OP15
OP15
OP28 OP80
ST699
ST699
ST221
01119
0142101421
OP38
01119
OP7
ST160
OP7
OP15
OP15
ST122
ST194
ST194 ST194
ST194S
ST632
ST805
0123
0123
0123
01119
01460
01119
01460
0123
ST1426
ST979ST550
ST302ST114
OP80
OP80
OP7
OP3
ST1760
01230146001460
ST404
ST114
01460
ST519
OP7
OP3SST32C
ST645
0123
0123
0123
"HR
"HR
HAL ROGERS
PA
RKWAY
MOUNTAIN"MT
0123S
OP3
ST191
PKWY
ST550ST680 ST122
ST1929
ST194ST194
ST1758
ST1499ST1441
ST1441
ST122OP80
OP80OP30
ST638
OP15
ST1087
OP15
ST160
01421
ST3449 ST2007ST219
ST186ST2079
0123
BER T T COM BS
ST3218
ST632
01460
OP80
01421
"HR
OP80OP80
0127
ST914ST1247
ST1247
!"#64
OP92
OP11ST221
OP66
OP66
ST472
ST3094
ST192
01421
ST1071
ST343
ST1469
ST197
ST680
OP15
OP92
OP15
OP80
OP11
01421
0125W
OP30
OP26
0125E
ST3427
ST221
ST850
ST195
ST194
ST3386
ST194
ST2062
ST292
0123
ST191
ST191ST191
0123
ST3337
ST225ST1344
ST197
ST1056
ST1469OP11
OP66
ST699
OP6
OP92
0127
ST1809
ST1595
OP7
OP11
OP28
OP92
01421
ST1231
OP3
OP30
OP30 ST847
OP28
ST1110
OP30
OP150123
0111901119 ST319
OP32
0123
01460
ST205 ST30 ST867
ST404
OP11
!"#75
01421
0125
OP80
OP66ST1850
ST2011
ST118
OP80
OP15
OP80ST1146ST1067
ST267ST2446
ST160
OP3
01230123
ST3227
OP80
ST1086
ST680
ST1498ST122
ST306
01119
01460ST366
ST194
01119ST1426
ST1426
0123ST317
OP7
OP15
01119 ST3404
ST15X
OP72
ST990 ST3462
OP38
01119
01119
OP74
0125W ST2417ST3436
ST830
0125W
OP92
0127
OP6ST1064
OP92
OP26
01421
OP15
ST476
"HR 0123
BELL
WHITLEY
HARLAN
KNOX
LETCHERLESLIELAUREL
CLAY
PERRY
ROCKCASTLE
KNOTT
OWSLEYJACKSON
BREATHITT
LEE
PIKE
FLOYD
WOLFEMAGOFFIN
MARTIN
JOHNSONMORGAN
LAWRENCE
BOYD
PULASKI
McCREARY
ELLIOTT
ESTILLMADISON
POWELL
MENIFEE
WK
WN
HR
EB
BG
MT
AU
Producing
COAL STATUS
Impact
No Activity
Audubon Parkway
Bert T. CombsMountain PkwyMartha Layne CollinsBluegrass PkwyEdward T. BreathittPennyrile Pkwy
Hal Rogers Pkwy
Wendell H. FordWestern KY PkwyWilliam NatcherPkwy
State MaintainedCoal Haul Route
After extraction and washing, coal is crushed to enable greater burning e#ciency. It is then transported via truck, train and barge for use in power plants and other industrial operations. Each form of transport presents potential health impacts for both workers and the broader public including those caused by emissions, accidents and damage to infrastructure.
Approximately 3,700 miles of Kentucky’s roads are used for transportation of coal by truck with just under one billion ton-miles reported moved in 2010.96 Two thousand !ve hundred miles of railroad lines haul around 98 million tons of coal annually97 and an additional 46 million tons of coal are transported by barge on Kentucky’s 1,100 miles of navigable waterways.98 Such extensive transportation produces high emissions of carbon dioxide, ozone and over 50,000 tons of PM10 (particulate matter greater than 10 microns).99 Such quantities of pollution contribute
to increased rates of asthma, lung cancer and concerns around cardiac health.100, 101
Rail transport of coal causes both occupational injuries and death. Between 2003 and 2009, 56 occupational deaths were associated speci!cally with the transportation of coal in the U.S.102 In Kentucky, between 2001 and 2010, rail transport caused 137 fatalities and 1,175 nonfatal injuries.103 With 47% of U.S. rail tra#c tied to the transport of coal signi!cant loss of life is associated with its movement across the country. "is number does not include public fatalities and represents is only a fraction of lives impacted.104 Epstein and colleagues estimated the cost of coal-based railroad accidents on the U.S. economy is $1.8 billion per year with approximately 246 U.S. lives lost annually.105
Truck transport of coal can result in signi!cant community impacts. Overloading of coal trucks has led
Source: Kentucky Transportation Cabinet
1616A Report from Kentucky Environmental Foundation

to road and bridge damage from extreme truck weight, increasing potential for accidents.106 In addition, trucks that fail to cover their coal can release cinders that break windshields of vehicles, reducing visibility and adding !nancial burden to the vehicle owner. Other community-based concerns include high levels of dust and noise. Rates of asthma in eastern Kentucky are high with an estimated 12 % of children and 10% of adults su$ering from symptoms.107 Increased exposures to dust can agitate the disease leading to asthma attacks.
People living along or near coal transportation roadways expressed concern about high levels of tra#c and pedestrian safety where roadways do not have sidewalks. Parents may not permit children to play in areas that are risky therefore reducing outdoor activity time.108 Decreases in physical activity can contribute to obesity, a signi!cant health concern that a$ects 31% of the entire population in Kentucky.109
William Minton from Manchester KY, lives next to a coal processing plant. He feels “hammered” every day by the plant and the trucks that pass back and forth in front of his house. “In the end we sit covered in coal dust. My whole family has respiratory problems but I’m most concerned about my child. She’s seven and is on eight medications. She can’t be placed on any more medications. No part of the [coal] process is clean.”
Minton says care for his daughter is expensive and often requires long drives to the doctor, up to 110 miles if they have to go to Louisville. “If my child was not covered by a medical card there is no way I could afford the medicines that she’s on. To be honest I don’t know how much money that the government is out just on my child alone. Because if she wasn’t being smothered to death and been put in the position to be on all these medicines that’s one less bill that the government would have to foot.”
HEALTH DETERMINANT EFFECTS ON HEALTH POPULATION AT RISK EVIDENCE OF IMPACTS EFFECT ON HEALTH DETERMINANT
Processing of coal: Crushing Asthma, respiratory irritation Asthmatics, children, Minton (2011)
Coal Transport by Truck: Accidents
Risk of injury or death Truck drivers and community members
KFTC
Diesel emissions 1. Cancer2. Cardiac death3. Artherosclerosis (blood clots), 4. Constricted blood vessels5. High blood pressure6. Heart attacks7. Stroke8. Asthma9. improper immune
development in infants10. Reduced birth weight
neonatal mortality
Truck drivers and community members
1. Bhatia (1998)2. Dockery (1993)3. Brook (2010)4. Brook (2002)5. Brook (2009)6. Peters (2001) Epstein (2011)7. Wellenius (2005)8. Khatri (2009)9. Herr (2011)10. Slama (2007), Lin (2004)
Lacasaña (2005)
Dust Asthma and other breathing concerns
Truck drivers and community members
Minton (2011), Nunn (2009)
Road damage Risk of accidents and death Truck drivers and community members
KFTC
Reduced pedestrian transport
Increased obesity Kentuckians living in coal mining communities
Minton (2011)
Coal Transport by train: Accidents
Risk of injury and death Train engineers, Kentuckians living along tracks
1. Bureau of Labor Statistics (2009)2. Federal Railroad Administration (2011)3. Epstein (2011)
Emissions As above in coal truck emissions Kentuckians living along train transport routes for coal
As above in coal truck emissions
Coal Transport by barge: Emissions
As above in coal truck emissions Kentuckians living along water transport routes for coal
As above in coal truck emissions
Coal Processing and Transportation Health Impacts Summary
1717 Health Impact Assessment of Coal and Clean Energy Options in Kentucky
Health impacts of Coal Power Plant EmissionsOnce coal has been transported to an energy plant, it is
pulverized into a !ne powder and burned. "is pulverized coal combustion (PCC) system burns coal to heat water in tubes around a furnace, creating steam. "e steam turns turbines, which then turn electrical generators. Gasses and particulates from the burning coal are released through smoke stacks into the air. While PCC systems have been the standard in coal !red power plants, newer more e#cient technologies include %uidized bed combustion, supercritical and ultrasupercritical technology, and integrated gasi!cation combined cycle (IGCC). Kentucky has 56 operating coal-!red generating units at 21 locations totaling 16,510 megawatts (MW). Most of these still use the PCC system.110
ParticulatesGases and particulates released by burning coal can
distribute up to hundreds of miles from the source. Emissions can a$ect the heart, lungs and nervous system, as well as damage prenatal development. According to research by ABT associates for the Clean Air Task Force, Kentucky experiences approximately 412 deaths, 286 hospitalizations and 539 heart attacks annually due to power plant pollution. Of the 350,000 sudden cardiac deaths in the US per year, 60,000 are related to particulate air pollution from coal-based electricity production.111
Pollutants with the greatest potential to harm human health include particulate matter smaller than 2.5 micrometers (PM2.5), nitrogen oxides (NOx), sulfur dioxide (SO2) and ozone (O3). Particulates damage the respiratory and circulatory systems and nitrogen oxides decrease lung function.112 Ozone can irritate the respiratory system, inducing asthma attacks, and causing wheezing and shortness of breath. 113 Health impacts of SO2 include nasal in%ammation, shortness of breath, wheezing, coughing, destabilized heart rhythms, asthma, low birth weight and increased risk of infant death. Sulfur oxides can also react with sunlight causing acid rain. 114, 115
Eighty percent of US green house gas emissions are caused by energy-related carbon dioxide emissions.116 In addition, 18% of the nation’s NOx and 66% of SO2 came from the US power sector in 2008. Of the pollutants within this sector the majority of SO2 emissions (99%) and NOx (93%) emissions came from coal combusting electricity generators. 117
CARDIOVASCULAR DISEASE. Particulate matter (PM) is the leading source of health concerns in coal based air pollution. PM in the form of dust or pollen is typically greater than 10 microns and can be expelled from our lungs through coughing. Particles produced through combustion are much smaller, at 2.5 microns or less (PM2.5) and can travel hundreds of miles before being inhaled deep into the lungs. Such particles can then enter the circulatory system causing damage through in%ammation and oxidation.118 "is in%ammatory process can constrict blood vessels119 increasing blood pressure and lead to heart attacks, arrhythmia, stroke or even death. 120, 121, 122, 123 Long term exposure to PM can lead to the development of atherosclerosis, the build up of plaques in the arteries.124
Exposure to PM2.5 can trigger heart disease and arrhythmias in as little as a few hours to a few days. Cases such as Donora, Pennsylvania (October 27-30, 1948), and the “London Fog” (December 5-9, 1952) provide clear examples of the health impacts of coal-based air pollution. Mortality rates reached 6 and 9 times higher than normal respectively during the episodes when air pollution from coal burning stoves in homes, and zinc, iron, steel and electrical industries built up in the local atmosphere. Further research has found that those most at risk to short-term high levels of PM2.5 include elderly, those with existing heart disease and possibly diabetics.125 Additional studies have found that for each 10 mg/m3 increase in long-term average PM2.5 there is an associated 6% risk of cardiopulmonary mortality.126
"e EPA believes there is no safe level of PM2.5. It is, however, considered a modi!able factor that contributes to cardiovascular morbidity and mortality. Increased exposure leads to higher rates of mortality and morbidity while decreased levels of exposure lead to reductions in mortality and morbidity.127
ASTHMA. Approximately one in 10 Kentuckians su$er from asthma.128 Power plant emissions including PM, SO2, NOx and the associated ozone produced by exposure to sunlight can all contribute to increased rates of asthma attacks.129 Currently 3,331,201 individuals in Kentucky live within 30 miles of a power plant. "is includes 811,993 children, 44,158 of whom are asthmatic.130 Kentucky’s children, particularly those of color, experience the highest rates of asthma. Asthma rates reach as high as 22% for African American high school students.131
1818A Report from Kentucky Environmental Foundation
Health care for asthmatics is expensive. In 2002 Kentucky hospitals saw over 7,150 asthma patients with expenses averaging $6053.132 In 2007, 6,235 Kentuckians were hospitalized for asthma costing $62,231,688.33 in health care. Of the 883,525 people enrolled in Kentucky’s Medicaid program, 81,431 (9.2%) received asthma related services in 2006. An average of 50 deaths (1.2 per 100,000) occur annually in Kentucky with asthma listed as the primary cause.133 A decrease in levels of particulate matter can help prevent asthma attacks and the amount of money spent on treatment.
PRENATAL DEVELOPMENT. Air pollution, including PM2.5 can a$ect the health and development of a fetus. Mothers exposed to elevated levels of air pollution can incur increased risk of preterm birth and the fetus may experience improper immune development134 and reduced birth weight.135, 136 For example, a study in the Utah valley found that mothers delivering babies during the time a coal-burning steel plant was closed had fewer preterm births. When the steel plant restarted operation, preterm births increased.137 Research in Tongliang, China determined through cord blood testing for polycyclic aromatic hydrocarbons, lead, and mercury that exposure to pollutants from the local power plant adversely a$ected the development of children in motor, adaptive, language and social areas.138 A meta-analysis, culminating research from multiple studies, concluded that for each 10 ug/m3 increase in PM10 was associated with a 22% increase in respiratory post-neonatal mortality.139 As Kentucky experiences high rates of air pollution from power plants, such evidence warrants concern for the health of Kentucky’s unborn children.
Reductions in air pollution caused by legislation
Quality legislation can help reduce the impacts of coal-based air pollution. Title IV of the Clean Air Act Amendments (CAAA), also known as the Acid Rain Program, was established in 1990 to reduce power plant emissions of sulfur dioxide (SO2) and nitrogen oxides (NOx), precursors to acid rain. A review determined that ultimately costs were less than predicted with !nancial bene!ts associated with protection of human health and the environment far exceeding those planned. The cap and trade method proposed a cap of 8.95 million tons of SO2 , half the amount emitted by power plants in 1980.
The highest concentrations of ozone from coal combustion energy plants in the US lie across Kentucky and Tennessee. Nationally, estimated total value of health bene!ts for reductions in ozone due to Title IV for 2010 was about $4 billion. Ninety percent of this was associated with reductions in mortality. This included $59 million saved on potentially lost school days, $22 million to lost work days, $14 million on respiratory hospital admissions under the age of 2 and $27 million for admissions over the age of 65. 140 In its Transport Rule the U.S. EPA proposal estimates that reductions in power plant air pollution will prevent the deaths of 14,000 to 36,000 people annually starting in 2014. 141
Studies indicate that creating good policy around air pollution can save lives and protect public health. Research by Rayens and colleagues observed reductions in asthma related emergency department visits after the implementation of a smoke free law in public places in Lexington, KY.142 A study by Khudar and colleagues also found positive health outcomes through the smoking ban with reductions in hospital admissions for coronary heart disease.143 Just as the smoking ban reduced indoor air pollution, policies for reductions in emissions of coal-based energy would create healthier air for Kentuckians.
AVOIDED HEALTH EFFECTS
# OF CASES AVOIDED
MONETARY VALUE (MILLIONS)
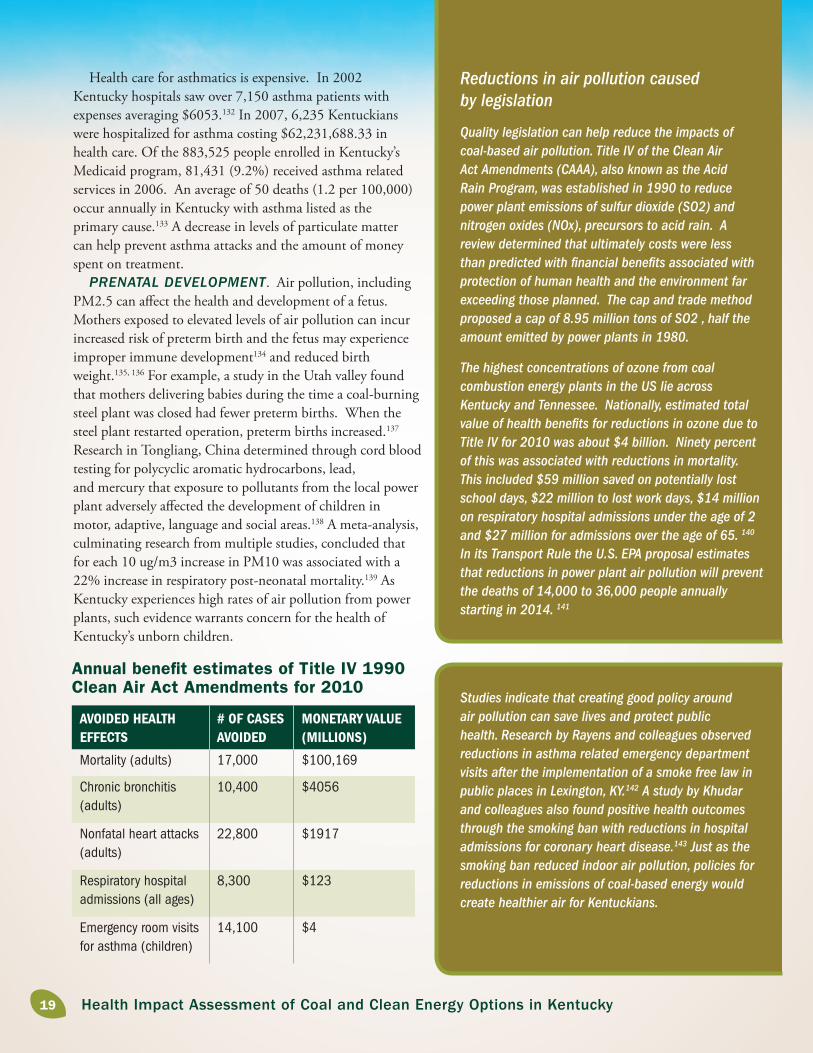
Mortality (adults) 17,000 $100,169
Chronic bronchitis (adults)
10,400 $4056
Nonfatal heart attacks (adults)
22,800 $1917
Respiratory hospital admissions (all ages)
8,300 $123
Emergency room visits for asthma (children)
14,100 $4
Annual benefit estimates of Title IV 1990 Clean Air Act Amendments for 2010
1919 Health Impact Assessment of Coal and Clean Energy Options in Kentucky
Mercury emissions
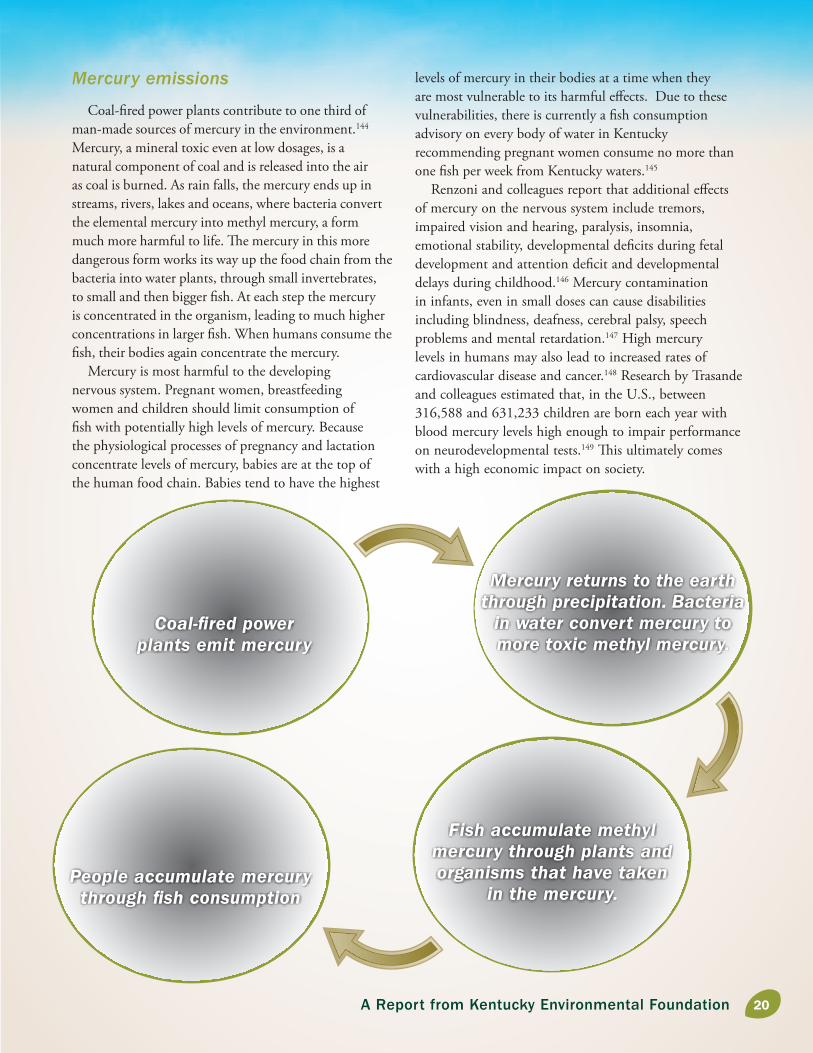
Coal-!red power plants contribute to one third of man-made sources of mercury in the environment.144 Mercury, a mineral toxic even at low dosages, is a natural component of coal and is released into the air as coal is burned. As rain falls, the mercury ends up in streams, rivers, lakes and oceans, where bacteria convert the elemental mercury into methyl mercury, a form much more harmful to life. "e mercury in this more dangerous form works its way up the food chain from the bacteria into water plants, through small invertebrates, to small and then bigger !sh. At each step the mercury is concentrated in the organism, leading to much higher concentrations in larger !sh. When humans consume the !sh, their bodies again concentrate the mercury.
Mercury is most harmful to the developing nervous system. Pregnant women, breastfeeding women and children should limit consumption of !sh with potentially high levels of mercury. Because the physiological processes of pregnancy and lactation concentrate levels of mercury, babies are at the top of the human food chain. Babies tend to have the highest
levels of mercury in their bodies at a time when they are most vulnerable to its harmful e$ects. Due to these vulnerabilities, there is currently a !sh consumption advisory on every body of water in Kentucky recommending pregnant women consume no more than one !sh per week from Kentucky waters.145
Renzoni and colleagues report that additional e$ects of mercury on the nervous system include tremors, impaired vision and hearing, paralysis, insomnia, emotional stability, developmental de!cits during fetal development and attention de!cit and developmental delays during childhood.146 Mercury contamination in infants, even in small doses can cause disabilities including blindness, deafness, cerebral palsy, speech problems and mental retardation.147 High mercury levels in humans may also lead to increased rates of cardiovascular disease and cancer.148 Research by Trasande and colleagues estimated that, in the U.S., between 316,588 and 631,233 children are born each year with blood mercury levels high enough to impair performance on neurodevelopmental tests.149 "is ultimately comes with a high economic impact on society.
Fish accumulate methyl mercury through plants and organisms that have taken
in the mercury.People accumulate mercury through fish consumption
Coal-fired power plants emit mercury
Mercury returns to the earth through precipitation. Bacteria
in water convert mercury to more toxic methyl mercury.
2020A Report from Kentucky Environmental Foundation

HEALTH DETERMINANT
EFFECTS ON HEALTH POPULATION AT RISK EVIDENCE OF HEALTH DETERMINANT IMPACT ON HEALTH
PM2.5 1. Cardiac death
2. Damaged respiratory system
3. Artherosclerosis (blood clots),
4. Constricted blood vessels
5. High blood pressure
6. Heart attacks
7. Stroke
8. Asthma
9. Improper immune development in infants
10. Reduced birth weight
11. Neonatal mortality
Elderly,
Those with existing heart problems,
Pregnant mothers,
Diabetics (Brook 2008),
Asthmatics
1. CATF (2010), Dockery (1993)
2. Lockwood (2009)
3. Brook (2010)
4. Brook (2002)
5. Brook (2009)
6. Peters (2001)
7. Wellenius (2005)
8. Khatri (2009)
9. Herr (2011)
10. Slama (2007), Lin (2004)
11. Lacasaña (2005)
Ozone (O3) Asthma attacks,
Wheezing,
Shortness of breath
Children, elderly, people with asthma or other respiratory disease, people who exercise outdoors.
1. Lockwood (2009)
2. Ji (2011)
3. EPA
Nitrogen Oxides (NOx)
Decreased lung function and Lung disease
Elderly, children, people with asthma
1. Lockwood (2009)
2. EPA
Sulfur Dioxide (SO2)
Nasal in!ammation, shortness of breath, wheezing, coughing, destabilized heart rhythms, asthma, low birth weight and increased risk of infant death
children, people with asthma
1. Lockwood (2009)
2. EPA
Mercury (Hg) 1. Tremors, impaired vision and hearing, paralysis, insomnia, emotionally stability, developmental de"cits during fetal development, and attention de"cit and developmental delays during childhood
2. Cerebral palsy, speech problems and mental retardation
3. Increased rates of cardiovascular disease and cancer
4. Impaired performance on neurodevelopmental tests
1. Renzoni (1998)
2. Davis (2002)
3. Risher (2002)
4. Trasande (2005), Tang (2008)
Power Plant Emissions Health Impact Summary
2121 Health Impact Assessment of Coal and Clean Energy Options in Kentucky
Health Impacts of Greenhouse Gas EmissionsCoal based energy, through mining and burning,
produces carbon dioxide, methane and other “greenhouse gases,” so named because these gases, in the atmosphere, trap in solar heat, creating greenhouse-like warming on the planet. "e burning of coal is the largest current source of carbon dioxide, producing approximately one-third of current U.S. CO2 output.150 About 6% of current methane emissions are the result of coal mining.151
As the planet continues to warm, greater %uctuations occur in weather patterns. Kentucky will not be exempt from more extreme temperatures, droughts and %oods. Higher temperatures in the summer mean that outdoor workers and athletes may experience higher rates of heat stroke.152 Globally, the planet is also experiencing melting glaciers, higher sea levels and loss of coastal land. All have direct e$ects on human health, including an increase in deaths from heat strokes, %ooding, malnutrition and water- and insect-borne illness such as diarrhea, Lyme disease and malaria.153, 154, 155 Drought can cause loss of crops and resulting hunger. Major U.S. storms in the
past 10 years have caused signi!cant injuries and loss of life. "e World Health Organization has estimated that 160,000 people died and many more were made ill in the year 2000 as a direct result of climate change.156 Knowlton and colleagues have accounted for about $14 billion in health care costs associated with six climate change events between 2000 and 2009. "e majority (95%) of these costs are due to the value of lives lost prematurely.157 "is number may continue to grow as greenhouse gases increase each year.
Carbon sequestration, a process of capturing and storing CO2 emissions underground, has been considered as a measure to reduce this green house gas. Concerns, however, have been raised regarding the e$ectiveness of the method and the feasibility of long-term storage. If stored in saline environments, CO2 can acidify the water, killing aquatic life.158 Other health concerns lie in the fact that concentrated carbon dioxide can itself be a health hazard if released suddenly.159 Prevention of the need for CO2 capture is currently more a$ordable than construction of carbon capture systems.
HEALTH DETERMINANT
EFFECTS ON HEALTH POPULATION AT RISK EVIDENCE OF HEALTH DETERMINANT IMPACT ON HEALTH
Shifts in weather patterns:
Extreme heat
Heat stroke The young, the elderly, those working out doors, atheletes, those without cooling systems, all Kentuckians
Patz (2005), Yard (2010), Knowlton (2011)
Increased !ooding
Injury, loss of life, loss of property
Those living in !ood zones Patz (2005), Haines 2006, Knowlton (2011)
Increased drought
Loss of crops, decreased food security
Farmers, all Kentuckians Patz (2005), Haines 2006, Knowlton (2011)
Increased global temperature: Flooding
Injury, loss of life, loss of property
Those living at sea level Patz (2005), Haines 2006, Knowlton (2011)
Expansion of vector habitat
Increased cases of malaria, Lyme disease
Individuals in vector’s expanded habitat.
Patz (2005), Haines 2006, Mohammed (2011), Brownstein (2005)
Greenhouse Gas Emissions Health Impacts Summary
2222A Report from Kentucky Environmental Foundation
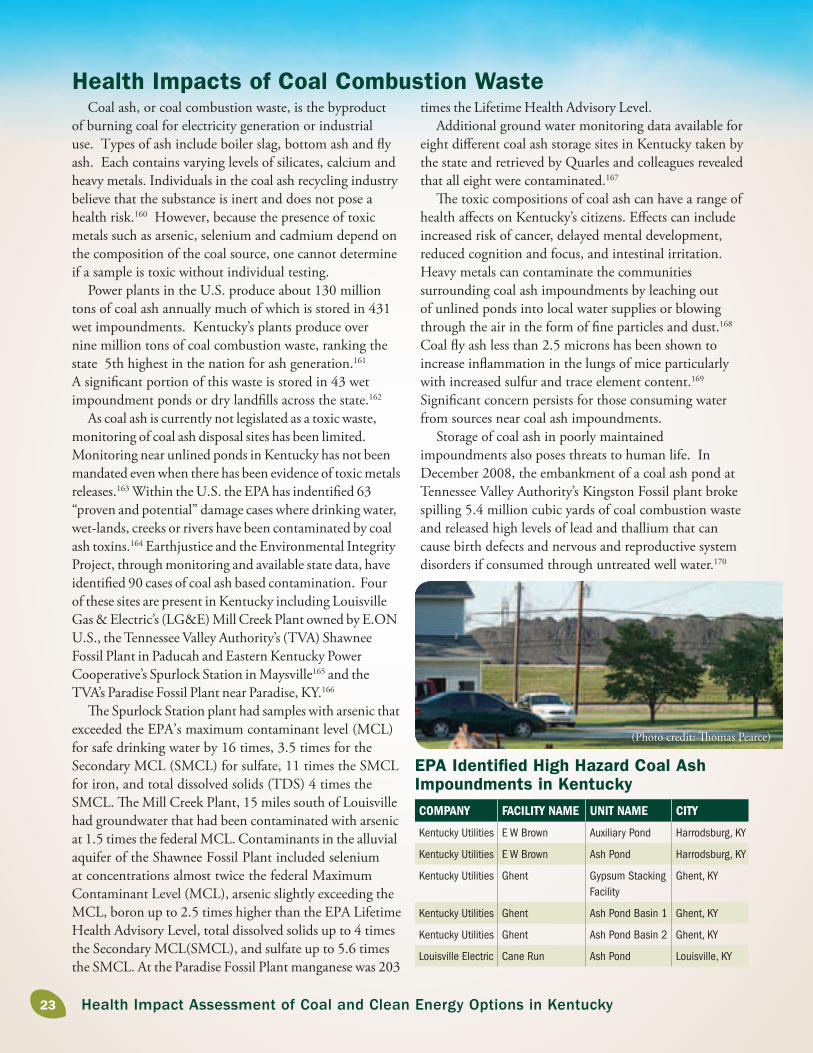
Health Impacts of Coal Combustion WasteCoal ash, or coal combustion waste, is the byproduct
of burning coal for electricity generation or industrial use. Types of ash include boiler slag, bottom ash and %y ash. Each contains varying levels of silicates, calcium and heavy metals. Individuals in the coal ash recycling industry believe that the substance is inert and does not pose a health risk.160 However, because the presence of toxic metals such as arsenic, selenium and cadmium depend on the composition of the coal source, one cannot determine if a sample is toxic without individual testing.
Power plants in the U.S. produce about 130 million tons of coal ash annually much of which is stored in 431 wet impoundments. Kentucky’s plants produce over nine million tons of coal combustion waste, ranking the state 5th highest in the nation for ash generation.161 A signi!cant portion of this waste is stored in 43 wet impoundment ponds or dry land!lls across the state.162
As coal ash is currently not legislated as a toxic waste, monitoring of coal ash disposal sites has been limited. Monitoring near unlined ponds in Kentucky has not been mandated even when there has been evidence of toxic metals releases.163 Within the U.S. the EPA has indenti!ed 63 “proven and potential” damage cases where drinking water, wet-lands, creeks or rivers have been contaminated by coal ash toxins.164 Earthjustice and the Environmental Integrity Project, through monitoring and available state data, have identi!ed 90 cases of coal ash based contamination. Four of these sites are present in Kentucky including Louisville Gas & Electric’s (LG&E) Mill Creek Plant owned by E.ON U.S., the Tennessee Valley Authority’s (TVA) Shawnee Fossil Plant in Paducah and Eastern Kentucky Power Cooperative’s Spurlock Station in Maysville165 and the TVA’s Paradise Fossil Plant near Paradise, KY.166
"e Spurlock Station plant had samples with arsenic that exceeded the EPA’s maximum contaminant level (MCL) for safe drinking water by 16 times, 3.5 times for the Secondary MCL (SMCL) for sulfate, 11 times the SMCL for iron, and total dissolved solids (TDS) 4 times the SMCL. "e Mill Creek Plant, 15 miles south of Louisville had groundwater that had been contaminated with arsenic at 1.5 times the federal MCL. Contaminants in the alluvial aquifer of the Shawnee Fossil Plant included selenium at concentrations almost twice the federal Maximum Contaminant Level (MCL), arsenic slightly exceeding the MCL, boron up to 2.5 times higher than the EPA Lifetime Health Advisory Level, total dissolved solids up to 4 times the Secondary MCL(SMCL), and sulfate up to 5.6 times the SMCL. At the Paradise Fossil Plant manganese was 203
EPA Identified High Hazard Coal Ash Impoundments in KentuckyCOMPANY FACILITY NAME UNIT NAME CITY
Kentucky Utilities E W Brown Auxiliary Pond Harrodsburg, KY
Kentucky Utilities E W Brown Ash Pond Harrodsburg, KY
Kentucky Utilities Ghent Gypsum Stacking Facility
Ghent, KY
Kentucky Utilities Ghent Ash Pond Basin 1 Ghent, KY
Kentucky Utilities Ghent Ash Pond Basin 2 Ghent, KY
Louisville Electric Cane Run Ash Pond Louisville, KY
times the Lifetime Health Advisory Level. Additional ground water monitoring data available for
eight di$erent coal ash storage sites in Kentucky taken by the state and retrieved by Quarles and colleagues revealed that all eight were contaminated.167
"e toxic compositions of coal ash can have a range of health a$ects on Kentucky’s citizens. E$ects can include increased risk of cancer, delayed mental development, reduced cognition and focus, and intestinal irritation. Heavy metals can contaminate the communities surrounding coal ash impoundments by leaching out of unlined ponds into local water supplies or blowing through the air in the form of !ne particles and dust.168 Coal %y ash less than 2.5 microns has been shown to increase in%ammation in the lungs of mice particularly with increased sulfur and trace element content.169 Signi!cant concern persists for those consuming water from sources near coal ash impoundments.
Storage of coal ash in poorly maintained impoundments also poses threats to human life. In December 2008, the embankment of a coal ash pond at Tennessee Valley Authority’s Kingston Fossil plant broke spilling 5.4 million cubic yards of coal combustion waste and released high levels of lead and thallium that can cause birth defects and nervous and reproductive system disorders if consumed through untreated well water.170
(Photo credit: "omas Pearce)
2323 Health Impact Assessment of Coal and Clean Energy Options in Kentucky
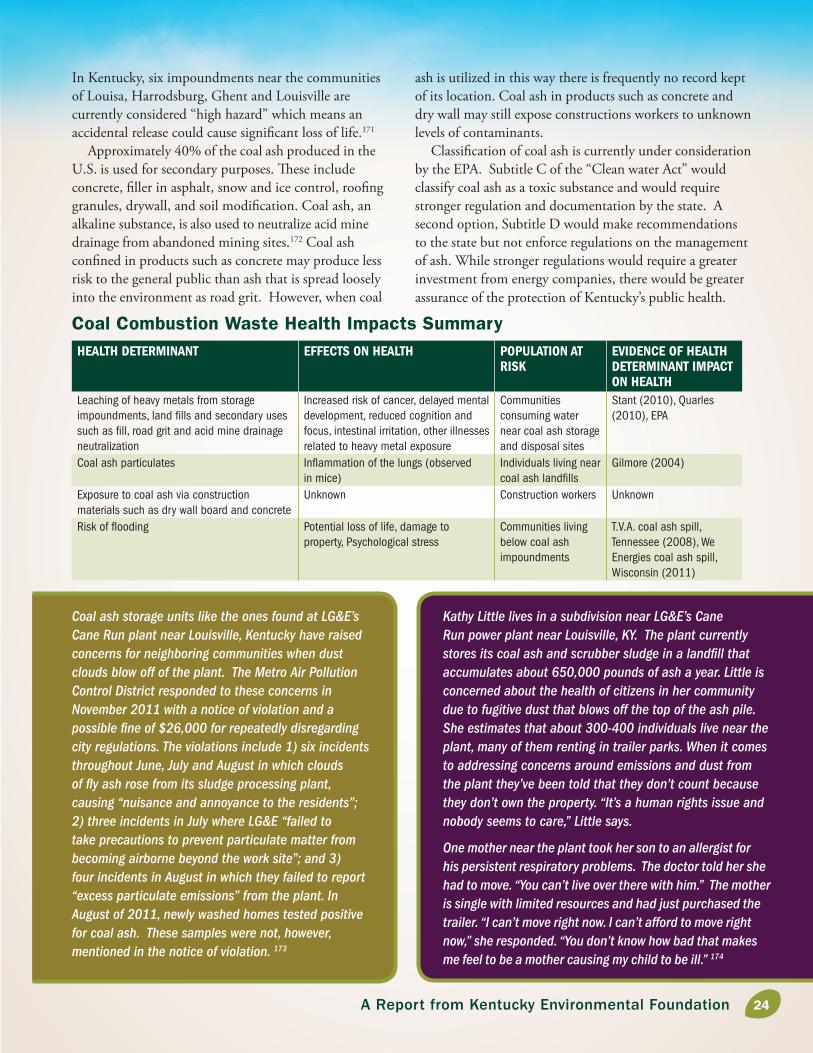
In Kentucky, six impoundments near the communities of Louisa, Harrodsburg, Ghent and Louisville are currently considered “high hazard” which means an accidental release could cause signi!cant loss of life.171
Approximately 40% of the coal ash produced in the U.S. is used for secondary purposes. "ese include concrete, !ller in asphalt, snow and ice control, roo!ng granules, drywall, and soil modi!cation. Coal ash, an alkaline substance, is also used to neutralize acid mine drainage from abandoned mining sites.172 Coal ash con!ned in products such as concrete may produce less risk to the general public than ash that is spread loosely into the environment as road grit. However, when coal
Coal ash storage units like the ones found at LG&E’s Cane Run plant near Louisville, Kentucky have raised concerns for neighboring communities when dust clouds blow off of the plant. The Metro Air Pollution Control District responded to these concerns in November 2011 with a notice of violation and a possible !ne of $26,000 for repeatedly disregarding city regulations. The violations include 1) six incidents throughout June, July and August in which clouds of "y ash rose from its sludge processing plant, causing “nuisance and annoyance to the residents”; 2) three incidents in July where LG&E “failed to take precautions to prevent particulate matter from becoming airborne beyond the work site”; and 3) four incidents in August in which they failed to report “excess particulate emissions” from the plant. In August of 2011, newly washed homes tested positive for coal ash. These samples were not, however, mentioned in the notice of violation. 173
Kathy Little lives in a subdivision near LG&E’s Cane Run power plant near Louisville, KY. The plant currently stores its coal ash and scrubber sludge in a land!ll that accumulates about 650,000 pounds of ash a year. Little is concerned about the health of citizens in her community due to fugitive dust that blows off the top of the ash pile. She estimates that about 300-400 individuals live near the plant, many of them renting in trailer parks. When it comes to addressing concerns around emissions and dust from the plant they’ve been told that they don’t count because they don’t own the property. “It’s a human rights issue and nobody seems to care,” Little says.
One mother near the plant took her son to an allergist for his persistent respiratory problems. The doctor told her she had to move. “You can’t live over there with him.” The mother is single with limited resources and had just purchased the trailer. “I can’t move right now. I can’t afford to move right now,” she responded. “You don’t know how bad that makes me feel to be a mother causing my child to be ill.” 174
ash is utilized in this way there is frequently no record kept of its location. Coal ash in products such as concrete and dry wall may still expose constructions workers to unknown levels of contaminants.
Classi!cation of coal ash is currently under consideration by the EPA. Subtitle C of the “Clean water Act” would classify coal ash as a toxic substance and would require stronger regulation and documentation by the state. A second option, Subtitle D would make recommendations to the state but not enforce regulations on the management of ash. While stronger regulations would require a greater investment from energy companies, there would be greater assurance of the protection of Kentucky’s public health.
HEALTH DETERMINANT EFFECTS ON HEALTH POPULATION AT RISK
EVIDENCE OF HEALTH DETERMINANT IMPACT ON HEALTH
Leaching of heavy metals from storage impoundments, land "lls and secondary uses such as "ll, road grit and acid mine drainage neutralization
Increased risk of cancer, delayed mental development, reduced cognition and focus, intestinal irritation, other illnesses related to heavy metal exposure
Communities consuming water near coal ash storage and disposal sites
Stant (2010), Quarles (2010), EPA
Coal ash particulates In!ammation of the lungs (observed in mice)
Individuals living near coal ash land"lls
Gilmore (2004)
Exposure to coal ash via construction materials such as dry wall board and concrete
Unknown Construction workers Unknown
Risk of !ooding Potential loss of life, damage to property, Psychological stress
Communities living below coal ash impoundments
T.V.A. coal ash spill, Tennessee (2008), We Energies coal ash spill, Wisconsin (2011)
Coal Combustion Waste Health Impacts Summary
2424A Report from Kentucky Environmental Foundation
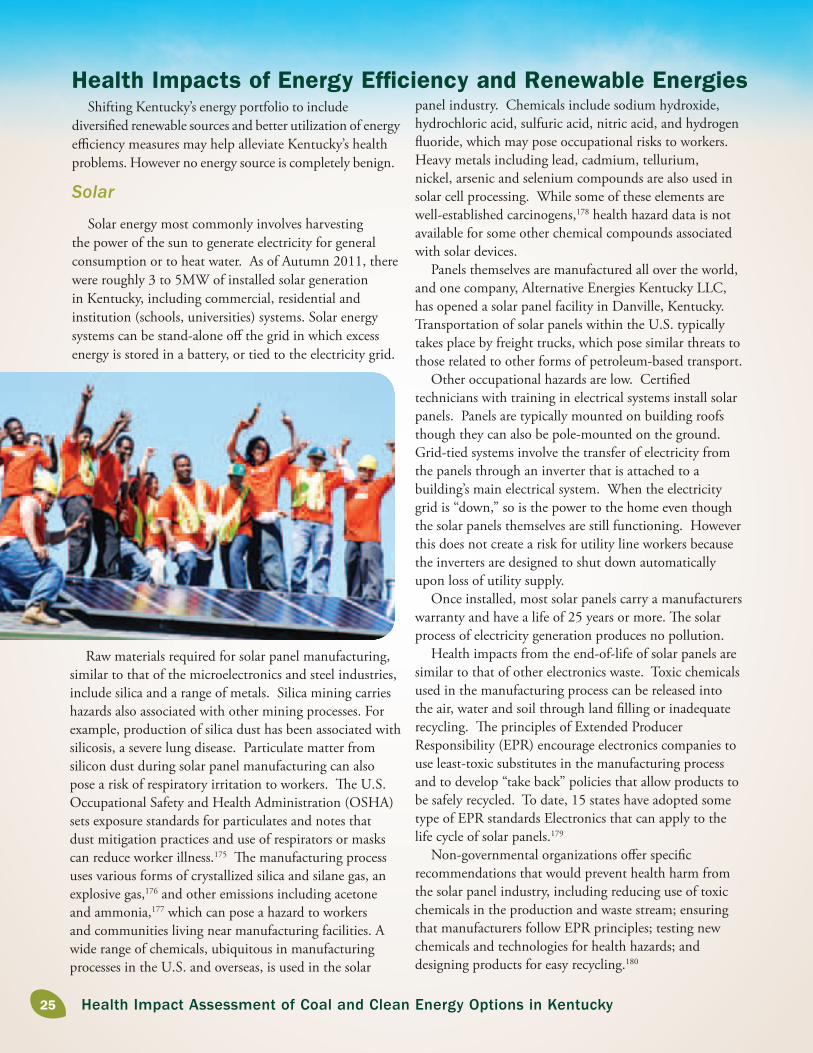
Health Impacts of Energy Efficiency and Renewable EnergiesShifting Kentucky’s energy portfolio to include
diversi!ed renewable sources and better utilization of energy e#ciency measures may help alleviate Kentucky’s health problems. However no energy source is completely benign.
Solar
Solar energy most commonly involves harvesting the power of the sun to generate electricity for general consumption or to heat water. As of Autumn 2011, there were roughly 3 to 5MW of installed solar generation in Kentucky, including commercial, residential and institution (schools, universities) systems. Solar energy systems can be stand-alone o$ the grid in which excess energy is stored in a battery, or tied to the electricity grid.
panel industry. Chemicals include sodium hydroxide, hydrochloric acid, sulfuric acid, nitric acid, and hydrogen %uoride, which may pose occupational risks to workers. Heavy metals including lead, cadmium, tellurium, nickel, arsenic and selenium compounds are also used in solar cell processing. While some of these elements are well-established carcinogens,178 health hazard data is not available for some other chemical compounds associated with solar devices.
Panels themselves are manufactured all over the world, and one company, Alternative Energies Kentucky LLC, has opened a solar panel facility in Danville, Kentucky. Transportation of solar panels within the U.S. typically takes place by freight trucks, which pose similar threats to those related to other forms of petroleum-based transport.
Other occupational hazards are low. Certi!ed technicians with training in electrical systems install solar panels. Panels are typically mounted on building roofs though they can also be pole-mounted on the ground. Grid-tied systems involve the transfer of electricity from the panels through an inverter that is attached to a building’s main electrical system. When the electricity grid is “down,” so is the power to the home even though the solar panels themselves are still functioning. However this does not create a risk for utility line workers because the inverters are designed to shut down automatically upon loss of utility supply.
Once installed, most solar panels carry a manufacturers warranty and have a life of 25 years or more. "e solar process of electricity generation produces no pollution.
Health impacts from the end-of-life of solar panels are similar to that of other electronics waste. Toxic chemicals used in the manufacturing process can be released into the air, water and soil through land !lling or inadequate recycling. "e principles of Extended Producer Responsibility (EPR) encourage electronics companies to use least-toxic substitutes in the manufacturing process and to develop “take back” policies that allow products to be safely recycled. To date, 15 states have adopted some type of EPR standards Electronics that can apply to the life cycle of solar panels.179
Non-governmental organizations o$er speci!c recommendations that would prevent health harm from the solar panel industry, including reducing use of toxic chemicals in the production and waste stream; ensuring that manufacturers follow EPR principles; testing new chemicals and technologies for health hazards; and designing products for easy recycling.180
Raw materials required for solar panel manufacturing, similar to that of the microelectronics and steel industries, include silica and a range of metals. Silica mining carries hazards also associated with other mining processes. For example, production of silica dust has been associated with silicosis, a severe lung disease. Particulate matter from silicon dust during solar panel manufacturing can also pose a risk of respiratory irritation to workers. "e U.S. Occupational Safety and Health Administration (OSHA) sets exposure standards for particulates and notes that dust mitigation practices and use of respirators or masks can reduce worker illness.175 "e manufacturing process uses various forms of crystallized silica and silane gas, an explosive gas,176 and other emissions including acetone and ammonia,177 which can pose a hazard to workers and communities living near manufacturing facilities. A wide range of chemicals, ubiquitous in manufacturing processes in the U.S. and overseas, is used in the solar
2525 Health Impact Assessment of Coal and Clean Energy Options in Kentucky

WindWind energy potential is determined by wind speeds
at speci!c geographic locations as well as by the height of the wind turbine, comprised of a tower, hub, blades, gearboxes and a generator. Earlier wind turbine heights topped at 80 meters, but utility-scale turbines can also have hub heights of 120 meters or more. "e National Renewables Energy Laboratory and AWS Truewind determined in 2009 that wind energy potential in Kentucky could be nearly 50,000 megawatts for wind turbines with a 100-meter hub height.181
Turbine component parts are manufactured in the U.S. and overseas. Occupational health and safety impacts for wind turbines component parts are similar to that of other metals manufacturing processes. Once installed, wind turbines require occasional routine maintenance, and produce no pollution.
Wind turbines emit low frequency vibrations, low frequency noise from the gearbox and shadow %ickers as the blade shadows move across the ground.182 In a document called “Public Health Impacts of Wind Turbines,” written to assess the impacts of proposed wind turbines in Minnesota, researchers examined variable human sensitivities to these low frequency disturbances and concluded that the health impacts are generally not a problem for businesses, public buildings or for people outdoors.183 "e National Research Council had in its 2007 study concluded that these disturbances are not a concern beyond a half-mile from the turbine site. Disturbances to nearby populations can be limited by attention to turbine siting.
HydroelectricityKentucky rivers currently generate roughly 2,605
MWh of electricity through hydroelectric dams.184 "e National Renewables Energy Laboratory estimates that an additional 887 MW could be generated from existing small-scale hydro dams in Kentucky waterways.
Hydroelectricity is the production of electrical power through the use of the gravitational force of falling or %owing water, through a hydraulic turbine that is connected to a generator. "e water exits the turbine and is returned to a stream or riverbed below the dam. Once operating, occupational hazards are low as only routine mechanical maintenance is required.185 Dams do not release pollution into the water or air and therefore have little to no impact on human health. Still, organizations such as the Low Impact Hydropower Institute o$er voluntary certi!cation of “low impact” hydro facilities, to encourage owners to minimize environmental impacts. In 2007 the Mother Ann Lee Hydroelectric Station on the Kentucky River received its Low Impact certi!cation.186
Biomass
"e Kentucky Governor’s plan of 2008 pushes for tripled production of renewable energy by 2025.187 While renewable sources in the proposal include hydro and solar, more than 50% would be comprised of bio-fuels such as wood and land!ll gas. Like coal, burning biomass can produce particulates less than 2.5 microns, nitrogen oxides, and volatile organic compounds that increase smog and ozone. Health concerns are therefore similar to those produced by emissions of coal-based power plants.188,189,190 National organizations such as the American Lung Association, American Cancer Society and the U.S. EPA’s Clean Air Scienti!c advisory committee have articulated concern about the signi!cant health impacts of !ne particulate air pollution. Other concerns have been raised around the potential health e$ects of speci!c biomass sources. Wood products containing formaldehyde, chicken waste and switch grass may have varying levels of particulates and combusted by-products. Such concerns should be included with the development of Kentucky’s energy portfolio.
Energy ef!ciency
Beyond production, Kentucky’s energy use impacts the health of its citizens. Homes with poor e#ciency are associated with a range of health concerns including higher rates of respiratory disease, lower HRQOL and more frequent trips to the doctor.191,192 High energy use also has economic implications for many low income families. Costs of heating ine#cient homes can exceed the cost of a mortgage or rent payment, creating tremendous !nancial burden.
Mother Ann Lee Hydroelectric Station
2626A Report from Kentucky Environmental Foundation
Investments in energy e#ciency and renewable energy can be healthy for Kentuckians. Studies indicate that insulating existing houses can lead to signi!cantly warmer, drier indoor environments resulting in improved self-rated health, reduced wheezing, fewer days o$ school and work as well as fewer hospital admissions for respiratory conditions.193,194 Energy e#cient lighting in schools and workplaces improves safety, increases learning, and improves social interaction and physical health.195 Weatherization programs also improve water and heating systems, which ultimately reduce the risk of !re.196
Energy ef!cient lightingUtilizing natural lighting can o$er physical and mental
health bene!ts including less eye-strain. Energy e#cient electric lighting also holds many health bene!ts including avoided unnecessary pollution from fossil fuels. Compact %orescent lightbulbs (CFLs) can save as much as $6 a year in electricity costs and can save more than $40 over its lifetime.197 In addition, research indicates that verbal-intellectual task performance and visual performance may be better under electronic ballasts than older, less e#cient magnetic ballasts.198
CFLs contain a small amount of mercury that could be released into the environment if a bulb breaks.& CFL manufacturers and the Environmental Protection Agency’s Energy Star program o$er guidelines for cleaning up and disposing of broken CFLs to limit the risk of human exposure to mercury.& Overall, the health bene!ts of CFLs greatly outweigh the potential risks of mercury exposure. For example, the Environmental Protection Agency estimates that one 60 watt incandescent bulb results in 5.8 mg of mercury from electricity usage, while one 13 watt CFL results in only 1.6 mg of mercury.
Moreover, unbroken CFLs can be recycled.& In Kentucky, many cities o$er waste recycling services for CFLs and retail stories like Home Depot collect used bulbs for recycling regardless of where the bulbs were originally purchased.
Newer LED bulbs o$er a step-up in energy e#ciency and o$er longer-term health bene!ts because they do not contain mercury. Currently LED bulbs carry a higher sticker price however the costs are dropping as demand increases.
Energy ef!cient construction materials
Construction materials vary widely in their health and carbon footprint, and the toxicity of some materials used for energy e#cient retro!ts may impact public health.& For example, some insulation contains formaldehyde, which may leach out into homes.199& Vinyl-clad windows and doors, often used to replace older wooden models, carry a higher health impact due to the presence of highly toxic polyvinyl chlorides (PVC).& Noting the health impacts of PVC exposure in buildings, on November 2, 2011 the American Public Health Association passed a resolution calling on “decision-makers...to consider phasing out the use and purchase of %exible PVC in building materials...and facilities with vulnerable populations when cost-e$ective alternatives are available.”200
"ese health impacts are those faced in any building. However, some impacts can be mitigated or avoided with energy e#cient new construction, or renovations, when builders themselves, homeowners or landlords are informed about and utilize healthier materials.& Kentucky small businesses such as the Bluegrass Green Company in Louisville provide non-toxic building materials as do larger hardware retail stores.& Organizations such as the Healthy Building Network, through its Pharos database, provide access to comprehensive health and pollution screening data on a wide range of construction materials.201& In addition, proper ventilation of homes on a new or newly weatherized home is essential.& "e Department of Energy’s& Weatherization Assistance Program (WAP) provides guidelines and requirements that all homes weatherized after January 1, 2012, must meet the most recent minimum ventilation standards. WAP guidelines also outline health and safety standards for workers and materials in order to limit accidents or exposures. In Kentucky, WAP requirements are implemented by the Kentucky Housing Corporation.&&&
2727 Health Impact Assessment of Coal and Clean Energy Options in Kentucky

Marshall Porter, 23, from Elizabethtown, Kentucky-
“Back in 2004 we replaced our existing single pane windows with double pane argon windows. The original windows were dif!cult to open and were drafty. After having the new energy ef!cient windows installed we instantly noticed the energy savings as well as a difference in temperature control. Before we got the windows, in the summer the electric bills were sometimes over $200 but now it is rare to pay even $100. Replacing the windows was absolutely worth the investment, we save money all year round. I think it would be wonderful for people to have government assistance in energy saving efforts not only for the sake of saving energy but also because it can help improve the value of their homes and give them a better quality of life.”
Home energy ef!ciency improves respiratory health
Improving energy e#ciency can reduce air pollution and the associated illnesses and deaths.202 Researchers in California estimated in 2006 that a state energy e#ciency program to add !berglass attic insulation to electricity-heated homes would result in a four-fold reduction in disease burden – a net avoidance of premature deaths from exposure to power plant soot – over the life of the insulation, even considering occupational health concerns associated with manufacturing the insulation. 203
One study by Levy and colleagues found that upgrading insulation for approximately 46 million single family homes in the U.S. with poor or adequate insulation would save 800 BTU (8 ' 1014 British "ermal Units). "is would result in 3,100 fewer tons of PM2.5, 100,000 fewer tons of NOx, and 190,000 fewer tons of SO2 per year. "e emission reductions would be associated with outcomes including 240 fewer deaths, 6,500 fewer asthma attacks, and 110,000 fewer restricted activity days per year. Corresponding health bene!ts include $1.3 billion in externalities averted and $5.9 billion in economic savings annually. 204
Nishioka and colleagues determined the reductions in risk of illness and death tied to electricity production by installing high quality insulation (International Energy Conservation Code) in all new home construction. Su#cient insulation would lead to a national reduction of over 1000 tons of PM2.5, 30,000
tons of NOx and 40,000 tons of SO2 and would lead to 60 fewer deaths over a ten year time period. Adoption of a more stringent code of insulation for new homes in Kentucky would also lead to reductions of PM2.5, NOx and SOx. Out of all 50 states, improvement in insulation standards for Kentucky and West Virginia would lead to the greatest reduction in air pollution. "is is due to the fact that many Kentucky homes use electric space heating with electricity provided by higher emitting power plants. Kentucky ranked third in this study for its potential to reduce the risk of mortality caused by power plant emissions. 205
Good, e#cient air ventilation also improves health. Individuals living in new homes with heat recovery ventilators reported improvements in respiratory health including throat irritation, cough and fatigue, over the course of one year compared to occupants in new homes without the e#ciency modi!cation.206
The “heat or eat dilemma”Families in Kentucky can spend over $300-400 a
month to heat poorly insulated houses or trailers.207 "is often leads to the “heat or eat” dilemma to which families must decide between paying their heating bill and having money to buy groceries. "e !nancial burden can impact the nutrition of children and has been associated with higher rates of anemia. 208, 209 Families that spend a signi!cant portion of their budget on housing costs also have increased psychological stress210 and reduced resources to spend on medical care. State investments in energy e#ciency could reduce this !nancial disparity freeing up funds to spend on more nutritious food. Programs that help improve the e#ciency of homes also lead to fewer cut-o$s and reconnection fees for delinquency.211
2828A Report from Kentucky Environmental Foundation
Richardsville Elementary School in Warren County Kentucky was the !rst school in the country to operate with a net zero energy design. The school, which serves approximately 500 students, preschool through 5th grade, has a LEED Gold certi!cation by the U.S. Green Building Council. Through the use of energy ef!ciency measures including insulated concrete form wall construction, a high performance building envelope, active day-lighting, and geothermal HVAC with CO2 monitoring and de-centralized pumping, the school has signi!cantly cut down on heating, lighting and appliance costs. A thin !lm photovoltaic system adhered to the roof produces electricity for the school.220 After an energy audit the school also incorporated simple behavior change techniques to save energy such as turning off the lights when leaving the classroom. The school also set up “energy teams” with the students to further study and promote actions for saving energy.
Work towards energy ef!ciency is not new to Kentucky schools. In 1990, Paint Lick elementary school installed the !rst geothermal system in the state. Since then more than 290 schools have added geothermal systems to help offset heating and cooling costs.221 Through projects such as the Green Schools Program more than 100 Kentucky schools now have ENERGY STAR certi!cation.222 Working towards energy ef!cient buildings can ultimately be good for both student’s education and their environmental health.
Building a healthy economy
Kentucky’s lack of diversity in energy generation increases economic risk. Coal based electricity rates have increased as much as 30% from 2009 to 2011. While the U.S. Department of Energy estimates that Kentucky has approximately 14,480 million tons of estimated recoverable reserves,213 the downward trend of coal production over the last 10 years may suggest that Kentucky has already peaked in !nancially viable coal.214 "e contribution of coal to the national energy mix is also expected to decline from 45 to 43%. In addition, coal mined from the Appalachian region is expected to increase in price leading to a decrease in production and a stronger dependence on coal from the Powder River Basin. Such trends suggest that diversifying Kentucky’s energy economy would improve the economic health of the region.215
Projections made by the U.S. Energy Information Administration predict that the renewable electricity
Jerry Workman is familiar with the association between energy bills and struggling to get by. As coordinator of the Berea Food Bank and Bereans United for Utility and Rent Relief (BUURR), Workman helps alleviate the burden of energy bills and buying groceries by providing partial assistance with rent, utilities, and groceries to families in need. It makes sense that these two organization work closely together, because as Workman notes, “Most of the time when people are having trouble with their utilities, they’re also having trouble with food. Food is energy. There is an intermarriage between the food bank and BUURR, because most of the time when people are talking about utilities, they’re also talking about food.” When families fall on hard times, they are forced to prioritize their spending, creating some dif!cult decisions. In 2011, Workman had seen 97 of those families come to BUURR for help with their bills and 536 of those families at the Food Bank. The average amount that BUURR distributed to a family was $97.32. He shared the hardships of his community through raw data, “There have been 750 visits, which means that many families have been here more than once. Of the families that have been in so far this year, 36% have never been to the food bank before. It’s been a hard year.”212
sector will expand from 10 to 14% by 2035.216 "is shift will utilize sources such as wind and solar and could improve the health of 700,000 US workers and potentially eliminate 1,300 worker deaths over the coming decade by reducing risk in the energy extraction phase.217 A new report by Synapse Energy Economics estimates that the Clean Energy Opportunity Act (HB 167) introduced in the 2012 Kentucky legislative session could create over 28,000 jobs for the state over the next 10 years. "is is over and above those that might be lost to fossil fuel extraction.218 Transitioning from one primary source of energy to a diversi!ed portfolio could strengthen the economy and improve the health concerns related to Kentucky’s coal based electricity generation.219
2929 Health Impact Assessment of Coal and Clean Energy Options in Kentucky

Jonita Horn, eastern KY resident
Some Kentuckians are concerned about a shift from coal based energy to other forms of renewable energy production. Members of Jonita Horn’s family work in the coal industry and have depended on coal mining for their income. She feels that if energy policies change, alterative industries must move into Kentucky’s mining regions to ensure employment within the region.
“I really like the idea of policies that support clean energy. There is no doubt that all this coal we burn is polluting us just as much as it is polluting our planet. However, I have some very real concerns [on what a shift from coal] might do to the people who rely on coal for their livelihood. We know that similar programs have created many jobs, but we do not know who ended up !lling those jobs. Obviously, the counterpart to more clean energy is less dirty energy. The jobs that are created will also mean jobs that are lost. It is very important that the men and women that rely on coal for their living have !rst chance at these jobs…It would also be important for the jobs to pay at least as much as the coal so that people could maintain their standard of living.”
(Photo credit: J.M. Hibberd) 3030A Report from Kentucky Environmental Foundation

HEALTH DETERMINANT EFFECTS ON HEALTH AFFECTED POPULATIONS
EVIDENCE OF HEALTH DETERMINANT IMPACT ON HEALTH
Wind turbines Negligible affect on health Those living near turbines MN Dept. of Health, Env. Health Division, Natl. Resource Council
Wind Turbines:Zero emissions during energy production
Reduced lung and heart disease All Kentuckians All research pertaining to particulate matter
Solar Panels:Production (silica dust)
Silicosis Silica miners Fthenakis, Electric Power Research Institute
Solar Panels: Zero emissions during energy production
Reduced lung and heart disease All Kentuckians All research pertaining to particulate matter
Hydro electricityPlant operations:
Occupational safety hazards Plant operators Fairchild
Hydro electricity:Zero emissions during energy production
Reduced lung and heart disease All Kentuckians All research pertaining to particulate matter.
Biofuel Heart attackArtherosclerosisischemic and hemorrhagic stroke
All Kentuckians PetersBrookWellenius
Home energy ef"ciency 1. Improved comfort and quality of life
2. Improved respiratory health 3. Reduced deaths caused by air
pollution
All Kentuckians 1. Leech, Howden-Chapman, Fisk2. Howden-Chapman, Levy, Fisk,
Leech3. Nishioka, Levy, California Air
Commission
Energy ef"ciency building materials:PVC
Risk of cancer Individuals utilizing PVC based materials
EPA
Reduced spending on housing costs
1. Improved nutrition2. Reduced Psychological Stress
Low income families 1. Harkness, Schweitzer, Frank, Meyers
2. Frank
Energy ef"cient lighting Improved attention, learning, safety, and work ef"ciency
Children in schools and individuals in the work place
Veitch
Expansion of renewable energies industries
1. Reductions in injuries, disease, and fatalities associated with the extraction process of fossil fuels
2. Healthier, diversi"ed economy
1. Energy industry workers2. All Kentuckians
1. Sumner 2. Tracz
Policy: Clean Air Act Amendments
Reductions of mortality, chronic bronchitis, nonfatal and fatal heart attacks, respiratory hospital admissions, emergency room visits for children with asthma, preterm birth (expand list to include all from study)
Adults with heart and lung diseases, elderly, children living with asthma, pregnant mothers, all Kentuckians
Chestnut L.G.
Renewable and energy efficiency health impacts summary
3131 Health Impact Assessment of Coal and Clean Energy Options in Kentucky
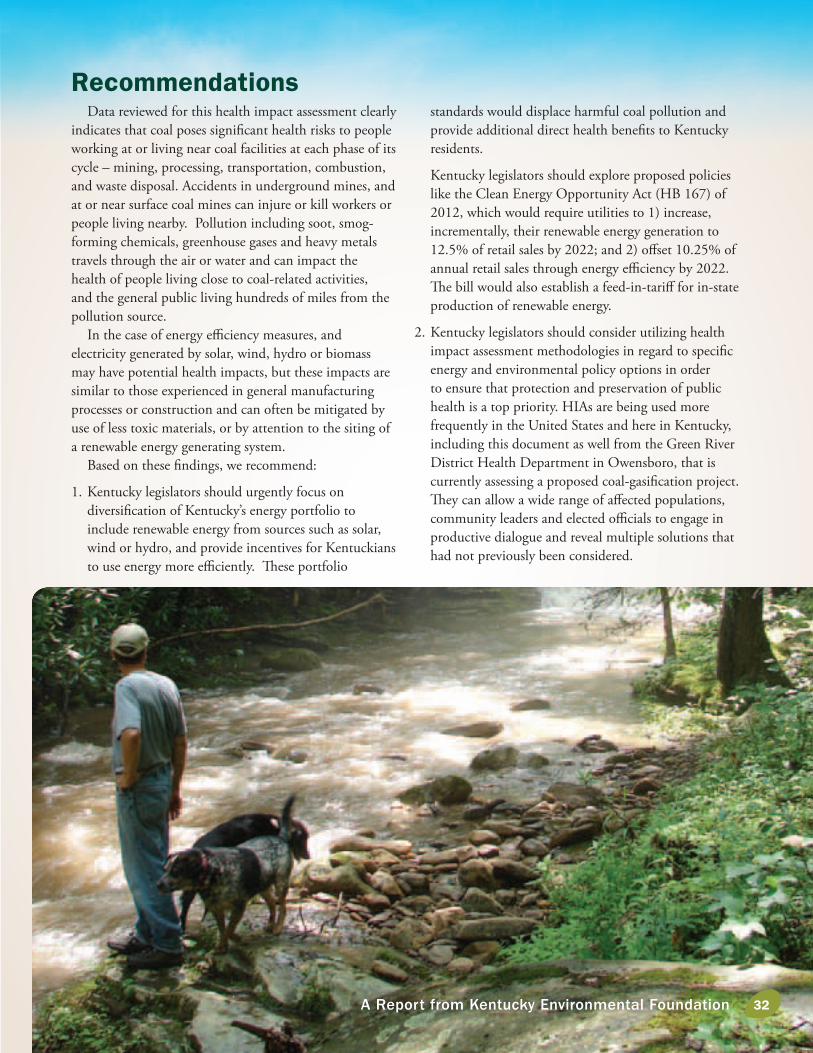
Data reviewed for this health impact assessment clearly indicates that coal poses signi!cant health risks to people working at or living near coal facilities at each phase of its cycle – mining, processing, transportation, combustion, and waste disposal. Accidents in underground mines, and at or near surface coal mines can injure or kill workers or people living nearby. Pollution including soot, smog-forming chemicals, greenhouse gases and heavy metals travels through the air or water and can impact the health of people living close to coal-related activities, and the general public living hundreds of miles from the pollution source.
In the case of energy e#ciency measures, and electricity generated by solar, wind, hydro or biomass may have potential health impacts, but these impacts are similar to those experienced in general manufacturing processes or construction and can often be mitigated by use of less toxic materials, or by attention to the siting of a renewable energy generating system.
Based on these !ndings, we recommend:
1. Kentucky legislators should urgently focus on diversi!cation of Kentucky’s energy portfolio to include renewable energy from sources such as solar, wind or hydro, and provide incentives for Kentuckians to use energy more e#ciently. "ese portfolio
Recommendationsstandards would displace harmful coal pollution and provide additional direct health bene!ts to Kentucky residents.
Kentucky legislators should explore proposed policies like the Clean Energy Opportunity Act (HB 167) of 2012, which would require utilities to 1) increase, incrementally, their renewable energy generation to 12.5% of retail sales by 2022; and 2) o$set 10.25% of annual retail sales through energy e#ciency by 2022. "e bill would also establish a feed-in-tari$ for in-state production of renewable energy.
2. Kentucky legislators should consider utilizing health impact assessment methodologies in regard to speci!c energy and environmental policy options in order to ensure that protection and preservation of public health is a top priority. HIAs are being used more frequently in the United States and here in Kentucky, including this document as well from the Green River District Health Department in Owensboro, that is currently assessing a proposed coal-gasi!cation project. "ey can allow a wide range of a$ected populations, community leaders and elected o#cials to engage in productive dialogue and reveal multiple solutions that had not previously been considered.
3232A Report from Kentucky Environmental Foundation

References1 Kentucky Sector for Energy Development and Independence.
Kentucky Energy Pro!le 2010. Kentucky Energy and Environment Cabinet. Available from: http://energy.ky.gov/Documents/Kentucky%20Energy%20Pro!le,%202010.pdf retrieved November 27, 2011
2 Hendryx M, Ahern M. Relations between health indicators and residential proximity to coal mining in West Virginia. American Journal of Public Health, 2008; 98: 669-671.
3 Hendryx M, O’Donnell K, Horn K. Lung cancer mortality is elevated in coal mining areas of Appalachia. Lung Cancer, 2008 Oct;62(1): 1-7. Epub 2008 Mar 18.
4 Hendryx M. Mortality from heart, respiratory and kidney disease in coal mining areas of Appalachia. International Archives of Occupational and Environmental Health, 2009; 82: 243-249
5 Hendryx M, Zullig K. Higher coronary heart disease and heart attack morbidity in Appalachian coal mining regions. Preventive Medicine, 2009; 49: 355-359.
6 Hendryx M, Fedorko E, Anesetti-Rothermel A. A geographical information system-based analysis of cancer mortality and population exposure to coal mining activities in West Virginia, United States of America. Geospatial Health, 2010; 4: 243-256.
7 Hendryx M. Hospitalization patterns associated with Appalachian coal mining. Journal of Toxicology and Environmental Health Part A, 2007; 70: 2064-2070
8 Ahern M, Mullett M, MacKay K, Hamilton C. Residence in coal-mining areas and low-birth-weight outcomes. Maternal and Child Health Journal, 2010; 15(7): 974-979.
9 Zullig KJ, Hendryx M. A comparative analysis of health-related quality of life (HRQOL) for residents of US counties with and without coal mining. Public Health Reports, 2010;125: 548-555.
10 Id. Hendryx M. Hospitalization patterns associated with Appalachian coal mining. JTEH. 2007.
11 Hendryx M, Ahern M. Mortality in Appalachian coal mining regions: the value of statistical life lost. Public Health Reports, 2009; 124: 541-550.
12 Center for Disease Control and Prevention. Health Related Quality of Life (HRQL). Available from: http://www.cdc.gov/hrqol/ retrieved: December 12, 2011.
13 Bell, S. E. “"ere Ain’t No Bond in Town Like "ere Used to Be”: "e Destruction of Social Capital in the West Virginia Coal!elds. Sociological Forum, 2009; 24:&631–657. doi:&10.1111/j.1573-7861.2009.01123.x
14 Cain L, Hendryx M. Learning outcomes among students in relation to West Virginia coal mining: an environmental “riskscape” approach. Environmental Justice, 2010; 3: 71-77.
15 Mainiero R, Harris M, Rowland J. Dangers of Toxic Fumes from Blasting. NIOSH-2 No. 20032444. 2007. Available from: http://www.cdc.gov/niosh/mining/pubs/pubreference/outputid2508.htm retrieved November 16, 2011.
16 Palmer MA, Bernhardt ES, Schlesinger WH, Eshleman KN, Foufoula-Georgiou E, Hendryx MS, Lemly AD, Likens GE, Loucks OL, Power ME, White PS, Wilcock PR. Consequences of mountaintop mining. Science, 2010; 327: 148-149.
17 House, S. Personal communication. October 14, 2011.
18 Hendryx M. Poverty and mortality disparities in central Appalachia: mountaintop mining and environmental justice. Journal of Health Disparities Research and Practice, 2011; 4(3): 50-59.
19 Ahern M, Hendryx M, Conley J, Fedorko E, Ducatman A, Zullig K. "e association between mountaintop mining and birth defects among live births in Central Appalachia, 1996-2003. Environmental Research, 2011;111, 838-846.
20 Esch L, Hendryx M. Chronic cardiovascular disease mortality in mountaintop mining areas of central Appalachian states. Journal of Rural Health, 2011; 27:4, 350–357.
21 Hendryx M, Wolfe L, Luo J, Webb, B. Self-reported cancer rates in two rural areas of West Virginia with and without mountaintop coal mining. Journal of Community Health, 2011 July 24 [Epub ahead of print].
22 Zullig K, Hendryx M. Health-related quality of life among central Appalachian residents in mountaintop mining counties. American Journal of Public Health, 2011;101: 848-853.
23 Simmons J, et al. Forest to reclaimed land mine use change leads to altered ecosystem structure and function. Ecological Society of America, 2008;18(1).
24 Minton, William. Personal communication. April 5, 2011.
25 Neithercut WD. E$ect of calcium, magnesium and sodium ions on in vitro nucleation of human gall bladder bile. Gut, 1989; 30, 665-670.
26 Shukla VK, Prakash A, Tripathi BD, Reddy DCS, Singh S. Biliary heavy metal concentrations in carcinoma of the gall bladder: case-control study. BMJ, 1998 Nov 7; 317(7168): 1288–1289.
27 Hitt NP, Hendryx M. Ecological integrity of streams related to human cancer mortality rates. EcoHealth, 2010; 7: 91-104.
28 Morell C. Mining Town Rises in Anger After Boy Is Killed by Boulder, Va. Residents Cite Disregard for Safety. Washington Post. January 6, 2005
29 McCoy, Mickey. Personal communication. December 8, 2011.
30 Kentucky Coal Association and Kentucky Geological Survey. Kentucky Coal Facts, 11th Edition Pocket Guide. 2011.
31 "e Canary Project. Kentuckians for the Commonwealth. Available from: http://www.kftc.org/our-work/canary-project retrieved October 4, 2011.
32 Wilkin, R. Metal Attenuation Processes at Mining Sites. EPA Groundwater Issue. September 2007.
3333 Health Impact Assessment of Coal and Clean Energy Options in Kentucky
33 T. Ty Lindberg, Emily S. Bernhardt, Raven Bier, A. M. Helton, R. Brittany Merola, Avner Vengosh, and Richard T. Di Giulio. Cumulative impacts of mountaintop mining on an Appalachian watershed. Proceedings of the National Academy of Sciences of the United States of America. Published online before print December 12, 2011, doi: 10.1073/pnas.1112381108
34 Withrow, Ted. Personal communication. December 8, 2011.
35 Grieshop, Joe. Personal communication. December 8, 2011.
36 Doria, M. Bottled water versus tap water: understanding consumers’ preferences. Journal of Water and Health, 2006; 04(2): 271-276.
37 Hirschorn, G. "irty "ousand Bottles of Drinking Water Provided to Kentucky Community A$ected by Methane-Contaminated Well Water. PR Newswire. August 18, 2011. Available from: http://www.prnewswire.com/news-releases/thirty-thousand-bottles-of-drinking-water-provided-to-kentucky-community-a$ected-by-methane-contaminated-well-water-128041838.html retrieved: December 9, 2011.
38 Ellis, R. Burning Water Well Hard to Fathom. August 29, 2011. "e E#ngham Daily News. Available from: (http://e#nghamdailynews.com/cnhins/x890683161/Burning-water-well-hard-to-fathom) retrieved: December 9, 2011.
39 Environmental Protection Agency. 2010. Drinking water contaminants: List of contaminants and their MCLs. Available from: www.epa.gov/safewater/contaminants/index.html retrieved: November 29, 2011.
40 Id. Ahern M. "e association between mountaintop mining and birth defects among live births in Central Appalachia, 1996-2003. Environmental Research, 2011.
41 Brabin B, Smith M, Milligan P, Benjamin C, Dunne E, Pearson M. Respiratory morbidity in Merseyside school children exposed to coal dust and air pollution. Archives of Disease in Childhood, 1994 Apr;70(4):305-12.
42 Pless-Mulloli T, Howel D, King A, Stone I, Mere!eld J, Bessell J, Darnell R. Living near opencast coal mining sites and children’s respiratory health. Occupational and Environmental Medicine, 2000;57:145–151.
43 Knuth, A. Mommy I Can’t Breath: What are the Respiratory E$ects in the Children of Marsh Fork Elementary School from Mountaintop Removal Coal Mining? Research in Appalachia. Wheeling Jesuit University. 2010.
44 Bonds, Julia. Health survey summary of Marsh Fork Elementary School students. Coal River Mountain Watch. 2005. Available from: http://www.ohvec.org/issues/mountaintop_removal/articles/marsh_folk_health_summary.pdf retrieved November 15, 2011.
45 Estep, Bill. Lawsuit blames coal company for %ooding death in Knoxville. Lexington Herald Leader. October 11, 2011. Available from: http://www.kentucky.com/2011/10/10/1916094/lawsuit-blames-coal-company-for.html retrieved: December 9, 2011.
46 Phillips J. Impacts of surface mine valley !lls on headwater %oods in eastern Kentucky. Environmental Geology, 2004; 45(3): 367-380.
47 Morell C. Mining Town Rises in Anger After Boy Is Killed by Boulder. Washington Post, 2005.
48 Cooper, D. Boulder From Mountaintop Coal Mine Crashes into Home. Hu#ngton Post Green. September 9, 2009. Available from: http://www.hu#ngtonpost.com/dave-cooper/boulder-from-mountaintop_b_279374.html retrieved: December 17, 2011.
49 Nater UM, Maloney E, Heim C, Reeves WC. Cumulative life stress in chronic fatigue syndrome. Psychiatry Research, 2011 Sep 30;189(2):318-20. Epub 2011 Aug 15.
50 "oits PA. Stress and health: major !ndings and policy implications. Journal of Health and Social Behavior, 2010; 51 Suppl:S41-53.
51 Futrell, R. Personal communication. December 13, 2011.
52 Id. Morell C. Mining Town Rises in Anger After Boy Is Killed by Boulder, Va. Residents Cite Disregard for Safety. Washington Post. January 6, 2005
53 Coal Operator Mining Facts 2004, CDC Department of Health and Human Services, NIOSH 2007-167.
54 U.S. Department of Labor, Bureau of Labor Statistics. Injuries, Illnesses, and Fatalities in the Coal mining industry. Fact sheet. April 2010. Available from: http://www.bls.gov/iif/oshwc/osh/os/osar0012.htm retrieved: February 20, 2011.
55 Peterson, J.S.; P.G. Kovalchik, R.J. Matetic “Sound power level study of a roof bolter” Trans Soc Min Metal Explor, 2006;(320): 171–7.
56 Joy GJ, Middendorf PJ. Noise Exposure and hearing conservation in U.S. coal mines-a surveillance report. Journal of Occupation and Environmental Hygiene, 2007 Jan; 4(1): 26-35.
57 Kuempel ED, Wheeler MW., Smith, RJ, Vallyathan V, Green FHY. Contributions of Dust Exposure and Cigarette Smoking to Emphsema Severity in Coal Miners in the United States. American Journal of Respiratory and Critical Care Medicine, 2009;180: 257-264.
58 Bertrand JP, Simon V, Chau N. Association of symptoms related to isocyanate, rueaformol, and formophenolic exposures with respiratory symptoms and lung function in coal miners. International Journal of Occupational and Environmental Health, 2007 Apr-Jun;13(2): 181-7.
59 Onder M, Onder S. Evalutaion of occupational exposures to respirable dust in underground coal mines. Industrial Health, 2009 Jan; 47 (1): 43-9.
60 Laney AS, Att!eld MD. Coal workers’ pneumoconiosis and progressive massive !brosis are increasingly more prevalent among workers in small underground coal ines in the United States. Occupational and Environmental Medicine, 2010 Jun; 67(6): 428-31.
61 Att!eld MD, Kuempel ED. Mortality amoung U.S. underground coal miners: a 23-year follow-up. American Journal of Industrial Medicine, 2003 Apr; 51(4): 231-45.
62 CDC, NIOSH. Coal and Metal/Nonmetal Mining Facts-2008. DHHS (NIOSH) Publication No. 2011–170.
3434A Report from Kentucky Environmental Foundation

63 United States Department of Labor, Mine Safety and Health Administration Fatality Statistics. http://www.msha.gov/stats/charts/chartshome.htm retrieved March 28, 2011.
64 Solis H, Main J. Injury Experience in Coal Mining. Mine Safety and Health Administration, United States Department of Labor, 2009.
65 CDC. Coal Operator Mining Facts – 2004. NIOSH Publication No. 2007-167.
66 Kentucky Energy and Environment Cabinet, Department for Natural Resources, O#ce of Mine Safety and Liscensing, Annual Reports 2000-2009. Available from: http://omsl.ky.gov/Pages/AnnualReports.aspx. Retreived: October 11, 2011.
67 Id. Kuempel ED. Contributions of Dust Exposure and Cigarette Smoking to Emphsema Severity in Coal Miners in the United States. American Journal of Respiratory and Critical Care Medicine, 2009.
68 Id. Bertrand JP. Association of symptoms related to isocyanate, rueaformol, and formophenolic exposures with respiratory symptoms and lung function in coal miners. International Journal of Occupational and Environmental Health. 2007.
69 Id. Att!eld MD. Mortality amoung U.S. underground coal miners: a 23-year follow-up. American Journal of Industrial Medicine, 2003.
70 Ibid.
71 CDC, NIOSH. Current Intelligence Bulletin Report 64, Coal Mine Dust Exposure and Associated Health Outcomes: A review of information published since 1995. April 2011.
72 Id. Onder M. Evalutaion of occupational exposures to respirable dust in underground coal mines. Industrial Health. 2009.
73 Id. Laney AS. Coal workers’ pneumoconiosis and progressive massive !brosis are increasingly more prevalent among workers in small underground coal ines in the United States. Occupational and Environmental Medicine, 2010.
74 Joy GJ; Middendorf PJ. Noise Exposure and hearing conservation in U.S. coal mines-a surveillance report. Journal of Occupation and Environmental Hygiene, 2007 Jan; 4(1): 26-35.
75 Kowalski-Trako%er KM, Alexander DW, Bruick MJ, McWilliams LJ, Reissman DB. Underground Coal Mining Disasters and Fatalities- United States. Morbidity and Mortality Weekly Report, 2009;57 (51&52).
76 United States Department of Labor, Mine Safety and Health Administration. Historical Data on Mine Disasters in the United States. Available from: http://www.msha.gov/mshainfo/factsheets/mshafct8.htm retrieved: December 3, 2011.
77 U.S. Department of Labor, Mine Safety and Health Admininstration. 2010 Preliminary Accident Reports, Fatalgrams and Fatal Investigation Reports Coal Mines. Available from: http://www.msha.gov/FATALS/FABC2010.asp retrieved: December 3, 2011.
78 Weeks JL. Occupational health and safety regulation in the coal mining industry: public health at the workplace. Annual Review of Public Health, 1991;12:195-207.
79 Wilham, Justin. Interview of Eddie Bostic. October 31, 2011.
80 Buchanan, Brittany. Interview of Sam Buchanan. October 30, 2011.
81 Horn, Jonita. Anonymous interview. October 31, 2011.
82 Coleman PJ, Kerkering JC. Measuring mining safety with indjury statistics: lost workdays as indicators of risk. Journal of Safety Research. 2007;38 (5): 523-33.
83 Scott DF, Grayson RL, Metz EA. Disease and Illness in U.S. Mining, 1983-2001. Journal of Occupational And Environmental Medicine, 2004 Dec;46 (12): 1272-7.
84 EPA. Basic Information about Acrylamide in Drinking Water. Available at: http://water.epa.gov/drink/contaminants/basicinformation/acrylamide.cfm#What%20are%20acrylamide’s%20health%20e$ects Retrieved: December 4, 2011.
85 Wheeling Jesuit Universtiy. Coal Impoundment Location & Information System. Available from: http://www.coalimpoundment.org/locate/list.asp retrieved: November 23, 2011.
86 ATSDR, 2005, Health consultation: Private well water quality, Williamson WV sites (aka Williamson Area): Atlanta, Ga., Agency for Toxic Substances and Disease Registry, Public Health Service, U.S. Department of Health and Human Services, 31 p.
87 Stout, B. Household water quality associated with slurry disposal. To: Davitt McAteer, Vice President for Sponsored Programs National Technology Transfer Center, Wheeling Jesuit University Memo. Aug. 3 2009.
88 Bunnell J. Preliminary Toxicological Analysis of the E$ect of Coal Slurry Impoundment Water on Human Liver Cells. USGS Open-File Report 2008–1143.
89 West Virginia Department of Environmental Protection. Selenium-induced developmental deformities among !shes in West Virginia. 2010.
90 Stout B, Papillo J. Well water quality in the vicinity of a coal slurry impoundment near Williamson West Virginia. Prepared in response to January 15, 2004 training session of the Coal Impoundment Location and Warning System, Delbarton West Virginia. Wheeling Jesuit University, 2004.
91 Loo, C.Y., K. Mitrakul, I. B. Voss, C. V. Hughes, & N. Ganeshkumar. Involvement of the adc operon and manganese homeostasis in Streptococcus Gordonii bio!lm formation. Journal of Bacteriology, 2003;185: 2887-2900.
92 Nugent, T. (1973) Death at Bu$alo Creek: "e 1972 West Virginia Flood Disaster. New York: W. W. Norton & Company.
93 O#ce of Surface Mining Reclamation and Enforcement. Report on October 2000 Breakthrough at the Big Branch Slurry Impoundment. Available from: http://www.osmre.gov/resources/newsroom/News/Archive/2002/030402%20Report/introduction.pdf Retrieved: December 4, 2011.
94 EPA Region 4: Freedom of Information. Martin County Coal Corp., Pollution Reports. Available from: http://www.epa.gov/region4/foiapgs/readingroom/martincoal/r4mccpolreps.html Retrieved: December 4, 2011.
3535 Health Impact Assessment of Coal and Clean Energy Options in Kentucky

95 Lovan, D. Inez Coal Slurry Spill: Toxic Sludge From Massey Facility Still Pollutes Kentucky Town A Decade After Disaster. Hu#ngton Post Green. 10/10/10. Available from: http://www.hu#ngtonpost.com/2010/10/11/inez-coal-slurry-spill-to_n_757900.html Retrieved: December 3, 2011.
96 Kentucky Transportation cabinet, Coal Haul Highway System Annual Report, 2011. Coal Ton-Miles and Percentages of Ton-Miles. Available from: http://transportation.ky.gov/Planning/Documents/COALTONSDLG.pdf Retrieved November 29, 2011.
97 Association of American Railroads. U.S. Freight Railroad Industry Snapshot. Available from: http://www.aar.org/KeyIssues/Railroads-States.aspx Retrieved: February 24, 2011.
98 U.S. Army Corps of Engineers. Kentucky 2008 Waterborne Commerce to, from and within the State. Available from: http://outreach.lrh.usace.army.mil/States/KY/Default.htm Retrieved: November 29, 2011.
99 Department of Transportation. Federal Highway Administration. Assessing the E$ects of Freight Movement on Air Quality Final Report. April 2005.
100 Epstein PR, Buonocore JJ, Eckerle K, Hendryx M, Stout BM, Heinberg R, Clapp RW, May B, Reinhart N, Ahern MM, Doshi SK, and Glustrom L. Full cost accounting for the life cycle of coal in “Ecological Economics Reviews.” New York Academy of Sciences, 2011; 1219: 73–98.
101 Bhatia R, Lopopero P, and Smith, AH. Diesel Exhaust Exposure and Lung Cancer. Epidemiology, 1998;9(1), 84-91.
102 Bureau of Labor statistics. Census of Fatal occupational injuries by industry and event or exposure, All United States. 2009.
103 Federal Railroad Administration, O#ce of Safety Analysis. Kentucky Summary by Calendar Year. Available from: http://safetydata.fra.dot.gov/O#ceofSafety/publicsite/Query/tenyr2a.aspx Retrieved: March 16, 2011.
104 Class 1 Railroads, Association of American Railroads. Available from: http://www.aar.org/PubCommon/Documents/About"eIndustry/Statistics.pdf Retrieved: February 24, 2011.
105 Id. Epstein P, et al. Full cost accounting for the life cycle of coal in “Ecological Economics Reviews.” Science. 2011.
106 Carter, P. Member’s Story. Kentuckians for the Commonwealth. Available from: http://www.kftc.org/our-work/canary-project/campaigns/coal-trucks/patsy-carter/?searchterm=coal%20trucks Retrieved: December 9, 2011.
107 Nunn, K., Hudson, N., Robeson, S. Kentucky Asthma Surveillance Report 2009. Kentucky Department for Public Health, 2009.
108 W. Minton, Personal communication, November 3, 2011.
109 Center for Disease Control and Prevention, Behavioral Risk Factor Surveillance System. Prevelence and Trends Data, Kentucky-2010 Overweight and Obesity (BMI). Available from: http://apps.nccd.cdc.gov/BRFSS/display.asp?cat=OB&yr=2010&qkey=4409&state=KY Retrieved: November 29, 2011.
110 Source Watch. Existing Coal Plants in Kentucky. Available from: http://www.sourcewatch.org/index.php?title=Category:Existing_coal_plants_in_Kentucky Retrieved: November 21, 2011.
111 Clean Air Task Force. "e Toll from Coal: An Updated Assessment of Death and Disease from America’s Dirtiest Energy Source. September 2010.
112 EPA. Nitrogen Dioxide, Health. Available from: http://www.epa.gov/air/nitrogenoxides/health.html Retrieved: December 8, 2011.
113 Ji M, Cohan DS, Bell ML. Meta-analysis of the Association between Short-Term Exposure to Ambient Ozone and Respiratory Hospital Admissions. Environmental Research Letters, 2011 Apr;6(2). pii: 024006.
114 Lockwood A, Welker-Hood K, Rauch M, Gottlieb B. Coal’s Assault on Human Health. Physicians for Social Responsibility. November 2009.
115 EPA. Sulfur dioxide, Health. Available from: http://www.epa.gov/airquality/sulfurdioxide/health.html Retrieved: December 8, 2011.
116 EIA Energy Information Administration. Emissions of Greenhouse Gases Report 2009. Available from: www.eia.goe.gov Retrieved: March 7, 2011.
117 Fisher J, Wilson R, Hughes N, Wittenstein M, Biewald B. Bene!ts of Beyond BAU : Human, Social, and Environmental Damages Avoided through the Retirement of the US Coal Fleet. Civil Society Institute, January 25, 2011.
118 Brook RD, Rajagopalan. Particulate matter air pollution and atherosclerosis. Current Artherosclerosis Reports, 2010 Sep; 12(5): 291-300.
119 Brook RD, Brook JR, Urch B, Vincent R, Rajagopalan S, Silverman F. Inhalation of !ne particulate air pollution and ozone causes acute arterial vasoconstriction in healthy adults. Circulation, 2002 Apr 2;105 (13): 1534-6.
120 Brook RD, Rajagopalan S. Particulate matter, air pollution, and blood pressure. Journal of the American Society of Hypertension, 2009 Sep-Oct; 3(5): 332-50.
121 Peters A, Dockery DW, Muller JE, Mittleman MA. Increased particulate air pollution and the triggering of myocardial infarction. Circulation. 2001 Jun 12; 103(23): 2810-5.
122 Wellenius GA, Schwartz J, Mittleman MA. Air pollution and hospital admissions for ischemic and hemorrhagic stroke among medicare bene!ciaries. Stroke, 2005 Dec; 36(12): 2549-53. Epub 2005 Oct 27.
123 Dockery DW, Pope CA 3rd, Xu X, Spengler JD, Ware JH, Fay ME, Ferris BG Jr, Speizer FE. An association between air pollution and mortality in six U.S. cities. New England Journal of Medicine,1993 Dec 9; 329(24): 1753-9.
124 Id. Brook. Particulate matter air pollution and atherosclerosis. Current Artherosclerosis Reports, 2010.
125 Brook RD. Cardiovascular e$ects of air pollution. Clinical Science, 2008 Sep; 115(6): 175-87.
3636A Report from Kentucky Environmental Foundation

126 Künzli N, Kaiser R, Medina S, Studnicka M, Chanel O, Filliger P, Herry M, Horak F Jr, Puybonnieux-Texier V, Quénel P, Schneider J, Seethaler R, Vergnaud JC, Sommer H. Public-health impact of outdoor and tra#c-related air pollution: a European assessment. Lancet. 2000 Sep 2; 356(9232): 795-801.
127 Brook RD, et al. Particulate Matter Air Pollution and Cardiovascular Disease: An Update to the Scienti!c Statement from the American Heart Association. Circulation. 2010; 121: 2331-2378.
128 Id. Nunn, K. Asthma Surveillance Report 2009. Kentucky Department for Public Health, 2009.
129 Khatri SB, Holguin FC, Ryan PB, Mannino D, Erzurum SC, Teague WG. Association of ambient ozone exposure with airway in%ammation and allergy in adults with asthma. "e Journal of Asthma, 2009 Oct; 46(8): 777-85.
130 Clean Air Task Force. Kentucky State Exposure to Coal Fired Power Plants. Available from: www.catf.us/resources/factsheets/!les/Children_at_Risk-Kentucky.pdf 2002. Retrieved: February 3, 2011.
131 Ibid.
132 McLendon P, Robeson S. Asthma in Kentucky ~ Hitting the Airways. Kentucky Epidemiologic Notes and Reports, Jul. 2004 Vol. 39, 6.
133 Id. Nunn, K. Asthma Surveillance Report 2009. Kentucky Department for Public Health, 2009.
134 Herr CEW, Ghosh R, Dostal M, Skokanova V, Ashwood P, Lipsett M, Joad JP, Pinkerton KE, Yap P-S, Frost JD, Sram R, Hertz-Picciotto I. Exposure to air pollution in critical prenatal time windows and IgE levels in newborns. Pediatric Allergy Immunology, 2011; 22: 75-84.
135 Slama R, Morgenstern V, Cyrys J, Zutavern A, Herbarth O, Wichmann HE, Heinrich J; LISA Study Group. Tra#c-related atmospheric pollutants levels during pregnancy and o$spring’s term birth weight: a study relying on a land-use regression exposure model. Environmental Health Perspectives, 2007 Sep; 115(9): 1283-92.
136 Lin CM, Li CY, Yang GY, Mao IF. Association between maternal exposure to elevated ambient sulfur dioxide during pregnancy and term low birth weight. Environmental Research, 2004 Sep; 96(1): 41-50.
137 Parker JD, Mendola P, Woodru$ TJ. Preterm birth after the Utah Valley Steel Mill closure: a natural experiment. Epidemiology. 2008 Nov; 19(6): 820-3.
138 Tang D, Li TY, Liu JJ, Zhou ZJ, Yuan T, Chen YH, Rauh VA, Xie J, Perera F. E$ects of prenatal exposure to coal-burning pollutants on children’s development in China. Environmental Health Perspectives. 2008 May; 116(5): 674-9.
139 Lacasaña M, Esplugues A, Ballester F. Exposure to ambient air pollution and prenatal and early childhood health e$ects. European Journal of Epidemiology, 2005;20(2):183-99.
140 Chestnut LG, Mills DM. A fresh look at the bene!ts and costs of the U.S. acid rain program. Journal of Environmental Management, 2005; 77: 252-256.
141 Id. Fisher J. Bene!ts of Beyond BAU : Human, Social, and Environmental Damages Avoided through the Retirement of the US Coal Fleet. Civil Society Institute. 2011.
142 Rayens K, Burkhart P, Zhang M, Lee S, Moser D, Mannino D, Hahn E. Reduction in asthma-related emergency department visits after implementation of a smoke-free law. "e Journal of Allergy and Clinical Immunology, 2008 Sep;122(3):537-41.e3. Epub 2008 Aug 9.
143 Khudar S, Milz S, Jordan T, Price J, Silvestri K, Butler P. "e impact of a smoking ban on hospital admissions for coronary heart disease. Preventive Medicine, 2007 Jul;45(1):3-8. Epub 2007 Apr 4.
144 EPA O#ce of Air Quality Planning & Standards and O#ce of Research and Development. Mercury study report to Congress. Volume II: an inventory of anthropogenic mercury emissions in the United States; Dec 1997: EPA-452/R-97-004.
145 Kentucky Division of Fish and Wildlife Resources. Fish Consumption Advisories. Available from: http://fw.ky.gov/!shadvisory.asp?lid=900&NavPath=C101. Retrieved: October 27, 2011.
146 Renzoni A, Zino, F, and Franchi E. Mercury levels along the food chain and risk for exposed populations. Environmental Research,1998; 77.2: 68-72.
147 Davis, D. 2002. When smoke ran like water: Tales of environmental deception and the battle against pollution. New York: Basic Books.
148 Risher J, Murray E, and Prince G. Organic mercury compounds: human exposure and its relevance to public health. Toxicology & Industrial Health, 2002;18.3: 109-160.
149 Trasande L, Landrigan PJ, Schechter C. Public health and economic consequences of methyl mercury toxicity to the de- veloping brain. Environ Health Perspect 2005; 113(5):590–596.
150 U.S. EPA. Inventory of U.S. greenhouse gas emissions and sinks: 1990–2007. 2009: EPA-430/R-09-004. Available from: http://www.epa.gov/climatechange/emissions/ usinventoryreport.html. Retrieved: December 3, 2011.
151 U.S. EPA. Methane. Available from: http://www.epa.gov/methane/sources.html. Retrieved December 3, 2011.
152 Yard EE, Gilchrist J, Haileyesus T, Murphy M, Collins C, McIlvain N, Comstock RD. Heat illness among high school athletes--United States, 2005-2009. Journal of Safety Research. 2010 Dec;41(6):471-4. Epub 2010 Oct 13.
153 Haines A, Kovats RS, Campbell-Lendrum D, Corvalan C. Climate change and human health: impacts, vulnerability and public health. Public Health. 2006 Jul;120(7):585-96. Epub 2006 Mar 20.
154 Brownstein JS, Holford TR, Fish D. E$ect of Climate Change on Lyme Disease Risk in North America. Ecohealth, 2005 March;2(1):38-46.
155 Mohammed A, Chadee DD. E$ects of di$erent temperature regimens on the development of Aedes aegypti (L.) (Diptera: Culicidae) mosquitoes. Acta Tropica, 2011 Jul;119(1):38-43. Epub 2011 Apr 28.
3737 Health Impact Assessment of Coal and Clean Energy Options in Kentucky
156 Patz JA, Campbell-Lendrum D, Holloway T, and Foley JA. Impact of regional climate change on human health. Nature, 2005; 438: 310-317.
157 Knowlton K, Rotkin-Ellman M, Geballe L, Max W, Solomon GM. Six climate change-related events in the United States accounted for about $14 billion in lost lives and health costs. Health A$airs (Millwood), 2011 Nov;30(11):2167-76.
158 Abanades JC, et al. 2005. Carbon Dioxide Capture and Storage, Summary for Policymakers. A Special Report of Working Group III of the Intergovernmental Panel on Climate Change.
159 Id. Lockwood, A.H. Coal’s assault on human health. Physicians for Social Responsibility. 2009.
160 Groppo, J. Personal communication. September 28, 2010.
161 U.S. EPA and United States Department of Energy (U.S. DOE). Coal Combstion Waste Management at Land!lls and Surface Impoudments, 1994-2004, August 2006.
162 U.S. EPA. Database of coal combustion waste surface impoundments, 2009.
163 Quarles M and Segall C. Slow Motion Spills: Coal Combustion Waste and Water in Kentucky. Sierra Club, Kentucky Waterways Alliance, and Global Environmental, LLC. http://kentucky.sierraclub.org/resources/Environmental_Research/Coal_Combustion_Waste_and_Water_In_KY_042110.pdf Retrieved: November 29, 2011.
164 U.S. Environmental Protection Agency. “Hazardous and Solid Waste Management System; Identi!cation and Listing of Special Wastes; Disposal of Coal Combustion Residuals from Electric Utilities.” [EPA-HQ-RCRA-2009-0640; FRL-9149-4] Proposed rule. Page 8. Avialable from: http://www.epa.gov/osw/nonhaz/ industrial/special/fossil/ccr-rule/fr-corrections.pdf. Retrieved: December 6, 2011.
165 Stant J. Editor. In Harm’s Way: Lack of Federal Coal Ash Regulations Endangers Americans and "eir Environment. Environmental Integrity Project, Earthjustice and Sierra Club, 2010. Available from: http://www. earthjustice.org/sites/default/!les/!les/report-in-harms-way. Pdf Retrieved: December 6, 2011.
166 Stant, J. Editor. Risky Business: Coal Ash "reatens America’s Groundwater Resources at 19 More Sites. Environmental Integrity Project. December 12, 2011. Available from http://www.environmentalintegrity.org/documents/121311EIP"irdDamageReport.pdf Retrieved: December 13, 2011.
167 Id. Quarles M. Slow Motion Spills: Coal Combustion Waste and Water in Kentucky. Sierra Club, Kentucky Waterways Alliance, and Global Environmental, LLC
168 Ibid.
169 Gilmour MI, O’Connor S; Dick CA, Miller CA, Linak WP. Di$erential pulmonary in%ammation and in vitro cytotoxicity of size-fractionated %y ash particles from pulverized coal combustion. Journal of the Air Waste Management Association. 2004 Mar; 54(3): 286-95.
170 Dewan, S. Tennessee Ash Flood Larger "an Initial Estimate. New York Times, December 26, 2008. Available from: http://www.nytimes.com/2008/12/27/us/27sludge.html Retrieved December 17, 2011.
171 Id. U.S. EPA. Database of coal combustion waste surface impoundments (2009).
172 American Coal Ash Association. Revised 2009 Coal Combustion Product (CCP) Production & Use Survey Report. http://www.acaa-usa.org/associations/8003/!les/2009_Production_and_Use_Survey_Revised_100511.pdf Retrieved: November 29, 2011.
173 Sonka, J. LG&E is on notice: Air Pollution Control District uncovers violations at coal ash land!ll. Leo Weekly, 2011, November 9. http://leoweekly.com/news/lge-notice Retrieved: November 29, 2011.
174 Little, Kathy. Personal communication. December 7, 2011.
175 Yassin A, Yebesi F, and Tingle R. Occupational Exposure to Crystalline Silica Dust in the United States: 1988–2003. Environmental Health Perspectives, 2005;113(3):255-260.
176 Fthenakis, V. and Moskowitz P. An Assessment of Silane Explosion Hazards. Solid State Technology, 1990;33(1):81–85.
177 Electric Power Research Institute. Potential Health and Environmental Impacts Associated with the Manufacture and Use of Photovoltaic Cells. Report to the California Energy Commission, Palo Alto, CA, 2003.
178 ATSDR. Available from: http://www.atsdr.cdc.gov/ Retrieved: December 14, 2011.
179 TakeBack Coalition. Available from: http://www.computertakeback.com Retrieved: December 10, 2011.
180 Toward a Just and Sustainable Solar Energy Industry. Silicon Valley Toxics Coalition, January 14, 2009. Available from: http://www.greencollar.org/UserFiles/ads-media/12526955654aaa9e0d799db.pdf Retrieved: December 14, 2011.
181 National Renewable Energy Laboratory. Kentucky- Wind Resource Potential Cumulative Rated Capacity vs. Gross capacity Factor (CF). Available from: http://www.windpoweringamerica.gov/wind_resource_maps.asp?stateab=ky Retrieved: December 17, 2011.
182 National Research Council, Environmental Impacts of Wind-Energy Projects, 2007, National Academies Press.
183 Minnesota Department of Health, Environmental Health Division. Public Health Impacts of Wind Turbines. May 22, 2009. Available from: http://energyfacilities.puc.state.mn.us/documents/Public%20Health%20Impacts%20of%20Wind%20Turbines,%205.22.09%20Revised.pdf Retrieved: December 14, 2011.
184 U.S. Energy Information Administration. Net Generation from Hydroelectric (Conventional) Power by State by Sector, Year-to-Date through December 2010. Available from: http://www.eia.gov/cneaf/solar.renewables/page/hydroelec/hydroelec.html Retrieved: December 10, 2011.
185 Fairchild, R. Personal communication. December 16, 2011.
186 Mother Ann Lee Hydroelectric station. Available from: http://www.kyhydropower.com/ Retrieved: December 15, 2011.
187 Kentucky Energy and Environment Cabinet. Intelligent Energy Choices for Kentucky’s Future: Governor Steve Beshear’s Energy Plan. Department for Energy Development and Independence. November 2008. http://energy.ky.gov/resources/Pages/EnergyPlan.aspx Retrieved: November 28, 2011.
3838A Report from Kentucky Environmental Foundation

188 Id. Brook RD. Particulate matter air pollution and atherosclerosis. Current Artherosclerosis Reports. 2009.
189 Id. Wellenius GA. Air pollution and hospital admissions for ischemic and hemorrhagic stroke among medicare bene!ciaries. Stroke, 2005.
190 Id. Peters A. Increased particulate air pollution and the triggering of myocardial infarction. Circulation. 2001.
191 Leech JA, Raizenne M, and Gusdorf J. Health in occupants of energy e#cient new homes. Indoor Air. 2004;14(3): 169–173.
192 Howden-Chapman P, Matheson A, Crane J, Viggers H, Cunningham M, Blakely T, Cunningham C, Woodward A, Saville-Smith K, O’Dea D, Kennedy M, Baker M, Waipara N, Chapman R, Davie G. E$ect of insulating existing houses on health inequality: cluster randomized study in the community. British Medical Journal, 2007;334(7591):460.
193 Ibid.
194 Sustainable Energy Authority of Ireland. E$ectiveness of Domestic Energy E#ciency Programmes, Fuel Poverty Action Reasearch, report 3: Health Impacts. 2009.
195 Veitch JA, Newsham GR. Lighting Quality and Energy-E#ciency E$ects on Task Performance, Mood, Health, Satisfaction and Comfort. National Research Council of Canada. 1997.
196 Meyers A, Rubin D, Napoleone M, and Nichols K. Public Housing Subsidies May Improve Poor Children’s Nutrition. American Journal of Public Health. 1993; 83(1): 115.
197 Energy Star, US EPA. Light bulbs. Available from: http://www.energystar.gov/index.cfm?fuseaction=!nd_a_product.showProductGroup&pgw_code=LB Retrieved: December 15, 2011.
198 Veitch JA, Newsham GR. Lighting Quality and Energy-E#ciency E$ects on Task Performance, Mood, Health, Satisfaction and Comfort. National Research Council of Canada, 1997.
199 Formaldehyde emissions from !berglass insulation with phenol formaldehyde binder, Memo, Healthy Building Network, January 16, 2009.
200 American Public Health Assocation Policy Resolution: Reducing PVC in Facilities With Vulnerable Populations - Final Revisions October 11, 2011. &
201 Healthy Building Network. Available from: http://www.healthybuilding.net/ Retrieved: December 15, 2011.
202 Fisk WJ. Health and productivity gains from better indoor environments and their relationship with building energy e#ciency. Annual Review of Energy and the Environment. 2000; 25:537–66.
203 California Energy Commission. Public Health Bene!ts of End-Use Electrical Energy E#ciency in California: An Exploratory Study. Dec. 2006. CEC 500-2006-116.
204 Levy J, Nishioka Y, Spengler J. "e public health bene!ts of insulation retro!ts in existing housing in the United States. Environmental Health: A Global Access. Environmental Health, 2003; 2:4.
205 Nishioka Y, Levy J, Norris G, Wilson A, Hofstetter P, Spengler J. Integrating Risk Assessment and Life Cycle Assessment: A Case Study of Insulation. Risk Analysis, 2002;22(5). 1003-1017.
206 Id. Leech. Health in occupants of energy e#cient new homes. Indoor Air. 2004.
207 Champerlain, Gina (Director of Home Energy Partners, Madison County, KY). Personal communication. December 4, 2011.
208 Harkness J and Newman SM. Housing A$ordability and Children’s Well-Being: Evidence from the National Survey of America’s Families. Housing Policy Debate, 2005; 16(2): 223–255.
209 Schweitzer M, Tonn B. Nonenergy bene!ts from the Weatherization Assistance Program: A summary of !ndings from the recent literature. Oak Ridge, TN: Oak Ridge National Laboratory, 2002;15–16.
210 Frank DA, Neault NB, Skalicky A, Cook JT, Wilson JD, Levenson S, Meyers JF, Heeren T, Cutts DB, Casey PH, Black MM, and Berkowitz C. Heat or Eat: "e Low Income Home Energy Assistance Program and Nutritional and Health Risks Among Children Less "an 3 Years of Age. Pediatrics. 2006; 118(5): 1293–1302.
211 Meyers A, Rubin D, Napoleone M, and Nichols K. Public Housing Subsidies May Improve Poor Children’s Nutrition. American Journal of Public Health. 1993; 83(1): 115.
212 Engel, Jordan. Interview of Jerry Workman. October 30, 2011.
213 U.S. DOE&-&EIA, Recoverable Coal Reserves at Producing Mines, Estimated Recoverable Reserves, and Demonstrated Reserve Base by Mining Method DOE/EIA-0584 (2009) http://www.eia.gov/cneaf/coal/page/acr/table15.html Retrieved: November 27, 2011.
214 U.S. Energy Information Administration. U.S. Coal Supply and Demand: 2010 Year in Review. Available from: http://www.eia.gov/coal/review/coal_production.cfm Retrieved: November 29, 2011.
215 U.S. Energy Information Administration. Annual Energy Outlook 2011 with Projections to 2035. DOE/EIA-0383 (2011).
216 Ibid.
217 Sumner S, Layde P. Expansion of Renewable Energy Industries and Implications for Occupational Health. JAMA, 2009; 302(7):787-789.
218 Hornby R, White D, Vitolo T, Comings T, Takahashi K. Synapse, Energy Economics, Inc. Potential Impacts of a Renewable and Energy E#ciency Portfolio Standard in Kentucky. January 12, 2012.
219 Tracz K, Bailey J. Building Clean Energy Careers in Kentucky. Mountain Association for Community Economic Development. Nov. 2010.
220 Sherman, Carter, Bernhardt. Richardsville Elementary School. http://www.scbarchitects.com/our-work/k-12-education/elementary-schools/richardsville-elementary-school Retrieved: January 13, 2012.
221 Wood C. Geothermal Rising. http://www.smileypete.com/Articles-Business-Lexington-Columns-c-2011-11-22-99546.113117-Geothermal-Rising.html Retrieved January 13, 2012.
222 Alliance to Save Energy. Kentucky Celebrates over 100 energy star schools with green schools program. http://ase.org/e#ciencynews/kentucky-celebrates-over-100-energy-star-schools-green-schools-program Retrieved: January 13, 2012.
3939 Health Impact Assessment of Coal and Clean Energy Options in Kentucky

4040A Report from Kentucky Environmental Foundation

PO Box 467 128 Main Street Berea KY 40403
859.986.0868 859.986.7565 (Chemical Weapons Working Group) 859.986.2695 (FAX)
http://kyenvironmentalfoundation.org