Embed Size (px)
Citation preview
1
HEALTH FINANCING IN ARGENTINA CAVAGNERO • CARRIN • XU • AGUILAR
Health Financing in Argentina:
An Empirical Study of Health Care Expenditure
and Utilization
Eleonora Cavagnero
Guy Carrin
Ke Xu
Ana Mylena Aguilar-Rivera
Innovations in Health Financing
Working Paper Series8
2
HEALTH FINANCING IN ARGENTINA CAVAGNERO • CARRIN • XU • AGUILAR
Working Paper Ser ies
INNOVATIONS IN HEALTH FINANCING
EditorsFelicia Marie KnaulStefano M. Bertozzi
Héctor Arreola-Ornelas
3
HEALTH FINANCING IN ARGENTINA CAVAGNERO • CARRIN • XU • AGUILAR
HEALTH FINANCING IN ARGENTINA: AN EMPIRICAL STUDY OF HEALTH
CARE EXPENDITURE AND UTILIZATION
Eleonora Cavagnero
Guy Carrin
Ke Xu
Ana Mylena Aguilar-Rivera
4
HEALTH FINANCING IN ARGENTINA CAVAGNERO • CARRIN • XU • AGUILAR
Health Financing in Argentina: An Empirical Study of Health Care Expenditure and Utilization
Copyright © 2006Fundación Mexicana para la Salud, A. C.Instituto Nacional de Salud Pública
ISBN: 968-5661-00-6Printed in Mexico
The research in this paper is the sole responsibility of the authors and does not necessarily reflects the views of their institution.
Editorial coordination: Luis F. Bautista and Bronwyn UnderhillGraphic design: Elena Contreras and Efrén Motta
In front page:Diego Rivera. Aire, 1929Ministry of Health of MexicoCopyright © (2001) Banco de México Fideicomiso Museos Diego Rivera y Frida Kahlo. Av. 5 de Mayo No. 2. Col. Centro, Del. Cuauhtémoc 06059, México, D.F.Reproduction authorized by the National Institute of Fine Arts. CONACULTA-INBA. Mexico.
The original version of the kite is:Pequeña Esperanza by María Hazel Olmos Sánchez from Puebla, Mexico. First Place, XI National Drawing Competition for Children and Youth 2002 “A World with no Poverty” and Second Place at the International Drawing Competition for Children and Youth 2002, organized by the United Nations Population Fund, New York.
5
HEALTH FINANCING IN ARGENTINA CAVAGNERO • CARRIN • XU • AGUILAR
INTRODUCTION . . . . . . . . . . . . . . . . . . . . . . . . . . . . . . . . . . . . . 6
I. OVERVIEW OF ARGENTINEAN HEALTH CARE FINANCING SYSTEM . . . . . 8 The Public Sector . . . . . . . . . . . . . . . . . . . . . . . . . . . . . . . . . . 9 Social Care Insurance . . . . . . . . . . . . . . . . . . . . . . . . . . . . . . . . 9 The Private Sector . . . . . . . . . . . . . . . . . . . . . . . . . . . . . . . . . . 10
II. DETERMINANTS OF HEALTH CARE UTILIZATION AND HEALTH CARE EXPENDITURE . . . . . . . . . . . . . . . . . . . . . . . . . . . 12 Conceptual Framework . . . . . . . . . . . . . . . . . . . . . . . . . . . . . . . 12 Data Sources . . . . . . . . . . . . . . . . . . . . . . . . . . . . . . . . . . . . . 14 Descriptive Data Analysis . . . . . . . . . . . . . . . . . . . . . . . . . . . . . . 14 Health Service Utilization . . . . . . . . . . . . . . . . . . . . . . . . . . . . . . 14 Catastrophic Health Expenditure . . . . . . . . . . . . . . . . . . . . . . . . . . . 18
III. ECONOMETRIC ANALYSIS . . . . . . . . . . . . . . . . . . . . . . . . . . . . . 21 Methodology . . . . . . . . . . . . . . . . . . . . . . . . . . . . . . . . . . . . . 21 Results . . . . . . . . . . . . . . . . . . . . . . . . . . . . . . . . . . . . . . . . 23 Health Services Utilization . . . . . . . . . . . . . . . . . . . . . . . . . . . . . . 23 Catastrophic Health Expenditure . . . . . . . . . . . . . . . . . . . . . . . . . . . 25
IV. CONCLUSIONS . . . . . . . . . . . . . . . . . . . . . . . . . . . . . . . . . . . . 28
REFERENCES . . . . . . . . . . . . . . . . . . . . . . . . . . . . . . . . . . . . . . . 30
CONTENTS
6
HEALTH FINANCING IN ARGENTINA CAVAGNERO • CARRIN • XU • AGUILAR
INTRODUCTION*
* Corresponding author: E-mail: [email protected]. Tel: +41 791 1416. Fax: +41 22 791 4328. Health Financing Policy. Department of Health Systems Financing. World Health Organization.This paper was presented in the 2nd International Con-ference on Health Financing in Developing Countries in Clermont-Ferrand. We are grateful to participants for their useful comments and suggestions. Comments from Jerome Lahaye are also gratefully acknowledged.All views expressed in this article are entirely those of the authors and do not necessarily represent those of World Health Organization.
Health systems deliver preventive and curative health services aimed at mak-ing substantial differences for people’s
health. At the same time, health improvements can provide poor households with the opportunity to escape poverty (Whitehead, Dahlgren & Evans, 2001; Kawabata, Xu & Carrin, 2002; Van Damme, et al., 2004). Therefore, it is a major challenge for health systems to protect households from the risk of impoverishment resulting from health expen-diture, and to ensure that the population receives health services when needed. The financial burden of out-of-pocket payments at the time of health care utilization can lead individuals to spend high amounts compared to their available incomes, there-by reducing basic spending on other items or even preventing people from seeking or obtaining care.
Increasing the availability and use of health services is critical with a view to improving health systems. However, if health systems financing basi-cally relies on out-of-pocket payments and finan-cial risk protection measures are missing, unwanted effects may be observed. Health care out-of-pocket payments will result in a number of households facing catastrophic payments. Catastrophic pay-ments occur when households need to spend an important fraction of their net income on health care, some of them being pushed into poverty and others giving up the care needed. Special at-tention should therefore be paid to the coverage of vulnerable population groups, benefit package adequacy and an acceptable co-payment scale in order to enhance financial risk protection (World Health Report, 2000).
In Latin America, most welfare programs were founded on social insurance principles but in contrast to European countries, social insurance
never reached universality. The focus was on spe-cific groups of workers through Social Insurance Funds (Obras Sociales). In addition, governments provided a limited range of universal tax-funded health services – universal meaning that everybody was entitled to use most services in public facilities. However, those tended to be of poor quality. In practice, publicly provided health services were mostly targeted to low-income households as more affluent households usually opted for privately provided health care.
In some respects, Argentina has a fairly well developed health system considering standards in developing countries. However, a number of Argentina’s health status indicators are worse than those of middle income countries in the region with lower health expenditure and per capita in-come, such as Chile, Costa Rica and Uruguay. In 1997, all those countries had higher life expectancy and significantly lower infant mortality rates even though their per capita health expenditure – US$ 250, US$ 160 and US$ 124 respectively – was lower than Argentina’s US$ 500.
The Argentine economic crisis in 1989, the beginning of the economic transformation
7
HEALTH FINANCING IN ARGENTINA CAVAGNERO • CARRIN • XU • AGUILAR
in 1991 and increasing unemployment through the 1990s had an impact on the health care fi-nancing system, household wealth and probably on health care access. At the same time, Argen-tina went through a health care reform in the 1990s – like many other middle income countries. This reform put special emphasis on the decen-tralization of the tax-funded health sector and the restructuring of the social insurance system with its Obras Sociales. In the last decade, the Argen-tine government enacted new laws initiating the gradual liberalization of the health sub-sector of social insurance, henceforth it will be denoted as social health insurance. One of the goals was to improve efficiency and quality in health care provision by avoiding over-insurance.
This paper explores that specific period of institutional changes in the health sector and its impact on health service utilization and cata-strophic out-of-pocket payments; although our
goal is not to make an overall assessment of the proposed reform, the results presented lead to a better understanding of the effects of possible changes in the health insurance sector and con-tribute to improve health care policy design.
An overview of Argentina’s health financing system and sub-systems as it existed in the 1990s is presented in the next section. This particular period was selected for this overview to be coher-ent with the timing of the household survey that will be analysed. It is followed by the conceptual framework, description of the variables and data sources as well as a descriptive analysis of the main variables in section two. Section three presents our econometric analysis. A discussion of the method-ology and a study of the determinants of health services utilization and catastrophic payments are carried out. Concluding remarks are provided in section four.
8
HEALTH FINANCING IN ARGENTINA CAVAGNERO • CARRIN • XU • AGUILAR
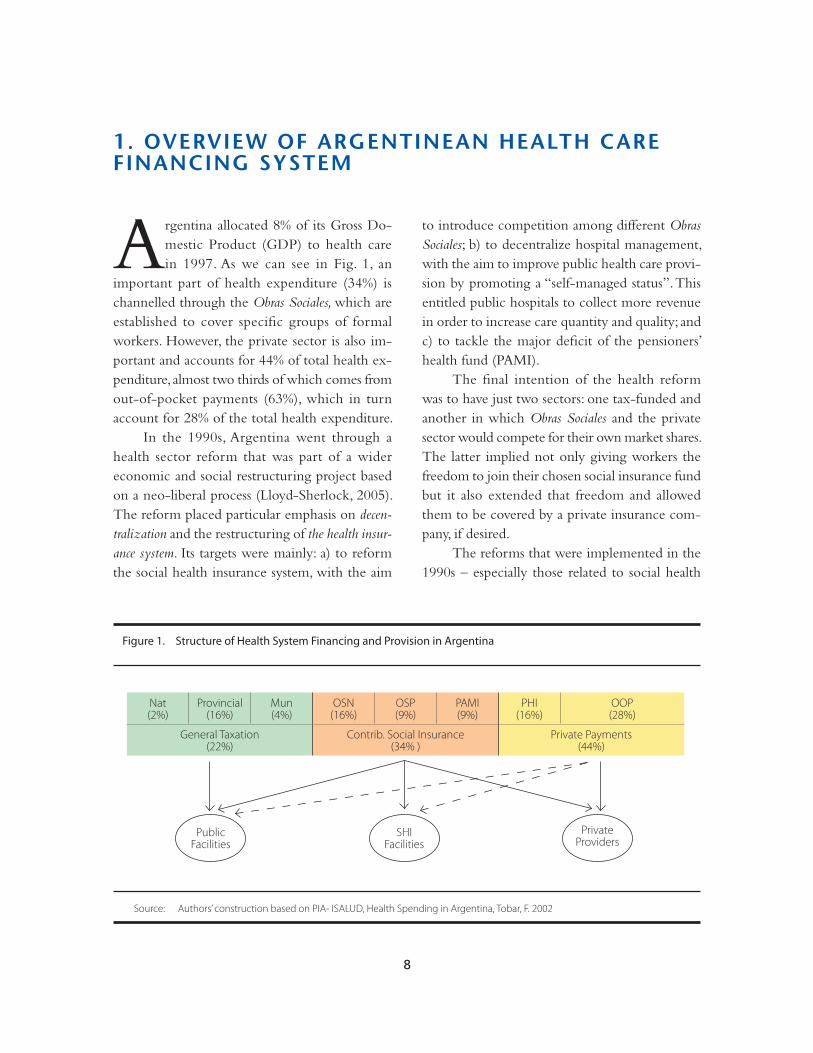
Argentina allocated 8% of its Gross Do-mestic Product (GDP) to health care in 1997. As we can see in Fig. 1, an
important part of health expenditure (34%) is channelled through the Obras Sociales, which are established to cover specific groups of formal workers. However, the private sector is also im-portant and accounts for 44% of total health ex-penditure, almost two thirds of which comes from out-of-pocket payments (63%), which in turn account for 28% of the total health expenditure.
In the 1990s, Argentina went through a health sector reform that was part of a wider economic and social restructuring project based on a neo-liberal process (Lloyd-Sherlock, 2005). The reform placed particular emphasis on decen-tralization and the restructuring of the health insur-ance system. Its targets were mainly: a) to reform the social health insurance system, with the aim
to introduce competition among different Obras Sociales; b) to decentralize hospital management, with the aim to improve public health care provi-sion by promoting a “self-managed status”. This entitled public hospitals to collect more revenue in order to increase care quantity and quality; and c) to tackle the major deficit of the pensioners’ health fund (PAMI).
The final intention of the health reform was to have just two sectors: one tax-funded and another in which Obras Sociales and the private sector would compete for their own market shares. The latter implied not only giving workers the freedom to join their chosen social insurance fund but it also extended that freedom and allowed them to be covered by a private insurance com-pany, if desired.
The reforms that were implemented in the 1990s – especially those related to social health
1. OVERVIEW OF ARGENTINEAN HEALTH CARE FINANCING SYSTEM
Figure 1. Structure of Health System Financing and Provision in Argentina
Source: Authors’ construction based on PIA- ISALUD, Health Spending in Argentina, Tobar, F. 2002
Nat(2%)
Provincial(16%)
Mun(4%)
OSN(16%)
OSP(9%)
PAMI(9%)
PHI(16%)
OOP(28%)
General Taxation(22%)
Contrib. Social Insurance(34% )
Private Payments(44%)
PublicFacilities
SHIFacilities
PrivateProviders
9
HEALTH FINANCING IN ARGENTINA CAVAGNERO • CARRIN • XU • AGUILAR
insurance at the national level and the manage-ment of public hospitals – should provide useful lessons for the future.
Argentina’s health financing system consisted of three main sub-systems: the public sector1, social health insurance and the private sector, which we shall review briefly. Fig. 1 presents the relationships within the Argentine health system. As we will see, the system was originally fragmented with a vertical integration of financing and provision within each of the three sub-systems. Recently, however, a larger degree of integration of provi-sion is being observed.
THE PUBLIC SECTOR
The publicly-funded sector was increasingly de-centralized, giving the federal Ministry of Health a rather limited role in national health policy. The public sector was decentralized from the federal level to provincial or local administrations (municipalities). As a result, the federal level ac-counts for a minimal expenditure percentage, i.e. only 2% of total health expenditure as shown on Fig. 1. Provincial health ministries are in charge of basic public health services, including prevention, education and promotion. Although access to basic health services is universal in theory, with free access for uninsured people, the implementation of (or increase in the number of) out-of-pocket payments for services was introduced as a part of the reform. Therefore, since the legislative frame-work was enacted in 1993, hospitals have been able to adopt a self-managed status. Public hospitals
provide services not only to uninsured groups, but also to those that are covered by social or private health insurance. The public sector is also used by insured people requiring more complex and expensive treatments and surgeries. In principle, hospitals should be refunded by the Obras Sociales for these particular services, but in practice they are hardly reimbursed.
SOCIAL HEALTH INSURANCE
The social health insurance sector consists of many different Obras Sociales, most of which are admin-istrated by trade unions. Social health insurance is funded by a compulsory payroll contribution from employees (3%) and employers (6%). It consists of about 300 different funds covering more than 50% of the national population. As a part of these Obras Sociales, there are 24 Obras Sociales Provinciales (OSP), one for each province, which cover around 5 million public sector employees and their depen-dents. The Obras Sociales Nacionales (OSN) were associated with different industrial sectors that had a monopolistic right over the formal labour force of each sector. Therefore, before the reform, different groups of workers were not allowed to choose with which fund they were affiliated2.
1 ‘Public sector’ hereafter only refers to the tax-funded sector (without taking Social Health Insurance Funds into account). 2 It is worth noting that the above-mentioned reform involved just Obras Sociales Nacionales and no the 24 Obras Sociales Provinciales.
10
HEALTH FINANCING IN ARGENTINA CAVAGNERO • CARRIN • XU • AGUILAR
Obras Sociales pools risks for its members but there is no pooling across sectors and there are no inter-industry or sector transfers from richer to poorer sectors. As a result, there are important differences among different Obras Sociales, depending on the average wages and number of formal workers in each sector. Still, a ‘Redistribution Fund’ was cre-ated to reduce such differences among insurance funds. Its goal was to redistribute a percentage of total funds in order to compensate poor Obras Sociales with the surplus of richer ones and ensure that all formal workers had the same benefit pack-ages. However, the ‘Redistribution Fund’ proved to be insufficient to finance poorer funds’ deficits and each social insurance fund had to apply dif-ferent kinds of co-payments or user fees.
The social health insurance system does not make a direct link between the contributions made and benefits received. Employees’ dependents are covered and also, workers can extend coverage to other family members.
As most social health insurance funds were too small to provide services directly, they sub-contracted private clinics and hospitals, giving rise to a large private provision sector. Instead of promoting efficiency and competition, such a purchaser-provider split generated a complex contracting and subcontracting system.
Since 1993, as part of the reform, the govern-ment started a gradual liberalization of the social insurance sector, which allowed workers to select their own insurance funds. The social insurance sector was subjected to a number of other reforms throughout the 1990s, one of the most significant ones being the reduction in employer contribution from 6% to 5% of the wage bill. This implied a significant loss for the social health insurance sec-
tor3. Social health insurance started to contract out their administrative functions, which consequently were highly profitable customers for the private sector. Indeed, it currently acts as a purchaser of health services from private sector.
A special case is the separate health insurance fund for retired people, the Programa de Atención Médico Integral (PAMI)4. Services are funded by a combination of wage levies and contributions on pension benefits. In the past, other social insurance funds were exempted from providing services to retired members and that is why the PAMI was created. It mainly contracts out to private provid-ers, although the demand for health services is also partly directed at the public sector.
THE PRIVATE SECTOR
As we can see in Fig. 1, out-of-pocket payments made by households at the point of service account for 28% of total health expenditure. Private health insurance (PHI) is funded through direct and vol-untary pre-payments by insured members. Benefit packages depend on insured people’s contribu-tions. Approximately 4 million individuals hold private insurance, i.e. around 10% of the popula-
3 The government enacted the Emergency Plan for the health sector in early 2002. Employer contributions were restored to 6 %. 4 The PAMI is a dedicated health insurance fund for pensioners, broadly comparable to Medicare in the USA.
11
HEALTH FINANCING IN ARGENTINA CAVAGNERO • CARRIN • XU • AGUILAR
tion, while 60% is contracted individually and the remaining part derives from social health insurers’ provision 5 and supplementary coverage.
The explanation as to why the private sector grew rapidly during the 1990s is twofold. Firstly, it was caused by the opening of private health care market to provide health services to those covered by social health insurance, and secondly, because of the increasing demand from richer population groups, which sought better quality services than those provided by the public sector and directly
by the Obras Sociales. There are approximately 200 private health insurance institutions; however there is no effective regulatory framework.
To sum up, the most important transfor-mations within the system as a whole were the freedom given to social health insurance and the public hospitals’ ‘self-management’. In other words, one of the final objectives of the health system reform was to establish full competition in health care provision and, doing so, to promote just two sectors: one public and one private.
5 Most white-collar workers are directly enrolled in private health insurance coverage through their social health insurers.
12
HEALTH FINANCING IN ARGENTINA CAVAGNERO • CARRIN • XU • AGUILAR
CONCEPTUAL FRAMEWORK
As it was already explained, different institution-al changes took place in Argentina during the 1990s and the health sector was not an exception. Therefore, the present study aims at examining the determinants of health service utilization and catastrophic payments due to out-of-pocket pay-ments for health services, using the World Health Organization’s methodology (Xu, K. et al., 2005). In doing so, we seek to answer some questions such as: a) Who uses health services and where do they go?; b) Who pays how much and for what kinds of health services?; and, c) How do these payments affect a household’s financial situ-ation? These answers should help to understand the effects of past decisions and therefore should provide useful contributions to future health care policy design.
For health care utilization, our analysis was based on the use of outpatient care for each indi-vidual reporting illness in the preceding month. Those people were asked whether they had used outpatient care and, if so, where they had been. Four options were provided - use of public, private, social health insurance facilities or non-use of such health services6. Individuals were also asked if they had been required to have other tests and special examinations in the previous three months or had used inpatient care in the previous year.
To analyse health care utilization, the Condi-tion of Life Survey was used, in which only income is reported. Hence, income quintiles rather than expenditure quintiles are calculated.
The study of the determinants of catastrophic payments was based on household expenditure during the last month. A catastrophic payment is
defined based on a household’s capacity to pay (Russell, 1996). The estimation of a household’s capacity to pay (ctph) or non-subsistence income requires data on total household expenditure (or income) and subsistence expenditure (seh). Although both income and expenditure were reported on the National Survey on Household Expenditure, reported consumption expenditure7 is used to measure a household’s capacity to pay. Also, it is used to define whether a family faced a catastrophic expenditure. Therefore, expenditure quintiles rather than income quintiles are used. Such a choice can be explained by at least two different reasons. On the one hand, the variance of current expenditure over time is smaller than the variance of current income. Income data reflect random shocks, and expenditure data better reflect the notion of effective income. On the other hand, expenditure data are more reliable than income data in most household surveys. That is particularly true in developing countries, where the informal sector is typically large and survey respondents may not wish to reveal their true income for various reasons (Xu, K. et al., 2003; Bouis, 1994; Deaton, 1992).
Considering that the share of food expendi-ture in a household’s total expenditure diminishes as income increases, the subsistence expenditure
2. DETERMINANTS OF HEALTH CARE UTILIZATION AND HEALTH CARE EXPENDITURE
6 Non-use of such services includes non-use, use of traditional providers, others and self-treatment. 7 Consumption expenditure categories include ‘pur-chase and sale’ of car, equipment etc. Those items can have negatives values if the sold amount exceeds the purchased amount. Households’ expenditure that have negative values as result were not taken into account in our analysis.
13
HEALTH FINANCING IN ARGENTINA CAVAGNERO • CARRIN • XU • AGUILAR
seh, is defined as a household’s food expenditure, with the sample median food share of total ex-penditure. In order to minimize the measurement error, calculations are based on the average food expenditure of households whose food expen-diture share of total expenditures is in the 45-55 percentile range. It is adjusted according to household size8.
Some households may report food expen-diture that is lower than subsistence spending (seh>foodh). That indicates that the household’s food expenditure is under the estimated poverty stan-dard for that country. Such a situation can result from the fact that reported food expenditure in the survey does not consider food subsidies, cou-pons, self-production and other non-cash means of food consumption. In that case, the non-food expenditure is used as non-subsistence spending. Then, the ctph can be expressed as follows,
ctph= exph − seh ; if seh ≤ foodh(1)
ctph= exph − foodh ; if seh > foodh
Out-of-pocket payments (oop) refer to household payments for health at the point of service. Such payments typically include doc-tor consultation fees, medication purchases and hospital bills. Although spending on alternative and traditional medicine is included in out-of-pocket payments, expenditure on health-related transportation and special nutrition is excluded. In the present analysis, geriatrics or home bills were also excluded from out-of-pockets payments. Thus, the burden of health expenditure is defined as the oop payments as a percentage of a household’s capacity to pay,
oopctph =
ooph (2)
ctph
In our case, a household is considered to be facing catastrophic expenditure when total out-of-pocket health payments equal or exceed 40% of the household’s capacity to pay (Murray C. et al., 2003). As a result, a dummy variable (cata) reflecting the presence of catastrophic payments is constructed,
cata= 1 if oopctph ≥ 0.4(3)
cata= 0 if oopctp < 0.4
Estimated basic subsistence needs seh, also serve as a poverty line for analysing the poverty im-pact of out-of-pocket health payments. A house-hold is impoverished when it crosses the poverty line after paying for health services, shifting from non-poor to poor.
impoor = 1 if exp ≥ seh and exph − ooph < seh(4)
impoor = 0 if exp ≥ seh and exph − ooph ≥ seh
In each survey analysed, each individual was asked whether each household member was covered by some health insurance, and about the specific type of insurance coverage. Insurance coverage categories were divided as social health
8 A complete explanation can be found in Xu, Kla-vus, Kawabata, Evans, Hanvoravongchai, Ortiz de Iturbe, Zeramdini, Murray (2003) and Xu, Evans, Kawabata, Zeramdini, Klavus, & Murray (2003).
14
HEALTH FINANCING IN ARGENTINA CAVAGNERO • CARRIN • XU • AGUILAR
insurance (compulsory), private prepayment scheme (voluntary), both (compulsory and voluntary), only emergency coverage or without coverage (public coverage). In our analysis, only emergency cover-age was included in the private health insurance variable. Variables reflecting coverage and type of insurance were taken as explanatory variables. Our analysis also uses information on demographic, oc-cupational and educational characteristics, health conditions and gender.
Regarding determinants of health service utilization, two dummies were created to take into account distance to health facilities. Distances from each household to public centres for basic health services and to public hospitals were taken into account.
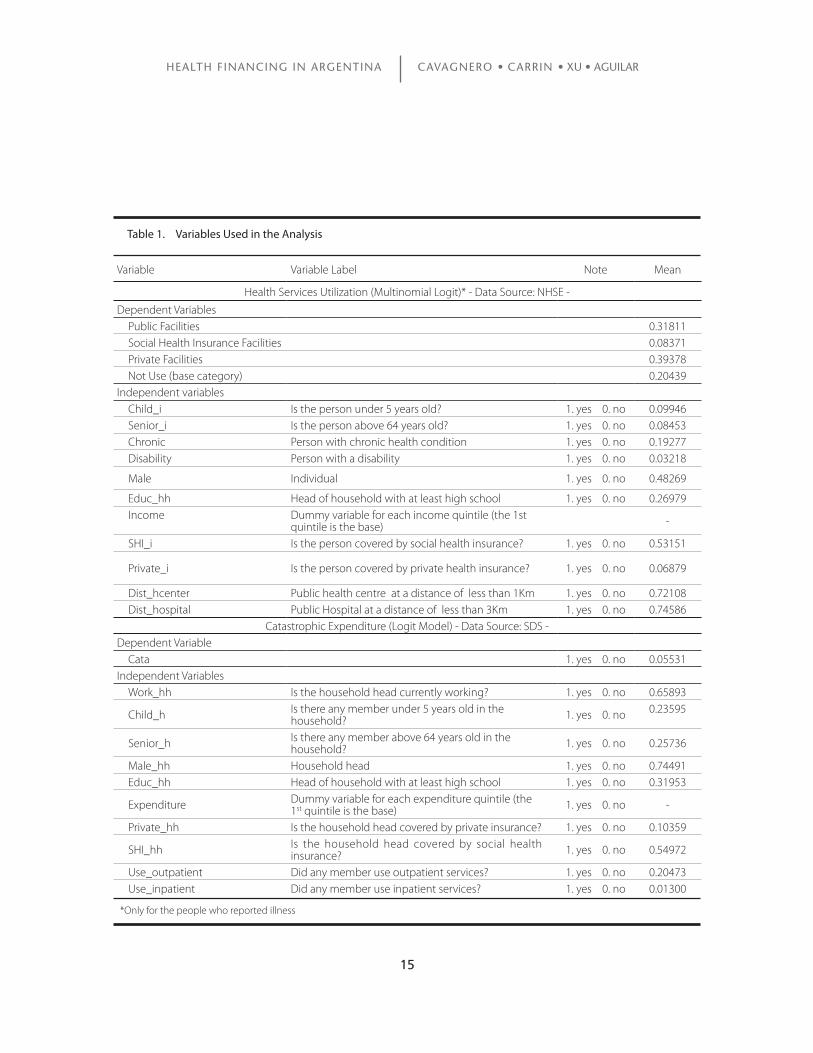
In the case of catastrophic payments, two dummies were created for households that spend money on outpatient or inpatient services. Such variables were used as proxy of outpatient and inpatient care utilization, respectively. The variables used in the analysis are listed in Table 1.
DATA SOURCES
The data used in this study come from two dif-ferent national and regional representative surveys, one of which is the ‘National Survey on House-hold Expenditure’ (NSHE)9 conducted between February 1996 and March 1997. The second one is the ‘Conditions of Life Survey’ (CLS)10 carried out in August 1997. Both were aimed at private house-holds in urban areas nation-wide with 5000 inhab-itants or more11 , making up a sample of 114 cities
representing 96% of the urban population and 84% of the national population. Households liv-ing in localities under 5000 inhabitants and in rural areas, which account for 14% of the national population, were excluded. The surveys included responses from 27,102 households (NSHE) and 74,932 individuals (CLS).
The first survey provides information on household expenditure and income, while the second provides information on income as well as specific information across age groups, including health facilities utilization and insurance coverage categories.
DESCRIPTIVE DATA ANALYSIS
Health Service Utilization
Considering utilization of health services, it is first worth noting that 23% of the population experienced illness or injuries in the last 30 days. Among those, around 80% sought advice from a physician, 2% obtained self-treatment or traditional medicine and the remaining 18% did not receive any health services.
9 Encuesta Nacional del Gasto de los Hogares 1996-1997 (ENGH). Instituto Nacional de Estadísticas y Censos (INDEC). Argentina. 10 Encuesta de Desarrollo Social 1997 (SIEMPRO/ INDEC): Condiciones de Vida y acceso a programas y servicios sociales. 11 They were constructed according to the 1991 Population and Dwellings Census INDEC.
15
HEALTH FINANCING IN ARGENTINA CAVAGNERO • CARRIN • XU • AGUILAR
Variable Variable Label Note Mean
Health Services Utilization (Multinomial Logit)* - Data Source: NHSE -
Dependent VariablesPublic Facilities 0.31811Social Health Insurance Facilities 0.08371Private Facilities 0.39378Not Use (base category) 0.20439
Independent variablesChild_i Is the person under 5 years old? 1. yes 0. no 0.09946Senior_i Is the person above 64 years old? 1. yes 0. no 0.08453Chronic Person with chronic health condition 1. yes 0. no 0.19277Disability Person with a disability 1. yes 0. no 0.03218
Male Individual 1. yes 0. no 0.48269
Educ_hh Head of household with at least high school 1. yes 0. no 0.26979Income Dummy variable for each income quintile (the 1st
quintile is the base) -
SHI_i Is the person covered by social health insurance? 1. yes 0. no 0.53151
Private_i Is the person covered by private health insurance? 1. yes 0. no 0.06879
Dist_hcenter Public health centre at a distance of less than 1Km 1. yes 0. no 0.72108Dist_hospital Public Hospital at a distance of less than 3Km 1. yes 0. no 0.74586
Catastrophic Expenditure (Logit Model) - Data Source: SDS -Dependent Variable
Cata 1. yes 0. no 0.05531Independent Variables
Work_hh Is the household head currently working? 1. yes 0. no 0.65893
Child_h Is there any member under 5 years old in the household? 1. yes 0. no 0.23595
Senior_h Is there any member above 64 years old in the household? 1. yes 0. no 0.25736
Male_hh Household head 1. yes 0. no 0.74491Educ_hh Head of household with at least high school 1. yes 0. no 0.31953
Expenditure Dummy variable for each expenditure quintile (the 1st quintile is the base) 1. yes 0. no -
Private_hh Is the household head covered by private insurance? 1. yes 0. no 0.10359
SHI_hh Is the household head covered by social health insurance? 1. yes 0. no 0.54972
Use_outpatient Did any member use outpatient services? 1. yes 0. no 0.20473Use_inpatient Did any member use inpatient services? 1. yes 0. no 0.01300
Table 1. Variables Used in the Analysis
*Only for the people who reported illness
16
HEALTH FINANCING IN ARGENTINA CAVAGNERO • CARRIN • XU • AGUILAR
The proportion of self-reported illness is fairly constant across quintiles. Many studies show that the proportion of self-reported illness is less significant among the poor than the non-poor. Even though the poor might suffer more illness than the non-poor, the non-poor perceive them-selves to suffer as much and to have even more ill-ness than the poor (Sen, 2002). Yet, that behaviour was not found in this survey.
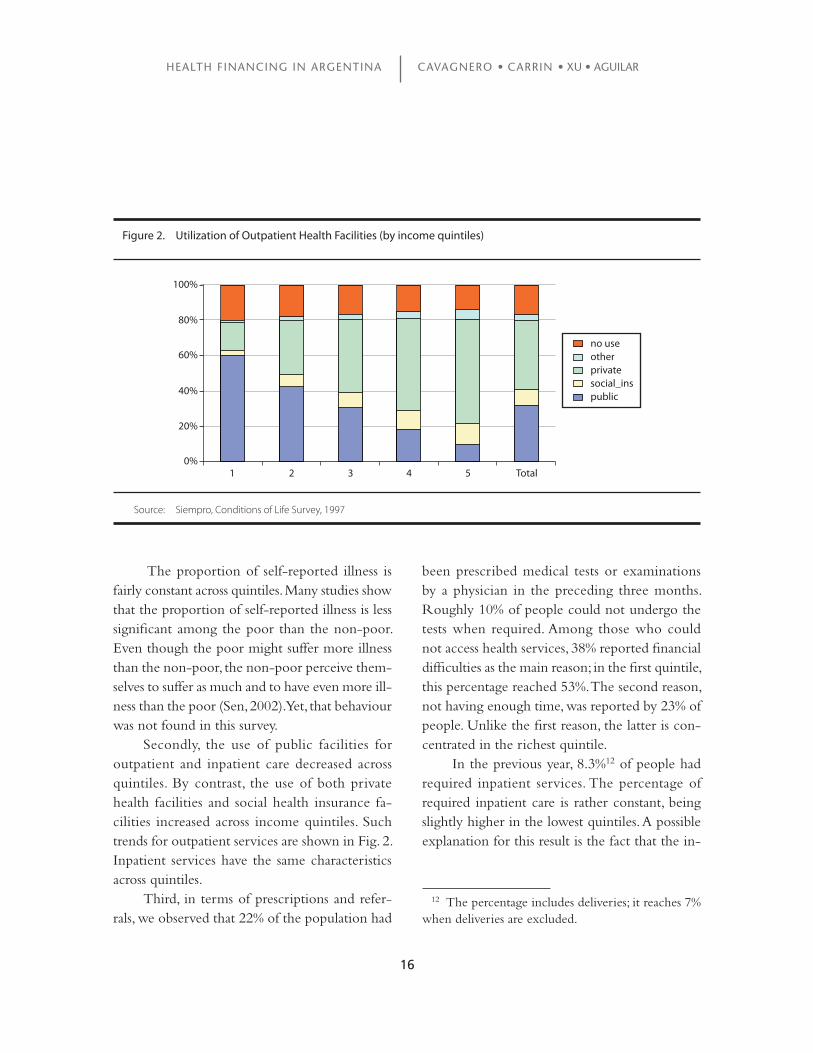
Secondly, the use of public facilities for outpatient and inpatient care decreased across quintiles. By contrast, the use of both private health facilities and social health insurance fa-cilities increased across income quintiles. Such trends for outpatient services are shown in Fig. 2. Inpatient services have the same characteristics across quintiles.
Third, in terms of prescriptions and refer-rals, we observed that 22% of the population had
been prescribed medical tests or examinations by a physician in the preceding three months. Roughly 10% of people could not undergo the tests when required. Among those who could not access health services, 38% reported financial difficulties as the main reason; in the first quintile, this percentage reached 53%. The second reason, not having enough time, was reported by 23% of people. Unlike the first reason, the latter is con-centrated in the richest quintile.
In the previous year, 8.3%12 of people had required inpatient services. The percentage of required inpatient care is rather constant, being slightly higher in the lowest quintiles. A possible explanation for this result is the fact that the in-
1 2 3 4 5 Total
no useotherprivatesocial_inspublic
0%
20%
40%
60%
80%
100%
Figure 2. Utilization of Outpatient Health Facilities (by income quintiles)
Source: Siempro, Conditions of Life Survey, 1997
12 The percentage includes deliveries; it reaches 7% when deliveries are excluded.
17
HEALTH FINANCING IN ARGENTINA CAVAGNERO • CARRIN • XU • AGUILAR
patient percentage includes deliveries and that the higher birth-rate among poorer income groups causes the use of inpatient care to be fairly steady across quintiles.
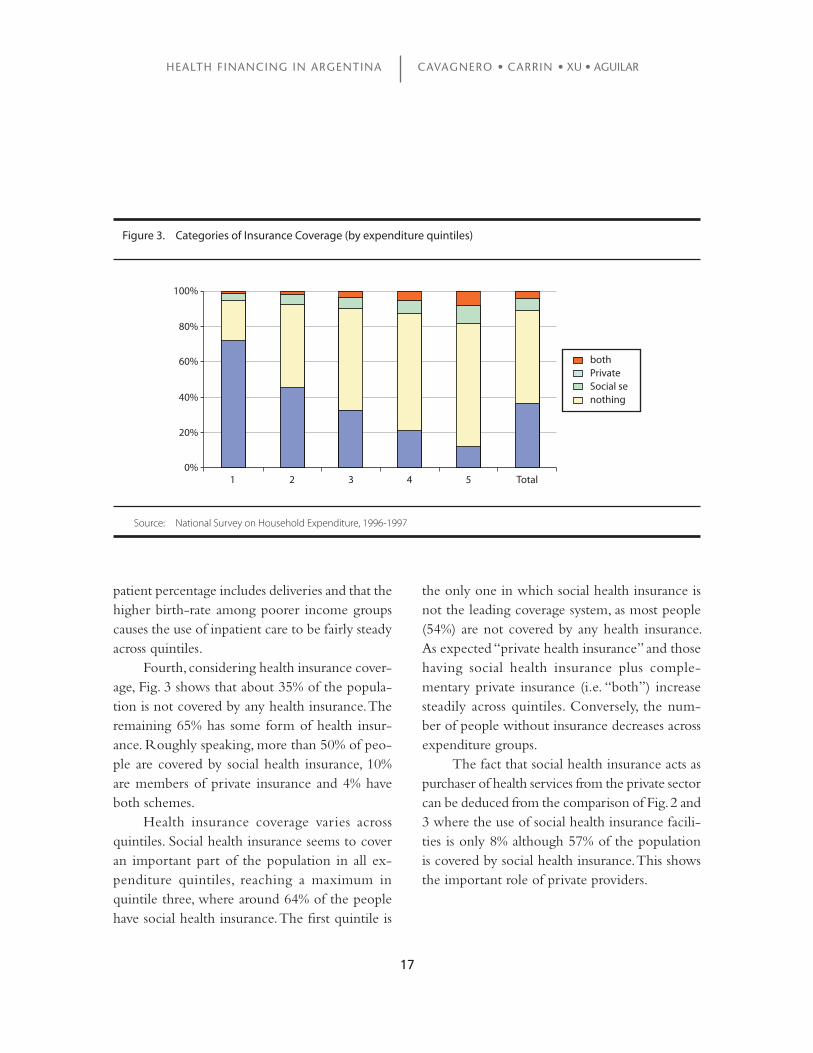
Fourth, considering health insurance cover-age, Fig. 3 shows that about 35% of the popula-tion is not covered by any health insurance. The remaining 65% has some form of health insur-ance. Roughly speaking, more than 50% of peo-ple are covered by social health insurance, 10% are members of private insurance and 4% have both schemes.
Health insurance coverage varies across quintiles. Social health insurance seems to cover an important part of the population in all ex-penditure quintiles, reaching a maximum in quintile three, where around 64% of the people have social health insurance. The first quintile is
the only one in which social health insurance is not the leading coverage system, as most people (54%) are not covered by any health insurance. As expected “private health insurance” and those having social health insurance plus comple-mentary private insurance (i.e. “both”) increase steadily across quintiles. Conversely, the num-ber of people without insurance decreases across expenditure groups.
The fact that social health insurance acts as purchaser of health services from the private sector can be deduced from the comparison of Fig. 2 and 3 where the use of social health insurance facili-ties is only 8% although 57% of the population is covered by social health insurance. This shows the important role of private providers.
1 2 3 4 5 Total
bothPrivateSocial senothing
0%
20%
40%
60%
80%
100%
Figure 3. Categories of Insurance Coverage (by expenditure quintiles)
Source: National Survey on Household Expenditure, 1996-1997
18
HEALTH FINANCING IN ARGENTINA CAVAGNERO • CARRIN • XU • AGUILAR
Catastrophic Health Expenditure
The average household out-of-pocket health spending in 1997 was Ar$13 52.4 per month. For outpatient services, household out-of-pocket ex-penditure was on average Ar$ 9; for inpatient care, it was on average Ar$ 2.20 per month. Average out-of-pocket payments amounted to 5.6% of total household monthly expenditure and 8% of household capacity to pay. In absolute terms, out of-pocket health expenditure varies signifi-cantly across quintiles. Average household out-of-pocket payments amounted to Ar$ 5.7 in the poorest quintile, which is considerably less than the monthly Ar$ 131.7 in the richest quintile.
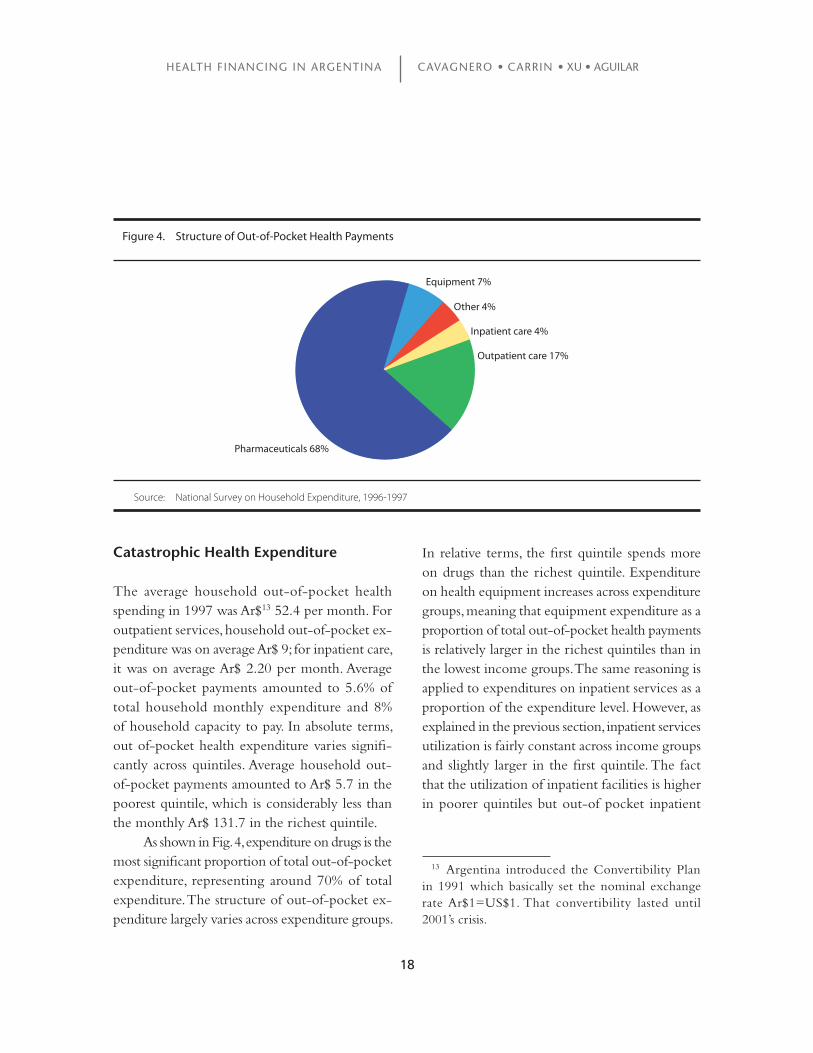
As shown in Fig. 4, expenditure on drugs is the most significant proportion of total out-of-pocket expenditure, representing around 70% of total expenditure. The structure of out-of-pocket ex-penditure largely varies across expenditure groups.
In relative terms, the first quintile spends more on drugs than the richest quintile. Expenditure on health equipment increases across expenditure groups, meaning that equipment expenditure as a proportion of total out-of-pocket health payments is relatively larger in the richest quintiles than in the lowest income groups. The same reasoning is applied to expenditures on inpatient services as a proportion of the expenditure level. However, as explained in the previous section, inpatient services utilization is fairly constant across income groups and slightly larger in the first quintile. The fact that the utilization of inpatient facilities is higher in poorer quintiles but out-of pocket inpatient
Equipment 7%
Other 4%
Inpatient care 4%
Outpatient care 17%
Pharmaceuticals 68%
Figure 4. Structure of Out-of-Pocket Health Payments
Source: National Survey on Household Expenditure, 1996-1997
13 Argentina introduced the Convertibility Plan in 1991 which basically set the nominal exchange rate Ar$1=US$1. That convertibility lasted until 2001’s crisis.
19
HEALTH FINANCING IN ARGENTINA CAVAGNERO • CARRIN • XU • AGUILAR
expenditure increases across quintiles might be influenced by the low cost (or almost free access) offered to poor mothers at childbirth.
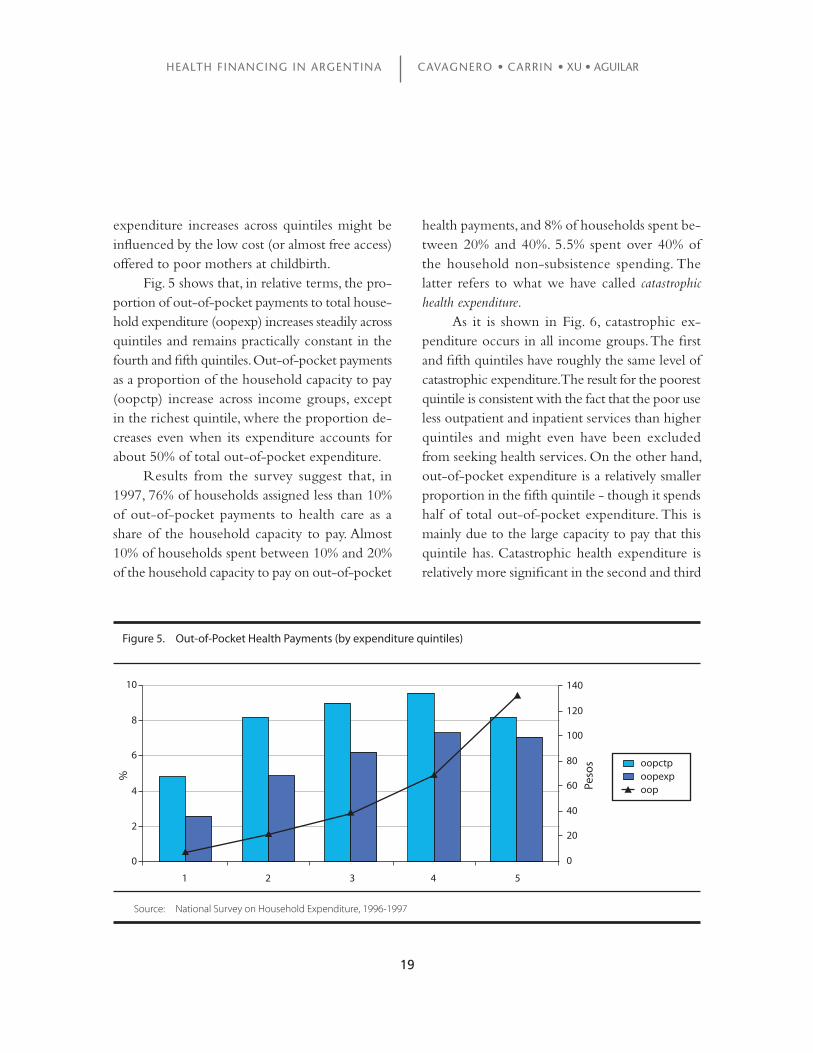
Fig. 5 shows that, in relative terms, the pro-portion of out-of-pocket payments to total house-hold expenditure (oopexp) increases steadily across quintiles and remains practically constant in the fourth and fifth quintiles. Out-of-pocket payments as a proportion of the household capacity to pay (oopctp) increase across income groups, except in the richest quintile, where the proportion de-creases even when its expenditure accounts for about 50% of total out-of-pocket expenditure.
Results from the survey suggest that, in 1997, 76% of households assigned less than 10% of out-of-pocket payments to health care as a share of the household capacity to pay. Almost 10% of households spent between 10% and 20% of the household capacity to pay on out-of-pocket
health payments, and 8% of households spent be-tween 20% and 40%. 5.5% spent over 40% of the household non-subsistence spending. The latter refers to what we have called catastrophic health expenditure.
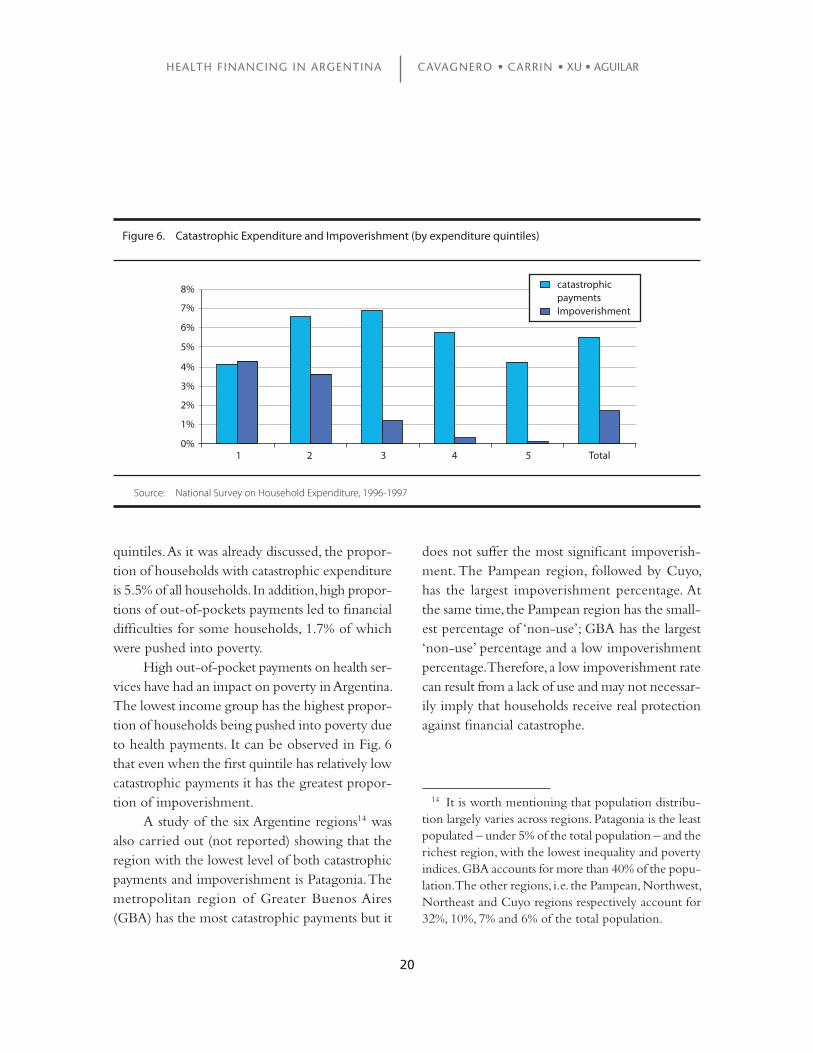
As it is shown in Fig. 6, catastrophic ex-penditure occurs in all income groups. The first and fifth quintiles have roughly the same level of catastrophic expenditure. The result for the poorest quintile is consistent with the fact that the poor use less outpatient and inpatient services than higher quintiles and might even have been excluded from seeking health services. On the other hand, out-of-pocket expenditure is a relatively smaller proportion in the fifth quintile - though it spends half of total out-of-pocket expenditure. This is mainly due to the large capacity to pay that this quintile has. Catastrophic health expenditure is relatively more significant in the second and third
Figure 5. Out-of-Pocket Health Payments (by expenditure quintiles)
Source: National Survey on Household Expenditure, 1996-1997
oopctpoopexpoop
1 2 3 4 5
0
2
4
6
8
10
0
20
40
60
80
100
120
140
Peso
s
%
20
HEALTH FINANCING IN ARGENTINA CAVAGNERO • CARRIN • XU • AGUILAR
quintiles. As it was already discussed, the propor-tion of households with catastrophic expenditure is 5.5% of all households. In addition, high propor-tions of out-of-pockets payments led to financial difficulties for some households, 1.7% of which were pushed into poverty.
High out-of-pocket payments on health ser-vices have had an impact on poverty in Argentina. The lowest income group has the highest propor-tion of households being pushed into poverty due to health payments. It can be observed in Fig. 6 that even when the first quintile has relatively low catastrophic payments it has the greatest propor-tion of impoverishment.
A study of the six Argentine regions14 was also carried out (not reported) showing that the region with the lowest level of both catastrophic payments and impoverishment is Patagonia. The metropolitan region of Greater Buenos Aires (GBA) has the most catastrophic payments but it
does not suffer the most significant impoverish-ment. The Pampean region, followed by Cuyo, has the largest impoverishment percentage. At the same time, the Pampean region has the small-est percentage of ‘non-use’; GBA has the largest ‘non-use’ percentage and a low impoverishment percentage. Therefore, a low impoverishment rate can result from a lack of use and may not necessar-ily imply that households receive real protection against financial catastrophe.
1 2 3 4 5 Total
catastrophic paymentsImpoverishment
0%
1%
2%
3%
4%
5%
6%
7%
8%
Figure 6. Catastrophic Expenditure and Impoverishment (by expenditure quintiles)
Source: National Survey on Household Expenditure, 1996-1997
14 It is worth mentioning that population distribu-tion largely varies across regions. Patagonia is the least populated – under 5% of the total population – and the richest region, with the lowest inequality and poverty indices. GBA accounts for more than 40% of the popu-lation. The other regions, i.e. the Pampean, Northwest, Northeast and Cuyo regions respectively account for 32%, 10%, 7% and 6% of the total population.
21
HEALTH FINANCING IN ARGENTINA CAVAGNERO • CARRIN • XU • AGUILAR
METHODOLOGY
The logistic regression model is applied to the analysis of catastrophic expenditure. The unit of analysis used for the regression is the household. As explained above, the qualitative dependent variable (cata) in the logistic regression is a dichotomous variable defined as 1 when the household faced catastrophic health payments and 0 otherwise. The pooled dataset contains a list of households that faced catastrophic payments. Within that popula-tion, we selected several other sub-events related to the value of the independent variables.
Based on the logistic distribution function, the probability of a household facing catastrophic expenditure is:
P=E(cata|X)=Pr(cata=1|X)=F(X´β)=eχ´β(1+eχ´β)−1
(5)
where X is the vector of independent variable and β is the coefficients’ vector.
The odds refer to the ratio of the number of relevant observations (with the required char-acteristic) to the number of irrelevant observa-tions (without that characteristic). Under random sampling conditions, a calculated proportion gives us an estimate of the probability of identifying household facing catastrophic payments. There-fore, the ‘odds ratio’ indicates how often the event happens, relative to how often it does not, under a certain circumstance. The odds ratios (OR) can be written as follows:
OR= P
= Pr (cata=1|X)
=eχ´β (6) 1−P Pr (cata=0|X)
3. ECONOMETRIC ANALYSIS
It ranges from 0 when Pr (cata=1|X)=0 to ∞ when Pr (cata=1|X)=1.
After logit transformation
In P
= In Pr (cata=1|X)
=X´β (7)
1−P Pr (cata=0|X)
Let us consider a continuous but latent vari-able, say y*, with a dichotomous realization on our dependent variable. The dependent variable, cata, is determined by:
cata =
1 if y* >0 0 otherwise
y* = const + β1work_hhi + β2senior_hi + β3child_hi + β4male_hhi + … + εi (8)
assuming that εi follows a logistic distribution. The model is estimated by maximum likelihood. Econometric results also feature ‘odds ratios’ that are associated with each explanatory variable. Such odds ratios refer to the amount by which the odds favouring cata=1 are multiplied when there is a unit increase in that variable, considering that the values for the other explanatory variables remain constant. In other words, an odds ratio below 1 for a dependent variable indicates that the factor protects a household from facing catastrophic ex-penditure, whereas an odds ratio above 1 indicates that the factor is linked to higher probability that the household faces catastrophic expenditure.
The marginal effect is also reported in this study. It is computed as a discrete probability variation following a change from 0 to 1 for an independent variable, assuming that all other inde-
22
HEALTH FINANCING IN ARGENTINA CAVAGNERO • CARRIN • XU • AGUILAR
pendent variables are constant. In that case, other independent variables are evaluated at the sample mean X. For a binary independent variable b, the expression of the slope is calculated as:
∆Pr(y=1|X)=Pr(cata=1|X,bi=1)−Pr(cata=1|X,bi=0)
∆bi (9)
Multinomial logistic regression is used to analyse service utilization (Hjortsberg, 2003). The probability that a person reporting illness sought care at a particular type of facility can be writ-ten as:
Pr(use=j|X)=exp(X´βj) (10)
4
∑exp(X´βi)
i=1
where j = 1, 2, 3, 4 stands for the use of “public”, “social insurance” or “private” health facilities or “non-use” of any of those, respectively. X is the vector of independent variables and β is the parameter vector.
Our study’s base category is non-use, i.e., β4= 0. Therefore, the probability of non-use of public facilities can be written as:
Pr(use=4|X)= 1
1+exp(X´β1)+exp(X´β2)+exp(X´β3)
(11)
The odds ratios related to the use of public, social insurance or private facilities are compared to the non-use base. As explained above, the odds
ratio is a ratio of probabilities. As a result, according to equation (10) and after convenient simplifica-tion, the odds ratios of choosing to use any health provider can be written as follows:
Pr(use= k|X) =exp(X´βk) (12)Pr(use=4|X)
Where k = 1, 2, 3 is for use of public, social insurance or private facilities, respectively.
Unlike coefficients, marginal effects are di-rectly interpretable. Marginal effects are partial derivatives of the probabilities with respect to the explanatory variables evaluated at their sample means. They are interpreted as the change in prob-ability of using a particular kind of health service facilities as one unit change in the explanatory variable occurs. In other words, it is the net effect holding the other variables at their means.
As our variables are all dummies, they rep-resent the probability change following a change from 0 to 1 of an independent variable. Having “k” health providers, we can consider the effect of changing by one unit a regressor on the jth probability as follows:
3∂Prij =Prij(βij−∑Prikβik) (13)∂xi k=1
The marginal effects for a particular inde-pendent variable depend on the β coefficients of that and all other variables. Multinomial logit coefficients and marginal effects for a particular variable may have different signs.
´
23
HEALTH FINANCING IN ARGENTINA CAVAGNERO • CARRIN • XU • AGUILAR
RESULTS
Health Services Utilization
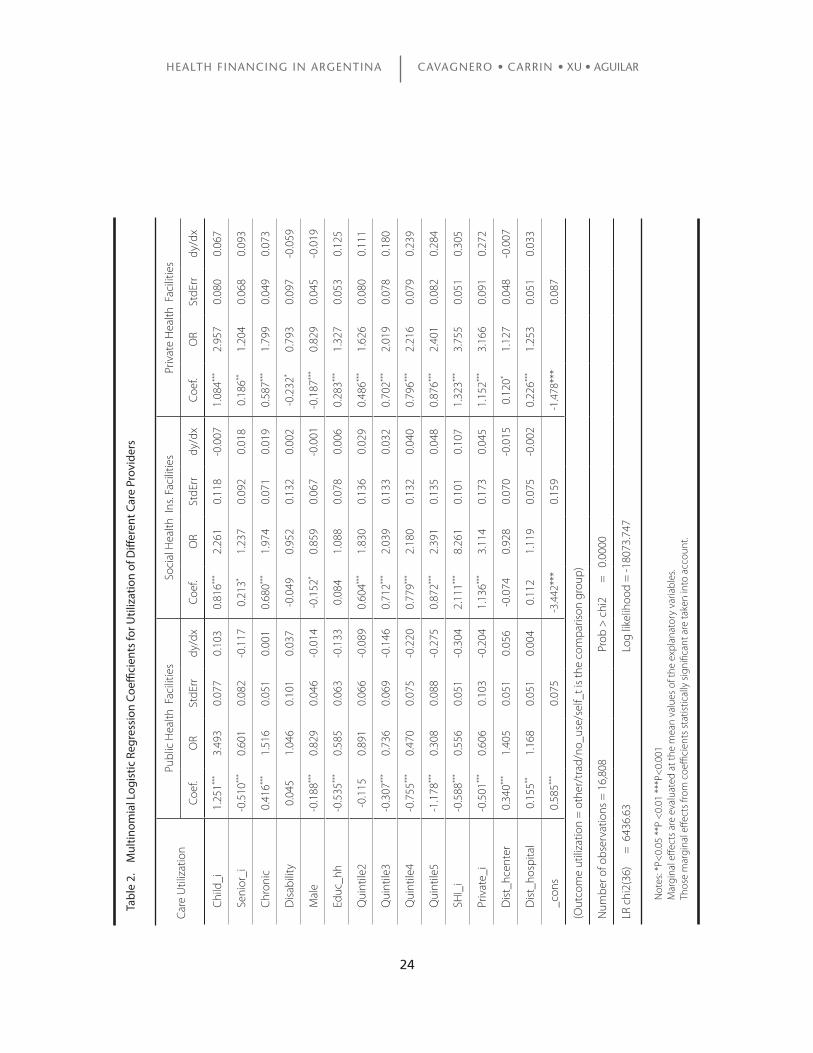
This section aims at exploring the determinants of health care utilization in the different health financing schemes, given the need for outpatient treatment. The multinomial logit regression is run for people with self-reported illness during previ-ous 30 days. The results are presented in Table 2. That method is used to examine the effect of any indicator, keeping the effects of all other indicators constant. A positive number means that the factor increases the likelihood to access a specific health financing scheme, whereas a negative number in-dicates a decreasing likelihood. In addition to the coefficients, the results are reported as relative risk ratios (OR), which give the relative risk associated with one-unit change in the explanatory variable. Figures greater (less) than one indicate higher (lower) chances to use a health facility relative to those who do not use any of these facilities. The comparison basis is the “no use” variable which includes self treatment, traditional, others and non use at all. Marginal effects are also reported.
The results from the analysis suggest that in the case of use of public health facilities, richer individuals are less likely to use such health services when needed compared to poorer quintiles, the second quintile having a statistically non-signifi-cant coefficient. All other income coefficients are statistically significant. Results are different in the case of access to private and social health insurance facilities. In both cases, richer individuals are more likely to use health services. Private health care utilization increases across quintiles. This result is
valid for social health insurance facilities, but the quintile-related increase is less pronounced than in the private case. Other individual and house-hold characteristics also affect access to health care. Variables such as the age group, gender and health conditions of the individual seeking care were taken into account, as well as the education level of the household head.
In all cases, children under five and females have greater access to health care when needed, all factors being equal. However, taking marginal effects into account an opposite sign is found for children less than five years old using social health insurance facilities. This means that children have less probability to use social health insur-ance compared to adults, holding other variables at their means. The greater access for children to public facilities can be due to the fact that the public sector contributes significantly to finance the newborns’ health services. Public hospitals provide most antenatal care almost free of charge. Potential users are mostly poor mothers with chil-dren under two (Gasparini & Panadeiro, 2003)15. Individuals over sixty-five years old have less access to public health facilities compared to younger people. However, they are more likely to use social health insurance and private facilities. This may reflect the important role played by the fund for pensioners, PAMI.
15 Gasparini & Panadeiro (2003) also found that over 40% of all beneficiaries of that program belonged to the first income quintile in 1997. This pro-poor pattern is basically the consequence of a concentration of children under two at the bottom of income distribution and a sharp decrease in the choice for public facilities with higher incomes.
24
HEALTH FINANCING IN ARGENTINA CAVAGNERO • CARRIN • XU • AGUILAR
Care
Util
izat
ion
Publ
ic H
ealth
Fac
ilitie
sSo
cial
Hea
lth I
ns. F
acili
ties
Priv
ate
Hea
lth F
acili
ties
Coef
.O
RSt
dErr
dy/d
xCo
ef.
OR
StdE
rrdy
/dx
Coef
.O
RSt
dErr
dy/d
x
Chi
ld_i
1.25
1***
3.49
30.
077
0.10
30.
816**
*2.
261
0.11
8-0
.007
1.08
4***
2.95
70.
080
0.06
7
Seni
or_i
-0.5
10**
*0.
601
0.08
2-0
.117
0.21
3*1.
237
0.09
20.
018
0.18
6**1.
204
0.06
80.
093
Chr
onic
0.41
6***
1.51
60.
051
0.00
10.
680**
*1.
974
0.07
10.
019
0.58
7***
1.79
90.
049
0.07
3
Dis
abili
ty0.
045
1.04
60.
101
0.03
7-0
.049
0.95
20.
132
0.00
2-0
.232
*0.
793
0.09
7-0
.059
Mal
e-0
.188
***
0.82
90.
046
-0.0
14-0
.152
*0.
859
0.06
7-0
.001
-0.1
87**
*0.
829
0.04
5-0
.019
Educ
_hh
-0.5
35**
*0.
585
0.06
3-0
.133
0.08
41.
088
0.07
80.
006
0.28
3***
1.32
70.
053
0.12
5
Qui
ntile
2-0
.115
0.89
10.
066
-0.0
890.
604**
*1.
830
0.13
60.
029
0.48
6***
1.62
60.
080
0.11
1
Qui
ntile
3-0
.307
***
0.73
60.
069
-0.1
460.
712**
*2.
039
0.13
30.
032
0.70
2***
2.01
90.
078
0.18
0
Qui
ntile
4-0
.755
***
0.47
00.
075
-0.2
200.
779**
*2.
180
0.13
20.
040
0.79
6***
2.21
60.
079
0.23
9
Qui
ntile
5-1
.178
***
0.30
80.
088
-0.2
750.
872**
*2.
391
0.13
50.
048
0.87
6***
2.40
10.
082
0.28
4
SHI_
i-0
.588
***
0.55
60.
051
-0.3
042.
111**
*8.
261
0.10
10.
107
1.32
3***
3.75
50.
051
0.30
5
Priv
ate_
i-0
.501
***
0.60
60.
103
-0.2
041.
136**
*3.
114
0.17
30.
045
1.15
2***
3.16
60.
091
0.27
2
Dis
t_hc
ente
r0.
340**
*1.
405
0.05
10.
056
-0.0
740.
928
0.07
0-0
.015
0.12
0*1.
127
0.04
8-0
.007
Dis
t_ho
spita
l0.
155**
1.16
80.
051
0.00
40.
112
1.11
90.
075
-0.0
020.
226**
*1.
253
0.05
10.
033
_con
s0.
585**
*0.
075
-3.4
42**
*0.
159
-1.4
78**
*0.
087
(Out
com
e ut
iliza
tion
= o
ther
/tra
d/no
_use
/sel
f_t i
s th
e co
mpa
rison
gro
up)
Num
ber o
f obs
erva
tions
= 1
6,80
8
Pro
b >
chi
2
=
0.00
00
LR c
hi2(
36)
=
643
6.63
L
og li
kelih
ood
= -1
8073
.747
Ta
ble
2.
Mul
tinom
ial L
ogis
tic R
egre
ssio
n C
oeffi
cien
ts fo
r Util
izat
ion
of D
iffer
ent C
are
Prov
ider
s
Not
es: *
P<0.
05 *
*P <
0.01
***
P<0.
001
Mar
gina
l effe
cts
are
eval
uate
d at
the
mea
n va
lues
of t
he e
xpla
nato
ry v
aria
bles
. Th
ose
mar
gina
l effe
cts
from
coe
ffici
ents
sta
tistic
ally
sig
nific
ant a
re ta
ken
into
acc
ount
.
25
HEALTH FINANCING IN ARGENTINA CAVAGNERO • CARRIN • XU • AGUILAR
Those with chronic health conditions are more likely to use health services in all insurance schemes. However, those with any disability have less access to private health services. Neither the coefficient for social health insurance utilization nor the coefficient of access to public facilities is statistically significant. A reason why people with any restriction or lack of ability have less access to private facilities might be related to the fact that private health services currently offered do not cover the needs of that group.
Social health insurance members or people with private coverage are less likely to use pub-lic facilities compared with those without any coverage. The fact that people have social health insurance coverage increases the probability of using social health insurance facilities. People with private health insurance are also more likely to do so but to a lesser extent than those with social health insurance. This reflects the fact that the use of social health insurance facilities is mostly reserved to members. Social and private health insurance coverage is positively correlated with the use of private facilities. It might be expected that privately insured people favour private facili-ties rather than social health insurance members. However, in our particular case, the coefficient is lower than in the social health insurance case. Once again, that reveals the important role played by private providers for people covered by social health insurance.
Those living within 1Km from a public health centre were more likely to use those public facilities. They were also more likely to use private health facilities compared to those that have not used any health facilities. However, in the latter case the marginal effect has a different sign. Thus,
if an individual lives near to a public health centre, her probability of using private health facilities is 0.7% lower than an individual who lives further away, holding other variables at their means.
In case of distance from public hospitals, individuals living nearer were more likely to use public health facilities and private ones. The coef-ficient for utilization of social health insurance is not statistically significant.
Catastrophic Health Expenditure
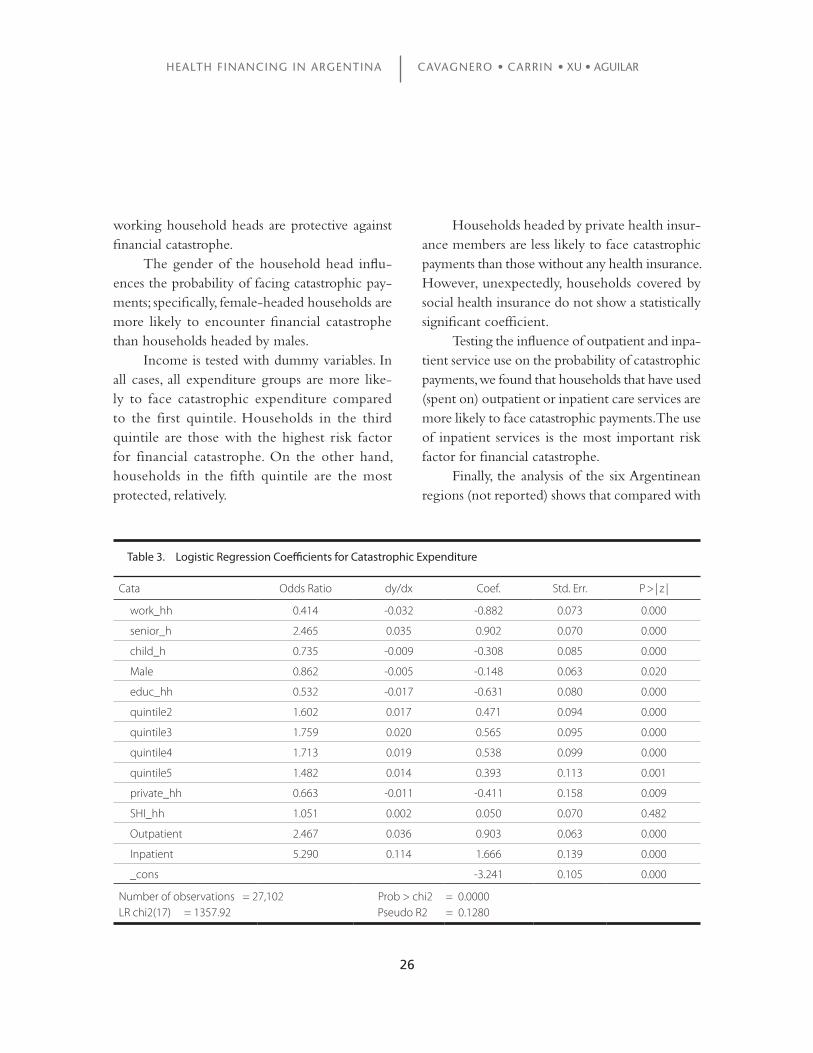
Logistic regression was applied to all households in order to explore the determinants of catastrophic expenditure. The binary independent variable is defined as 1 when a household’s health expen-diture is equal to or above 40% of its capacity to pay and 0 otherwise. The unit of analysis for the regression is the household. In addition to coef-ficients, marginal effects are presented. In our case the marginal effects are evaluated when a dummy variable is transformed from zero to one.
Results in Table 3 show that a wide range of variables are associated with catastrophic expen-diture. Households that have at least one senior member – aged 65 or more – are more likely to face catastrophic payments than younger people. Having children less than five years old is not a risk factor for facing catastrophic payments. The ‘protective effect’ of having children under 5 years old suggests that children are not a frequent cause of high health expenditure compared with adults or older populations.
Higher-educated household heads are less likely to face catastrophic payments. The same is found for working status, meaning that
26
HEALTH FINANCING IN ARGENTINA CAVAGNERO • CARRIN • XU • AGUILAR
working household heads are protective against financial catastrophe.
The gender of the household head influ-ences the probability of facing catastrophic pay-ments; specifically, female-headed households are more likely to encounter financial catastrophe than households headed by males.
Income is tested with dummy variables. In all cases, all expenditure groups are more like-ly to face catastrophic expenditure compared to the first quintile. Households in the third quintile are those with the highest risk factor for financial catastrophe. On the other hand, households in the fifth quintile are the most protected, relatively.
Households headed by private health insur-ance members are less likely to face catastrophic payments than those without any health insurance. However, unexpectedly, households covered by social health insurance do not show a statistically significant coefficient.
Testing the influence of outpatient and inpa-tient service use on the probability of catastrophic payments, we found that households that have used (spent on) outpatient or inpatient care services are more likely to face catastrophic payments. The use of inpatient services is the most important risk factor for financial catastrophe.
Finally, the analysis of the six Argentinean regions (not reported) shows that compared with
Cata Odds Ratio dy/dx Coef. Std. Err. P > | z |
work_hh 0.414 -0.032 -0.882 0.073 0.000
senior_h 2.465 0.035 0.902 0.070 0.000
child_h 0.735 -0.009 -0.308 0.085 0.000
Male 0.862 -0.005 -0.148 0.063 0.020
educ_hh 0.532 -0.017 -0.631 0.080 0.000
quintile2 1.602 0.017 0.471 0.094 0.000
quintile3 1.759 0.020 0.565 0.095 0.000
quintile4 1.713 0.019 0.538 0.099 0.000
quintile5 1.482 0.014 0.393 0.113 0.001
private_hh 0.663 -0.011 -0.411 0.158 0.009
SHI_hh 1.051 0.002 0.050 0.070 0.482
Outpatient 2.467 0.036 0.903 0.063 0.000
Inpatient 5.290 0.114 1.666 0.139 0.000
_cons -3.241 0.105 0.000
Number of observations = 27,102 Prob > chi2 = 0.0000LR chi2(17) = 1357.92 Pseudo R2 = 0.1280
Table 3. Logistic Regression Coefficients for Catastrophic Expenditure
27
HEALTH FINANCING IN ARGENTINA CAVAGNERO • CARRIN • XU • AGUILAR
Patagonia, all other regions have positive coeffi-cients, which indicates that they are more likely to face catastrophic payments. Patagonia has higher expenditure than the other regions, which broadly speaking means that the region is relatively richer. However, it worth noting that the Patagonia region only accounts for about 5% of the population. As
a result, the reason why all other regions are more likely to face catastrophic payments compared with Patagonia can rely on at least two arguments: the low population percentage in that region and the fact that the people from that region belong to higher income groups.
28
HEALTH FINANCING IN ARGENTINA CAVAGNERO • CARRIN • XU • AGUILAR
The Argentine health financing reform - namely the institution of user fees for public services together with the decen-
tralization and restructuring of Obras Sociales - is likely to have had some impact on health service utilization as well as on catastrophic health ex-penditure. Empirical results show that high out-of pocket health expenditure led 5.5% of households to face catastrophic expenditure. Such percentages are the highest for the third and second quintiles (6.8% and 6.6% respectively). Furthermore, it is estimated that 1.7% of households crossed the poverty line after health payments. Moreover, 52% of those households were in the first quintile and 35% were in the second. This result should be considered with caution as we do not know how long those households went through finan-cial difficulties caused by health expenditure and whether the impoverishment was permanent or transitory, but it undoubtedly constitutes a risk factor for poorer households.
Furthermore, results from the regression show that spending on inpatient services and having at least one senior member in the house-hold represent high risk factors for catastrophic payments. The study gives reasons to believe that elderly people are the most vulnerable and likely to fall in financial hardship due to out-of-pocket payments. Moreover, there is no evidence that households with social health insurance are better protected against catastrophic payments. Therefore, the problem is not only the presence of insurance coverage, but rather the scope of the coverage (i.e. the extent to which patients have to co-pay for services, drugs, etc.) and the lack of targeted co-payment exemptions for poor elderly people. Finally, catastrophic payments are related to in-
come, with the third quintile having the highest probability of facing catastrophic expenditure. Households with private coverage seem to be better protected. However, private coverage is concentrated in higher quintiles – about 50% of private coverage corresponds to the fifth quintile. Thus, the highest quintile has the lowest prob-ability of facing catastrophic payments. That may reflect the polarization that occurred in income distribution in the 1990s, with the gradual im-poverishment of the Argentinean middle class as it faced the highest out-of-pocket health payment burden. Notwithstanding the economic boom, open unemployment reached unprecedented levels in the 1990s. Many workers lost insurance pro-tection due to the shift to short-term contracts and part-time employment. In addition, a massive reduction of public sector jobs took place during that decade.
In the case of the utilization of health provid-ers, analysis results suggest that richer individu-als are more likely to use private health services, followed by social health insurance facilities. At the same time, richer quintiles are less likely to use public facilities, which may indicate that the perception of the poor quality of care in public health facilities leads people to turn to private health care as soon as they can afford it. Therefore, improvements in the implementation of a basic service package – and in the quality of services – may lead to some reduction in such dispari-ties. The benefit package should tackle impor-tant unmet needs of specific population groups with an adequate level of co-payment allowing citizens to receive financial protection against medical costs and avoiding catastrophic spending and impoverishment.
4. CONCLUSIONS
29
HEALTH FINANCING IN ARGENTINA CAVAGNERO • CARRIN • XU • AGUILAR
With a view to grasping the impact of changes in health system, some limitations of this study have to be taken into account. Firstly, out-of-pocket expenditure was recorded in the Na-tional Survey of Household Expenditure during a one-month period and catastrophic expenditure was based on the expenditure reported for that month. Consequently, it is important to keep in mind that catastrophic expenditure does not have the same consequences across income (expen-diture) quintiles. For lower quintiles, recovering from a catastrophic payment can be slower than in households in higher quintiles. Unfortunately, that gradual process cannot be reflected by the data available. Secondly, the quality of services at public, private and health insurance facilities seems to be an important determinant of the choice for
a specific provider, but no direct information on quality was available from the survey.
Regardless of these limitations, further analy-sis should help lead to a better understanding of the changes that occurred not only as a result of the health sector reform but also those resulting from macroeconomic changes since 1998. Ar-gentina has suffered dramatic transformations in income distribution and inequality. Poverty has substantially increased over the last three decades and per capita disposable income in real terms dropped 13% between 1997 and 2001 (Gasparini & Panadeiros, 2003). Being aware of the impact of such changes on access to health services and its economical impact on household expenditure, in particular on vulnerable groups, is a challenge that still has to be addressed.
30
HEALTH FINANCING IN ARGENTINA CAVAGNERO • CARRIN • XU • AGUILAR
BARRIENTOS A. & Lloyd-Sherlock, P. (2000). Reforming Health Insurance in Argentina and Chile. Health Policy and Planning 15(4) 417-423.
BOUIS, H. (1994). The Effect of Income on De-mand for Food in Poor Countries: Are Our Food Consumption Databases Giving us Reliable Estimates? Journal of Development Economics 44 199-226.
DEATON, A. (1992). Understanding Consumption. Oxford: Oxford University Press.
GASPARINI, L. & Panadeiros, M. (2003). Tar-geting Health and Nutrition Policies: The Case of Argentina. Fundación de Investigaciones Económicas Latinoamericana (FIEL), Capital Federal, Bs. As., Argentina. 2004.
HJORTSBERG, C. (2003). Why Do the Sick People Not Utilise Health Care? The Case of Zambia. Health Economics 12 755-770.
KAWABATA, K., Xu, K., & Carrin G. (2002). Preventing Impoverishment through Protec-tion against Catastrophic Health Expendi-tures. Bulletin of the World Health Organization 80(8), 612.
LLOYD-SHERLOCK, P. (2005). Health Sector Reform in Argentina: A Cautionary Tale. Social Science and Medicine (60) 1893-1903.
MURRAY, C., et al. Assessing the Distribution of Household Financial Contributions to the Health System: Concepts and Empirical. In Murray CJL, & Evans DB, eds. Health System Performance Assessment: Debates, Methods and Empiricism. Geneva: World Health Organiza-tion. 2003: 514-531.
PALMER, N., et al. (2004). Health Financing to Promote Access in Low Income Settings – How Much Do We Know? The Lancet 364
(9442) 1365-1370. RUSSELL, S. (1996). Ability to Pay for Health
Care: Concepts and Evidence. Health Policy and Planning 11 (3) 219-237.
RUSSELL, S. (2004). The Economic Burden of Illness for Households in Developing Coun-tries: A Review of Studies Focusing on Ma-laria, Tuberculosis, and Human Immunode-ficiency Virus/Acquired Immunodeficiency Syndrome. American Journal of Tropical Medi-cine and Hygiene 71 (2), 147-155.
SEN A. (2002). Health Perception versus Ob-servation. British Medical Journal 324(7342), 860-861.
TOBAR, F. et al. (2002). El gasto en salud en Ar-gentina y su método de cálculo. Ediciones ISALUD No. 5. Buenos Aires, 2002.
TOBAR, F. (2001). Financiamiento del sistema de salud Argentino. El sistema de salud en Argentina. Ed. J. Bello y J. Mera. OPS. Buenos Aires. 2001.
VAN DAMME, W. et al. (2004). Out-of-pock-et Health Expenditures and Debt in Poor Households: Evidence from Cambodia. Tropical Medicine & International Health 9 (2) 273-280.
WAGSTAFF, A., & Van Doorslaer, E. (2003). Ca-tastrophe and Impoverishment in Paying for Health Care: With Applications to Vietnam 1993-1998. Health Economics 12 921-934.
WHITEHEAD, M., Dahlgren, G. & Evans, T. (2001). Equity and Health Sector Reform: Can Low-income Countries Escape the Medical Poverty Trap? The Lancet 358 (9284) 833-836.
WORLD Health Organization (2000). World Health Report 2000. Geneva: WHO.
REFERENCES
31
HEALTH FINANCING IN ARGENTINA CAVAGNERO • CARRIN • XU • AGUILAR
WYSZEWIANSKI, L. (1986). Families with Cata-strophic Health Care Expenditures. Health Services Research 21 (5) 617-634.
XU, K. et al. (2003). Household Catastrophic Health Expenditure: A Multicountry Analy-sis. The Lancet 362 1 111-117.
XU, K. et al. Household Health System Contri-butions and Capacity to Pay: Definitional, Empirical and Theoretical Challenges. In Murray CJL, & Evans DB, eds. Health System Performance Assessment: Debates, Methods and Empiricism. Geneva, World Health Organiza-tion. 2003: 533-542.
XU, K. et al. (2005). Distribution of health pay-ments and catastrophic expenditures-Meth-odology. 2005. WHO Health Financing Policy discussion paper.
XU, K. et al. (2006). Understanding the impact of eliminating user fees: Utilization and cata-strophic health expenditures in Uganda. So-cial Science & Medicine 62 866-876.
ZIMMERMAN, C. (1932). Ernst Engel’s Law of Expenditures for Food. Quarterly Journal of Economics Vol. 47(No. 1), 80.
32
HEALTH FINANCING IN ARGENTINA CAVAGNERO • CARRIN • XU • AGUILAR
Editors
Felicia Marie Knaul
Stefano M. Bertozzi
Héctor Arreola-Ornelas
Fundación Mexicana para la Salud
In 2004, as a contribution to the health reforms underway in Mexico, Latin America and globally, the Mexican Ministry of Health, the Colombian Ministry for Social Protection and the Mexican Health Foundation (FUNSALUD) organized the international conference Innovations in Health Financing with support from the World Health Organization, the World Bank, the National Institute of Public Health (INSP) and the Fundación México en Harvard. The main objective of the conference was to provide a forum for the exchange of international experiences in implementing alternative strategies to provide fair, equitable, and sustainable health financing. The conference was held in memory of Doctor Juan Luis Londoño de la Cuesta, a central figure in the international debate on health system reform, who was the Minister for Social Protection in Colombia until his untimely death in February 2003.With the aim of making the findings and conclusions of the conference widely available and of stimulating debates on related topics, the World Health Organization has financed this series of working papers, published by FUNSALUD and the INSP. Hopefully they will contribute to discussions on health financing, highlight recent research findings and inform ongoing efforts in health system reform.
World Health Organization
ISB
N: 9
68-5
661-
00-6