Embed Size (px)
Citation preview

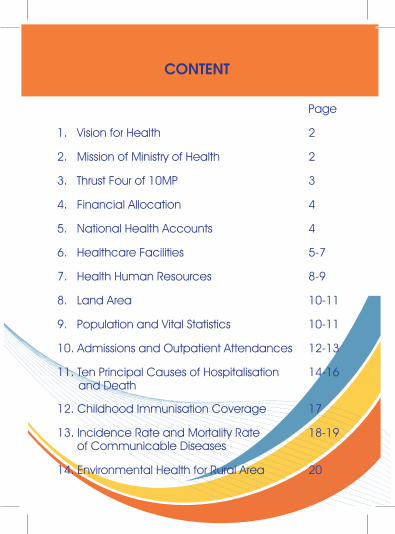
CONTENT
Page
1. Vision for Health 2
2. Mission of Ministry of Health 2
3. Thrust Four of 10MP 3
4. Financial Allocation 4
5. National Health Accounts 4
6. Healthcare Facilities 5-7
7. Health Human Resources 8-9
8. Land Area 10-11
9. Population and Vital Statistics 10-11
10. Admissions and Outpatient Attendances 12-13
11. Ten Principal Causes of Hospitalisation and Death
14-16
12. Childhood Immunisation Coverage 17
13. Incidence Rate and Mortality Rate of Communicable Diseases
18-19
14. Environmental Health for Rural Area 20
2
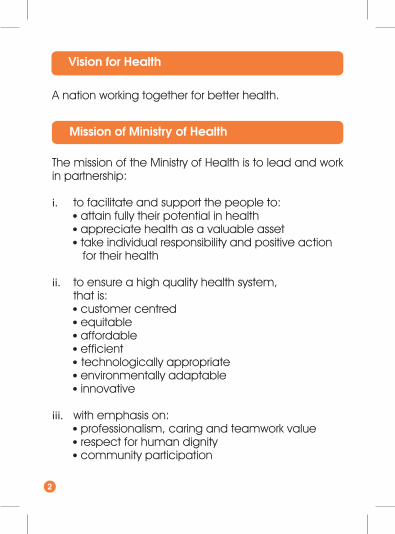
The mission of the Ministry of Health is to lead and work in partnership:
i. to facilitate and support the people to:• attain fully their potential in health• appreciate health as a valuable asset• take individual responsibility and positive action
for their health
ii. to ensure a high quality health system, that is:• customer centred• equitable• affordable• efficient• technologically appropriate• environmentally adaptable• innovative
iii. with emphasis on:• professionalism, caring and teamwork value• respect for human dignity• community participation
A nation working together for better health.
Vision for Health
Mission of Ministry of Health

3
Transforming Healthcare To Improve Quality And Provide Universal AccessEnsuring the health and well-being of the Rakyat is essential for the achievements of Vision 2020 in line with the National Missions Thrust in particular Thrust Four which is ‘To improve the standard and sustainability of quality of life’. With the commencement of the 10th Malaysia Plan in 2011, the Government of Malaysia plans to reform the healthcare delivery system with a focus on four key areas :
• Transforming delivery of the healthcare system;
• Increasing quality, capacity and coverage of the healthcare infrastructure;
• Shifting towards wellness and disease prevention, rather than treatment; and
• Increasing the quality of human resource for health.
Thrust Four of 10MP : To Improve The Standard and Sustainability of Quality of Life

4
Total MoH Allocation RM19,277,189,500
- Operating RM17,352,956,000
- Development RM1,924,233,500
Per Capita Income1 (current prices & forecast) RM32,947
Percentage of Total MoH Allocation as a Percentage of National Budget
7.66%
Indicator 2010 2011
Total Expenditure on Health (Public & Private) (in million)
RM35,075 RM37,542
Total Expenditure on Health as a Percentage of GDP (current prices)
4.58% 4.40%
Public Expenditure as a Percentage of Total Expenditure on Health
55.11% 52.73%
Source: Planning Division, MoH
National Health Accounts
Financial Allocation, 2013
Sources: Estimated Federal Budget 2013, Ministry of Finance1 Economic Report 2012/2013, Ministry of Finance

5
Indicator 2010 2011
Total Expenditure on Health (Public & Private) (in million)
RM35,075 RM37,542
Total Expenditure on Health as a Percentage of GDP (current prices)
4.58% 4.40%
Public Expenditure as a Percentage of Total Expenditure on Health
55.11% 52.73%
Source: Planning Division, MoH
Government• Ministry of Health NO. BEDS
(OFFICIAL)
Hospitals 140 38,978
- Hospitals 132 34,078
- Special Medical Institutions 1 8 4,900
Dental Clinics
- Dental Clinics 2 50 441
- Mobile Dental Clinics 27 44
Health Clinics
- Health Clinics 4 1,025 -
- Community Clinics (Klinik Desa) 1,831 -
- Mobile Health Clinics (Teams) - 197
- Flying Doctor Services (Teams) 5 6 12
Healthcare Facilities, 2012 (as of 31 December)
1 Refers to one Rehabilitation Hospital, one Women & Children Hospital, one Leprosy, one Respiratory, and four Psychiatrics Institutions
2 Refers to Standalone Dental Clinics3 Refers to Dental Chairs4 Health Clinics include Maternal & Child Health Clinics5 Refers to Teams6 Refers to Helicopters
5
5
3
3

6
Healthcare Facilities, 2012 (as of 31 December)
Government (contd.)• 1Malaysia Clinics NO. TEAMS
- 1Malaysia Clinics* 178 -
- 1Malaysia Mobile Clinics (Bus) 5 8
- 1Malaysia Mobile Clinics (Boat) 1 2
NO. CHAIRS
- 1Malaysia Dental Clinics 3 3
- 1Malaysia Dental Mobile Clinics (Bus)
1 1
• Non Ministry of Health NO. BEDS(OFFICIAL)
Hospitals 7 3,729
* as of 14 February 2013

7
Private• Licensed NO. BEDS
(OFFICIAL)
Hospitals 209 13,667
Maternity Homes 23 96
Nursing Homes 15 364
Hospice 4 38
Ambulatory Care Centre
49 101
Blood Bank 5 23
Haemodialysis Centre 363 3,347
Community Mental Health Centre
0 0
Combined Facilities4 1 14
• Registered
Medical Clinics 6,675 -
Dental Clinics 1,623 -
Healthcare Facilities, 2012 (as of 31 December)
1 Refers to 4 Cord Blood Stem Cells Banks and 1 Stem Cell and Regenerative Medicine Research Lab and Services
2 Refers to Banks/Tanks3 Refers to dialysis chairs4 Ambulatory Care and Haemodialysis Centre
Source: Medical Practice Division, MoH
Government (contd.)• 1Malaysia Clinics NO. TEAMS
- 1Malaysia Clinics* 178 -
- 1Malaysia Mobile Clinics (Bus) 5 8
- 1Malaysia Mobile Clinics (Boat) 1 2
NO. CHAIRS
- 1Malaysia Dental Clinics 3 3
- 1Malaysia Dental Mobile Clinics (Bus)
1 1
• Non Ministry of Health NO. BEDS(OFFICIAL)
Hospitals 7 3,729
1 2
3
3

8
PUBLIC PRIVATE TOTAL PROFESSION:POPULATION
Doctors 1 & 2 27,478 11,240 38,718 1: 758
Dentists 3 2,664 1,894 4,558 1: 6,436
Pharmacists 4 5,908 3,744 9,652 1: 3,039
Opticians 5 - 2,940 2,940 1: 9,979
Optometrists 5 281 855 1,136 1: 25,825
Asst. Medical Officers 1&6
10,902 944 11,846 1: 2,477
Nurses 1&7 56,089 28,879 84,968 1: 345
PharmacyAssistant 1&4
4,068 482 4,550 -
Asst. Environmental Health Officers 1&8
4,952 n.a 4,952 -
Medical Lab. Technologists 1&8
6,161 n.a 6,161 -
Occupational Therapists 1&8
836 n.a 836 -
Physiotherapists 1 1,041 n.a 1,041 -
Radiographers c&1&8 2,883 1,451 4,334 -
Dental Nurses 1 2,684 - 2,684 -
CommunityNurses d&1&7
22,917 301 23,218 -
Health Human Resources, 2012 (as of 31 December)
a
b b

9
PUBLIC PRIVATE TOTAL PROFESSION:POPULATION
Doctors 1 & 2 27,478 11,240 38,718 1: 758
Dentists 3 2,664 1,894 4,558 1: 6,436
Pharmacists 4 5,908 3,744 9,652 1: 3,039
Opticians 5 - 2,940 2,940 1: 9,979
Optometrists 5 281 855 1,136 1: 25,825
Asst. Medical Officers 1&6
10,902 944 11,846 1: 2,477
Nurses 1&7 56,089 28,879 84,968 1: 345
PharmacyAssistant 1&4
4,068 482 4,550 -
Asst. Environmental Health Officers 1&8
4,952 n.a 4,952 -
Medical Lab. Technologists 1&8
6,161 n.a 6,161 -
Occupational Therapists 1&8
836 n.a 836 -
Physiotherapists 1 1,041 n.a 1,041 -
Radiographers c&1&8 2,883 1,451 4,334 -
Dental Nurses 1 2,684 - 2,684 -
CommunityNurses d&1&7
22,917 301 23,218 -
Health Human Resources, 2012 (as of 31 December)
PUBLIC PRIVATE TOTAL PROFESSION:POPULATION
Dental Technologists 1 & 9
963 749 1,712 -
Dental Surgery Assistants 1 & 9
3,834 44 3,878 -
Traditional & Complementary Medicine Practitioners 10
n.a n.a 13,367 -
Notes :
n.a: not availablea Includes House Officersb MoH onlyc Includes Diagnostic and Therapist d Includes Midwives (Division II)e refers to registration of local and foreign practitioners
Sources:1 Human Resources Divisions, MoH2 Malaysian Medical Council3 Malaysian Dental Council4 Pharmacy Board Malaysia5 Malaysia Optical Council6 Medical Assistant Board7 Malaysia Nursing Board8 Allied Health Division, MoH9 Oral Health Division, MoH10 Traditional & Complementary Medicine Division, MoH
Health Human Resources, 2012 (as of 31 December)
e

10
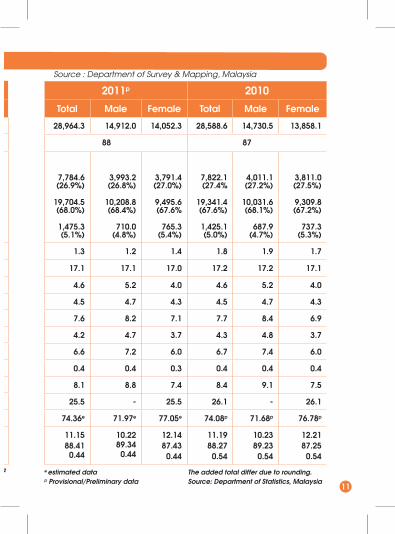
Malaysia 330,289 sq.km Source : Department of Survey & Mapping, Malaysia
Land Area
Population andVital Statistics
2012p
Total Male Female
Total Population a (‘000) 29,336.8 15,093.7 14,243.1
Population Density (per sq.km) 89
Population By Age Group: a (number & percentage)
• below 15 years (‘000) 7,757.4(26.4%)
3,980.2(26.4%)
3,777.2(26.5%)
• 15 – 64 years (‘000) 20,034.5(68.3%)
10,369.9(68.7%)
9,664.6(67.9%)
• 65 Years & above (‘000) 1,544.9(5.3%)
743.6(4.9%)
801.3(5.6%)
Annual Population Growth Rate (%) 1.3 1.2 1.3
Crude Birth Rate (per 1,000 population)
Crude Death Rate (per 1,000 population)
Stillbirth Rate (per 1,000 births)
Perinatal Mortality Rate (per 1,000 births)
Neonatal Mortality Rate (per 1,000 live births)
Infant Mortality Rate (per 1,000 live births)
Toddler Mortality Rate (per 1,000 population aged 1 – 4 years)
Under – 5 Mortality Rate (per 1,000 live births)
Maternal Mortality Ratio (per 100,000 live births)
Life Expectancy At Birth (in years)
Distribution of Live Births By Birthweight (%): • under 2.5 kg • 2.5 kg and over • unknown
a 2012 : Population projections based on the Population and Housing Census of Malaysia 2011 2010, adjusted for under enumeration. 2010 : Mid-year population estimates based on the Population and Housing Census
of Malaysia 2010, adjusted for under enumeration.
}
2011p 2010
Total Male Female Total Male Female
28,964.3 14,912.0 14,052.3 28,588.6 14,730.5 13,858.1
88 87
7,784.6(26.9%)
3,993.2(26.8%)
3,791.4(27.0%)
7,822.1(27.4%
4,011.1(27.2%)
3,811.0(27.5%)
19,704.5(68.0%)
10,208.8(68.4%)
9,495.6(67.6%
19,341.4(67.6%)
10,031.6(68.1%)
9,309.8(67.2%)
1,475.3(5.1%)
710.0(4.8%)
765.3(5.4%)
1,425.1(5.0%)
687.9(4.7%)
737.3(5.3%)
1.3 1.2 1.4 1.8 1.9 1.7
17.1 17.1 17.0 17.2 17.2 17.1
4.6 5.2 4.0 4.6 5.2 4.0
4.5 4.7 4.3 4.5 4.7 4.3
7.6 8.2 7.1 7.7 8.4 6.9
4.2 4.7 3.7 4.3 4.8 3.7
6.6 7.2 6.0 6.7 7.4 6.0
0.4 0.4 0.3 0.4 0.4 0.4
8.1 8.8 7.4 8.4 9.1 7.5
25.5 - 25.5 26.1 - 26.1
74.36e 71.97e 77.05e 74.08p 71.68p 76.78p
11.1588.410.44
10.2289.34
0.44
12.1487.43
0.44
11.1988.270.54
10.2389.230.54
12.2187.25
0.54
e estimated data The added total differ due to rounding.p Provisional/Preliminary data Source: Department of Statistics, Malaysia
11
Malaysia 330,289 sq.km Source : Department of Survey & Mapping, Malaysia
Population andVital Statistics
2012p
Total Male Female
Total Population a (‘000) 29,336.8 15,093.7 14,243.1
Population Density (per sq.km) 89
Population By Age Group: a (number & percentage)
• below 15 years (‘000) 7,757.4(26.4%)
3,980.2(26.4%)
3,777.2(26.5%)
• 15 – 64 years (‘000) 20,034.5(68.3%)
10,369.9(68.7%)
9,664.6(67.9%)
• 65 Years & above (‘000) 1,544.9(5.3%)
743.6(4.9%)
801.3(5.6%)
Annual Population Growth Rate (%) 1.3 1.2 1.3
Crude Birth Rate (per 1,000 population)
Crude Death Rate (per 1,000 population)
Stillbirth Rate (per 1,000 births)
Perinatal Mortality Rate (per 1,000 births)
Neonatal Mortality Rate (per 1,000 live births)
Infant Mortality Rate (per 1,000 live births)
Toddler Mortality Rate (per 1,000 population aged 1 – 4 years)
Under – 5 Mortality Rate (per 1,000 live births)
Maternal Mortality Ratio (per 100,000 live births)
Life Expectancy At Birth (in years)
Distribution of Live Births By Birthweight (%): • under 2.5 kg • 2.5 kg and over • unknown
a 2012 : Population projections based on the Population and Housing Census of Malaysia 2011 2010, adjusted for under enumeration. 2010 : Mid-year population estimates based on the Population and Housing Census
of Malaysia 2010, adjusted for under enumeration.
2011p 2010
Total Male Female Total Male Female
28,964.3 14,912.0 14,052.3 28,588.6 14,730.5 13,858.1
88 87
7,784.6(26.9%)
3,993.2(26.8%)
3,791.4(27.0%)
7,822.1(27.4%
4,011.1(27.2%)
3,811.0(27.5%)
19,704.5(68.0%)
10,208.8(68.4%)
9,495.6(67.6%
19,341.4(67.6%)
10,031.6(68.1%)
9,309.8(67.2%)
1,475.3(5.1%)
710.0(4.8%)
765.3(5.4%)
1,425.1(5.0%)
687.9(4.7%)
737.3(5.3%)
1.3 1.2 1.4 1.8 1.9 1.7
17.1 17.1 17.0 17.2 17.2 17.1
4.6 5.2 4.0 4.6 5.2 4.0
4.5 4.7 4.3 4.5 4.7 4.3
7.6 8.2 7.1 7.7 8.4 6.9
4.2 4.7 3.7 4.3 4.8 3.7
6.6 7.2 6.0 6.7 7.4 6.0
0.4 0.4 0.3 0.4 0.4 0.4
8.1 8.8 7.4 8.4 9.1 7.5
25.5 - 25.5 26.1 - 26.1
74.36e 71.97e 77.05e 74.08p 71.68p 76.78p
11.1588.41
0.44
10.2289.34
0.44
12.1487.43
0.44
11.1988.27
0.54
10.2389.23
0.54
12.2187.25
0.54
e estimated data The added total differ due to rounding.p Provisional/Preliminary data Source: Department of Statistics, Malaysia
12
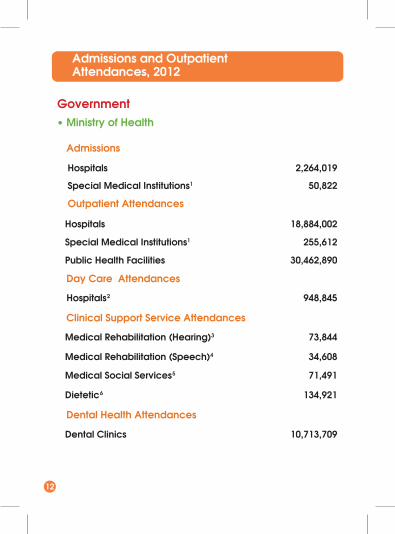
Admissions and Outpatient Attendances, 2012
Admissions
Hospitals 2,264,019
Special Medical Institutions1 50,822
Outpatient Attendances
Hospitals 18,884,002
Special Medical Institutions1 255,612
Public Health Facilities 30,462,890
Day Care Attendances
Hospitals2 948,845
Clinical Support Service Attendances
Medical Rehabilitation (Hearing)3 73,844
Medical Rehabilitation (Speech)4 34,608
Medical Social Services5 71,491
Dietetic6 134,921
Dental Health Attendances
Dental Clinics 10,713,709
Government• Ministry of Health
Maternal & Child Health Attendances
Ante-natal Attendances 5,615,916
Post-natal Attendances 549,269
Child Attendances 7,544,896
• Non Ministry of Health Hospitals
Admissions 137,362
Outpatient Attendances 1,992,113
Private Hospitals 7
Admissions 8 971,080
Outpatient Attendances 8 3,853,779
1 In 2012, the Women and Children Hospital, Likas was reclassified from Hospital to Special Medical Institution.
2 Based on 77.46% response rate.3 Based on 97.44% response rate. 4 Based on 80.29% response rate. 5 Based on 84.29% response rate. 6 Based on 88.11% response rate.7 Includes Private Hospitals, Private Maternity Homes, Private Nursing Homes and Private Hospice
8 Based on 98.42% response rate.

13
Admissions
Hospitals 2,264,019
Special Medical Institutions1 50,822
Outpatient Attendances
Hospitals 18,884,002
Special Medical Institutions1 255,612
Public Health Facilities 30,462,890
Day Care Attendances
Hospitals2 948,845
Clinical Support Service Attendances
Medical Rehabilitation (Hearing)3 73,844
Medical Rehabilitation (Speech)4 34,608
Medical Social Services5 71,491
Dietetic6 134,921
Dental Health Attendances
Dental Clinics 10,713,709
Admissions and Outpatient Attendances, 2012
Maternal & Child Health Attendances
Ante-natal Attendances 5,615,916
Post-natal Attendances 549,269
Child Attendances 7,544,896
• Non Ministry of Health Hospitals
Admissions 137,362
Outpatient Attendances 1,992,113
Private Hospitals 7
Admissions 8 971,080
Outpatient Attendances 8 3,853,779
1 In 2012, the Women and Children Hospital, Likas was reclassified from Hospital to Special Medical Institution.
2 Based on 77.46% response rate.3 Based on 97.44% response rate. 4 Based on 80.29% response rate. 5 Based on 84.29% response rate. 6 Based on 88.11% response rate.7 Includes Private Hospitals, Private Maternity Homes, Private Nursing Homes and Private Hospice
8 Based on 98.42% response rate.
Government (contd.)• Ministry of Health
14
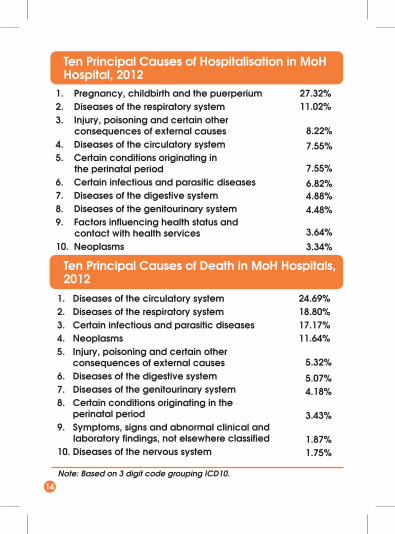
1. Pregnancy, childbirth and the puerperium2. Diseases of the respiratory system3. Injury, poisoning and certain other
consequences of external causes4. Diseases of the circulatory system5. Certain conditions originating in
the perinatal period6. Certain infectious and parasitic diseases7. Diseases of the digestive system8. Diseases of the genitourinary system9. Factors influencing health status and
contact with health services10. Neoplasms
27.32%11.02%
8.22%
7.55%
7.55%
6.82%4.88%4.48%
3.64%3.34%
1. Diseases of the circulatory system2. Diseases of the respiratory system3. Certain infectious and parasitic diseases4. Neoplasms5. Injury, poisoning and certain other consequences of external causes6. Diseases of the digestive system7. Diseases of the genitourinary system8. Certain conditions originating in the perinatal period9. Symptoms, signs and abnormal clinical and
laboratory findings, not elsewhere classified10. Diseases of the nervous system
24.69%18.80%17.17%11.64%
5.32%
5.07%4.18%
3.43%
1.87%1.75%
Ten Principal Causes of Hospitalisation in MoH Hospital, 2012
Ten Principal Causes of Death in MoH Hospitals, 2012
Note: Based on 3 digit code grouping ICD10.

15
Ten Principal Causes of Hospitalisation in MoH Hospital, 2012
1. Diseases of the respiratory system2. Pregnancy, childbirth and the puerperium3. Certain infectious and parasitic diseases4. Diseases of the digestive system5. Injury, poisoning and certain other consequences of external causes6. Diseases of the circulatory system7. Diseases of the genitourinary system8. Diseases of the musculoskeletal system and
connective tissue9. Neoplasms10. Factors influencing health status and
contact with health services
13.66%13.53%11.31%9.55%
7.55%
7.27%7.10%
5.43%4.54%
4.49%
1. Diseases of the circulatory system2. Neoplasms3. Diseases of the respiratory system4. Certain infectious and parasitic diseases5. Diseases of the digestive system6. Diseases of the genitourinary system7. Symptoms, signs and abnormal clinical and
laboratory findings, not elsewhere classified8. Injury, poisoning and certain other consequences of external causes9. Endocrine, nutritional & metabolic diseases10. Certain conditions originating in
the perinatal period
28.05%27.76%11.48%10.71%
4.63%4.02%
3.03%
2.18%1.89%
1.77%
Ten Principal Causes of Hospitalisation in Private Hospitals, 2012
Ten Principal Causes of Death in Private Hospitals, 2012
Note: Based on 3 digit code grouping ICD10.

16
1. Pregnancy, childbirth and the puerperium2. Diseases of the respiratory system3. Certain infectious and parasitic diseases4. Injury, poisoning and certain other consequences of external causes5. Diseases of the circulatory system6. Diseases of the digestive system7. Diseases of the genitourinary system8. Certain conditions originating in the perinatal period9. Factors influencing health status and
contact with health services10. Neoplasms
21.79%12.08%
8.62%
7.95%7.44%6.75%5.53%
5.40%
3.98%3.82%
1. Diseases of the circulatory system2. Diseases of the respiratory system3. Certain infectious and parasitic diseases4. Neoplasms5. Diseases of the digestive system6. Injury, poisoning and certain other consequences of external causes7. Diseases of the genitourinary system8. Certain conditions originating in the perinatal period9. Symptoms, signs and abnormal clinical and
laboratory findings, not elsewhere classified10. Endocrine, nutritional & metabolic diseases
25.10%17.90%16.37%13.63%
5.01%
4.93%
4.16%
3.23%
2.01%1.76%
Ten Principal Causes of Hospitalisation in MoH & Private Hospitals, 2012
Ten Principal Causes of Death in MoH and Private Hospitals, 2012
Note: Based on 3 digit code grouping ICD10.

17
Ten Principal Causes of Hospitalisation in MoH & Private Hospitals, 2012
Ten Principal Causes of Death in MoH and Private Hospitals, 2012
B.C.G. Immunisation Coverage of Infants1
98.72%
DPT – HIB Immunisation Coverage of Infants (3rd Dose)2
99.71%
Polio Immunisation Coverage of Infants (3rd Dose)2
99.71%
MMR Immunisation Coverage of Children Aged 1 to < 2 years
95.47%
Hepatitis B Immunisation Coverage of Infants (3rd Dose)2
98.07%
HPV Immunisation Coverage of Girls Aged 13 years (3rd Dose)
89.62%
1 Denominator: Live births from TBIS (Tuberculosis Information System)2 Denominator: Estimated live births from Dept. of Statistics, Malaysia
Source: Department of Public Health, MoH
Childhood Immunisation Coverage, 2012

18
Incidence Rate and Mortality Rate of Communicable Diseases, 2012 (per 100,000 Population)
CommunicableDiseases
Incidence Rate
Mortality Rate
Food and Water Borne Diseases
CholeraDysenteryFood PoisoningHepatitis ATyphoid
0.960.29
44.931.580.75
0.000
0.000
0.00
Vector Borne Diseases
DengueDengue Haemorrhagic FeverMalariaPlagueTyphusYellow Fever
72.202.45
16.110
0.030
00.120.05
000
Vaccine Preventable Diseases
Acute PoliomyelitisDiphtheriaHepatitis BMeaslesNeonatal Tetanus1
Other TetanusWhooping Cough
00
8.996.390.020.080.76
00
0.080
0.010.010.01

19
Incidence Rate and Mortality Rate of Communicable Diseases, 2012 (contd.)(per 100,000 Population)
CommunicableDiseases
IncidenceRate
MortalityRate
Sexually Transmitted Diseases
ChancroidGonorrheaSyphilis
05.095.70
00
0.00
Other Infectious Diseases
AIDSEbolaHand, Foot & Mouth DiseasesHepatitis CHIVLeprosyLeptospirosisOther Specified Viral HepatitisRabiesRelapsing FeverTuberculosisViral Encephalitis
4.640
117.665.91
11.721.11
12.490.26
00
77.410.08
1.820
0.000.110.57
00.16
000
4.820.01
1Per 1,000 live births Source: Disease Control Division, MoH

20
Percentage of Houses Served with Clean Water Supply
96.29%
Percentage of Houses Served with Sanitary Latrines
97.08%
Percentage of Houses Served with Sullage Disposal
66.75%
Percentage of Houses Served with Solid Waste Disposal
71.15%
Environmental Health for Rural Area1, 2012
1 Rural area refers to area outside Local Authority/Municipality’s operational area