Embed Size (px)
Citation preview

Health CareTechnologyin Australia
by David Hailey 2OVERVIEW OF AUSTRALIA
Australia, which lies southeast of Asia between the Indianand Pacific oceans, consists of the smallest continent (andthe world’s largest island—approximately 4,000 km fromeast to west and 2,000 km from north to south) as well as
the island of Tasmania. About a third of the continent is uninhab-itable; in another third the rainfall is too low to permit close settle-ment. The climate varies from tropical to alpine, with very limitedrainfall in the deserts in the center of Australia.
I Population CharacteristicsThe country’s population in 1992 was 17.4 million (17). The
population is highly urbanized; 85 percent of Australians live inurban areas, and 65 percent live in the six state capitals. The mainconcentration is in the southeast, predominantly in the coastalzone. The crude fertility rate is 15.4 births per 1,000 population.Since the establishment of New South Wales as a British Colonyin 1788, Australia’s population growth has been dominated byEuropean settlement, with immigration from Asian countries be-coming more significant in recent years. Aborigines and TorresStrait Islanders (descendants of the country’s inhabitants prior toEuropean settlement) make up 1.4 percent of the population.
Government and Political StructureThe current political structure follows the federation of the for-
mer colonies into the commonwealth in 1901 and the basis forgovernment is set out in the Constitution. Legislative power ofthe commonwealth is vested in a Parliament consisting of theQueen, a Senate, and a House of Representatives. The system ofgovernment follows the Westminster system; Australia’s Parlia- 19ment was modeled on the six state Parliaments, which were in-

20 I Health Care Technology and Its Assessment in Eight Countries
turn modeled on the British House of Commons.Parliaments of all states except Queensland are bi-cameral. The two major territories in the coun-try-the Northern Territory and the AustralianCapital Territory-are self-governing and uni-cameral.
The relative powers of the commonwealth andstates have evolved considerably since federationthrough “cooperative federalism” and interpreta-tions of the Constitution by the High Court ofAustralia (96). In its development of governme-ntal relationships through the High Court, Austra-lia has followed a pattern that is closer to theUnited States than to the British experience; manyfeatures of the commonwealth Constitution arebased on the U.S. Constitution.
The EconomyPrimary production plays an important role inAustralia’s economy, and the country is a majorexporter of food and minerals. The Gross Domes-tic Product (GDP) in 1991/92] was $386 billion,2
and the average annual growth rate of the GDPwas 3.4 percent from 1981 to 1990, with decliningor lower growth since then.
Japan is Australia’s major trading partner, andtrade links with other Asian countries arestrengthening. In 1991/92, the value of exportedgoods and services was $68.8 billion, of which 23percent was composed of agricultural and relatedproducts and 57 percent of nonrural exports (3).Manufactured goods constituted 55 percent of ex-ports, of which 14 percent comprised food, bever-ages, and tobacco; 21 percent, basic metalproducts; and 8 percent, machinery and equip-ment. Foreign exchange earnings from tourism to-taled $7.2 billion. Imports are dominated bymanufactured goods.
HEALTH STATUS OF THE POPULATIONThe marked decline in death rates in Australia
since the late 1960s continued up to 1990 (13).
Life expectancy at birth increased, and the differ-ence in life expectancy between males and fe-males narrowed slightly to 6.1 years. The lifeexpectancy for females was 80 years; for males,73.9 years (in 1990).
These trends largely reflect declines in deathrates from diseases of the circulatory system. Thisgroup of diseases remains the leading cause ofdeath, however, and was responsible for 45 per-cent of all deaths in 1990. Death rates for injuriesalso continued to decline steadily. Deaths and in-cidence rates for cancers, responsible for 26 per-cent of deaths in 1990, have been steady for someyears. In 1990 the infant mortality rate was 8.2 per1,000 live births (13).
In 1988 there was slightly more than one hospi-tal admission for every five people. For males thehighest admission rate was for the category of“diseases of the digestive system,” followed by“injury and poisoning.” Complications of preg-nancy and childbirth were the leading cause foradmission for females, followed by diseases of thegenito-urinary system. For children up to 14 yearsold, the leading causes were diseases of the respi-ratory system, injury and poisoning, and diseasesof the digestive system. For the older age groups(65 years and over), diseases of the circulatorysystem, neoplasms, and diseases of the digestiveand respiratory systems were the most commonreasons for hospitalization (13).
According to the 1989/90 health survey con-ducted by the Australian Bureau of Statistics(ABS), 30 percent of males and 29 percent of fe-males aged 18 or over reported excellent healthstatus, with a further 50 percent considering theirhealth good; only 20 percent of males and 21 per-cent of females reported their health status as fairor poor (2). Sixty-four percent of males and 60percent of females reported one or more long-termhealth conditions—most commonly eye sight dis-orders, arthritis, hay fever, back trouble, asthma,hypertension, deafness and eczema or dermatitis.
1 1991/92 (and similar references to years) refer to the Australian fiscal year, which runs from July 1 through June 30.2 Dollar figures in this paper are Australia dollars. In early 1994, the value of the Australian dollar was about $USO.7.

Chapter 2 Health Care Technology in Australia 121
In 1988 one or more disabilities were reported by16 percent of Australians, with 13 percent report-ing being handicapped in some way by their dis-ability (13). Most frequently, disabling conditionswere those of the musculoskeletal system andconnective tissue, hearing loss, and conditions ofthe circulatory system.
Some of Australia’s major health concerns arecommon to those in other developed countries, in-cluding the major causes of illness and death—heart disease, stroke, and cancer. Efforts havebeen made through health promotion strategies toreduce the prevalence of risk factors for those dis-eases. A recent estimate of the cost of diet-relateddisease is $3.6 billion a year, with prematuredeaths due to poor diet contributing 36,600 poten-tial years of life lost in 1989 (27).
Various concerns regarding women’s health arebeing addressed through a series of initiatives, in-cluding cancer screening programs and strategiesto manage osteoporosis. Substantial governmentprograms have been put in place to assist the pre-vention and treatment of HIV infection.
Some problems that are more specific to Aus-tralia include high rates of skin cancer, includingmalignant melanoma (associated with exposure tohigh levels of sunlight) and asthma. Asthmadeaths in Australia have continued to increase,with mortality rates higher than those in Englandand Wales, Canada, and the United States (103).The reasons for this high prevalence remain un-certain (91 ).
Like other countries, Australia has experienceddifferentials in health status that are stronglylinked to employment and socioeconomic status.Amongst employed males, those whose occupa-tions are classified as professional or technicalhave the lowest death rate, whereas those in oc-cupations classified as transport/communicationshave the highest—with a differential of 87 per-cent. Most major causes of death show strong oc-cupational linkages. In addition, the numbers ofserious chronic and recent illnesses and averagedays of reduced activity reported by men andwomen rise as family income decreases (13).There are also concerns regarding the health statusof certain migrant groups and their use of health
services—particularly migrants with significantcultural differences from most Australians andthose with poor English skills.
Yet another concern is the very large differen-tial between the health of Aborigines and TorresStrait Islanders and that of other Australians. Ab-original health has improved over the last two de-cades but remains substantially worse than that ofother Australians. Overall life expectancy at birthis 15 to 17 years less than that for the total Austra-lian population. Considerably higher mortalitylevels are experienced by young and middle-agedadults, and the infant mortality rate is three timesthat for all Australians. Diseases of the respiratorysystem, complications of pregnancy and child-birth, and injury and poisoning have been the mostfrequent causes of hospitalization for Aborigines.
THE AUSTRALIAN HEALTH CARESYSTEM Organization and FundingThe health care system in Australia is pluralistic,complex, and only loosely organized (13). It in-volves all levels of government as well as publicand private providers. Government has been play-ing an increasing role in financing health services,but most medical and dental care and some otherprofessional services are provided by private prac-titioners on a fee-for-service basis.
After an amendment of the Constitution in1946, the commonwealth was empowered tomake laws on pharmaceutical, hospital, and sick-ness benefits and on medical and dental services.These powers and the extension of conditionalspecific-purpose grants under section 96 of theConstitution have enabled the commonwealth toexpand its role in the health care system. The com-monwealth government is primarily concernedwith funding programs and the development ofbroad policies. It influences policymaking andhealth services through financial arrangementswith state and territory governments, provision ofbenefits and grants, and regulation of health insur-ance. State and territory governments are respon-sible for providing most health services, includingpublic hospital systems, mental health services.
22 I Health Care Technology and Its Assessment in Eight Countries
public health regulation, and licensing. The mainresponsibilities of local governments are in envi-ronmental control and a range of personal, preven-tive, and home care services.
Since 1956 the commonwealth has introducedbenefits schemes covering medical, pharmaceutic-al, hospital, and nursing home services fundedthrough government budgets. Many other pro-grams, including health promotion, control of al-cohol and drug abuse, and the campaign againstAIDS, have involved conditional grants to thestates and territories. A universal health insuranceplan—Medicare—has been in operation since1984, administered by the commonwealth gov-ernment.
The structures of the various commonwealth,state, and territory health authorities have under-gone frequent changes. At the commonwealth lev-el, the Department of Health became theDepartment of Community Services and Health in1987 and subsequently expanded further to in-clude housing and then local government. At theend of 1993, the name of the agency changed tothe Department of Human Services and Health(DHSH)(used throughout this chapter for both thecurrent department and its predecessors). A sepa-rate statutory authority, the Health InsuranceCommission (HIC), administers the Medicareprogram of universal health insurance and thePharmaceutical Benefits Scheme.
At the state and territory level, some jurisdic-tions have combined health and community ser-vices functions. The momentum has been towardcreating central agencies that delegate responsibi-lities in varying degrees to regional or area autho-rities (13). Because of each state’s separatepolitical development and the significant dis-tances between major population centers, stategovernments have tended to take distinctive ap-proaches to the provision and support of healthcare technologies (50). Differences between thestates reflect varying philosophies on the level andorganization of hospital and other services, popu-lation distribution, and development of centers ofexcellence.
In 1991/92, health care expenditure in Austra-lia was $33.2 billion, an average of $1,900 per per-son (18). The commonwealth governmentprovided $13.3 billion; state and local gover-nments, $8.1 billion; and the private sector, $9.5billion. Since 1984/85, the proportion of total ex-penditure funded by governments has declinedfrom 72 to 68 percent, with the private sector pro-portion rising correspondingly.
The government contribution is funded fromgeneral taxation revenues and a Medicare levy ontaxable incomes. General distribution of fundsfrom the commonwealth to the states and territo-ries occurs through financial assistance grantswhose amounts are determined by the Common-wealth Grants Commission. The states decide theproportion of those grants that are allocated tohealth services. Hospital funding grants, whichtotaled $3.9 billion in 1992/93, are the main formof direct commonwealth assistance to the statesand territories for health purposes (39).
For each health care technology included on theMedical Benefits Schedule, Medicare reimbursesa proportion of the cost. If a technology is not in-cluded on the schedule, costs are typicall y paid bythe patient; private insurance coverage is relative-ly limited. (For some high-cost technologies,funding has been provided through governmentgrants with very limited private sector involve-ment.) Availability of Medicare benefits often hasa major effect on a particular technology’s diffu-sion. Once a technology is on the Medical Bene-fits Schedule, private providers are more likely toobtain it, knowing that payment for its use will becovered by insurance.
Capital grants that fund the acquisition of high-cost technologies are a means for government toachieve controlled introduction and distributionof health care technologies, which have remainedlargely in the public sector; to some extent this hasalso applied to lower-unit-cost technologies with-in the public hospital system, where the allocationof resources (including additional commonwealthgrants) is determined by the state governments.
Chapter 2 Health Care Technology in Australia 123
Medical Research and PolicyCoordination
Coordination of medical research at a national lev-el is largely the responsibility of the NationalHealth and Medical Research Council (NHMRC).Its principal committees are concerned with medi-cal research, health care, public health, publichealth research and development, and health eth-ics. The Council, which obtains funding throughthe federal budget, is the major funding source formedical research in Australia.
In 1991/92 the NHMRC provided $105 millionin basic research funding through its Medical Re-search Committee, including $67 million in proj-ect and program grants and nearly $18 million inblock grants to research institutes. About $5 mil-lion was provided for projects through the Coun-cil’s Public Health Research and DevelopmentCommittee.
Other research, particularly related to healthservices and health promotion, is supported byDHSH. Some states and the Northern Territoryprovide infrastructural support for medical re-search institutes established in association withuniversities and teaching hospitals. In some cases(notably in Victoria), revenue from tobacco taxeshas been used to support health research andhealth promotion activities.
There have been relatively few attempts tochannel research toward the development of newor modified health care technologies. TheNHMRC’s funding tends to support basic re-search projects in particular areas; specific down-stream products are relatively uncommon. TheNHMRC also channels research funds to definedareas of public health need (e.g., research on asth-ma). Evaluation research (through requests forproposals on specific topics) is also funded byNHMRC and DHSH.
Some research on potential commercial prod-ucts has been supported by the commonwealth’sDepartment of Industry, Technology and Region-al Development. Many of its programs have, how-ever, been directed toward assessing specificproposals rather than focusing research on partic-ular types of technology. An interesting recent ini-tiative has been the development of cooperative
research centers (CRCS) in various fields of sci-ence and technology. A CRC, typically a consor-tium of research and commercial agencies,undertakes basic and applied research with a viewto developing commercial products; matchingfunds are provided by the commonwealth gover-nment. Some of the CRCs cover areas of healthcare, including eye research and technology, insu-lin and cellular growth factors, vaccine technolo-gy, cardiac technology, tissue growth and repair,and cochlear implant, speech, and hearing re-search.
Responsibility for the development of nationalhealth statistics lies largely with the AustralianInstitute of Health and Welfare (AIHW), the ABS,Worksafe Australia, and the DHSH. The first threeare statutory bodies and their functions, responsi-bilities, and constraints are defined by their enab-ling legislation.
One mechanism for Australian governments todiscuss matters of mutual interest concerninghealth policies and programs is provided by theAustralian Health Ministers’ Conference(AHMC) and its advisory body, the AustralianHealth Ministers’ Advisory Council (AHMAC).AHMAC includes commonwealth, state, and ter-ritory health ministers; New Zealand and PapuaNew Guinea health ministers attend meetings asobservers. AHMAC consists of the heads of Aus-tralian health authorities and the chair of theNHMRC. It is concerned with health servicescoordination across the nation. Some of its stand-ing committees deal with organ registries anddonation, women’s health, and communicablediseases. Recently, additional coordination hasbeen achieved through joint meetings with theStanding Committee of Social Welfare Adminis-trators.
Health Expenditures and HealthServices
In real terms, health expenditures are continuingto grow at a relatively steady rate. As a proportionof GDP, health expenditure in 1991/92 was 8.6percent; the increase from the previous year’s pro-portion of 8.2 percent was largely the result of low

24 I Health Care Technology and Its Assessment in Eight Countries
growth in real GDP during the recession ( 17). Forthe six years from 1984/85 onwards, health expen-diture as a proportion of GDP was almost constantat around 7.8 percent.
The largest component of recurrent health ex-penditure (43 percent) is attributed to hospitals.Most personal health care is paid for throughMedicare, and all residents of Australia (exceptforeign diplomats and dependents) are eligible forMedicare benefits. The amounts that a patient canclaim for general practitioner services are set at 85percent of the schedule fee for each item on thebenefits schedule. Diagnostic services entail high-er out-of-pocket expenses for patients.
Doctors are not obliged to abide by schedulefees, but if they bill the Health Insurance Commis-sion directly for a service, the amount payable isthe Medicare benefit and the patient is not re-quired to pay any additional amount. The propor-tion of all services direct billed in this wayincreased from 45 percent in 1984/85 to 60 per-cent in 1990/91 (13).
Agreements among governments enable all pa-tients covered by Medicare to obtain free care atpublic hospitals from appointed doctors. Privateinsurance can be purchased to cover the charges ofprivate hospitals and for private status in publichospitals. Private insurance funds also sell cover-age for services not covered by Medicare (particu-larly private dentistry, physiotherapy, chiropracticservices, and appliances) and for prescribed medi-cines not covered by pharmaceutical benefits.
For private patients in hospitals, the Medicarebenefit is 75 percent of the schedule fee, and thegap between the benefits obtainable by the pa-tients and the fees charged is insurable. In othercircumstances, the gaps between fees and theamount that can be claimed by patients cannot becovered by private insurance. Patients who re-ceive social security are not usually required topay the gap between schedule fees and Medicarebenefits. A safety-net “threshold” above whichfull schedule fees are reimbursed applies to all pa-tients.
Pharmaceutical benefits are provided for pre-scribed items purchased at retail pharmacies;items are listed on a schedule. Unsubsidized pre-
scribed items can also be purchased in pharma-cies, and many drugs are available without aprescription. When listed prescribed items aresupplied, the pharmacist recoups the cost througha patient contribution and a commonwealth subsi-dy. Safety-net arrangements limit the amount tobe paid by a patient in any calendar year.
In 1990/91, the total cost of drugs was about$1.8 billion. This included $985 million throughthe Pharmaceutical Benefits Scheme (PBS) andother commonwealth programs, $127 million forprivate prescriptions, and $200 million for hospi-tal drug use (13).
Some tension exists between the common-wealth policies and programs and those of thestates and territories. Areas of debate include thelevel of grant funding to be provided by the com-monwealth for state-operated programs andwhether certain services provided through stateinstitutions are reimbursable under Medicare (andtherefore a charge on the commonwealth). TheAHMAC has helped resolve some of these diffi-culties, but negotiations on the funding of servicesand division of responsibilities can still be pro-tracted. Tension also exists between health autho-rities generally and medical and other health careprofessions regarding the degree of support pro-vided through Medicare and other mechanismsfor particular services and technologies. A majorfocus of debate is the perceived pressure on thepublic hospital system because of the limitedavailability of certain technologies.
Proposals for ChangeIn recent years the commonwealth, states, and ter-ritories and the private sector have collaborated toimprove hospital information and financial sys-tems, hence to increase the effective use of hospi-tal resources. This collaboration has entailed thedevelopment of “casemix systems.” A CasemixDevelopment Program, introduced in 1988, pro-vided approximately $30 million in funding overfive years (13). Activities funded to date havebeen directed toward developing patient record in-formation systems in hospitals, examining waysin which different types of patients can be classi-

Chapter 2 Health Care Technology in Australia 125
fled in casemix groups, developing suitable com-puter software, improving the understanding ofrelative costs of treating different types of patientsin hospitals (diagnosis-related group costweights), and using casemix information to ex-amine the appropriateness and quality of hospitalcare. The health ministers agreed in 1992 that theadoption of uniform national casemix classifica-tions and of cost and service weights should be ad-dressed so as to advance structural reforms withinthe Australian health care system.
In 1991 the commonwealth government put inplace a national health strategy. Over a two-yearperiod the strategy was intended to focus on insti-tutional, community, and personal health servicesprimarily concerned with treating and caring forthe ill, and also to consider activities that fostergood health (66). The strategy project released aseries of about 20 papers on a wide range of issues;their substance and recommendations have pro-vided input for further consideration of changes tothe health care system.
CONTROLLING HEALTH CARETECHNOLOGYThe introduction and diffusion of health caretechnologies in Australia is determined by a com-plex interaction of market forces, public funding,and regulation (12). Nongovernmental parties, in-cluding professional groups, equipment suppli-ers, consumer organizations, third-party payers,local service administrations, and medical spe-cialists all exert significant influence, and theintroduction of a particular technology may not al-ways be consistent with health care priorities. (Forexample, the establishment of laser comealsculpting services was a result of decisions madeby individual specialists without the involvementof health policy makers.) In some areas, such as theintroduction of pharmaceuticals, there have beenstrong legislative provisions and regulatory con-trol. More common] y, however, the major methodof control is financial.
Regulation of PharmaceuticalsMajor changes to the way drugs are regulated havebeen introduced in the 1990s, updating a systemdeveloped largely in the 1970s. The first compre-hensive program for appraising the safety and effi-cacy of pharmaceuticals was developed by thecommonwealth during the early 1970s, with someadditional regulatory measures imposed by thestates of New South Wales and Victoria. The fed-eral controls applied to imported pharmaceuticalsand to products registered under the PBS. Forthese categories of product, the TherapeuticGoods Act and the Customs (Prohibited Imports)Regulations could be applied, requiring assess-ment of safety and efficacy (compliance with labelclaim).
Until recently, much weaker controls existedfor pharmaceuticals manufactured in Australiathat were not registered under the PBS, includingover-the-counter preparations. Control of thesewas to some extent effected by state regulations,which included provisions for joint common-wealth-state inspections of manufacturing prem-ises. The control of locally manufactured productshas now been strengthened by an amendment tothe Therapeutic Goods Act.
The approach to evaluating new products paral-leled that used by the United States and Sweden.Pharmaceuticals were evaluated in accordancewith a New Drug Formulation document devel-oped by the commonwealth; chemistry and quali-ty control, animal and human safety, and efficacyfor each preparation were to be described bymanufacturers. Following a detailed assessmentby the DHSH, which included some chemical andpharmacological testing of new products, phar-maceuticals that met the evaluation requirementswere certified for use by the Austral i an Drug Eval-uation Committee (ADEC). An Adverse DrugReactions Advisory Committee coordinated post-marketing surveillance.
Long-standing concerns within the pharmaceu-tical industry about the slowness of the evaluation

26 I Health Care Technology and Its Assessment in Eight Counfries
procedure generated pressure for streamlining.This pressure was increased by such issues as theperceived needfor’’fasttracking” of approvals fornewdrugs fortreatingAIDS. The pharmaceuticalindustry had also expressed concern about the rateof government reimbursement available throughthe PBS and had suggested that commonwealthpolicies were unduly restrictive on industry in theprices they could charge for drugs covered by thePBS.
These concerns eventually led to an inquiry re-garding the drug evaluation system (20), includ-ing extensive informal discussion and bargainingas well as formal hearings (29). An important is-sue identified by the inquiry was a perceived over-emphasis on safety and efficacy over timeliness.Recommendations included the adoption of stricttarget deadlines for evaluation and easier access toexperimental drugs. The review also suggestedgreater use of evaluation reports from other coun-tries, building on programs that had already beenstarted in Sweden and Canada.
Proposed administrative reforms included re-duction of “dead time” while drug applicationswere pending and a decrease in the need to refor-mat data by accepting European Community dataformats. It was further recommended that routineevaluation of all individual patient data be discon-tinued to reduce the costs to industry and the De-partment and to facilitate the use of evaluationsundertaken abroad. Preparation of product in-formation after marketing approval was to bespeeded up. The ADEC was to cease its involve-ment with more routine matters and to return toproviding expert advice on difficult clinical issuesand considering appeals of rejected applications.The findings of the inquiry were accepted by thegovernment and have led to substantial changes inthe drug evaluation program.
Availability of drugs subsidized by the com-monwealth under the PBS is achieved through thePharmaceutical Benefits Advisory Committee(PBAC), which makes recommendations onwhich products should be listed on the schedule.The PBAC is required to take into account thecost-effectiveness of drugs when making suchrecommendations. Since 1993, industry applica-
tions for listing under the PBS have had to includeformal evidence of cost- effectiveness (34). Theguidelines for industry to follow in preparing theirapplications are intended to be flexible and prag-matic while remaining linked to theoreticalfoundations. They do, however, pose challengesto industry and to government officials (31).Some emerging issues are the shortage of analyti-cal expertise, selection of comparative therapies,degree of accuracy of estimates of incrementalhealth benefits, and consistency of levels of evi-dence (69).
Despite the control exercised by the common-wealth government over pharmaceuticals’ dis-tribution and use, information about most aspectsof their use is poor ( 13). Information from DHSHindicates that between 1980/8 1 and 1990/91, thereal price per prescription issued through pharma-cies increased by 34 percent. Average expendi-tures per person on prescription drugs increasedby almost 240 percent—about twice the increasein the Consumer Price Index. The number of pre-scriptions per person increased by 16 percent andthe price per prescription increased even more.Much of the increase in prices was due to theswitch to newer, more costly drugs. Expenditureson drugs by public hospitals have decreased sincethe mid-1 980s, essentially through the transfer ofcosts to the commonwealth (PBS) by reducing thesupply of drugs to patients on discharge.
I Regulation of Medical DevicesSystematic assessment of the safety and efficacyof medical devices is less well developed than isthe program for pharmaceuticals. A formal pro-cess of evaluation of medical devices by DHSHwas implemented in the mid- 1980s (under theTherapeutic Goods Act). The most comprehen-sive component of this program has been the es-tablishment of a national register. Companiesmarketing medical devices in Australia must reg-ister their name and description with DHSH,which triggers an appraisal of product labeling. ATherapeutic Devices Evaluation Committee ap-pointed by the commonwealth minister provides
Chapter 2 Health Care Technology in Australia 127
recommendations on the import, export, and pro-duction of devices.
Beyond this, more detailed evaluation is under-taken for a limited number of categories of devicethat are prescribed by regulation. This list now ex-tends to drug infusion systems, cardiac valveprostheses, cardiac pacemakers and accessories,intrauterine devices, intraocular lenses, intraocu-lar viscoelastic fluids, and biomaterials of humanand animal origin. For such products, departmen-tal evaluations look at evidence of safety, efficacy,and the manufacturer’s quality control process.Because such appraisals are resource-intensive,DHSH has moved to establish priorities to take ac-count of major areas of need (22).
Financial Controls for Health CareTechnology
As noted earlier, the main avenues open to gover-nments for controlling the use of health caretechnologies (including procedures) have been fi-nancial-either through budgets for hospitals andclinic services (at the state level), through rate-set-ting for procedures funded through the Medicareand PBS programs, or through the allocation ofgrants for specific technologies or services. It isgenerally recognized that these are crude andimperfect ways of influencing the diffusion oftechnology and that control by regulation can onlybe partial (1 2).
Inclusion of items on the Medical BenefitsSchedule is dominant in any consideration of pay-ment for medical services, including technolo-gies. Toward the end of the 1980s, 75 percent of allmedical services in Australia were eligible forMedicare benefits, which covered a high propor-tion of the total costs. A further 18 percent of allmedical services were provided to in-patients inpublic and repatriation general (i.e., Veterans’)hospitals; the remainder was composed of veter-ans’ services, workers’ compensation, public lab-oratories, and community services (13).
Given the prominence of the Medicare programin recent years, the listing of new technologies onthe Medical Benefits Schedule and reimburse-ment policies for technologies already in place are
of major significance. Listing on the schedule isgained after submissions from professionalgroups to DHSH, which considers in detail bothcost and efficacy data.
To date there has been no systematic linking ofMedicare Benefits Schedule appraisals withhealth care technology assessment. Similarly, re-views of older technologies on the schedule havenot drawn systematically on data from Australianassessments. From time to time recommendationsin reviews of particular technologies by Austra-lian assessment bodies have influenced subse-quent decisions for listing. For example,computed visual perimetry was included on theschedule following an assessment (76), and reim-bursement for use of a portable fluoroscope wasnot supported after the national assessment bodyexpressed concerns about it (75).
Variations in technology use by different prac-titioners have concerned the commonwealth gov-ernment for many years. Although there willalways be some variation among medical practi-tioners, some appear to be overusing services asjudged by data obtained by the HIC (which is re-sponsible for administering the payment of Medi-care Benefits). Pursuit of such practitionersthrough the courts has had limited success. TheHIC has more recently begun providing feedbackto practitioners whose level of use of technologiesis considerably above average. This appears to behaving some success as an educational process, al-though the long-term effects remain to be seen.
Governments can control the introduction ofcertain technologies that have high capital costsby funding their purchase in limited numbers.Commonly, costs are shared by the common-wealth and one or more state governments. Suchapproaches appear to be successful in the short tomedium term and have been undertaken, for ex-ample, in the introduction of renal lithotripsy ser-vices, where initial restriction of governmentsupport to two sites prevented early diffusion ofthe technology (8). Such approaches seem to beessentially stopgap arrangements prior to the wid-er diffusion of technologies under Medicare fund-ing, through health program grants from the

28 I Health Care Technology and Its Assessment in Eight Countries
commonwealth, or public hospital funding pro-vided by the states.
9 Regulation of the Placement of ServicesRegulation of the placement of services has gener-ally been the responsibility of state governmentsand has typically been associated with some fi-nancial control over public sector facilities. Stateshave at times followed the suggestions and recom-mendations offered by guidelines on specialty ser-vices but often have reacted more to localpressures and imperatives. The placement of veryspecialized services has in recent years been di-rected by a policy on nationally funded centersadopted by AHMAC (discussed later).
Some control over the use of medical devices isexerted at the state level, particularly under radi-ation health legislation, which is used by somestates to license various sites to operate technolo-gy such as radiotherapy equipment. In Victoria theintroduction of certain new technologies was ef-fectively controlled for several years by certificateof need (CON) provisions under the State Health(Radiation Safety) Act. State approval was re-quired before certain equipment could be installedand operated. This legislation was applied to theintroduction of new diagnostic scanners (particu-larly computed tomography (CT) and magneticresonance imaging (MRI)) and to restrict litho-tripsy introduction. No other state has adoptedCON legislation and the Victorian use of this ap-proach now appears to be at an end.
The background to the Victorian initiative hasbeen described by Duckett (33), who commentedthat at that time, commonwealth and state incen-tives worked in opposite directions. For CT scan-ning, for example, commonwealth incentives forboth capital and recurrent expenditure were cov-ered by the Medical Benefits Schedule fee, there-by encouraging installation of scanners (as allcosts were covered). State incentives were an at-tempt to regulate CT scanner acquisition.
Quality Control and AccreditationQuality control requirements for health caretechnology services funded by governments are
not mandatory in most areas, and standards andpractice in this area are still evolving. A survey ofhospitals in 1987 found that hospital quality as-surance programs were embryonic and that al-though peer review was fairly common, itseffectiveness had not been assessed (90).
A significant force in hospital and other institu-tional quality assurance has been the AustralianCouncil on Health Care Standards (ACHS), estab-lished in 1974 by the Australian Hospital Associa-tion and the Australian Medical Association as anindependent body to promote and encourage theefficient provision of best quality health care. Itdevelops and implements national standards ofcare through an accreditation program in coopera-tion with professional bodies.
ACHS policy requires that health care facilitiesevaluate the care and services they provide in or-der to be eligible for full accreditation. This for-mal evaluation involves medical, nursing, alliedhealth, and administrative staff. If granted, ac-creditation may be for one or three years, depend-ing on the degree of compliance with guidelines.
As of April 1993,379 hospitals were accreditedby ACHS, accounting for 73 percent of privatehospital beds and 59 percent of public hospitalbeds in all states and territories. Accreditation ofhospitals is perceived as a useful means of raisingand maintaining standards, but it does not neces-sarily reflect an institution’s access to funding forthe use of a particular technology or service.ACHS is in an early stage of widening its activi-ties to cover extended care and day procedure faci-lities. Results of follow-up surveys published byACHS suggest that accredited hospitals are activein responding to recommendations made by sur-veyors. Some areas, notably medical record con-tent, continue to be resistant to change, however.
In 1989 ACHS, in collaboration with medicalcolleges and other professional bodies, began theCare Evaluation Program, which involves the de-velopment of objective clinical indicators that re-flect the process and outcomes of patient care.Development of the indicators stemmed in partfrom the medical colleges’ requirement for agreater clinical component in the accreditationprocess and ACHS’ wish to have greater clinical
Chapter 2 Health Care Technology in Australia 129
involvement in quality assurance and a more de-fined role for clinician surveyors. National stan-dards are to be established that are specific fordisciplines and facilities but that account for case-mix and illness severity. Hospital-wide medicalindicators have been developed by the Royal Aus-tralian College of Medical Administrators in con-junction with ACHS. Their use became a formalrequirement for accreditation in 1993, and theyare being phased in gradually.
The ACHS programs have given Australia acoherent framework for improving the quality ofits health care institutions. However, even withthe Council’s effort, there are limits to what hasbeen achieved even for those hospitals that are ac-credited. Coverage of ACHS accreditation is farfrom complete, and participation in the program isnot mandatory.
National pathology laboratory accreditationcame into being with amendments to the FederalNational Health Act. Accreditation is awarded onthe basis of laboratory inspections by the NationalAssociation of Testing Authorities using stan-dards developed by the National Pathology Ac-creditation Advisory Council. Only thosepremises that provide pathology services to be re-imbursed through Medicare are obliged to be-come accredited (outside of Victoria), but inpractice, a large majority of laboratories are ac-credited, including all significant public sector fa-cilities. One of the requirements for accreditationis that laboratories participate in appropriate qual-ity assurance programs, typically those offered bythe Royal College of Pathologists of Australasiaand the Australian Association of Clinical Bio-chemists. Pathology laboratory accreditation hasgenerally been regarded as successful in raisingthe standards of pathology services. While accred-itation has had no obvious effect on levels of use ofpathology testing, it has, in association with li-censing costs, been one factor in restricting to avery low level all norlaboratory pathology use inAustralia.
HEALTH CARE TECHNOLOGYASSESSMENTHealth care technology assessment in Australia isundertaken by university groups, private consul-tants, and health authorities, but its major direc-tion for over a decade has been set by nationaladvisory bodies established by governments withsecretariats provided by health authorities. As-sessments from other sources have at times beeninfluential, but the work of the national commit-tees has had the most obvious effects on health au-thorities’ opinions about health care technologiesand on the formulation of policy.
Interest in health care technology assessmentoutside the context of the regulatory appraisal ofpharmaceuticals developed during the late 1970s.A number of concerns and options were addressedin the report of the Committee on Applicationsand Costs of Modem Technology in MedicalPractice (97), which was established to addressthe increasing costs of medical investigations andpatient care. It considered various effects of tech-nological developments on medical benefits andpublic hospital costs, with some emphasis ondiagnostic methods that were then emerging as asignificant area of concern. Certain key issues re-lating to technology assessment were clearly iden-tified in this committee’s report:
Modem technology has increased the diag-nostic capability and therapeutic effectivenessof doctors. It has made significant contributionsto improvements in . . . health and . . . quality oflife . . . . However, it has been suggested that theextra resources consumed through further in-creases in the use of modem technology mayhave only marginal benefits in terms of furtherimprovements in health . . . . Both [doctors andpatients] now tend to be less willing to acceptdiagnoses that have been arrived at solely on thebasis of clinical examinations.
The report viewed technology assessment asone of several long-term measures to improve theeffectiveness of technological services in the

30 I Health Care Technology and Its Assessment in Eight Countries
Australian Health Technology Advisory Committee (AHTAC)Identify, gather data on, and assess new and emerging health technologies and highly specialized services, Including
their safety, efficacy, effectiveness, cost, equity, accessibility, and social impact in the context of the Australianhealth care system.
Assess and develop guidelines for established health technologies and highly specialized services in light of theirhistory of use.
Determine methods of and priorities for assessment of health technologies.
Advise the Australian Health Minister’s Advisory Council (AHMAC) on requests relating to the assessment oftechnologies in the context of AHMAC’S nationally funded centers policy,
National Health Technology Advisory Panel (NHTAP)Identify, gather data on and, where appropriate, assess new and emerging health technologies, including their safety,
efficacy, effectiveness, cost, accessibility, and social impact In the context of the Australian health care system.Review and assess established health technologies in light of their history of use,
Determine methods of and priorities for assessment of health technologies, and issue guidelines on these topics.
Make recommendations on appropriate areas of research into health technologies.
Make recommendations on educational measures for promoting the appropriate use of health technologies,
AHMAC Superspecialty Services Subcommittee (SSS)Develop guidelines for superspecialty services, defined as highly specialized services for relatively rare diseases or
which are unusually complex and costly. Guidelines should include the potential for integration, coordination, andrationalization of superspecialty services. Guidelines are submitted through AHMAC to the Australian HealthMinisters’ Conference for approval.
SOURCE D M Halley, 1994
health care system. The committee recommendedthat an expert national panel be established to ad-vise on the scope of new technology; whethermedical benefits should be paid for its use and, ifso, whether it should be restricted to specific loca-tions; and likely changes in patterns of use of re-lated technology.
D The Formation and Operation ofNational Advisory Bodies
A National Health Technology Advisory Panel(NHTAP) was established by the commonwealthin mid-1982 (table 2-1). As envisaged by the SaxCommittee, its membership balanced various in-terests and included representatives of the medicalprofession, hospitals, the health insurance indus-try, and manufacturing, as well as technical spe-cialists. The DHSH chaired and provided asecretariat for the Panel, which reported to the fed-eral minister for health and had broad terms of ref-erence.
The Panel selected MR1 as its first topic andproduced its first report in 1983. This influentialassessment was a major input to policy on MRI.The MRI report established a process used by thePanel in later work: detailed consideration ofavailable literature plus consultation with profes-sional bodies, manufacturers, and health authori-ties, culminating in a synthesis of availableinformation. Particular focuses were on clinical,technical, safety, and utilization data (cost datawere also included but without duplicating activi-ties undertaken by the DHSH). The Panel was alsoinvolved in two major assessments involving pri-mary data collection: the MRI study that followedfrom the first report and one on dry chemistrypathology analyzers. Both were coordinated bytechnical committees that included representa-tives from appropriate professional bodies.
The Panel produced numerous assessment re-ports as administrative arrangements evolved.
Chapter 2 Health Care Technology in Australia 131
Year Topic Originator of request——..—— ..——.
1987-9019871988
1983-90 MRI, MR spectroscopy
1984 Medical Cycloton Facilities
1985 Lasers in medicine1985, 1987 Renal extracorporeal shock wave Iithotripsy1986, 1989 Bone mineral assessment1986 Digital subtraction angiography
Vestibular function testing
Surgical staplingLasers in gynecology
Oxygen concentrators
Nonlaboratory pathology testing
EndoscopyDigital radiology
CT scanningPortable fluoroscope
Screening MammographyBillary extracorporeal shock wave Iithotripsy
Dynamometry for low back pain
1989 Coronary angioplastyHigh energy radiotherapy equipment
Computerized perimetry1990 Extracorporeal Membrane Oxygenation
Cerebrovascular embolizatlonPositron emission tomography
NHTAP
Federal MinisterNHMRC
DHSH
DHSH
DHSHDHSH
Industry
Professional body
NHTAP
AHMACProfessional body
NHTAPNHTAP
DHSHAHMAC
NHTAP
Accident Compensation OrgNHTAP
State Health AuthorityDHSH
AH MACAHMACDHSH— ——— —.—.————
KEY AHMAC = Australian Health Mlnlsters Advisory Council, DHSH = Department of Human Serwces and Health, NHMRC = Nahonal Health andMedical Research Council
SOURCE D M Halley, 1994
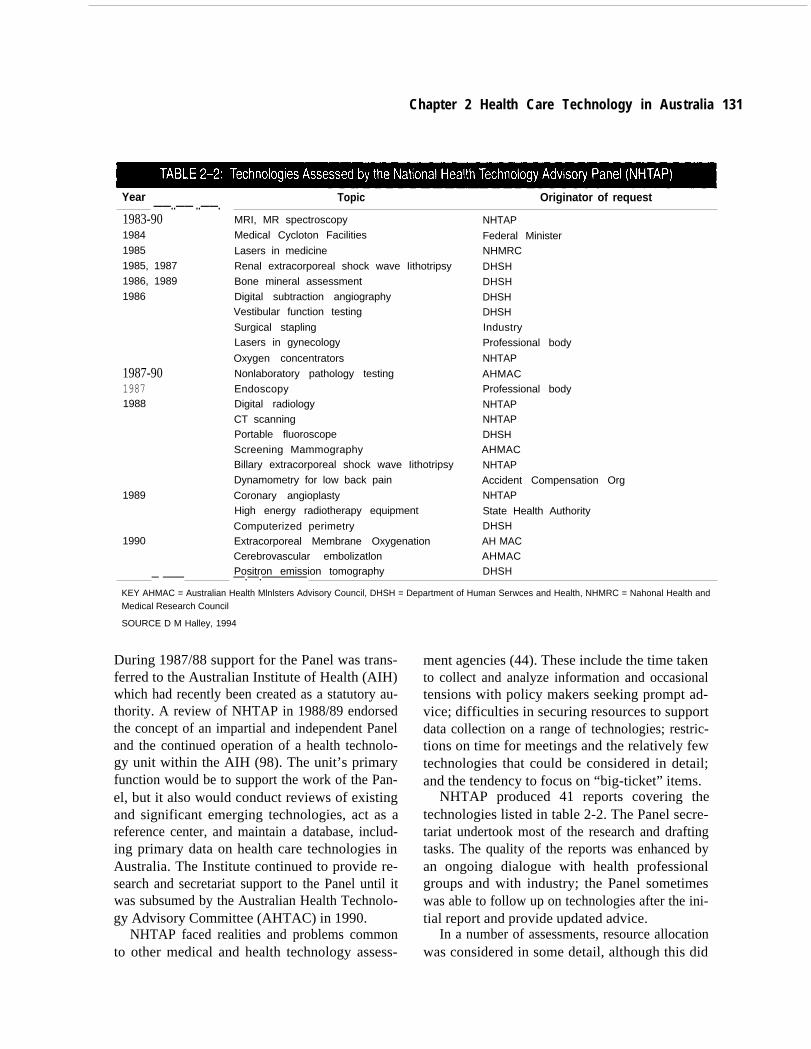
During 1987/88 support for the Panel was trans-ferred to the Australian Institute of Health (AIH)which had recently been created as a statutory au-thority. A review of NHTAP in 1988/89 endorsedthe concept of an impartial and independent Paneland the continued operation of a health technolo-gy unit within the AIH (98). The unit’s primaryfunction would be to support the work of the Pan-el, but it also would conduct reviews of existingand significant emerging technologies, act as areference center, and maintain a database, includ-ing primary data on health care technologies inAustralia. The Institute continued to provide re-search and secretariat support to the Panel until itwas subsumed by the Australian Health Technolo-gy Advisory Committee (AHTAC) in 1990.
NHTAP faced realities and problems commonto other medical and health technology assess-
ment agencies (44). These include the time takento collect and analyze information and occasionaltensions with policy makers seeking prompt ad-vice; difficulties in securing resources to supportdata collection on a range of technologies; restric-tions on time for meetings and the relatively fewtechnologies that could be considered in detail;and the tendency to focus on “big-ticket” items.
NHTAP produced 41 reports covering thetechnologies listed in table 2-2. The Panel secre-tariat undertook most of the research and draftingtasks. The quality of the reports was enhanced byan ongoing dialogue with health professionalgroups and with industry; the Panel sometimeswas able to follow up on technologies after the ini-tial report and provide updated advice.
In a number of assessments, resource allocationwas considered in some detail, although this did

32 I Health Care Technology and Its Assessment in Eight Countries
not always include economic analysis. The morecommon approach undertaken by the Panel was toinclude cost analyses without proceeding to fulleconomic evaluation. However, in these and otherreports, many of the concepts embedded in mod-els of economic assessment of health care technol-ogies were taken into account (32).
Health authorities were major targets forNHTAP assessments—particularly DHSH withrespect to technologies that were potential candi-dates for funding through Medicare. About halfthe referrals received by the Panel came fromhealth authorities, but in some cases NHTAP initi-ated work on its own to provide early warning ofpotentially significant developments.
Although many of its recommendations wereconcerned with the adoption of technology andguidance on appropriate, phased introductions, invarious instances the Panel also offered sugges-tions to professional bodies on the appropriate useof medical devices or procedures.
Another initiative in the early 1980s was thecreation by the AHMAC predecessor of a Super-specialty Services Subcommittee. It developedguidelines for highly specialized services cateringto relatively rare diseases or those that entailed un-usually costly or complex forms of treatment.This initiative was motivated by increasing pres-sures on state health authorities to organize andfund more complex services within their hospi-tals. The Subcommittee, which was composed ofcommonwealth and state officials, relied on indi-vidual health departments to provide researchsupport as resources became available.
Aided by professional bodies and other centersof expertise, the Subcommittee compiled in-formation on the use, demand, distribution, andappropriate operation of various health services.Its publications provide general background de-scriptions of services followed by guidelines onsuch issues as bed requirements, sizes of units,geographic distribution, design of facilities,equipment requirements, and relationships withother services and staffing. The development ofthese guidelines proved to be demanding. Needed
Year Topic
1982 Burn treatment
1983 Cardiac surgery
Level 3 neonatal intensive care(updated 1990)
1985 Bone marrow transplant services
Genetic disorders
1987 Cancer treatment services1988 Major plastic and reconstructive
surgery1989 Acute spinal cord injury services
1990 Refractory epilepsy centers —
SOURCE D M Halley, 1994
data were hard to obtain, and there were problemsin achieving consensus on what were effectivelyaset of standards for specialized health servicesthroughout the country (44).
The Subcommittee prepared nine guidelineswith one major update (table 2-3). Most of theguidelines are valuable resource documents andcontinue to be widely regarded, although their rec-ommendations are not necessarily followed by alljurisdictions.
Current Structure of AssessmentEntitiesIn 1990 both the Panel and the Subcommittee
were subsumed by a new body, the AustralianHealth Technology Advisory Committee (AH-TAC) which was to report to the Health CareCommittee of the National Health and MedicalResearch Council (NHMRC). This change was inline with a move to establish stronger links be-tween AHMAC and NHMRC and to involveNHMRC more closely in advising health authori-ties on health services and technology.
Still in its early stages of development, AH-TAC retains some of the characteristics ofNHTAP. Its membership provides a range of ex-pertise and is drawn from diverse sectors. AHTACwill be regarded as a source of advice to AH MAC

and DHSH on various matters, and may also re-ceive requests for advice through the Health CareCommittee. AHTAC is tending to follow theNHMRC practice of convening a working partyfor each project.
AHTAC’S work to date has been dominated byreferences on Nationally Funded Centers passedto it by AHMAC. The Committee is also continu-ing with the Subcommittee’s work on guidelinespreparation, which seems likely to be a significantongoing function. Another likely undertaking isthe preparation of brief statements on technolo-gies, particularly for patients and the general pub-lic; the Committee’s place within the NHMRCstructure may provide a particular advantage indrawing on networks and achieving publicity. TheCommittee’s reports are issued through theNHMRC system, and all are endorsed by thisbody (table 2-4 lists AHTAC’S publications todate).
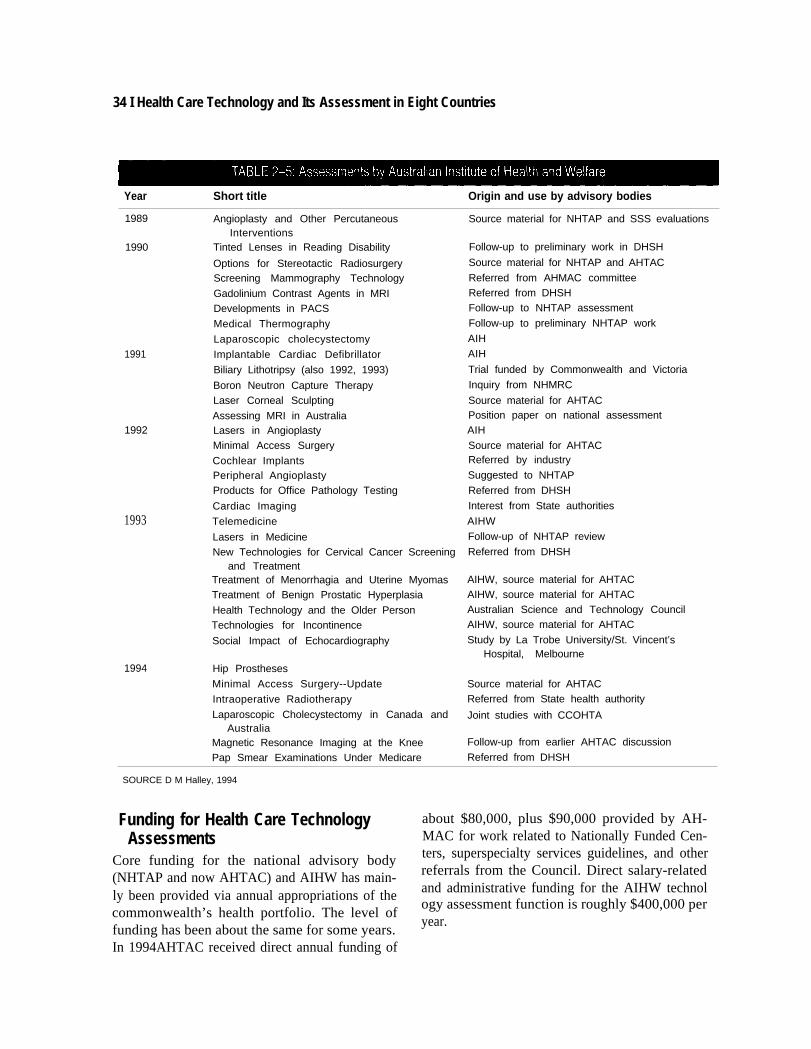
AIHW undertakes health technology assess-ments in addition to its work in support ofAHTAC, following the general directions recom-mended in the review of the earlier Panel. Thiswork includes assessments initiated by the Insti-tute or requested by other agencies, includingDHSH; collation and publication of statistics onhealth care technologies in Australia; and partici-pation in collaborative work with hospitals andother centers. (Assessments published by theInstitute are listed in table 2-5.) In addition, on be-half of AHMAC the Institute undertook a majorassessment project on screening for breast andcervical cancer.
Following a project undertaken for DHSH, in1991 the Institute started a series of emergingtechnology briefs intended to provide prompt ad-vice to health authorities and managers on newmedical devices and procedures that seemed like-ly to have a significant impact on the health caresystem (table 2-6). There has been some collabo-ration with Canadian agencies in the preparationof these briefs. Briefs on current issues dealingwith more established technologies have alsobeen developed.
In some cases assessments that have been un-dertaken by the Institute have formed the basis for
Chapter 2 Health Care Technology in Australia 133
Year
1991
1992
1993
1994
Topic
Consensus statement on clinical efficacy ofMRI
RenaI stone therapyLiver transplantation programsStatement on sleep disordersGuidelines for renal dialysis and
transplantationLiver transplantation programs--2nd reviewTreatment of sleep apneaStatement on laser corneal sculptingRenal lithotripsyHeart and lung transplantation programsLow power lasers in medicineTreatment options for benign prostatic
hyperplasia
Briefs (Nationally Funded Center Assessments)
“1 990 Alfred Hospital, Melbourne cardiactransplantation unit
1991 Pediatric cardiac transplantationStereotactic radiosurgery
1992 Craniofacial surgeryBone marrow transplantation using
unmatched donors1993 Queensland cardiac transplantation service—
SOURCE D M Halley, 1994
subsequent evaluation by AHTAC or other groups.For example, the statement on laser cornealsculpting followed an emerging technology briefand then a discussion paper by the Institute, whichwere in turn followed up by AHTAC. In otherareas—for example, in a discussion paper on tele-medicine (25)—the Institute has undertakenbroader reviews that have served as resource doc-uments for health authorities and other interestedparties.
The National Center for Health Program Evalu-ation, which is partly funded through NHMRCand is part of Monash University in Melbourne,has had some involvement with health technologyassessment matters. Its work has included cost-utility analysis of treatments for biliary disease,evaluation of whole body protein monitors, andassessment of laser treatment of benign prostatichyperplasia.
34 I Health Care Technology and Its Assessment in Eight Countries
Year Short title Origin and use by advisory bodies
1991
1992
1993
1994
1989 Angioplasty and Other PercutaneousInterventions
1990 Tinted Lenses in Reading Disability
Options for Stereotactic RadiosurgeryScreening Mammography Technology
Gadolinium Contrast Agents in MRIDevelopments in PACS
Medical Thermography
Laparoscopic cholecystectomy
Implantable Cardiac Defibrillator
Biliary Lithotripsy (also 1992, 1993)
Boron Neutron Capture TherapyLaser Corneal Sculpting
Assessing MRI in AustraliaLasers in AngioplastyMinimal Access Surgery
Cochlear ImplantsPeripheral AngioplastyProducts for Office Pathology Testing
Cardiac Imaging
Telemedicine
Lasers in MedicineNew Technologies for Cervical Cancer Screening
and TreatmentTreatment of Menorrhagia and Uterine MyomasTreatment of Benign Prostatic Hyperplasia
Health Technology and the Older PersonTechnologies for Incontinence
Social Impact of Echocardiography
Hip Prostheses
Minimal Access Surgery--Update
Intraoperative Radiotherapy
Laparoscopic Cholecystectomy in Canada andAustralia
Magnetic Resonance Imaging at the KneePap Smear Examinations Under Medicare
Source material for NHTAP and SSS evaluations
Follow-up to preliminary work in DHSH
Source material for NHTAP and AHTAC
Referred from AHMAC committeeReferred from DHSHFollow-up to NHTAP assessment
Follow-up to preliminary NHTAP work
AIH
AIH
Trial funded by Commonwealth and Victoria
Inquiry from NHMRC
Source material for AHTACPosition paper on national assessmentAIH
Source material for AHTACReferred by industry
Suggested to NHTAP
Referred from DHSH
Interest from State authorities
AIHW
Follow-up of NHTAP review
Referred from DHSH
AIHW, source material for AHTACAIHW, source material for AHTACAustralian Science and Technology CouncilAIHW, source material for AHTAC
Study by La Trobe University/St. Vincent’sHospital, Melbourne
Source material for AHTACReferred from State health authority
Joint studies with CCOHTA
Follow-up from earlier AHTAC discussion
Referred from DHSH
SOURCE D M Halley, 1994
Funding for Health Care Technology about $80,000, plus $90,000 provided by AH-
Assessments MAC for work related to Nationally Funded Cen-
Core funding for the national advisory body ters, superspecialty services guidelines, and other
(NHTAP and now AHTAC) and AIHW has main- referrals from the Council. Direct salary-related
ly been provided via annual appropriations of the and administrative funding for the AIHW technology assessment function is roughly $400,000 per
commonwealth’s health portfolio. The level offunding has been about the same for some years.
year.
In 1994AHTAC received direct annual funding of

Year Topic—..—1991 Laser corneal sculpting
Radiofrequency catheter ablation
Cervical loop diathermy
New laparoscopic procedures
1992 Endovascular coronary stents
Helium lasers in corneal sculpting
Cardlomyoplasty
Collagen Implant therapy for treatment ofstress incontinence
Excimer lasers in coronary angloplasty
Technologies for treating benign prostatichyperplasia
Cerebral oximetry
Magnetoencephalography (MEG)
Cultured skin
Magnetic resonance anglography
Laparscopically assisted hysterectomy
Transurenthral Iithotnpsy
1993 Lasers in dentistry
Coronary atherectomy
Radiolabeled monocolonal antibodies indiagnostic Imaging
Fall oposcopy
Focused extra corporeal pyrotherapy
Levonorgestrel IUD for menorrhagia
1994 Digital mammography
Dedicated MRI extremly scanners
Stereotactic Image-guided surgery
Health technology issues
1993 Carotid endarterectomy
Diagnostic hysteroscopy
Prostheses for total hip replacement
Implantable defibrillators
Hellcal CT scanners
Cholesterol screening and associatedInterventions—
SOURCE D M Hailey, 1994
In practice, other funding has generally becomeavailable on a short-term basis for the national ad-visory body, and the Institute receives grants fromDHSH and other sources. In 1990,$200,000 wasmade available by DHSH for specific small proj-ects under the auspices of NHTAP, which were ad-
Chapter2 Health Care Technology in Australia 135
ministered by AIH. The Department continues toprovide evaluation funding for projects that arebroadly related to current policy—including, forinstance, support for a randomized trial of laparo-scopic cholecystectomy, work by AHTAC onminimal access surgery, and a review of technolo-gies for cervical cancer screening undertaken byAIHW.
In general, over the last decade the level offunding for the health technology assessment pro-vided some assurance of continuity, but it remainsat a modest level, limiting what can be achieved.Additional resources would permit more detailedeconomic studies, more consistent follow-up oftechnologies after their initial evaluation, widercoverage of technologies, and greater focus on pa-tient perspectives.
Impacts of Health Care TechnologyAssessment
The early studies of MRI and dry chemistrypathology testing (where local primary datacollection was being undertaken) and assessmentsof medical cyclotrons and renal lithotripsy, allwere prompted by policy considerations and theresults were used in the decisionmaking process(40,41).
Possible measures of impact and the conditionsfor these to occur were described and applied to areview of 24 technologies assessed by NHTAP(43). The Panel’s reports appeared to have had asignificant influence in the short to medium termfor 11 of 20 technologies assessed through 1988;major recommendations were accepted, and sub-sequent governmental or other action was taken.Sixteen reports proved useful as source and educa-tional materials, as judged by requests and litera-ture citations. As an indirect indicator of impact,there was a steady growth in the number of re-quests for reports, and some publications wereused in university courses.
The influence of Australian assessments of 10health technologies (by NHTAP, AU-I and AH-TAC) was discussed in more detail by Drummondand coworkers (32), who felt that the assessmentsmet important criteria (e.g., whether evaluationquestions were clearly specified, alternatives ad-

36 I Health Care Technology and Its Assessment in Eight Countries
dressed, follow-up studies undertaken, and policyand practice influenced). The evaluations were in-fluential, although the impacts of some of themhad yet to be fully established given the intervalbetween receipt of advice and policy formulation.As in other countries, the most obvious successes,in terms of policy being informed by assessment,have been linked to the possible introduction of atechnology. The evaluation mechanisms availableand their influence on the actual use of technolo-gies become less certain after diffusion.
A further analysis noted that the impact of as-sessments by advisory bodies was greatest whenlocal primary data were collected and the technol-ogy was not yet available or had just beenintroduced (42). The data generated by the variousassessments was important, but perhaps equallysignificant was the commitment made by govern-ments to support data collection in the first place.Each of the assessed technologies was seen as sig-nificant in policy terms so that evaluation fundingwas made available to hospitals and other institu-tions.
Assessments of eight technologies consideredunder the Nationally Funded Centers policy faceddifficulties because of limited data and time foranalysis but were nonetheless very successful: al-most all the recommendations were accepted byAHMAC. In these cases the influence on policy ismore obvious and direct, given the relatively nar-row focus (i.e., to fund or not fund from a particu-lar pool of money under set criteria) and the clearwish of health authorities for advice. Of 18 assess-ments undertaken by AIHW, five were used as in-put for subsequent NHTAP and AHTACevaluations, all but two seemed to provide signifi-cant source material, and eight appeared to signifi-cantly influence policy or further research.
A survey undertaken by AHTAC of gover-nment agencies and other recipients of assessmentreports showed that many considered the back-ground information, the data on use, caseload, ef-fectiveness, and cost, and the recommendations tobe generally useful. The background informationseemed of rather more immediate help to somepolicy makers than the cost/economic analyses.The scope of the assessments in most cases was
seen as generally relevant or (less often) very rele-vant; to some extent this probably reflected thedifficulty of capturing the immediate policy inter-est of the moment. Although the reports were seenas generally timely by a most survey respondents,only a small proportion thought they were “verytimely.”
The impact of health care technology assess-ment has been most readily visible in the decisionsof health authorities and other funding sources.The effects on patterns of clinical practice is lesscertain; they have probably been more limited, butdetailed studies have yet to be undertaken. The re-view of the impact of NHTAP assessments drewattention to the probable increased acceptance byprofessional bodies of the need for evaluation andcritical consideration of health technologies (43).Changes to clinical practice maybe slow, howev-er: some influences of health technology assess-ment will be felt only over the long term. Thefurther review of 10 technologies suggested thatin five cases, assessment had probably affectedclinical practice; it was too early to make such ajudgment for another two cases (32).
In some areas there maybe reluctance to acceptnew evidence. An Australian randomized trialwas among several studies that demonstrated thatantenatal fetal heart rate monitoring had no detect-able effect on mortality or morbidity in high-riskcases (65). However, during the year after the trialended, use of the technology in the hospital in-creased 16-fold, and it extended to less and lessappropriate groups (64). This technology contin-ues to be widely applied some years later.
A recent initiative of NHMRC has been theformation of a Quality of Health Care Committeethat is responsible for preparing clinical practiceguidelines. Three guidelines currently under de-velopment cover treatment of breast cancer,ischemic heart disease, and depression in adoles-cents. This approach offers the potential tostrengthen the impact of assessment by providinga further channel for the results of individual eval-uations.
The appraisals of impact indicate a need for im-proved dialogue among concerned parties, the de-sirability of timely advice, and the need for

Chapter 2 Health Care Technology in Australia 137
realistic linkages with the policy processes andmethods of practice. There is an unmet need forsystematic appraisal of a greater range of technol-ogies and for follow-up after their introduction.This in turn points to the need for a wider constitu-ency in health care technology assessment, withinput from hospitals and other organizations.
Both NHTAP and AHTAC have involved clini-cians (as well as other experts) in the assessmentprocess, both through consultation during devel-opment and through comment and debate ondrafts at the review stage. Public involvement inthe work of the national advisory bodies has so farbeen limited, although NHTAP included a con-sumer representative; such representation is stan-dard practice with NHMRC committees,including AHTAC. If there are significant movestoward organizing consensus conferences, a formof assessment that has not been widely used inAustralia, public involvement may increase. Fur-ther development of advisory statements by AH-TAC (making use of the NHMRC distributionprocess) might also increase public involvement.
Health technology assessment is well estab-lished in Australia and has influenced healthpolicy. However, limitations on resources, the de-gree of coverage of technologies, and the extent towhich initial assessments can be followed up areconcerns that need addressing as technology as-sessment proceeds in Australia. It would also bedesirable to achieve better coordination of evalua-tion groups and to complement existing success-ful patterns of assessment with further use of moreformal methods, such as detailed cost-effective-ness studies and meta-analyses. Finally, greateruse could be made of health technology assess-ment by policy makers, health care providers, andfunders.
Policies on Specific Technologies andPharmaceuticals
Nationally Funded CentersIn 1989, Australia’s health ministers agreed to apolicy supporting certain highly specialized orhigh-cost technologies that typically only one or
two centers in the country might provide. Thispolicy, applied by AHMAC, is aimed at ensuringaccess for all Australians to approved high-cost,low-demand services and avoiding unnecessaryduplication. Support is provided on a relativelyshort-term basis; renewal of funding is subject to areview of the technology and of the centers that areproviding it. The expectation is that in manycases, Nationally Funded Center status will bediscontinued as technologies diffuse further.
Support for Nationally Funded Centers is pro-vided through a special fund created by a portionof each state’s Medicare grant. The policy rests onagreements reached between governments, ratherthan on legislation. Proposals for funding aremade by individual states, with submissions pre-pared by the hospitals that intend to establish ordevelop the technology. Most of the funding hasso far been applied to transplantation services.
Proposals for support under this policy are re-ferred by AHMAC to AHTAC for evaluationagainst two sets of criteria. The first set is de-signed to establish the suitability of the technolo-gy as judged by measures of safety, efficacy,national demand, and need to concentrate servicesfor cost-efficiency and best performance. The se-cond set of criteria relates to the suitability of theproposed site in terms of established expertise, re-search programs, and support services. Eachtechnology funded is eventually reviewed by AH-TAC to determine whether support should contin-ue or if the technology should be regarded as asuperspecialty service funded by individualstates.
Application of the policy to new proposals canbe illustrated by the evaluation of technologies fortreatment of arteriovenous malformations(AVMs) and other cerebral lesions. Evaluation ofcerebrovascular embolization was carried out byNHTAP and completed by AHTAC (80). Propos-als were assessed from a center in Perth with along record of research in this technique and fromhospitals in Sydney and Melbourne. It was ac-cepted that embolization demanded high levels ofskill and integration of specialties, that technolo-gy development continued to be significant, andthat it was a useful approach to managing small

———————.—.
38 I Health Care Technology and Its Assessment in Eight Countries
numbers of patients at significant risk of majorneurological deficit or death. In view of the esti-mated national caseload and the developing ex-pertise in the eastern states, the establishment oftwo national centers was recommended—in Perthand in Sydney. After AHMAC accepted this rec-ommendation, a budget was developed on the ba-sis of assessment data. Both centers will collectclinical and cost data for subsequent review by of-ficials and evaluation by AHTAC.
Initial interest in establishing stereotactic ra-diosurgery, also used in the treatment of AVMSand certain types of cerebral tumor, related tointroduction of the gamma knife, a focused arrayof gamma radiation from cobalt 60 sources. How-ever, it became apparent that there had been signif-icant developments in the alternative approach ofthe focused linear accelerator (linac). The technol-ogy was assessed by AHTAC in 1992 in responseto applications for funding from centers in Perthand Sydney. AHTAC took the view that the fo-cused linac option was more realistic and that be-cause of the probable diffusion of this approachand the comparatively limited additional exper-tise required (compared with that found in majorradiotherapy units), the technology would not beappropriate for Nationally Funded Center status(8). This position was accepted by AHMAC.Funding of radiosurgery units is therefore a matterfor individual state governments.
The ongoing review process for NationallyFunded Centers can be illustrated by assessmentsof programs for liver transplantation services thatwere supported at three centers—in Sydney, Bris-bane, and Melbourne. AHTAC considered livertransplantation in terms of criteria specified underthe policy: whether the technology was continu-ing to evolve, whether further diffusion wouldlead to additional costs and inefficiencies, andwhether the move to superspecialty status wouldadversely affect access to such services. In an ini-tial review the Committee considered that techni-cal development was still significant, furtherdiffusion was not appropriate (particularly tosmaller centers of population), and the situationshould be reviewed again in two years (7). The fol-low-up review concluded that technical develop-
ment had plateaued, further proliferation would beunlikely to generate significant inefficiencies, anda move to superspecialty status would not ad-versely affect access. The recommendation wasfor discontinuation of Nationally Funded Centerstatus for the centers (10); it was accepted by AH-MAC.
Highly Specialized DrugsFollowing the states’ concerns over rapid growthin the use of expensive specialized drugs providedthrough the public hospital system, discussions byAHMC and AHMAC led to an agreement onfunding for such services and the establishment ofa Highly Specialized Drugs Working Party(HSDWP). This entity selects drugs for inclusionin funding arrangements, monitors new highlyspecialized drugs that are potential candidates forinclusion, and monitors the way in which drugssupplied under the program are used. Decisions onlisting drugs are made by the PharmaceuticalBenefits Advisory Committee. The criteria forselection of a drug for funding specify that ongo-ing medical supervision is required; the drug is fortreatment of chronic medical conditions, not acuteinpatient episodes; the drug is highly specialized,is subject to marketing approval by the common-wealth, and has a high unit cost; and there is anidentifiable patient target group.
In addition to erythropoietin (discussed later inthe case study on end-stage renal disease), the pro-gram was also initially applied to the supply of cy -closporine to patients through public hospitals,with grants of $25.1 million being made to statesand territories in 1991/92. Subsequently, theHSDWP has focused especially on drugs for man-agement of AIDS. Forward estimates for com-monwealth funding of zidovudine (AZT) in1992/93 were $12.9 million. Recommendationshave been made on listings and prices for didano-sine, desferoxamine, and ganciclovir. In each casesupply of the drugs is handled by the public hospi-tals. States provide funding for an initial period,after which the commonwealth meets all subse-quent costs subject to receipt of usage data basedon individual patient records.
Chapter 2 Health Care Technology in Australia 139
TREATMENTS FOR CORONARY ARTERYDISEASE
Coronary Artery Bypass Grafting(CABG)
CABG commenced in Australia in 1970, andusage rates have increased steadily ever since. Thestatus of CABG was considered briefly in guide-lines prepared by the Superspecialty ServicesSubcommittee (100). At that stage, CABG proce-dures accounted for about 75 percent of all cardiacsurgery caseloads in some states, after a period ofrapid growth in use of the technique. The Subcom-mittee predicted that CABG caseloads would sta-bilize at about 500 procedures per million people.Recommendations did not address CABG per sebut included minimum caseload levels for a car-diac surgery service of 200 adult patients per yearwithin two years of inception, with a longer termgoal of at least 1,000 patients per year. The Sub-committee’s guidelines helped the New SouthWales Health Department make a decision to limitthe number of centers for such surgery; the guide-lines were less influential in other states.
In 1991 there were 12,694 operations for coro-nary artery disease (CAD), all but 45 involvingbypass grafting—an increase of 11 percent over1990 (85). This amounts to 669 operations permillion, which is substantially above the originalSubcommittee estimate even after the diffusion ofcoronary angioplasty. Of these operations, 11,586were without concomitant procedures. Mortalitynationally was 2 percent (6 percent for the 7 per-cent of all bypass procedures that were reopera-tions). The number of grafts per patient in 1990stabilized over the previous six years at just overthree.
There was no national evaluation of CABG, al-though the National Heart Foundation has moni-tored the use and diffusion of the technology for
many years. Published accounts of Australianwork appear to be limited to descriptions of expe-rience and outcomes for small series of patients.Diffusion of the technology has been determinedlargely by decisions of individual hospitals andstate health authorities and by the availability ofreimbursement through Medicare benefits. Theinitial growth of bypass surgery was particularlyrapid in South Australia and Western Australia;there is now a more even coverage. Rates of sur-gery continue to increase in all states; in 1991 theyranged from 834 per million in New South Walesto 548 per million in Queensland.
Percutaneous Transluminal CoronaryAngioplasty (PTCA)
PTCA was introduced in Australia in 1980. In1991, 5,726 procedures were undertaken at 20units (18 percent were repeat procedures), a 17percent increase over 1990. The number of proce-dures per unit averaged 286 (ranging from 11 to656), performed by 81 physicians (84). The over-whelming majority of procedures were for singlevessel disease; procedures for double-vessel dis-ease decreased from 10.2 to 8.1 percent between1989 and 1991. Procedures on more than two ves-sels are still uncommon.
The primary success rate in 1990 was 91 per-cent, an increase of about 3 percent over fiveyears. In 91 percent of all cases, indications forPTCA were stable or unstable angina, with acutemyocardial infarction (AM I) accounting for 4 per-cent and prognostic reasons for 2 percent; 9 per-cent of procedures were performed on patientswith CABG grafts. In 1991, 127 patients (2.2 per-cent) required CABG after PTCA during the samehospital admission, about three-quarters within24 hours as emergency operations for complica-tions. Over a 10-year period the rate of CABG

40 I Health Care Technology and Its Assessment in Eight Countries
post-PTCA has fallen from initial values of 11 to12 percent. The overall rate for AMI followingPTCA is 2 percent over a 10-year period, with noclear trends over the last seven. The mortality ratefor PTCA was about 0.4 percent between 1980and 1991.
Coronary angioplasty was assessed by NHTAP,drawing on a review commissioned by AIH(79,93). The Panel’s assessment looked in somedetail at the indications for PTCA, efficacy, com-plications, and cost in comparison with bypasssurgery and medical therapy; distribution of ser-vices in Australia; and institutional requirements.The Panel commented that each form of therapy(CABG, PTCA, and medical) had its own range ofindications but that these overlapped substantial-ly. It recommended the development of guidelinesfor PTCA, noting that these would need to be re-viewed as results emerged from trials comparingCABG and PTCA for treating multi vessel dis-ease.
NHTAP also noted that there was a potential forsubstantially increased use of PTCA in Australia,with replacement of some CABG procedures, in-creased use after AMI, and use for patients consid-ered too frail for CABG or whose condition wasnot considered serious enough for surgery. Thedanger of overuse was also flagged-for example,for patients whose angina was satisfactorily con-trolled by medication, asymptomatic patients, andthose for whom the cause of symptoms was uncer-tain. The Panel also saw a possibility of underuse,particularly in the public sector, as the result offunding constraints on public hospitals. Thiscould lead to loss of productivity y, unnecessary useof CABG, and inadequate medical treatment withcosts that could have been avoided if PTCA weremore readily available. A possible reason for themodest growth of PTCA use in Australia (whichhas eased since preparation of the NHTAP report)is the limited capacity of cardiac catheterizationlaboratories.
There was no formal training program forPTCA in Australia, although all practitioners hadin fact been trained under supervision (largely inthe United States). Because peer review processesin Australia are strong, hospitals would be unlike-
ly to award angioplasty privileges unless the prac-titioner had adequate experience. The Panel foundno apparent immediate need for the introductionof credentialing for Australian users of PTCA.
Costs of PTCA and CABGNHTAP estimated a cost for a single PTCA proce-dure of approximately $7,100, including an an-giogram and other tests. Average cost per patientto the health care system, which also includedCABG for a proportion of cases including laterelective procedures, was $9,400. In comparison,the estimated cost of CABG was $10,500, risingto$11 ,700 in average cost per patient if complica-tions were taken into account. No allowance wasmade for repeat CABG or PTCA, which would berequired by many patients within 10 years of thefirst CABG procedure. In comparison, the costs ofmedical treatment of angina would vary widely,perhaps between $1,500 and $10,600 over a10-year period.
The Panel recommended further analysis of thecosts and benefits of PTCA by AIH in consulta-tion with professional and government bodies. Italso urged that appropriate professional bodies (inconsultation with health authorities) consider thedesirability of an accreditation system for institu-tions providing PTCA services.
Recent DevelopmentsPTCA services have continued to grow, but al-though the Cardiac Society of Australia and NewZealand has developed guidelines, accreditationprovisions have not yet been applied further toinstitutions and specialists. Because of fundingconstraints and other priorities for assessment, theproposed analysis of costs and benefits has yet tobe undertaken. The question of more comprehen-sive guidelines for cardiac interventions is nowbeing addressed by AHTAC, in part as a follow-upto the original cardiac surgery guidelines pro-duced by the Subcommittee. The NHMRC’sQuality of Health Care Committee is addressingthe question of practice standards in this area.
It might have been expected that as PTCA be-came more accepted, possible CABG cases that

would have required only one or two grafts wouldbe increasingly referred to angioplasty and thatsimple bypass procedures would make up a small-er proportion of the total (79). In fact, the propor-tion of CABG procedures requiring one or twodistal anastomoses has fallen only slightly sincePTCA was introduced, suggesting that PTCAmight not be substituting for CABG to any majorextent in Australia. International developments inthis area have been followed with interest in Aus-tralia, but the use of CABG and PTCA has beendetermined largely by funding and organizationalpriorities and, to some extent, by assessment inputfrom NHTAP and AIH.
Statistics collected by the National HeartFoundation show that the application of newertechnology as an extension of PTCA and CABGhas so far been quite modest. Thrombolytic thera-py was used prior to angioplasty in 7.4 percent ofall cases in 1991. Until recently, atherectomy wasperformed by only a few centers, and its level ofuse is low (42 cases in 1991). It seems to be re-garded as an extension of PTCA, especially forapplication to extensively calcified or occludedlesions.
Use of coronary stents is increasing slowly(used in 50 PTCA procedures in 1990 and 78 in1991 ), leading to increased costs (14). There arealso issues related to patient selection criteria, ap-propriate training, and the need for appraisal ofnew stent designs and their use in Australia. TheInstitute saw coronary stents as a developing, ad-ditive technology that would find a useful but lim-ited niche in algorithms for management of CAD.
The application of lasers for coronary arterydisease has not yet occurred in Australia exceptfor a brief trial in Perth. A review of lasers in an-gioplasty concluded that there was no evidencethat laser treatment could replace balloon angio-plasty, although lasers might play a limited role inthe recanalization of complete or nearly completeobstructions (25). At that stage none of the lasersbeing evaluated overseas looked so promising asto make the case for evaluation in Australia partic-ularly attractive. A more recent Australian reviewhas concluded that laser coronary angioplasty isstill a developing technology and that cost-effec-
Chapter 2 Health Care Technology in Australia 141
tiveness has not yet been established (28). On thebasis of expected potential caseload, use of an ex-cimer laser would cost $50,000 to $60,000 peryear per hospital, with no clear indication at thisstage of benefits or of complication rates (15)
Proven methods for treatment of CAD are wellestablished in Australia, and access to them is gen-erally good. Waiting list data are at present notgenerally available, but there are some indicationsfor Western Australia. According to recent in-formation for elective procedures in that state, me-dian waiting times are about one week for PTCAand about one month for cardiothoracic surgery.The numbers of cases on the cardiology and car-diothoracic lists were halved between June 1992and June 1993 (55).
Areas for consideration are achieving suitablebalance between the different methods and resolv-ing any problems of coverage in the public sector.A specific concern is the continuing growth ofboth CABG and PTCA despite earlier expecta-tions that angioplasty might replace the surgicalprocedure to a large extent.
A further issue, identified in the NHTAP as-sessment, is the pressure placed on public hospitalbudgets by demand for PTCA services. Manypublic hospitals have imposed severe rationing onthe number of PTCA procedures that they per-form. Their costs are significant, and the benefitshave accrued to the patient and the commonwealthrather than the state and the hospital (because ofdecreased commonwealth-funded medication andquicker return to normal activity). The situationhas changed somewhat since a Medicare schedulebenefits item for PTCA became available. Thisproblem illustrates the type of funding debate thatcan occur between commonwealth and state gov-ernments.
The influence of technology assessment on thisarea has been relatively modest. The early Sub-committee report was helpful to some state gov-ernments, but although later assessments havebeen considered by policy makers and profession-al bodies, there is no evidence that they have ex-erted any major influence. Other factors haveproved more significant.

—
42 I Health Care Technology and Its Assessment in Eight Countries
MEDICAL IMAGING (CT AND MRI)
I Computed Tomography (CT)
CT scanning was introduced into Australia in themid- 1970s with the acquisition of head scannersby private radiology practices. There appears tohave been no systematic early evaluation of CTscanning. Opit and Dunt (89) analyzed the level ofneed for CT head scanning in a defined populationand were among the first to express reservationsabout the number of machines that would realisti-cally be needed for this new technique.
The private sector dominated the early stages ofCT diffusion; the only governmental control wasimposed by certain state authorities in terms ofvarious units installed in public hospitals undertheir jurisdiction. Reimbursement for CT ex-aminations rapidly became available throughMedicare.
In early 1984 the Royal Australasian College ofRadiologists (RACR) issued a statement on CTscanning that outlined suggested uses for thetechnology and gave details and suggestions forits distribution. An overview of health caretechnology assessment at that time noted that al-though the statement contained useful data, fur-ther appraisal involving other organizations in thehealth care system was now needed (44).
A synthesis report by NHTAP considered pat-terns of use of CT in Australia and its clinical role,costs, safety aspects, and clinical value (77). Bymid- 1987 there were at least 170 CT units in Aus-tralia, 118 in the private sector and 52 in the publicsector; at that stage, installation of public hospitalunits had become more widespread. It appearedthat on a per capita basis, Australia offered higherlevels of CT services (10.8 scanners per millionresidents) than any European country, but lowerthan the United States and Japan.
Although CT services were widely dissemi-nated in Australia, there appeared to be room forimproving the pattern of distribution, includingkeeping public hospital facilities under reviewand perhaps widening coverage to include smallerpopulation centers. However, even taking into ac-count the earlier methods that CT had replaced
and widening indications for its use, it was notpossible to account for the very large increase innumbers of examinations in recent years.
The Panel also drew attention to studies in oth-er countries that suggested that use of CT scannerswas unrewarding for patients with headaches andnormal neurological findings, and to a WesternAustralian study that evaluated the use of CT inprivate neurological practice (52). Sixty patientshad a CT scan before consultation, and 95 percentof those were normal. Of the 83 patients referredfor CT after neurological consultation, 91 percenthad normal CT findings. The Panel questioned thepossible overuse of CT in this area.
Concern about certain applications of CT con-tinues. In a series of 100 CT exams on 87 consecu-tive patients with low back pain or sciaticareferred for specialist orthopedic opinion, 36 ex-ams could be justified (of which 16 influencedmanagement of the condition); 47 unnecessaryexams were abnormal, but the abnormal findingswere irrelevant. Some 75 percent of unnecessaryscans would have been eliminated if somatic painhad been recognized and if the fact that CT doesnot contribute to an evaluation of such cases hadbeen appreciated (94).
While accepting the technique’s diagnostic ex-cellence NHTAP noted that little quantitative in-formation was available on how CT was beingused in Australia or its effect on patient manage-ment, particularly outside major public hospitals.It recommended that a study be undertaken to de-termine the contribution of CT to patient care andthe cost savings achieved through its use. It alsorecommended that professional bodies considerthe development of guidelines for medical practi-tioners on the use of CT, including advice on ap-propriate indications for procedures, examinationrisks, costs, and expected benefits.
The first recommendation was considered indetail and a proposal for a study discussed by AH-MAC. However, support for such an assessmentwas not approved largely because of disagreementbetween governments as to responsibilities forfunding. The second recommendation (on guide-lines) was taken up by NHMRC’s Health CareCommittee. Guidelines were subsequently pub-
Chapter 2 Health Care Technology in Australia 143
lished (71) that drew on broader imaging guide-lines developed by the Victorian Post-GraduateFoundation and the RACR (63) as well as on inputfrom individual radiologists. The impact of theseguidelines will probably not be apparent for sometime and will depend on the degree of reinforce-ment by professional bodies.
The NHTAP report has been used as a sourcedocument by health authorities and has providedinput for discussions on levels of reimbursementunder Medicare. Medicare fees for CT have de-creased in recent years, and the CT examinationseligible for payment under Medicare are specifiedin considerable detail in the benefits schedule. Atthe state level, replacement of older generationscanners has occurred in a number of publichospitals.
By November 1992 the total number of Austra-lian CT scanners had reached 292, or 17 per mil-lion people (16), and in early 1994 it wasapproaching 350 (19). It appears probable that thisincrease will continue, given the comparativelylower numbers in Victoria following the earlierCON strategy in that state. On a per capita basis,numbers of services have increased by 115 percentover the last five years, and Medicare Benefitspayments by 54 percent. There are still no quanti-tative data on how most CT services are beingused and to what effect. The continuing prolifera-tion of CT services maybe due to a combination offactors, including the availability of reimburse-ment under Medicare, support through the publichospital system, competition among hospitals andpractices, and pressure from requests by referringphysicians.
Magnetic Resonance Imaging (MRI)The introduction and diffusion of MRI in Austra-lia has followed a different pattern than that of CTbecause of technology assessment, related policydecisions, and investment judgments by privateradiology practices in the early 1980s.
Australia’s program for introducing and eva-luating MRI (45) had its origins in a synthesis re-port by NHTAP (73). MRI was regarded as anexpensive, rapidly evolving, and promising diag-nostic imaging method that should be assessed be-
fore any widespread diffusion within Australiawas contemplated. The report recommendationswere accepted by the commonwealth govern-ment, which acted with the states to implement anassessment of MRI. This support for the rationalintroduction of MRI was prompted to some extentby concerns at the level of use of CT scanning. Is-sues for the governments included the likely costof the new technology, its realistic range of ap-plication, likely benefits when compared with ex-isting methods, technical performance, and areasof weakness.
At the start of the Australian evaluation, littlewas known about the performance and clinical useof MRI. Information from other countries was oflimited use in the Australian context. Many earlystudies were poorly done and, in any case, applica-ble to different health care systems. The Austra-lian governments sought a broad assessment ofthe overall place of the new technology, meaningthat a wide range of possible examinations anddisease states had to be considered.
The study was carried out at radiology depart-ments in five public hospitals with general direc-tion by a technical committee of NHTAP andcollation and monitoring of data by the Panel’sSecretariat. Each MRI unit collected cost data ac-cording to a defined protocol; a minimum data set,completed for every patient, which provided in-formation on demographics, history, MRI find-ings, and radiologists’ assessment of the benefit ofMRI at the time of examination; and 71 more de-tailed follow-up studies on selected groups of pa-tients to assess the usefulness of MRI in thediagnosis and management of specific conditions.No government funding for MRI was availableoutside the program.
One specific study reported on 2,810 consecu-tive examinations at the Royal North Shore Hos-pital in Sydney, which provided follow-up data on2,100 cases (99). The accuracy of MRI in a num-ber of conditions was considered in detail, andclinical impact was assessed on the basis referringclinicians’ opinions. The impact of the techniquewas apparent in 104 cases where surgery wasavoided; in 55 where invasive procedures wereavoided: in 151 where MRI led to surgery or im-

— — -.
44 I Health Care Technology and Its Assessment in Eight Countries
proved surgical planning; and in 175 where a cor-rect diagnosis was established after incorrectresults from CT or other tests.
Another study considered the follow-up of1,119 cionsecutive patients examined at the SirCharles Gairdner Hospital in Perth who had beenreferred by specialists for imaging of brain orspine (47). MRI made a dominant contribution tothe final diagnosis with neoplasia and vasculardisorders but was less significant for white matterdisease, including multiple sclerosis. In a highproportion of cases, other types of examinationalso influenced final diagnosis. MRI affected pa-tient management in a high proportion of spinalexaminations and in cases of cerebral neoplasm,with a lesser contribution to cases of cerebral vas-cular disorder and white matter disease. AlthoughMRI was seen to be generally superior to otherimaging methods, in practice it was often only oneinput to diagnostic and management decisions.For some cases, such as pituitary neoplasm andsuspected acoustic neuroma, MRI replaced oldertests and was not additive.
Following recommendations of NHTAP at theend of the assessment (82), the governmentsagreed on a policy to develop a network of teach-ing-hospital MRI units, with 18 to be placed incenters with major neurosurgical responsibilities.Government funding continues to be channeledonly to such units, and reimbursement is not avail-able for further services provided by private radi-ology practices except for limited numbers of“overflow” cases from public hospitals to desig-nated private units. Decisions on levels of fundingfor the public MRI units have drawn on the costdata obtained in the assessment. The limited num-bers of government-funded examinations at pri-vate units have had to comply with the MRIguidelines of a consensus statement developedduring the assessment (6).
Despite this policy on limited governmentfunding of services, the number of private radiolo-gy MRI scanners has increased substantially sincethe assessment (46). For most private units the ca-seload has been limited and dominated by work-ers’ compensation cases. By early 1992 there wereseven public and 16 private units in Australia, or
1.3 per million people—a somewhat lower pro-portion than in several European countries butnow increasing to a projected 41 units by the endof 1994 (or 2.3 per million). There is concern thatthe proliferation of I may eventually lead toprovision of services that are not cost effective andthat much of the spread of the technology willhave occurred outside the immediate influence ofhealth authorities.
Influence of Technology AssessmentThe introduction and use of MRI were strongly in-fluenced by the assessments undertaken byNHTAP (similarly, assessments have influencedthe more recent introduction of positron emissiontomography (PET) (74,83). In contrast, assess-ment effect on the use of CT have been 1 imited todate, and it is too early to say whether theNHMRC guidelines developed following thePanel’s report will have a major influence.
LAPAROSCOPIC SURGERYThe most common of the well-established laparo-scopic procedures (based on Medicare data) in-clude laparoscopy for treatment of ovarian cysts,endometriosis and adhesions, and arthroscopicoperations on the knee. These widely establishedtechniques were introduced in the 1970s. Arthro-scopic surgery to the elbow, wrist, shoulder, andankle was added to the Medical Benefits Schedulein 1990 and 1991. The numbers of these newerarthroscopic procedures are still quite small. Ther-apeutic thoracoscopy, esophagoscopy, and utero-scopy have also been established for many years,but their numbers also are small (less than 1,200per year for each) but increasing. Most of these la-paroscopic procedures have replaced older moreinvasive procedures, although the number of addi-tional knee arthroscopes has risen substantially(60).
Use of diagnostic hysteroscopy has increasedconsiderably in recent years (from 1,000 pay-ments under Medicare benefits in 1985/86 to al-most 28,000 in 1991/92). Over the same period,payments for dilatation and curettage (D&C) havedeclined. Some replacement of the older tech-

Chapter 2 Health Care Technology in Australia 145
nique may have occurred, although the RoyalAustralian College of Obstetricians and Gy-necologists (RACOG) advises that diagnostichysteroscopy is usually an adjunct to, rather than areplacement for, D&C. It is also regarded by theCollege as complementary to the radiologicaltechnique of hysterosalpingography rather than asan alternative. Since 1989/90 there has been in-creasing use of outpatient endometrial sampling,which is being seen by RACOG as less invasiveand cheaper than hysteroscopy and probably as ef-fective. The trend toward office-based proce-dures, with further reduction in hospitaladmissions for D&C, seems likely to continue.
Laparoscopic CholecystectomyThe more recent introduction of minimal-accesssurgical procedures has been dominated by devel-opments and debate on laparoscopic cholecystec-tomy. The technique was assessed by AIH in 1990following its introduction into Australia that year(58). Its early use was undertaken within majorteaching hospitals. Diffusion within Australia hasbeen rapid because of the acceptable up-frontcosts to hospitals, early eligibility for governmentreimbursement under Medicare, and publicawareness and demand for a less invasive proce-dure. At present the benefits schedule fee for lapa-roscopic cholecystectomy is higher than that forthe open procedure.
The early experience of teaching hospital unitsis illustrated by the results obtained as part of theAustralian biliary lithotripsy evaluation (95).When compared with open cholecystectomy, a se-ries of laparoscopic cases at the hospital showeddecreased length of hospital stay and down timefor the patient before returning to normal activi-ties, and substantially decreased requirements foranalgesia following the operation. Estimatedcosts of the laparoscopic procedure were lowerthan for open surgery, largely reflecting the de-creased hospital stay. Such estimates of savings,however, do not necessarily take into account thefull costs to a hospital of introducing such a proce-dure and the associated infrastructural changes.
A cost-utility analysis showed that the outcomeof laparoscopic cholecystectomy was superior toboth the open procedure and lithotripsy, unlesssubsequent evidence indicated a very high inci-dence of common bile duct damage (24). Thisstudy included an assessment of costs to patientsassociated with both forms of cholecystectomyand lithotripsy. The costs to patients per case wereestimated at between $1,800 and $2,500 less forlaparoscopic cholecystectomy than for open cho-lecystectomy (101). A further study has con-firmed shorter hospital stays, lower costs, andfaster recovery for laparoscopic cholecystectomyas compared to open surgery (53).
Diffusion of laparoscopic cholecystectomy hascontinued rapidly. In early 1993 the Royal Austra-lasian College of Surgeons (RACS) advised thatthe technique was in place in all teaching hospitalsand inmost smaller surgical centers. The spread ofthe technique has been associated with an increasein total numbers of cholecystectomies.
An early estimate was that there had been a 26percent increase in the rates of cholecystectomy inthe first two years after introduction of the laparo-scopic method, following a period of several yearswhere rates for gallbladder removal were almostconstant (68). Conversion rates for laparoscopicto open surgery were high during the first twoyears of use: Health Insurance Commission dataindicated a level of over 14 percent. At that stageonly an estimated 13 percent of potential savingsto health program costs through use of the newmethod were being realized. Decreased costs percase for laparoscopic surgery appeared to be large-ly offset by the increased numbers of procedures.
The increase in the rate of cholecystectomieshas subsequently slowed, although the number ofprocedures per year remains considerably higherthan the levels prior to introduction of the laparo-scopic method (49). The conversion rate has fallenwith increasing experience with the procedure, to8.4percent in 1992/93. Possible reasons for the in-crease in surgery rates include extension of ser-vices to frailer patients, a wish to resolvesymptomatic cases rather than watchful waiting,

46 I Health Care Technology and Its Assessment in Eight Countries
application to asymptomatic cases, and applica-tions to misdiagnosed cases (68).
Concerns remain regarding standards of perfor-mance of laparoscopic cholecystectomy in small-er centers, and in response, the RACS hasdeveloped accreditation and training procedures.There have been anecdotal accounts of seriouscomplications following performance of laparo-scopic procedures at smaller centers. Routine in-traoperative cholangiography has declined by 66percent since the introduction of laparoscopiccholecystectomy. It has been suggested that rou-tine laparoscopic exploration of the bile ductshould be adopted as a standard practice to permittreatment of common duct calculi at the time of la-paroscopic surgery (37).
Other Laparoscopic ProceduresData on the other recently developed laparoscopicprocedures are more limited. Laparoscopic appen-dectomy was first performed in Australia in theearly 1980s (36). Since then its use has been re-stricted primarily to gynecologists treating chron-ic recurring lower abdominal pain in women.Although laparoscopic appendectomy is increas-ing in Australia, its uptake is likely to be slowerthan for laparoscopic cholecystectomy becausetraining in the technique has not been widespreadand because of the undesirability y of applying lapa-roscopic procedure in an emergency situation(60). There is also some feeling that the laparo-scopic procedure may offer 1imited advantages forhospitals and surgical staff and that there would belittle improvement in recovery time for patients ascompared with the open procedure.
The major impact of laparoscopic surgery onhysterectomy is expected to be through use of la-paroscopically assisted vaginal hysterectomy(LAH) rather than the full laparoscopic procedure(59,67). Neither LAH nor laparoscopic myomec-tomy are yet in general use in Australia. The RA-COG is developing training and accreditationprotocols for LAH.
LAH offers uncertain advantages to serviceproviders over abdominal or vaginal hysterecto-my as cost estimates are sensitive to lengths of
stay, substitution rates, and instrument costs (59).However, if half of the abdominal hysterectomiesperformed for myomas were replaced by LAH,annual savings to the health care system could beon the order of $2 million. Future attention mayfocus on options for reducing the costs of dispos-able instruments (currently about $1,200 percase).
In terms of societal costs, LAH offers potentialmajor benefits through considerable reduction inpost-operative recovery (by four weeks) and prob-ably in the cost of complications. Such factors arelikely to increase the pressure for diffusion ofLAH. A counterforce will be the availability ofcompeting, minimally invasive approaches, in-cluding endometrial ablation or resection usingdiathermy. Endometrial ablation/resection is wellestablished, with over 4,000 procedures fundedthrough Medicare benefits in 1991/92 (59). Dur-ing this period the rate of hysterectomy for me-norrhagia in public hospitals declined byone-third.
Laparoscopic hernia repair was introduced intoAustralia in 1990 (21). This procedure’s impact isexpected to increase, although some centers donot regard the immediate advantages of the lapa-roscopic approach over a short-stay open repair tobe clearcut, particularly in view of the experimen-tal nature of the technology. If laparoscopic ap-proaches for hernia repair ultimately result infaster recovery, decreased pain, and overall re-duced costs, they are likely to be popular with bothpatients and organizations responsible for com-pensation payments, despite uncertainties aboutlong-term recurrence (60).
Laparoscopic vagotomy has been performed inAustralia (88), although its level of use is current-ly low; most patients are now treated with drugs.There still appears to be some uncertainty as to theappropriate technique for this procedure. Laparos -copically assisted bowel resection was introducedin 1991 at the Sydney Hospital, with the mobi-lized bowel taken out of the body via a laparotomyexcision to perform the resection and form theanastomosis (102). At least some centers in Aus-

Chapter 2 Health Care Technology in Australia 147
tralia appear to be moving toward the use of thefull laparoscopic approach for this application.
Unanswered questions surrounding newer la-paroscopic procedures relate particularly to assur-ance of appropriate training, availability ofadequate caseload, mechanisms for appropriatefollow-up of patients after laparoscopic surgery,and costs to hospitals through changes to infra-structure (48). Up-front costs of disposable instru-ments, which are preferred on technical grounds,are a chronic problem for hospital administrators.In a number of cases public hospitals have beenusing reusable equipment, accepting the less ob-vious cost of cleaning and sterilization plus theconsequences for patients if these procedures arenot performed adequately.
The Impact of Technology AssessmentThe impact of technology assessment on the
use of laparoscopic procedures is uncertain. Sev-eral assessments have provided information tohealth authorities and professional bodies, butthere has been no discernible influence in the shortterm on the use and organization of services. Forexample, the trends in use of laparoscopic chole-cystectomy and diagnostic hysteroscopy havelargely occurred as a result of influences otherthan formal evaluation. Possibly assessment maybe more significant in the longer term as data fromthe initial phase of some techniques are moreclosely considered and guidelines are established.AHTAC is developing a report on minimal-accesssurgery that may provide further focus and helpset directions for the future.
TREATMENTS FOR END-STAGERENAL DISEASE (ESRD)Rates of ESRD treatment continue to rise in Aus-tralia. The Australia and New Zealand Dialysisand Transplant Registry has accumulated recordson over 10,000 patients who have begun treatmentfor ESRD in Australia (30). In 1989 the treatmentrate was 34.4 per 100,000 population.
These rates are rising largely because of an in-crease in the number of people over 60 years be-ginning dialysis. Diabetic nephropathy appears to
be involved in an increasing proportion of cases ofrenal failure treated by dialysis and transplanta-tion. Compared with many other nations, Austra-lia has a high level of a nephropathy caused byanalgesic medicines, although new cases are de-clining (9). Recent data indicate that Aboriginesmay have a more extensive requirement for renaldialysis. The rate at which Aborigines began treat-ment was over three times that for all Australians,and there still may be much untreated disease.
Guidelines for renal dialysis and transplanta-tion have been prepared by AHTAC (9). There ap-pears to be little scope for identifying preventivestrategies to lower the incidence of renal failure.Although renal transplantation is recognized asthe preferred method of managing ESRD, dialysisremains the dominant treatment method. Thetransplantation rate has remained at about thesame level for the last decade; in 1990 only 12 per-cent of dialysis patients received a transplant.
During the 1980s the number of home dialysispatients grew slowly, and the proportion relativeto population has been declining. In 1989 therewere 798 home continuous ambulatory peritonealdialysis (CAPD) patients (4.6 per 100,000), 582(3.5 per 100,000) home hemodialysis patients and18 (O. 1 per 100,000) home intraperitoneal dialysis(IPD) patients. Overall there were 16.3 dialysispatients per 100,000 population.
The overall median survival rate for patientswith ESRD after five years of treatment is 61 per-cent; outcomes become poorer with increasingage. Variations in survival among different centersis substantial. For primary cadaver grafts after 12months, there is a 22 percent variation in terms ofpatient survival and a 36 percent difference ingraft survival between the best and the worst cen-ters, AHTAC has recommended that every effortbe made to elevate those units with poor results toan acceptable standard.
With regard to current service provision and ex-pertise and the efficient use of staff and facilities.AHTAC considered a minimum of 30 transplantoperations per year at each center to be desirableand recommended that centers that are not per-forming 20 operations per year should either ceasetransplantation altogether or increase their com-

48 I Health Care Technology and Its Assessment in Eight Countries
mitment. All dialysis units should be linked orga-nizationally to a renal transplantation program(9).
Transplantation is the preferred treatment oncost grounds, with hospital hemodialysis the mostexpensive of the alternative approaches. Opportu-nities for home dialysis appear to be lacking. AH-TAC recommended that new facility developmentbe promoted in the following order of priority:transplantation facilities, home dialysis (includ-ing CAPD), satellite dialysis, and hospital dialy-sis. In addition, efforts should be made tominimize maintenance dialysis in hospitals. Re-nal treatment programs should review their poli-cies on dialysis location for patients with a view torelocating suitable patients to satellite and homedialysis.
Major themes of the AHTAC guidelines docu-ment were the need to increase the rate of organdonations for transplants and to decrease the pro-portion of dialysis patients treated in hospitals.Changing community and professional attitudestoward organ donation have the greatest potentialto alter ESRD’S impacts and to affect cost alloca-tion. According to the Australian CoordinationCommittee on Organ Registries and Donation(ACCORD), the current donation rate is 13.5 or-gans per million per year. If all suitable potentialdonors were to become actual donors, this ratecould be nearly doubled.
Insufficient kidney donation is a major prob-lem in overcoming the backlog of patients await-ing transplantation (40 to 45 percent of dialysispatients). ACCORD is addressing organ acquisi-tion difficulties and promoting improvements toinfrastructure and financial support.
Living related donor transplantation accountsfor 10 to 12 percent of renal transplants in Austra-lia and New Zealand. Increased use of this ap-proach would be desirable because of theexcellent results compared with cadaver trans-plants and the shortage of cadaver organs. In a se-ries from a Melbourne hospital, the living relateddonor approach was associated with shorter wait-ing times for transplantation (38). Pancreastransplantation in association with renal trans-plantation is being undertaken on small numbers
of type 1 diabetic patients with renal failure. Theservice is offered at a hospital in Sydney underthe Nationally Funded Centers policy, after itsconsideration by the Health Care Committee ofNHMRC and AHTAC.
Erythropoietin (EPO)Recombinant EPO for management of anemia dueto renal failure has been used in Australia since1990, initially on a restricted basis because of itscost. It was suggested that treatment might need tobe limited to patients in whom anemia causes seri-ous disability unrelieved by other measures (35).
Various centers have adopted measures to re-duce the EPO dose to the lowest level suitable formaintaining benefits in each patient. Experienceat the Queen Elizabeth Hospital, Adelaide, hassuggested that the cost per patient per year mightfall to $6,()()(). At the Royal Adelaide Hospital, theannual cost for EPO given subcutaneously maybeas low as $2,000 to $3,000 per patient (9). A studyat Westmead Hospital, Sydney, reported the suc-cessful use of low-dose EPO at a yearly per-pa-tient drug cost of $3,681 (54).
The question of financial support for EPO wassubsequently considered by HSDWP. Followingits recommendations, funding was provided in the1991 commonwealth budget to support the drug’suse for treatment of anemia requiring transfusionassociated with ESRD, where treatment is initi-ated in a hospital with a renal dialysis unit. (Anyapplication outside these indications is not cov-ered by the commonwealth.)
The states are responsible for meeting the drugcosts of the in-hospital phase (taken to be threemonths from the initiation of treatment); the com-monwealth meets subsequent costs. common-wealth grants to the states and territories for EPOin 1991/92 totaled just under $7.5 million (57),and the drug is now being used by all major cen-ters. Evaluation procedures must still be devel-oped.
The Impact of Technology AssessmentThe impact of technology assessment in this areahas been limited to date. The AHTAC guidelines

Chapter 2 Health Care Technology in Australia 149
summarize current statistics, concerns, and pos-sible future directions. Their influence will de-pend on how the suggested targets are viewed bystate health authorities and professional groups.
NEONATAL INTENSIVE CARELike many other countries, Australia has acceptedthe concept of regionalization for perinatal ser-vices as a means of improving access to secondaryand tertiary levels of care. A paper on organizationof perinatal services, which drew on Canadian ex-perience, defined three levels of neonatal care:level 1 (suitable for uncomplicated situations),level 2 (generally located in larger or suburbanhospitals with obstetric services), and level 3 (so-phisticated services based in major general mater-nity or children’s hospitals) (70).
State guidelines for the numbers of beds in 1ev-el 2 units vary considerably, from 1 to 2 per 1,000live births in Queensland to 4.25 in New SouthWales. Infants admitted to a level 2 unit are gener-ally over 32 weeks in gestation and over 1,500 g inbirthweight. Most level 3 units have obstetric ser-vices and accept many high-risk pregnancies re-ferred in from the region in which they are located;they also handle the management of normal preg-nancies in their immediate area.
Guidelines for level 3 neonatal intensive carewere developed by the Superspecialty ServicesSubcommittee in 1983 and updated in 1991 (5).Apart from an increase in the recommended num-ber of ventilator beds from 0.6 to 0.7 per 1,000 livebirths, no substantial changes were made to rec-ommendations in the guidelines during that peri-od. Other major specifications are that level 3units should have 10 to 20 level 3 beds (1.1 per1,000 live births) and nurse-to-patient ratios of 1to 1 for ventilator beds and 1 to 2 for other level 3beds. The guidelines also outline the need for level3 units to provide support for parents, to have awell-defined role in staff and public education,and to monitor data and outcomes on a long-termbasis. The need for control of nosocomial infec-tion is stressed, although infection is not currentlya major cause of neonatal death.
In 1990, 20 hospitals in Australia had level 3neonatal intensive care units (NICUS) and full-
time neonatologists; these had a total of 160 venti-lator beds. A further 14 ventilator beds wereplanned for New South Wales and Victoria.
In 1983 the average cost per baby from the timeof admission to the NICU to the time of dischargehome, transfer to another hospital, or death wasestimated at $13,952 (based on a hospital inSydney): the average cost per survivor was$16,415 (61). In 1988/89 the average cost perbaby had fallen to $10,279, and the average costper survivor to $10,953 (62). The cost to the com-munity of neonatal intensive care averaged$13,857 per surviving baby, with a range of$4,064 for a birthweight of more than 2,000 g toalmost $138,000 for those less than 750 g (62).
The survival rate for very immature infants rosefrom 20 to 61 percent, associated with theintroduction of positive pressure-assisted ventila-tion. Between the 1977-83 and 1984-86 periods,survival increased by 9 percent while the cost peradditional survivor rose by 60 percent.
Both outcomes and costs for each individualbaby are variable and difficult to predict (4).Those making decisions about withholding inten-s ive care for individual babies are essential 1 y mak-ing value judgments. Cost and economic data canonly be one component of these judgments. TheSubcommittee’s guidelines point to statements onethical issues in intensive care and to other guide-lines for very -low-birthweight babies developedat consensus conferences at Westmead Hospital,Sydney.
Concern has been expressed about the in-creased need for NICU services that may resultfrom births following in-vitro fertilization (IVF)and gamete intrafallopian transfer (GIFT) tech-niques. Assisted conception by IVF and GIFT in1991 resulted in 2,009 live births up to September1992, with overall totals of 6,932 and 3,794, re-spectively, since these techniques were intro-duced (86). About 1 in 200 births in Australia nowresult from these new reproductive technologies.These births are more likely to result in low birth-weights, to be multiple, and to require neonatal in-tensive care. Over one-third of IVF/GIFT babiesare of low birthweight, and about 23 percent ofthese births are multiple. Some NICUS report that

50 I Health Care Technology and Its Assessment in Eight Countries
the IVF/GIFT cases consume up to 7 percent ofbed days.
Extracorporeal Membrane Oxygenation(ECMO)
ECMO was introduced in Australia in mid-1988at the Royal Children’s Hospital, Melbourne, andabout a year later at the Prince of Wales ChildrenHospital, Sydney (51 ). The decision to develop anECMO program was made by the hospitals, andcosts were met from their own budgets. Early re-sults for neonates and other children were excel-lent. Different approaches were adopted at the twoAustralian centers. In Melbourne ECMO was of-fered to all neonates who met specified entry crite-ria. In Sydney high-frequency ventilation wastried first and ECMO was used only when it failed.
Following the units’ initial experience, a con-sensus conference organized by the AustralianAssociation of Pediatric Teaching Centres andNHMRC was held to define the role of ECMO aswell as resource and research requirements. It wasapparent that local clinical and cost data were lim-ited and that a strong minority opinion held thatsatisfactory results were obtainable using conven-tional treatment.
The improvement in conventional treatmentover recent years suggested the need for a criticalcomparison of ECMO with alternative ap-proaches. Local evaluation was seen as necessarybecause of differences between Australia and oth-er countries both in patient population and in stan-dards of obstetric and neonatal care. For example,perhaps 40 percent of neonatal cases treated withECMO in the U.S. have a primary diagnosis ofmeconium aspiration syndrome, which is com-paratively rare in Australia. Also, the small na-tional caseload would make it difficult to designand conduct a randomized controlled trial thatcould produce definitive results.
It was recommended that a panel be set up toexplore the feasibility of a trial and that AHMACbe approached for funding and agreement to re-strict ECMO units to two centers ( 1,92). AHMACin turn referred to NHTAP the question of thecosts and financial benefits of limiting ECMO to
not more than two centers. NHMRC was to givefurther consideration to the feasibility of conduct-ing a controlled trial of the technology.
The assessment of costs and financial benefitsdrew on information from the consensus confer-ence, further opinions from the hospitals con-cerned, and relevant literature (81 ). It emergedthat the marginal costs of ECMO were relativelymodest ($5,800 to $8,400 per patient). AlthoughNHTAP found that there was little difference incost terms between the different options for num-bers of ECMO centers, there appeared to be com-pelling reasons to limit the number of centers. Thetechnology was still evolving and was in somesenses experimental, and an appropriate mini-mum caseload was seen as necessary to maintainexpertise and achieve efficiencies of scale.
Various issues needed to be considered byhealth authorities with regard to the future use ofthe technology. ECMO appeared to be a usefulmethod of last resort in treating neonates and olderchildren with severe respiratory distress; howev-er, the data on its efficacy were limited, and pe-diatric use data were not conclusive. Futureselection criteria used by ECMO centers wouldstrongly influence caseload, cost per case, and therate and quality of survival. The efficacy ofECMO in comparison with conventional therapywas deemed to need further critical review giventhe apparent shifts in practice, possible improve-ments in conventional therapy, and the perceivedlow sensitivity and specificity of selection crite-ria. NHTAP suggested that it would be wise forany future research on ECMO in Australia to in-clude appraisal of alternative therapies.
AHMAC subsequently accepted the recom-mendation that there be not more than two ECMOcenters but did not consider additional support un-der the Nationally Funded Center policy appropri-ate, in light of the limited impact of the specializedservice on hospital budgets when marginal costswere taken into account. The issue of the con-trolled trial remains unresolved. The NHMRC hasconsidered the question, but the fact is that manyclinicians and nurses using ECMO have becomeconvinced of its usefulness and will not accept al-

Chapter2 Health Care Technology in Australia 151
location of at-risk neonates to a control group. Ef-forts are being made to include one of theAustralian centers in the British randomized trialof this technology.
The Impact of Technology AssessmentThe impact of technology assessment on neonatalintensive care has been variable. The originalguidelines produced by the Superspecialty Ser-vices Subcommittee were probably influential be-cause of the consultation process that took placeduring their preparation. When they were up-dated, much of the material prepared some sixyears earlier was considered still current. Policyon support for ECMO was clearly influenced by aconsensus conference and subsequent assessmentby an advisory body, although the effect on pat-terns of practice probably was more limited.
SCREENING FOR BREAST CANCERBreast cancer is the most common cancer and themost common cause of death from cancer amongAustralian women (4). Small-scale breast cancerscreening services were established in themid- 1980s but fell well short of a national pro-gram. They were limited in coverage, not subjectto accreditation or other controls, and not de-signed to recruit and screen those women mostlikely to benefit from screening.
Use of mammography services increased in allage groups between 1984 and 1988, but womenover 65 made least use of them, although the deathrate associated with the disease was highest in thatgroup (4). Data from the 1988-90 National HealthSurvey conducted by the Australia Bureau of Sta-tistics indicated that only 22 percent of womenaged 40 to 64 had had a mammogram in the pre-vious three years, with the highest proportion (25percent) in the 45-to 49-year age group (2). Poorawareness appeared to be a contributing factor, in-fluenced by education level, family income, placeof residence, and whether women spoke Englishat home.
I Evaluation of Breast Cancer ScreeningTwo of the targets set in 1987 by an AHMAC com-mittee were to reduce the death rate from breastcancer by 25 percent or more by the year 2000 andto increase participation in breast cancer screeningto 70 percent or more of eligible women by 1995(56).
In 1988, Australian health authorities estab-lished a National Breast Cancer Screening Evalu-ation. The evaluation, coordinated by a unit atAIH, reported in mid-1990 (4). It drew on a num-ber of pilot projects based on some of the alreadyestablished screening services and included a de-tailed economic assessment. Technical aspects ofscreening mammography were considered byNHTAP as input to the national evaluation (79).The Panel supported proposals by RACR to ac-credit clinics for mammography screening andsummarized specifications for mammographyunits, film processing and quality control. Briefconsideration was also given to personnel require-ments, the need for follow-up facilities, and a na-tional database.
The NHTAP report was followed up by AIH atthe request of the AHMAC Steering Committee(11 ). The AIH report confirmed that mammogra-phy was the only proven technique suitable forbreast cancer screening, gave detailed specifica-tions for mammography units, and recommendedadoption of quality control guidelines prepared bythe Australasian College of Physical Scientistsand Engineers in Medicine. According to a surveyby the Australian Radiation Laboratory, therewere about 300 mammography units in Australiain 1989, but it was not known how many of thesewould be available for screening work.
The Steering Committee’s report supportedintroduction of a national screening program forall eligible women on both scientific and econom-ic grounds. Cost per life year gained was esti-mated to be in the range of $6.600 to $11,000 (4).It was recommended that the program selectwomen on the basis of age alone. The Committeealso urged that mammographic screening be madeavailable and publicized for women aged 40 yearsand older but that recruitment strategies should betargeted at women from 50 to 69 years old.

52 I Health Care Technology and Its Assessment in Eight Countries
Screening should be made available as widely aspossible to all eligible women in the target groupwith the intent of rescreening every two years.
Important practical and ethical issues arise inaddition to cost-effectiveness considerations. Theintroduction of a mammography screening pro-gram that excluded women from 40 to 49 years oldwould encounter a practical difficulty: women inthis age group would obtain mammography out-side the screening program. Because such mam-mography would lack many of the featuresrequired of a national program, it would be likelyto be less effective, with variable quality control,and seriously undermine the conduct of a nationalscreening program.
Economic aspects of breast cancer screeninghave subsequently been considered by Carter andco-workers (23), whose analysis suggested thatscreening all women aged 50 to 69 every two tothree years is reasonable value for money. Forwomen from 40 to 49 mortality benefits and cost-effectiveness are less clear. It was suggested thatscreening in this age group be allowed but not ac-tively pursued until further evidence is available.
This series of assessments addressed major is-sues in screening mammography, including thedegree of benefit of the technology compared withother approaches, expected gains in quality of life,and problems caused by false positive results.These matters were taken into account during thedevelopment of a national program.
Establishment of a National ProgramIn March 1990 the commonwealth announced thatit would contribute $64 million over three yearstoward the establishment of a National Programfor the Detection of Breast Cancer. The earlierAHMAC report formed the basis for thisprogram’s development. By 1993 all states andterritories had made commitments to population-based screening programs for eligible women.
The national program fully funds the provisionof screening and assessment services through toconfirmed diagnosis of breast cancer. Funding isindependent of the Medical Benefits Schedule.Services funded under the program must be ac-credited.
Proposals in the AIH report regarding machinespecifications and quality control were adopted inthe National Accreditation Guidelines issued aspart of the national program (87). The guidelinescover recruitment, services, and facilities forscreening and assessment, data collection, train-ing activities, and program management. Othertopics covered include performance objectivesand acceptable process, the timeframe for the na-tional program, technical items to be evaluated ina quality assurance program, and suggested speci-fications for mammography units.
Under the national program, each screeningunit will be linked to an assessment center. The as-sessment center will function with multidiscipli-nary teams and have primary responsibility forquality control and for management of screeningand assessment procedures, including counselingand diagnostic workups.
Coordination units in each state or territory willhave primary responsibility for liaison and negoti-ation with the commonwealth and implementa-tion of the national program. This responsibilityincludes making recommendations on the loca-tion, type, and number of screening units and as-sessment centers; recruitment; accreditation;monitoring and evaluation; financial manage-ment; and data management. The national coor-dination unit (located within DHSH) isresponsible for data collection and analysis andprogram monitoring and evaluation.
The national program has given detailed con-sideration to the role of general practitioners in theprimary health care of women who are eligible forscreening. General practitioners should be kept in-formed of the results of screening and any furtherworkups required unless a woman directs other-wise. However, a doctor’s referral is not a prereq-uisite for attendance at a screening service.
The current intention is to rescreen women ev-ery two years subject to revision as new data be-come available. Screening will be made availableat minimal or no cost and will be free to eligiblewomen who would not attend if there was acharge. Comprehensive and easily understood in-formation, emotional support, and counselingwill be provided. Women will be advised on the
Chapter 2 Health Care Technology in Australia 153
effectiveness and risks of mammography and onthe maintenance of a regime of breast care, such asbreast self-examination, to reinforce the messagethat a negative mammographic screen does notpreclude the diagnosis of breast cancer prior to thenext screening.
The program follows earlier recommendationsof the AH MAC Steering Committee in specifyingrequirements for screening services. Film-screenmammography alone is the principal screeningmethod, using two-view mammography with oneview at rescreening if previous mammogramshave indicated that two views are not required. Allmammograms will be taken by a radiographer ap-propriately trained in screening mammography,and read and reported independently by two ormore specially trained readers, at least one ofwhom is a radiologist. Reports will be combinedinto a single recommendation and results pro-vided to patients promptly and directly.
In 1990, 10 screening and assessment serviceswere offered in five states that had been pilot proj-ects in the National Screening Evaluation. Screen-ing services under the national policy are nowestablished in all states and the Australian CapitalTerritory (with the Northern Territory to follow inshortly), for a total of 21 centers in place. Areaswhere coverage is poor are being reached by mo-bile mammography units in order to increase ac-ceptance of the technology before establishingpermanent facilities. Participation rates are rising,
although they remain considerably below target.Current NHMRC policy on mammography
screening for women under 50 years of age is thatthere is insufficient evidence to advise women un-der 50 years to have routine mammography (72).Women from 40 to 49 should not be excludedfrom screening programs if they request it butshould be counseled on current evidence of bene-fits; women at higher-than-average risk shouldhave the option of attending a screening program.There is no evidence of benefits from screeningwomen under 40 years old.
Now that substantial resources have been com-mitted by governments to the national program,concerns are to ensure an appropriately high rateof recruitment, adequate minimum technical stan-dards, and effective reporting and follow-up pro-cedures. The program will be subject to ongoingevaluation coordinated by a national advisorycommittee. It is hoped that this concerted effortwill lead in the medium term to a significant im-provement in one aspect of women’s health.
Technology assessment has strongly in-fluenced the development of screening mammog-raphy services. The substantial evaluationprogram funded by AHMAC set directions for thecurrent national program, and the brief assess-ments by NHTAP and AIH assisted this process.Assessment will continue with formal reviews ofthe performance and impacts of the program.
CHAPTER SUMMARY much should be spent on high-technology medi-
Substantial changes in approaches taken to health cine as opposed to preventive and community pro-
care technologies in Australia have occurred in the grams.Overall, the Australian population’s access to apast two decades. Medical benefits remain an im-
portant factor in the funding and use of health care wide and appropriate range of health care technol -
technologies: however, other mechanisms, such ogies is good, and an effective level of support hasbeen delivered within expenditures that have re-as government grants and the Nationally Funded
Centers program, have become significant. mained at or below 8 percent of GDP for a number
Health care technology mechanisms has been put of years. Concerns typically arise regarding
in place, and quality assurance programs have whether some technologies (notably diagnostic
been developed. The availability and quality of techniques) are overused. delays in providing ser-
data have improved. Debate continues on how vices to some patients. appropriate levels of reim-

54 I Health Care Technology and Its Assessment in Eight Countries
bursement for use of technologies, and whetherboth superspecialty and more routine services areconsistently provided cost-effectively and to ap-propriate standards.
In Australia significant segments of the popula-tion will always be geographically remote fromsome technologies and services. Most specialistmedical practitioners with expertise in new healthcare technologies are based close to metropolitanareas or to university teaching hospitals, not easilyaccessible for many Australians. The inconve-nience and expense to some patients is unlikely tochange in the short term. Certain health caretechnologies will continue to be sited in large pop-ulation centers because of high costs and limiteddemand.
Although there are areas of dissatisfaction, in-cluding pressure on public hospitals and the levelof out-of-pocket expenses for some services undercurrent insurance arrangements, the level of pub-lic acceptance of the health care system seemsquite high. Notably, the Medicare insurancescheme continues to be popular. In early 1994only 38.4 percent of Australians had hospital in-surance coverage through private funds.
Australia’s relative success in controllingtechnologies—taking account of introduction,diffusion, level of use, societal costs and benefits,and equity of access—has been mixed. As de-scribed earlier, legislative provisions to controlmost types of health technology are limited. Bothhealth authorities and health professionals have tolive with the realities of operating within a systemwith a complex mix of government responsibili-ties and political and professional imperatives.The control and use of health technologies in Aus-tralia will be strongly influenced by intergover-nmental relationships, the size and distribution ofbudgets for health care, and funding mechanisms.Major programs that have been put in place in re-cent years, such as the casemix development andcancer screening initiatives, are likely to signifi-cantly affect government and professional rela-tionships and patterns of provision of health
The control of pharmaceuticals with regard tosafety and efficacy has been generally successful,with changes seen as necessary to ensure that eval-uation is timely. Close consideration of cost-effec-tiveness is a recent development. Control ofmedical devices has been less certain, and evenless direct influence has been possible with regardto procedures.
The Nationally Funded Centers policy has pro-vided defined mechanisms for support of veryspecialized technologies in their early stages ofuse and review to determine when this type of in-tergovernmental support is no longer justifiable.Linking government grants conditionally to as-sessment of new types of medical devices hasbeen a useful approach. The shortcomings of suchinitiatives have been the limited assessment andmonitoring of technologies after diffusion. Ac-creditation procedures for pathology serviceshave worked effectively, although they provideonly a narrow focus of control, and the Superspe-cialty Services Subcommittee and AHTAC guide-lines have been successful in providing aframework for discussion and planning of healthcare services.
The Australian experiment of linking theintroduction and support of health care technolo-gies to assessment is now in its second decade.There have been some significant successes in in-forming policy through appropriately targeted,well-timed assessments. Recommendations anddata from the assessments have influenced policyon whether to fund technologies, levels of fund-ing, indications for use, and placement of ser-vices, but only in a minority of cases. Practice,too, has been influenced, but the data here aremore limited.
Despite “islands” of assessment and fully in-formed policy, the mainstream of health technolo-gy has been deployed through less formalmechanisms (42). This is perhaps inevitable untilassessment is linked more systematically to deci-sions on resource allocation and is undertakenmore widely within hospitals and other institu-
services.

Chapter 2 Health Care Technology in Australia 155
(ions. Further progress is likely though more sys-tematic linking of funding decisions with formalassessment, application of practice guidelines,and longer term educational initiatives.
Reports from Australia’s national advisory bo-dies have been influential and well regarded andhave contributed to policy formulation and to thewider education of health technology providersand purchasers. A major factor in the success ofthese assessments has been the expertise and con-tinuity provided by a permanent group of evalua-tors who have supported the national committees.
Some assessments, notably those involvingcollection of primary data, have to some extentbeen opportunistic, depending on the level of sup-port obtainable from staff in hospitals and otherinstitutions. The emerging databases and assess-ments undertaken by AIHW (some in support ofAHTAC) have also worked well.
The involvement of professional bodies and in-dustry in the work of the national health technolo-gy assessment groups, and the practices ofinviting comment and being willing to update re-ports and recommendations in the light of experi-ence and new data, have helped considerably inbroadening the base of assessments and their ac-ceptance. One possibly undervalued aspect of theassessments has been the provision of general de-scriptions of technologies to policy makers, ad-ministrators, and the media, which have helped todemystify technical terms and concepts.
Information from agencies in other countrieshas been a valuable input to many assessments.However, local appraisal of a health technology isoften highly desirable because of limitations in thedata from other countries and the need to take intoaccount local characteristics (98).
Conducting primary research locally is oftendesirable, even if studies are not entirely defini-tive: counsels of perfection need not impede clini-cal trials of new technologies. Several Australiantrials have provided rich information on costs, ef-fectiveness, and process even though pragmaticdecisions had to be made on limiting the power ofparticular studies.
Health authorities and professional groups faceconstraints in controlling technologies and ensur-ing their appropriate use. The timing of assess-ments and the prompt provision of results remainmajor issues, and evaluators need to be aware ofthe pressures on policymaking areas. Mechanismsare needed to link the introduction and diffusion ofnew services and procedures to the assurance ofefficacy and to the collection and provis ion of databy the new methods’ sponsors. This will not beeasily achieved without legislative changes andclose cooperation between Australian gover-nments and professional groups.
Australia has achieved a realistic balance be-tween the coverage of technologies, rigor anddepth of evaluation, speed of assessment andavailable resources. However, changes in the ad-ministrative arrangements for national advisorybodies in recent years have caused some loss ofmomentum. A period of stability would be desir-able to permit consolidation of achievements andstronger links between different evaluationgroups—all of which seek increases in funding. Itmust be said that assessment output has probablyreached its limits with the current level of re-sources.
REFERENCES1.
2.
3.
4.
Australian Association of Pediatric Teach-ing Centers, “Extracorporeal MembraneOxygenation Consensus DevelopmentStatement,” Int. J. Technol. Assess. HealthCare 7:100-105, 1991.Australian Bureau of Statistics, 1989-1990National Health Survey, Summary of Re-sults, Australia Catalogue No. 4364.0 (Can-berra: 1991).Australian Bureau of Statistics, Year BookAustralia 1994 (Canberra: 1993).Australian Health Ministers’ AdvisoryCouncil Breast Cancer Screening Evalua-tion Committee, Breast Cancer Screening inAustralia: Future Directions (Canberra:

56 I Health Care Technology and Its Assessment in Eight Countries
Australian Government Publishing Service,1990).
5. Australian Health Ministers’ AdvisoryCouncil Superspecialty Services Subcom-mittee, Guidelines for Level Three NeonatalIntensive Care (Canberra: Australian Gov-ernment Publishing Service, 1991).
6. Australian Health Technology AdvisoryCommittee, Consensus Statement on Clini-cal Efficacy of Magnetic Resonance Imag-ing (Canberra: Australian Institute ofHealth, January 1991).
7. Australian Health Technology AdvisoryCommittee, Liver Transplant Programs(Canberra: National Health and Medical Re-search Council, 1991 ).
8. Australian Health Technology AdvisoryCommittee, Stereotactic Radiosurgery inAustralia: Proposals for Nationally FundedCenters (Canberra: Australian Institute ofHealth, October 1991).
9. Australian Health Technology AdvisoryCommittee, Guidelines for Renal Dialysisand Transplantation (Canberra: NationalHealth and Medical Research Council,1992).
10. Australian Health Technology AdvisoryCommittee, Liver Transplantation Pro-grams—A Second Review (Canberra: Aus-tralian Health Ministers’ Advisory Council,1993).
11. Australian Institute of Health, ScreeningMammography Technology (Canberra:March 1990).
12. Australian Institute of Health, Australia’sHealth 1990 (Canberra: Australian Gover-nment Publishing Service, 1990).
13. Australian Institute of Health and Welfare,Australia’s Health 1992 (Canberra: Austra-lian Government Publishing Service, 1992).
14. Australian Institute of Health and Welfare,Endovascular Coronary Stents. EmergingHealth Technology Brief No. 5 (Canberra:February 1992)
15. Australian Institute of Health and Welfare,Excimer Lasers in Coronary Angioplasty.
Emerging Health Technology Brief No. 9(Canberra: June 1992).
16. Australian Institute of Health and Welfare,Health Tech Stats No. 2 (Canberra: 1992).
17. Australian Institute of Health and Welfare,Health Expenditure Bulletin No, 8 (Canber-ra: April 1993).
18. Australian Institute of Health and Welfare,Australia’s Health 1994 (Canberra: Austra-lian Government Publishing Service, inpress, 1994).
19. Australian Institute of Health and Welfare,unpublished data, 1994.
20. Baume, P., A Question of Balance: Reporton the Future of Drug Evaluation in Austra-lia (Canberra: Australian Government Pub-lishing Service, 1991).
21. Blaney, S.L. and Wale R.J., “LaparoscopicRepair of Inguinal Hernia,” Med. J. Aust.155:718, 1991.
22. Butler, J. R., “A Model for Prioritizing Ther-apeutic Devices for Evaluation,” Economicsand Health 1989, C. Selby Smith (cd) (Mel-bourne: Monash University, 1990, pp76-87).
23. Carter, R., Glasziou, P., van Oortmarssen,G., et al., “Cost Effectiveness of Mammo-graphic Screening in Australia,” Aust. J.Pub. Health 17:42-50, 1993.
24. Cook, J., Richardson, J., and Street, A.,“Cost Utility Analysis of Treatment Optionsfor Gallstone Disease,” Economics andHealth 1992, C. Selby Smith (cd.) (Mel-bourne: Monash University, 1993, pp244-275).
25. Cowley, D. E., Lasers in Angioplasty (Can-berra: Australian Institute of Health, 1991).
26. Crowe, B. L., TeZemedicine (Canberra: Aus-tralian Institute of Health and Welfare, Feb-ruary 1993).
27. Crowley, S., Antioch, K., Carter, R., et al.,The Cost of Diet-Related Disease in Austra-lia (Canberra: Australian Institute of Healthand Welfare/National Center for Health Pro-gram Evaluation, September 1992).
28. Dankiw, W., Hailey, D., and Angel, A., La-sers in Medicine (Canberra: Australian Insti-tute of Health and Welfare, 1993).
29. Degeling, P., Baume, P., and Jones, K.,“Staging an Official Inquiry for PolicyChange: The Case of the Drug EvaluationReview in Australia,” Policy and Politics21 :259-273, 1993.
30. A.P.S. Disney (cd.) ANZDATA Report 1991,(Adelaide: Australia and New Zealand Dial-ysis and Transplant Registry, 1991).
31. Drummond, M. F., “Cost-EffectivenessGuidelines for Reimbursement of Pharma-ceuticals: Is Economic Evaluation Ready forits Enhanced Status?” Health Economics1:85-92, 1992.
32. Drummond, M., Hailey, D., and SelbySmith, C., “Maximizing the Impact ofHealth Technology Assessment,” Econom-ics and Health 1991 C. Selby Smith (cd.)(Melbourne: Monash University, 1992 pp234-27 1).
33. Duckett, S., “Regulating Medical Technolo-gies: The Victorian Experience, ” Technolo-gies in Health Care: Policies and Poli~ics J.Daly, K. Green, E. Willis (eds.) (Canberra:Australian Institute of Health, 1987, pp89-93).
34. Evans, D., Freund, D., Dittus, R., et al., TheUse of Economic Analysis as a Basis for In-clusion of Pharmaceutical Products in thePharmaceutical Benefits Scheme (Canberra:Department of Health Housing and Commu-nity Services, 1992).
35. Firkin, F., “Recombinant Human Erythro-poietin Enters the Pharmacopoeia,” Aust. N.Z. J. Med. 19:279-280, 1989.
36. Fleming, J. S., “Laparascopically DirectedAppendectomy, ’’Aust. N. Z. J. Obs. and Gy -naecol. 25:238-240, 1985.
37. Fletcher, D. R., “Changes in the Practice of13iliary Surgery and ERCP During theIntroduction of Laparoscopic Cholecystec-tomy to Australia: Their Possible Signifi-cance,” Aust. N. Z. J. Surg. 64, in press,1994: No. 64:75-80.
Chapter 2 Health Care Technology in Australia 157
38. Francis, D. M. A., Walker, R. G., Becker,G.J., et al., “Kidney Transplantation FromLiving Related Donors: A 19-Year Experi-ence,” Med. J. Aust. 158:244-247, 1993.
39. Grant, C., and Lapsley, H. M., The Austra-lian Health Care System 1992, MonographNo. 75 (Sydney: University of New SouthWales 1993).
40. Hailey, D. M., “Health Care Technology As-sessment,” Resources for Health Care Eval-uation-Report of an NHMRC Workshop(Canberra: Australian Government Publish-ing Service, 1985, pp 112-128).
41. Hailey D. M., “Commonwealth Policy onHealth Technology and the Role of the Na-tional Health Technology Advisory Panel,”J. Daly, K. Green, E. Willis (eds.) Technolo-gies in Health Care: Policies and Politics(Canberra: Australian Institute of Health,1987, pp 94-105).
42. Hailey D. M., “The Influence of TechnologyAssessments by Advisory Bodies on HealthPolicy and Practice,” Health Policy25:243-254, 1993.
43. Hailey D. M., Cowley D. E., and Dankiw, W.,“The Impact of Health Technology Assess-ment,” Community Health Stud.14:223-234, 1990.
44. Hailey, D. M., and Crowe, B.L. “TheIntroduction and Evaluation of MagneticResonance Imaging in Australia,” HealthPolicy 17:25-37, 1991.
45. Hailey, D. M., and Crowe B. L., “HealthTechnology Assessment: An Australian Per-spective,” Med. Prog. Technol. 17: 103-109,1991.
46. Hailey D. M., and Crowe B. L., “The Influ-ence of Health Technology Assessment onDiffusion of MRI in Australia,” lnt. J. Tech-nol. Assess. Health Care 9:522-529. 1993.
47. Hailey, D. M., Crowe, B. L.. Burgess, I. A., etal., “The Effect of Magnetic ResonanceImaging in a Teaching Hospital on PatientManagement,” Australus, Radiol.37:249-251 , 1993.

—-—
58 I Health Care Technology and Its Assessment in Eight Countries
48. Hailey, D. M., and Hirsch, N. A., “Laparo-scopic Surgery: Some Unresolved Issues,”Med. J. Aust. 156:318-320, 1992.
49. Hailey, D. M., and Hirsch, N. A., “Laparo-scopic Cholecystectomy: Potential Impactand Reality,” paper presented at “Intern-ational Conference on Same Day Surgery,”Perth, Western Australia, Oct. 21, 1993.
50. Hailey, D. M., and Roseman, C., “HealthTechnology in Australia and New Zealand:Contrasts and Cooperation,” Health Policy14:177-189, 1990.
51. Hailey, D. M., and Slatyer, B., “Evaluationand Policy Considerations in the Introduc-tion of Extracorporeal Membrane Oxygen-ation,” Health Policy 22:287-295, 1992.
52. Hankey, G.J., and Stewart-Wynne, E. G.,“An Analysis of Cranial Computerized To-mography Scanning in Neurological Prac-tice,” Clin. Exper. Neurol. 23: 187-90, 1987.
53. Hardy, K.J., Miller, H., Fletcher, D.R, et al.,“An Evaluation of Laparoscopic VersusOpen Cholecystectomy,” Med. J. Ausz.160:58-62, 1994.
54. Harris, D. C. H., Chapman, J. R,, Stewart,J. H., et al. “Low Dose Erythropoietin inMaintenance Haemodialysis: Improvementin Quality of Life and Reduction in TrueCost of Haemodialysis,” Aust. N. Z. Med. J.21:693-700, 1991.
55. Health Department of Western Australia,Elective Surgery Bulletin No. 5 (September1993).
56. Health Targets and Implementation Com-mittee, Health for All Australians (Canber-ra: Australian Government PublishingService, 1988).
57. Highly Specialized Drugs Working Party,Report—Activities, March 1991 to Septem-ber 1992 (Canberra: Department of Health,Housing and Community Services, 1993).
58. Hirsch, N. A., Laparoscopic Cholecystecto-my (Canberra: Australian Institute of Health,November 1991).
59. Hirsch, N. A., Treatment of Menorrhagiaand Uterine Myomas (Canberra: AustralianInstitute of Health and Welfare, April 1993).
60. Hirsch, N. A., and Hailey, D. M., MinimalAccess Surgery (Canberra: Australian Insti-tute of Health and Welfare, 1992).
61. John, E., Lee, K., and Li, G.M. “Cost ofNeonatal Intensive Care,” Aus?. Paed. J.19: 152-156, 1983.
62. John, E., Abelson, P., Hind, N. et al. Cost ofNeonatal Care, A Report to the Departmentof Health, NSW (Sydney, 1990).
63. Lau, L.S.W. (cd), Imaging Guidelines (Mel-bourne, Victorian Postgraduate FoundationInc./Royal Australasian College of Radiolo-gists, 1990).
64. Lumley, J., “Assessing Technology in aTeaching Hospital: Three Case Studies,”Technologies in Health Care: Policies andPolitics, J. Daly, K. Green, E. Willis (eds.)(Canberra, Australian Institute of Health,1987 pp 45-52).
65. Lumley, J., Lester, A., Anderson, I., et al. “ARandomized Trial of Weekly Cardiotoco-graphy in High-Risk Obstetric Patients,”Brit. J. Obstet. Gynaecol. 90: 1018-1026,1983.
66. Macklin, J., Setting the Agenda for Change(Canberra: The National Health Strategy,November 1990).
67. Maher, P.J., Wood, E. C., Hill, D.J., et al.,“Laparoscopically Assisted Hysterectomy,”Med. J. Aust. 156:316-318, 1992.
68. Marshall, D., Clark, E., and Hailey, D. M.,“The Impact of Laparoscopic Cholecystec-tomy in Canada and Australia,” Hea/thPolicy 1994; 26:221-230.
69. Mitchell, A. S., “The Australian Perspectiveon the Development of PharmacoeconomicGuidelines,” Canadian CollaborativeWorkshop o n Pharmacoeconomi es, F .Schubert (cd.) (Princeton: Excerpta Medica,Inc., 1993 pp 3-7).

Chapter 2 Health Care Technology in Australia 159
70. National Health and Medical ResearchCouncil, “Organization of Perinatal Ser-vices,” Report of the Eighty -Fifih Session,Appendix VI (Canberra: Australian Govern-ment Publishing Service, 1978).
71. National Health and Medical ResearchCouncil, Guidelines for CT Scanning (Can-berra: 1992).
72. National Health and Medical ResearchCouncil, Mammography. Guidelines forWomen Under 50 Years of Age (Canberra:1992).
73. National Health Technology Advisory Pan-el, Nuclear Magnetic Resonance Imaging(Canberra: Commonwealth Department ofHealth, June 1983).
74. National Health Technology Advisory Pan-el, Medical Cyclotrons (Canberra: Com-monwealth Department of Health, 1984).
75. National Health Technology Advisory Pan-el, Portable Fluoroscopic Devices-theLixiscope (Canberra: Commonwealth De-partment of Health, 1987).
76. National Health Technology Advisory Pan-el, Computed Perimetry (Canberra: Austra-lian Institute of Health, 1988).
77. National Health Technology Advisory Pan-el, CT Scanning in Australia (Canberra:Australian Institute of Health, 1988).
78. National Health Technology Advisory Pan-el, Screening Mammography Services (Can-berra: Australian Institute of Health, 1988).
79. National Health Technology Advisory Pan-el, Coronary Angioplasty (Canberra: Aus-tralian Institute of Health, 1989).
80. National Health Technology Advisory Pan-el, Cerebr-ovascular Embolicution (Canber-ra: Australian Institute of Health, 1990).
81. National Health Technology Advisory Pan-el, Extra corporeal Membrane Oxygenation(Canberra: Australian Institute of Health,1 990).
82. National Health Technology Advisory Pan-el, MRI Assessment Pro,?ram: Final Report(Canberra: Australian Institute of Health,1990).
83. National Health Technology Advisory Pan-el, Positron Emission Tomography (Canber-ra: Australian Institute of Health, 1990).
84. National Heart Foundation of Australia,Cardiac Surgery ]991 (Canberra: 1993).
85. National Heart Foundation of Australia,Coronary Angioplasty 1991 (Canberra:1 993).
86. National Perinatal Statistics Unit of the Aus-tralian Institute of Health and Welfare, As-sisted Conception Australia and NewZealand 1991 (Sydney: NPSU, 1993).
87. National Program for the Early Detection ofBreast Cancer, National AccreditationGuidelines (Canberra: Department ofHealth, Housing and Community Services,November 1991).
88. Nettle, P. D., “Laparoscopic Vagotomy forChronic Duodenal Ulcer,” Med. J. Aust.,155:648, 1991.
89. Opit, L. J., and Dunt, D.R. “Rationalizing theNeed for CT Head Scanning in a DefinedPopulation,” Community Health Stud.3: 181-186, 1979.
90. Renwick, M., Harvey, R. Quality Assurancein Hospitals (Canberra: Australian Govern-ment Publishing Service, 1989. )
91. Robertson, C. F., Bishop, J., Dalton. M., etal., “Prevalence of Asthma in Regional Vic-torian Schoolchildren,” Med. J. Aust.156:831-833, 1992.
92. Robertson, D.M. “Pediatr ic ECMO: AConsensus Position, ’’Med. J. Aust. 153: 122.1990.
93. Rowe, M., Angioplasty and Other Percuta-neous Interventional Techniques in Treat-ment ofIschaemic Heart Disease (Canberra:Australian Institute of Health, 1989).
94. Ryan, M. D., Ruff, S. J., and Robertson, P.,“Lumbar Spine CT,” Med. J. Aust. 154: 138,1991.
95. St. Vincent’s Hospital, Melbourne BiliaryLithotripsy Assessment; Second InterimReport (Canberra: Australian Institute ofHealth, 1992).
60 I Health Care Technology and Its Assessment in Eight Countries
96. Sawer G., The Australian Constitution(Canberra: Australian Government Publish-ing Service, 1975).
97. Sax, S. (Chairman), Report of the Commit-tee on Applications and Costs of ModernTechnology in Medical Practice (Canberra:Australian Government Publishing Service,1978).
98. Selby Smith, C. (Chairman), Report of theCommittee to Review the Role and Functionof the National Health Technology AdvisoryPanel (Canberra: Department of Communi-ty Services and Health, 1989).
99. Sorby, W., ”An Evaluation of Magnetic Res-onance Imaging at the Royal North Shore
Hospital of Sydney,” Med. J. Aust.151:8-17, 1989.
100. Standing Committee of the Health Minis-ters, Superspecialty Services Working Party,Guidelines for Cardiac Surgery (Adelaide:SSS, 1983).
101. Street, A., The Cost of Treatment for Gall-stone Disease (Melbourne: National Centerfor Health Program Evaluation, 1993).
102. Wilson, T., “Laparoendoscopy for Abdomi-nal Cancer,” Med. J. Aust. 153:208, 1991.
103. Woolcock, A., “Worldwide Differences inAsthma Prevalence and Mortality. Why isAsthma Mortality So Low in the USA?”Chest 90( Suppl):405-455, 1986.